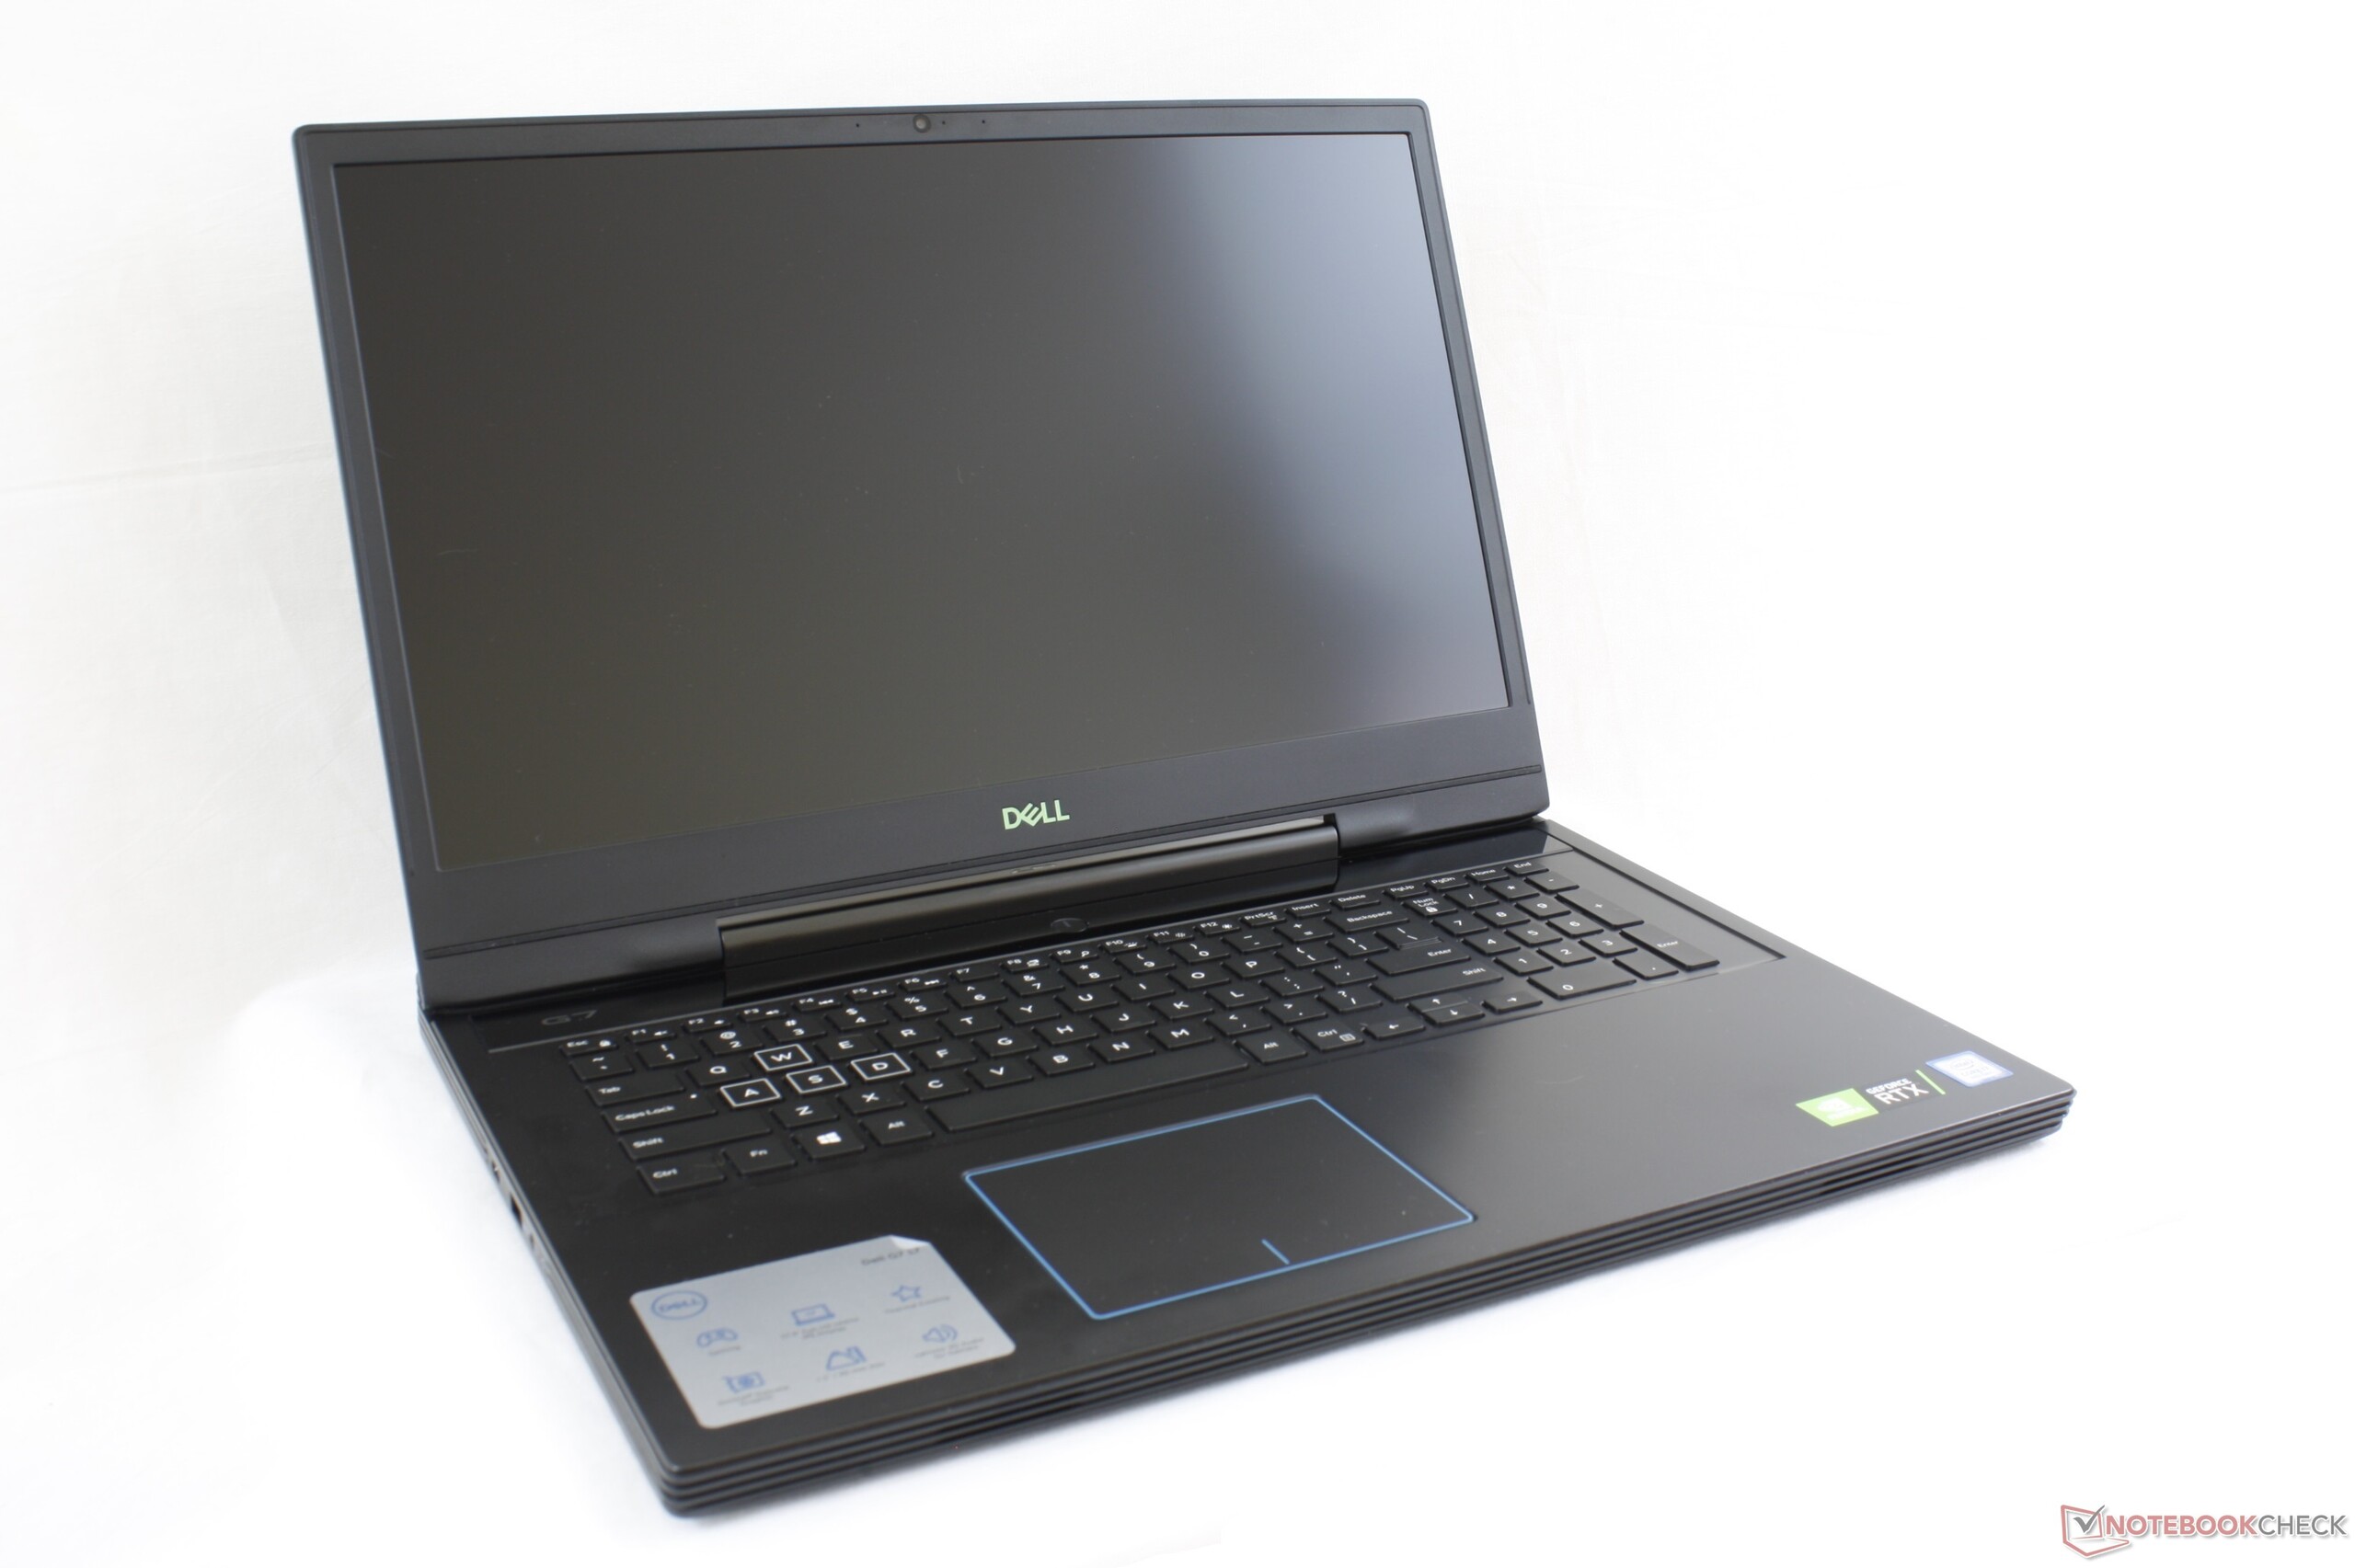
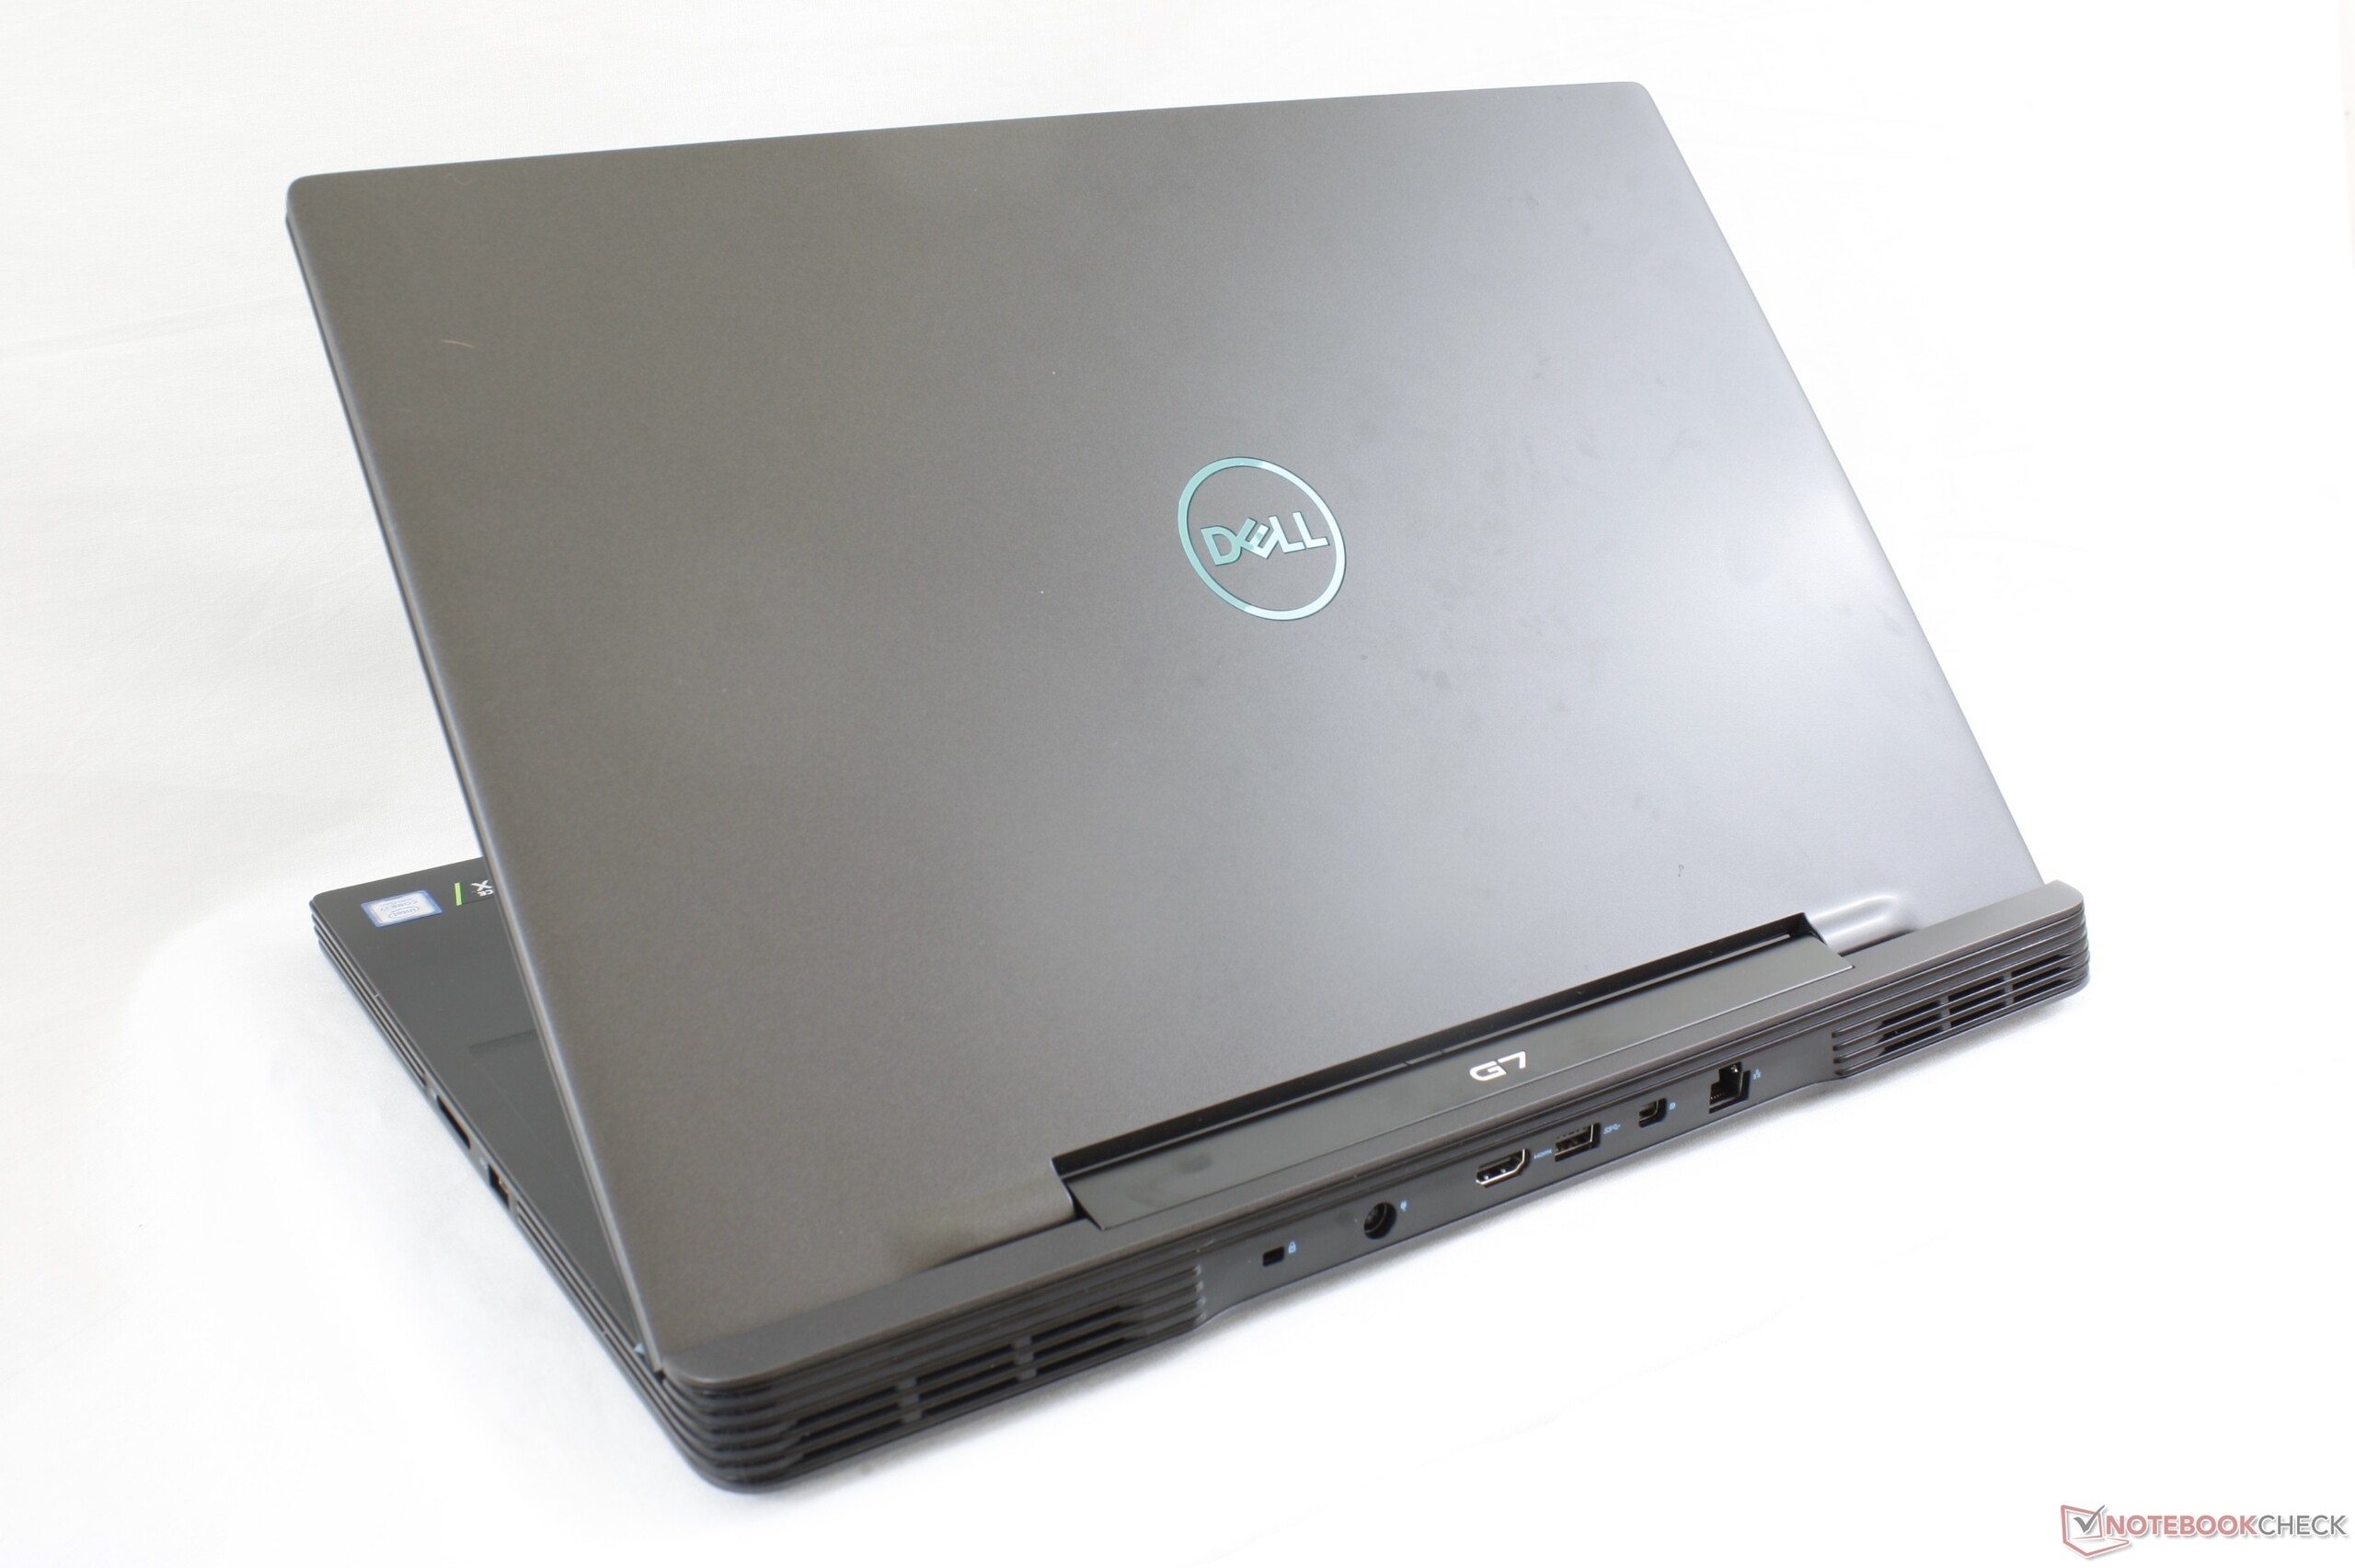
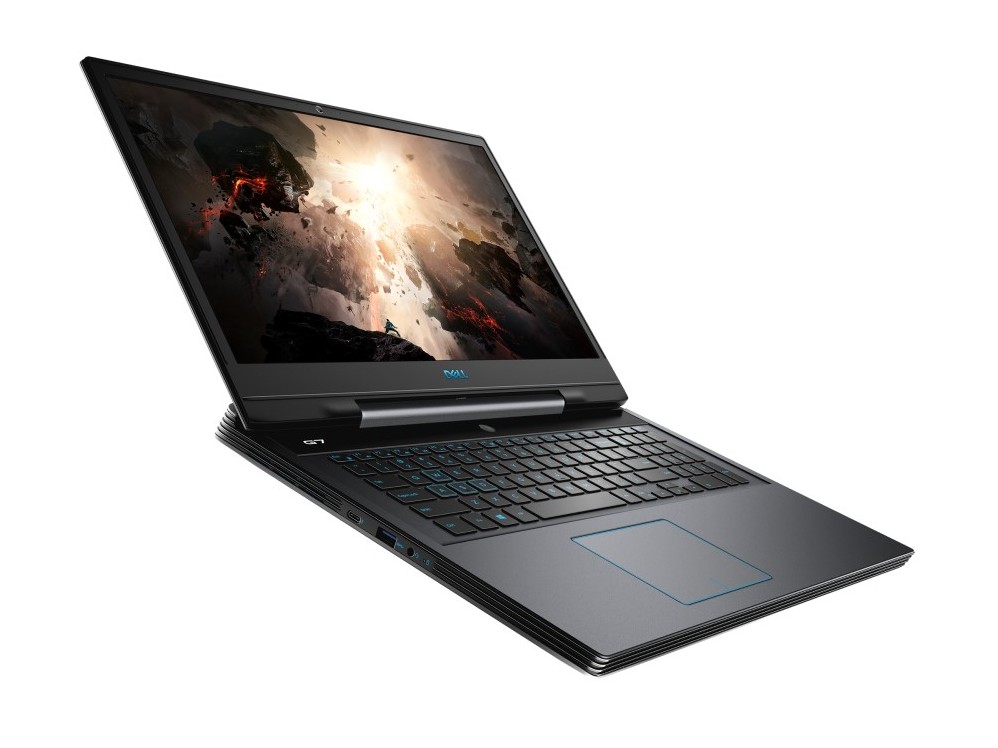
戴尔G7 17 7790 (i7-8750H, RTX 2070 Max-Q) 笔记本电脑评测
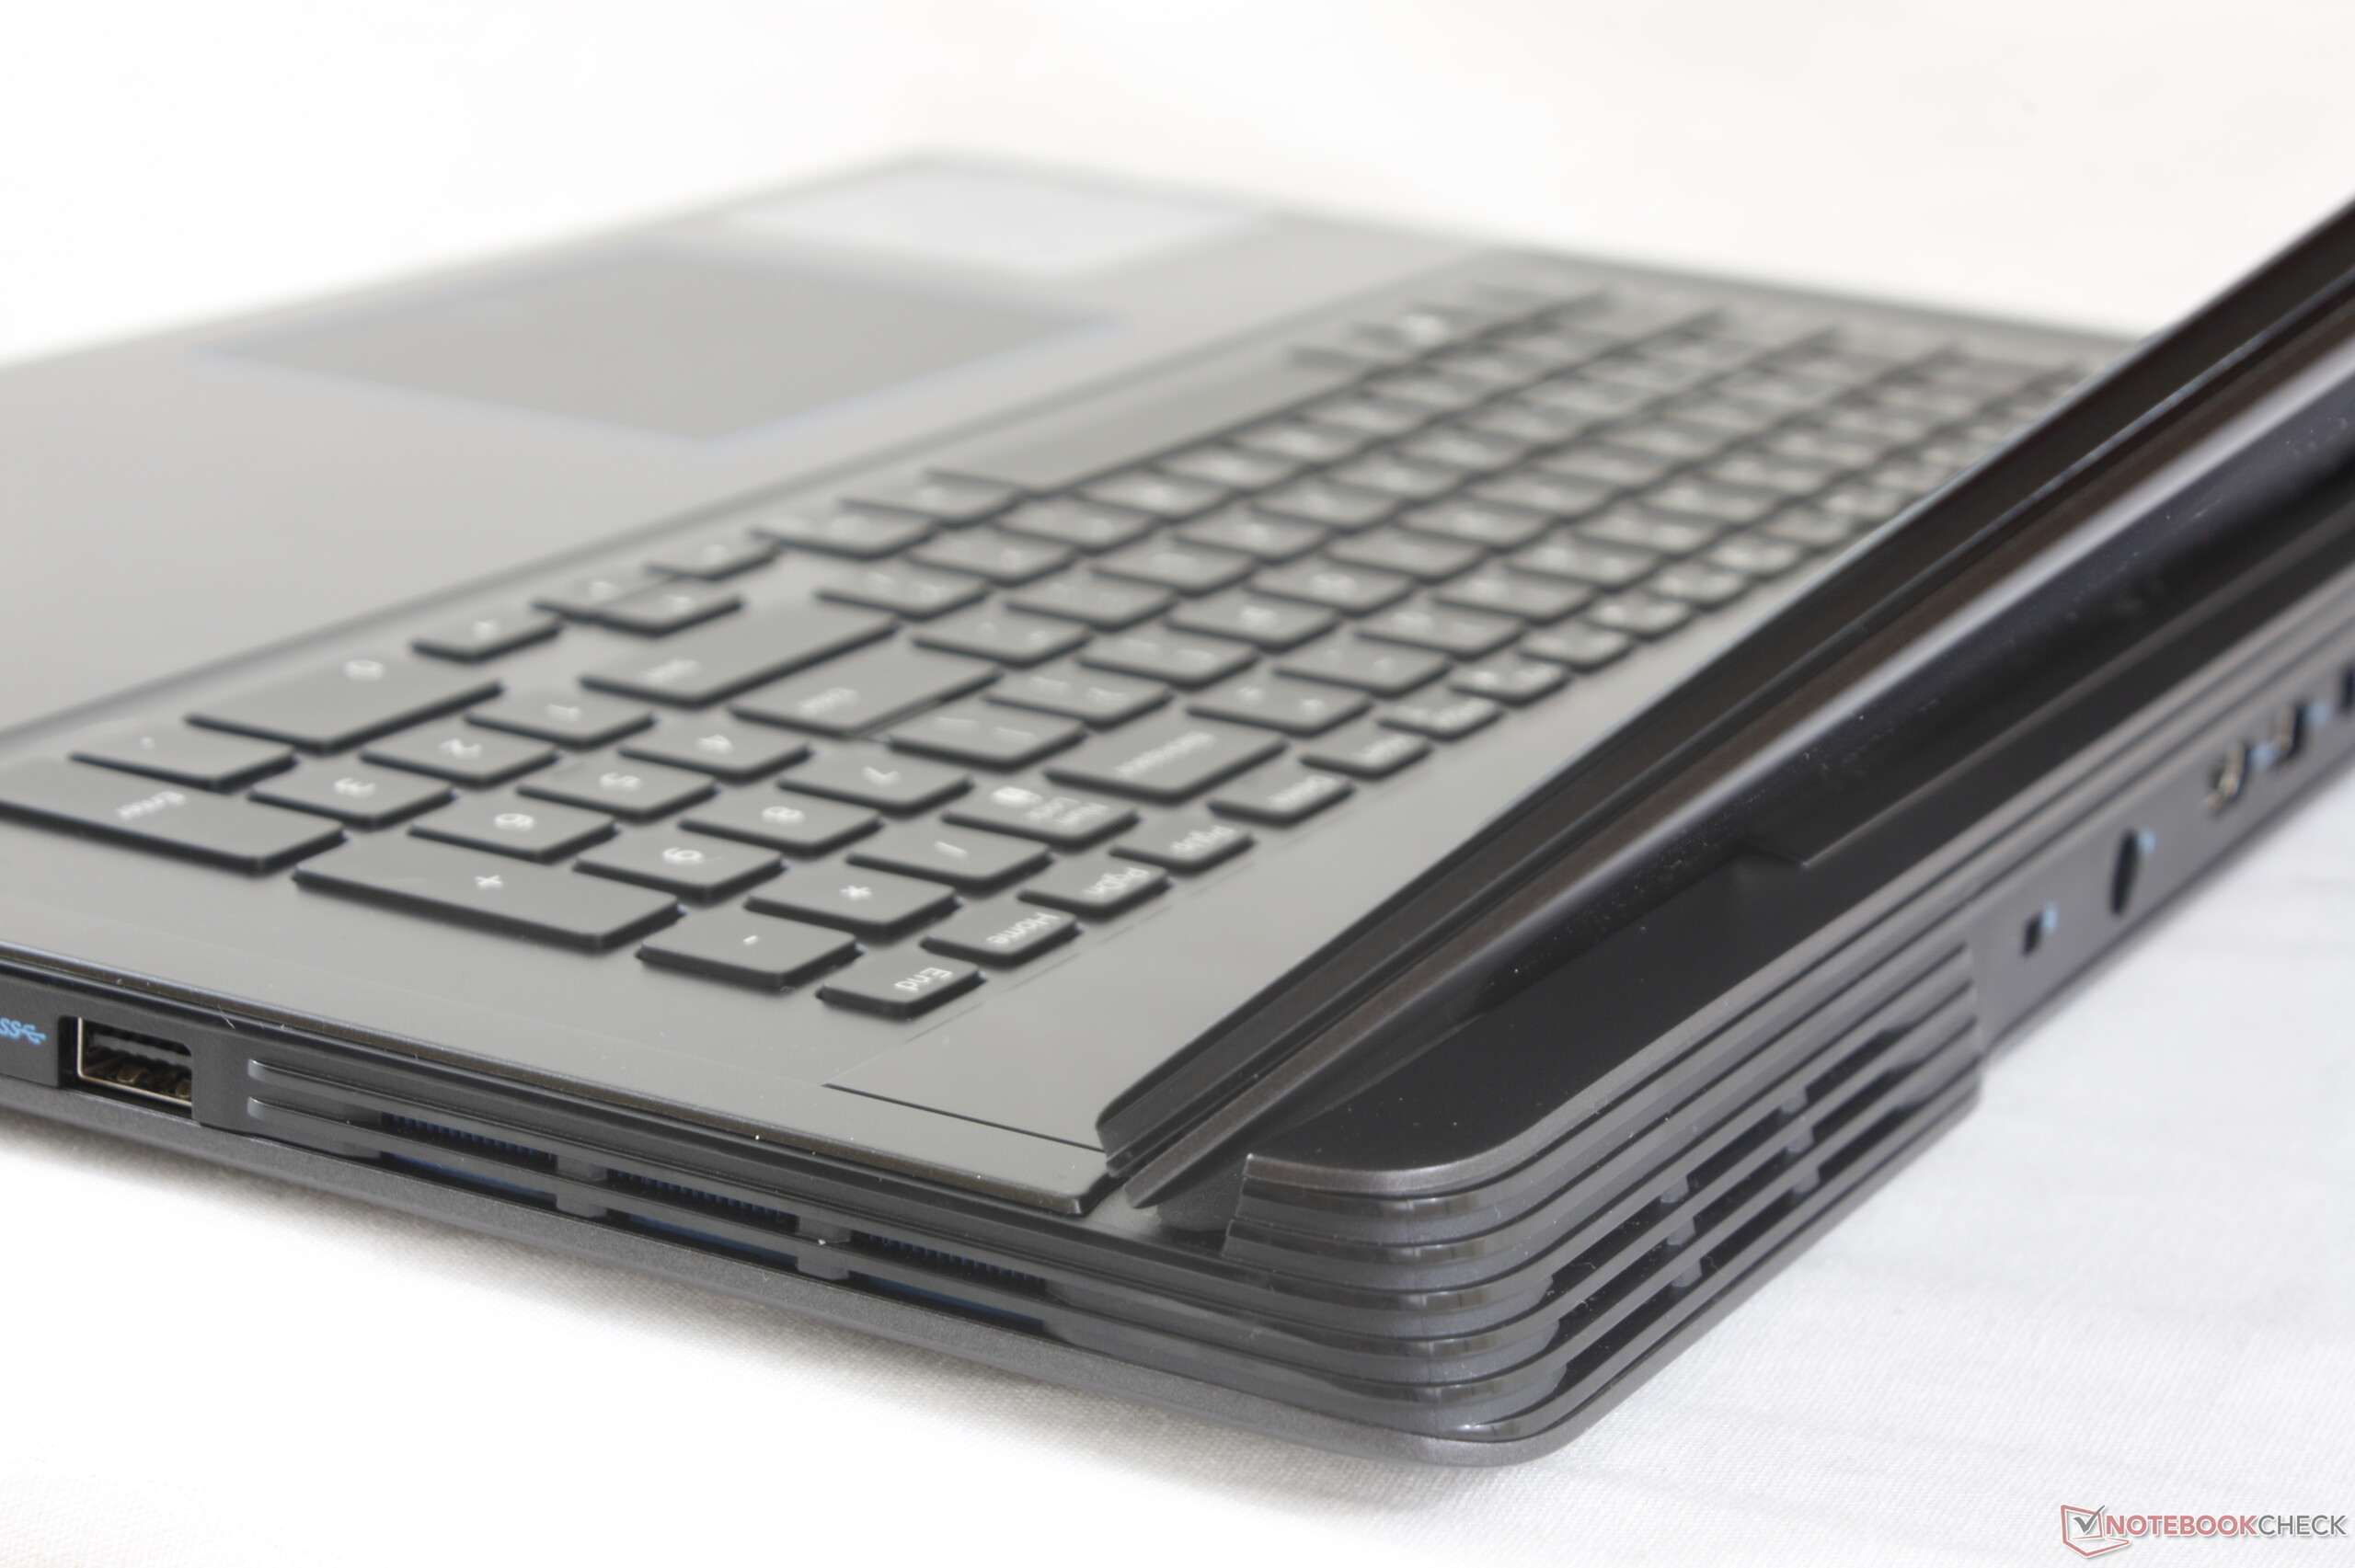

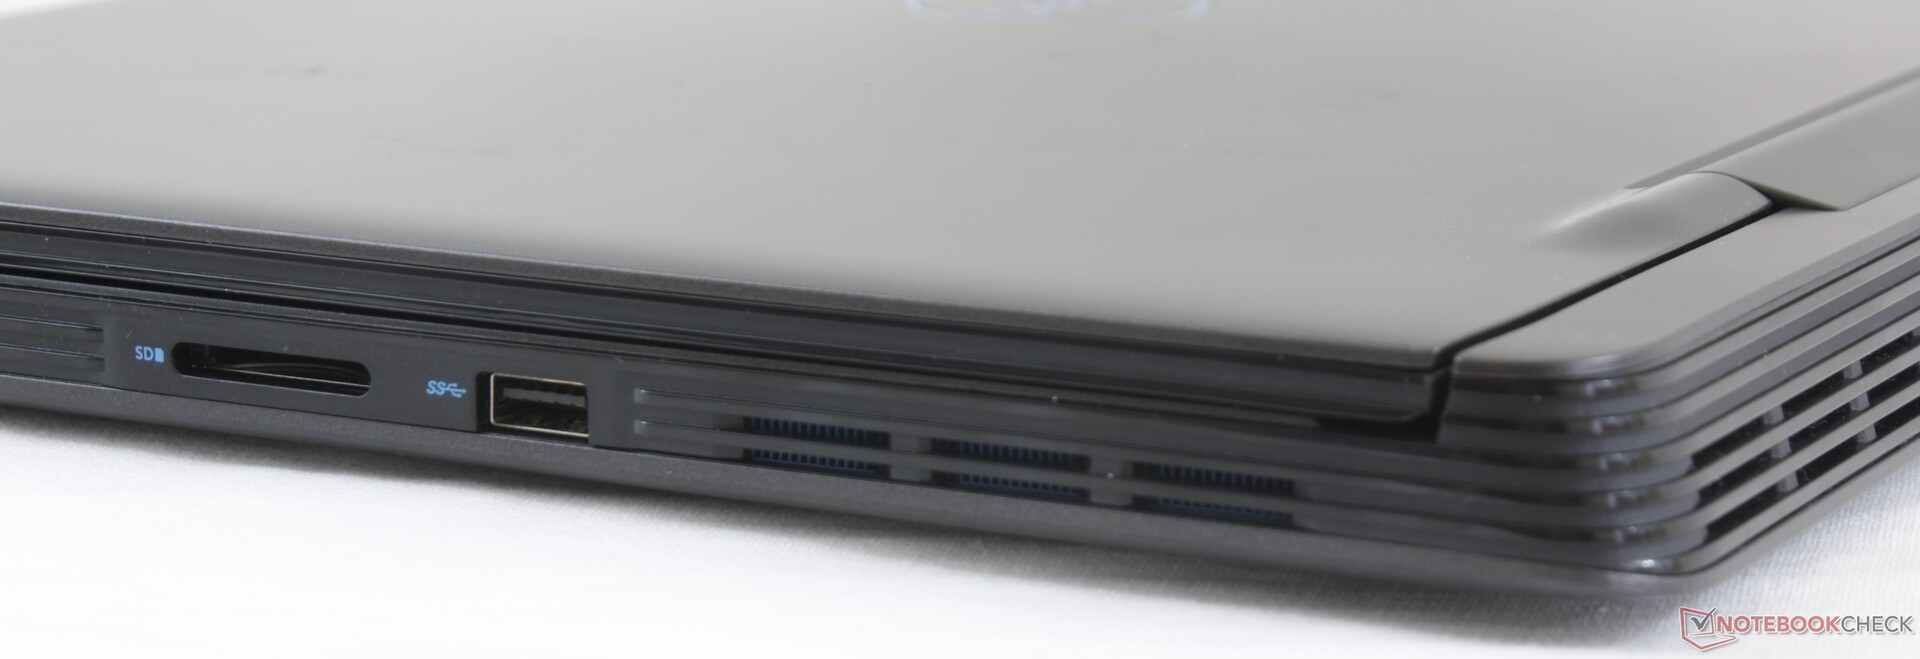
| SD Card Reader | |
| average JPG Copy Test (av. of 3 runs) | |
| Dell XPS 15 9570 Core i9 UHD (Toshiba Exceria Pro SDXC 64 GB UHS-II) | |
| Asus ZenBook 15 UX533FD (Toshiba Exceria Pro SDXC 64 GB UHS-II) | |
| Dell G7 17 7790 (Toshiba Exceria Pro SDXC 64 GB UHS-II) | |
| MSI GL73 8SE-010US (Toshiba Exceria Pro SDXC 64 GB UHS-II) | |
| maximum AS SSD Seq Read Test (1GB) | |
| Dell XPS 15 9570 Core i9 UHD (Toshiba Exceria Pro SDXC 64 GB UHS-II) | |
| Asus ZenBook 15 UX533FD (Toshiba Exceria Pro SDXC 64 GB UHS-II) | |
| Dell G7 17 7790 (Toshiba Exceria Pro SDXC 64 GB UHS-II) | |
| MSI GL73 8SE-010US (Toshiba Exceria Pro SDXC 64 GB UHS-II) | |
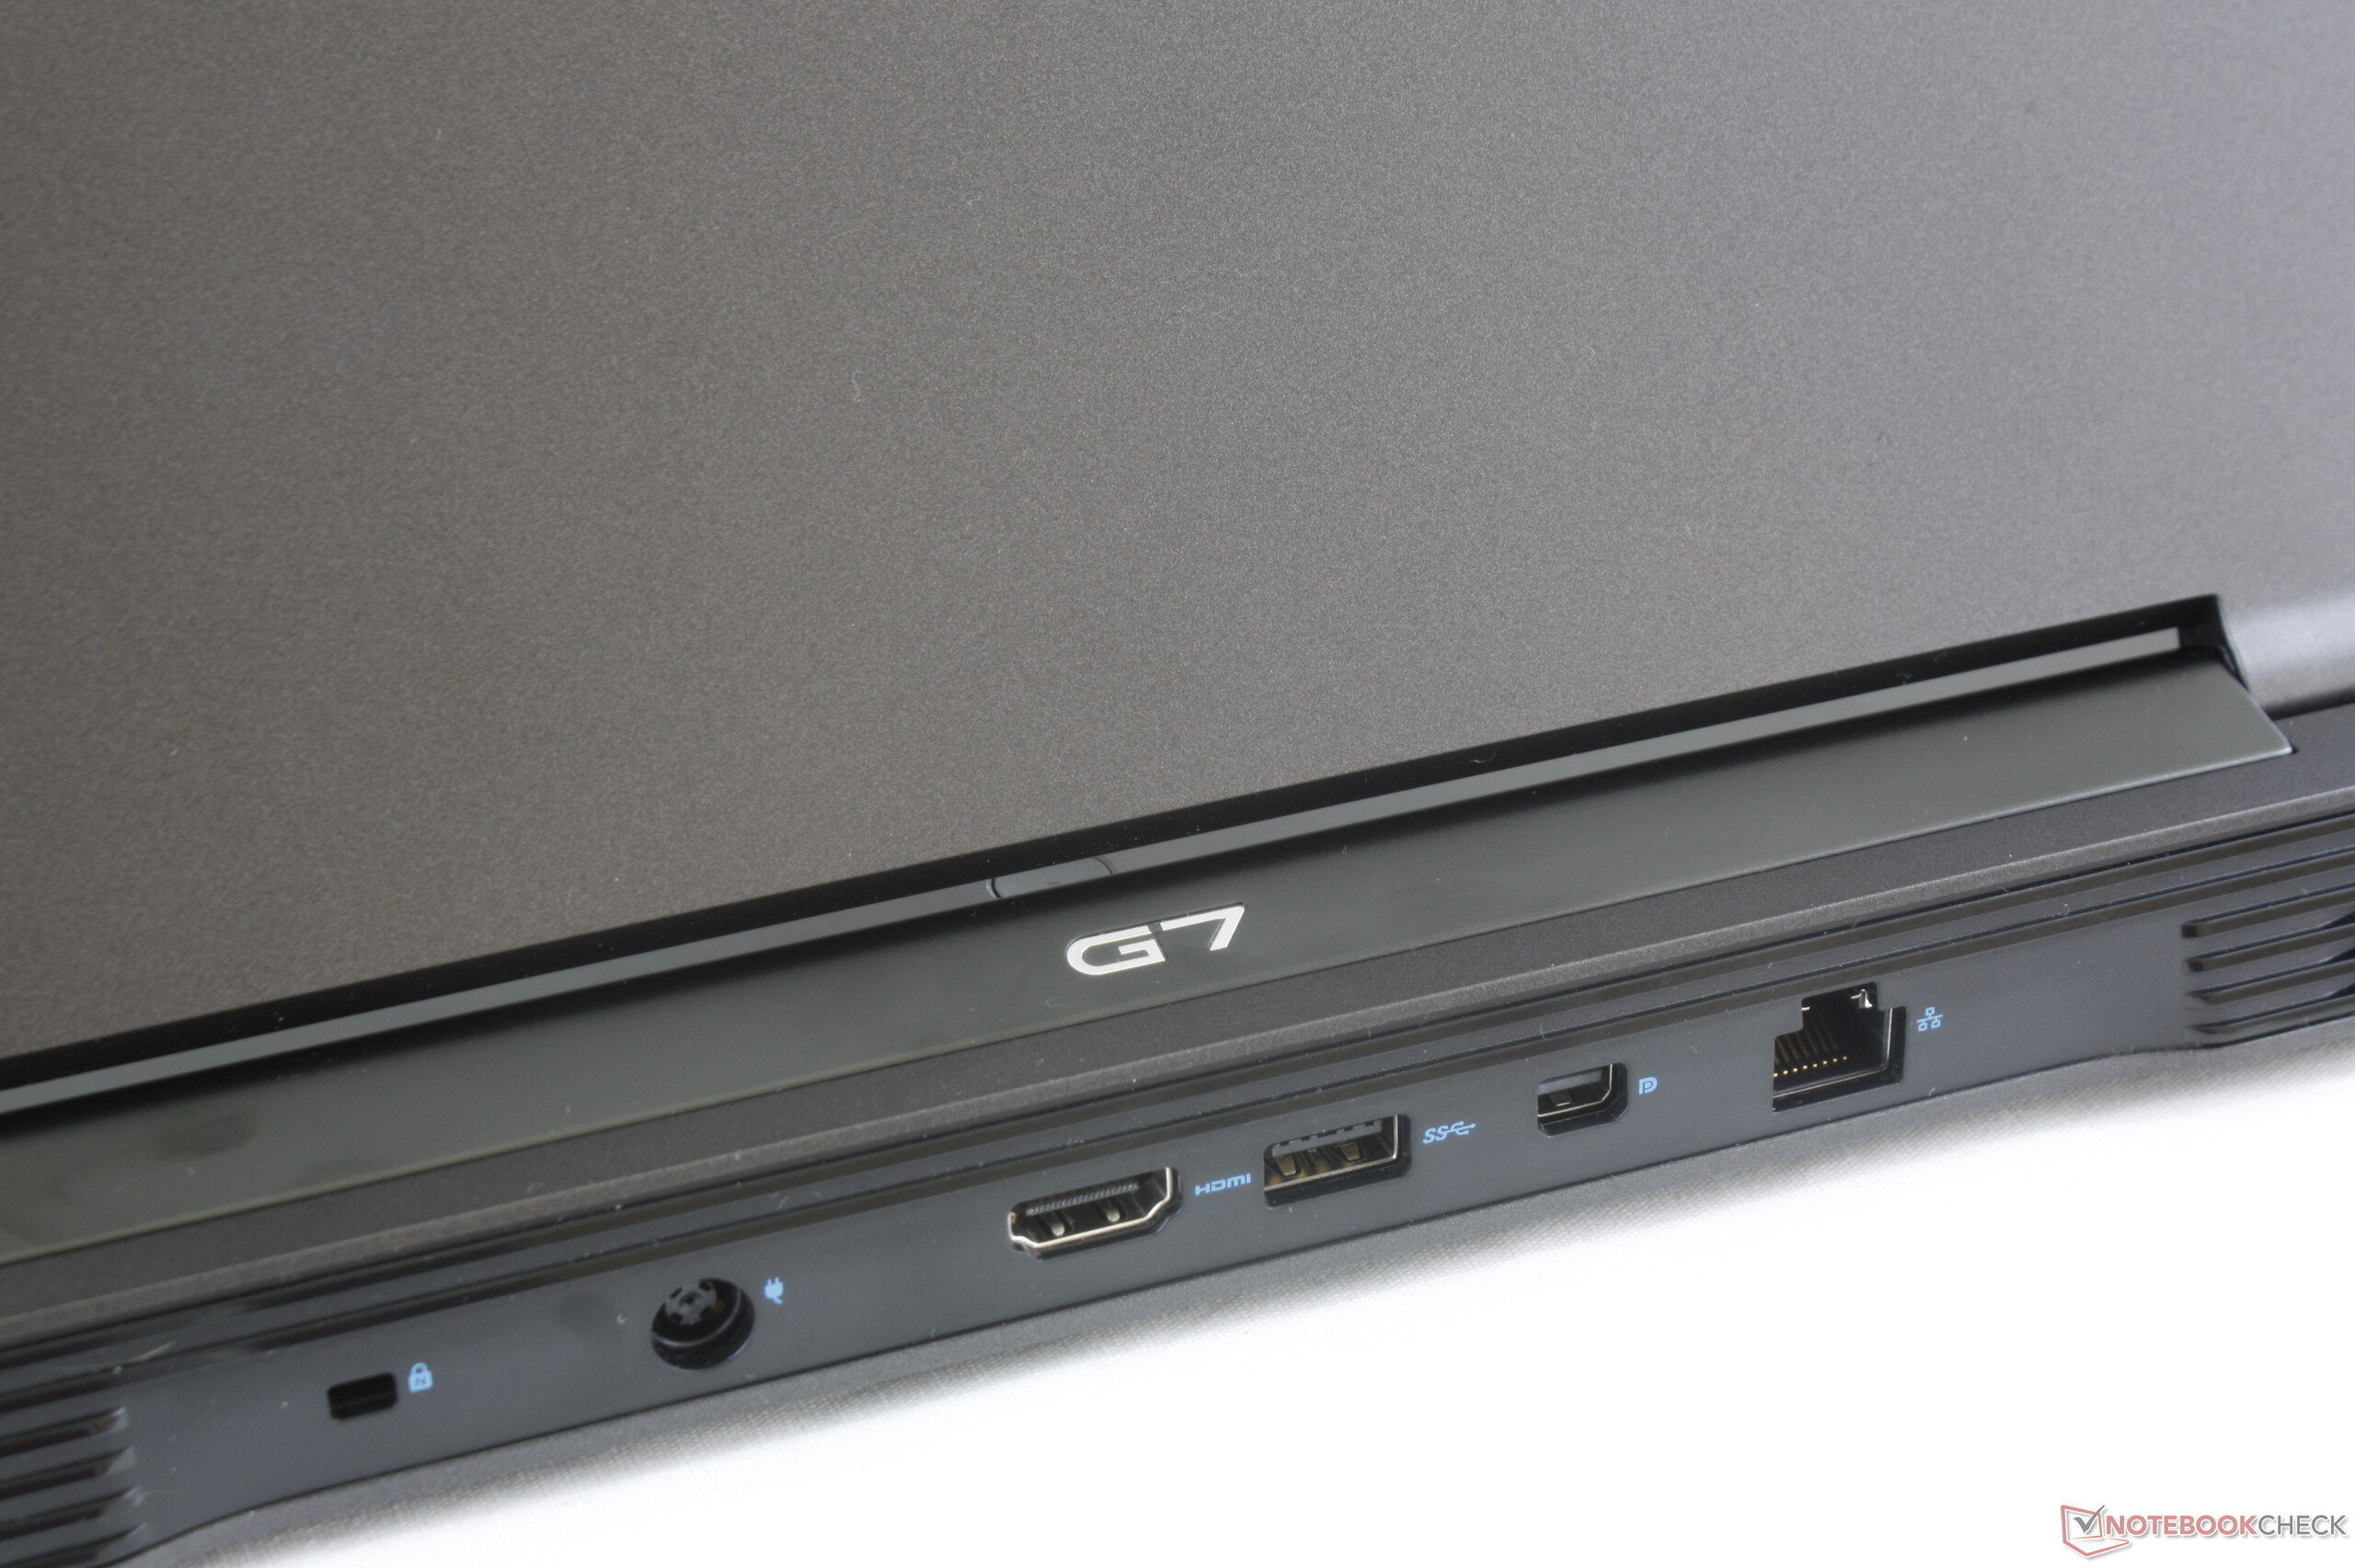
| Networking | |
| iperf3 transmit AX12 | |
| Dell G7 17 7790 | |
| Alienware m17 P37E | |
| MSI GL73 8SE-010US | |
| Lenovo Legion Y740-17ICH | |
| Asus TUF FX705DT-AU068T | |
| iperf3 receive AX12 | |
| Alienware m17 P37E | |
| Dell G7 17 7790 | |
| MSI GL73 8SE-010US | |
| Lenovo Legion Y740-17ICH | |
| Asus TUF FX705DT-AU068T | |
| |||||||||||||||||||||||||
Brightness Distribution: 92 %
Center on Battery: 308.6 cd/m²
Contrast: 1064:1 (Black: 0.29 cd/m²)
ΔE ColorChecker Calman: 4.26 | ∀{0.5-29.43 Ø4.72}
calibrated: 2.93
ΔE Greyscale Calman: 5 | ∀{0.09-98 Ø4.97}
89.2% sRGB (Argyll 1.6.3 3D)
57.8% AdobeRGB 1998 (Argyll 1.6.3 3D)
63.2% AdobeRGB 1998 (Argyll 3D)
89.6% sRGB (Argyll 3D)
61.9% Display P3 (Argyll 3D)
Gamma: 2.07
CCT: 7488 K
| Dell G7 17 7790 AU Optronics AUO409D, B173HAN, IPS, 17.3", 1920x1080 | Alienware m17 P37E AU Optronics B173ZAN01.0, IPS, 17.3", 3840x2160 | Asus TUF FX705DT-AU068T AU Optronics B173HAN04.2, IPS, 17.3", 1920x1080 | Lenovo Legion Y740-17ICH AU Optronics B173HAN03.2, IPS, 17.3", 1920x1080 | MSI GL73 8SE-010US CMN1747, TN LED, 17.3", 1920x1080 | Dell G3 17 3779 AUO, B173HAN01.3, IPS, 17.3", 1920x1080 | |
|---|---|---|---|---|---|---|
| Display | 36% | 0% | 2% | 31% | 2% | |
| Display P3 Coverage (%) | 61.9 | 86.4 40% | 62.3 1% | 64 3% | 91.1 47% | 63.9 3% |
| sRGB Coverage (%) | 89.6 | 99.9 11% | 89.1 -1% | 90.4 1% | 100 12% | 89.8 0% |
| AdobeRGB 1998 Coverage (%) | 63.2 | 99.1 57% | 63.7 1% | 64.8 3% | 85.4 35% | 64.9 3% |
| Response Times | -120% | -144% | 1% | 29% | -119% | |
| Response Time Grey 50% / Grey 80% * (ms) | 17.2 ? | 35.6 ? -107% | 41 ? -138% | 15.6 ? 9% | 12.8 ? 26% | 38 ? -121% |
| Response Time Black / White * (ms) | 12 ? | 28 ? -133% | 30 ? -150% | 12.8 ? -7% | 8.2 ? 32% | 26 ? -117% |
| PWM Frequency (Hz) | 25770 ? | |||||
| Screen | -10% | 7% | -10% | -19% | -4% | |
| Brightness middle (cd/m²) | 308.6 | 357.9 16% | 316 2% | 299.1 -3% | 326.4 6% | 323 5% |
| Brightness (cd/m²) | 299 | 347 16% | 294 -2% | 273 -9% | 317 6% | 306 2% |
| Brightness Distribution (%) | 92 | 94 2% | 84 -9% | 81 -12% | 90 -2% | 89 -3% |
| Black Level * (cd/m²) | 0.29 | 0.33 -14% | 0.32 -10% | 0.27 7% | 0.28 3% | 0.31 -7% |
| Contrast (:1) | 1064 | 1085 2% | 988 -7% | 1108 4% | 1166 10% | 1042 -2% |
| Colorchecker dE 2000 * | 4.26 | 6.57 -54% | 3.39 20% | 5.07 -19% | 7.83 -84% | 4.96 -16% |
| Colorchecker dE 2000 max. * | 7.83 | 9.86 -26% | 5.56 29% | 10.55 -35% | 13.36 -71% | 8.25 -5% |
| Colorchecker dE 2000 calibrated * | 2.93 | 6.74 -130% | 2.14 27% | 3.31 -13% | 2.83 3% | |
| Greyscale dE 2000 * | 5 | 4.3 14% | 3.17 37% | 6.8 -36% | 10.9 -118% | 5.65 -13% |
| Gamma | 2.07 106% | 2.6 85% | 2.39 92% | 2.46 89% | 1.97 112% | 2.24 98% |
| CCT | 7488 87% | 6403 102% | 7098 92% | 7805 83% | 11056 59% | 7441 87% |
| Color Space (Percent of AdobeRGB 1998) (%) | 57.8 | 88.4 53% | 51 -12% | 58.5 1% | 75.8 31% | 58 0% |
| Color Space (Percent of sRGB) (%) | 89.2 | 100 12% | 89 0% | 89.9 1% | 100 12% | 90 1% |
| Total Average (Program / Settings) | -31% /
-15% | -46% /
-13% | -2% /
-7% | 14% /
-3% | -40% /
-18% |
* ... smaller is better
Display Response Times
| ↔ Response Time Black to White | ||
|---|---|---|
| 12 ms ... rise ↗ and fall ↘ combined | ↗ 6.8 ms rise | 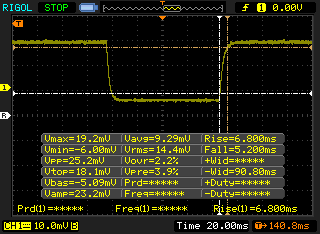 |
| ↘ 5.2 ms fall | ||
| The screen shows good response rates in our tests, but may be too slow for competitive gamers. In comparison, all tested devices range from 0.1 (minimum) to 240 (maximum) ms. » 32 % of all devices are better. This means that the measured response time is better than the average of all tested devices (19.8 ms). | ||
| ↔ Response Time 50% Grey to 80% Grey | ||
| 17.2 ms ... rise ↗ and fall ↘ combined | ↗ 7.6 ms rise | 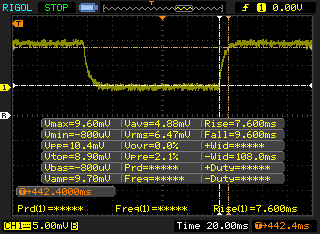 |
| ↘ 9.6 ms fall | ||
| The screen shows good response rates in our tests, but may be too slow for competitive gamers. In comparison, all tested devices range from 0.165 (minimum) to 636 (maximum) ms. » 31 % of all devices are better. This means that the measured response time is better than the average of all tested devices (31 ms). | ||
Screen Flickering / PWM (Pulse-Width Modulation)
| Screen flickering / PWM not detected | 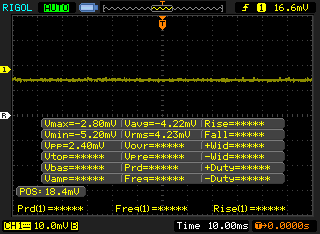 | ||
In comparison: 52 % of all tested devices do not use PWM to dim the display. If PWM was detected, an average of 7747 (minimum: 5 - maximum: 343500) Hz was measured. | |||
| Cinebench R11.5 | |
| CPU Single 64Bit | |
| MSI GE75 9SG | |
| Average Intel Core i7-8750H (1.89 - 2, n=40) | |
| Asus FX503VM-EH73 | |
| Asus ROG Zephyrus G15 GA502DU | |
| CPU Multi 64Bit | |
| MSI GE75 9SG | |
| Average Intel Core i7-8750H (9.54 - 13.5, n=41) | |
| Asus ROG Zephyrus G15 GA502DU | |
| Asus FX503VM-EH73 | |
| Cinebench R10 | |
| Rendering Multiple CPUs 32Bit | |
| MSI GE75 9SG | |
| Average Intel Core i7-8750H (29664 - 35307, n=25) | |
| Asus FX503VM-EH73 | |
| Asus ROG Zephyrus G15 GA502DU | |
| Asus TUF FX705DT-AU068T | |
| Rendering Single 32Bit | |
| MSI GE75 9SG | |
| Average Intel Core i7-8750H (6236 - 6645, n=25) | |
| Asus FX503VM-EH73 | |
| Asus ROG Zephyrus G15 GA502DU | |
| Asus TUF FX705DT-AU068T | |
| wPrime 2.10 - 1024m | |
| Asus FX503VM-EH73 | |
| Asus ROG Zephyrus G15 GA502DU | |
| Average Intel Core i7-8750H (125.5 - 180.5, n=6) | |
| MSI GE75 9SG | |
* ... smaller is better
| PCMark 10 | |
| Score | |
| Lenovo Legion Y740-17ICH | |
| Alienware m17 P37E | |
| Average Intel Core i7-8750H, NVIDIA GeForce RTX 2070 Max-Q (5279 - 5941, n=7) | |
| Dell G7 17 7790 | |
| MSI GL73 8SE-010US | |
| Dell G3 17 3779 | |
| Asus TUF FX705DT-AU068T | |
| Essentials | |
| Lenovo Legion Y740-17ICH | |
| Average Intel Core i7-8750H, NVIDIA GeForce RTX 2070 Max-Q (8517 - 9859, n=7) | |
| Dell G7 17 7790 | |
| Alienware m17 P37E | |
| MSI GL73 8SE-010US | |
| Asus TUF FX705DT-AU068T | |
| Dell G3 17 3779 | |
| Productivity | |
| Alienware m17 P37E | |
| Lenovo Legion Y740-17ICH | |
| Average Intel Core i7-8750H, NVIDIA GeForce RTX 2070 Max-Q (6783 - 7678, n=7) | |
| MSI GL73 8SE-010US | |
| Dell G7 17 7790 | |
| Dell G3 17 3779 | |
| Asus TUF FX705DT-AU068T | |
| Digital Content Creation | |
| Lenovo Legion Y740-17ICH | |
| Alienware m17 P37E | |
| Average Intel Core i7-8750H, NVIDIA GeForce RTX 2070 Max-Q (6565 - 8163, n=7) | |
| Dell G7 17 7790 | |
| MSI GL73 8SE-010US | |
| Dell G3 17 3779 | |
| Asus TUF FX705DT-AU068T | |
| PCMark 8 | |
| Home Score Accelerated v2 | |
| Lenovo Legion Y740-17ICH | |
| Asus TUF FX705DT-AU068T | |
| Average Intel Core i7-8750H, NVIDIA GeForce RTX 2070 Max-Q (3570 - 5115, n=7) | |
| Dell G7 17 7790 | |
| Dell G3 17 3779 | |
| MSI GL73 8SE-010US | |
| Alienware m17 P37E | |
| Work Score Accelerated v2 | |
| Lenovo Legion Y740-17ICH | |
| Average Intel Core i7-8750H, NVIDIA GeForce RTX 2070 Max-Q (4465 - 5857, n=7) | |
| MSI GL73 8SE-010US | |
| Dell G7 17 7790 | |
| Dell G3 17 3779 | |
| Asus TUF FX705DT-AU068T | |
| Alienware m17 P37E | |
| PCMark 8 Home Score Accelerated v2 | 4010 points | |
| PCMark 8 Work Score Accelerated v2 | 5315 points | |
| PCMark 10 Score | 5279 points | |
Help | ||
| Dell G7 17 7790 Toshiba BG3 KBG30ZMS256G | Alienware m17 P37E SK Hynix PC401 512GB M.2 (HFS512GD9TNG) | Lenovo Legion Y740-17ICH Samsung SSD PM981 MZVLB256HAHQ | Dell G3 17 3779 SK hynix SC311 SATA | Asus TUF FX705DT-AU068T WDC PC SN520 SDAPNUW-256G | |
|---|---|---|---|---|---|
| AS SSD | 159% | 235% | -19% | 108% | |
| Seq Read (MB/s) | 1033 | 1835 78% | 1153 12% | 511 -51% | 1546 50% |
| Seq Write (MB/s) | 218.3 | 1121 414% | 1328 508% | 254.4 17% | 1182 441% |
| 4K Read (MB/s) | 24.12 | 23.98 -1% | 35.05 45% | 24.22 0% | 36.54 51% |
| 4K Write (MB/s) | 55 | 100 82% | 96 75% | 58.5 6% | 109.2 99% |
| 4K-64 Read (MB/s) | 330.3 | 687 108% | 727 120% | 160.7 -51% | 612 85% |
| 4K-64 Write (MB/s) | 155.8 | 776 398% | 1212 678% | 114.8 -26% | 436.6 180% |
| Access Time Read * (ms) | 0.18 | 0.047 74% | 0.063 65% | 0.136 24% | 0.113 37% |
| Access Time Write * (ms) | 0.314 | 0.053 83% | 0.04 87% | 0.069 78% | 0.034 89% |
| Score Read (Points) | 458 | 895 95% | 878 92% | 236 -48% | 803 75% |
| Score Write (Points) | 233 | 988 324% | 1441 518% | 199 -15% | 664 185% |
| Score Total (Points) | 891 | 2306 159% | 2784 212% | 552 -38% | 1869 110% |
| Copy ISO MB/s (MB/s) | 382.9 | 773 102% | 1487 288% | 154.9 -60% | 698 82% |
| Copy Program MB/s (MB/s) | 234.9 | 493 110% | 608 159% | 99.8 -58% | 114.1 -51% |
| Copy Game MB/s (MB/s) | 218.7 | 647 196% | 1162 431% | 124.2 -43% | 379.6 74% |
* ... smaller is better

| 3DMark | |
| 1920x1080 Fire Strike Graphics | |
| MSI GE75 9SG | |
| Alienware m17 P37E | |
| Asus Zephyrus S GX502GW | |
| Average NVIDIA GeForce RTX 2070 Max-Q (11563 - 21191, n=31) | |
| Dell G7 17 7790 | |
| Dell G5 15 5590 | |
| HP Omen 15-dc0015ng | |
| Asus ROG Zephyrus G15 GA502DU | |
| Asus FX503VM-EH73 | |
| Asus TUF FX705DT-AU068T | |
| Dell XPS 15 9570 Core i9 UHD | |
| Dell G3 17 3779 | |
| Asus ZenBook 15 UX533FD | |
| Razer Blade Stealth i7-8565U | |
| 2560x1440 Time Spy Graphics | |
| MSI GE75 9SG | |
| Alienware m17 P37E | |
| Asus Zephyrus S GX502GW | |
| Average NVIDIA GeForce RTX 2070 Max-Q (5948 - 8065, n=28) | |
| Dell G7 17 7790 | |
| Dell G5 15 5590 | |
| Asus ROG Zephyrus G15 GA502DU | |
| HP Omen 15-dc0015ng | |
| Asus FX503VM-EH73 | |
| Asus TUF FX705DT-AU068T | |
| Razer Blade Stealth i7-8565U | |
| 2560x1440 Port Royal Graphics | |
| MSI GE75 9SG | |
| Alienware m17 P37E | |
| Asus Zephyrus S GX502GW | |
| Average NVIDIA GeForce RTX 2070 Max-Q (3240 - 4742, n=23) | |
| Dell G7 17 7790 | |
| Dell G5 15 5590 | |
| 3DMark 11 | |
| 1280x720 Performance GPU | |
| MSI GE75 9SG | |
| Alienware m17 P37E | |
| Asus Zephyrus S GX502GW | |
| Average NVIDIA GeForce RTX 2070 Max-Q (14723 - 27694, n=31) | |
| Dell G7 17 7790 | |
| Dell G5 15 5590 | |
| HP Omen 15-dc0015ng | |
| Asus ROG Zephyrus G15 GA502DU | |
| Asus FX503VM-EH73 | |
| Asus TUF FX705DT-AU068T | |
| Dell XPS 15 9570 Core i9 UHD | |
| Dell G3 17 3779 | |
| Asus ZenBook 15 UX533FD | |
| Razer Blade Stealth i7-8565U | |
| 1280x720 Performance Combined | |
| MSI GE75 9SG | |
| Average NVIDIA GeForce RTX 2070 Max-Q (9107 - 17603, n=30) | |
| Alienware m17 P37E | |
| HP Omen 15-dc0015ng | |
| Asus Zephyrus S GX502GW | |
| Dell G5 15 5590 | |
| Dell G7 17 7790 | |
| Dell XPS 15 9570 Core i9 UHD | |
| Asus FX503VM-EH73 | |
| Dell G3 17 3779 | |
| Asus ZenBook 15 UX533FD | |
| Asus ROG Zephyrus G15 GA502DU | |
| Asus TUF FX705DT-AU068T | |
| Razer Blade Stealth i7-8565U | |
| 3DMark 11 Performance | 16731 points | |
| 3DMark Cloud Gate Standard Score | 31556 points | |
| 3DMark Fire Strike Score | 15448 points | |
| 3DMark Time Spy Score | 6521 points | |
Help | ||
| The Witcher 3 - 1920x1080 Ultra Graphics & Postprocessing (HBAO+) | |
| MSI GE75 9SG | |
| Alienware m17 P37E | |
| Asus Zephyrus S GX502GW | |
| Average NVIDIA GeForce RTX 2070 Max-Q (56 - 83.8, n=31) | |
| Dell G7 17 7790 | |
| Dell G5 15 5590 | |
| HP Omen 15-dc0015ng | |
| MSI GL73 8SE-010US | |
| Asus ROG Zephyrus G15 GA502DU | |
| Asus FX503VM-EH73 | |
| Asus TUF FX705DT-AU068T | |
| Asus ZenBook 15 UX533FD | |
| Lenovo ThinkPad X1 Extreme-20MF000RGE | |
| Dell G3 17 3779 | |
| Razer Blade Stealth i7-8565U | |
| low | med. | high | ultra | |
|---|---|---|---|---|
| BioShock Infinite (2013) | 248 | 218.1 | 205.8 | 133.6 |
| The Witcher 3 (2015) | 203 | 165.1 | 113.5 | 64.7 |
| Rocket League (2017) | 249 | 213.2 | 188.9 |
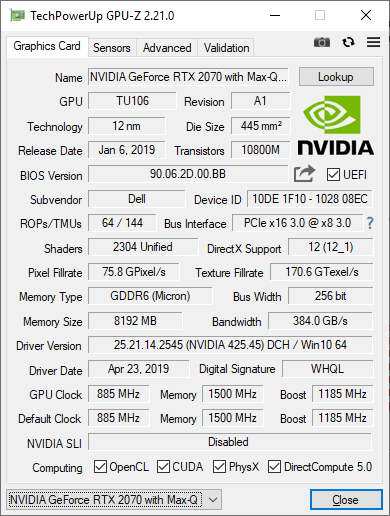
| Dell G7 17 7790 GeForce RTX 2070 Max-Q, i7-8750H, Toshiba BG3 KBG30ZMS256G | Alienware m17 P37E GeForce RTX 2080 Max-Q, i9-8950HK, SK Hynix PC401 512GB M.2 (HFS512GD9TNG) | Asus TUF FX705DT-AU068T GeForce GTX 1650 Mobile, R5 3550H, WDC PC SN520 SDAPNUW-256G | Lenovo Legion Y740-17ICH GeForce RTX 2080 Max-Q, i7-8750H, Samsung SSD PM981 MZVLB256HAHQ | MSI GL73 8SE-010US GeForce RTX 2060 Mobile, i7-8750H, Kingston RBUSNS8154P3128GJ | Dell G3 17 3779 GeForce GTX 1050 Mobile, i5-8300H, SK hynix SC311 SATA | |
|---|---|---|---|---|---|---|
| Noise | -9% | -8% | -1% | -10% | -8% | |
| off / environment * (dB) | 28.2 | 28.2 -0% | 30.8 -9% | 28.3 -0% | 28.6 -1% | 30.5 -8% |
| Idle Minimum * (dB) | 28.6 | 28.2 1% | 30.8 -8% | 31.5 -10% | 33.8 -18% | 30.5 -7% |
| Idle Average * (dB) | 28.6 | 28.2 1% | 30.8 -8% | 31.6 -10% | 34 -19% | 31.1 -9% |
| Idle Maximum * (dB) | 28.6 | 31 -8% | 32.2 -13% | 31.6 -10% | 34.1 -19% | 32.1 -12% |
| Load Average * (dB) | 31.8 | 50.8 -60% | 38.6 -21% | 32.3 -2% | 36.5 -15% | 43.4 -36% |
| Witcher 3 ultra * (dB) | 50.6 | 50.8 -0% | 43 15% | 47.8 6% | ||
| Load Maximum * (dB) | 50.8 | 50.8 -0% | 44.8 12% | 45.5 10% | 52.2 -3% | 39.2 23% |
* ... smaller is better
Noise level
| Idle |
| 28.6 / 28.6 / 28.6 dB(A) |
| Load |
| 31.8 / 50.8 dB(A) |
 | ||
30 dB silent 40 dB(A) audible 50 dB(A) loud |
||
min: | ||
(-) The maximum temperature on the upper side is 46.6 °C / 116 F, compared to the average of 40.4 °C / 105 F, ranging from 21.2 to 68.8 °C for the class Gaming.
(-) The bottom heats up to a maximum of 57 °C / 135 F, compared to the average of 43.2 °C / 110 F
(±) In idle usage, the average temperature for the upper side is 32.1 °C / 90 F, compared to the device average of 33.9 °C / 93 F.
(±) Playing The Witcher 3, the average temperature for the upper side is 36.7 °C / 98 F, compared to the device average of 33.9 °C / 93 F.
(+) The palmrests and touchpad are cooler than skin temperature with a maximum of 31.2 °C / 88.2 F and are therefore cool to the touch.
(-) The average temperature of the palmrest area of similar devices was 28.8 °C / 83.8 F (-2.4 °C / -4.4 F).
Dell G7 17 7790 audio analysis
(+) | speakers can play relatively loud (87.2 dB)
Bass 100 - 315 Hz
(-) | nearly no bass - on average 19.5% lower than median
(±) | linearity of bass is average (13.8% delta to prev. frequency)
Mids 400 - 2000 Hz
(±) | higher mids - on average 7.1% higher than median
(±) | linearity of mids is average (8.9% delta to prev. frequency)
Highs 2 - 16 kHz
(+) | balanced highs - only 2.6% away from median
(±) | linearity of highs is average (8.1% delta to prev. frequency)
Overall 100 - 16.000 Hz
(±) | linearity of overall sound is average (19.9% difference to median)
Compared to same class
» 70% of all tested devices in this class were better, 6% similar, 24% worse
» The best had a delta of 6%, average was 18%, worst was 132%
Compared to all devices tested
» 51% of all tested devices were better, 7% similar, 42% worse
» The best had a delta of 4%, average was 23%, worst was 134%
Apple MacBook 12 (Early 2016) 1.1 GHz audio analysis
(+) | speakers can play relatively loud (83.6 dB)
Bass 100 - 315 Hz
(±) | reduced bass - on average 11.3% lower than median
(±) | linearity of bass is average (14.2% delta to prev. frequency)
Mids 400 - 2000 Hz
(+) | balanced mids - only 2.4% away from median
(+) | mids are linear (5.5% delta to prev. frequency)
Highs 2 - 16 kHz
(+) | balanced highs - only 2% away from median
(+) | highs are linear (4.5% delta to prev. frequency)
Overall 100 - 16.000 Hz
(+) | overall sound is linear (10.2% difference to median)
Compared to same class
» 7% of all tested devices in this class were better, 2% similar, 90% worse
» The best had a delta of 5%, average was 18%, worst was 53%
Compared to all devices tested
» 5% of all tested devices were better, 1% similar, 94% worse
» The best had a delta of 4%, average was 23%, worst was 134%
| Off / Standby | |
| Idle | |
| Load |
|
Key:
min: | |
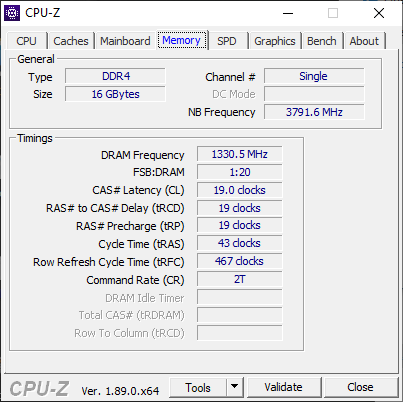
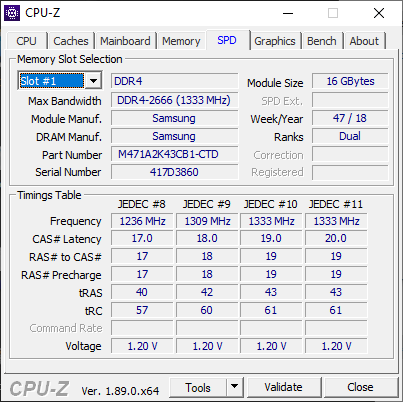
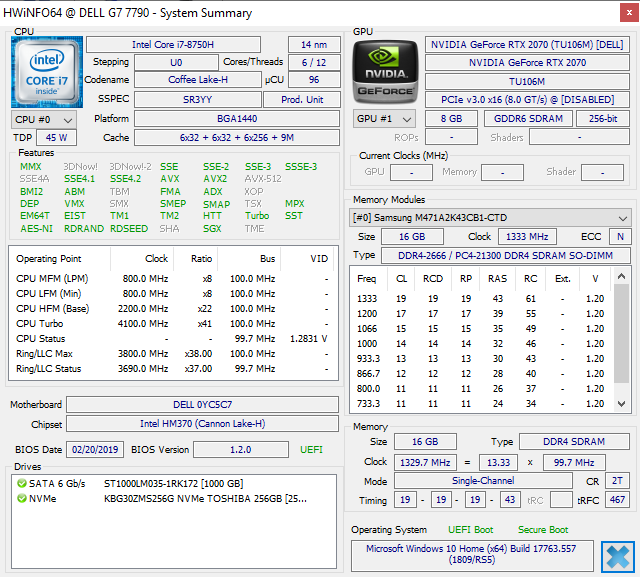
| Dell G7 17 7790 i7-8750H, GeForce RTX 2070 Max-Q, Toshiba BG3 KBG30ZMS256G, IPS, 1920x1080, 17.3" | Alienware m17 P37E i9-8950HK, GeForce RTX 2080 Max-Q, SK Hynix PC401 512GB M.2 (HFS512GD9TNG), IPS, 3840x2160, 17.3" | Asus TUF FX705DT-AU068T R5 3550H, GeForce GTX 1650 Mobile, WDC PC SN520 SDAPNUW-256G, IPS, 1920x1080, 17.3" | MSI GL73 8SE-010US i7-8750H, GeForce RTX 2060 Mobile, Kingston RBUSNS8154P3128GJ, TN LED, 1920x1080, 17.3" | MSI GL73 8RD-418US i7-8750H, GeForce GTX 1050 Ti Mobile, Kingston RBUSNS8154P3128GJ, TN LED, 1920x1080, 17.3" | |
|---|---|---|---|---|---|
| Power Consumption | -54% | 49% | 7% | 2% | |
| Idle Minimum * (Watt) | 9.5 | 21.2 -123% | 3.9 59% | 8.8 7% | 11.8 -24% |
| Idle Average * (Watt) | 16.2 | 29.6 -83% | 9.6 41% | 16.2 -0% | 18.7 -15% |
| Idle Maximum * (Watt) | 23.8 | 34 -43% | 12.2 49% | 18.3 23% | 19.8 17% |
| Load Average * (Watt) | 101.7 | 130.9 -29% | 59 42% | 86.1 15% | 100.8 1% |
| Witcher 3 ultra * (Watt) | 155 | 177.5 -15% | 146.7 5% | 124.4 20% | |
| Load Maximum * (Watt) | 172.2 | 219.7 -28% | 80 54% | 186.4 -8% | 151.6 12% |
* ... smaller is better
| Dell G7 17 7790 i7-8750H, GeForce RTX 2070 Max-Q, 60 Wh | Alienware m17 P37E i9-8950HK, GeForce RTX 2080 Max-Q, 90 Wh | Asus TUF FX705DT-AU068T R5 3550H, GeForce GTX 1650 Mobile, 64 Wh | Lenovo Legion Y740-17ICH i7-8750H, GeForce RTX 2080 Max-Q, 76 Wh | MSI GL73 8SE-010US i7-8750H, GeForce RTX 2060 Mobile, 41 Wh | Dell G3 17 3779 i5-8300H, GeForce GTX 1050 Mobile, 56 Wh | |
|---|---|---|---|---|---|---|
| Battery runtime | -9% | 55% | -18% | -41% | 33% | |
| Reader / Idle (h) | 8.5 | 9.1 7% | 13.6 60% | 6.5 -24% | 12.2 44% | |
| WiFi v1.3 (h) | 3.9 | 4.9 26% | 7.8 100% | 3.2 -18% | 2.8 -28% | 5.8 49% |
| Load (h) | 2 | 0.8 -60% | 2.1 5% | 0.6 -70% | 2.1 5% |
Pros
Cons
戴尔G7 17 7790与Alienware m15和m17具有许多相同的优点和缺点。性能非常出色,特别是在长时间保持可靠的Turbo Boost水平时,尽管这是以CPU的高温为代价的。大个的的风扇与较轻且通常更安静的联想Y740相比就没那么讨喜了,后者配备了与戴尔相同的CPU和GPU选项。重型游戏笔记本电脑是可以理解的,但它们应该更安静,以弥补重量上的缺陷,不幸的是G7 17在两个方面都没做好。
尽管如此,这台电脑还是有许多讨喜的地方的。标配的144 Hz面板,易于维修,扬声器和多种接口选项给人留下了坚实的第一印象,即使机身看起来不像许多竞争对手那样帅气。但是,如果您打算经常在旅途中使用17.3英寸游戏笔记本电脑,那么较轻的MSI GS75或Acer Predator Helios可能是更明智的选择。
虽然缺点列表很短,但它们非常关键。强大的性能需要吵闹的风扇和重型机身做靠山,比起经常出差的游戏玩家这更适合家庭游戏玩家。
Dell G7 17 7790
- 06/17/2019 v6 (old)
Allen Ngo
Price comparison

