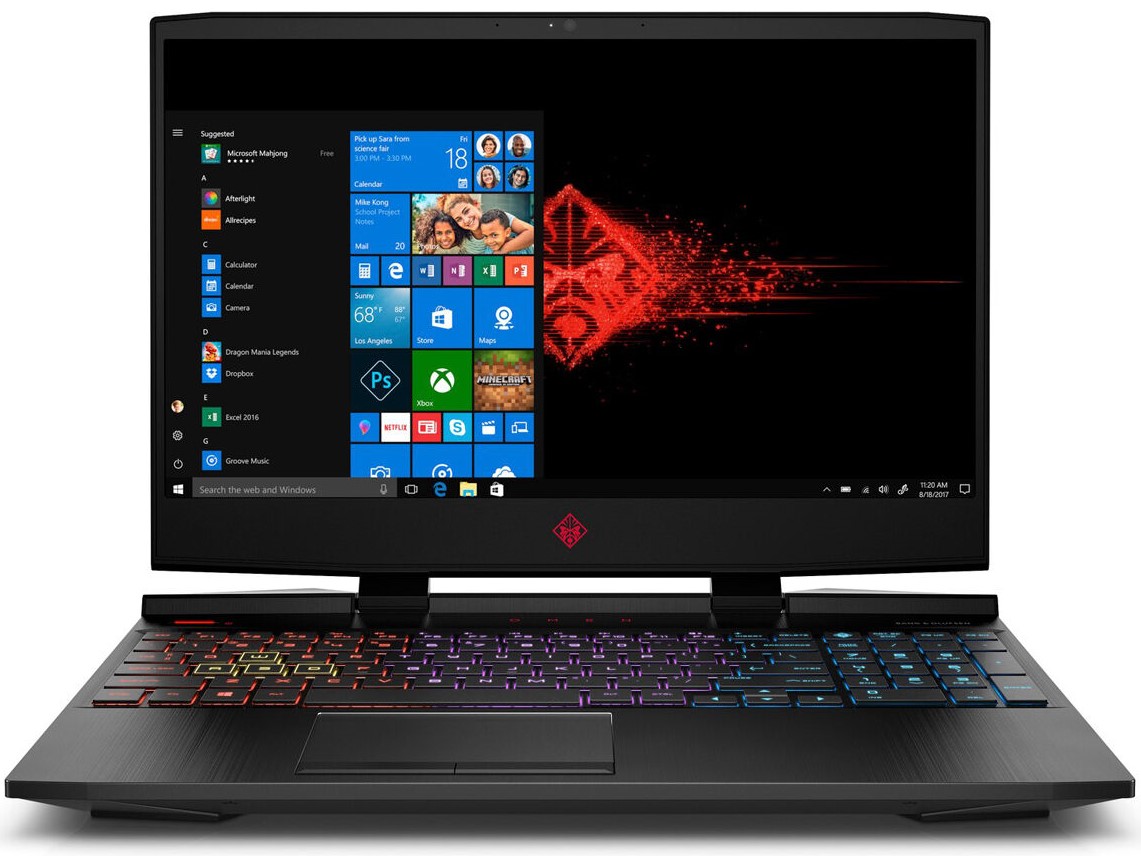
惠普暗影精灵4Pro笔记本电脑评测:RTX 2070 Max-Q与144hz的电竞体验
| SD Card Reader | |
| average JPG Copy Test (av. of 3 runs) | |
| Average of class Gaming (20.9 - 210, n=54, last 2 years) | |
| Aorus 15 X9 (Toshiba Exceria Pro M501 64 GB UHS-II) | |
| HP Omen 15-dc0015ng (Toshiba Exceria Pro SDXC 64 GB UHS-II) | |
| HP Omen 15-dc1303ng (Toshiba Exceria Pro SDXC 64 GB UHS-II) | |
| Dell G5 15 5590 (Toshiba Exceria Pro SDXC 64 GB UHS-II) | |
| maximum AS SSD Seq Read Test (1GB) | |
| Average of class Gaming (25.5 - 261, n=51, last 2 years) | |
| Aorus 15 X9 (Toshiba Exceria Pro M501 64 GB UHS-II) | |
| HP Omen 15-dc0015ng (Toshiba Exceria Pro SDXC 64 GB UHS-II) | |
| HP Omen 15-dc1303ng (Toshiba Exceria Pro SDXC 64 GB UHS-II) | |
| Dell G5 15 5590 (Toshiba Exceria Pro SDXC 64 GB UHS-II) | |
| Networking | |
| iperf3 transmit AX12 | |
| HP Omen 15-dc0015ng | |
| Dell G5 15 5590 | |
| Aorus 15 X9 | |
| HP Omen 15-dc1303ng | |
| Alienware m15 P79F | |
| Lenovo Legion Y530-15ICH | |
| iperf3 receive AX12 | |
| HP Omen 15-dc1303ng | |
| Dell G5 15 5590 | |
| Alienware m15 P79F | |
| HP Omen 15-dc0015ng | |
| Aorus 15 X9 | |
| Lenovo Legion Y530-15ICH | |
| |||||||||||||||||||||||||
Brightness Distribution: 84 %
Center on Battery: 324 cd/m²
Contrast: 752:1 (Black: 0.42 cd/m²)
ΔE ColorChecker Calman: 2.7 | ∀{0.5-29.43 Ø4.72}
calibrated: 1.58
ΔE Greyscale Calman: 2.35 | ∀{0.09-98 Ø4.97}
93% sRGB (Argyll 1.6.3 3D)
60% AdobeRGB 1998 (Argyll 1.6.3 3D)
65% AdobeRGB 1998 (Argyll 3D)
93.4% sRGB (Argyll 3D)
63.8% Display P3 (Argyll 3D)
Gamma: 2.41
CCT: 6904 K
| HP Omen 15-dc1303ng LG Philips LGD05C0, , 1920x1080, 15.6" | Aorus 15 X9 LG Philips LP156WFG-SPB2, , 1920x1080, 15.6" | Alienware m15 P79F Samsung SDCA029, 156WR04, , 3840x2160, 15.6" | Dell G5 15 5590 AU Optronics B156HAN, , 1920x1080, 15.6" | HP Omen 15-dc0015ng LG Philips LGD05C0, , 1920x1080, 15.6" | |
|---|---|---|---|---|---|
| Display | 2% | 39% | -38% | 0% | |
| Display P3 Coverage (%) | 63.8 | 64.9 2% | 99.9 57% | 39.26 -38% | 64.2 1% |
| sRGB Coverage (%) | 93.4 | 95.6 2% | 100 7% | 59.1 -37% | 93.4 0% |
| AdobeRGB 1998 Coverage (%) | 65 | 66.3 2% | 100 54% | 40.56 -38% | 65.1 0% |
| Response Times | -11% | 80% | -197% | -11% | |
| Response Time Grey 50% / Grey 80% * (ms) | 14 ? | 15.2 ? -9% | 2.6 ? 81% | 45 ? -221% | 17 ? -21% |
| Response Time Black / White * (ms) | 11 ? | 12.4 ? -13% | 2.3 ? 79% | 30 ? -173% | 11 ? -0% |
| PWM Frequency (Hz) | 60.2 ? | ||||
| Screen | 3% | -15% | -76% | -9% | |
| Brightness middle (cd/m²) | 316 | 305.1 -3% | 452.1 43% | 234 -26% | 317 0% |
| Brightness (cd/m²) | 295 | 295 0% | 452 53% | 219 -26% | 283 -4% |
| Brightness Distribution (%) | 84 | 78 -7% | 90 7% | 82 -2% | 76 -10% |
| Black Level * (cd/m²) | 0.42 | 0.33 21% | 0.17 60% | 0.62 -48% | |
| Contrast (:1) | 752 | 925 23% | 1376 83% | 511 -32% | |
| Colorchecker dE 2000 * | 2.7 | 2.58 4% | 6.34 -135% | 8.6 -219% | 2.83 -5% |
| Colorchecker dE 2000 max. * | 5.65 | 4.32 24% | 12.97 -130% | 17.49 -210% | 5.78 -2% |
| Colorchecker dE 2000 calibrated * | 1.58 | 1.33 16% | 4.06 -157% | ||
| Greyscale dE 2000 * | 2.35 | 3.4 -45% | 2.8 -19% | 8.55 -264% | 2 15% |
| Gamma | 2.41 91% | 2.28 96% | 2.21 100% | 3.02 73% | 2.28 96% |
| CCT | 6904 94% | 6374 102% | 6114 106% | 7802 83% | 6493 100% |
| Color Space (Percent of AdobeRGB 1998) (%) | 60 | 60.7 1% | 91 52% | 37 -38% | 60 0% |
| Color Space (Percent of sRGB) (%) | 93 | 95.2 2% | 100 8% | 59 -37% | 93 0% |
| Total Average (Program / Settings) | -2% /
1% | 35% /
12% | -104% /
-84% | -7% /
-7% |
* ... smaller is better
Display Response Times
| ↔ Response Time Black to White | ||
|---|---|---|
| 11 ms ... rise ↗ and fall ↘ combined | ↗ 7 ms rise | 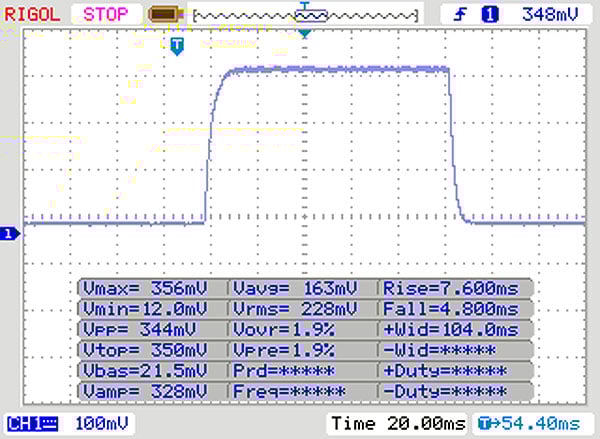 |
| ↘ 4 ms fall | ||
| The screen shows good response rates in our tests, but may be too slow for competitive gamers. In comparison, all tested devices range from 0.1 (minimum) to 240 (maximum) ms. » 30 % of all devices are better. This means that the measured response time is better than the average of all tested devices (19.8 ms). | ||
| ↔ Response Time 50% Grey to 80% Grey | ||
| 14 ms ... rise ↗ and fall ↘ combined | ↗ 7 ms rise | 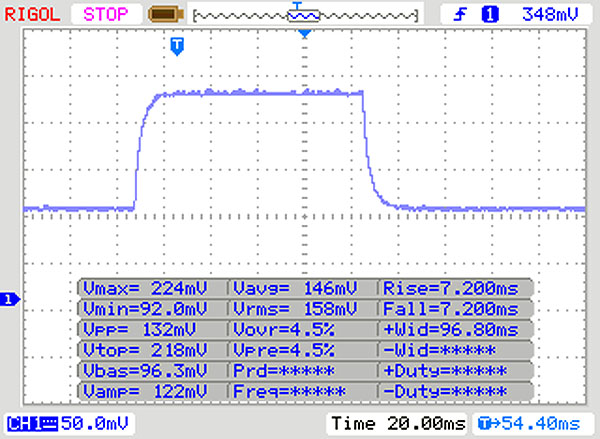 |
| ↘ 7 ms fall | ||
| The screen shows good response rates in our tests, but may be too slow for competitive gamers. In comparison, all tested devices range from 0.165 (minimum) to 636 (maximum) ms. » 28 % of all devices are better. This means that the measured response time is better than the average of all tested devices (31 ms). | ||
Screen Flickering / PWM (Pulse-Width Modulation)
| Screen flickering / PWM not detected | 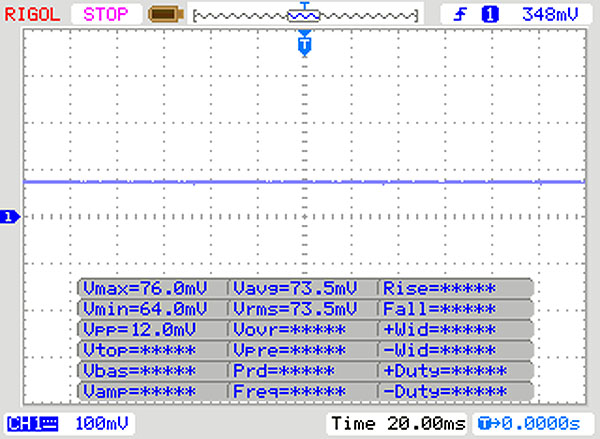 | ||
In comparison: 52 % of all tested devices do not use PWM to dim the display. If PWM was detected, an average of 7763 (minimum: 5 - maximum: 343500) Hz was measured. | |||
| Cinebench R15 | |
| CPU Single 64Bit | |
| Average of class Gaming (188.8 - 343, n=109, last 2 years) | |
| Average Intel Core i7-8750H (163 - 177, n=86) | |
| HP Omen 15-dc1303ng | |
| HP Omen 15-dc0015ng | |
| Alienware m15 P79F | |
| Aorus 15 X9 | |
| Dell G5 15 5590 | |
| CPU Multi 64Bit | |
| Average of class Gaming (1578 - 6271, n=108, last 2 years) | |
| Alienware m15 P79F | |
| Dell G5 15 5590 | |
| Average Intel Core i7-8750H (863 - 1251, n=93) | |
| HP Omen 15-dc1303ng | |
| HP Omen 15-dc0015ng | |
| Aorus 15 X9 | |
| PCMark 8 | |
| Home Score Accelerated v2 | |
| Average of class Gaming (n=1last 2 years) | |
| HP Omen 15-dc0015ng | |
| HP Omen 15-dc1303ng | |
| Aorus 15 X9 | |
| Average Intel Core i7-8750H, NVIDIA GeForce RTX 2070 Max-Q (3570 - 5115, n=7) | |
| Dell G5 15 5590 | |
| Alienware m15 P79F | |
| Work Score Accelerated v2 | |
| HP Omen 15-dc1303ng | |
| Aorus 15 X9 | |
| HP Omen 15-dc0015ng | |
| Average Intel Core i7-8750H, NVIDIA GeForce RTX 2070 Max-Q (4465 - 5857, n=7) | |
| Dell G5 15 5590 | |
| Alienware m15 P79F | |
| Average of class Gaming (n=1last 2 years) | |
| PCMark 8 Home Score Accelerated v2 | 5077 points | |
| PCMark 8 Work Score Accelerated v2 | 5857 points | |
| PCMark 10 Score | 5609 points | |
Help | ||
| HP Omen 15-dc1303ng Samsung SSD PM981 MZVLB256HAHQ | Aorus 15 X9 Intel SSD 760p SSDPEKKW512G8 | Alienware m15 P79F Toshiba XG5 KXG50ZNV512G | Dell G5 15 5590 KBG30ZMS128G | HP Omen 15-dc0015ng Toshiba XG5 KXG50ZNV512G | Average Samsung SSD PM981 MZVLB256HAHQ | |
|---|---|---|---|---|---|---|
| CrystalDiskMark 5.2 / 6 | 53% | 35% | -53% | -21% | 70% | |
| Write 4K (MB/s) | 50.2 | 147.2 193% | 148.4 196% | 64.3 28% | 87.5 74% | 116.1 ? 131% |
| Read 4K (MB/s) | 35.32 | 63.7 80% | 49.65 41% | 29.3 -17% | 16.08 -54% | 189.5 ? 437% |
| Write Seq (MB/s) | 991 | 1573 59% | 1139 15% | 131.1 -87% | 614 -38% | 1409 ? 42% |
| Read Seq (MB/s) | 1526 | 2602 71% | 2353 54% | 776 -49% | 1341 -12% | 1624 ? 6% |
| Write 4K Q32T1 (MB/s) | 445.1 | 531 19% | 484.7 9% | 96.8 -78% | 307.9 -31% | 360 ? -19% |
| Read 4K Q32T1 (MB/s) | 526 | 598 14% | 542 3% | 198.6 -62% | 358.4 -32% | 396 ? -25% |
| Write Seq Q32T1 (MB/s) | 1647 | 1592 -3% | 1139 -31% | 127.8 -92% | 525 -68% | 1492 ? -9% |
| Read Seq Q32T1 (MB/s) | 3427 | 2981 -13% | 3108 -9% | 1044 -70% | 3077 -10% | 3313 ? -3% |
| AS SSD | -8% | -9% | -347% | -45% | -17% | |
| Seq Read (MB/s) | 2485 | 1912 -23% | 1937 -22% | 1036 -58% | 2432 -2% | 2032 ? -18% |
| Seq Write (MB/s) | 1575 | 1553 -1% | 1066 -32% | 115.1 -93% | 843 -46% | 1339 ? -15% |
| 4K Read (MB/s) | 53.4 | 56.5 6% | 31.76 -41% | 29.6 -45% | 21.24 -60% | 46.1 ? -14% |
| 4K Write (MB/s) | 113.5 | 119.6 5% | 102.6 -10% | 67.8 -40% | 99.3 -13% | 107.4 ? -5% |
| 4K-64 Read (MB/s) | 725 | 869 20% | 1140 57% | 184.5 -75% | 730 1% | 712 ? -2% |
| 4K-64 Write (MB/s) | 1371 | 584 -57% | 938 -32% | 95.2 -93% | 484.4 -65% | 999 ? -27% |
| Access Time Read * (ms) | 0.059 | 0.049 17% | 0.058 2% | 1.519 -2475% | 0.126 -114% | 0.07076 ? -20% |
| Access Time Write * (ms) | 0.032 | 0.031 3% | 0.04 -25% | 0.255 -697% | 0.063 -97% | 0.04352 ? -36% |
| Score Read (Points) | 1027 | 1116 9% | 1366 33% | 318 -69% | 994 -3% | 961 ? -6% |
| Score Write (Points) | 1642 | 859 -48% | 1147 -30% | 174 -89% | 668 -59% | 1240 ? -24% |
| Score Total (Points) | 3163 | 2544 -20% | 3168 0% | 620 -80% | 2091 -34% | 2671 ? -16% |
| Copy ISO MB/s (MB/s) | 1329 | 946 | 159.2 | 1632 | 1297 ? | |
| Copy Program MB/s (MB/s) | 404.3 | 452.8 | 94.4 | 30.89 | 409 ? | |
| Copy Game MB/s (MB/s) | 1071 | 1013 | 106.3 | 980 | 786 ? | |
| Total Average (Program / Settings) | 23% /
17% | 13% /
9% | -200% /
-223% | -33% /
-35% | 27% /
20% |
* ... smaller is better

| 3DMark 11 - 1280x720 Performance GPU | |
| Average of class Gaming (21841 - 80022, n=106, last 2 years) | |
| Aorus 15 X9 | |
| Alienware m15 P79F | |
| Average NVIDIA GeForce RTX 2070 Max-Q (14723 - 27694, n=31) | |
| Dell G5 15 5590 | |
| HP Omen 15-dc0015ng | |
| HP Omen 15-dc1303ng | |
| 3DMark | |
| 1280x720 Cloud Gate Standard Graphics | |
| Average of class Gaming (86886 - 223650, n=62, last 2 years) | |
| Aorus 15 X9 | |
| HP Omen 15-dc0015ng | |
| Dell G5 15 5590 | |
| Average NVIDIA GeForce RTX 2070 Max-Q (39014 - 134255, n=28) | |
| HP Omen 15-dc1303ng | |
| Alienware m15 P79F | |
| 1920x1080 Fire Strike Graphics | |
| Average of class Gaming (12242 - 62849, n=118, last 2 years) | |
| Aorus 15 X9 | |
| Alienware m15 P79F | |
| Average NVIDIA GeForce RTX 2070 Max-Q (11563 - 21191, n=31) | |
| Dell G5 15 5590 | |
| HP Omen 15-dc0015ng | |
| HP Omen 15-dc1303ng | |
| 2560x1440 Time Spy Graphics | |
| Average of class Gaming (5012 - 26212, n=118, last 2 years) | |
| Aorus 15 X9 | |
| Alienware m15 P79F | |
| Average NVIDIA GeForce RTX 2070 Max-Q (5948 - 8065, n=28) | |
| Dell G5 15 5590 | |
| HP Omen 15-dc0015ng | |
| 3DMark 11 Performance | 13166 points | |
| 3DMark Cloud Gate Standard Score | 31932 points | |
| 3DMark Fire Strike Score | 10797 points | |
Help | ||
| BioShock Infinite | |
| 1920x1080 Ultra Preset, DX11 (DDOF) | |
| Aorus 15 X9 | |
| Alienware m15 P79F | |
| Average NVIDIA GeForce RTX 2070 Max-Q (115.8 - 211, n=15) | |
| HP Omen 15-dc0015ng | |
| Dell G5 15 5590 | |
| HP Omen 15-dc1303ng | |
| 1366x768 High Preset | |
| HP Omen 15-dc0015ng | |
| Average NVIDIA GeForce RTX 2070 Max-Q (203 - 297, n=14) | |
| HP Omen 15-dc1303ng | |
| Alienware m15 P79F | |
| Dell G5 15 5590 | |
| Aorus 15 X9 | |
| Dota 2 Reborn | |
| 1920x1080 ultra (3/3) best looking | |
| Average of class Gaming (84.8 - 248, n=110, last 2 years) | |
| Average NVIDIA GeForce RTX 2070 Max-Q (105.8 - 126, n=13) | |
| HP Omen 15-dc0015ng | |
| HP Omen 15-dc1303ng | |
| 1920x1080 high (2/3) | |
| Average of class Gaming (82.8 - 275, n=109, last 2 years) | |
| Average NVIDIA GeForce RTX 2070 Max-Q (111.4 - 135, n=13) | |
| HP Omen 15-dc0015ng | |
| HP Omen 15-dc1303ng | |
| Anno 1800 | |
| 1920x1080 Ultra Graphics Quality (DX11) | |
| Average of class Gaming (n=1last 2 years) | |
| Dell G5 15 5590 | |
| Average NVIDIA GeForce RTX 2070 Max-Q (28.5 - 40, n=5) | |
| HP Omen 15-dc1303ng | |
| 1920x1080 High Graphics Quality (DX11) | |
| Average of class Gaming (n=1last 2 years) | |
| Average NVIDIA GeForce RTX 2070 Max-Q (58.5 - 70.6, n=4) | |
| Dell G5 15 5590 | |
| HP Omen 15-dc1303ng | |
| low | med. | high | ultra | |
|---|---|---|---|---|
| BioShock Infinite (2013) | 308.7 | 264.3 | 244.6 | 115.8 |
| Dota 2 Reborn (2015) | 126.5 | 117.4 | 111.4 | 105.8 |
| Anno 1800 (2019) | 58.5 | 28.45 |
Noise level
| Idle |
| 32.8 / 32.8 / 32.8 dB(A) |
| Load |
| 42.5 / 47.5 dB(A) |
 | ||
30 dB silent 40 dB(A) audible 50 dB(A) loud |
||
min: | ||
(-) The maximum temperature on the upper side is 47.6 °C / 118 F, compared to the average of 40.4 °C / 105 F, ranging from 21.2 to 68.8 °C for the class Gaming.
(-) The bottom heats up to a maximum of 59.6 °C / 139 F, compared to the average of 43.2 °C / 110 F
(+) In idle usage, the average temperature for the upper side is 31.6 °C / 89 F, compared to the device average of 33.9 °C / 93 F.
(+) The palmrests and touchpad are reaching skin temperature as a maximum (33 °C / 91.4 F) and are therefore not hot.
(-) The average temperature of the palmrest area of similar devices was 28.8 °C / 83.8 F (-4.2 °C / -7.6 F).
HP Omen 15-dc1303ng audio analysis
(-) | not very loud speakers (67.3 dB)
Bass 100 - 315 Hz
(-) | nearly no bass - on average 20.2% lower than median
(±) | linearity of bass is average (11.4% delta to prev. frequency)
Mids 400 - 2000 Hz
(+) | balanced mids - only 2.2% away from median
(±) | linearity of mids is average (8.2% delta to prev. frequency)
Highs 2 - 16 kHz
(+) | balanced highs - only 2.5% away from median
(+) | highs are linear (5.9% delta to prev. frequency)
Overall 100 - 16.000 Hz
(±) | linearity of overall sound is average (20.3% difference to median)
Compared to same class
» 72% of all tested devices in this class were better, 6% similar, 23% worse
» The best had a delta of 6%, average was 18%, worst was 132%
Compared to all devices tested
» 53% of all tested devices were better, 8% similar, 39% worse
» The best had a delta of 4%, average was 24%, worst was 134%
Apple MacBook 12 (Early 2016) 1.1 GHz audio analysis
(+) | speakers can play relatively loud (83.6 dB)
Bass 100 - 315 Hz
(±) | reduced bass - on average 11.3% lower than median
(±) | linearity of bass is average (14.2% delta to prev. frequency)
Mids 400 - 2000 Hz
(+) | balanced mids - only 2.4% away from median
(+) | mids are linear (5.5% delta to prev. frequency)
Highs 2 - 16 kHz
(+) | balanced highs - only 2% away from median
(+) | highs are linear (4.5% delta to prev. frequency)
Overall 100 - 16.000 Hz
(+) | overall sound is linear (10.2% difference to median)
Compared to same class
» 7% of all tested devices in this class were better, 2% similar, 91% worse
» The best had a delta of 5%, average was 18%, worst was 53%
Compared to all devices tested
» 5% of all tested devices were better, 1% similar, 94% worse
» The best had a delta of 4%, average was 24%, worst was 134%
| Off / Standby | |
| Idle | |
| Load |
|
Key:
min: | |
| HP Omen 15-dc1303ng i7-8750H, GeForce RTX 2070 Max-Q, Samsung SSD PM981 MZVLB256HAHQ, IPS, 1920x1080, 15.6" | Aorus 15 X9 i7-8750H, GeForce RTX 2070 Mobile, Intel SSD 760p SSDPEKKW512G8, IPS, 1920x1080, 15.6" | Alienware m15 P79F i7-8750H, GeForce RTX 2070 Max-Q, Toshiba XG5 KXG50ZNV512G, OLED, 3840x2160, 15.6" | Dell G5 15 5590 i7-8750H, GeForce RTX 2060 Mobile, KBG30ZMS128G, IPS, 1920x1080, 15.6" | HP Omen 15-dc0015ng i7-8750H, GeForce GTX 1070 Max-Q, Toshiba XG5 KXG50ZNV512G, IPS, 1920x1080, 15.6" | Average NVIDIA GeForce RTX 2070 Max-Q | Average of class Gaming | |
|---|---|---|---|---|---|---|---|
| Power Consumption | -60% | -4% | 22% | -23% | -23% | -26% | |
| Idle Minimum * (Watt) | 14.7 | 26 -77% | 10.9 26% | 3.5 76% | 14 5% | 15.4 ? -5% | 13 ? 12% |
| Idle Average * (Watt) | 18.6 | 30.8 -66% | 12.3 34% | 6.9 63% | 18.2 2% | 20 ? -8% | 18.7 ? -1% |
| Idle Maximum * (Watt) | 22.6 | 34.9 -54% | 19 16% | 8.5 62% | 24 -6% | 26.7 ? -18% | 24.3 ? -8% |
| Load Average * (Watt) | 90 | 90.7 -1% | 96 -7% | 127 -41% | 143 -59% | 105.2 ? -17% | 108.2 ? -20% |
| Load Maximum * (Watt) | 120 | 241.2 -101% | 229.1 -91% | 179 -49% | 190 -58% | 201 ? -68% | 254 ? -112% |
| Witcher 3 ultra * (Watt) | 175 | 161.7 | 126 |
* ... smaller is better
| HP Omen 15-dc1303ng i7-8750H, GeForce RTX 2070 Max-Q, 70 Wh | Aorus 15 X9 i7-8750H, GeForce RTX 2070 Mobile, 62 Wh | Alienware m15 P79F i7-8750H, GeForce RTX 2070 Max-Q, 90 Wh | Dell G5 15 5590 i7-8750H, GeForce RTX 2060 Mobile, 60 Wh | HP Omen 15-dc0015ng i7-8750H, GeForce GTX 1070 Max-Q, 70.07 Wh | Average of class Gaming | |
|---|---|---|---|---|---|---|
| Battery runtime | -44% | 58% | 154% | 53% | 71% | |
| Reader / Idle (h) | 5 | 1.8 -64% | 14.8 196% | 7.7 54% | 8.71 ? 74% | |
| WiFi v1.3 (h) | 3.3 | 1.6 -52% | 5.2 58% | 7.7 133% | 4.6 39% | 7 ? 112% |
| Load (h) | 1.2 | 1 -17% | 2.8 133% | 2 67% | 1.51 ? 26% |
Pros
Cons
暗影精灵4Pro仍然是一款坚固的游戏笔记本电脑。它保留了其前代产品的优势,同时在机身下藏有性能更强的组件。正如我们所期待的那样,该笔记本在负载下也相对安静地运行。升级或修理相对简单,可以更换RAM,存储以及无线网卡。然而,有些人可能会发现去拆底板有点困难。
暗影精灵4Pro物超所值,其强大的硬件充分利用了144 Hz 1080p显示屏。对比度差的屏幕和续航时间的不足则让这款游戏笔记本电脑光芒大减。
暗影精灵4Pro的续航时间出乎意料地差,特别是考虑到它配备了70 Wh电池。此外,虽然我们喜欢无PWM的144 Hz面板,但它的低对比度和高黑值令人失望。
总的来说,暗影精灵4Pro是一款普通的游戏笔记本电脑,专为那些只打算插电使用或连接到外接显示器的用户而设计。 RTX 2070 Max-Q和六核CPU仍然物有所值。
HP Omen 15-dc1303ng
- 06/24/2019 v6 (old)
Mike Wobker
Price comparison

