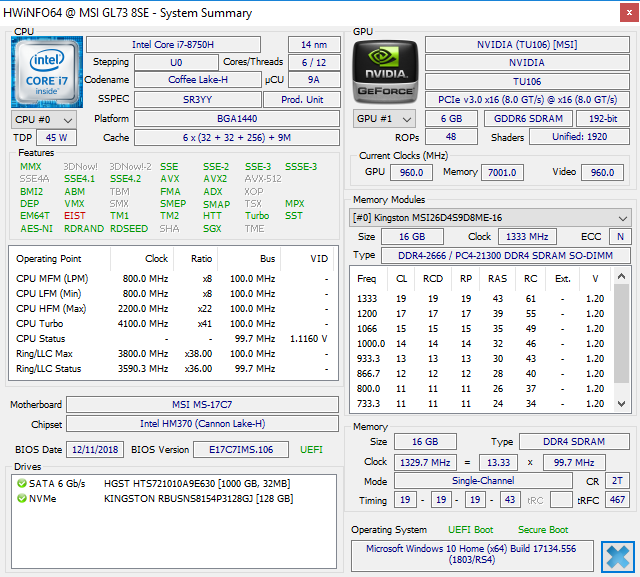
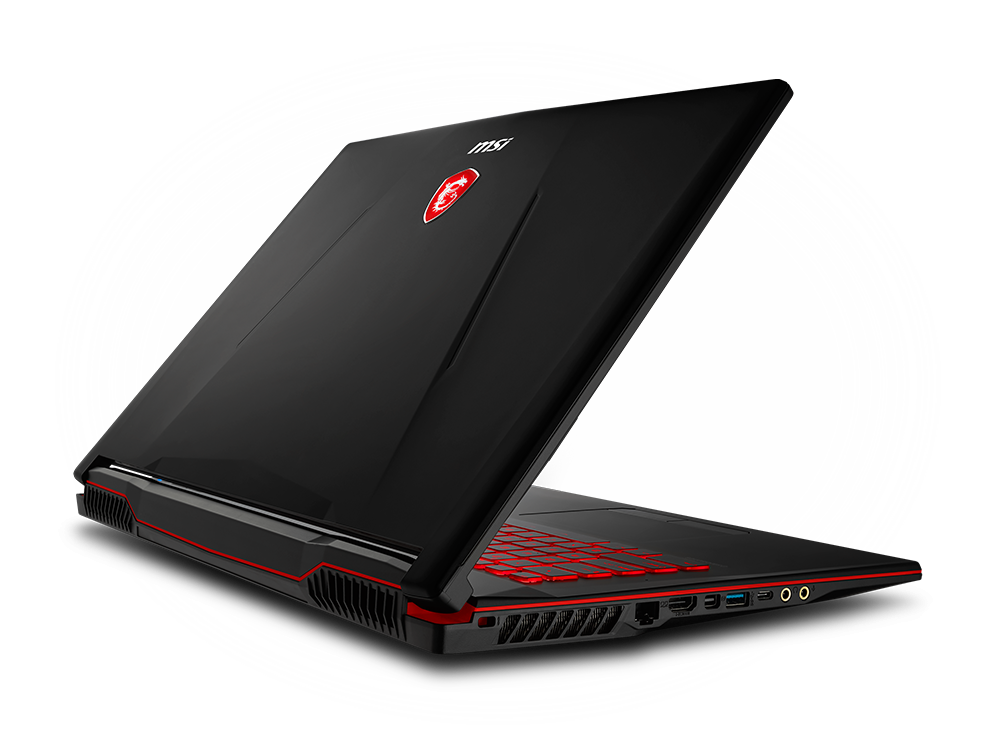
微星GL73 8SE(i7-8750H, RTX 2060)笔记本电脑评测
| SD Card Reader | |
| average JPG Copy Test (av. of 3 runs) | |
| Gigabyte Sabre 17-W8 (Toshiba Exceria Pro SDXC 64 GB UHS-II) | |
| MSI GL73 8SE-010US (Toshiba Exceria Pro SDXC 64 GB UHS-II) | |
| MSI GE73 8RF-008 Raider RGB (Toshiba Exceria Pro SDXC 64 GB UHS-II) | |
| Dell G3 17 3779 (Toshiba Exceria Pro SDXC 64 GB UHS-II) | |
| MSI GL72 7RDX-602 (Toshiba Exceria Pro SDXC 64 GB UHS-II) | |
| maximum AS SSD Seq Read Test (1GB) | |
| Gigabyte Sabre 17-W8 (Toshiba Exceria Pro SDXC 64 GB UHS-II) | |
| MSI GE73 8RF-008 Raider RGB (Toshiba Exceria Pro SDXC 64 GB UHS-II) | |
| MSI GL73 8SE-010US (Toshiba Exceria Pro SDXC 64 GB UHS-II) | |
| MSI GL72 7RDX-602 (Toshiba Exceria Pro SDXC 64 GB UHS-II) | |
| Networking | |
| iperf3 transmit AX12 | |
| MSI GE73 8RF-008 Raider RGB | |
| MSI GL73 8SE-010US | |
| Lenovo Legion Y730-17ICH, i7-8750H | |
| MSI GL72 7RDX-602 | |
| Dell G3 17 3779 | |
| MSI GL73 8RD-418US | |
| iperf3 receive AX12 | |
| MSI GE73 8RF-008 Raider RGB | |
| MSI GL73 8SE-010US | |
| Lenovo Legion Y730-17ICH, i7-8750H | |
| MSI GL73 8RD-418US | |
| MSI GL72 7RDX-602 | |
| Dell G3 17 3779 | |
| |||||||||||||||||||||||||
Brightness Distribution: 90 %
Center on Battery: 326.4 cd/m²
Contrast: 1166:1 (Black: 0.28 cd/m²)
ΔE ColorChecker Calman: 7.83 | ∀{0.5-29.43 Ø4.71}
calibrated: 2.83
ΔE Greyscale Calman: 10.9 | ∀{0.09-98 Ø4.96}
100% sRGB (Argyll 1.6.3 3D)
75.8% AdobeRGB 1998 (Argyll 1.6.3 3D)
85.4% AdobeRGB 1998 (Argyll 3D)
100% sRGB (Argyll 3D)
91.1% Display P3 (Argyll 3D)
Gamma: 1.97
CCT: 11056 K
| MSI GL73 8SE-010US CMN1747, TN LED, 17.3", 1920x1080 | Lenovo Legion Y730-17ICH, i7-8750H LP173WF4-SPF6, IPS, 17.3", 1920x1080 | MSI GL72 7RDX-602 Chi Mei CMN1735 N173HGE-E11, TN LED, 17.3", 1920x1080 | MSI GE73 8RF-008 Raider RGB Chi Mei N173HHE-G32 (CMN1747), TN WLED, 17.3", 1920x1080 | Asus TUF FX705GM AU Optronics B173HAN04.0 (AUO409D), IPS, 17.3", 1920x1080 | Dell G3 17 3779 AUO, B173HAN01.3, IPS, 17.3", 1920x1080 | MSI GL73 8RD-418US Chi Mei N173HHE-G32, TN LED, 17.3", 1920x1080 | |
|---|---|---|---|---|---|---|---|
| Display | -23% | -19% | 0% | -23% | -21% | -0% | |
| Display P3 Coverage (%) | 91.1 | 66.4 -27% | 65.2 -28% | 90.8 0% | 62.4 -32% | 63.9 -30% | 91.1 0% |
| sRGB Coverage (%) | 100 | 84.9 -15% | 94.3 -6% | 99.9 0% | 88.8 -11% | 89.8 -10% | 99.9 0% |
| AdobeRGB 1998 Coverage (%) | 85.4 | 62.1 -27% | 65.6 -23% | 85.8 0% | 63.8 -25% | 64.9 -24% | 84.8 -1% |
| Response Times | -190% | -172% | -93% | 10% | -207% | -68% | |
| Response Time Grey 50% / Grey 80% * (ms) | 12.8 ? | 36.8 ? -187% | 29 ? -127% | 28 ? -119% | 7.4 ? 42% | 38 ? -197% | 29.6 ? -131% |
| Response Time Black / White * (ms) | 8.2 ? | 24 ? -193% | 26 ? -217% | 13.6 ? -66% | 10 ? -22% | 26 ? -217% | 8.6 ? -5% |
| PWM Frequency (Hz) | 25770 ? | 961 | 25000 ? | 25510 ? | |||
| Screen | -8% | -18% | 16% | 17% | 6% | -4% | |
| Brightness middle (cd/m²) | 326.4 | 328.7 1% | 299 -8% | 273 -16% | 234 -28% | 323 -1% | 290.5 -11% |
| Brightness (cd/m²) | 317 | 318 0% | 274 -14% | 273 -14% | 228 -28% | 306 -3% | 284 -10% |
| Brightness Distribution (%) | 90 | 91 1% | 80 -11% | 90 0% | 85 -6% | 89 -1% | 81 -10% |
| Black Level * (cd/m²) | 0.28 | 0.51 -82% | 0.25 11% | 0.26 7% | 0.2 29% | 0.31 -11% | 0.27 4% |
| Contrast (:1) | 1166 | 645 -45% | 1196 3% | 1050 -10% | 1170 0% | 1042 -11% | 1076 -8% |
| Colorchecker dE 2000 * | 7.83 | 4.91 37% | 12.92 -65% | 3.52 55% | 2.16 72% | 4.96 37% | 8.55 -9% |
| Colorchecker dE 2000 max. * | 13.36 | 10.15 24% | 19.91 -49% | 6.34 53% | 3.39 75% | 8.25 38% | 13.44 -1% |
| Colorchecker dE 2000 calibrated * | 2.83 | 4.27 -51% | 2.09 26% | 2.02 29% | 2.74 3% | ||
| Greyscale dE 2000 * | 10.9 | 3.9 64% | 13.16 -21% | 3.11 71% | 2 82% | 5.65 48% | 11.1 -2% |
| Gamma | 1.97 112% | 2.13 103% | 2.36 93% | 2.43 91% | 2.46 89% | 2.24 98% | 1.85 119% |
| CCT | 11056 59% | 6911 94% | 15046 43% | 6999 93% | 6394 102% | 7441 87% | 10912 60% |
| Color Space (Percent of AdobeRGB 1998) (%) | 75.8 | 55.6 -27% | 60 -21% | 76 0% | 58 -23% | 58 -23% | 75.4 -1% |
| Color Space (Percent of sRGB) (%) | 100 | 84.7 -15% | 94 -6% | 100 0% | 89 -11% | 90 -10% | 99.9 0% |
| Total Average (Program / Settings) | -74% /
-34% | -70% /
-39% | -26% /
-1% | 1% /
9% | -74% /
-28% | -24% /
-11% |
* ... smaller is better
Display Response Times
| ↔ Response Time Black to White | ||
|---|---|---|
| 8.2 ms ... rise ↗ and fall ↘ combined | ↗ 6 ms rise | 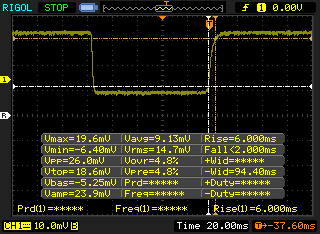 |
| ↘ 2.2 ms fall | ||
| The screen shows fast response rates in our tests and should be suited for gaming. In comparison, all tested devices range from 0.1 (minimum) to 240 (maximum) ms. » 24 % of all devices are better. This means that the measured response time is better than the average of all tested devices (19.8 ms). | ||
| ↔ Response Time 50% Grey to 80% Grey | ||
| 12.8 ms ... rise ↗ and fall ↘ combined | ↗ 6.8 ms rise | 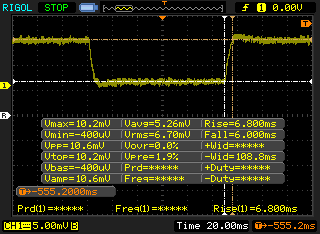 |
| ↘ 6 ms fall | ||
| The screen shows good response rates in our tests, but may be too slow for competitive gamers. In comparison, all tested devices range from 0.165 (minimum) to 636 (maximum) ms. » 26 % of all devices are better. This means that the measured response time is better than the average of all tested devices (31 ms). | ||
Screen Flickering / PWM (Pulse-Width Modulation)
| Screen flickering / PWM detected | 25770 Hz | ≤ 15 % brightness setting | 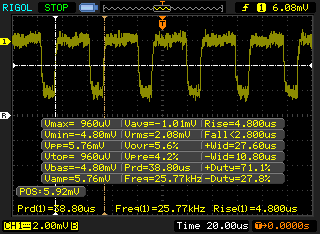 |
The display backlight flickers at 25770 Hz (worst case, e.g., utilizing PWM) Flickering detected at a brightness setting of 15 % and below. There should be no flickering or PWM above this brightness setting. The frequency of 25770 Hz is quite high, so most users sensitive to PWM should not notice any flickering. In comparison: 52 % of all tested devices do not use PWM to dim the display. If PWM was detected, an average of 7754 (minimum: 5 - maximum: 343500) Hz was measured. | |||
| Cinebench R15 | |
| CPU Single 64Bit | |
| Dell XPS 15 9570 Core i9 UHD | |
| Alienware m15 GTX 1070 Max-Q | |
| Average Intel Core i7-8750H (163 - 177, n=86) | |
| MSI GL73 8SE-010US | |
| Lenovo Yoga C930-13IKB 81C4 | |
| Lenovo Legion Y730-15ICH i5-8300H | |
| Lenovo Ideapad 720S-15IKB 81AC001AGE | |
| Acer Nitro 5 AN515-42-R6V0 | |
| Xiaomi Mi Gaming Laptop 7300HQ 1050Ti | |
| CPU Multi 64Bit | |
| Dell XPS 15 9570 Core i9 UHD | |
| Alienware m15 GTX 1070 Max-Q | |
| Average Intel Core i7-8750H (863 - 1251, n=93) | |
| MSI GL73 8SE-010US | |
| Lenovo Legion Y730-15ICH i5-8300H | |
| Lenovo Ideapad 720S-15IKB 81AC001AGE | |
| Acer Nitro 5 AN515-42-R6V0 | |
| Lenovo Yoga C930-13IKB 81C4 | |
| Xiaomi Mi Gaming Laptop 7300HQ 1050Ti | |
| PCMark 8 | |
| Home Score Accelerated v2 | |
| Asus TUF FX705GM | |
| MSI GE73 8RF-008 Raider RGB | |
| Average Intel Core i7-8750H, NVIDIA GeForce RTX 2060 Mobile (3876 - 5077, n=3) | |
| MSI GL73 8RD-418US | |
| Dell G3 17 3779 | |
| MSI GL73 8SE-010US | |
| MSI GL72 7RDX-602 | |
| Work Score Accelerated v2 | |
| Asus TUF FX705GM | |
| Average Intel Core i7-8750H, NVIDIA GeForce RTX 2060 Mobile (5291 - 5899, n=3) | |
| MSI GL73 8RD-418US | |
| MSI GL73 8SE-010US | |
| MSI GE73 8RF-008 Raider RGB | |
| Dell G3 17 3779 | |
| MSI GL72 7RDX-602 | |
| PCMark 8 Home Score Accelerated v2 | 3876 points | |
| PCMark 8 Work Score Accelerated v2 | 5359 points | |
| PCMark 10 Score | 5118 points | |
Help | ||
| MSI GL73 8SE-010US Kingston RBUSNS8154P3128GJ | Lenovo Legion Y730-17ICH, i7-8750H Toshiba KBG30ZMT128G | MSI GE73 8RF-008 Raider RGB Toshiba HG6 THNSNJ256G8NY | Asus TUF FX705GM WDC PC SN520 SDAPNUW-256G | Dell G3 17 3779 SK hynix SC311 SATA | |
|---|---|---|---|---|---|
| AS SSD | -68% | -24% | 116% | -34% | |
| Seq Read (MB/s) | 794 | 979 23% | 511 -36% | 1571 98% | 511 -36% |
| Seq Write (MB/s) | 427.6 | 125.4 -71% | 425.7 0% | 1236 189% | 254.4 -41% |
| 4K Read (MB/s) | 21.91 | 19.73 -10% | 14.07 -36% | 38.49 76% | 24.22 11% |
| 4K Write (MB/s) | 56.6 | 38.73 -32% | 38.34 -32% | 101.9 80% | 58.5 3% |
| 4K-64 Read (MB/s) | 354.3 | 168.6 -52% | 351.4 -1% | 720 103% | 160.7 -55% |
| 4K-64 Write (MB/s) | 285.7 | 31.38 -89% | 172.7 -40% | 856 200% | 114.8 -60% |
| Access Time Read * (ms) | 0.237 | 0.519 -119% | 0.235 1% | 0.106 55% | 0.136 43% |
| Access Time Write * (ms) | 0.09 | 0.324 -260% | 0.097 -8% | 0.036 60% | 0.069 23% |
| Score Read (Points) | 456 | 286 -37% | 417 -9% | 913 100% | 236 -48% |
| Score Write (Points) | 385 | 86 -78% | 254 -34% | 1082 181% | 199 -48% |
| Score Total (Points) | 1061 | 479 -55% | 881 -17% | 2458 132% | 552 -48% |
| Copy ISO MB/s (MB/s) | 811 | 272.7 -66% | 412.5 -49% | 154.9 -81% | |
| Copy Program MB/s (MB/s) | 278 | 182.9 -34% | 192.9 -31% | 99.8 -64% | |
| Copy Game MB/s (MB/s) | 556 | 134.6 -76% | 295.5 -47% | 124.2 -78% |
* ... smaller is better

| 3DMark | |
| 1920x1080 Fire Strike Graphics | |
| Schenker XMG Ultra 17 Coffee Lake Refresh | |
| Razer Blade 15 RTX 2070 Max-Q | |
| MSI GE73 8RF-008 Raider RGB | |
| Average NVIDIA GeForce RTX 2060 Mobile (14768 - 18358, n=43) | |
| Alienware m15 GTX 1070 Max-Q | |
| MSI GL73 8SE-010US | |
| Gigabyte Sabre 17-W8 | |
| Razer Blade 15 Base Model | |
| MSI GL73 8RD-418US | |
| Dell XPS 15 9570 Core i9 UHD | |
| Acer Nitro 5 AN515-42-R6V0 | |
| MSI GL72 7RDX-602 | |
| 2560x1440 Port Royal Graphics | |
| Razer Blade 15 RTX 2070 Max-Q | |
| Average NVIDIA GeForce RTX 2060 Mobile (3020 - 3859, n=29) | |
| MSI GL73 8SE-010US | |
| 3DMark 11 | |
| 1280x720 Performance GPU | |
| Schenker XMG Ultra 17 Coffee Lake Refresh | |
| MSI GE73 8RF-008 Raider RGB | |
| Razer Blade 15 RTX 2070 Max-Q | |
| Average NVIDIA GeForce RTX 2060 Mobile (19143 - 24662, n=40) | |
| Alienware m15 GTX 1070 Max-Q | |
| MSI GL73 8SE-010US | |
| Gigabyte Sabre 17-W8 | |
| Razer Blade 15 Base Model | |
| Asus TUF FX705GM | |
| MSI GL73 8RD-418US | |
| Dell XPS 15 9570 Core i9 UHD | |
| Acer Nitro 5 AN515-42-R6V0 | |
| MSI GL72 7RDX-602 | |
| 1280x720 Performance Combined | |
| Schenker XMG Ultra 17 Coffee Lake Refresh | |
| Asus TUF FX705GM | |
| Average NVIDIA GeForce RTX 2060 Mobile (1107 - 14726, n=40) | |
| Alienware m15 GTX 1070 Max-Q | |
| MSI GE73 8RF-008 Raider RGB | |
| Razer Blade 15 RTX 2070 Max-Q | |
| Razer Blade 15 Base Model | |
| MSI GL73 8SE-010US | |
| Gigabyte Sabre 17-W8 | |
| Dell XPS 15 9570 Core i9 UHD | |
| MSI GL73 8RD-418US | |
| MSI GL72 7RDX-602 | |
| Acer Nitro 5 AN515-42-R6V0 | |
| 3DMark 11 Performance | 15612 points | |
| 3DMark Cloud Gate Standard Score | 29408 points | |
| 3DMark Fire Strike Score | 13774 points | |
| 3DMark Time Spy Score | 5679 points | |
Help | ||
| The Witcher 3 - 1920x1080 Ultra Graphics & Postprocessing (HBAO+) | |
| Razer Blade 15 RTX 2070 Max-Q | |
| MSI GE73 8RF-008 Raider RGB | |
| Schenker XMG Ultra 17 Coffee Lake Refresh | |
| Average NVIDIA GeForce RTX 2060 Mobile (50.6 - 74, n=40) | |
| MSI GL73 8SE-010US | |
| Alienware m15 GTX 1070 Max-Q | |
| Razer Blade 15 Base Model | |
| Lenovo Legion Y7000P-1060 | |
| Lenovo Legion Y730-17ICH, i7-8750H | |
| Gigabyte Sabre 17-W8 | |
| MSI GL72 7RDX-602 | |
| Acer Nitro 5 AN515-42-R6V0 | |
| low | med. | high | ultra | |
|---|---|---|---|---|
| BioShock Infinite (2013) | 230.2 | 198.8 | 201.5 | 127.9 |
| The Witcher 3 (2015) | 188.7 | 157.5 | 104.3 | 55.1 |
| Shadow of the Tomb Raider (2018) | 93 | 75 | 70 | 65 |
| MSI GL73 8SE-010US GeForce RTX 2060 Mobile, i7-8750H, Kingston RBUSNS8154P3128GJ | Lenovo Legion Y730-17ICH, i7-8750H GeForce GTX 1050 Ti Mobile, i7-8750H, Toshiba KBG30ZMT128G | Gigabyte Sabre 17-W8 GeForce GTX 1060 Mobile, i7-8750H, Toshiba NVMe THNSN5256GPU7 | Asus TUF FX705GM GeForce GTX 1060 Mobile, i7-8750H, WDC PC SN520 SDAPNUW-256G | MSI GL73 8RD-418US GeForce GTX 1050 Ti Mobile, i7-8750H, Kingston RBUSNS8154P3128GJ | MSI GE73 8RF-008 Raider RGB GeForce GTX 1070 Mobile, i7-8750H, Toshiba HG6 THNSNJ256G8NY | |
|---|---|---|---|---|---|---|
| Noise | 11% | -0% | -6% | 11% | -2% | |
| off / environment * (dB) | 28.6 | 28 2% | 30.5 -7% | 29 -1% | 28.5 -0% | 30 -5% |
| Idle Minimum * (dB) | 33.8 | 28 17% | 32.1 5% | 32 5% | 29.2 14% | 32 5% |
| Idle Average * (dB) | 34 | 28 18% | 32.1 6% | 33 3% | 29.3 14% | 33 3% |
| Idle Maximum * (dB) | 34.1 | 31.3 8% | 32.3 5% | 44 -29% | 29.3 14% | 34 -0% |
| Load Average * (dB) | 36.5 | 33.4 8% | 42.9 -18% | 46 -26% | 32.7 10% | 41 -12% |
| Witcher 3 ultra * (dB) | 47.8 | 42.8 10% | 48 -0% | 42.7 11% | 50 -5% | |
| Load Maximum * (dB) | 52.2 | 46.2 11% | 48.8 7% | 50 4% | 45.2 13% | 54 -3% |
* ... smaller is better
Noise level
| Idle |
| 33.8 / 34 / 34.1 dB(A) |
| Load |
| 36.5 / 52.2 dB(A) |
 | ||
30 dB silent 40 dB(A) audible 50 dB(A) loud |
||
min: | ||
(-) The maximum temperature on the upper side is 47 °C / 117 F, compared to the average of 40.4 °C / 105 F, ranging from 21.2 to 68.8 °C for the class Gaming.
(±) The bottom heats up to a maximum of 44.4 °C / 112 F, compared to the average of 43.2 °C / 110 F
(+) In idle usage, the average temperature for the upper side is 22.3 °C / 72 F, compared to the device average of 33.9 °C / 93 F.
(+) Playing The Witcher 3, the average temperature for the upper side is 29.9 °C / 86 F, compared to the device average of 33.9 °C / 93 F.
(+) The palmrests and touchpad are cooler than skin temperature with a maximum of 22 °C / 71.6 F and are therefore cool to the touch.
(+) The average temperature of the palmrest area of similar devices was 28.8 °C / 83.8 F (+6.8 °C / 12.2 F).
MSI GL73 8SE-010US audio analysis
(+) | speakers can play relatively loud (88.2 dB)
Bass 100 - 315 Hz
(-) | nearly no bass - on average 23.1% lower than median
(+) | bass is linear (4% delta to prev. frequency)
Mids 400 - 2000 Hz
(+) | balanced mids - only 3.2% away from median
(±) | linearity of mids is average (9.2% delta to prev. frequency)
Highs 2 - 16 kHz
(+) | balanced highs - only 2.6% away from median
(±) | linearity of highs is average (7.1% delta to prev. frequency)
Overall 100 - 16.000 Hz
(±) | linearity of overall sound is average (18.6% difference to median)
Compared to same class
» 61% of all tested devices in this class were better, 9% similar, 31% worse
» The best had a delta of 6%, average was 18%, worst was 132%
Compared to all devices tested
» 42% of all tested devices were better, 8% similar, 50% worse
» The best had a delta of 4%, average was 23%, worst was 134%
Apple MacBook 12 (Early 2016) 1.1 GHz audio analysis
(+) | speakers can play relatively loud (83.6 dB)
Bass 100 - 315 Hz
(±) | reduced bass - on average 11.3% lower than median
(±) | linearity of bass is average (14.2% delta to prev. frequency)
Mids 400 - 2000 Hz
(+) | balanced mids - only 2.4% away from median
(+) | mids are linear (5.5% delta to prev. frequency)
Highs 2 - 16 kHz
(+) | balanced highs - only 2% away from median
(+) | highs are linear (4.5% delta to prev. frequency)
Overall 100 - 16.000 Hz
(+) | overall sound is linear (10.2% difference to median)
Compared to same class
» 7% of all tested devices in this class were better, 2% similar, 90% worse
» The best had a delta of 5%, average was 18%, worst was 53%
Compared to all devices tested
» 5% of all tested devices were better, 1% similar, 94% worse
» The best had a delta of 4%, average was 23%, worst was 134%
| Off / Standby | |
| Idle | |
| Load |
|
Key:
min: | |
| MSI GL73 8SE-010US i7-8750H, GeForce RTX 2060 Mobile, Kingston RBUSNS8154P3128GJ, TN LED, 1920x1080, 17.3" | MSI GE73 8RF-008 Raider RGB i7-8750H, GeForce GTX 1070 Mobile, Toshiba HG6 THNSNJ256G8NY, TN WLED, 1920x1080, 17.3" | MSI GL73 8RD-418US i7-8750H, GeForce GTX 1050 Ti Mobile, Kingston RBUSNS8154P3128GJ, TN LED, 1920x1080, 17.3" | MSI GL72 7RDX-602 i7-7700HQ, GeForce GTX 1050 Mobile, HGST Travelstar 7K1000 HTS721010A9E630, TN LED, 1920x1080, 17.3" | MSI GS73 Stealth 8RF-011 i7-8750H, GeForce GTX 1070 Max-Q, Samsung PM961 MZVLW256HEHP, TN, 1920x1080, 17.3" | MSI GF62VR 7RF-877 i7-7700HQ, GeForce GTX 1060 Mobile, Intel SSD 600p SSDPEKKW256G7, TN LED, 1920x1080, 15.6" | |
|---|---|---|---|---|---|---|
| Power Consumption | -34% | -7% | 4% | -3% | -11% | |
| Idle Minimum * (Watt) | 8.8 | 15 -70% | 11.8 -34% | 9.6 -9% | 8 9% | 16.2 -84% |
| Idle Average * (Watt) | 16.2 | 20 -23% | 18.7 -15% | 15 7% | 14 14% | 18.2 -12% |
| Idle Maximum * (Watt) | 18.3 | 26 -42% | 19.8 -8% | 16.5 10% | 22 -20% | 18.9 -3% |
| Load Average * (Watt) | 86.1 | 97 -13% | 100.8 -17% | 104 -21% | 92 -7% | 82.7 4% |
| Witcher 3 ultra * (Watt) | 146.7 | 186 -27% | 124.4 15% | 154 -5% | 125.7 14% | |
| Load Maximum * (Watt) | 186.4 | 239 -28% | 151.6 19% | 129 31% | 207 -11% | 162.3 13% |
* ... smaller is better
| MSI GL73 8SE-010US i7-8750H, GeForce RTX 2060 Mobile, 41 Wh | Lenovo Legion Y730-17ICH, i7-8750H i7-8750H, GeForce GTX 1050 Ti Mobile, 76 Wh | MSI GL72 7RDX-602 i7-7700HQ, GeForce GTX 1050 Mobile, 43.2 Wh | MSI GE73 8RF-008 Raider RGB i7-8750H, GeForce GTX 1070 Mobile, 51 Wh | Asus TUF FX705GM i7-8750H, GeForce GTX 1060 Mobile, 64 Wh | Dell G3 17 3779 i5-8300H, GeForce GTX 1050 Mobile, 56 Wh | MSI GL73 8RD-418US i7-8750H, GeForce GTX 1050 Ti Mobile, 41 Wh | |
|---|---|---|---|---|---|---|---|
| Battery runtime | 97% | 8% | -4% | 75% | 148% | -7% | |
| Reader / Idle (h) | 6.5 | 13.2 103% | 5.5 -15% | 5.1 -22% | 6.3 -3% | 12.2 88% | |
| WiFi v1.3 (h) | 2.8 | 6.7 139% | 3.4 21% | 3.1 11% | 4.5 61% | 5.8 107% | 2.6 -7% |
| Load (h) | 0.6 | 0.9 50% | 0.7 17% | 0.6 0% | 1.6 167% | 2.1 250% |
Pros
Cons

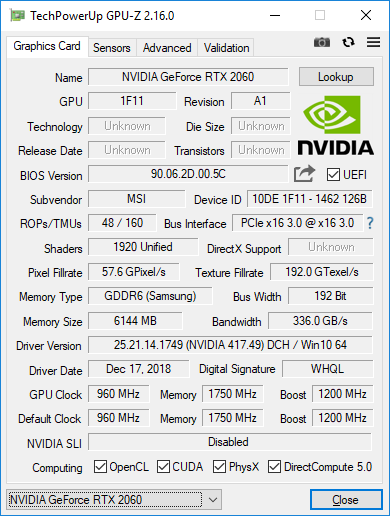
当我们在Blade 15上测试RTX 2070 Max-Q时,我们发现它的1080p性能仅比GTX 1070 Max-Q高出15%。因此,我们认为RTX 2060可能和GTX 1060差不了太多。但是我们很高兴地发现RTX 2060实际上比GTX 1060强35%甚至更多。不过与GTX 1070相比,它的性能还是差了一点,因此GTX 1070用户并不亏 - 至少在DLSS和光线追踪变得更加普遍之前。实际上,RTX 2060与GTX 1070 Max-Q的共同点比GTX 1070更多,甚至有着更低功耗。
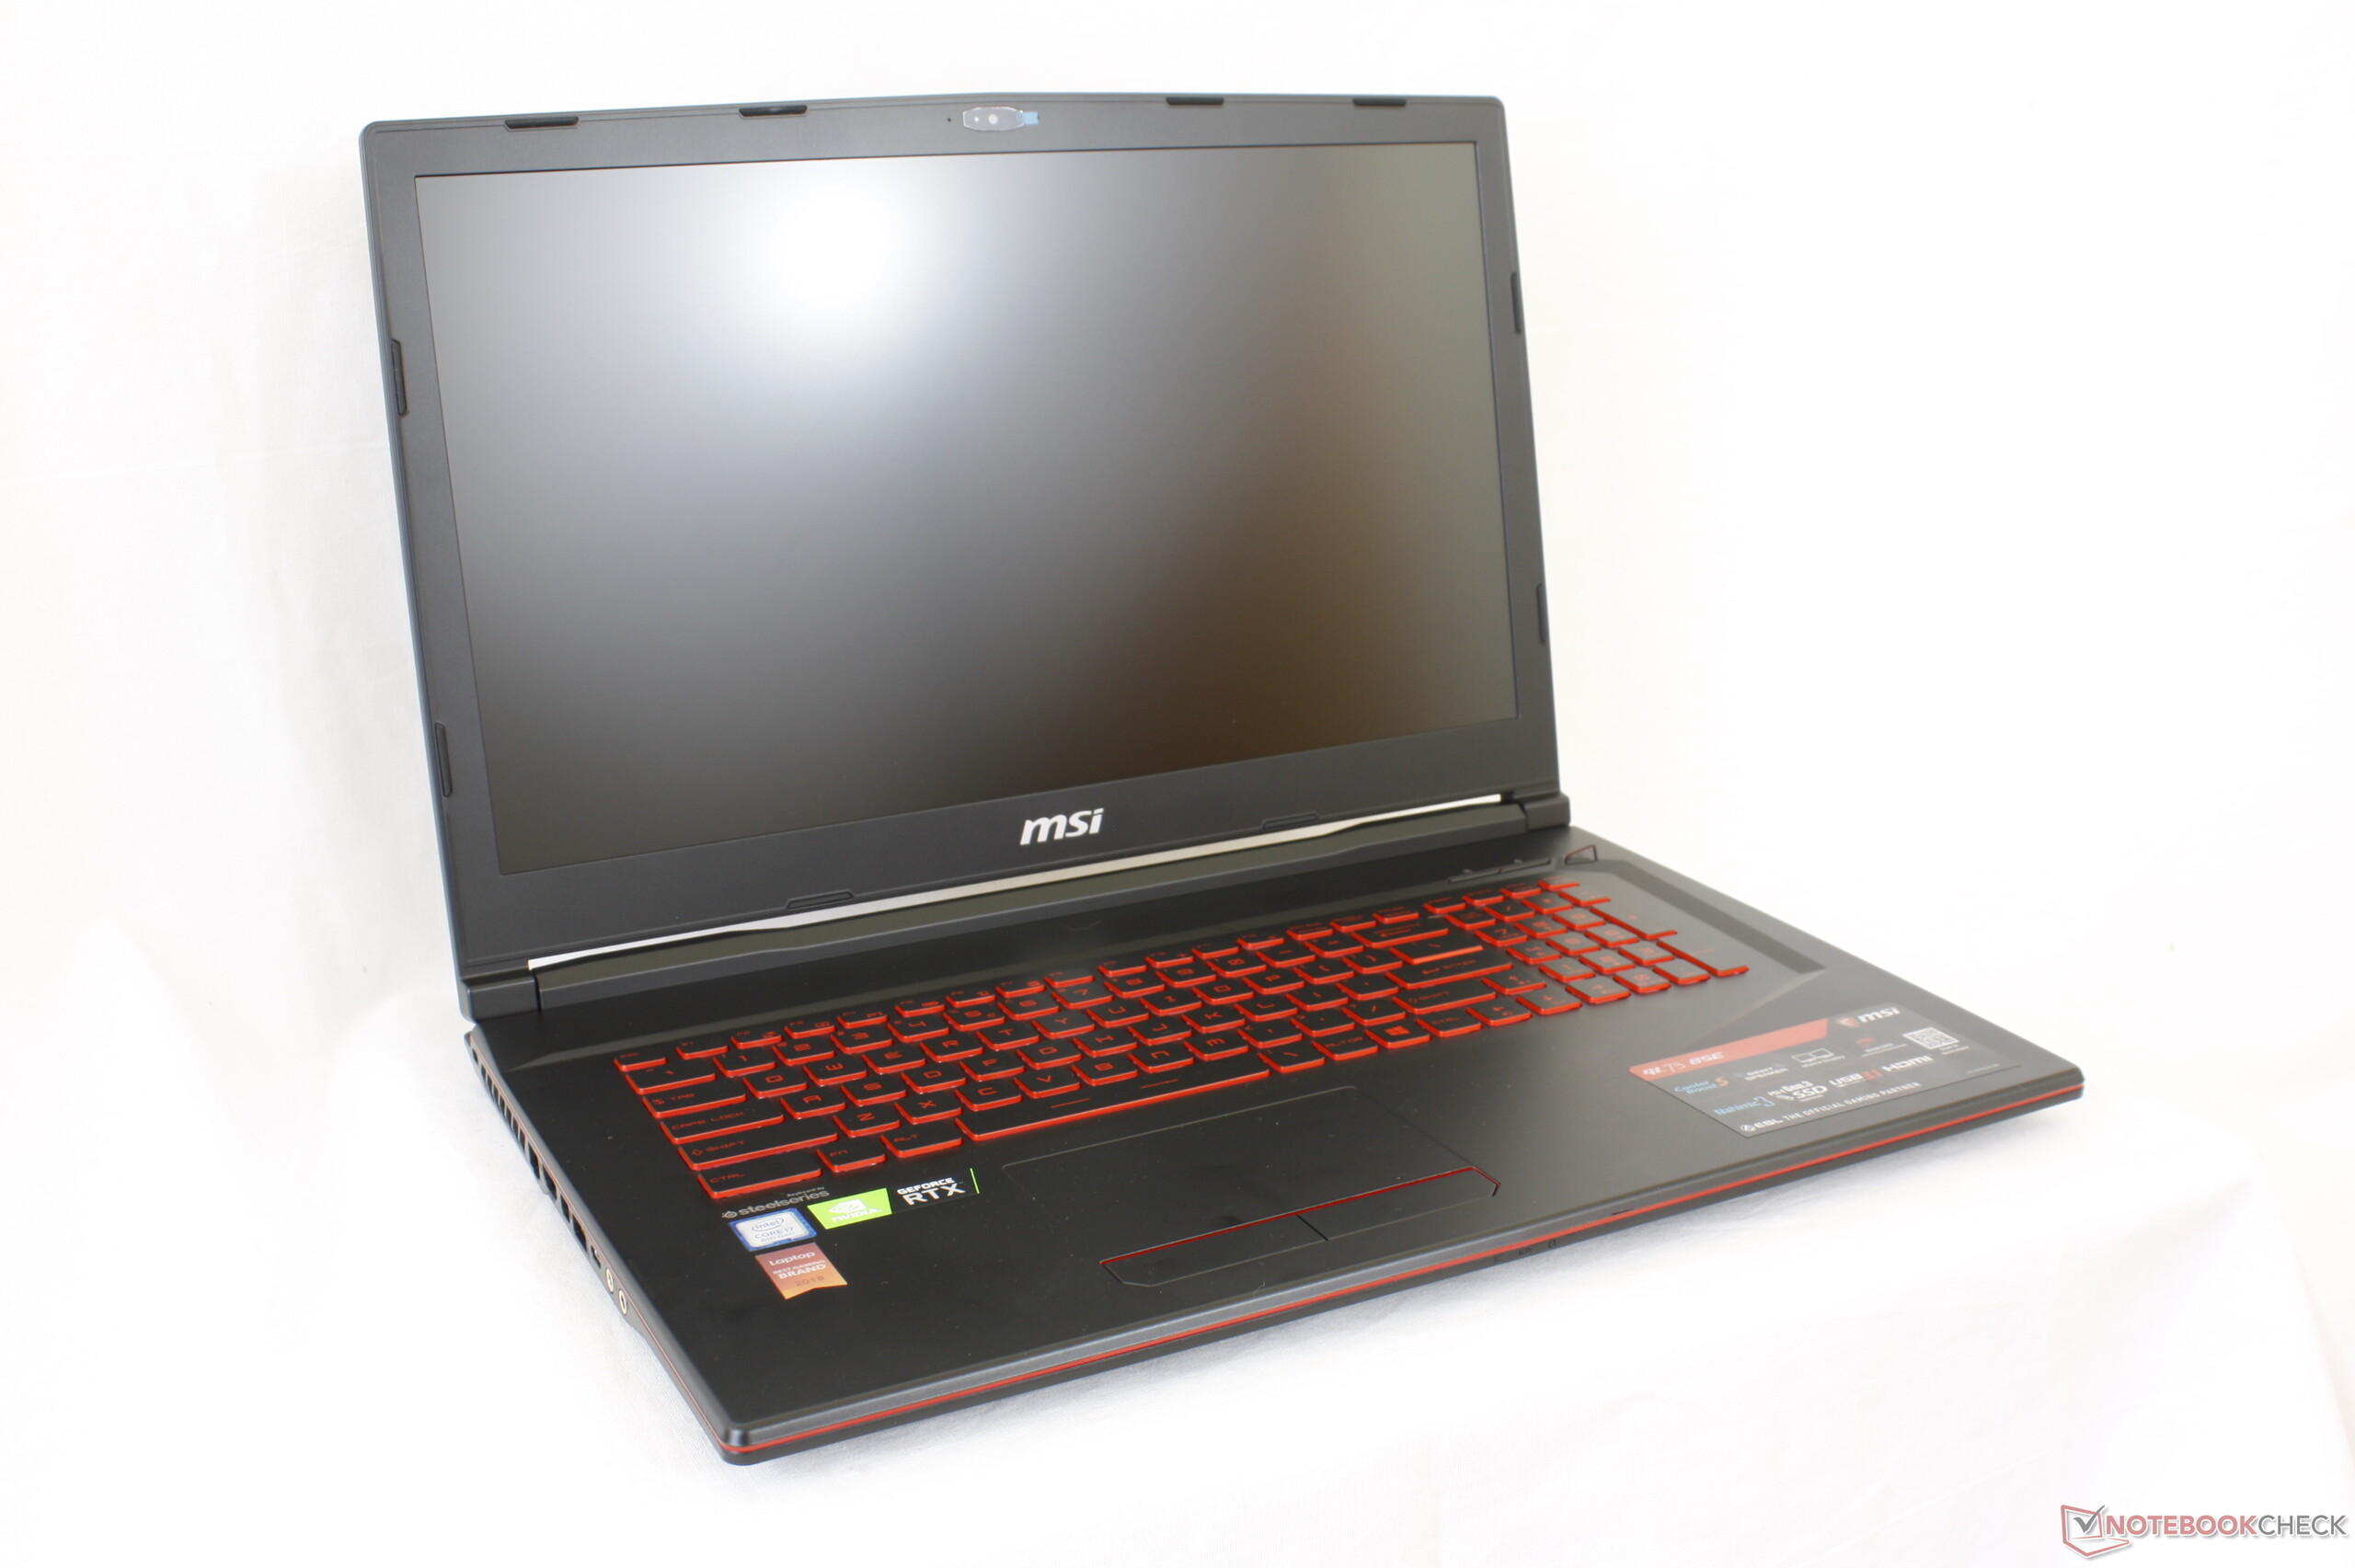
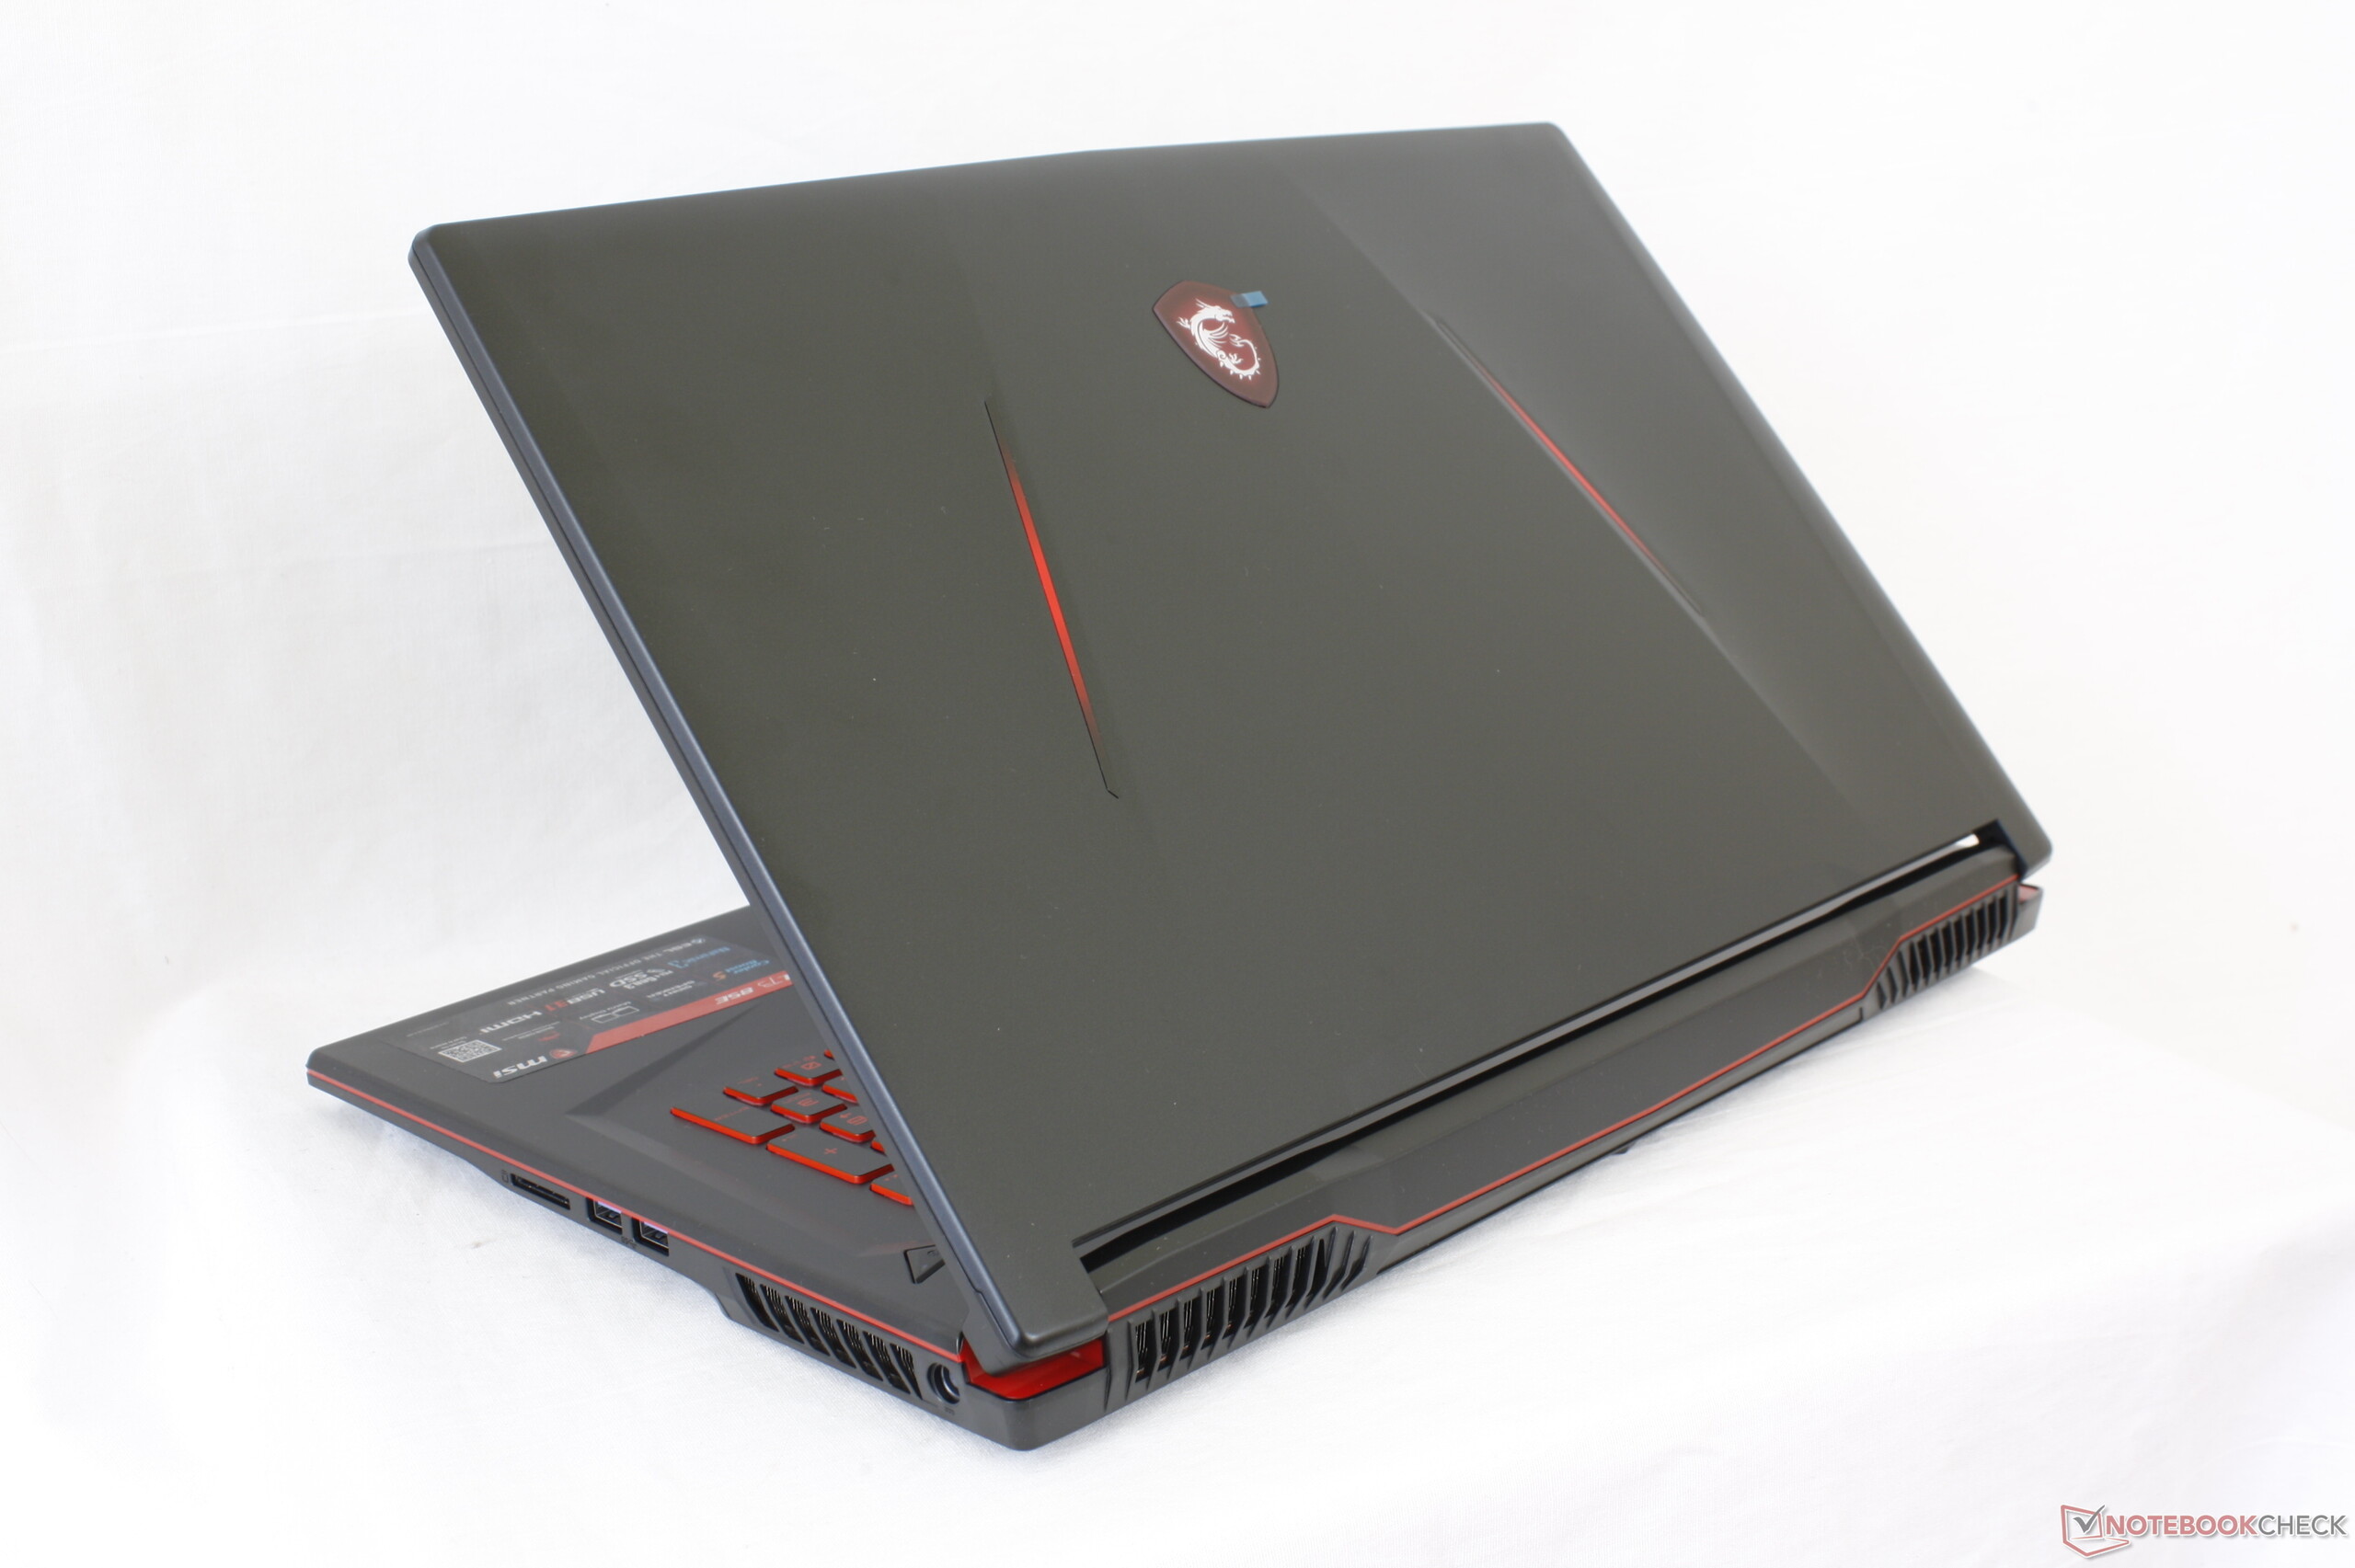
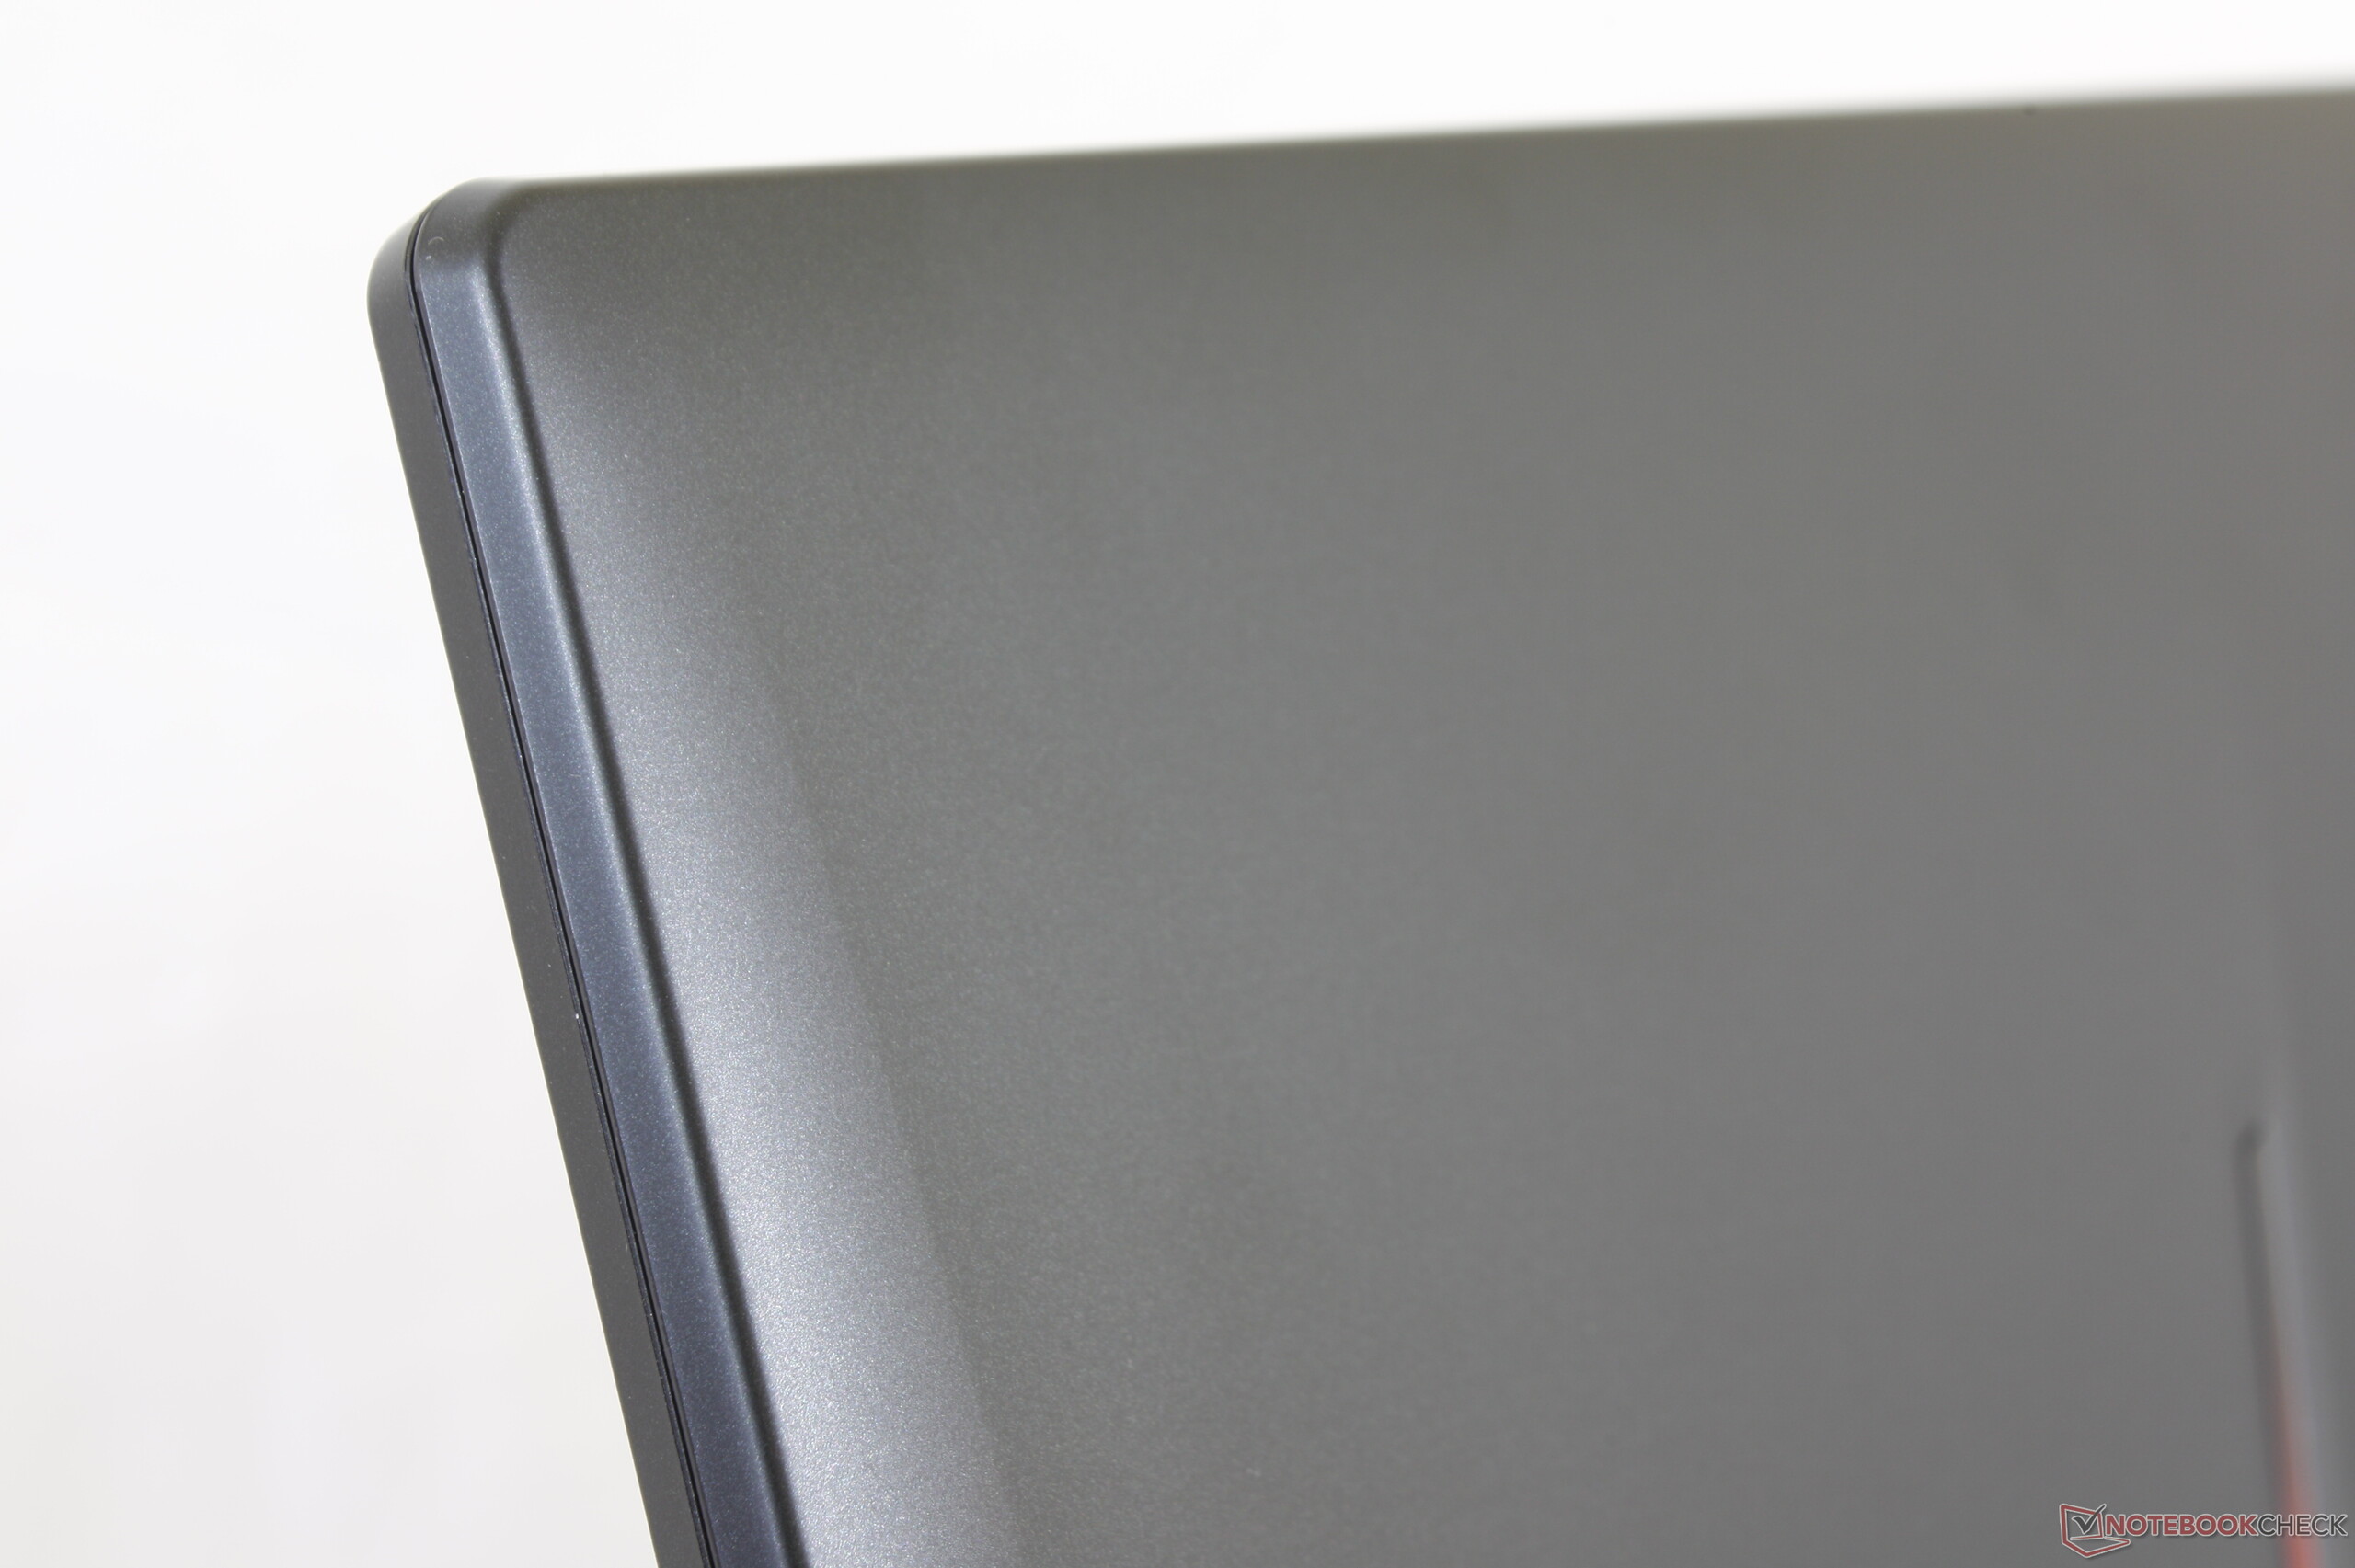
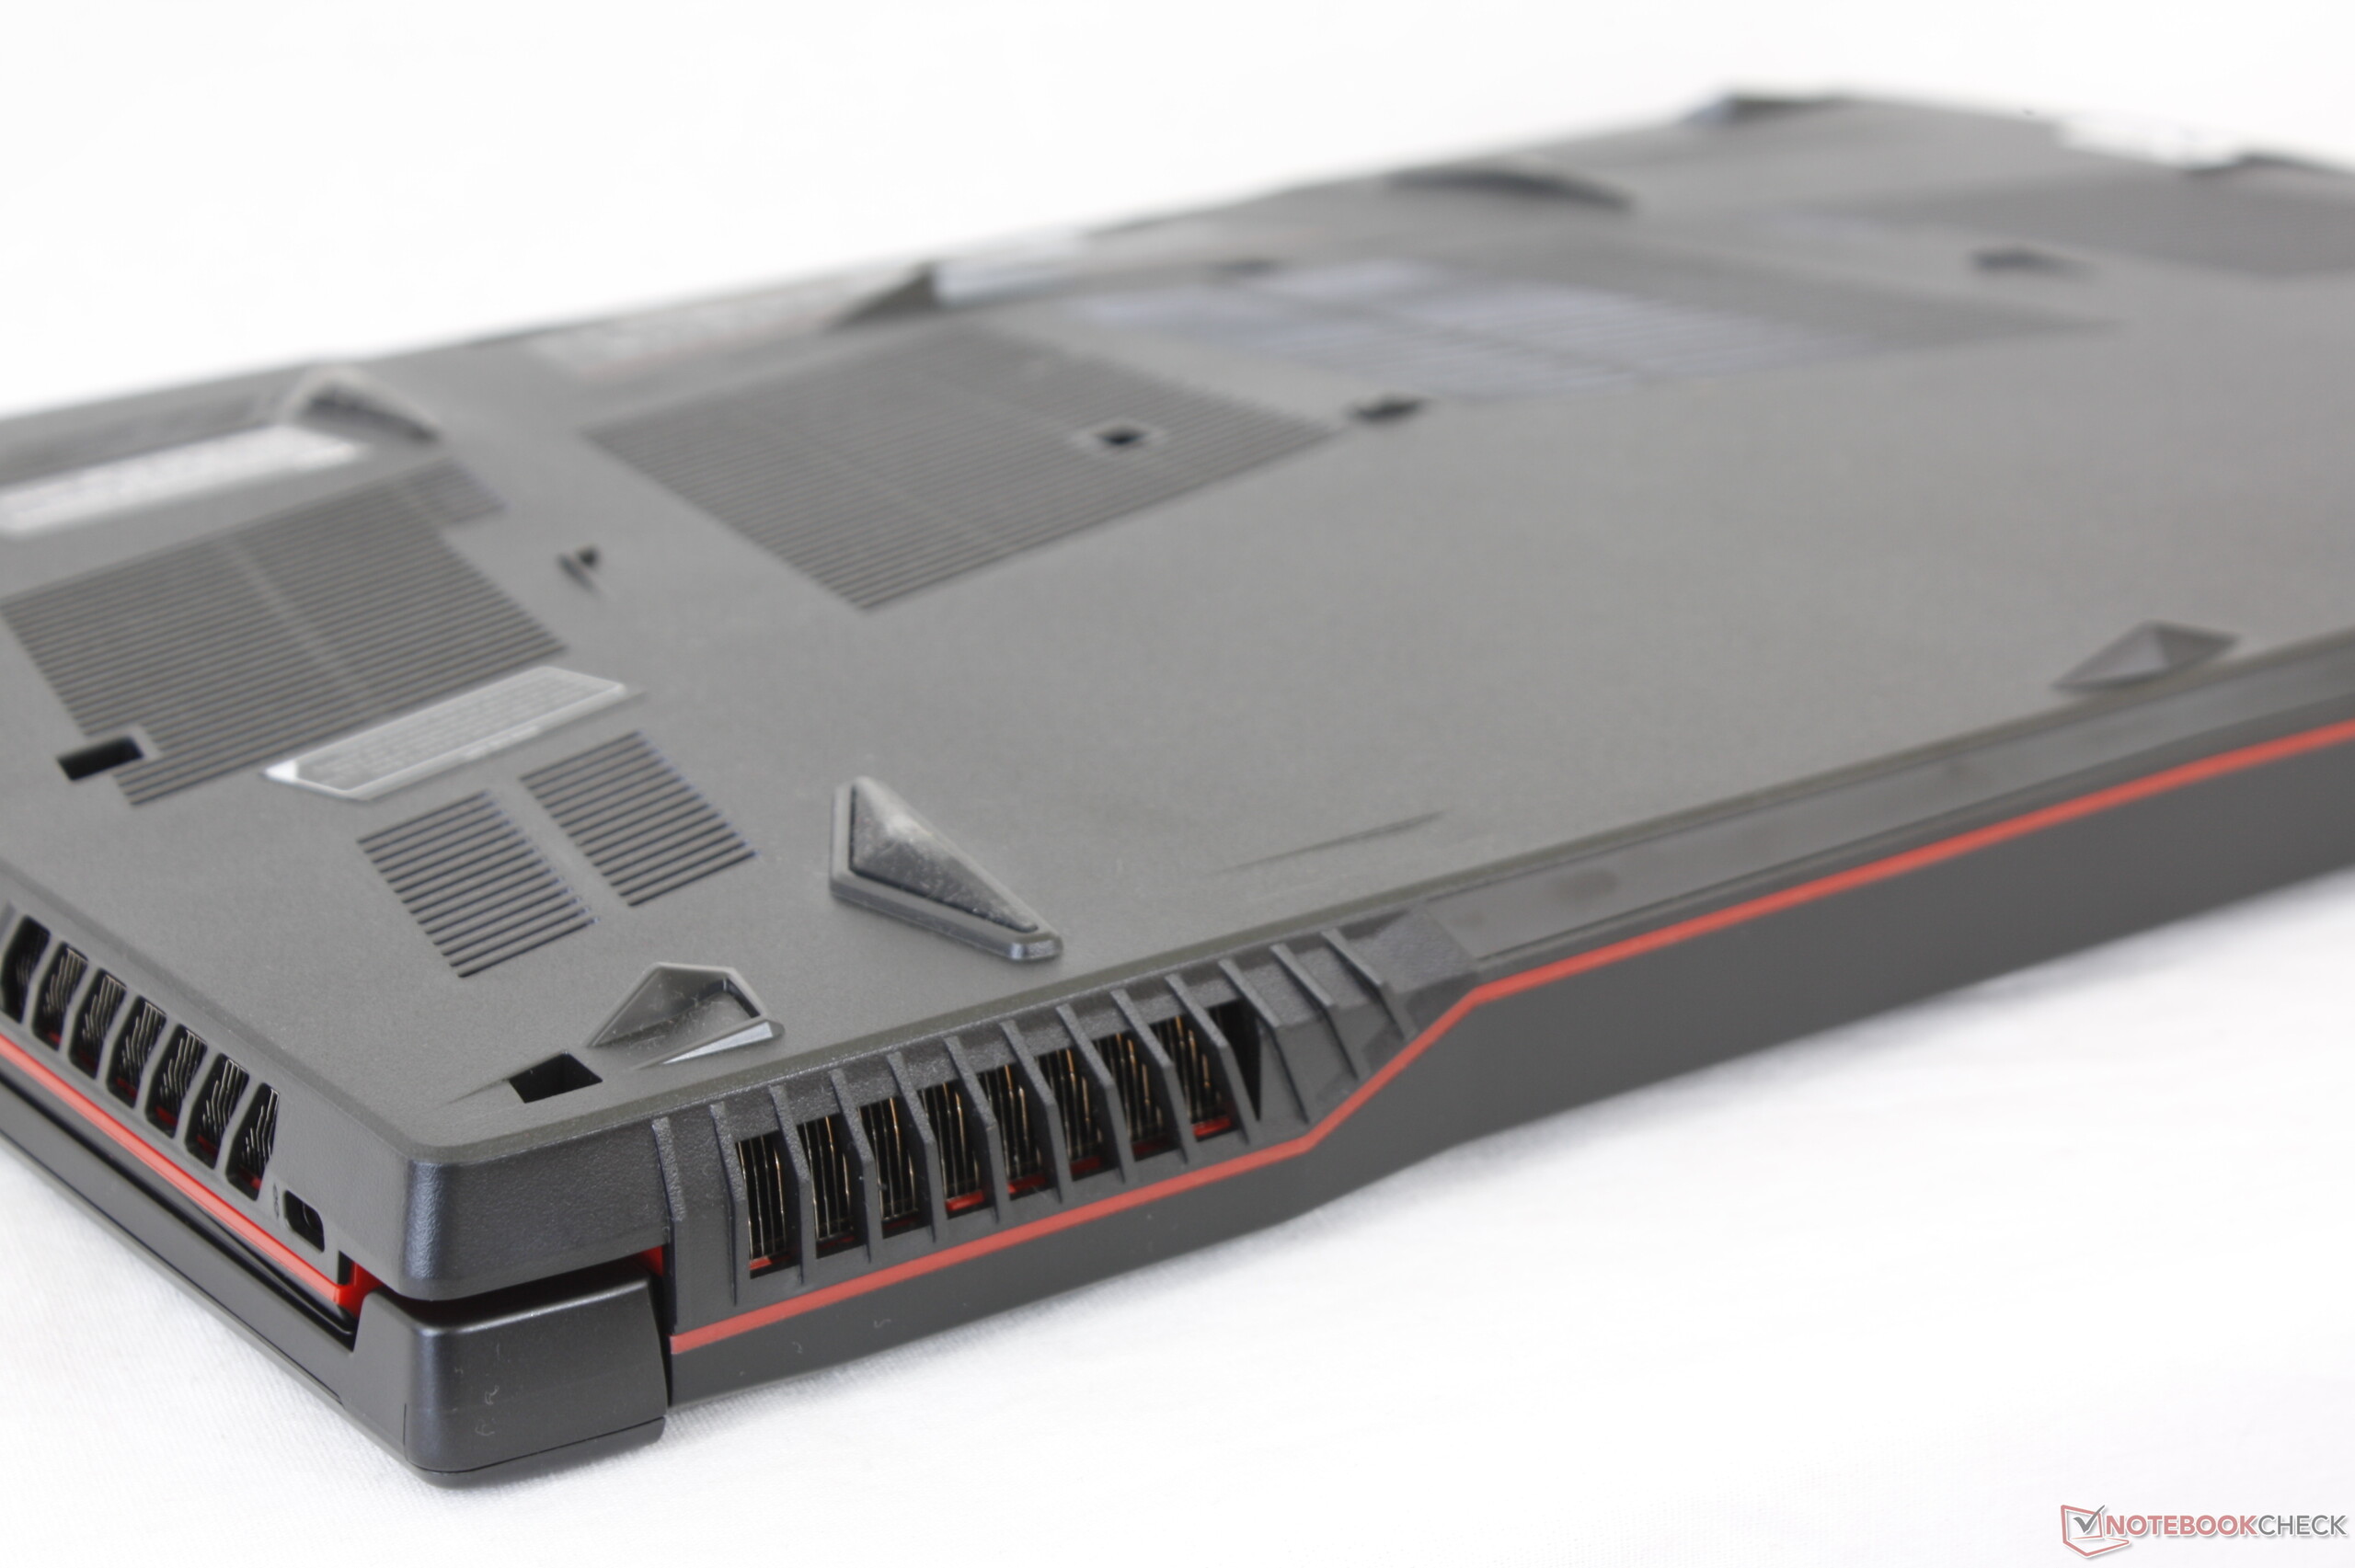
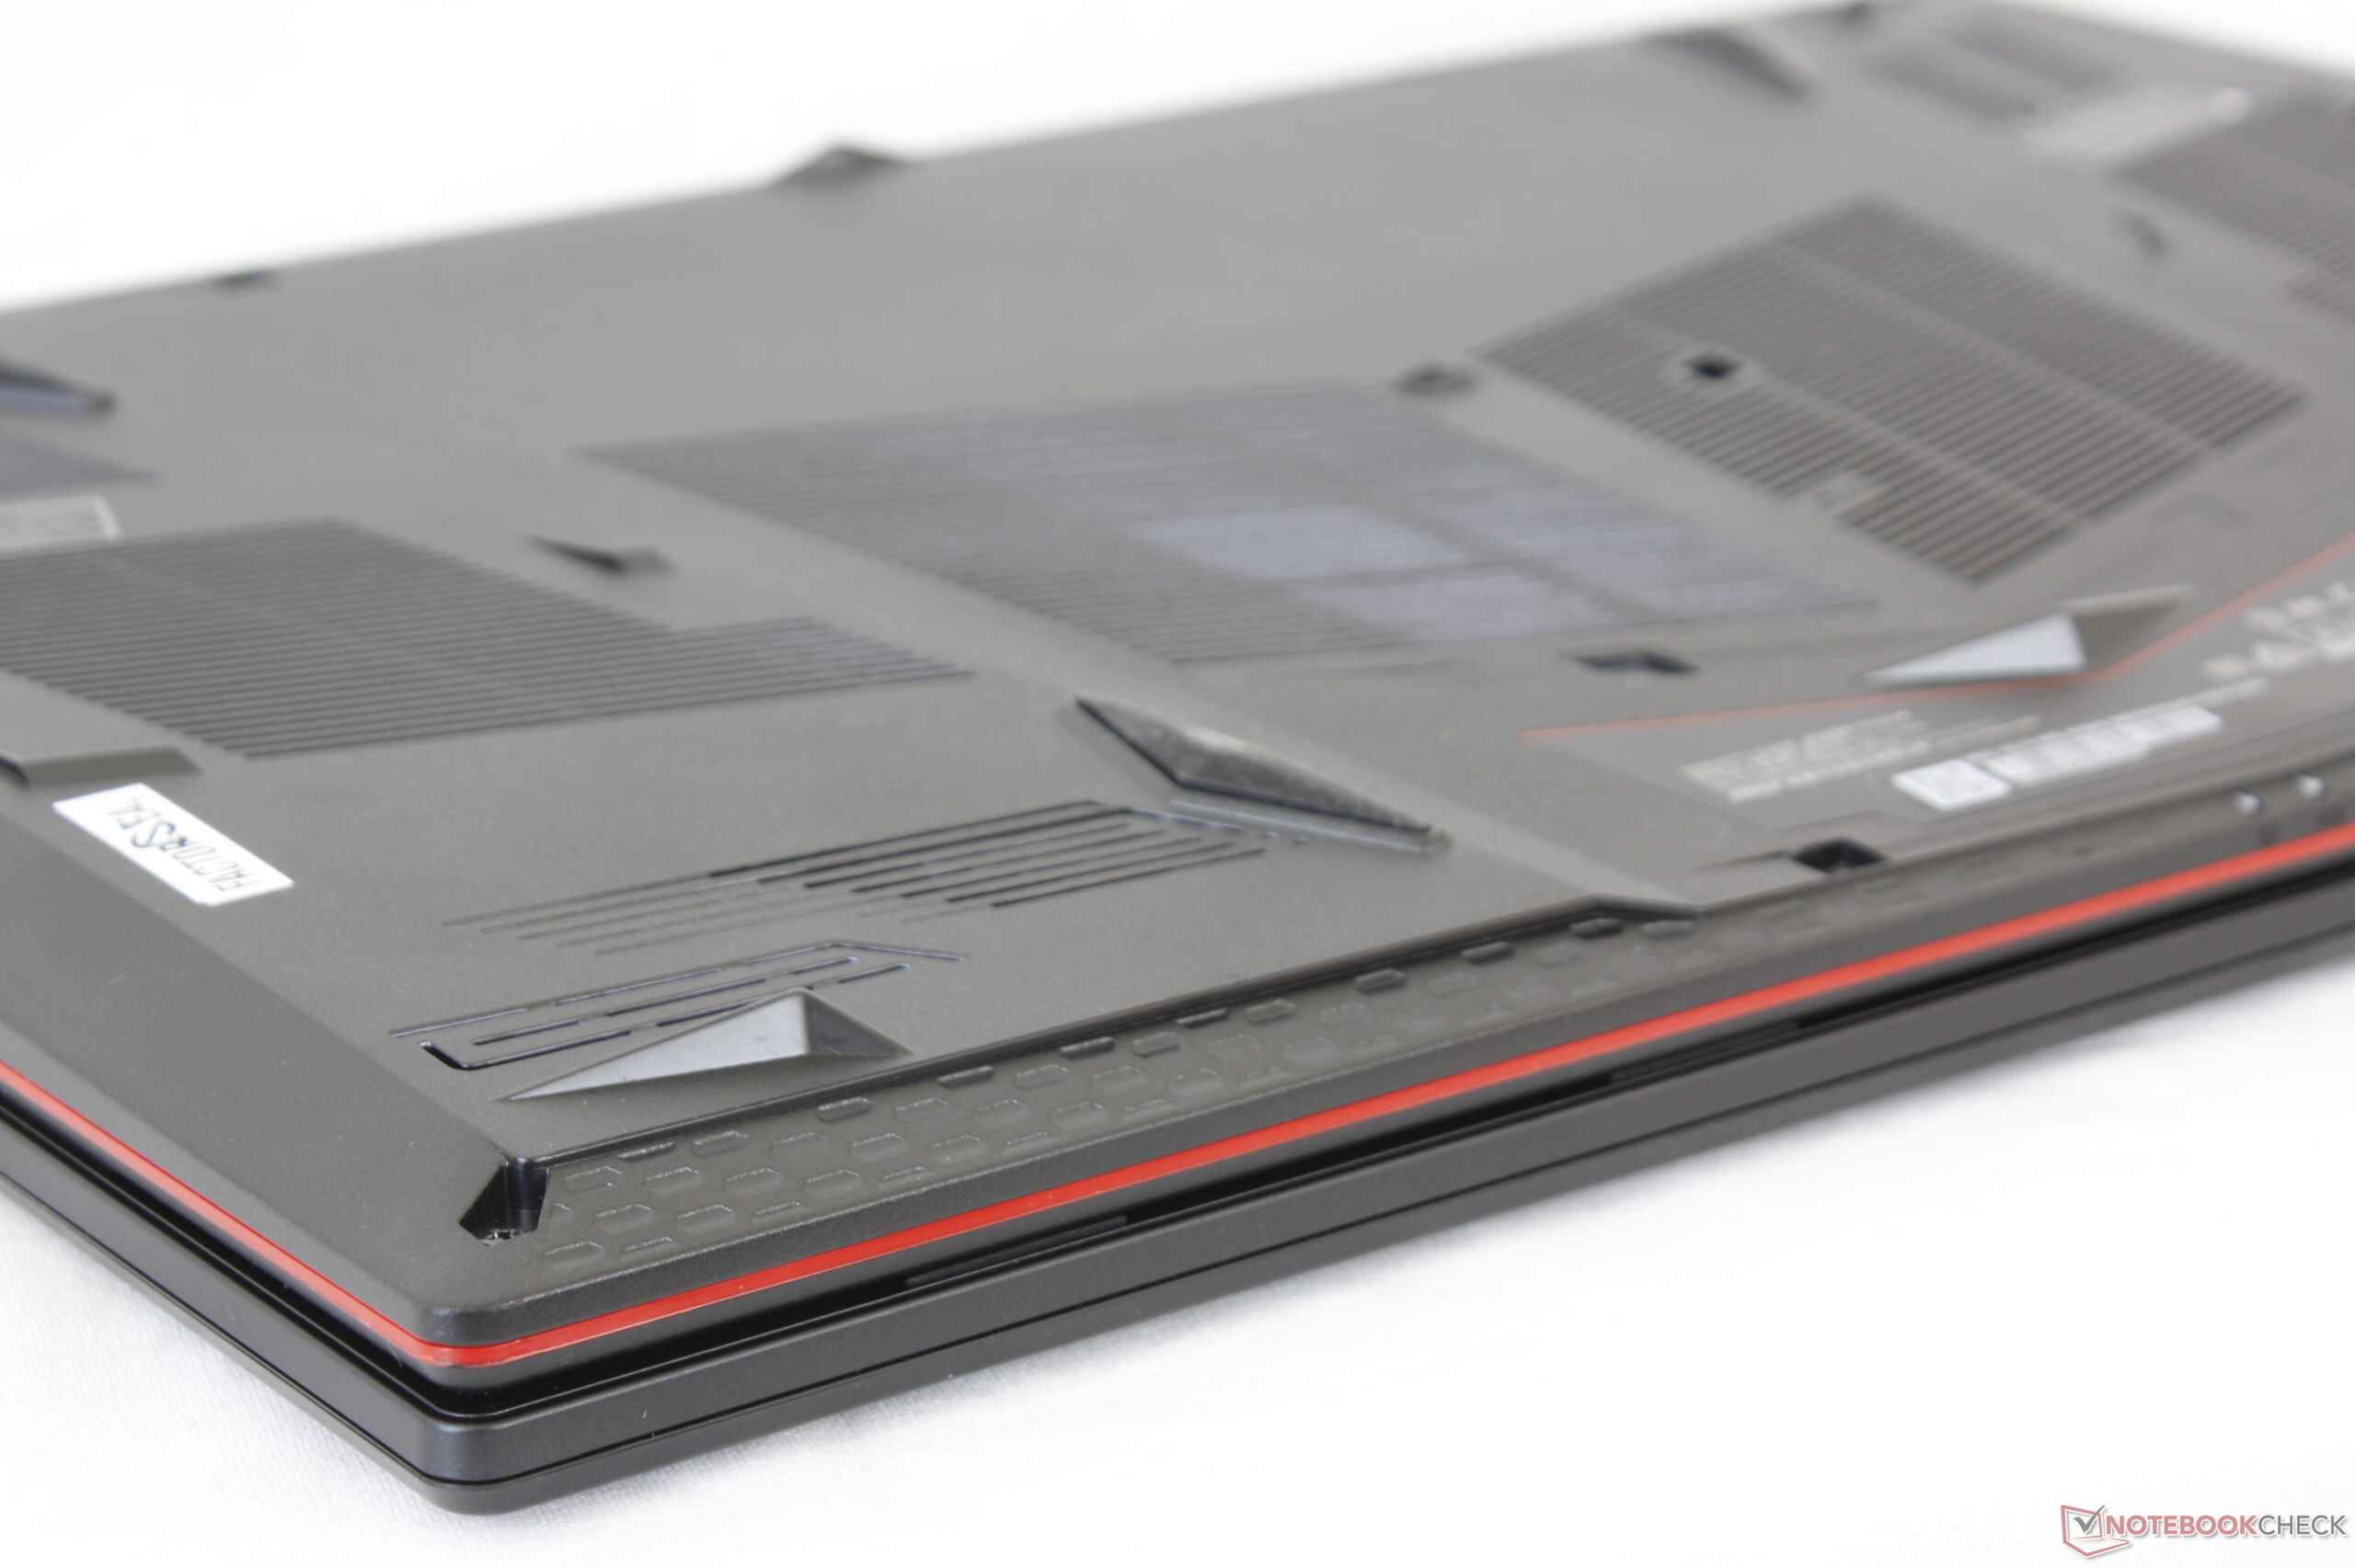
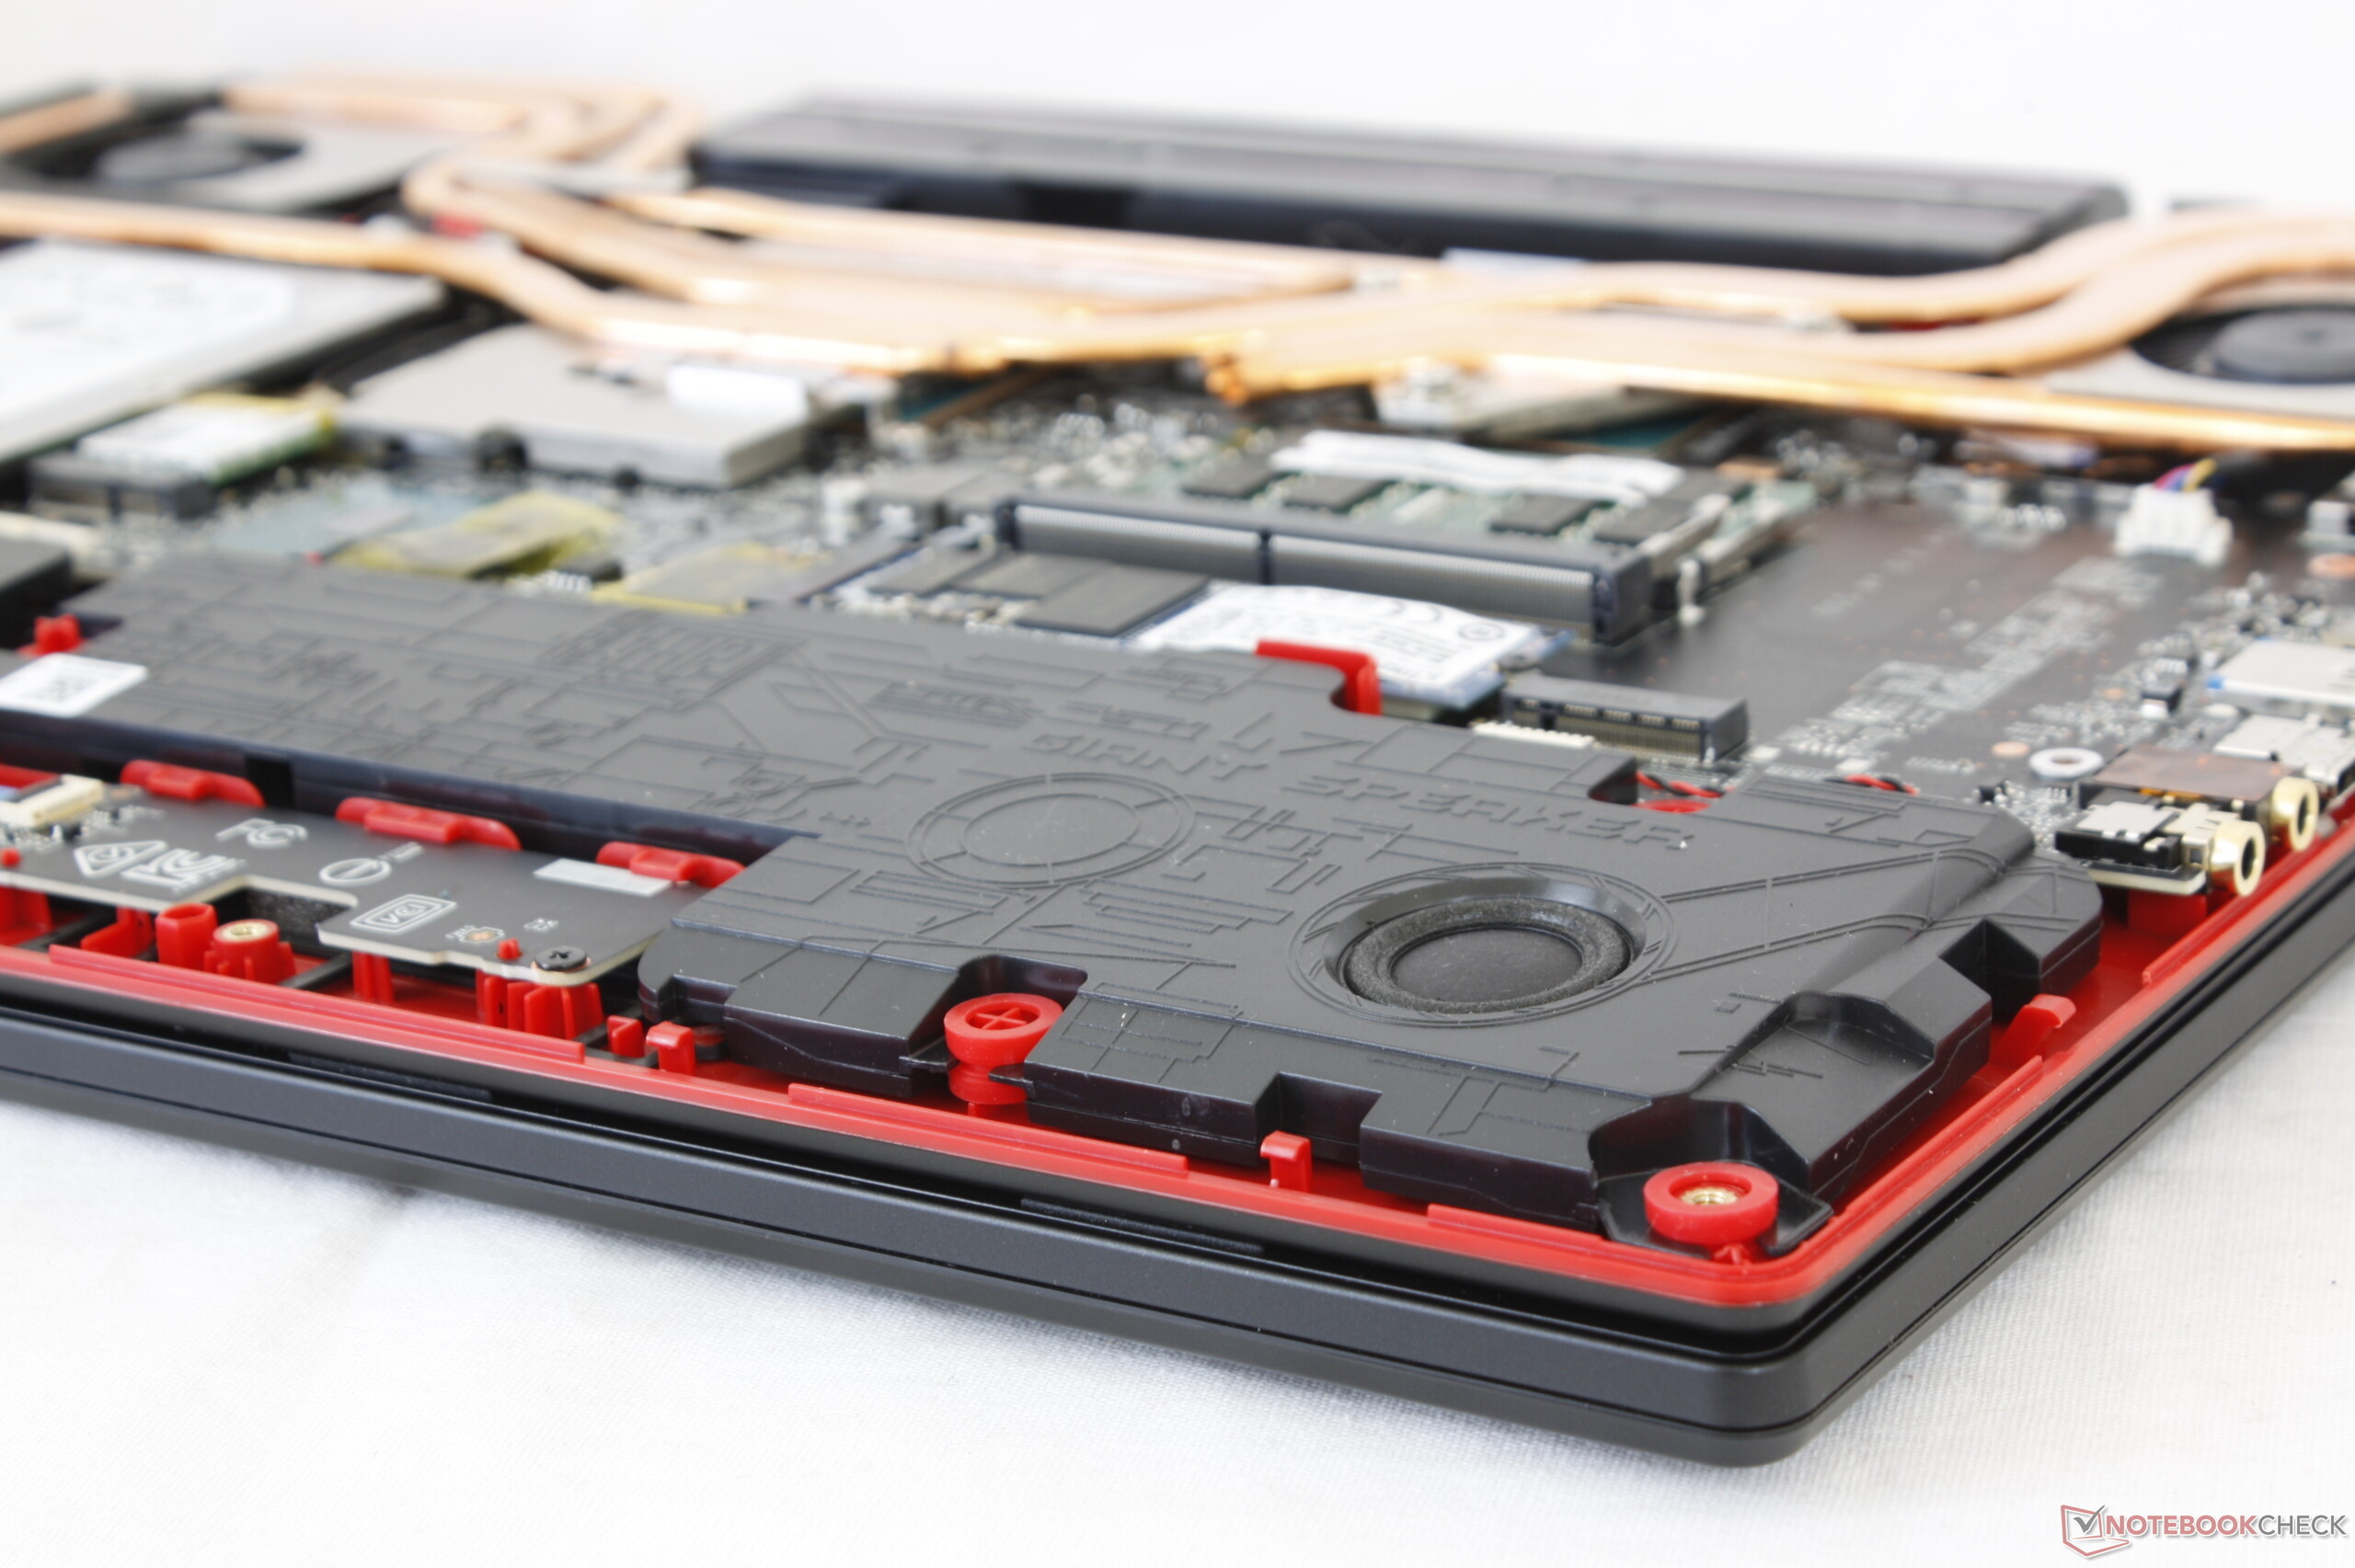
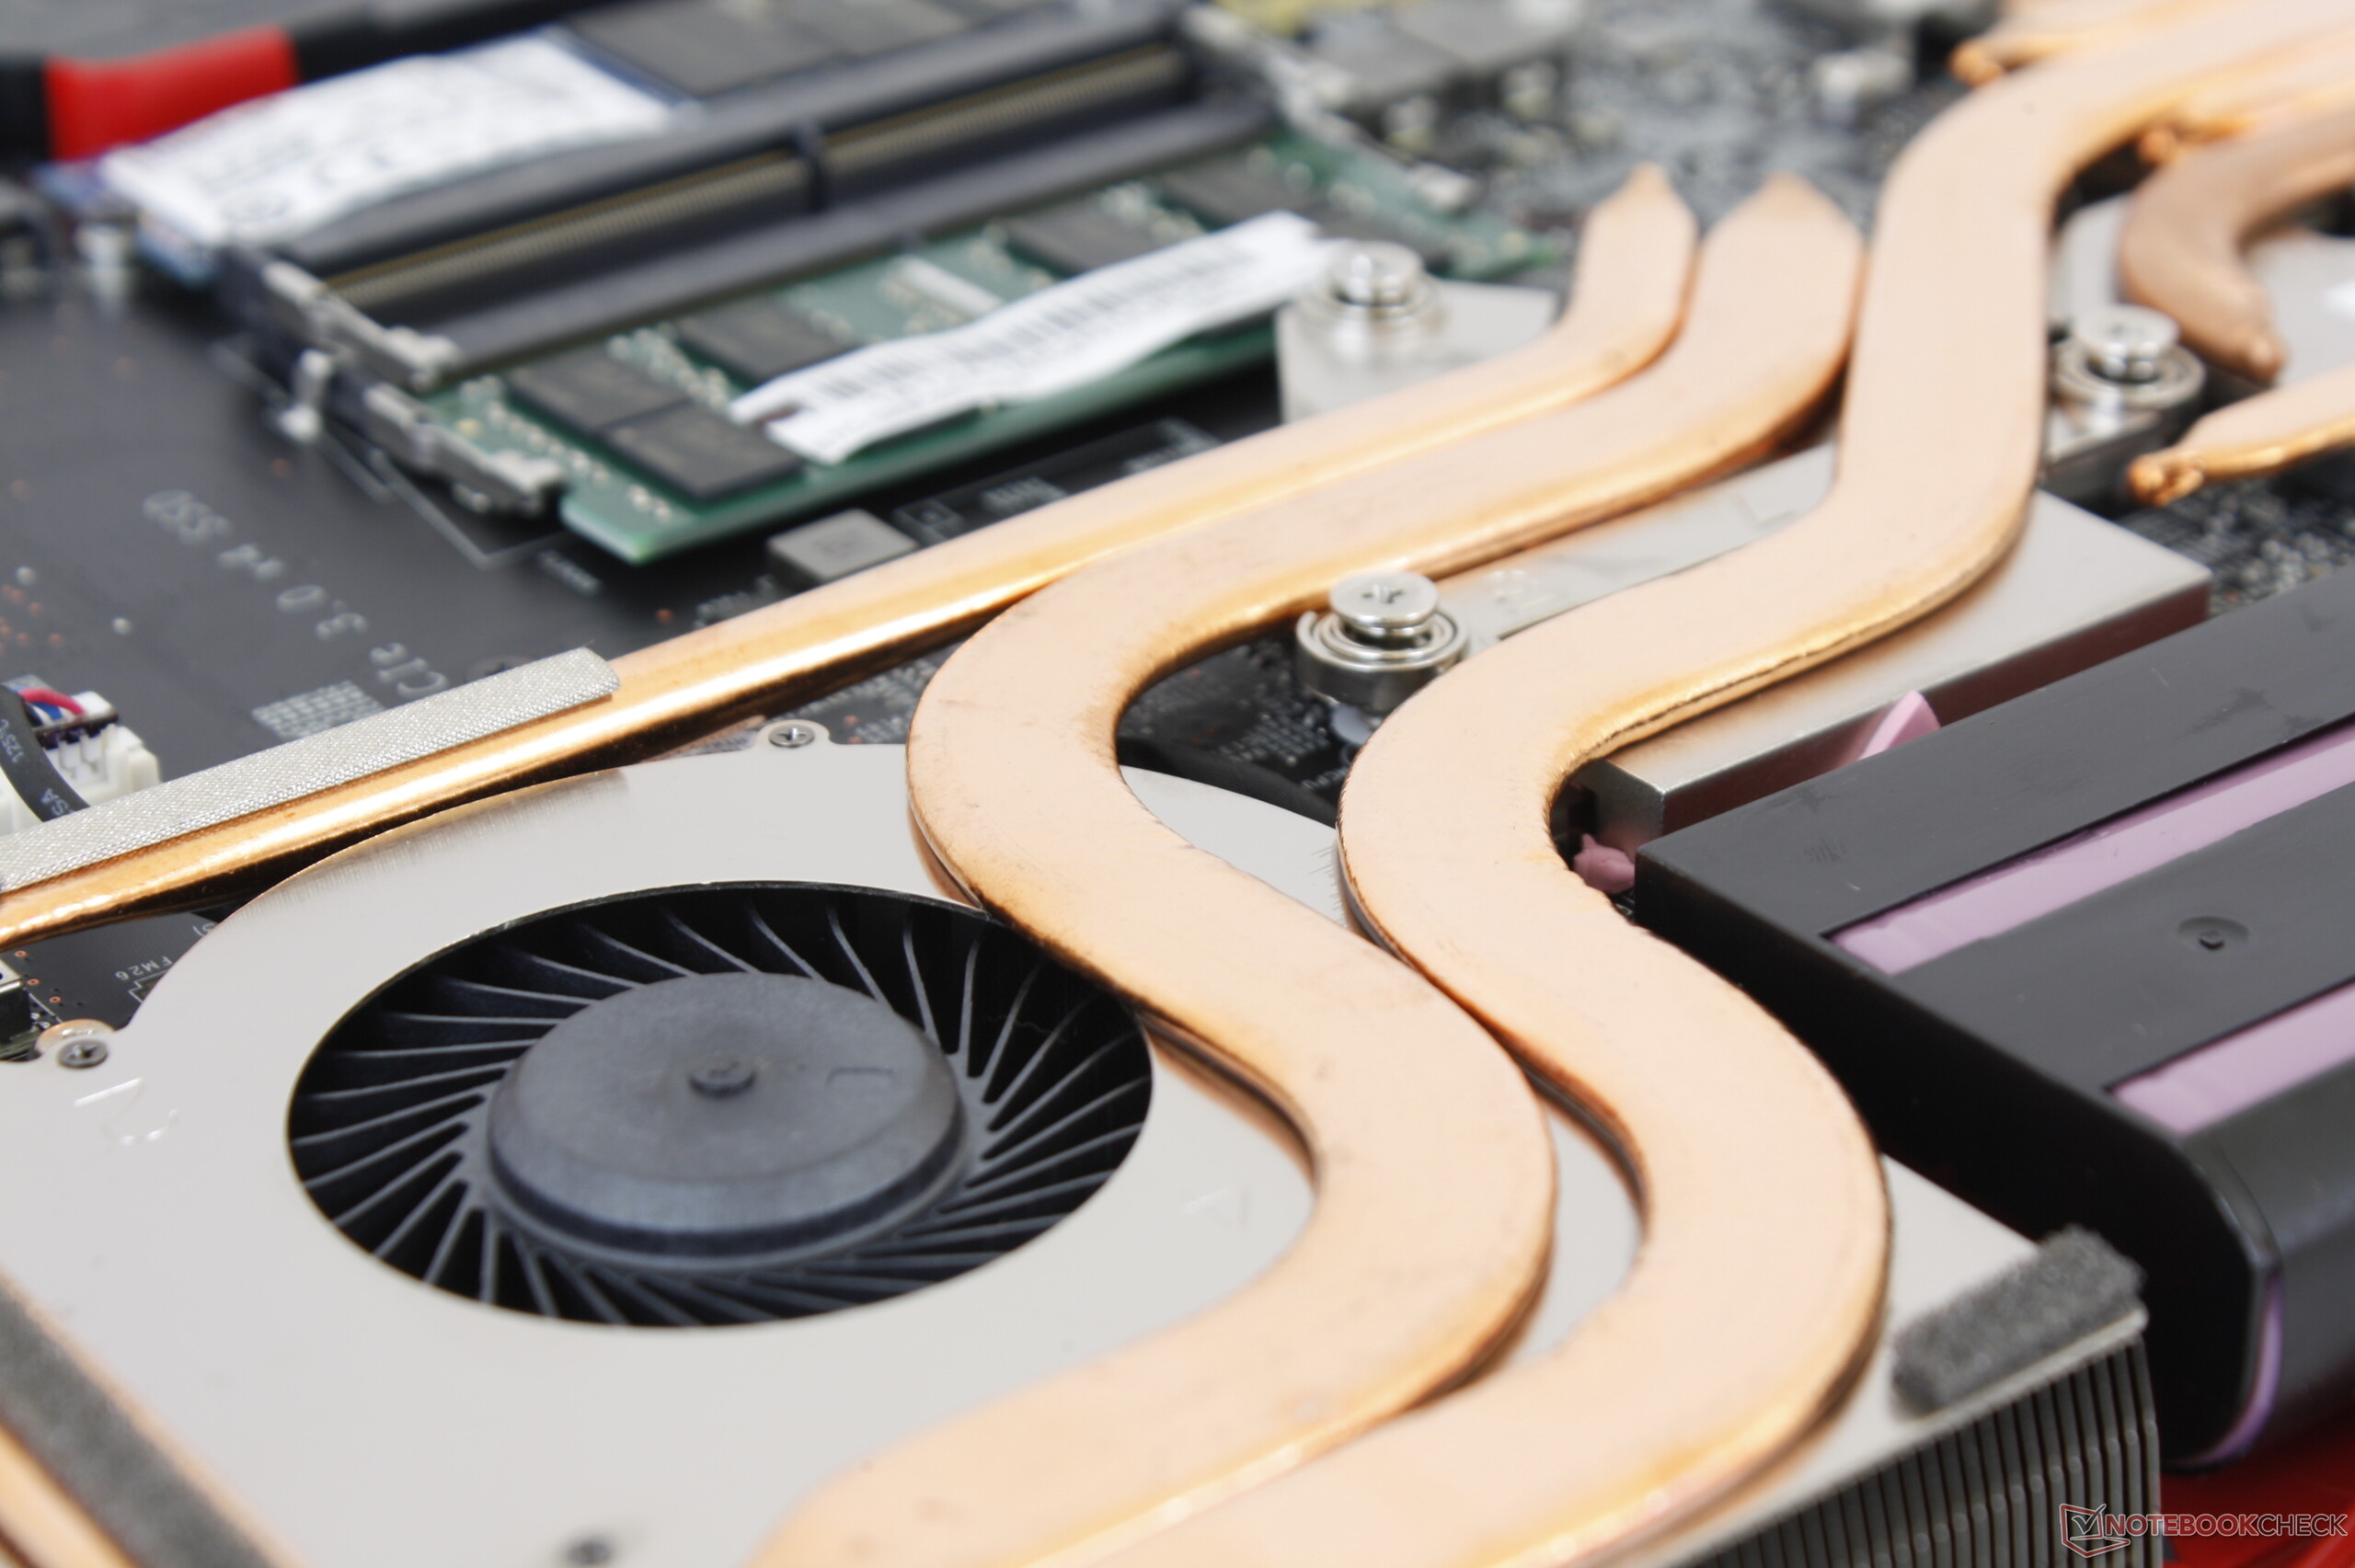
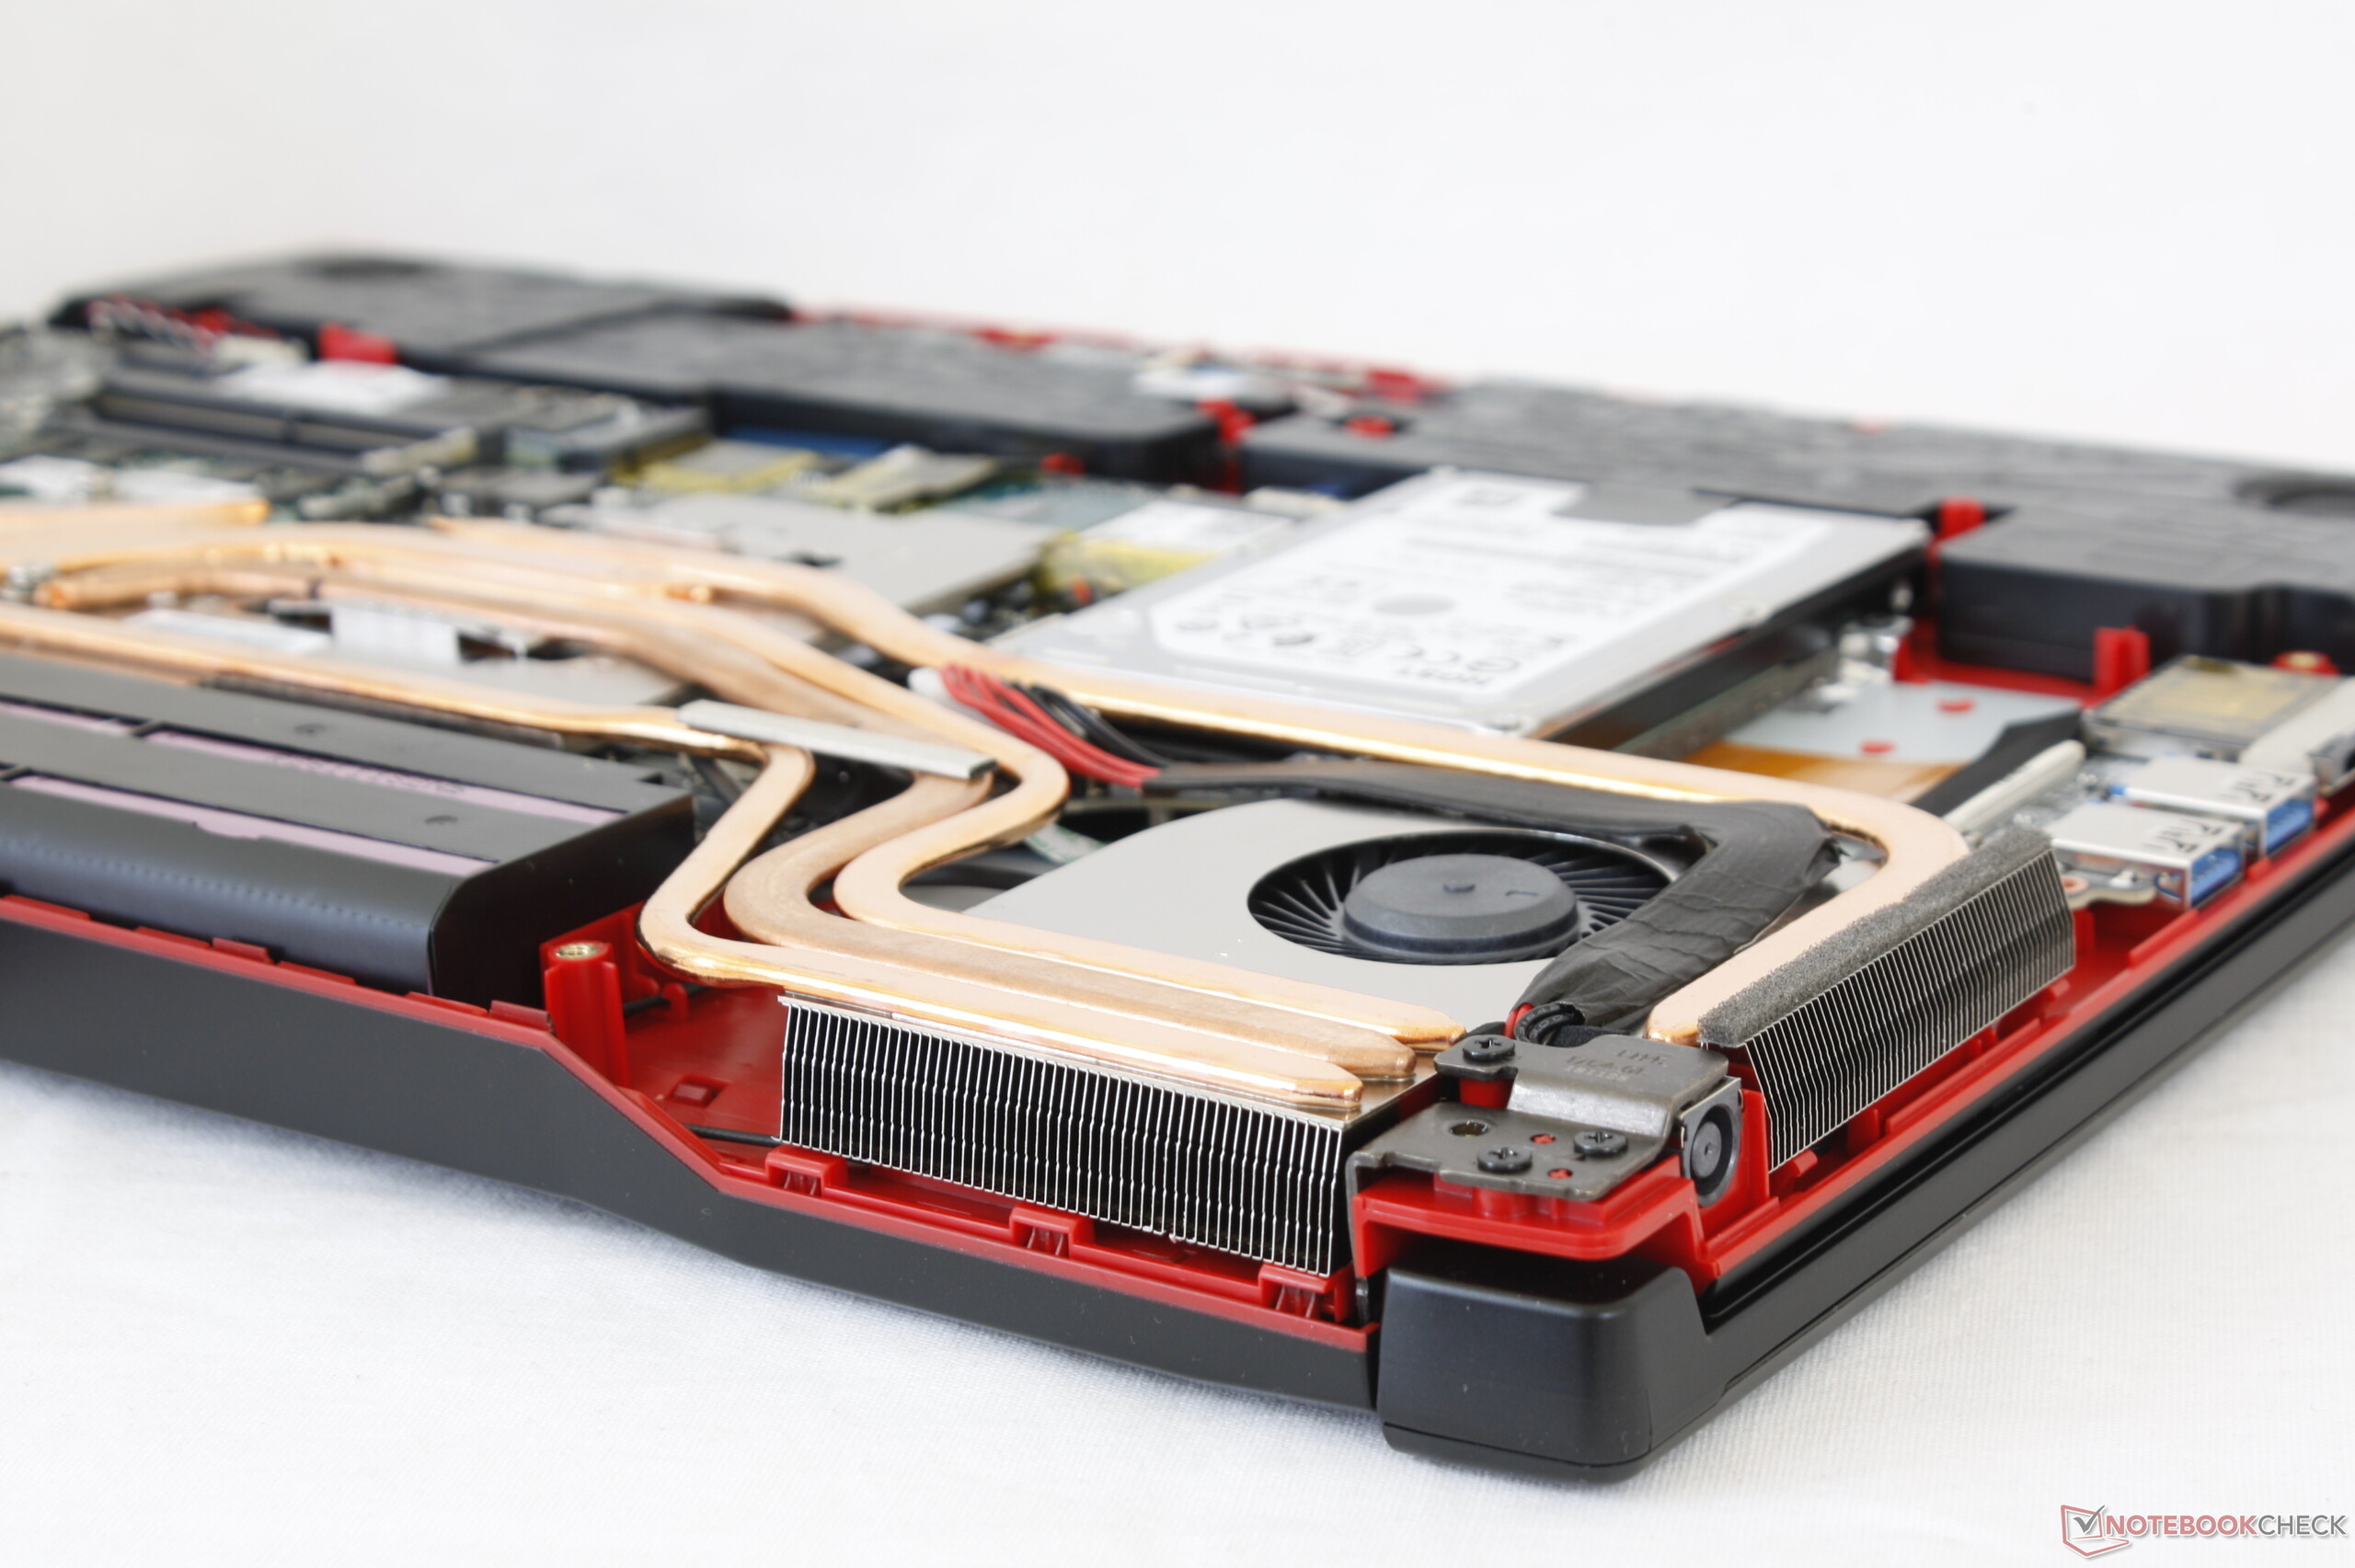
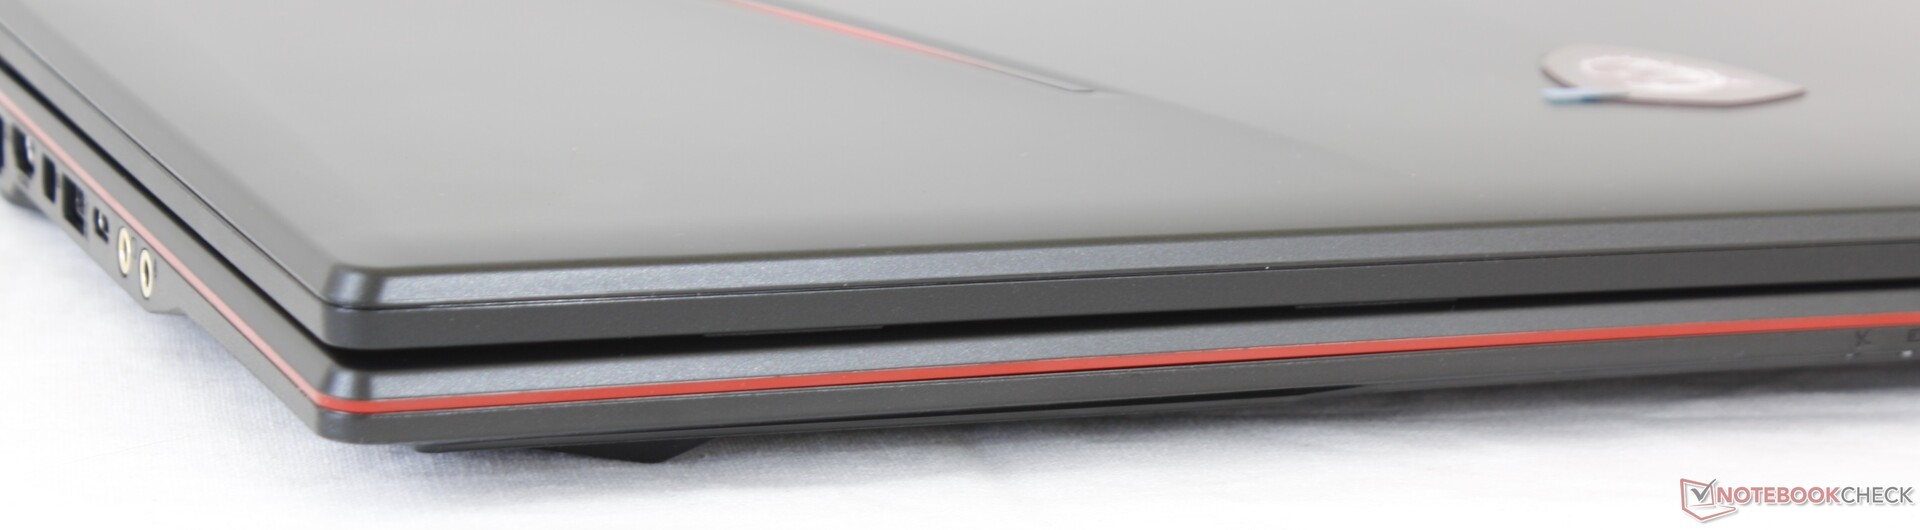
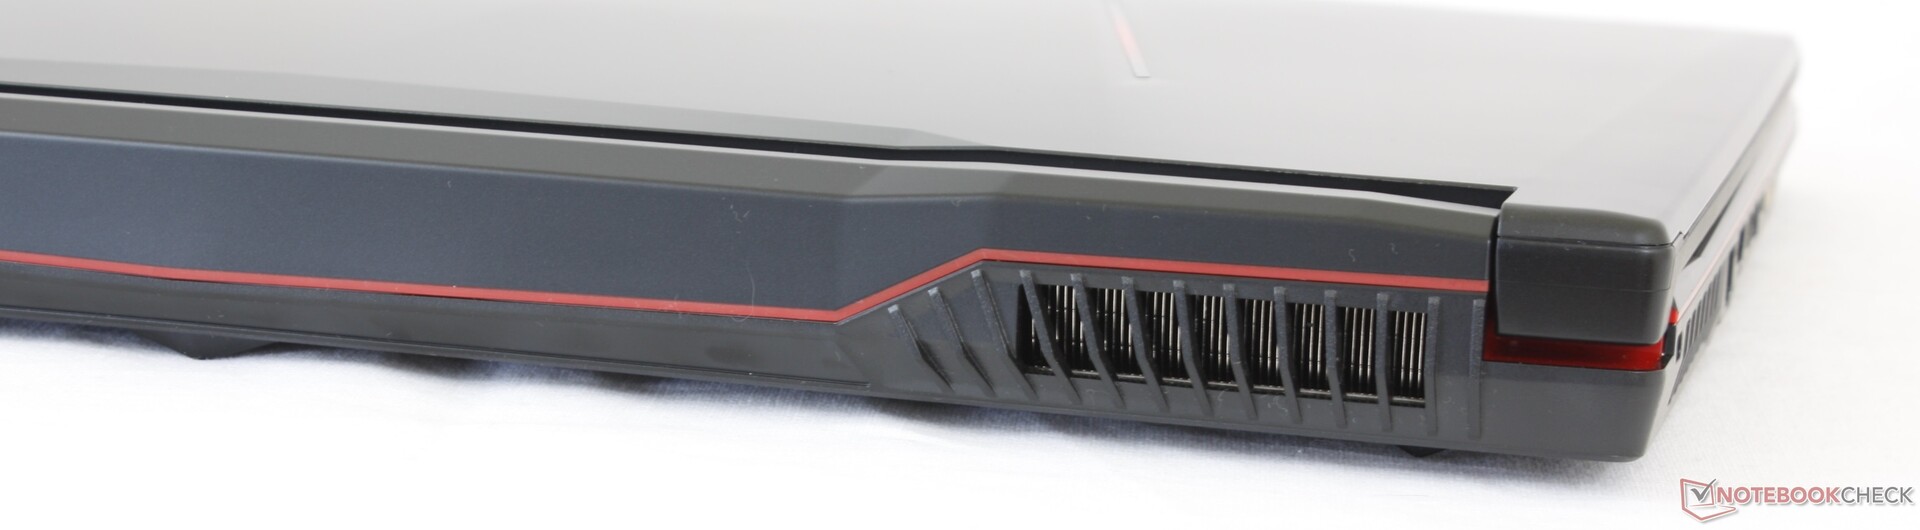
至于MSI GL73本身,其出色的功能包括三个内部存储托架,非常响亮的扬声器和高质量的120 Hz面板,这些在廉价游戏笔记本电脑上都相对不常见。请记住,它的风扇在游戏时会非常响,并且续航最多就几个小时。笔记本电脑的其余部分是廉价的塑料表面和小铰链。我们建议用户自行进行最终校准,以获得更加色彩准确的显示效果。
阻止我们认为MSI GL73比竞争华硕TUF FX705更好的主要问题是其更厚的边框和更大的尺寸。尽管核心温度比华硕更低,存储选项更多,但这些权衡的价值取决于用户。
如果GeForce RTX不是必备选项,那么使用上一代GTX 1070的系统将成为很好的选择,特别是现在GTX游戏笔记本电脑的价格一直在下降。
“MSI GL73拥有入门级1080p游戏笔记本所需的一切,从其广泛的存储选项到快速的5 ms / 120 Hz显示器和下一代Nvidia Turing显卡。但是,如果您经常旅行,那么可能值得考虑更便携的华硕TUF FX705。”
MSI GL73 8SE-010US
- 02/12/2019 v6 (old)
Allen Ngo
Price comparison

