宏碁Nitro 5 AN517-52 笔记本电脑评测:几乎全能的游戏本,还有续航优势
Rating | Date | Model | Weight | Height | Size | Resolution | Price |
|---|---|---|---|---|---|---|---|
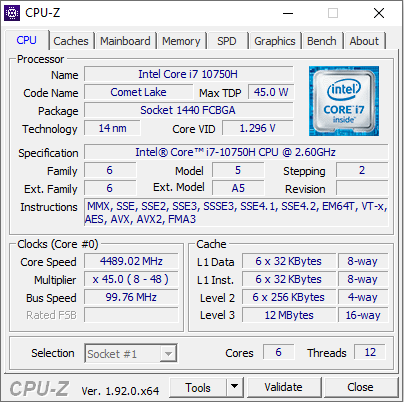
| 80.6 % v7 (old) | 08 / 2020 | Acer Nitro 5 AN517-52-77DS i7-10750H, GeForce RTX 2060 Mobile | 2.2 kg | 24.9 mm | 17.30" | 1920x1080 | |
| 82.9 % v7 (old) | 07 / 2020 | Asus TUF A17 FA706IU-AS76 R7 4800H, GeForce GTX 1660 Ti Mobile | 2.6 kg | 26 mm | 17.30" | 1920x1080 | |
| 83.2 % v7 (old) | Schenker XMG Pro 17 PB71RD-G i7-9750H, GeForce RTX 2060 Mobile | 2.8 kg | 30 mm | 17.30" | 1920x1080 | ||
| 81.6 % v7 (old) | 09 / 2019 | HP Pavilion Gaming 17-cd0085cl i7-9750H, GeForce GTX 1660 Ti Max-Q | 2.8 kg | 25 mm | 17.30" | 1920x1080 | |
| 82.3 % v7 (old) | 09 / 2019 | Lenovo Legion Y540-17IRH i5-9300H, GeForce GTX 1660 Ti Mobile | 2.8 kg | 26.3 mm | 17.30" | 1920x1080 |
| Networking | |
| iperf3 transmit AX12 | |
| Schenker XMG Pro 17 PB71RD-G | |
| Average Intel Wi-Fi 6 AX201 (49.8 - 1775, n=324) | |
| Lenovo Legion Y540-17IRH | |
| Acer Nitro 5 AN517-52-77DS | |
| HP Pavilion Gaming 17-cd0085cl | |
| Acer Aspire Nitro 5 AN517-51-7887 | |
| Asus TUF A17 FA706IU-AS76 | |
| iperf3 receive AX12 | |
| Schenker XMG Pro 17 PB71RD-G | |
| Average Intel Wi-Fi 6 AX201 (136 - 1743, n=324) | |
| Acer Nitro 5 AN517-52-77DS | |
| Lenovo Legion Y540-17IRH | |
| Acer Aspire Nitro 5 AN517-51-7887 | |
| HP Pavilion Gaming 17-cd0085cl | |
| Asus TUF A17 FA706IU-AS76 | |


| |||||||||||||||||||||||||
Brightness Distribution: 85 %
Center on Battery: 263 cd/m²
Contrast: 560:1 (Black: 0.47 cd/m²)
ΔE ColorChecker Calman: 5.07 | ∀{0.5-29.43 Ø4.72}
calibrated: 4.9
ΔE Greyscale Calman: 2.55 | ∀{0.09-98 Ø4.97}
59% sRGB (Argyll 1.6.3 3D)
37% AdobeRGB 1998 (Argyll 1.6.3 3D)
40.77% AdobeRGB 1998 (Argyll 3D)
58.9% sRGB (Argyll 3D)
39.47% Display P3 (Argyll 3D)
Gamma: 2.37
CCT: 6446 K
| Acer Nitro 5 AN517-52-77DS IPS, 1920x1080, 17.3" | Asus TUF A17 FA706IU-AS76 IPS, 1920x1080, 17.3" | Lenovo Legion Y540-17IRH IPS, 1920x1080, 17.3" | Schenker XMG Pro 17 PB71RD-G IPS, 1920x1080, 17.3" | HP Pavilion Gaming 17-cd0085cl IPS, 1920x1080, 17.3" | Acer Aspire Nitro 5 AN517-51-7887 IPS, 1920x1080, 17.3" | |
|---|---|---|---|---|---|---|
| Display | 2% | 72% | 56% | 57% | 57% | |
| Display P3 Coverage (%) | 39.47 | 40.55 3% | 69 75% | 62.8 59% | 63.3 60% | 62.7 59% |
| sRGB Coverage (%) | 58.9 | 59.7 1% | 98.3 67% | 89.8 52% | 90.2 53% | 92.5 57% |
| AdobeRGB 1998 Coverage (%) | 40.77 | 41.89 3% | 70.7 73% | 64.2 57% | 64.3 58% | 63.5 56% |
| Response Times | 31% | 50% | 53% | 18% | -3% | |
| Response Time Grey 50% / Grey 80% * (ms) | 35 ? | 22.4 ? 36% | 18 ? 49% | 16.8 ? 52% | 31.6 ? 10% | 37 ? -6% |
| Response Time Black / White * (ms) | 26 ? | 19.2 ? 26% | 12.8 ? 51% | 12 ? 54% | 19.6 ? 25% | 26 ? -0% |
| PWM Frequency (Hz) | ||||||
| Screen | 15% | 44% | 27% | 28% | 25% | |
| Brightness middle (cd/m²) | 263 | 264.8 1% | 286 9% | 274 4% | 299.6 14% | 407 55% |
| Brightness (cd/m²) | 246 | 253 3% | 282 15% | 273 11% | 285 16% | 364 48% |
| Brightness Distribution (%) | 85 | 90 6% | 87 2% | 95 12% | 86 1% | 84 -1% |
| Black Level * (cd/m²) | 0.47 | 0.31 34% | 0.19 60% | 0.26 45% | 0.33 30% | 0.3 36% |
| Contrast (:1) | 560 | 854 53% | 1505 169% | 1054 88% | 908 62% | 1357 142% |
| Colorchecker dE 2000 * | 5.07 | 4.73 7% | 3.57 30% | 4.62 9% | 3.68 27% | 4.55 10% |
| Colorchecker dE 2000 max. * | 20.5 | 18.89 8% | 7.5 63% | 7.66 63% | 8.05 61% | 12.44 39% |
| Colorchecker dE 2000 calibrated * | 4.9 | 4.64 5% | 1.31 73% | 1.93 61% | 3.15 36% | |
| Greyscale dE 2000 * | 2.55 | 1.4 45% | 4.51 -77% | 5.3 -108% | 3.8 -49% | 7.61 -198% |
| Gamma | 2.37 93% | 2.16 102% | 2.36 93% | 2.34 94% | 2.12 104% | 2.51 88% |
| CCT | 6446 101% | 6641 98% | 7411 88% | 7619 85% | 7240 90% | 7212 90% |
| Color Space (Percent of AdobeRGB 1998) (%) | 37 | 38.4 4% | 64 73% | 58 57% | 58.1 57% | 59 59% |
| Color Space (Percent of sRGB) (%) | 59 | 59.3 1% | 98 66% | 90 53% | 89.8 52% | 92 56% |
| Total Average (Program / Settings) | 16% /
15% | 55% /
50% | 45% /
36% | 34% /
32% | 26% /
27% |
* ... smaller is better
Display Response Times
| ↔ Response Time Black to White | ||
|---|---|---|
| 26 ms ... rise ↗ and fall ↘ combined | ↗ 14 ms rise | 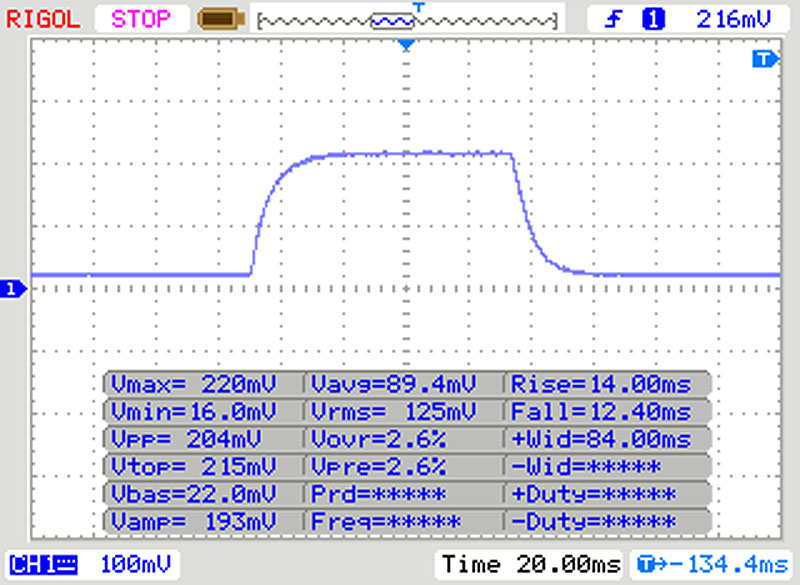 |
| ↘ 12 ms fall | ||
| The screen shows relatively slow response rates in our tests and may be too slow for gamers. In comparison, all tested devices range from 0.1 (minimum) to 240 (maximum) ms. » 62 % of all devices are better. This means that the measured response time is worse than the average of all tested devices (19.8 ms). | ||
| ↔ Response Time 50% Grey to 80% Grey | ||
| 35 ms ... rise ↗ and fall ↘ combined | ↗ 17 ms rise | 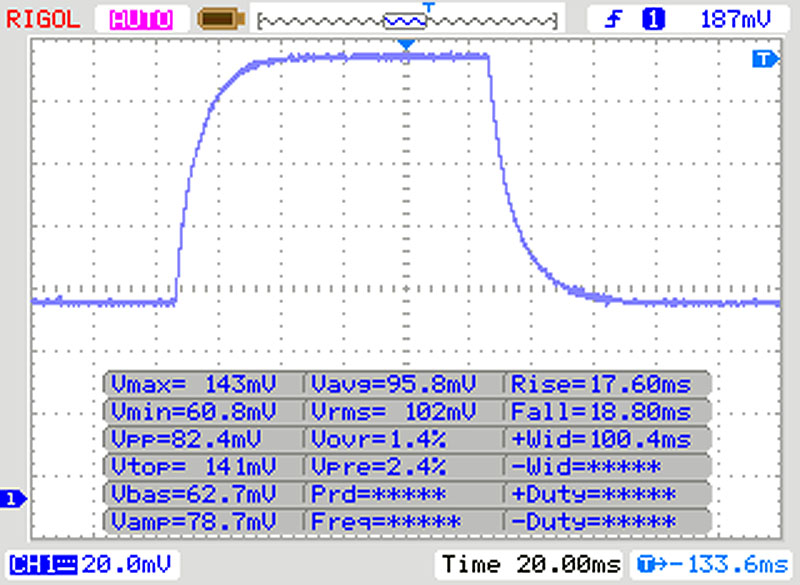 |
| ↘ 18 ms fall | ||
| The screen shows slow response rates in our tests and will be unsatisfactory for gamers. In comparison, all tested devices range from 0.165 (minimum) to 636 (maximum) ms. » 49 % of all devices are better. This means that the measured response time is worse than the average of all tested devices (31 ms). | ||
Screen Flickering / PWM (Pulse-Width Modulation)
| Screen flickering / PWM not detected | 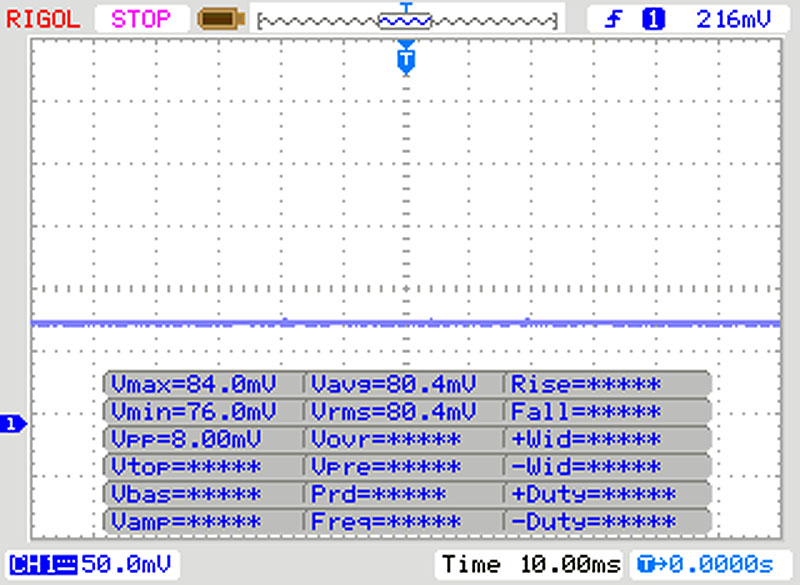 | ||
In comparison: 52 % of all tested devices do not use PWM to dim the display. If PWM was detected, an average of 7769 (minimum: 5 - maximum: 343500) Hz was measured. | |||
| Cinebench R15 | |
| CPU Single 64Bit | |
| Average of class Gaming (188.8 - 343, n=110, last 2 years) | |
| Average Intel Core i7-10750H (184 - 213, n=45) | |
| Acer Nitro 5 AN517-52-77DS | |
| HP Pavilion Gaming 17-cd0085cl | |
| Asus TUF A17 FA706IU-AS76 | |
| Acer Aspire Nitro 5 AN517-51-7887 | |
| Schenker XMG Pro 17 PB71RD-G | |
| Lenovo Legion Y540-17IRH | |
| CPU Multi 64Bit | |
| Average of class Gaming (1578 - 6271, n=109, last 2 years) | |
| Asus TUF A17 FA706IU-AS76 | |
| Acer Nitro 5 AN517-52-77DS | |
| Average Intel Core i7-10750H (804 - 1418, n=50) | |
| HP Pavilion Gaming 17-cd0085cl | |
| Schenker XMG Pro 17 PB71RD-G | |
| Acer Aspire Nitro 5 AN517-51-7887 | |
| Lenovo Legion Y540-17IRH | |
| Blender - v2.79 BMW27 CPU | |
| Acer Aspire Nitro 5 AN517-51-7887 | |
| Schenker XMG Pro 17 PB71RD-G | |
| Average Intel Core i7-10750H (322 - 587, n=43) | |
| Acer Nitro 5 AN517-52-77DS | |
| Asus TUF A17 FA706IU-AS76 | |
| Average of class Gaming (80 - 330, n=108, last 2 years) | |
| 7-Zip 18.03 | |
| 7z b 4 -mmt1 | |
| Average of class Gaming (4199 - 7436, n=109, last 2 years) | |
| Average Intel Core i7-10750H (4504 - 5470, n=43) | |
| Acer Nitro 5 AN517-52-77DS | |
| Acer Aspire Nitro 5 AN517-51-7887 | |
| Asus TUF A17 FA706IU-AS76 | |
| Schenker XMG Pro 17 PB71RD-G | |
| 7z b 4 | |
| Average of class Gaming (33491 - 148086, n=109, last 2 years) | |
| Asus TUF A17 FA706IU-AS76 | |
| Average Intel Core i7-10750H (26040 - 37345, n=43) | |
| Acer Nitro 5 AN517-52-77DS | |
| Acer Aspire Nitro 5 AN517-51-7887 | |
| Schenker XMG Pro 17 PB71RD-G | |
| Cinebench R20 | |
| CPU (Single Core) | |
| Average of class Gaming (442 - 895, n=110, last 2 years) | |
| Acer Nitro 5 AN517-52-77DS | |
| Asus TUF A17 FA706IU-AS76 | |
| Average Intel Core i7-10750H (431 - 504, n=43) | |
| Acer Aspire Nitro 5 AN517-51-7887 | |
| Lenovo Legion Y540-17IRH | |
| Schenker XMG Pro 17 PB71RD-G | |
| CPU (Multi Core) | |
| Average of class Gaming (4029 - 16108, n=110, last 2 years) | |
| Asus TUF A17 FA706IU-AS76 | |
| Acer Nitro 5 AN517-52-77DS | |
| Average Intel Core i7-10750H (1749 - 3325, n=43) | |
| Schenker XMG Pro 17 PB71RD-G | |
| Acer Aspire Nitro 5 AN517-51-7887 | |
| Lenovo Legion Y540-17IRH | |
| Geekbench 5.5 | |
| Single-Core | |
| Average of class Gaming (986 - 2474, n=109, last 2 years) | |
| Average Intel Core i7-10750H (1114 - 1333, n=43) | |
| Acer Nitro 5 AN517-52-77DS | |
| Asus TUF A17 FA706IU-AS76 | |
| Schenker XMG Pro 17 PB71RD-G | |
| Multi-Core | |
| Average of class Gaming (6460 - 27010, n=109, last 2 years) | |
| Asus TUF A17 FA706IU-AS76 | |
| Acer Nitro 5 AN517-52-77DS | |
| Average Intel Core i7-10750H (4443 - 6674, n=43) | |
| Schenker XMG Pro 17 PB71RD-G | |
| HWBOT x265 Benchmark v2.2 - 4k Preset | |
| Average of class Gaming (11.5 - 44.3, n=109, last 2 years) | |
| Asus TUF A17 FA706IU-AS76 | |
| Average Intel Core i7-10750H (5.54 - 11.6, n=43) | |
| Acer Nitro 5 AN517-52-77DS | |
| Acer Aspire Nitro 5 AN517-51-7887 | |
| Schenker XMG Pro 17 PB71RD-G | |
| LibreOffice - 20 Documents To PDF | |
| Asus TUF A17 FA706IU-AS76 | |
| Average Intel Core i7-10750H (43.1 - 99.2, n=43) | |
| Acer Nitro 5 AN517-52-77DS | |
| Average of class Gaming (19 - 88.8, n=109, last 2 years) | |
| R Benchmark 2.5 - Overall mean | |
| Schenker XMG Pro 17 PB71RD-G | |
| Acer Nitro 5 AN517-52-77DS | |
| Average Intel Core i7-10750H (0.578 - 0.708, n=42) | |
| Asus TUF A17 FA706IU-AS76 | |
| Average of class Gaming (0.3439 - 0.759, n=110, last 2 years) | |
* ... smaller is better
| PCMark 8 Home Score Accelerated v2 | 3836 points | |
| PCMark 8 Creative Score Accelerated v2 | 4075 points | |
| PCMark 8 Work Score Accelerated v2 | 5552 points | |
| PCMark 10 Score | 5201 points | |
Help | ||
| PCMark 8 | |
| Home Score Accelerated v2 | |
| Average of class Gaming (n=1last 2 years) | |
| Lenovo Legion Y540-17IRH | |
| Acer Aspire Nitro 5 AN517-51-7887 | |
| Asus TUF A17 FA706IU-AS76 | |
| Average Intel Core i7-10750H, NVIDIA GeForce RTX 2060 Mobile (3836 - 4539, n=6) | |
| HP Pavilion Gaming 17-cd0085cl | |
| Acer Nitro 5 AN517-52-77DS | |
| Work Score Accelerated v2 | |
| Asus TUF A17 FA706IU-AS76 | |
| Average Intel Core i7-10750H, NVIDIA GeForce RTX 2060 Mobile (5405 - 5928, n=6) | |
| Acer Nitro 5 AN517-52-77DS | |
| Acer Aspire Nitro 5 AN517-51-7887 | |
| HP Pavilion Gaming 17-cd0085cl | |
| Lenovo Legion Y540-17IRH | |
| Average of class Gaming (n=1last 2 years) | |
| DPC Latencies / LatencyMon - interrupt to process latency (max), Web, Youtube, Prime95 | |
| Asus TUF A17 FA706IU-AS76 | |
| Acer Nitro 5 AN517-52-77DS | |
* ... smaller is better

| Acer Nitro 5 AN517-52-77DS WDC PC SN530 SDBPNPZ-1T00 | Asus TUF A17 FA706IU-AS76 Intel SSD 660p 1TB SSDPEKNW010T8 | Lenovo Legion Y540-17IRH WDC PC SN520 SDAPNUW-512G | Schenker XMG Pro 17 PB71RD-G Samsung SSD 970 EVO Plus 500GB | HP Pavilion Gaming 17-cd0085cl Samsung SSD PM981 MZVLB256HAHQ | Acer Aspire Nitro 5 AN517-51-7887 WDC PC SN520 SDAPNUW-512G | Average WDC PC SN530 SDBPNPZ-1T00 | |
|---|---|---|---|---|---|---|---|
| CrystalDiskMark 5.2 / 6 | 10% | -27% | 22% | 16% | -21% | 16% | |
| Write 4K (MB/s) | 140 | 189.7 36% | 105.1 -25% | 117.5 -16% | 135.3 -3% | 104.6 -25% | 182.7 ? 31% |
| Read 4K (MB/s) | 49.04 | 62.3 27% | 34.41 -30% | 46.47 -5% | 63.7 30% | 39.76 -19% | 48.6 ? -1% |
| Write Seq (MB/s) | 1963 | 1681 -14% | 1298 -34% | 1345 -31% | 1337 -32% | 1268 -35% | 1979 ? 1% |
| Read Seq (MB/s) | 1455 | 1608 11% | 1099 -24% | 2804 93% | 1617 11% | 1414 -3% | 1828 ? 26% |
| Write 4K Q32T1 (MB/s) | 398.2 | 468.6 18% | 335.7 -16% | 368.2 -8% | 568 43% | 287.9 -28% | 498 ? 25% |
| Read 4K Q32T1 (MB/s) | 461.9 | 541 17% | 231.4 -50% | 412.9 -11% | 645 40% | 381.1 -17% | 573 ? 24% |
| Write Seq Q32T1 (MB/s) | 1969 | 1770 -10% | 1454 -26% | 3248 65% | 1428 -27% | 1319 -33% | 1980 ? 1% |
| Read Seq Q32T1 (MB/s) | 1927 | 1898 -2% | 1740 -10% | 3559 85% | 3184 65% | 1735 -10% | 2336 ? 21% |
Continuous load read: DiskSpd Read Loop, Queue Depth 8
| 3DMark 06 Standard Score | 38509 points | |
| 3DMark 11 Performance | 18057 points | |
| 3DMark Ice Storm Standard Score | 117009 points | |
| 3DMark Cloud Gate Standard Score | 31601 points | |
| 3DMark Fire Strike Score | 14191 points | |
| 3DMark Time Spy Score | 5759 points | |
Help | ||
| 3DMark 11 - 1280x720 Performance GPU | |
| Average of class Gaming (21841 - 80022, n=107, last 2 years) | |
| Average NVIDIA GeForce RTX 2060 Mobile (19143 - 24662, n=40) | |
| Schenker XMG Pro 17 PB71RD-G | |
| Asus TUF A17 FA706IU-AS76 | |
| Acer Nitro 5 AN517-52-77DS | |
| Acer Aspire Nitro 5 AN517-51-7887 | |
| Lenovo Legion Y740-17IRH | |
| Lenovo Legion Y540-17IRH | |
| HP Pavilion Gaming 17-cd0085cl | |
| 3DMark | |
| 1280x720 Cloud Gate Standard Graphics | |
| Average of class Gaming (86886 - 223650, n=63, last 2 years) | |
| Acer Nitro 5 AN517-52-77DS | |
| Lenovo Legion Y740-17IRH | |
| Acer Aspire Nitro 5 AN517-51-7887 | |
| Average NVIDIA GeForce RTX 2060 Mobile (55324 - 116593, n=36) | |
| HP Pavilion Gaming 17-cd0085cl | |
| Lenovo Legion Y540-17IRH | |
| Schenker XMG Pro 17 PB71RD-G | |
| Asus TUF A17 FA706IU-AS76 | |
| 1920x1080 Fire Strike Graphics | |
| Average of class Gaming (12242 - 62849, n=119, last 2 years) | |
| Schenker XMG Pro 17 PB71RD-G | |
| Average NVIDIA GeForce RTX 2060 Mobile (14768 - 18358, n=43) | |
| Lenovo Legion Y740-17IRH | |
| Acer Nitro 5 AN517-52-77DS | |
| Asus TUF A17 FA706IU-AS76 | |
| Acer Aspire Nitro 5 AN517-51-7887 | |
| Lenovo Legion Y540-17IRH | |
| HP Pavilion Gaming 17-cd0085cl | |
| 2560x1440 Time Spy Graphics | |
| Average of class Gaming (5012 - 26212, n=118, last 2 years) | |
| Average NVIDIA GeForce RTX 2060 Mobile (5660 - 6910, n=41) | |
| Lenovo Legion Y740-17IRH | |
| Schenker XMG Pro 17 PB71RD-G | |
| Asus TUF A17 FA706IU-AS76 | |
| Acer Nitro 5 AN517-52-77DS | |
| Lenovo Legion Y540-17IRH | |
| HP Pavilion Gaming 17-cd0085cl | |
| The Witcher 3 - 1920x1080 Ultra Graphics & Postprocessing (HBAO+) | |
| Average of class Gaming (95 - 240, n=8, last 2 years) | |
| Acer Nitro 5 AN517-52-77DS | |
| Average NVIDIA GeForce RTX 2060 Mobile (50.6 - 74, n=40) | |
| Schenker XMG Pro 17 PB71RD-G | |
| Lenovo Legion Y740-17IRH | |
| Asus TUF A17 FA706IU-AS76 | |
| Acer Aspire Nitro 5 AN517-51-7887 | |
| Lenovo Legion Y540-17IRH | |
| HP Pavilion Gaming 17-cd0085cl | |
| BioShock Infinite - 1920x1080 Ultra Preset, DX11 (DDOF) | |
| Lenovo Legion Y740-17IRH | |
| Average NVIDIA GeForce RTX 2060 Mobile (119 - 156, n=17) | |
| Acer Nitro 5 AN517-52-77DS | |
| Lenovo Legion Y540-17IRH | |
| Acer Aspire Nitro 5 AN517-51-7887 | |
| HP Pavilion Gaming 17-cd0085cl | |
| Shadow of the Tomb Raider - 1920x1080 Highest Preset AA:T | |
| Average of class Gaming (96 - 116, n=2, last 2 years) | |
| Lenovo Legion Y740-17IRH | |
| Average NVIDIA GeForce RTX 2060 Mobile (54 - 86, n=22) | |
| Asus TUF A17 FA706IU-AS76 | |
| Acer Nitro 5 AN517-52-77DS | |
| HP Pavilion Gaming 17-cd0085cl | |
| low | med. | high | ultra | |
|---|---|---|---|---|
| BioShock Infinite (2013) | 327.4 | 285.5 | 263.5 | 138.4 |
| The Witcher 3 (2015) | 277 | 188.3 | 108.9 | 63 |
| Dota 2 Reborn (2015) | 146.1 | 133.9 | 123.8 | 116.8 |
| X-Plane 11.11 (2018) | 98.3 | 84.1 | 75.8 | |
| Shadow of the Tomb Raider (2018) | 114 | 89 | 82 | 73 |
| Metro Exodus (2019) | 142.4 | 75.9 | 56.6 | 44.5 |
| Total War: Three Kingdoms (2019) | 229.6 | 107.4 | 66.9 | 46.3 |
| Control (2019) | 201.9 | 74.9 | 54.6 | |
| Borderlands 3 (2019) | 133 | 86.9 | 62.2 | 47.7 |
| Call of Duty Modern Warfare 2019 (2019) | 133.5 | 90.2 | 74.3 | 65.5 |
| Red Dead Redemption 2 (2019) | 116.9 | 76.1 | 50.7 | 32.5 |
| Escape from Tarkov (2020) | 121 | 121 | 117.5 | 103.3 |
| Hunt Showdown (2020) | 170.6 | 94.2 | 75 | |
| Doom Eternal (2020) | 195.6 | 125.4 | 112.4 | 108.9 |
| Gears Tactics (2020) | 236.1 | 145.6 | 93.3 | 60.7 |
Noise level
| Idle |
| 30.2 / 30.2 / 30.2 dB(A) |
| Load |
| 41.5 / 44.6 dB(A) |
 | ||
30 dB silent 40 dB(A) audible 50 dB(A) loud |
||
min: | ||
| Acer Nitro 5 AN517-52-77DS i7-10750H, GeForce RTX 2060 Mobile | Asus TUF A17 FA706IU-AS76 R7 4800H, GeForce GTX 1660 Ti Mobile | Schenker XMG Pro 17 PB71RD-G i7-9750H, GeForce RTX 2060 Mobile | Lenovo Legion Y540-17IRH i5-9300H, GeForce GTX 1660 Ti Mobile | HP Pavilion Gaming 17-cd0085cl i7-9750H, GeForce GTX 1660 Ti Max-Q | Acer Aspire Nitro 5 AN517-51-7887 i7-9750H, GeForce GTX 1660 Ti Mobile | Average NVIDIA GeForce RTX 2060 Mobile | Average of class Gaming | |
|---|---|---|---|---|---|---|---|---|
| Noise | -5% | -14% | -7% | 7% | -3% | -3% | 3% | |
| off / environment * (dB) | 30.2 | 28.7 5% | 30 1% | 30 1% | 28.2 7% | 30 1% | 27.9 ? 8% | 24.1 ? 20% |
| Idle Minimum * (dB) | 30.2 | 28.7 5% | 30 1% | 30 1% | 30.1 -0% | 30.2 -0% | 29 ? 4% | 25.9 ? 14% |
| Idle Average * (dB) | 30.2 | 30.5 -1% | 32 -6% | 32 -6% | 30.1 -0% | 30.2 -0% | 30 ? 1% | 27.4 ? 9% |
| Idle Maximum * (dB) | 30.2 | 32.5 -8% | 39 -29% | 34 -13% | 30.1 -0% | 31 -3% | 33 ? -9% | 29.9 ? 1% |
| Load Average * (dB) | 41.5 | 42.5 -2% | 51 -23% | 44 -6% | 34.2 18% | 43.4 -5% | 44 ? -6% | 43 ? -4% |
| Witcher 3 ultra * (dB) | 44.5 | 50.1 -13% | 54 -21% | 50 -12% | 34.2 23% | 48.5 -9% | ||
| Load Maximum * (dB) | 44.6 | 53.4 -20% | 54 -21% | 52 -17% | 43.8 2% | 45.5 -2% | 51.6 ? -16% | 54.1 ? -21% |
* ... smaller is better
(-) The maximum temperature on the upper side is 50.6 °C / 123 F, compared to the average of 40.4 °C / 105 F, ranging from 21.2 to 68.8 °C for the class Gaming.
(-) The bottom heats up to a maximum of 53.8 °C / 129 F, compared to the average of 43.2 °C / 110 F
(+) In idle usage, the average temperature for the upper side is 25 °C / 77 F, compared to the device average of 33.9 °C / 93 F.
(±) Playing The Witcher 3, the average temperature for the upper side is 37.3 °C / 99 F, compared to the device average of 33.9 °C / 93 F.
(+) The palmrests and touchpad are cooler than skin temperature with a maximum of 26.1 °C / 79 F and are therefore cool to the touch.
(+) The average temperature of the palmrest area of similar devices was 28.8 °C / 83.8 F (+2.7 °C / 4.8 F).
| Acer Nitro 5 AN517-52-77DS i7-10750H, GeForce RTX 2060 Mobile | Asus TUF A17 FA706IU-AS76 R7 4800H, GeForce GTX 1660 Ti Mobile | Schenker XMG Pro 17 PB71RD-G i7-9750H, GeForce RTX 2060 Mobile | Lenovo Legion Y740-17IRH i7-9750H, GeForce RTX 2060 Mobile | HP Pavilion Gaming 17-cd0085cl i7-9750H, GeForce GTX 1660 Ti Max-Q | Acer Aspire Nitro 5 AN517-51-7887 i7-9750H, GeForce GTX 1660 Ti Mobile | Average NVIDIA GeForce RTX 2060 Mobile | Average of class Gaming | |
|---|---|---|---|---|---|---|---|---|
| Heat | -4% | -4% | -3% | -11% | -5% | -7% | -5% | |
| Maximum Upper Side * (°C) | 50.6 | 47.6 6% | 47 7% | 43 15% | 42.6 16% | 51.7 -2% | 47.2 ? 7% | 45.2 ? 11% |
| Maximum Bottom * (°C) | 53.8 | 50.8 6% | 48 11% | 46 14% | 49 9% | 55.4 -3% | 52.7 ? 2% | 48.1 ? 11% |
| Idle Upper Side * (°C) | 26.6 | 33 -24% | 30 -13% | 31 -17% | 34 -28% | 29.1 -9% | 31 ? -17% | 31.1 ? -17% |
| Idle Bottom * (°C) | 27.8 | 29 -4% | 34 -22% | 34 -22% | 39.4 -42% | 29 -4% | 32.9 ? -18% | 34.2 ? -23% |
* ... smaller is better
Acer Nitro 5 AN517-52-77DS audio analysis
(-) | not very loud speakers (67.8 dB)
Bass 100 - 315 Hz
(-) | nearly no bass - on average 22.3% lower than median
(±) | linearity of bass is average (12% delta to prev. frequency)
Mids 400 - 2000 Hz
(+) | balanced mids - only 4.1% away from median
(±) | linearity of mids is average (9.2% delta to prev. frequency)
Highs 2 - 16 kHz
(+) | balanced highs - only 2.6% away from median
(+) | highs are linear (6.3% delta to prev. frequency)
Overall 100 - 16.000 Hz
(±) | linearity of overall sound is average (22.4% difference to median)
Compared to same class
» 80% of all tested devices in this class were better, 6% similar, 14% worse
» The best had a delta of 6%, average was 18%, worst was 132%
Compared to all devices tested
» 65% of all tested devices were better, 6% similar, 29% worse
» The best had a delta of 4%, average was 24%, worst was 134%
Asus TUF A17 FA706IU-AS76 audio analysis
(±) | speaker loudness is average but good (74 dB)
Bass 100 - 315 Hz
(±) | reduced bass - on average 12.7% lower than median
(±) | linearity of bass is average (11.5% delta to prev. frequency)
Mids 400 - 2000 Hz
(+) | balanced mids - only 4.8% away from median
(±) | linearity of mids is average (9.1% delta to prev. frequency)
Highs 2 - 16 kHz
(+) | balanced highs - only 3.1% away from median
(±) | linearity of highs is average (8.7% delta to prev. frequency)
Overall 100 - 16.000 Hz
(±) | linearity of overall sound is average (23.5% difference to median)
Compared to same class
» 85% of all tested devices in this class were better, 5% similar, 10% worse
» The best had a delta of 6%, average was 18%, worst was 132%
Compared to all devices tested
» 70% of all tested devices were better, 6% similar, 24% worse
» The best had a delta of 4%, average was 24%, worst was 134%
| Off / Standby | |
| Idle | |
| Load |
|
Key:
min: | |
| Acer Nitro 5 AN517-52-77DS i7-10750H, GeForce RTX 2060 Mobile | Asus TUF A17 FA706IU-AS76 R7 4800H, GeForce GTX 1660 Ti Mobile | Schenker XMG Pro 17 PB71RD-G i7-9750H, GeForce RTX 2060 Mobile | Lenovo Legion Y540-17IRH i5-9300H, GeForce GTX 1660 Ti Mobile | HP Pavilion Gaming 17-cd0085cl i7-9750H, GeForce GTX 1660 Ti Max-Q | Acer Aspire Nitro 5 AN517-51-7887 i7-9750H, GeForce GTX 1660 Ti Mobile | Average NVIDIA GeForce RTX 2060 Mobile | Average of class Gaming | |
|---|---|---|---|---|---|---|---|---|
| Power Consumption | -15% | -60% | -89% | 5% | 10% | -61% | -79% | |
| Idle Minimum * (Watt) | 5.4 | 7.4 -37% | 11 -104% | 19 -252% | 5.4 -0% | 3.9 28% | 11.5 ? -113% | 13.1 ? -143% |
| Idle Average * (Watt) | 9.8 | 10.5 -7% | 18 -84% | 22 -124% | 9.2 6% | 8.9 9% | 16.5 ? -68% | 18.8 ? -92% |
| Idle Maximum * (Watt) | 10.9 | 17 -56% | 28 -157% | 30 -175% | 13 -19% | 12.2 -12% | 23.7 ? -117% | 24.4 ? -124% |
| Load Average * (Watt) | 104 | 103.7 -0% | 99 5% | 79 24% | 85.9 17% | 83 20% | 107.5 ? -3% | 108.5 ? -4% |
| Witcher 3 ultra * (Watt) | 134.3 | 128.1 5% | 146 -9% | 134 -0% | 107.9 20% | 130 3% | ||
| Load Maximum * (Watt) | 193 | 183.2 5% | 210 -9% | 201 -4% | 182.2 6% | 168 13% | 199.7 ? -3% | 254 ? -32% |
* ... smaller is better
| Acer Nitro 5 AN517-52-77DS i7-10750H, GeForce RTX 2060 Mobile, 57.48 Wh | Asus TUF A17 FA706IU-AS76 R7 4800H, GeForce GTX 1660 Ti Mobile, 90 Wh | Lenovo Legion Y540-17IRH i5-9300H, GeForce GTX 1660 Ti Mobile, 57 Wh | Schenker XMG Pro 17 PB71RD-G i7-9750H, GeForce RTX 2060 Mobile, 62 Wh | HP Pavilion Gaming 17-cd0085cl i7-9750H, GeForce GTX 1660 Ti Max-Q, 52.5 Wh | Acer Aspire Nitro 5 AN517-51-7887 i7-9750H, GeForce GTX 1660 Ti Mobile, 57 Wh | Average of class Gaming | |
|---|---|---|---|---|---|---|---|
| Battery runtime | 26% | -49% | -42% | -20% | -3% | -7% | |
| Reader / Idle (h) | 11 | 9.1 -17% | 5.2 -53% | 5.2 -53% | 11.6 5% | 13.4 22% | 8.71 ? -21% |
| H.264 (h) | 7.3 | 3.4 -53% | 6.3 -14% | 8.26 ? 13% | |||
| WiFi v1.3 (h) | 6.6 | 8.5 29% | 3.7 -44% | 4.1 -38% | 5.7 -14% | 6.2 -6% | 6.98 ? 6% |
| Load (h) | 2 | 3.3 65% | 1.1 -45% | 1.3 -35% | 1 -50% | 1.7 -15% | 1.47 ? -26% |
Pros
Cons
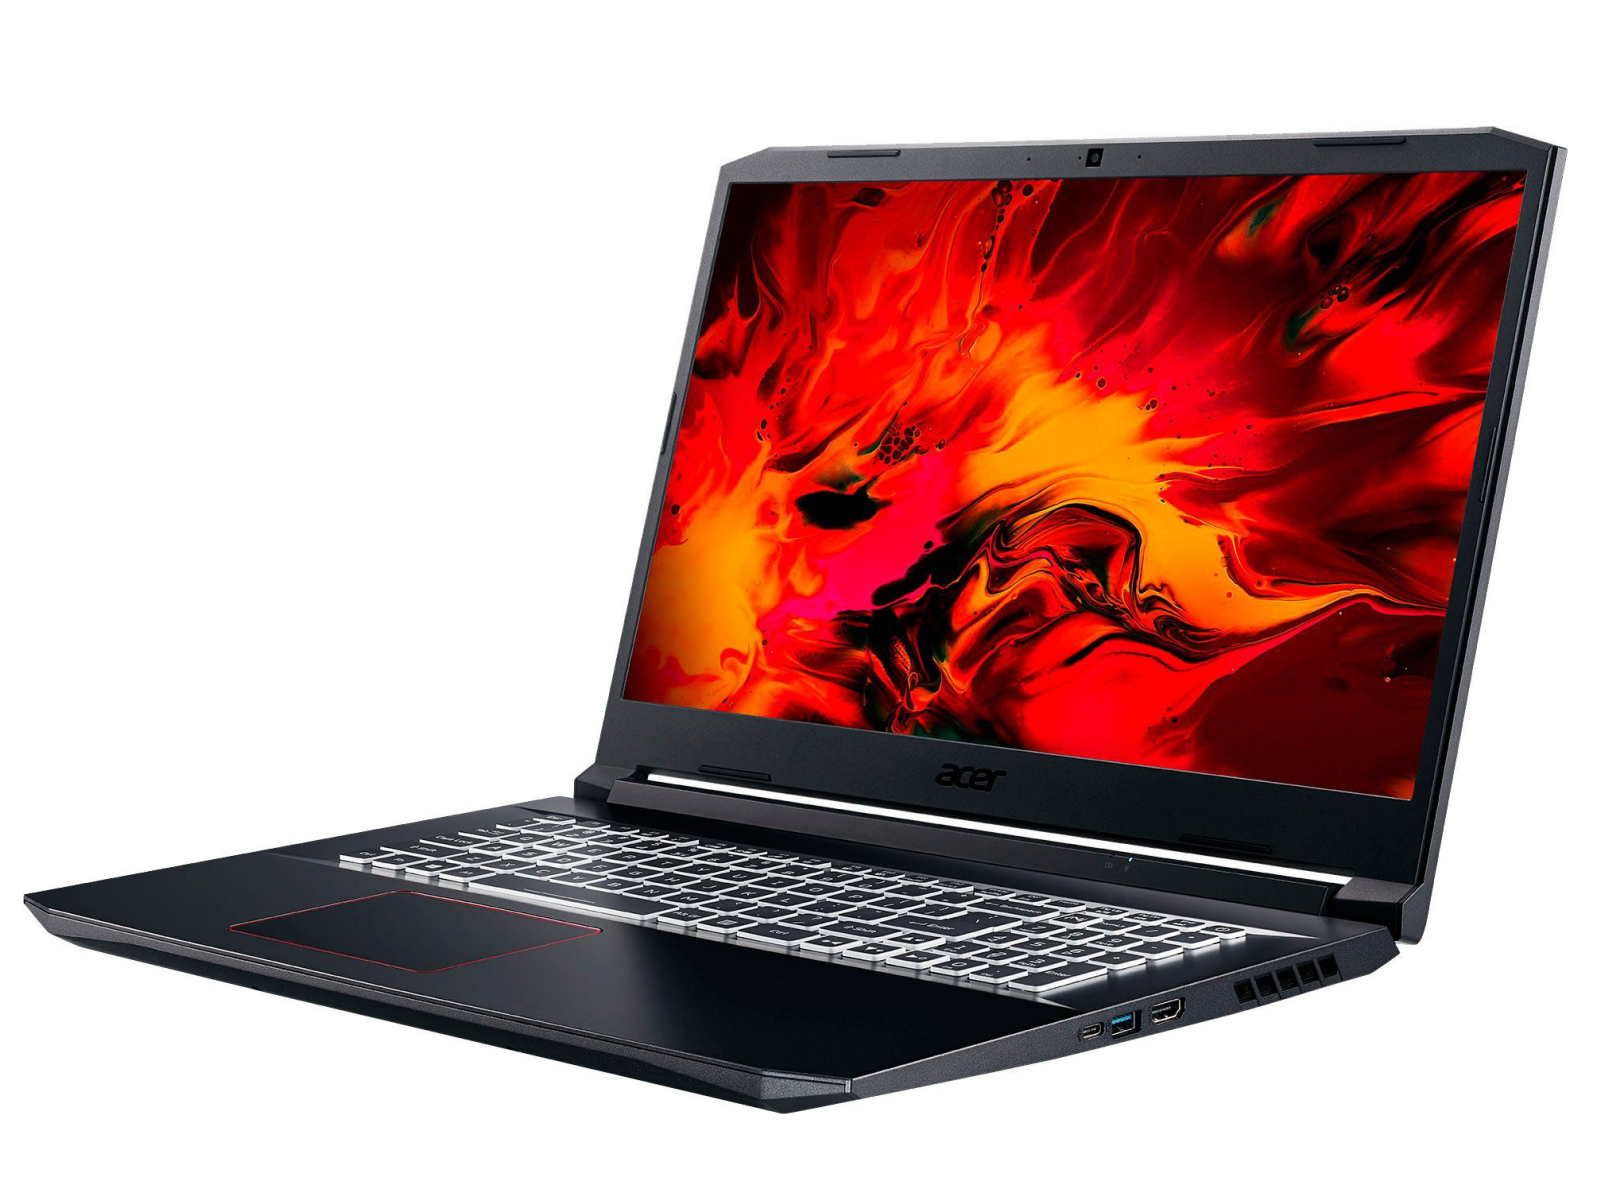
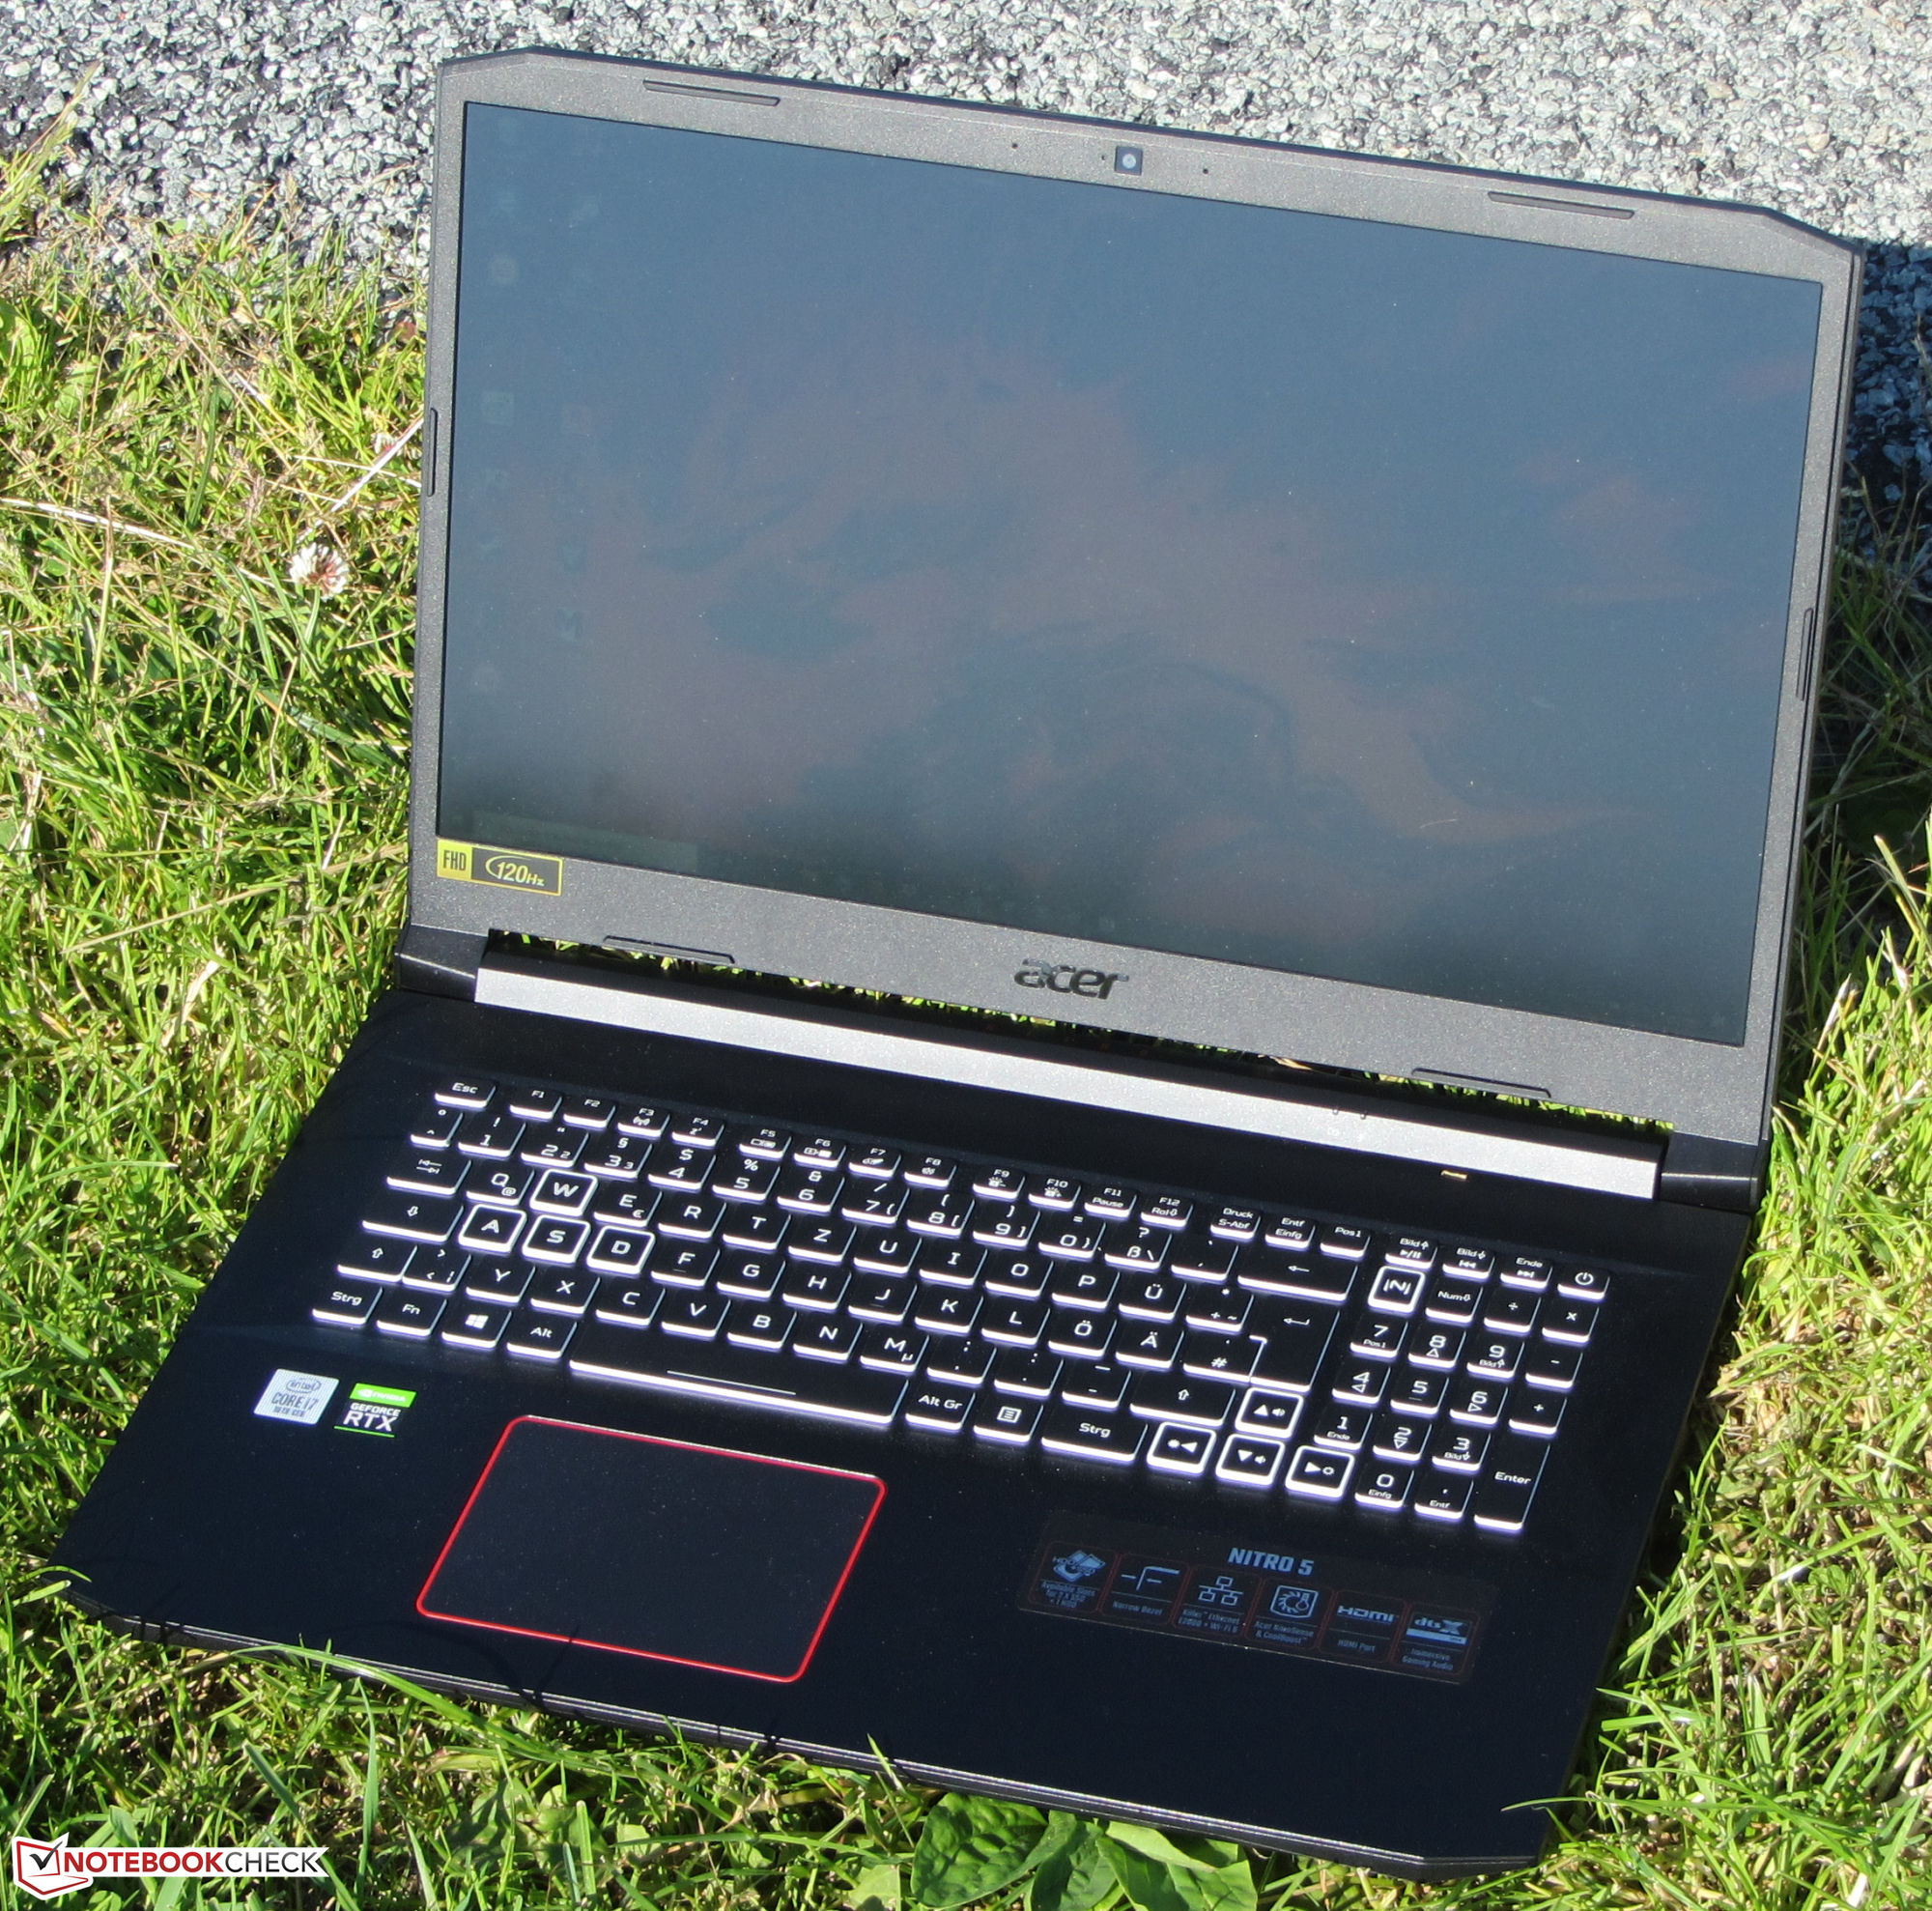
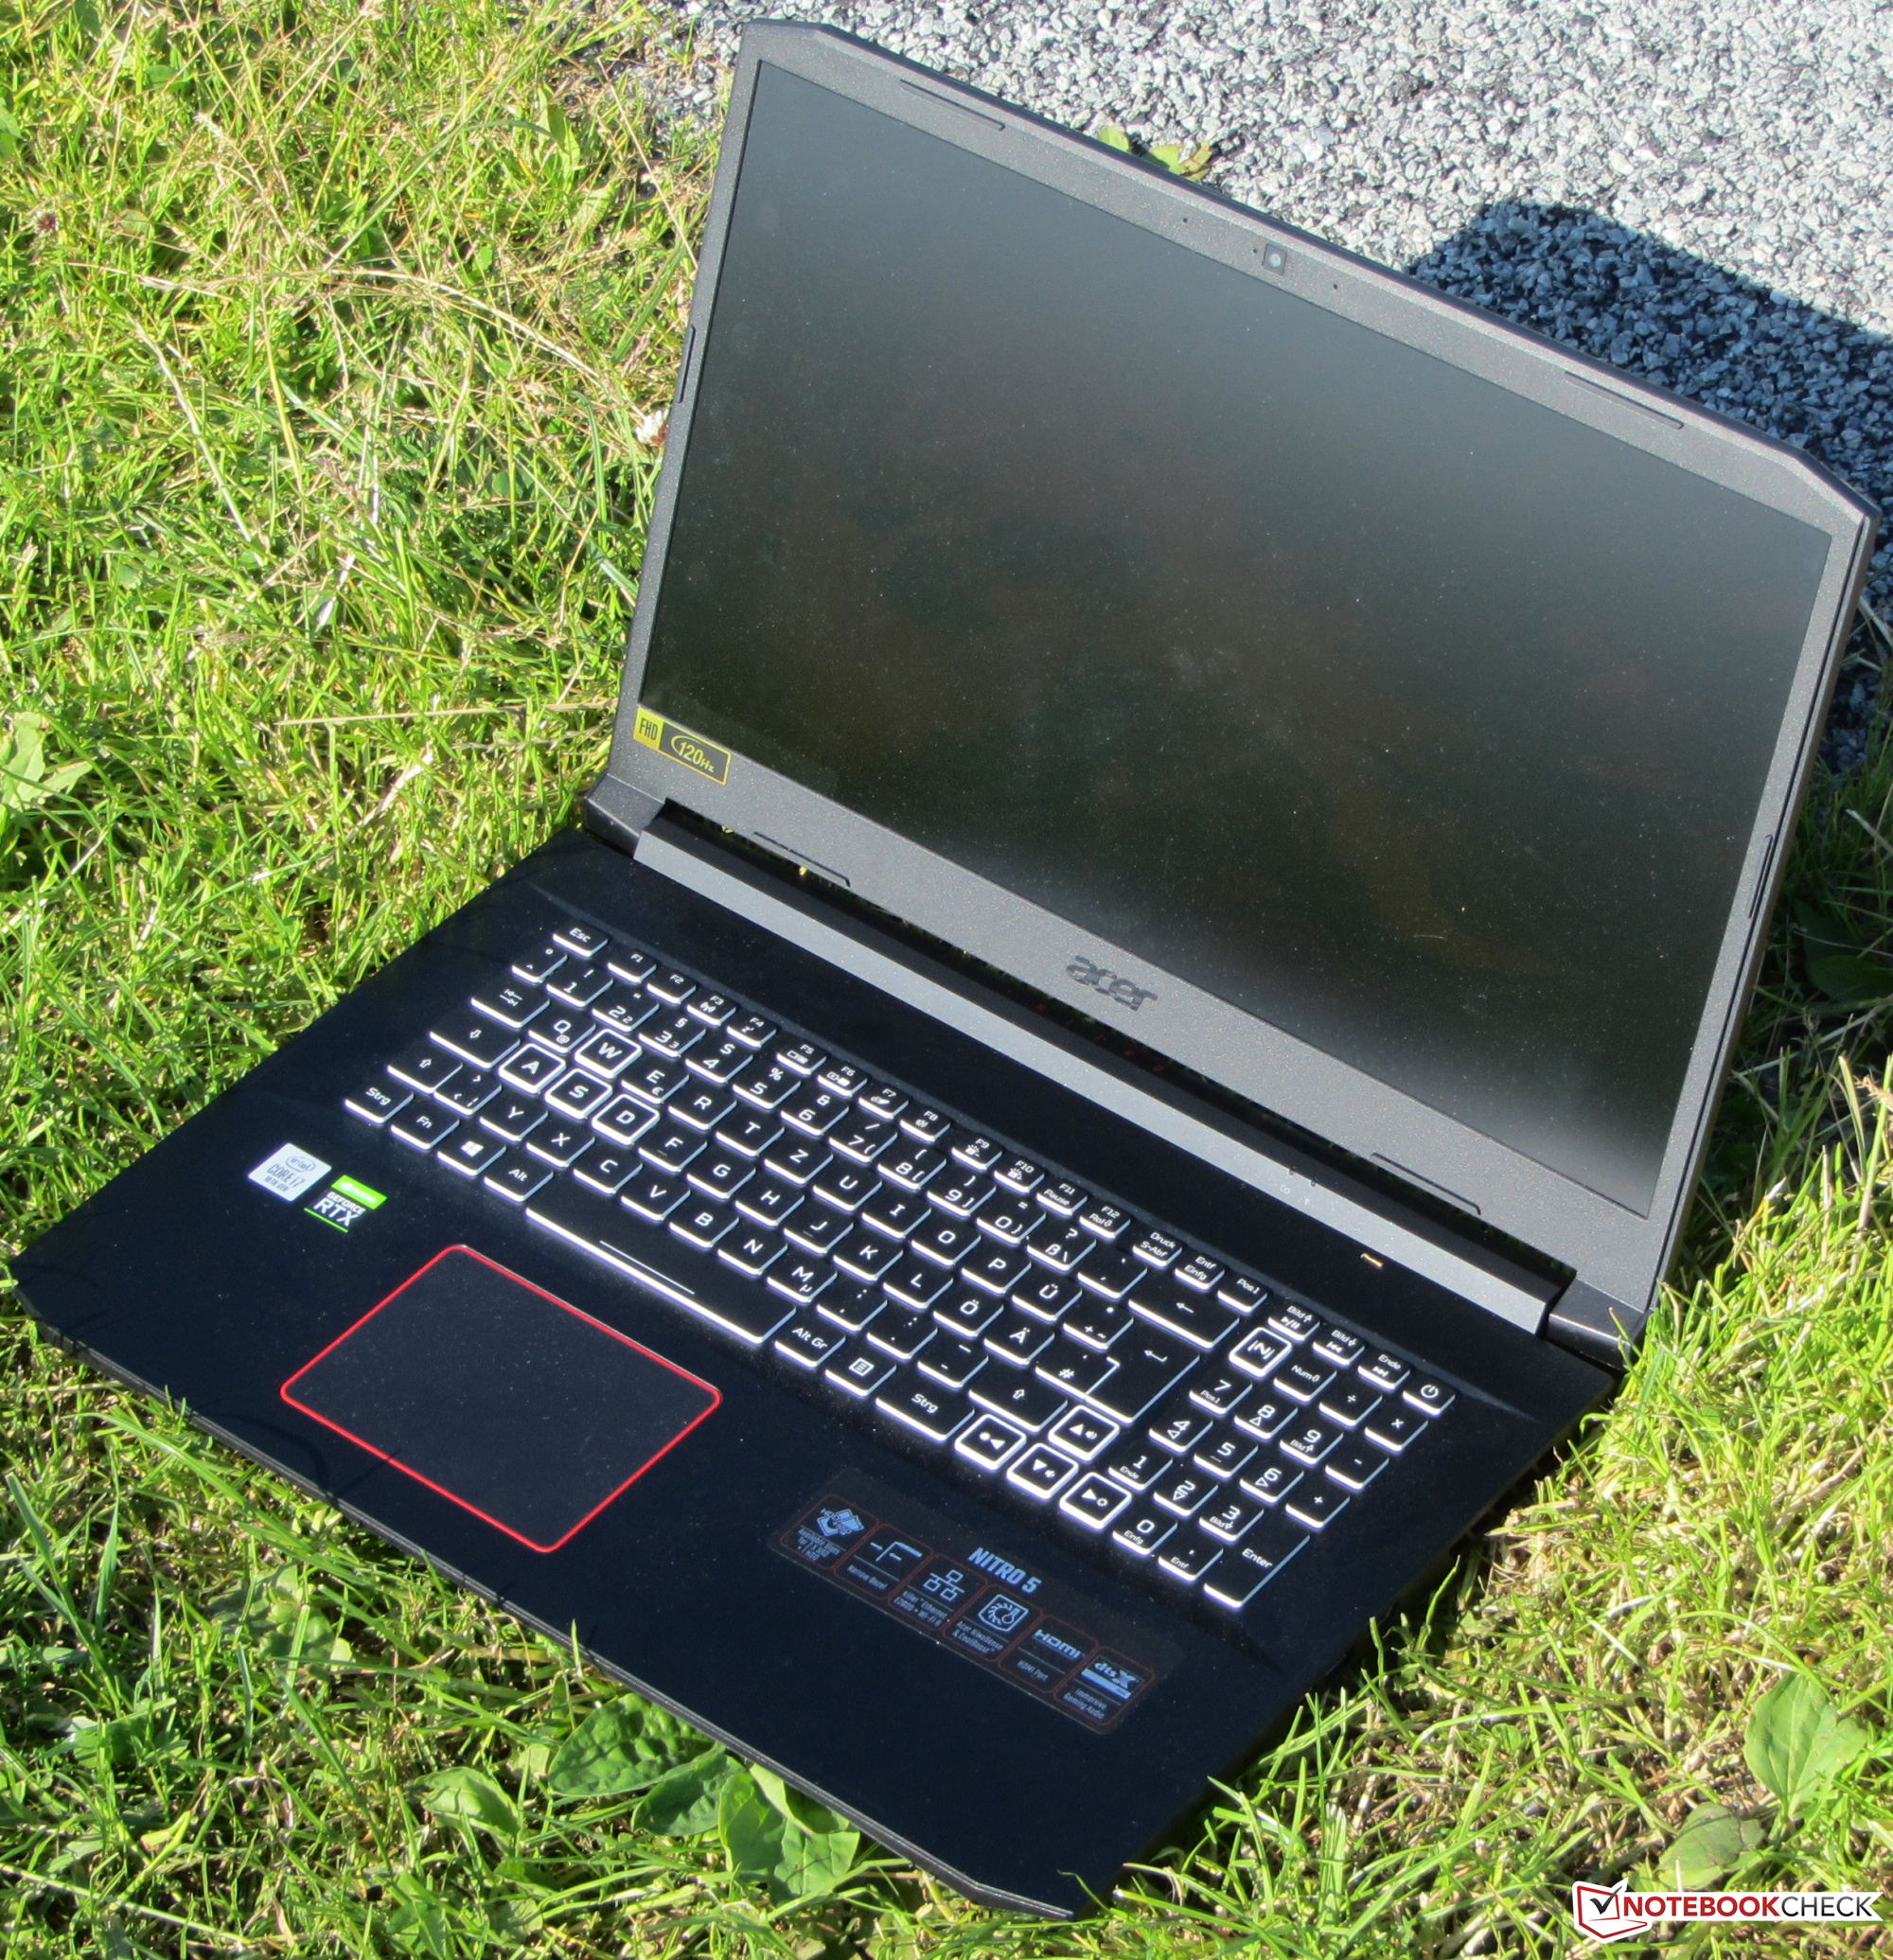
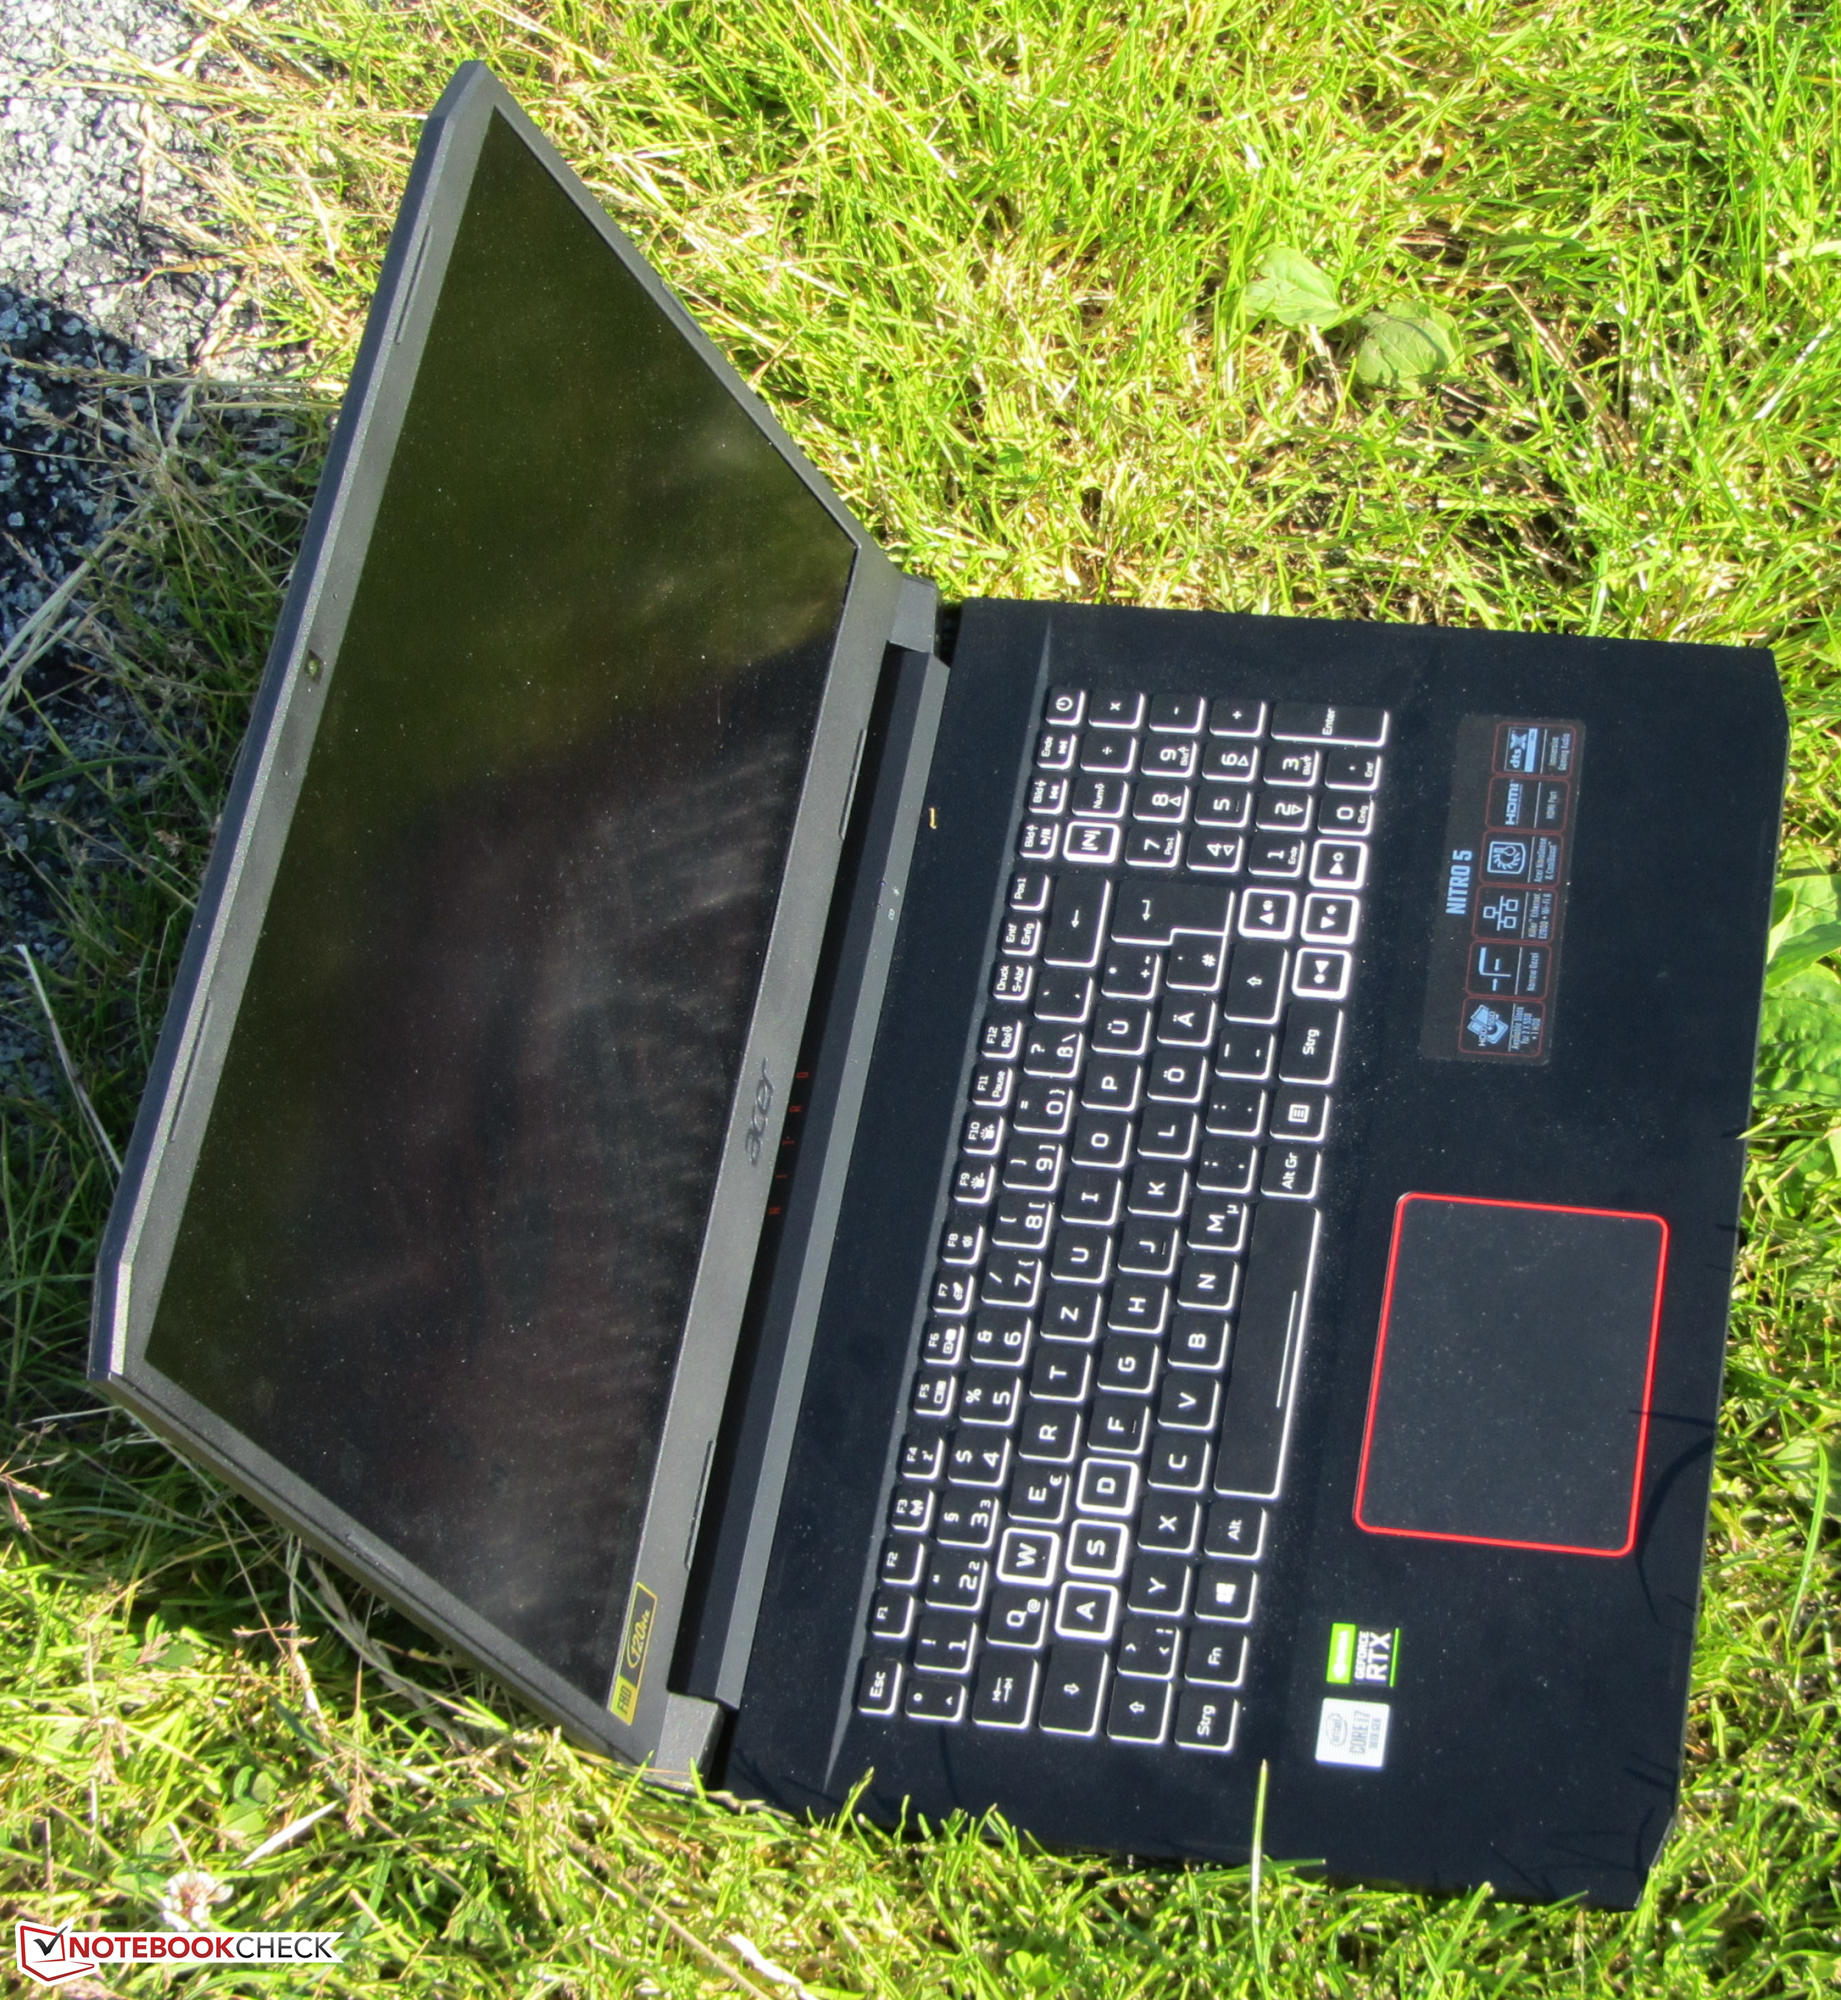
借助Core i7-10750H处理器和GeForce RTX 2060 GPU,Acer的17.3英寸游戏笔记本电脑能够在磨砂全高清显示屏上流畅地运行所有最新游戏。通常,您可以以Full HD分辨率和高质量设置运行。
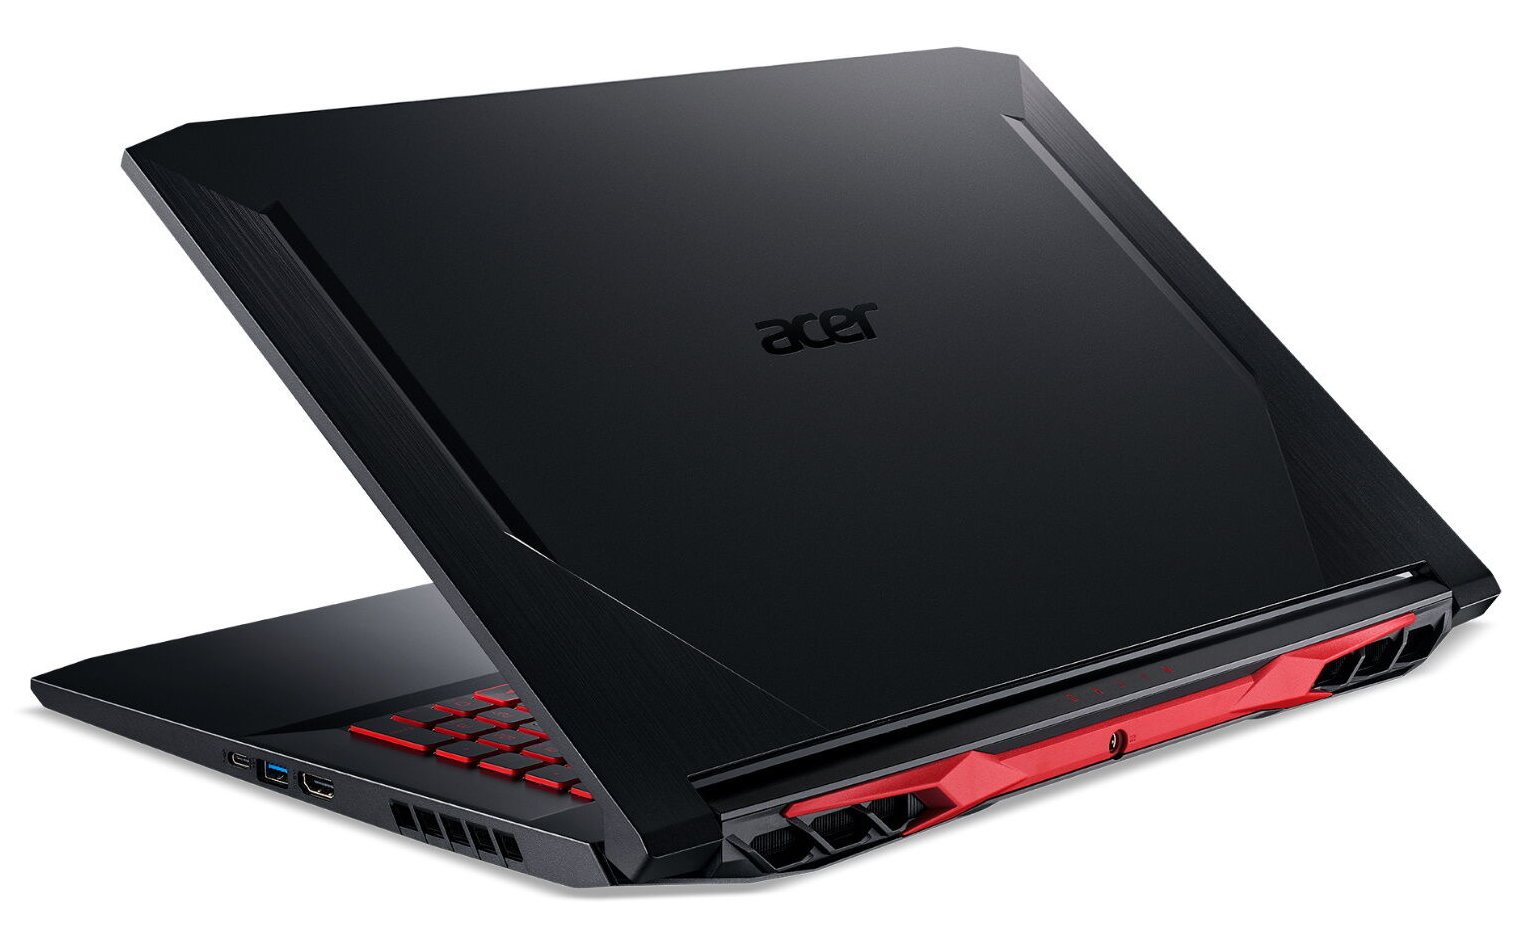
Acer Nitro 5 AN517-52是一款功能全面的游戏笔记本电脑,值得一看。
1 TB NVMe SSD为游戏和其他应用程序提供了足够的空间。如果存储空间用完了,则可以扩展。笔记本电脑还可以容纳第二个M.2 2280 NVMe SSD和2.5英寸存储设备。由于没有维护孔,因此必须为此打开机盖。
总而言之,120 Hz IPS显示屏无法令人信服。亮度,对比度和色彩空间覆盖率都太低。响应时间只能描述为平均。1,500欧元(约合1,697美元)的笔记本电脑需要在此处提供更多功能。稳定的视角,无光泽的表面和良好的色彩再现性代表了这种显示效果。
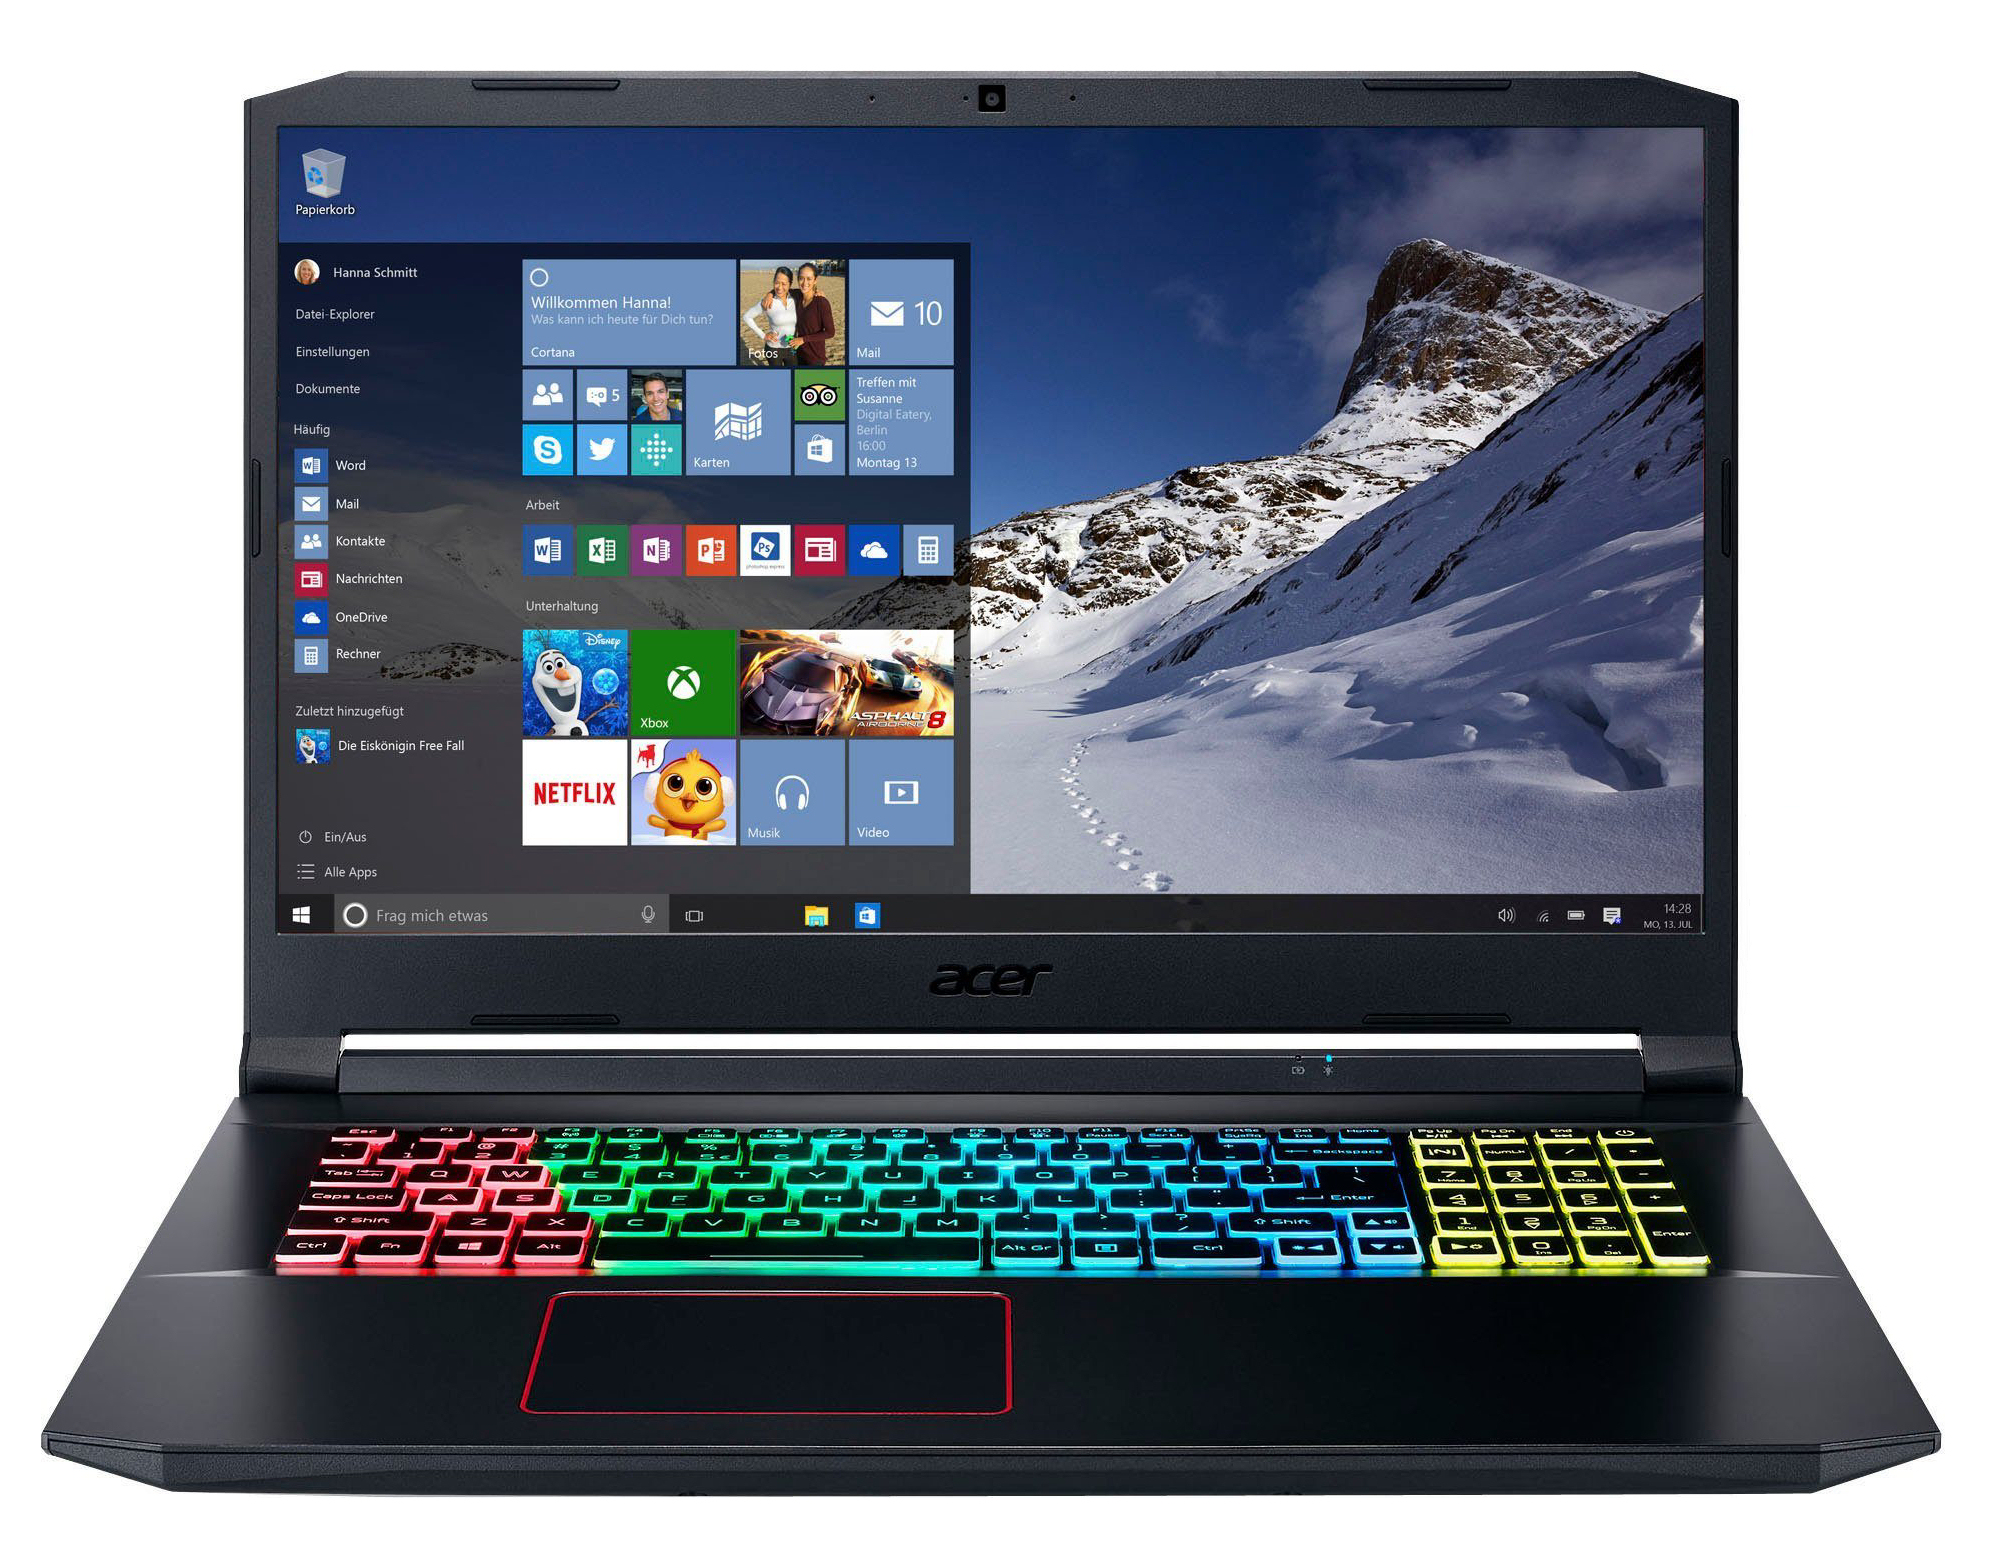
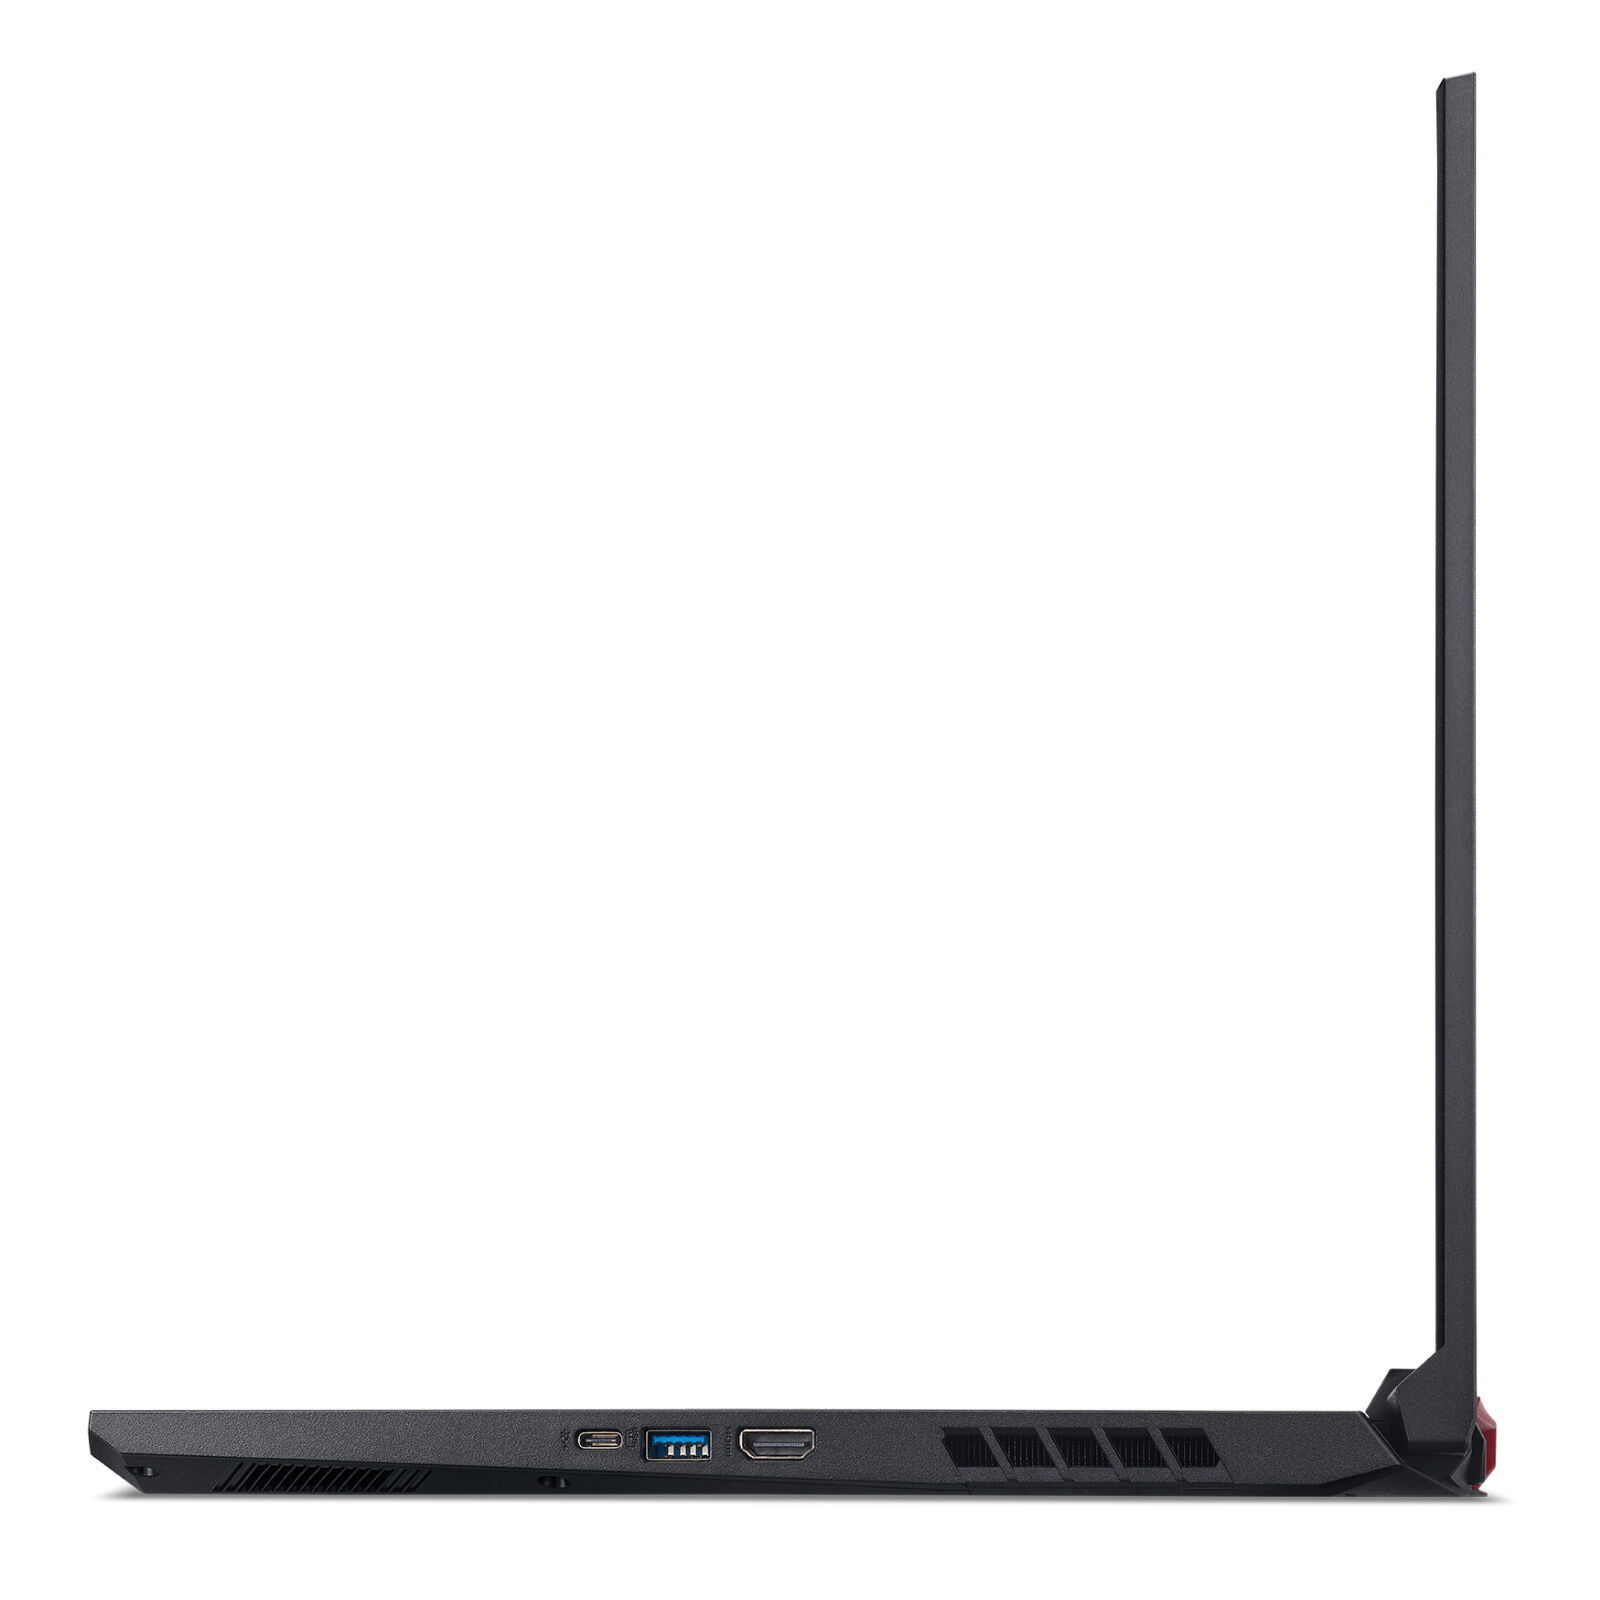
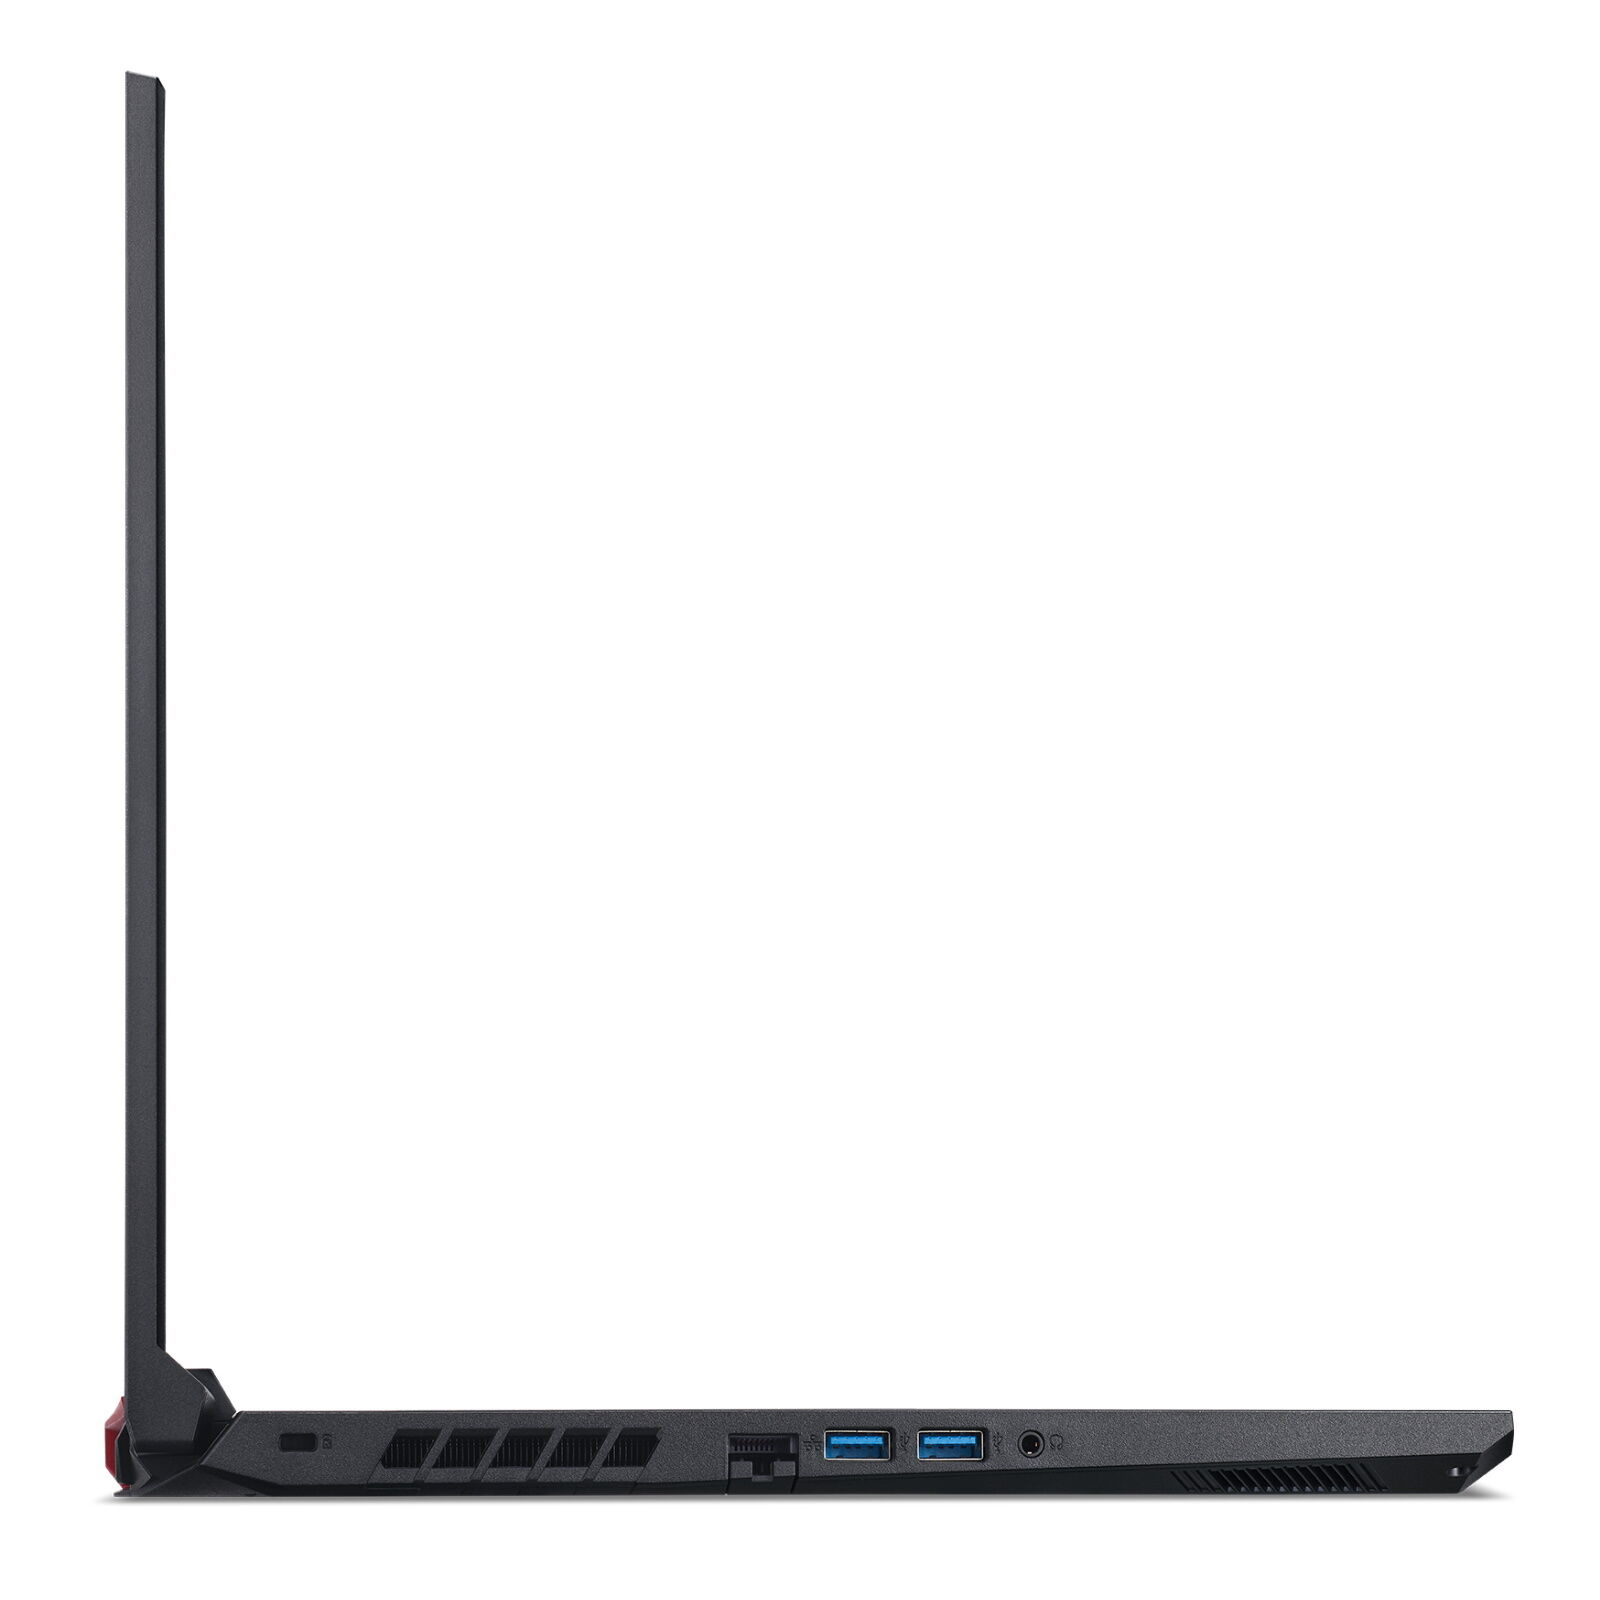
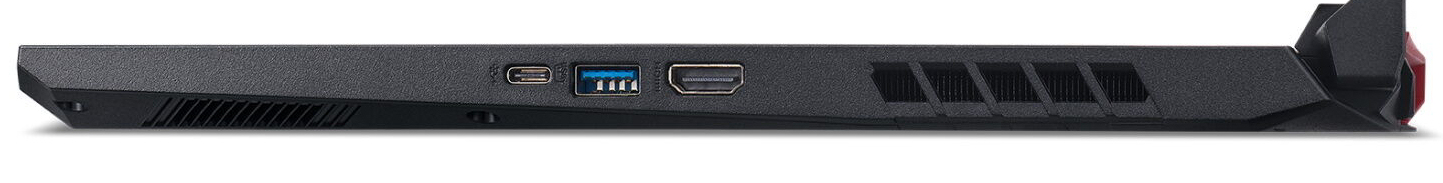
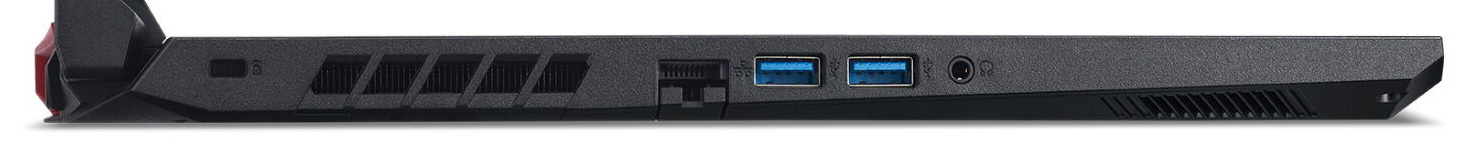
笔记本电脑带有最必要的端口。但是,您不会找到Thunderbolt 3端口。只有一个USB Type-C 3.2 Gen 2端口,不支持通过USB-C功能的DisplayPort。事实证明,内置键盘(带有RGB照明)适合日常使用。此外,对于17.3英寸的游戏笔记本电脑来说,续航时间已经足够了。
目前,笔记本电脑的价格不到1,500欧元(约合1,697美元)。结果,它实际上并廉价。但是它确实提供了良好的性价比。
Acer Nitro 5 AN517-52-77DS
- 06/18/2020 v7 (old)
Sascha Mölck
Price comparison

