

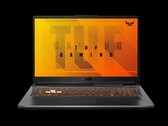
华硕TUF A17 FA706IU Ryzen 7笔记本电脑评测:$1100美元的i9性能
华硕已经从头到尾彻底改造了其TUF系列,并且变化很大。 如果您正在考虑购买较旧的FX705 / FX505系列,请忽略它们,而考虑购买较新的FA706 / FA506系列。
AMD Ryzen 7 4800H, NVIDIA GeForce GTX 1660 Ti Mobile, 17.3", 2.6 kg
AMD Ryzen 7 4800H是一款基于Renoir架构的大型笔记本电脑的移动SoC。 4800H集成了基于Zen 2微体系结构的所有八个内核。它们的时钟频率为2.9(基本时钟)至4.2 GHz(Turbo),并支持SMT /超线程(16个线程)。该芯片是台积电(TSMC)7纳米工艺制造的,AMD宣传这使得每瓦性能提高了2倍。
据AMD称,与Core i7-9750H相比,Ryzen 7 4800H在Cinebench R20单线程测试中的得分提高了5%,在多线程测试提高了46%(这要归功于2个附加内核)。这意味着位于Intel Core i9-9880H和i9-9980HK顶级型号之间的性能。得益于额外的4核,Zen 2微体系结构和更高的时钟速度,旧的Ryzen 3000移动芯片(例如Ryzen 7 3750H)在CPU性能上已经落后。这意味着Ryzen 7 4800H应该能够处理所有苛刻的任务和游戏。
除了八个CPU内核之外,APU还集成了Radeon RX Vega 7集成显卡,具有7个CU和最高1600 MHz。双通道内存控制器支持DDR4-3200和高能效LPDDR4-4266 RAM。此外,可以在芯片上找到8 MB的3级缓存。有关更多信息,请参见Renoir处理器上的中心页面。
APU的TDP指定为45瓦(默认),笔记本电脑供应商可以将其配置为35到54瓦。这意味着该芯片适用于大型且相对较重的笔记本电脑。 Ryzen 7 4800HS是4800H的35瓦版本,TDP降低了10瓦。
| Codename | Renoir-H (Zen 2) | ||||||||||||
| Series | AMD Renoir (Ryzen 4000 APU) | ||||||||||||
Series: Renoir (Ryzen 4000 APU) Renoir-H (Zen 2)
| |||||||||||||
| Clock Rate | 2900 - 4200 MHz | ||||||||||||
| Level 1 Cache | 512 KB | ||||||||||||
| Level 2 Cache | 4 MB | ||||||||||||
| Level 3 Cache | 8 MB | ||||||||||||
| Number of Cores / Threads | 8 / 16 | ||||||||||||
| Power Consumption (TDP = Thermal Design Power) | 45 Watt | ||||||||||||
| Manufacturing Technology | 7 nm | ||||||||||||
| Max. Temperature | 105 °C | ||||||||||||
| Socket | FP6 | ||||||||||||
| Features | DDR4-3200/LPDDR4-4266 RAM, PCIe 3, MMX, SSE, SSE2, SSE3, SSSE3, SSE4A, SSE4.1, SSE4.2, AVX, AVX2, BMI2, ABM, FMA, ADX, SMEP, SMAP, SMT, CPB, AES-NI, RDRAND, RDSEED, SHA, SME | ||||||||||||
| GPU | AMD Radeon RX Vega 7 ( - 1600 MHz) | ||||||||||||
| 64 Bit | 64 Bit support | ||||||||||||
| Architecture | x86 | ||||||||||||
| Announcement Date | 01/07/2020 | ||||||||||||
| Product Link (external) | www.amd.com | ||||||||||||
Asus ROG Strix G15 G513IM-HN161: NVIDIA GeForce RTX 3060 Laptop GPU, 15.60", 2.3 kg
External Review » Asus ROG Strix G15 G513IM-HN161
Asus Vivobook 15X M1503, R7 4800H: AMD Radeon RX Vega 7, 15.60", 1.7 kg
External Review » Asus Vivobook 15X M1503, R7 4800H
Asus ROG Strix G15 G513IM-HN008: NVIDIA GeForce RTX 3060 Laptop GPU, 15.60", 2.3 kg
External Review » Asus ROG Strix G15 G513IM-HN008
Asus ROG Strix G15 G513IC-HN100W: NVIDIA GeForce RTX 3050 4GB Laptop GPU, 15.60", 2.1 kg
External Review » Asus ROG Strix G15 G513IC-HN100W
Asus ROG Strix G17 G713IC-HX011: NVIDIA GeForce RTX 3050 Ti Laptop GPU, 17.30", 2.4 kg
External Review » Asus ROG Strix G17 G713IC-HX011
Asus ROG Strix G17 G713IE-HX011: NVIDIA GeForce RTX 3050 Ti Laptop GPU, 17.30", 2.7 kg
External Review » Asus ROG Strix G17 G713IE-HX011
Asus ROG Strix G15 G513IE-HN004W: NVIDIA GeForce RTX 3050 Ti Laptop GPU, 15.60", 2.3 kg
External Review » Asus ROG Strix G15 G513IE-HN004W
BTO Notebooks X-Book 15X1187-AMD: NVIDIA GeForce RTX 2060 Mobile, 15.60"
External Review » BTO Notebooks X-Book 15X1187-AMD
Asus ROG Strix G513IC-HN004: NVIDIA GeForce GTX 1650 Mobile, 15.60", 2.3 kg
External Review » Asus ROG Strix G513IC-HN004
Huawei MateBook 14 2020 AMD: AMD Radeon RX Vega 7, 14.00", 1.6 kg
External Review » Huawei MateBook 14 2020 AMD
HP Omen 15-en825no: NVIDIA GeForce RTX 2060 Mobile, 15.60", 2.5 kg
External Review » HP Omen 15-en825no
HP Pavilion Gaming 15-ec1028ns: NVIDIA GeForce GTX 1650 Ti Mobile, 15.60", 2 kg
External Review » HP Pavilion Gaming 15-ec1028ns
HP Pavilion Gaming 15-ec1013ns: NVIDIA GeForce GTX 1650 Ti Mobile, 15.60", 2 kg
External Review » HP Pavilion Gaming 15-ec1013ns
Asus ROG Strix G15 G513IH-HN008: NVIDIA GeForce GTX 1650 Mobile, 15.60", 2.1 kg
External Review » Asus ROG Strix G15 G513IH-HN008
Lenovo IdeaPad Gaming 3 15ARH05-82EY00RESP: NVIDIA GeForce GTX 1650 Mobile, 15.60", 2.2 kg
External Review » Lenovo IdeaPad Gaming 3 15ARH05-82EY00RESP
Asus TUF Gaming A15 FA506IV-AS76: NVIDIA GeForce RTX 2060 Mobile, 15.60", 2.3 kg
External Review » Asus TUF Gaming A15 FA506IV-AS76
HP Omen 15-en0016ns: NVIDIA GeForce RTX 2060 Mobile, 15.60", 2.4 kg
External Review » HP Omen 15-en0016ns
HP Omen 15-en0006na: NVIDIA GeForce GTX 1660 Ti Mobile, 15.60", 2.4 kg
External Review » HP Omen 15-en0006na
Lenovo IdeaPad Gaming 3 15ARH05-82EY00CQSP: NVIDIA GeForce GTX 1650 Mobile, 15.60", 2.2 kg
External Review » Lenovo IdeaPad Gaming 3 15ARH05-82EY00CQSP
HP Omen 15-en0017ns: NVIDIA GeForce RTX 2060 Mobile, 15.60", 2.5 kg
External Review » HP Omen 15-en0017ns
Lenovo IdeaPad 3 15ARH05-82EY00CNSP: NVIDIA GeForce GTX 1650 Mobile, 15.60", 2.2 kg
External Review » Lenovo IdeaPad 3 15ARH05-82EY00CNSP
HP Omen 15-en0009ns: NVIDIA GeForce RTX 2060 Mobile, 15.60", 2.5 kg
External Review » HP Omen 15-en0009ns
HP Omen 15-en0004ns: NVIDIA GeForce RTX 2060 Mobile, 15.60", 2.5 kg
External Review » HP Omen 15-en0004ns
Lenovo IdeaPad 3 15ARH05-82EY00BSMH: NVIDIA GeForce GTX 1650 Mobile, 15.60", 2.2 kg
External Review » Lenovo IdeaPad 3 15ARH05-82EY00BSMH
Lenovo Legion 5 15ARH05H-82B1000AUS: NVIDIA GeForce GTX 1660 Ti Mobile, 15.60", 2.5 kg
External Review » Lenovo Legion 5 15ARH05H-82B1000AUS
Asus TUF Gaming A15 FA506II-BQ029: NVIDIA GeForce GTX 1650 Ti Mobile, 15.60", 2.3 kg
External Review » Asus TUF A15 FA506II-BQ029
MSI Alpha 15 A4DEK-006XES: AMD Radeon RX 5600M, 15.60", 2.4 kg
External Review » MSI Alpha 15 A4DEK-006XES
Asus TUF A17 FA706II-AU741: NVIDIA GeForce GTX 1650 Ti Mobile, 17.30", 2.6 kg
External Review » Asus TUF A17 FA706II-AU741
HP Omen 15-en0046nf: NVIDIA GeForce RTX 2060 Mobile, 15.60", 2.4 kg
External Review » HP Omen 15-en0046nf
HP Pavilion Gaming 15-ec1076ax: NVIDIA GeForce GTX 1660 Ti Mobile, 15.60", 2.2 kg
External Review » HP Pavilion Gaming 15-ec1076ax
Lenovo Legion 5 15ARH05H-82B1003EMH: NVIDIA GeForce RTX 2060 Mobile, 15.60", 2.5 kg
External Review » Lenovo Legion 5 15ARH05H-82B1003EMH
Asus TUF A17 FX706IU-H7081T: NVIDIA GeForce GTX 1660 Ti Mobile, 17.30", 2.6 kg
External Review » Asus TUF A17 FX706IU-H7081T
Lenovo Legion 5 15ARH05H-82B1008ASP: NVIDIA GeForce RTX 2060 Mobile, 15.60", 2.5 kg
External Review » Lenovo Legion 5 15ARH05H-82B1008ASP
Asus TUF A15 FA566IU-HN244T: NVIDIA GeForce GTX 1660 Ti Mobile, 15.60", 2.3 kg
External Review » Asus TUF A15 FA566IU-HN244T
HP Omen 15-en0029nr: NVIDIA GeForce GTX 1660 Ti Mobile, 15.60", 2.5 kg
External Review » HP Omen 15-en0029nr
Asus TUF Gaming A15 FA506IH-BQ027T: NVIDIA GeForce GTX 1650 Mobile, 15.60", 2.3 kg
External Review » Asus TUF Gaming A15 FA506IH-BQ027T
Asus TUF A17 FX706: NVIDIA GeForce GTX 1660 Ti Mobile, 17.30", 2.6 kg
External Review » Asus TUF A17 FX706
Asus TUF Gaming A15 FA506IU-HN278: NVIDIA GeForce GTX 1660 Ti Mobile, 15.60"
External Review » Asus TUF A15 FA506IU-HN278
MSI Bravo 15 A4DDR-217XES: AMD Radeon RX 5500M, 15.60", 2 kg
External Review » MSI Bravo 15 A4DDR-217XES
Huawei MateBook 14 2020 AMD KLVL-WFE9: AMD Radeon RX Vega 7, 14.00", 1.5 kg
External Review » Huawei MateBook 14 2020 AMD KLVL-WFE9
HP Omen 15-en0013ax: NVIDIA GeForce RTX 2060 Mobile, 15.60", 2.4 kg
External Review » HP Omen 15-en0013ax
Huawei MateBook 14 2020 AMD 4800H: AMD Radeon RX Vega 7, 14.00", 1.5 kg
External Review » Huawei MateBook 14 2020 AMD 4800H
HP Omen 15-en0261ng: NVIDIA GeForce GTX 1650 Ti Mobile, 15.60", 2.4 kg
External Review » HP Omen 15-en0261ng
HP Omen 15-en0001ns: NVIDIA GeForce GTX 1650 Ti Mobile, 15.60", 2.4 kg
External Review » HP Omen 15-en0001ns
MSI Bravo 17 A4DDK-002XES: AMD Radeon RX 5500M, 17.30", 2.2 kg
External Review » MSI Bravo 17 A4DDK-002XES
Acer Nitro 5 AN515-44-R4P7: NVIDIA GeForce GTX 1650 Mobile, 15.60", 2.4 kg
External Review » Acer Nitro 5 AN515-44-R4P7
Asus TUF Gaming A15 FA506IV-HN337: NVIDIA GeForce RTX 2060 Mobile, 15.60", 2.3 kg
External Review » Asus TUF Gaming A15 FA506IV-HN337
Lenovo Legion 5 15ARH05-82B500D3SP: NVIDIA GeForce GTX 1650 Mobile, 15.60", 2.3 kg
External Review » Lenovo Legion 5 15ARH05-82B500D3SP
Schenker XMG Core 15-M20hdw: NVIDIA GeForce GTX 1650 Ti Mobile, 15.60", 1.9 kg
External Review » Schenker XMG Core 15-M20hdw
Asus TUF Gaming F15 FX506IV-BQ123T: NVIDIA GeForce RTX 2060 Mobile, 15.60", 2.3 kg
External Review » Asus TUF Gaming A15 FX506IV-BQ123T
Asus TUF Gaming A15 FA506II-BQ150: NVIDIA GeForce GTX 1650 Ti Mobile, 15.60", 2.3 kg
External Review » Asus TUF Gaming A15 FA506II-BQ150
MSI Bravo 17 A4DDR: AMD Radeon RX 5500M, 17.30", 2.2 kg
External Review » MSI Bravo 17 A4DDR
HP Omen 15-en0263ng: NVIDIA GeForce GTX 1660 Ti Mobile, 15.60", 2.4 kg
External Review » HP Omen 15-en0263ng
HP Pavilion Gaming 15-ec1012ns: NVIDIA GeForce GTX 1650 Ti Mobile, 15.60", 2 kg
External Review » HP Pavilion Gaming 15-ec1012ns
MSI Bravo 15 A4DDR-023: AMD Radeon RX 5500M, 15.60", 1.9 kg
External Review » MSI Bravo 15 A4DDR-023
MSI Bravo 17 A4DDR-021: AMD Radeon RX 5500M, 17.30", 2.2 kg
External Review » MSI Bravo 17 A4DDR-021
Dell G5 15 SE 5505 P89F: AMD Radeon RX 5600M, 15.60", 2.4 kg
External Review » Dell G5 15 SE 5505 P89F
Lenovo Legion 5 15ARH05-82B5007CMH: NVIDIA GeForce GTX 1650 Ti Mobile, 15.60", 2.3 kg
External Review » Lenovo Legion 5 15ARH05-82B5007CMH
Asus TUF Gaming A15 566IV-AL155T: NVIDIA GeForce RTX 2060 Mobile, 15.60", 2.1 kg
External Review » Asus TUF Gaming A15 566IV-AL155T
Acer Aspire Nitro 5 AN515-44: NVIDIA GeForce GTX 1650 Ti Mobile, 15.60", 2.4 kg
External Review » Acer Aspire Nitro 5 AN515-44
Asus TUF A17 FA706IU-AS76: NVIDIA GeForce GTX 1660 Ti Mobile, 17.30", 2.6 kg
External Review » Asus TUF A17 FA706IU-AS76
Asus TUF Gaming A15 FA506IV-AL064T: NVIDIA GeForce RTX 2060 Mobile, 15.60", 2.3 kg
External Review » Asus TUF Gaming A15 FA506IV-AL064T
Asus TUF Gaming F15 FX506IV: NVIDIA GeForce RTX 2060 Mobile, 15.60", 2.3 kg
External Review » Asus TUF Gaming A15 FX506IV
Lenovo Legion 5 15ARH05-82B500CFGE: NVIDIA GeForce GTX 1650 Mobile, 15.60", 2.3 kg
External Review » Lenovo Legion 5 15ARH05-82B500CFGE
MSI Bravo 15 A4DDR-007XES: AMD Radeon RX 5500M, 15.60", 2 kg
External Review » MSI Bravo 15 A4DDR-007XES
Asus TUF Gaming F15 FX506II-R75TB6B: NVIDIA GeForce GTX 1650 Ti Mobile, 15.60", 2.3 kg
External Review » Asus TUF Gaming A15 FX506II-R75TB6B
Asus TUF Gaming F15 FX506IU-AL109T: NVIDIA GeForce GTX 1660 Ti Mobile, 15.60", 2.3 kg
External Review » Asus TUF Gaming A15 FX506IU-AL109T
Asus TUF Gaming A15 FA506II-BQ027T: NVIDIA GeForce GTX 1650 Ti Mobile, 15.60", 2.3 kg
External Review » Asus TUF Gaming A15 FA506II-BQ027T
Asus TUF Gaming F15 FX506IU-BQ225: NVIDIA GeForce GTX 1660 Ti Mobile, 15.60", 2.3 kg
External Review » Asus TUF Gaming A15 FX506IU-BQ225
MSI Bravo 15 A4DDR-016: AMD Radeon RX 5500M, 15.60", 1.9 kg
External Review » MSI Bravo 15 A4DDR-016
Dell G5 15 SE 5505: AMD Radeon RX 5600M, 15.60", 2.5 kg
External Review » Dell G5 15 SE 5505
Asus TUF Gaming A17 FA706II-H7356: NVIDIA GeForce GTX 1650 Ti Mobile, 17.30", 2.6 kg
External Review » Asus TUF Gaming A17 FA706II-H7356
Asus TUF Gaming A17 FA706II-AU077T: NVIDIA GeForce GTX 1650 Ti Mobile, 17.30", 2.6 kg
External Review » Asus TUF Gaming A17 FA706II-AU077T
Asus TUF Gaming A15 FA506IV-AL029T: NVIDIA GeForce RTX 2060 Mobile, 15.60", 1.7 kg
External Review » Asus TUF Gaming A15 FA506IV-AL029T
MSI Bravo 17 A4DDR-009: AMD Radeon RX 5500M, 17.30", 2.3 kg
External Review » MSI Bravo 17 A4DDR-009
Asus TUF Gaming A15 FA506IV-AL032T: NVIDIA GeForce RTX 2060 Mobile, 15.60", 2.3 kg
External Review » Asus TUF Gaming A15 FA506IV-AL032T
Asus TUF Gaming A15 FA506UI: NVIDIA GeForce GTX 1660 Ti Mobile, 15.60", 2.3 kg
External Review » Asus TUF Gaming A15 FA506UI
» Notebookcheck多媒体笔记本电脑Top 10排名
» Notebookcheck游戏笔记本电脑Top 10排名
» Notebookcheck低价办公/商务笔记本电脑Top 10排名
» Notebookcheck高端办公/商务笔记本电脑Top 10排名
» Notebookcheck工作站笔记本电脑Top 10排名
» Notebookcheck亚笔记本电脑Top 10排名
» Notebookcheck超级本产品Top 10排名
» Notebookcheck变形本产品Top 10排名
» Notebookcheck平板电脑Top 10排名
» Notebookcheck智能手机Top 10排名
» Notebookcheck评测过最出色的笔记本电脑屏幕
» Notebookcheck售价500欧元以下笔记本电脑Top 10排名
» Notebookcheck售价300欧元以下笔记本电脑Top 10排名