打了鸡血的ZenBook:华硕ZenBook Pro Duo UX581笔记本电脑评测
| |||||||||||||||||||||||||
Brightness Distribution: 94 %
Center on Battery: 359.7 cd/m²
Contrast: ∞:1 (Black: 0 cd/m²)
ΔE ColorChecker Calman: 5.14 | ∀{0.5-29.43 Ø4.72}
ΔE Greyscale Calman: 2.7 | ∀{0.09-98 Ø4.97}
81.3% sRGB (Argyll 1.6.3 3D)
61.8% AdobeRGB 1998 (Argyll 1.6.3 3D)
67.3% AdobeRGB 1998 (Argyll 3D)
81% sRGB (Argyll 3D)
63.5% Display P3 (Argyll 3D)
Gamma: 2
CCT: 6220 K
| Asus ZenBook Pro Duo UX581GV Samsung SDCA029, OLED, 15.6", 3840x2160 | Asus ZenBook Pro 15 UX580GE AU Optronics B156ZAN03.1, IPS, 15.6", 3840x2160 | Asus ZenBook 15 UX533FD BOE07D8, IPS, 15.6", 1920x1080 | Asus Strix Scar III G531GW Sharp LQ156M1JW09 (SHP14D3), IPS, 15.6", 1920x1080 | HP Omen X 2S 15-dg0075cl AU Optronics AUO82ED, IPS, 15.6", 1920x1080 | Dell XPS 15 7590 9980HK GTX 1650 Samsung 156WR04, SDCA029, OLED, 15.6", 3840x2160 | |
|---|---|---|---|---|---|---|
| Display | 35% | 4% | 8% | 6% | 33% | |
| Display P3 Coverage (%) | 63.5 | 85.9 35% | 67.2 6% | 66.2 4% | 66.2 4% | 88.1 39% |
| sRGB Coverage (%) | 81 | 100 23% | 88.4 9% | 96.5 19% | 92.3 14% | 99.6 23% |
| AdobeRGB 1998 Coverage (%) | 67.3 | 99.1 47% | 64.6 -4% | 67.5 0% | 67.2 0% | 91.8 36% |
| Response Times | -1339% | -1634% | -507% | -453% | 2% | |
| Response Time Grey 50% / Grey 80% * (ms) | 2.2 ? | 44 ? -1900% | 45 ? -1945% | 17.2 ? -682% | 15.2 ? -591% | 2.3 ? -5% |
| Response Time Black / White * (ms) | 2.6 ? | 22.8 ? -777% | 37 ? -1323% | 11.2 ? -331% | 10.8 ? -315% | 2.4 ? 8% |
| PWM Frequency (Hz) | 240.4 ? | 24040 ? | 59.5 ? | |||
| Screen | 9% | -18% | 11% | -15% | 1% | |
| Brightness middle (cd/m²) | 359.7 | 357.6 -1% | 311 -14% | 266 -26% | 324.8 -10% | 421.2 17% |
| Brightness (cd/m²) | 366 | 350 -4% | 303 -17% | 252 -31% | 316 -14% | 417 14% |
| Brightness Distribution (%) | 94 | 85 -10% | 81 -14% | 88 -6% | 84 -11% | 94 0% |
| Black Level * (cd/m²) | 0.35 | 0.24 | 0.27 | 0.26 | ||
| Colorchecker dE 2000 * | 5.14 | 4.12 20% | 5.1 1% | 1.81 65% | 4.96 4% | 6.06 -18% |
| Colorchecker dE 2000 max. * | 7.77 | 9.91 -28% | 8.91 -15% | 3.23 58% | 8.95 -15% | 11.89 -53% |
| Greyscale dE 2000 * | 2.7 | 1.8 33% | 4.93 -83% | 2.44 10% | 5 -85% | 2.8 -4% |
| Gamma | 2 110% | 2.17 101% | 2.44 90% | 2.42 91% | 2.21 100% | 2.15 102% |
| CCT | 6220 105% | 6613 98% | 7641 85% | 7005 93% | 7742 84% | 6235 104% |
| Color Space (Percent of AdobeRGB 1998) (%) | 61.8 | 87.5 42% | 58 -6% | 62 0% | 59.8 -3% | 81 31% |
| Color Space (Percent of sRGB) (%) | 81.3 | 100 23% | 88 8% | 97 19% | 91.8 13% | 99.6 23% |
| Contrast (:1) | 1022 | 1296 | 985 | 1249 | ||
| Colorchecker dE 2000 calibrated * | 4.23 | 2.48 | 1.03 | 3.23 | ||
| Total Average (Program / Settings) | -432% /
-192% | -549% /
-261% | -163% /
-69% | -154% /
-78% | 12% /
9% |
* ... smaller is better
Display Response Times
| ↔ Response Time Black to White | ||
|---|---|---|
| 2.6 ms ... rise ↗ and fall ↘ combined | ↗ 1 ms rise | 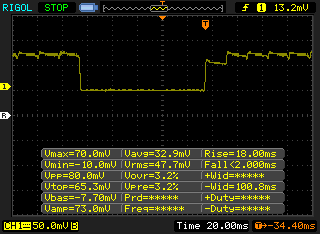 |
| ↘ 1.6 ms fall | ||
| The screen shows very fast response rates in our tests and should be very well suited for fast-paced gaming. In comparison, all tested devices range from 0.1 (minimum) to 240 (maximum) ms. » 14 % of all devices are better. This means that the measured response time is better than the average of all tested devices (19.8 ms). | ||
| ↔ Response Time 50% Grey to 80% Grey | ||
| 2.2 ms ... rise ↗ and fall ↘ combined | ↗ 1 ms rise | 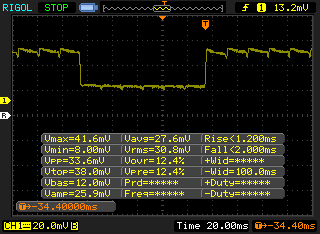 |
| ↘ 1.2 ms fall | ||
| The screen shows very fast response rates in our tests and should be very well suited for fast-paced gaming. In comparison, all tested devices range from 0.165 (minimum) to 636 (maximum) ms. » 11 % of all devices are better. This means that the measured response time is better than the average of all tested devices (31 ms). | ||
Screen Flickering / PWM (Pulse-Width Modulation)
| Screen flickering / PWM detected | 240.4 Hz | ≤ 52 % brightness setting | 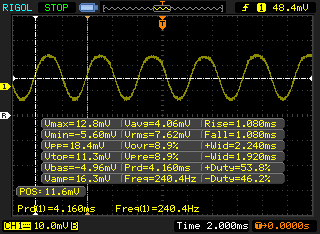 |
The display backlight flickers at 240.4 Hz (worst case, e.g., utilizing PWM) Flickering detected at a brightness setting of 52 % and below. There should be no flickering or PWM above this brightness setting. The frequency of 240.4 Hz is relatively low, so sensitive users will likely notice flickering and experience eyestrain at the stated brightness setting and below. In comparison: 52 % of all tested devices do not use PWM to dim the display. If PWM was detected, an average of 7747 (minimum: 5 - maximum: 343500) Hz was measured. | |||
| Cinebench R15 | |
| CPU Single 64Bit | |
| Asus Chimera G703GI | |
| Corsair One i160 | |
| Eurocom Nightsky RX15 | |
| Average Intel Core i9-9980HK (181 - 215, n=13) | |
| Asus ZenBook Pro Duo UX581GV | |
| Asus G703 | |
| Asus Strix Scar III G531GW | |
| Asus Strix Hero III G731GV | |
| Lenovo Legion Y540-17IRH | |
| Asus FX504GD | |
| Asus ROG G703GX | |
| Asus FX503VM-EH73 | |
| Asus ROG Zephyrus G15 GA502DU | |
| CPU Multi 64Bit | |
| Corsair One i160 | |
| Eurocom Nightsky RX15 | |
| Average Intel Core i9-9980HK (1327 - 1930, n=14) | |
| Asus ZenBook Pro Duo UX581GV | |
| Asus Strix Scar III G531GW | |
| Asus Chimera G703GI | |
| Asus ROG G703GX | |
| Asus Strix Hero III G731GV | |
| Asus G703 | |
| Lenovo Legion Y540-17IRH | |
| Asus ROG Zephyrus G15 GA502DU | |
| Asus FX503VM-EH73 | |
| Asus FX504GD | |
| PCMark 8 Home Score Accelerated v2 | 4157 points | |
| PCMark 8 Work Score Accelerated v2 | 5279 points | |
| PCMark 10 Score | 5654 points | |
Help | ||
| Asus ZenBook Pro Duo UX581GV Samsung SSD PM981 MZVLB1T0HALR | Asus ZenBook Pro 15 UX580GE Samsung SSD PM961 1TB M.2 PCIe 3.0 x4 NVMe (MZVLW1T0) | Asus ZenBook 15 UX533FD WDC PC SN520 SDAPNUW-512G | Dell XPS 15 7590 9980HK GTX 1650 Toshiba XG6 KXG60ZNV1T02 | Asus Strix Scar III G531GW Intel SSD 660p 1TB SSDPEKNW010T8 | HP Omen X 2S 15-dg0075cl WDC PC SN720 SDAPNTW-1T00 | |
|---|---|---|---|---|---|---|
| AS SSD | -0% | -23% | 7% | -37% | 16% | |
| Seq Read (MB/s) | 1409 | 2099 49% | 579 -59% | 1723 22% | 1574 12% | 2105 49% |
| Seq Write (MB/s) | 1316 | 1729 31% | 411.8 -69% | 1386 5% | 1591 21% | 2493 89% |
| 4K Read (MB/s) | 44.99 | 37.78 -16% | 41.81 -7% | 43.25 -4% | 26.79 -40% | 25.01 -44% |
| 4K Write (MB/s) | 93 | 100.9 8% | 131.6 42% | 98.3 6% | 105.1 13% | 108.7 17% |
| 4K-64 Read (MB/s) | 1092 | 1431 31% | 975 -11% | 1078 -1% | 583 -47% | 1604 47% |
| 4K-64 Write (MB/s) | 1810 | 1273 -30% | 1047 -42% | 1456 -20% | 603 -67% | 1593 -12% |
| Access Time Read * (ms) | 0.041 | 0.04 2% | 0.08 -95% | 0.05 -22% | 0.128 -212% | 0.046 -12% |
| Access Time Write * (ms) | 0.118 | 0.036 69% | 0.027 77% | 0.039 67% | 0.043 64% | 0.102 14% |
| Score Read (Points) | 1278 | 1679 31% | 1075 -16% | 1294 1% | 768 -40% | 1840 44% |
| Score Write (Points) | 2034 | 1547 -24% | 1220 -40% | 1693 -17% | 867 -57% | 1951 -4% |
| Score Total (Points) | 3970 | 4065 2% | 2845 -28% | 3638 -8% | 2033 -49% | 4743 19% |
| Copy ISO MB/s (MB/s) | 2112 | 1045 -51% | 3182 51% | 2250 7% | ||
| Copy Program MB/s (MB/s) | 874 | 430.9 -51% | 984 13% | 896 3% | ||
| Copy Game MB/s (MB/s) | 1677 | 728 -57% | 1824 9% | 1854 11% |
* ... smaller is better

| 3DMark | |
| 1280x720 Cloud Gate Standard Graphics | |
| Corsair One i160 | |
| Asus Zephyrus GX501 | |
| Asus ROG G703GX | |
| MSI RTX 2060 Gaming Z 6G | |
| Eurocom Nightsky Ti15 | |
| Asus G752VS-BA338T | |
| Average NVIDIA GeForce RTX 2060 Mobile (55324 - 116593, n=36) | |
| Asus ZenBook Pro Duo UX581GV | |
| Asus Zephyrus S GX531GM | |
| Eurocom Nightsky RX15 | |
| MSI GF75 Thin 9SC | |
| Asus ZenBook Pro 15 UX580GE | |
| 1920x1080 Fire Strike Graphics | |
| Corsair One i160 | |
| Asus ROG G703GX | |
| Eurocom Nightsky RX15 | |
| MSI RTX 2060 Gaming Z 6G | |
| Asus G752VS-BA338T | |
| Asus Zephyrus GX501 | |
| Average NVIDIA GeForce RTX 2060 Mobile (14768 - 18358, n=43) | |
| Eurocom Nightsky Ti15 | |
| Asus ZenBook Pro Duo UX581GV | |
| Asus Zephyrus S GX531GM | |
| MSI GF75 Thin 9SC | |
| Asus ZenBook Pro 15 UX580GE | |
| 2560x1440 Time Spy Graphics | |
| Corsair One i160 | |
| Asus ROG G703GX | |
| Eurocom Nightsky RX15 | |
| MSI RTX 2060 Gaming Z 6G | |
| Average NVIDIA GeForce RTX 2060 Mobile (5660 - 6910, n=41) | |
| Asus ZenBook Pro Duo UX581GV | |
| Eurocom Nightsky Ti15 | |
| Asus G752VS-BA338T | |
| Asus Zephyrus GX501 | |
| Asus Zephyrus S GX531GM | |
| MSI GF75 Thin 9SC | |
| Asus ZenBook Pro 15 UX580GE | |
| 3DMark 11 | |
| 1280x720 Performance GPU | |
| Corsair One i160 | |
| Asus ROG G703GX | |
| Eurocom Nightsky RX15 | |
| MSI RTX 2060 Gaming Z 6G | |
| Asus G752VS-BA338T | |
| Asus Zephyrus GX501 | |
| Average NVIDIA GeForce RTX 2060 Mobile (19143 - 24662, n=40) | |
| Eurocom Nightsky Ti15 | |
| Asus ZenBook Pro Duo UX581GV | |
| MSI GF75 Thin 9SC | |
| Asus Zephyrus S GX531GM | |
| Asus ZenBook Pro 15 UX580GE | |
| 1280x720 Performance Combined | |
| Corsair One i160 | |
| Eurocom Nightsky RX15 | |
| MSI RTX 2060 Gaming Z 6G | |
| Asus ZenBook Pro Duo UX581GV | |
| Eurocom Nightsky Ti15 | |
| MSI GF75 Thin 9SC | |
| Asus ROG G703GX | |
| Average NVIDIA GeForce RTX 2060 Mobile (1107 - 14726, n=40) | |
| Asus G752VS-BA338T | |
| Asus Zephyrus GX501 | |
| Asus ZenBook Pro 15 UX580GE | |
| Asus Zephyrus S GX531GM | |
| 3DMark 11 Performance | 17912 points | |
| 3DMark Cloud Gate Standard Score | 43412 points | |
| 3DMark Fire Strike Score | 13696 points | |
| 3DMark Time Spy Score | 6059 points | |
Help | ||
| Shadow of the Tomb Raider - 1920x1080 Highest Preset AA:T | |
| Corsair One i160 | |
| Asus ROG G703GX | |
| Eurocom Nightsky RX15 | |
| MSI RTX 2060 Gaming Z 6G | |
| HP Omen X 2S 15-dg0075cl | |
| Average NVIDIA GeForce RTX 2060 Mobile (54 - 86, n=22) | |
| Eurocom Nightsky Ti15 | |
| Asus ZenBook Pro Duo UX581GV | |
| MSI GF75 Thin 9SC | |
| Asus Zephyrus S GX531GM | |
| Dell XPS 15 7590 9980HK GTX 1650 | |
| The Witcher 3 - 1920x1080 Ultra Graphics & Postprocessing (HBAO+) | |
| Corsair One i160 | |
| Asus ROG G703GX | |
| Eurocom Nightsky RX15 | |
| MSI RTX 2060 Gaming Z 6G | |
| HP Omen X 2S 15-dg0075cl | |
| Asus Strix Scar III G531GW | |
| Asus Zephyrus GX501 | |
| Average NVIDIA GeForce RTX 2060 Mobile (50.6 - 74, n=40) | |
| Eurocom Nightsky Ti15 | |
| Asus G752VS-BA338T | |
| Asus ZenBook Pro Duo UX581GV | |
| Asus Zephyrus S GX531GM | |
| MSI GF75 Thin 9SC | |
| Dell XPS 15 7590 9980HK GTX 1650 | |
| Asus ZenBook 15 UX533FD | |
| Asus ZenBook Pro 15 UX580GE | |
| low | med. | high | ultra | 4K | |
|---|---|---|---|---|---|
| The Witcher 3 (2015) | 267 | 185.4 | 112.8 | 57.2 | 41.3 |
| Rocket League (2017) | 249 | 241.9 | 180.6 | 96.2 | |
| Shadow of the Tomb Raider (2018) | 114 | 87 | 80 | 71 | 24 |
| Asus ZenBook Pro Duo UX581GV GeForce RTX 2060 Mobile, i9-9980HK, Samsung SSD PM981 MZVLB1T0HALR | Asus ZenBook Pro 15 UX580GE GeForce GTX 1050 Ti Mobile, i9-8950HK, Samsung SSD PM961 1TB M.2 PCIe 3.0 x4 NVMe (MZVLW1T0) | Asus ZenBook 15 UX533FD GeForce GTX 1050 Max-Q, i7-8565U, WDC PC SN520 SDAPNUW-512G | Dell XPS 15 7590 9980HK GTX 1650 GeForce GTX 1650 Mobile, i9-9980HK, Toshiba XG6 KXG60ZNV1T02 | Asus Strix Scar III G531GW GeForce RTX 2070 Mobile, i9-9880H, Intel SSD 660p 1TB SSDPEKNW010T8 | HP Omen X 2S 15-dg0075cl GeForce RTX 2070 Max-Q, i7-9750H, WDC PC SN720 SDAPNTW-1T00 | |
|---|---|---|---|---|---|---|
| Noise | -3% | -4% | -4% | -22% | -9% | |
| off / environment * (dB) | 28.4 | 28 1% | 30.5 -7% | 28.2 1% | 29 -2% | 29 -2% |
| Idle Minimum * (dB) | 29 | 28.6 1% | 30.5 -5% | 28.2 3% | 30 -3% | 30.5 -5% |
| Idle Average * (dB) | 29 | 29.9 -3% | 30.5 -5% | 28.2 3% | 37 -28% | 31.5 -9% |
| Idle Maximum * (dB) | 29 | 30.5 -5% | 30.5 -5% | 30.4 -5% | 39 -34% | 31.5 -9% |
| Load Average * (dB) | 35.4 | 42.5 -20% | 40.8 -15% | 43.8 -24% | 54 -53% | 40.6 -15% |
| Witcher 3 ultra * (dB) | 42 | 44.8 -7% | 47.2 -12% | 54 -29% | 49.5 -18% | |
| Load Maximum * (dB) | 50 | 44.8 10% | 41.8 16% | 47.2 6% | 54 -8% | 53.4 -7% |
* ... smaller is better
Noise level
| Idle |
| 29 / 29 / 29 dB(A) |
| Load |
| 35.4 / 50 dB(A) |
 | ||
30 dB silent 40 dB(A) audible 50 dB(A) loud |
||
min: | ||
(±) The maximum temperature on the upper side is 40.4 °C / 105 F, compared to the average of 40.4 °C / 105 F, ranging from 21.2 to 68.8 °C for the class Gaming.
(-) The bottom heats up to a maximum of 47.8 °C / 118 F, compared to the average of 43.2 °C / 110 F
(±) In idle usage, the average temperature for the upper side is 34.5 °C / 94 F, compared to the device average of 33.9 °C / 93 F.
(±) Playing The Witcher 3, the average temperature for the upper side is 37.3 °C / 99 F, compared to the device average of 33.9 °C / 93 F.
(+) The palmrests and touchpad are reaching skin temperature as a maximum (34.6 °C / 94.3 F) and are therefore not hot.
(-) The average temperature of the palmrest area of similar devices was 28.8 °C / 83.8 F (-5.8 °C / -10.5 F).
Asus ZenBook Pro Duo UX581GV audio analysis
(±) | speaker loudness is average but good (74.4 dB)
Bass 100 - 315 Hz
(±) | reduced bass - on average 10.4% lower than median
(±) | linearity of bass is average (12.2% delta to prev. frequency)
Mids 400 - 2000 Hz
(+) | balanced mids - only 2.1% away from median
(+) | mids are linear (4.3% delta to prev. frequency)
Highs 2 - 16 kHz
(+) | balanced highs - only 4.5% away from median
(±) | linearity of highs is average (10.5% delta to prev. frequency)
Overall 100 - 16.000 Hz
(±) | linearity of overall sound is average (19.8% difference to median)
Compared to same class
» 70% of all tested devices in this class were better, 6% similar, 24% worse
» The best had a delta of 6%, average was 18%, worst was 132%
Compared to all devices tested
» 50% of all tested devices were better, 7% similar, 42% worse
» The best had a delta of 4%, average was 23%, worst was 134%
Apple MacBook 12 (Early 2016) 1.1 GHz audio analysis
(+) | speakers can play relatively loud (83.6 dB)
Bass 100 - 315 Hz
(±) | reduced bass - on average 11.3% lower than median
(±) | linearity of bass is average (14.2% delta to prev. frequency)
Mids 400 - 2000 Hz
(+) | balanced mids - only 2.4% away from median
(+) | mids are linear (5.5% delta to prev. frequency)
Highs 2 - 16 kHz
(+) | balanced highs - only 2% away from median
(+) | highs are linear (4.5% delta to prev. frequency)
Overall 100 - 16.000 Hz
(+) | overall sound is linear (10.2% difference to median)
Compared to same class
» 7% of all tested devices in this class were better, 2% similar, 90% worse
» The best had a delta of 5%, average was 18%, worst was 53%
Compared to all devices tested
» 5% of all tested devices were better, 1% similar, 94% worse
» The best had a delta of 4%, average was 23%, worst was 134%
| Off / Standby | |
| Idle | |
| Load |
|
Key:
min: | |
| Asus ZenBook Pro Duo UX581GV i9-9980HK, GeForce RTX 2060 Mobile, Samsung SSD PM981 MZVLB1T0HALR, OLED, 3840x2160, 15.6" | Asus ZenBook Pro 15 UX580GE i9-8950HK, GeForce GTX 1050 Ti Mobile, Samsung SSD PM961 1TB M.2 PCIe 3.0 x4 NVMe (MZVLW1T0), IPS, 3840x2160, 15.6" | Asus ZenBook 15 UX533FD i7-8565U, GeForce GTX 1050 Max-Q, WDC PC SN520 SDAPNUW-512G, IPS, 1920x1080, 15.6" | Dell XPS 15 7590 9980HK GTX 1650 i9-9980HK, GeForce GTX 1650 Mobile, Toshiba XG6 KXG60ZNV1T02, OLED, 3840x2160, 15.6" | Asus Strix Scar III G531GW i9-9880H, GeForce RTX 2070 Mobile, Intel SSD 660p 1TB SSDPEKNW010T8, IPS, 1920x1080, 15.6" | HP Omen X 2S 15-dg0075cl i7-9750H, GeForce RTX 2070 Max-Q, WDC PC SN720 SDAPNTW-1T00, IPS, 1920x1080, 15.6" | |
|---|---|---|---|---|---|---|
| Power Consumption | 27% | 61% | 37% | -32% | -75% | |
| Idle Minimum * (Watt) | 19.3 | 11.7 39% | 2.7 86% | 6.2 68% | 29 -50% | 46 -138% |
| Idle Average * (Watt) | 24.2 | 18.5 24% | 8 67% | 9.6 60% | 32 -32% | 59 -144% |
| Idle Maximum * (Watt) | 24.5 | 22.8 7% | 10.6 57% | 21.2 13% | 37 -51% | 65.5 -167% |
| Load Average * (Watt) | 122.3 | 97.5 20% | 74 39% | 104.3 15% | 157 -28% | 99.8 18% |
| Witcher 3 ultra * (Watt) | 137 | 102.9 25% | 91.7 33% | 173 -26% | 154.1 -12% | |
| Load Maximum * (Watt) | 208.4 | 111.1 47% | 89 57% | 135.3 35% | 217 -4% | 222.7 -7% |
* ... smaller is better
| Asus ZenBook Pro Duo UX581GV i9-9980HK, GeForce RTX 2060 Mobile, 71 Wh | Asus ZenBook Pro 15 UX580GE i9-8950HK, GeForce GTX 1050 Ti Mobile, 71 Wh | Asus ZenBook 15 UX533FD i7-8565U, GeForce GTX 1050 Max-Q, 73 Wh | Dell XPS 15 7590 9980HK GTX 1650 i9-9980HK, GeForce GTX 1650 Mobile, 97 Wh | Asus Strix Scar III G531GW i9-9880H, GeForce RTX 2070 Mobile, 66 Wh | HP Omen X 2S 15-dg0075cl i7-9750H, GeForce RTX 2070 Max-Q, 72 Wh | |
|---|---|---|---|---|---|---|
| Battery runtime | 18% | 107% | 81% | -28% | -42% | |
| Reader / Idle (h) | 13.1 | 14 7% | 26.5 102% | 15.2 16% | 5.5 -58% | 3.7 -72% |
| WiFi v1.3 (h) | 4.1 | 6.3 54% | 8.7 112% | 7.8 90% | 3 -27% | 2.2 -46% |
| Load (h) | 1.4 | 1.3 -7% | 2.9 107% | 3.3 136% | 1.4 0% | 1.3 -7% |
Pros
Cons
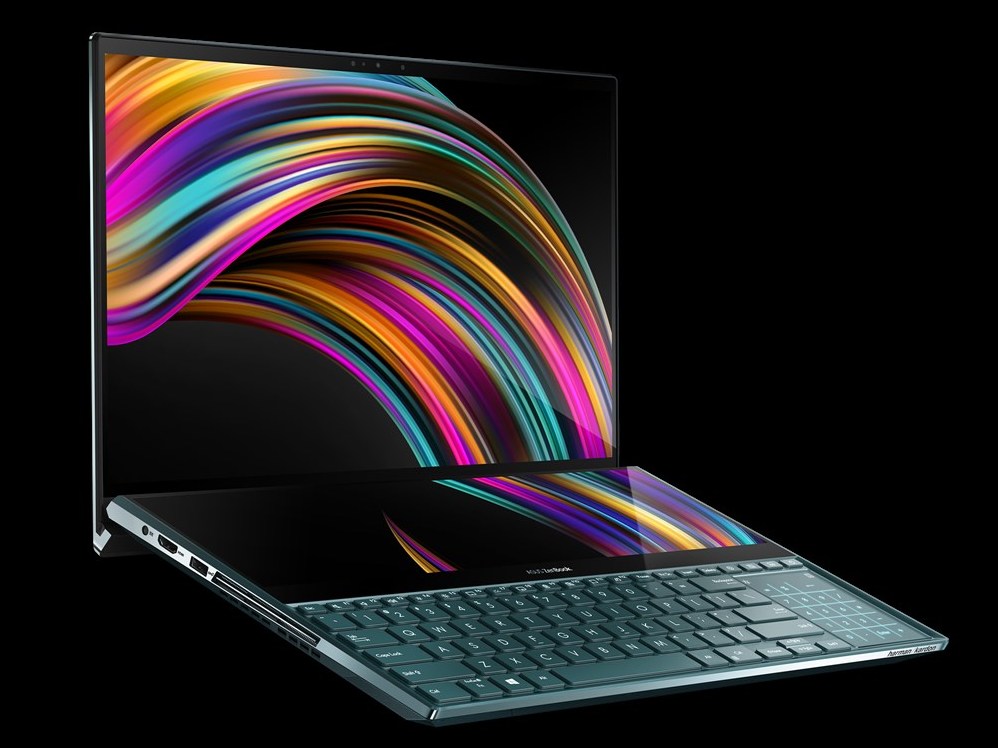

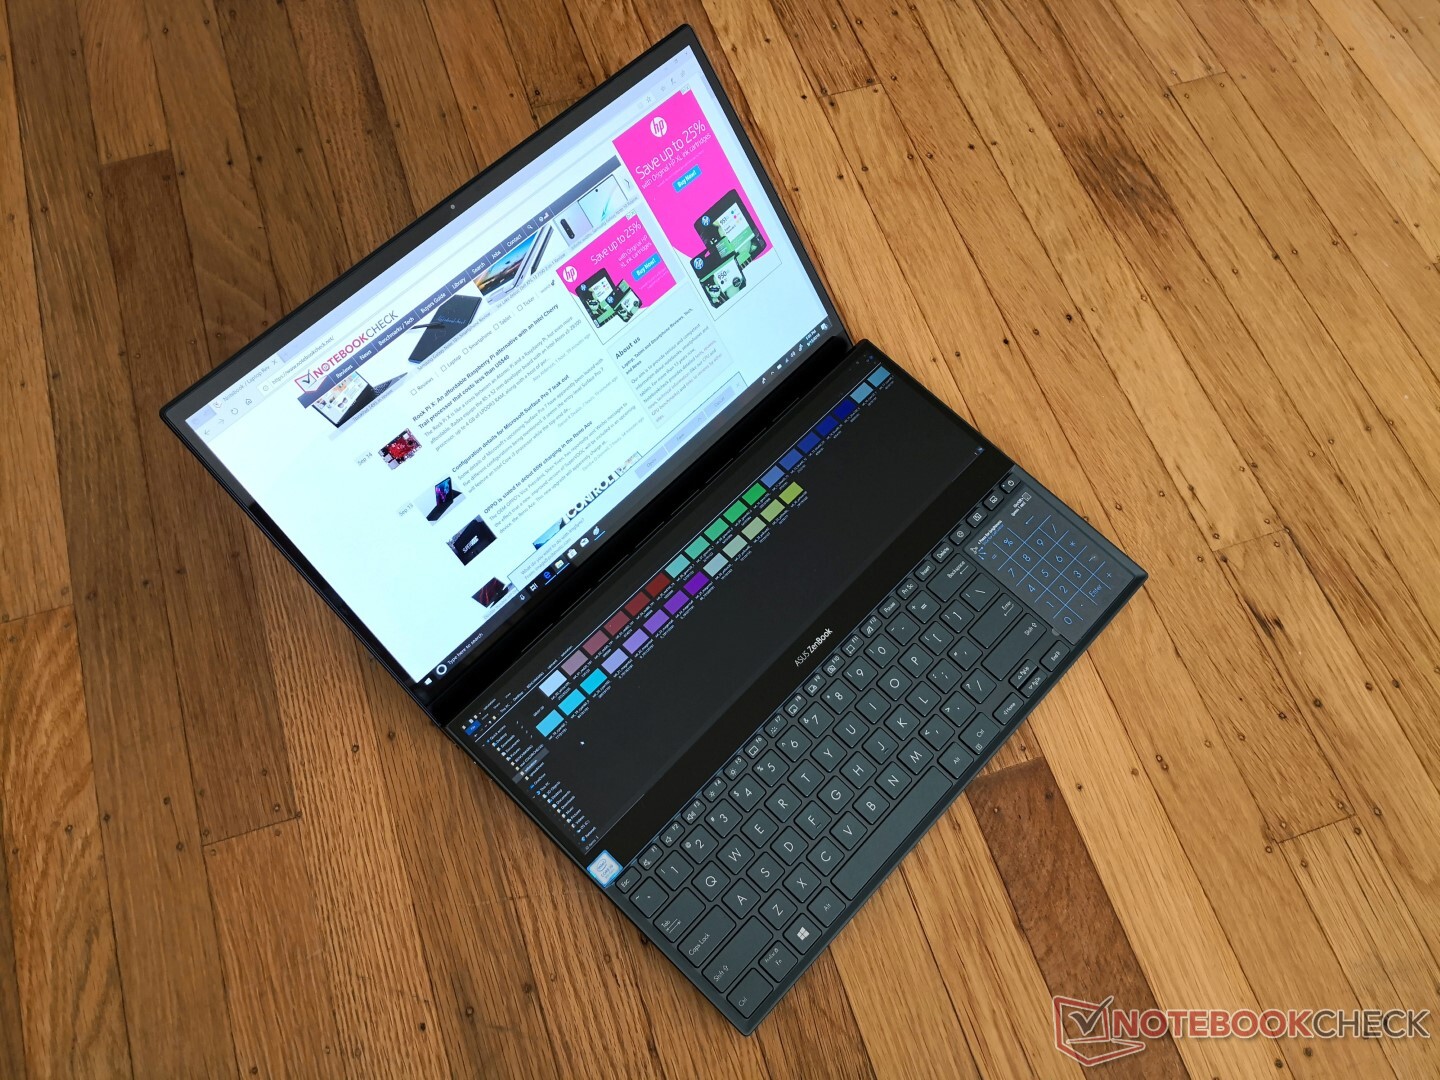
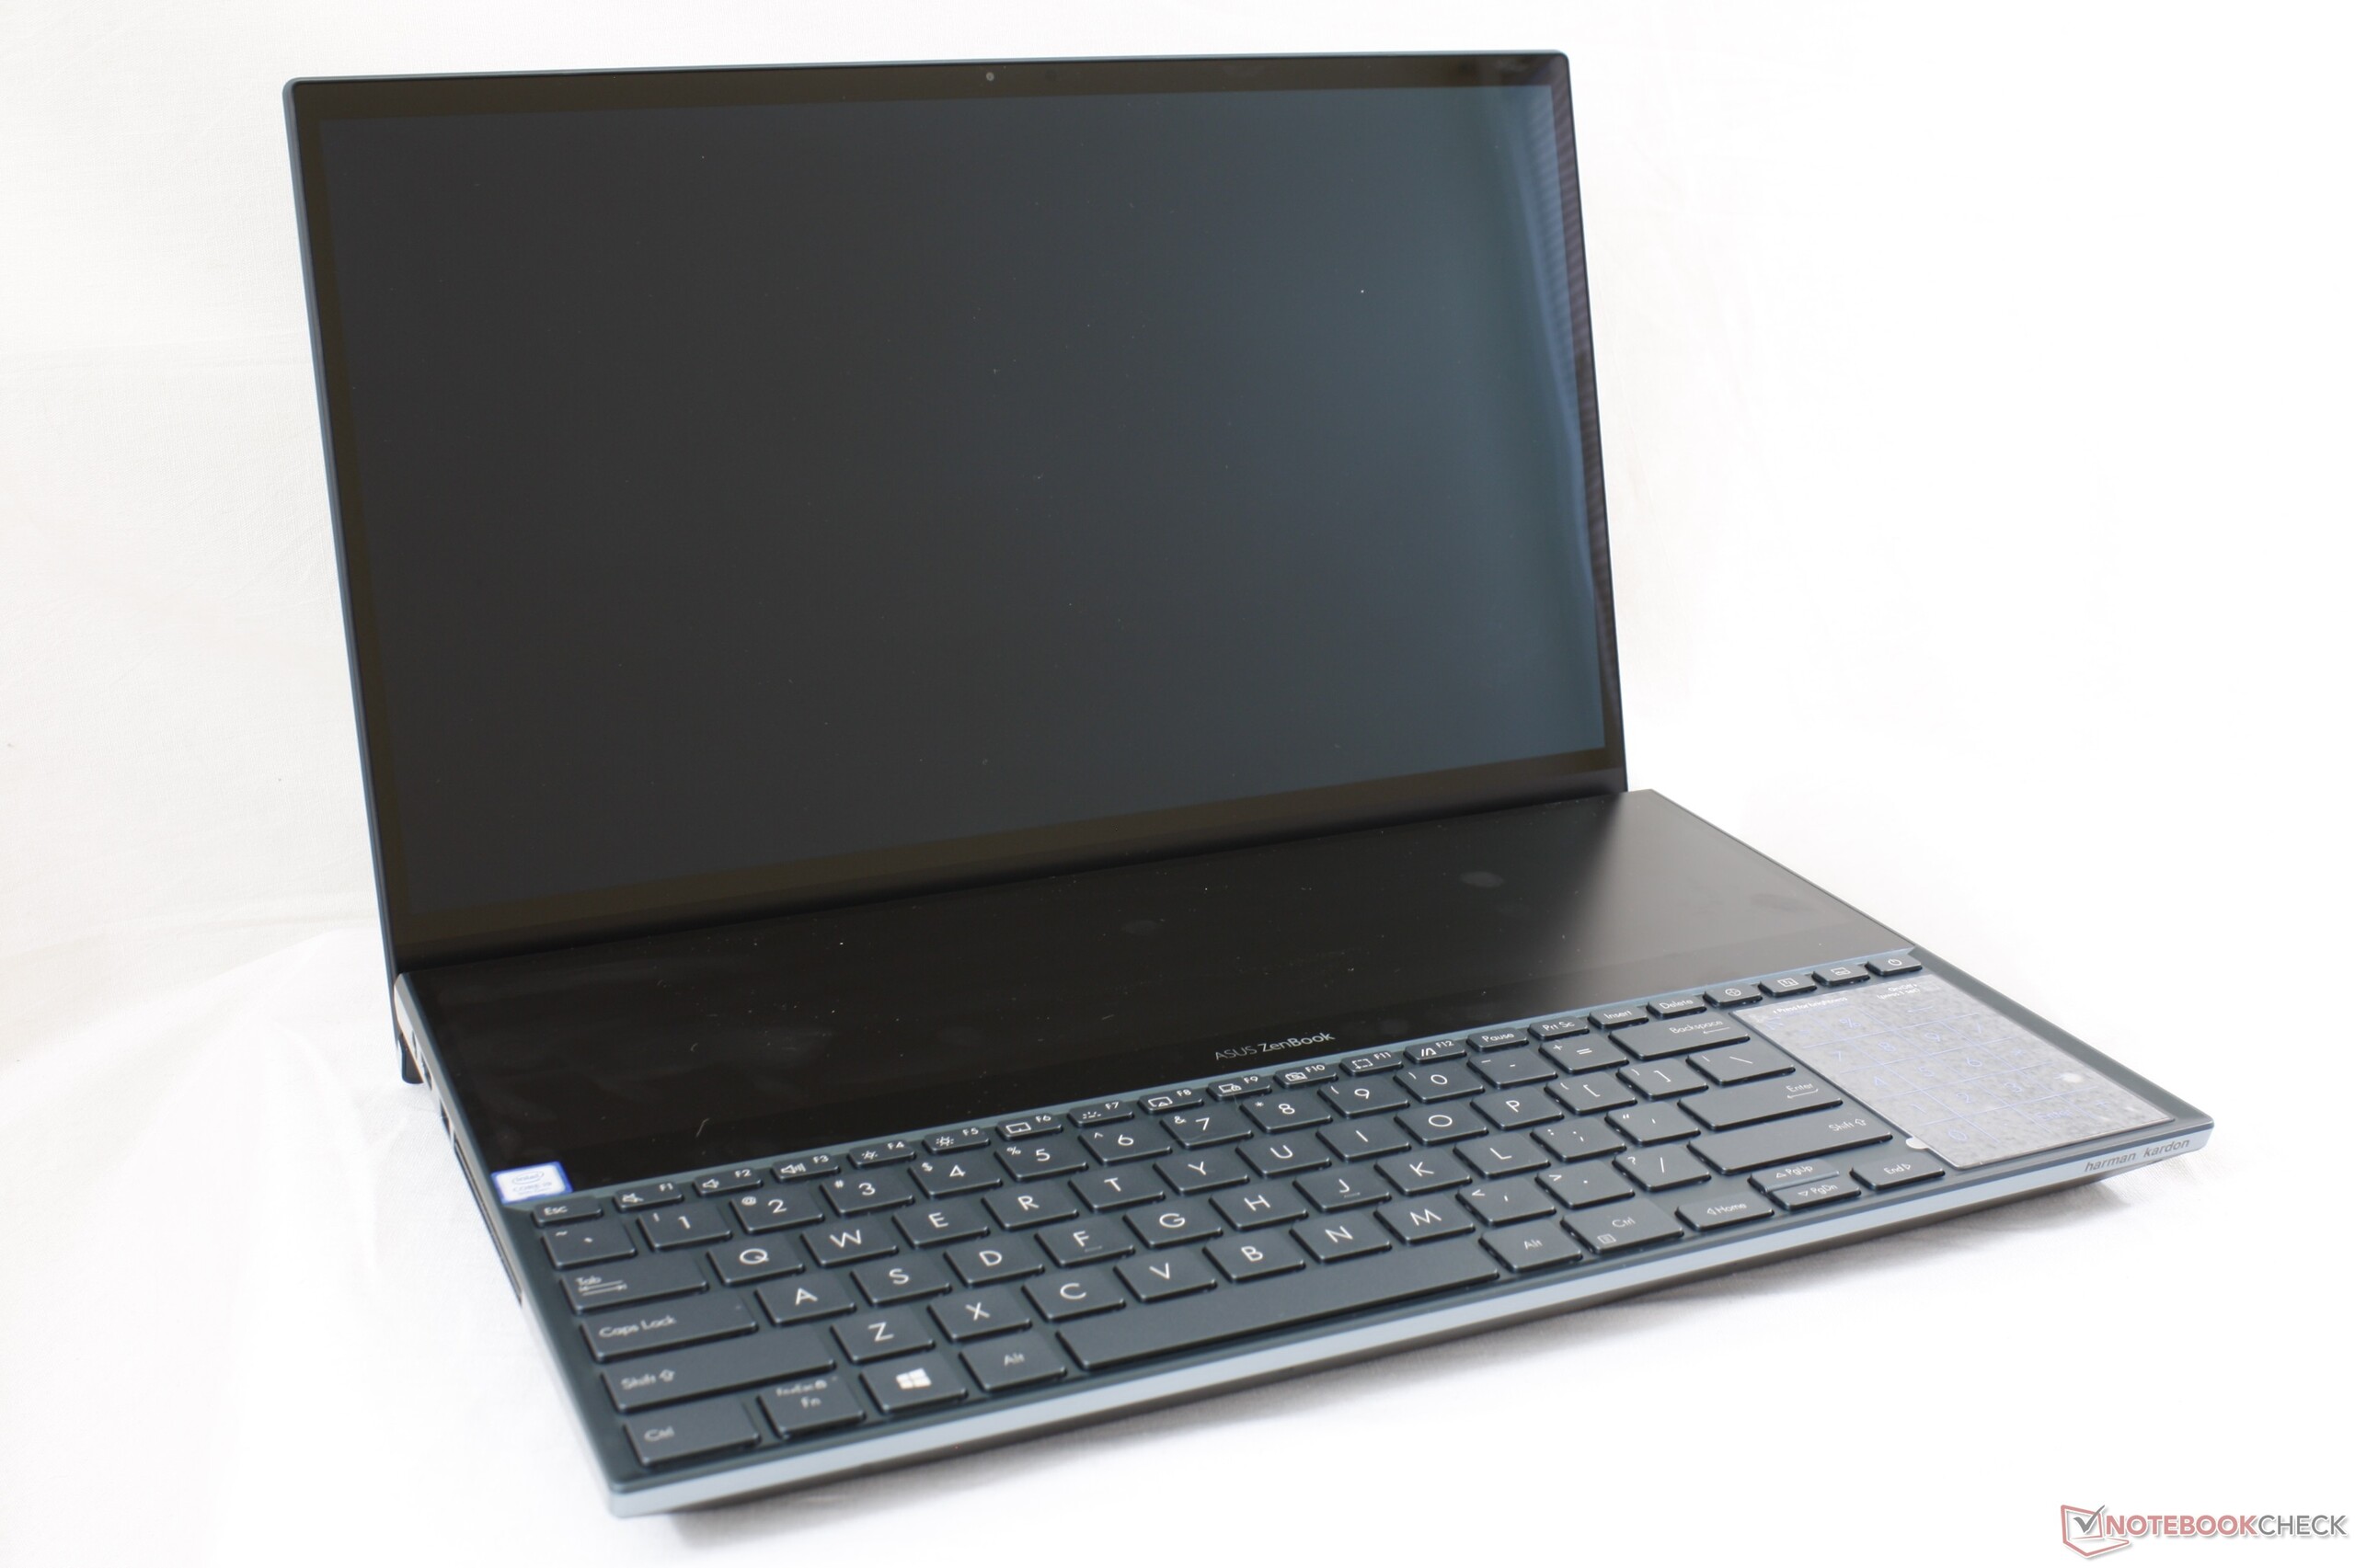
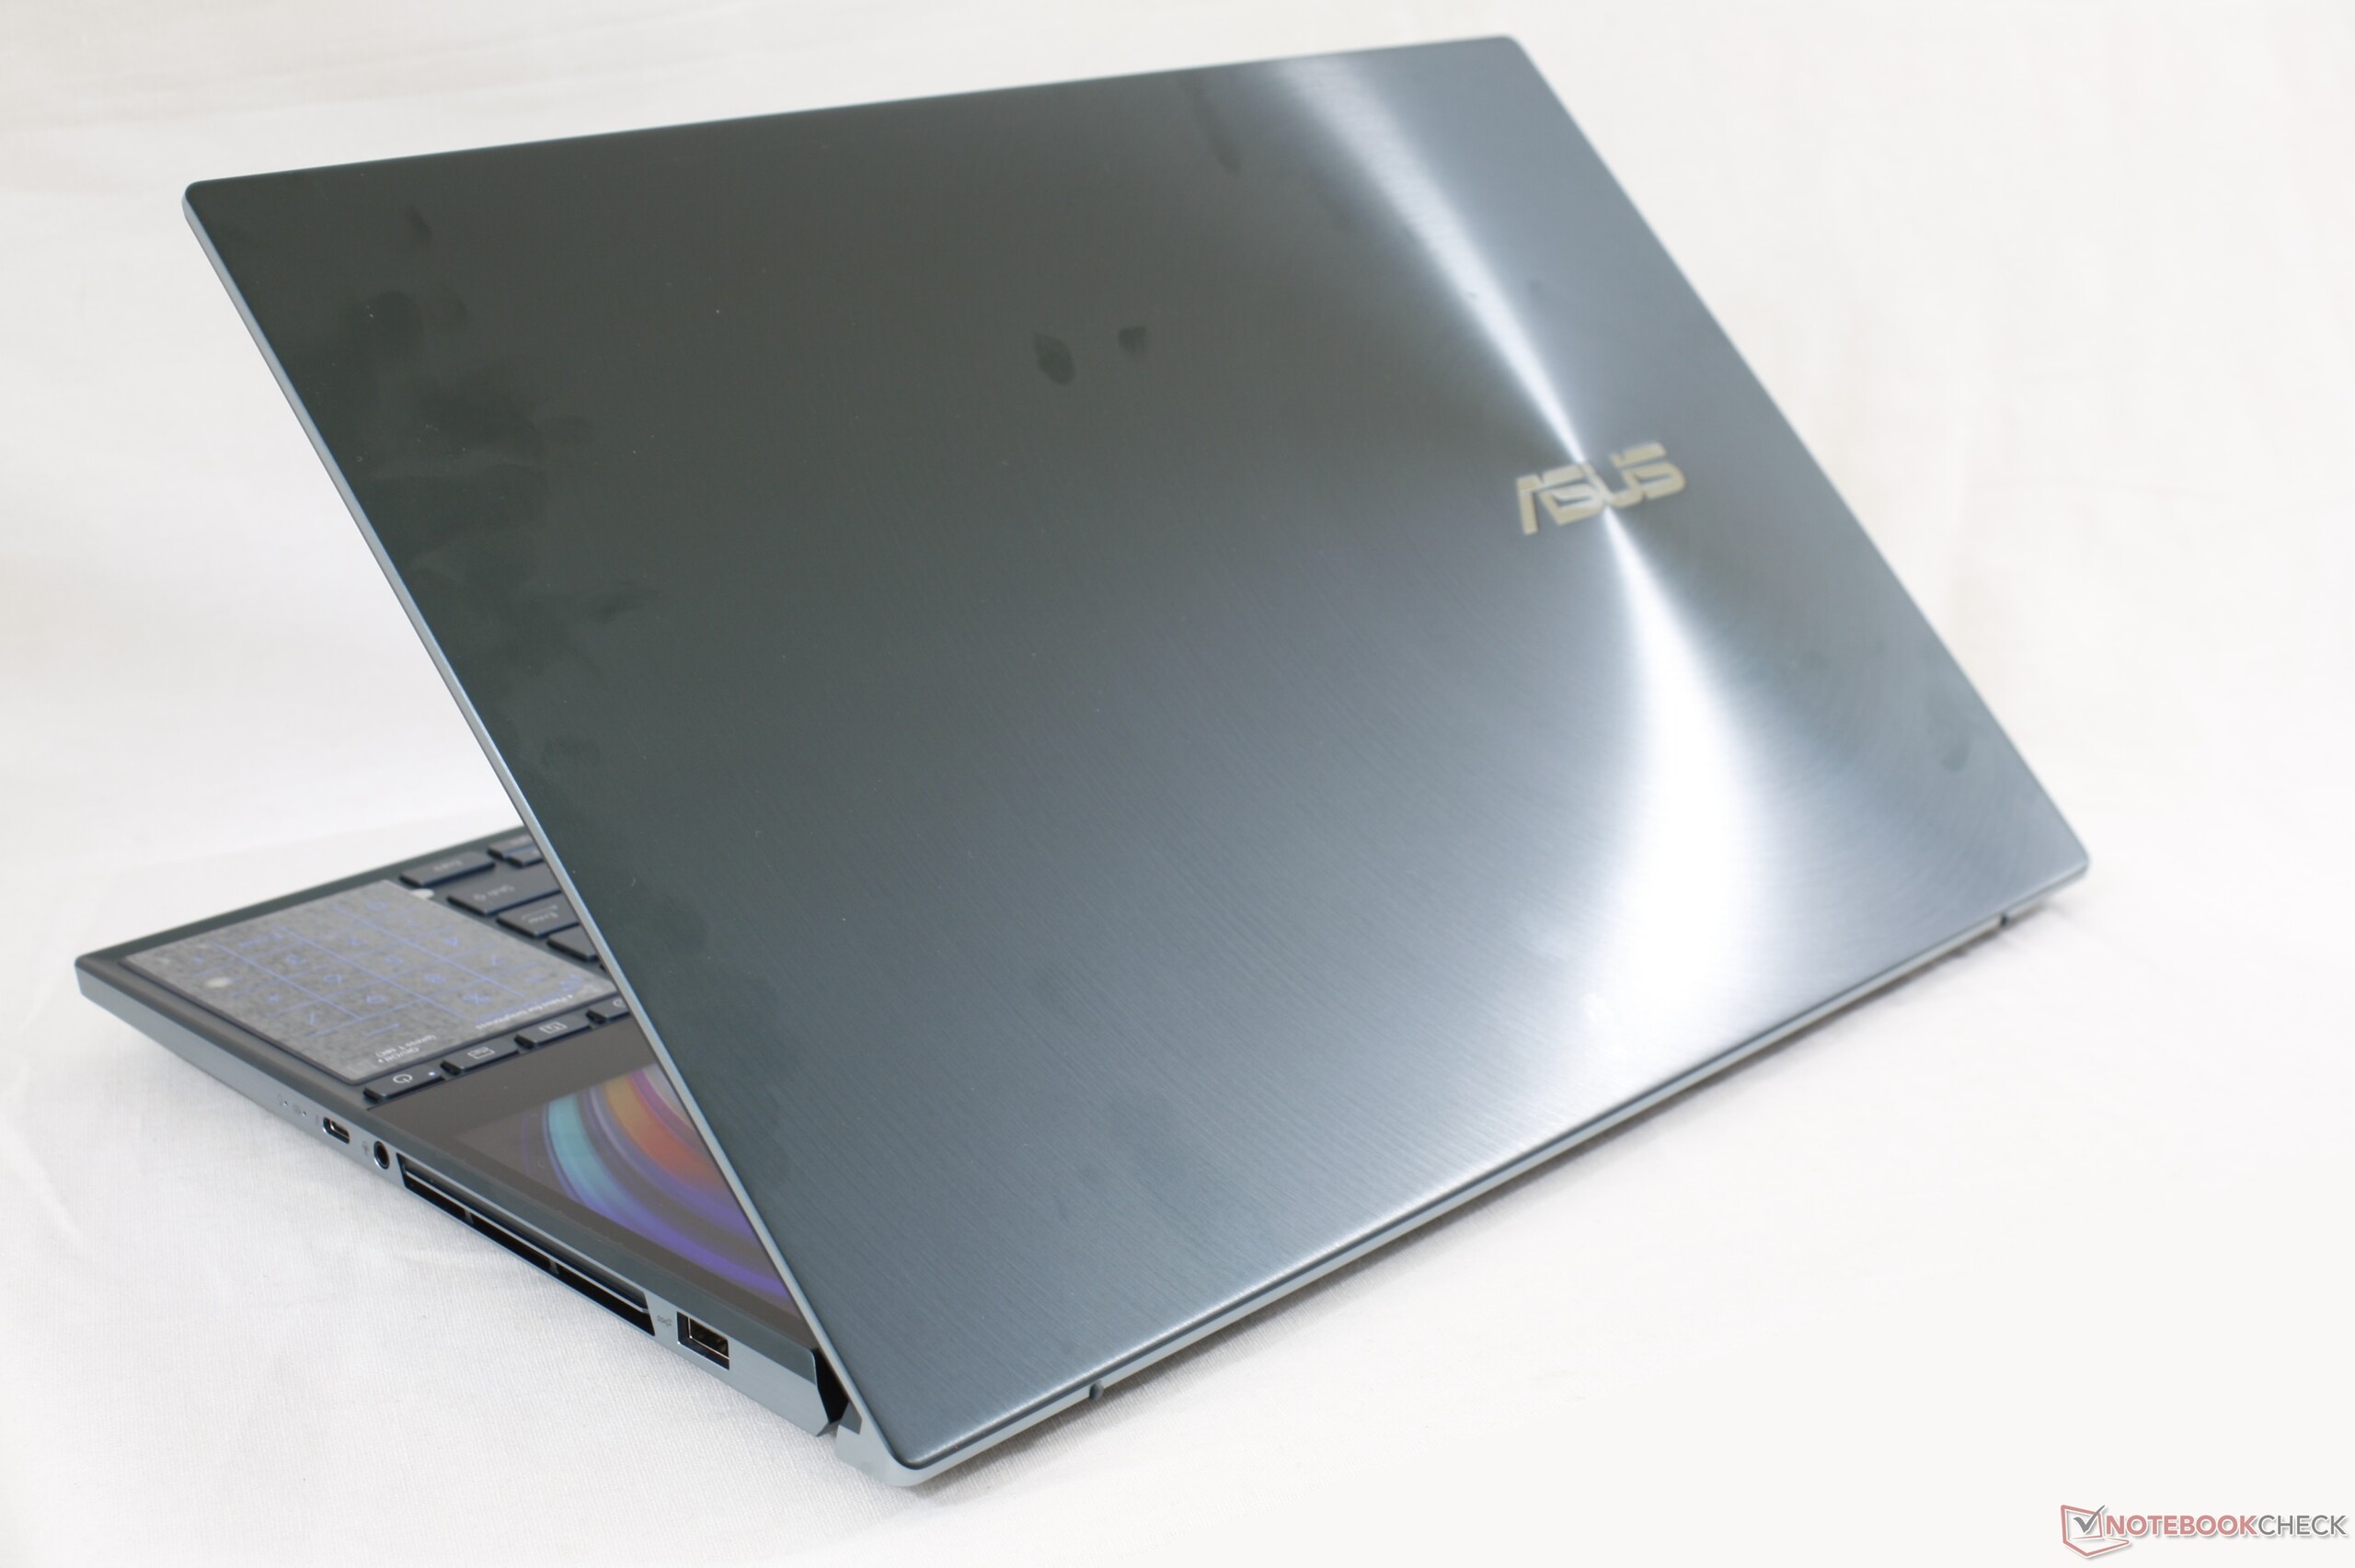
我们喜欢ZenBook Pro Duo UX581的独特概念及其代表意义。与2015 Razer Blade Pro,Asus ZenBook 15 UX534或 HP Omen X 2S 15的不成比例的第二屏幕相比,UX581的第二屏幕具有与主屏幕相同的宽度和PPI,因此更符合人体工程学。为了整合这么大的副屏,华硕不得不做出一些重大牺牲。最值得一提的是,UX581比典型的旗舰级超极本或多媒体笔记本电脑更厚,更重且价格更高,这使该系统更像是台式机的替代品,而不是真正的便携式产品。
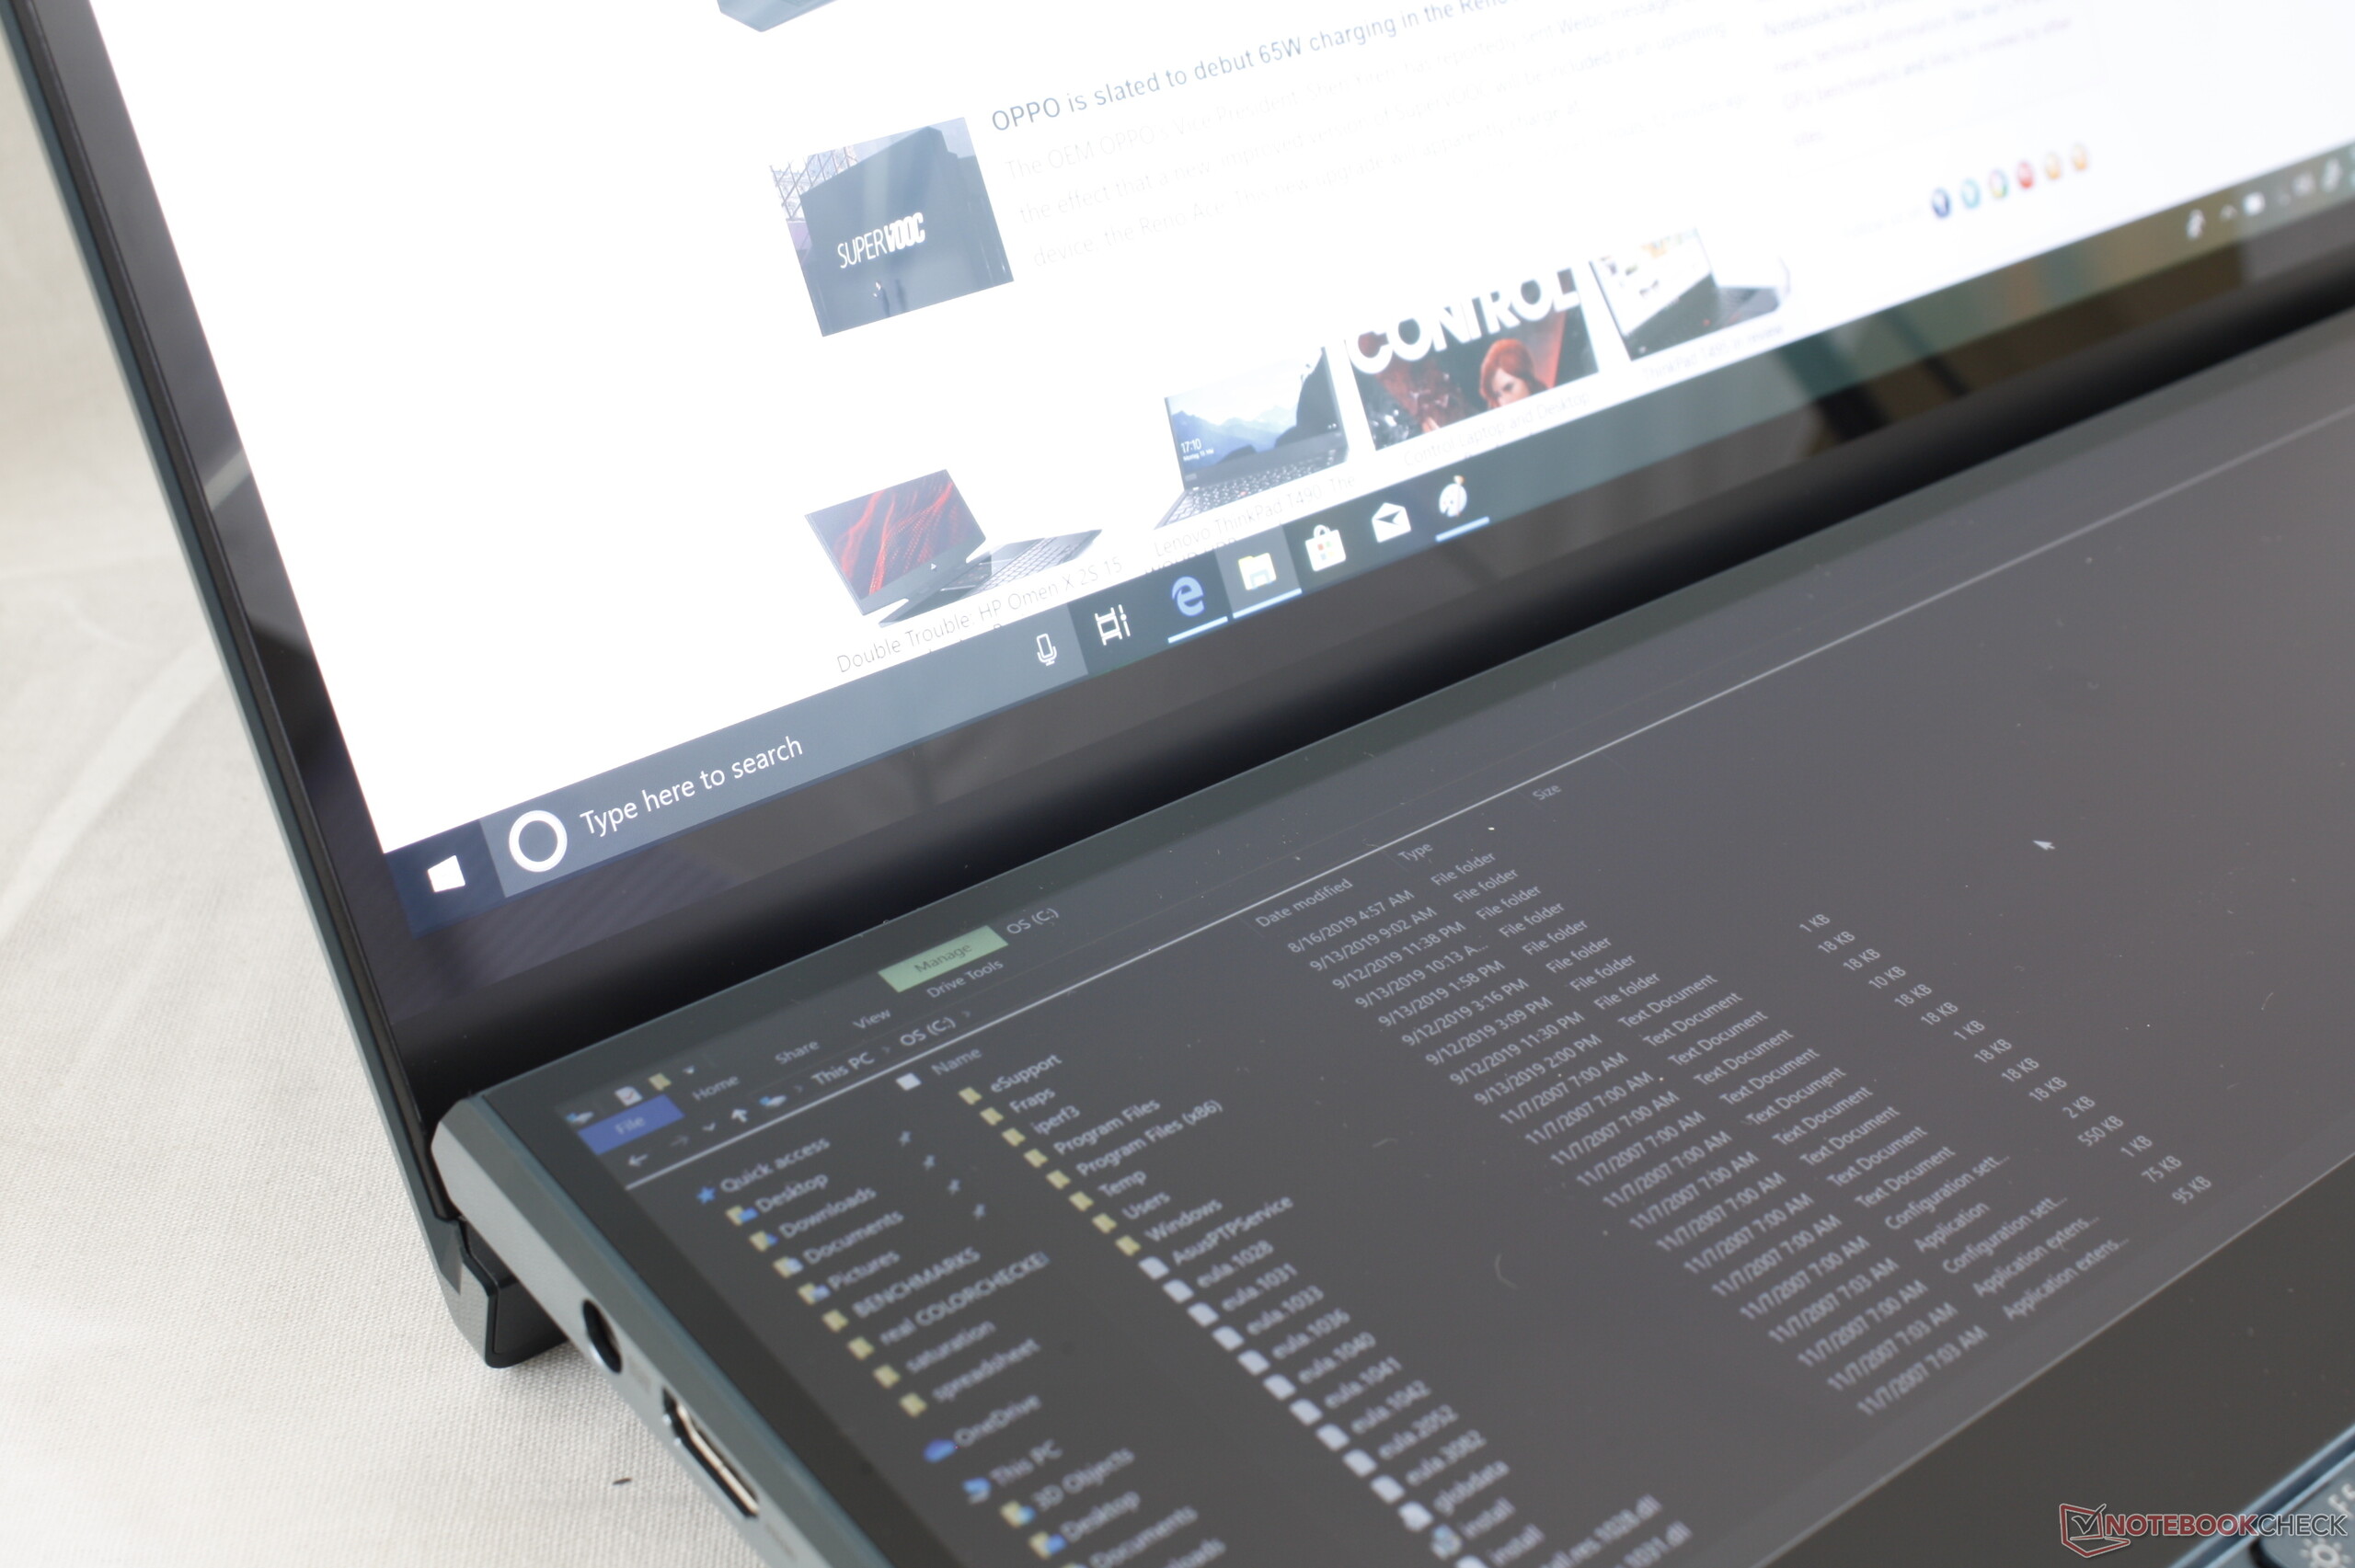
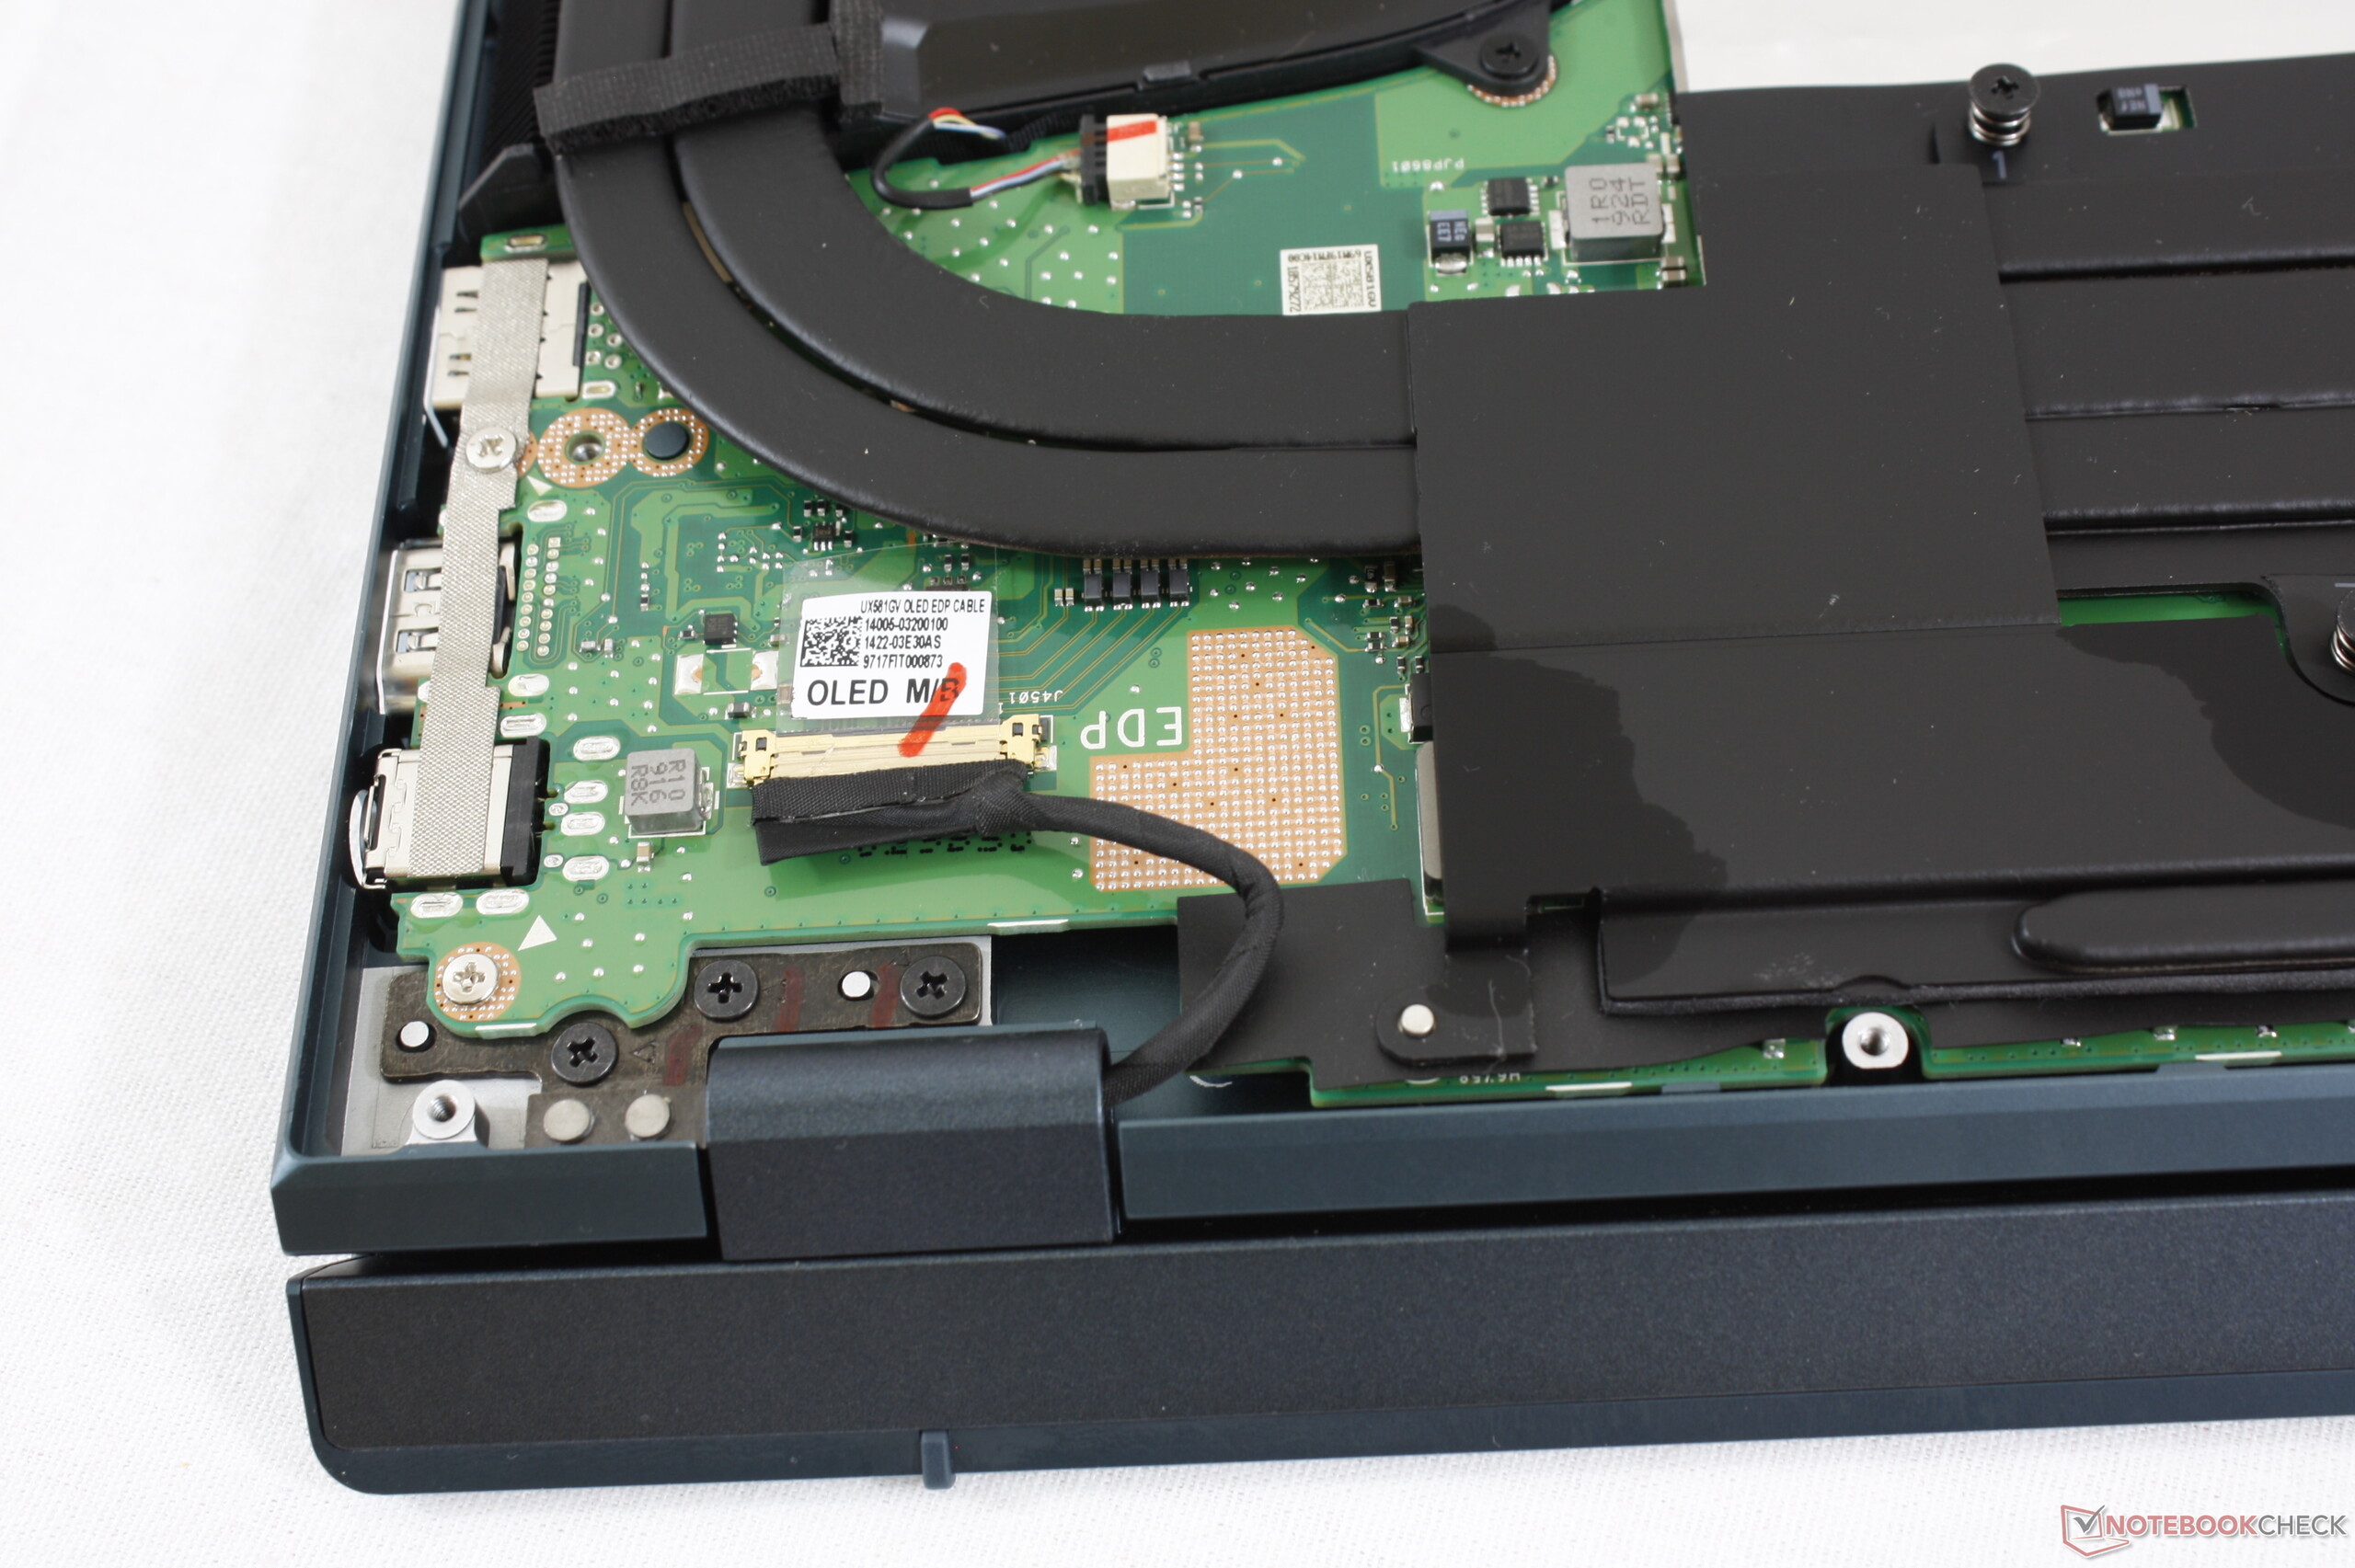
挑剔的专业人士可能讨厌的一个地方是两个屏幕之间的显示质量差异。具有超快响应时间的亮面OLED本质上与响应时间较慢的雾面IPS看起来截然不同。我们怀疑3840 x 1110分辨率OLED面板的供应有限,因此华硕别无选择,只能将IPS用于ScreenPad Plus。
其他缺点包括续航时间较短,只有单个存储插槽,缺少SD读取器和内容创造者或专业人士更喜欢的NumPad触感。理想情况下,将来的ZenBook Pro Duo更新版本将能够将第二个屏幕集成到大小和重量都完美的类似Razer Blade 15, XPS 15或 Spectre x360 15 Ultrabook的机身上,而不是做成中型游戏笔记本电脑的大小。在此之前,您将无法在UX581之外找到更好的双屏体验。
华硕ZenBook Pro Duo UX581是迄今为止最成熟的双屏笔记本电脑。它消除了原始ScreenPad的某些缺陷,从而提供了更自然的桌面体验。尽管如此,双屏笔记本电脑仍处于起步阶段,ZenBook Pro Duo系列肯定会在未来从更轻薄的设计中受益。
Asus ZenBook Pro Duo UX581GV
- 08/31/2022 v7 (old)
Allen Ngo
Price comparison

