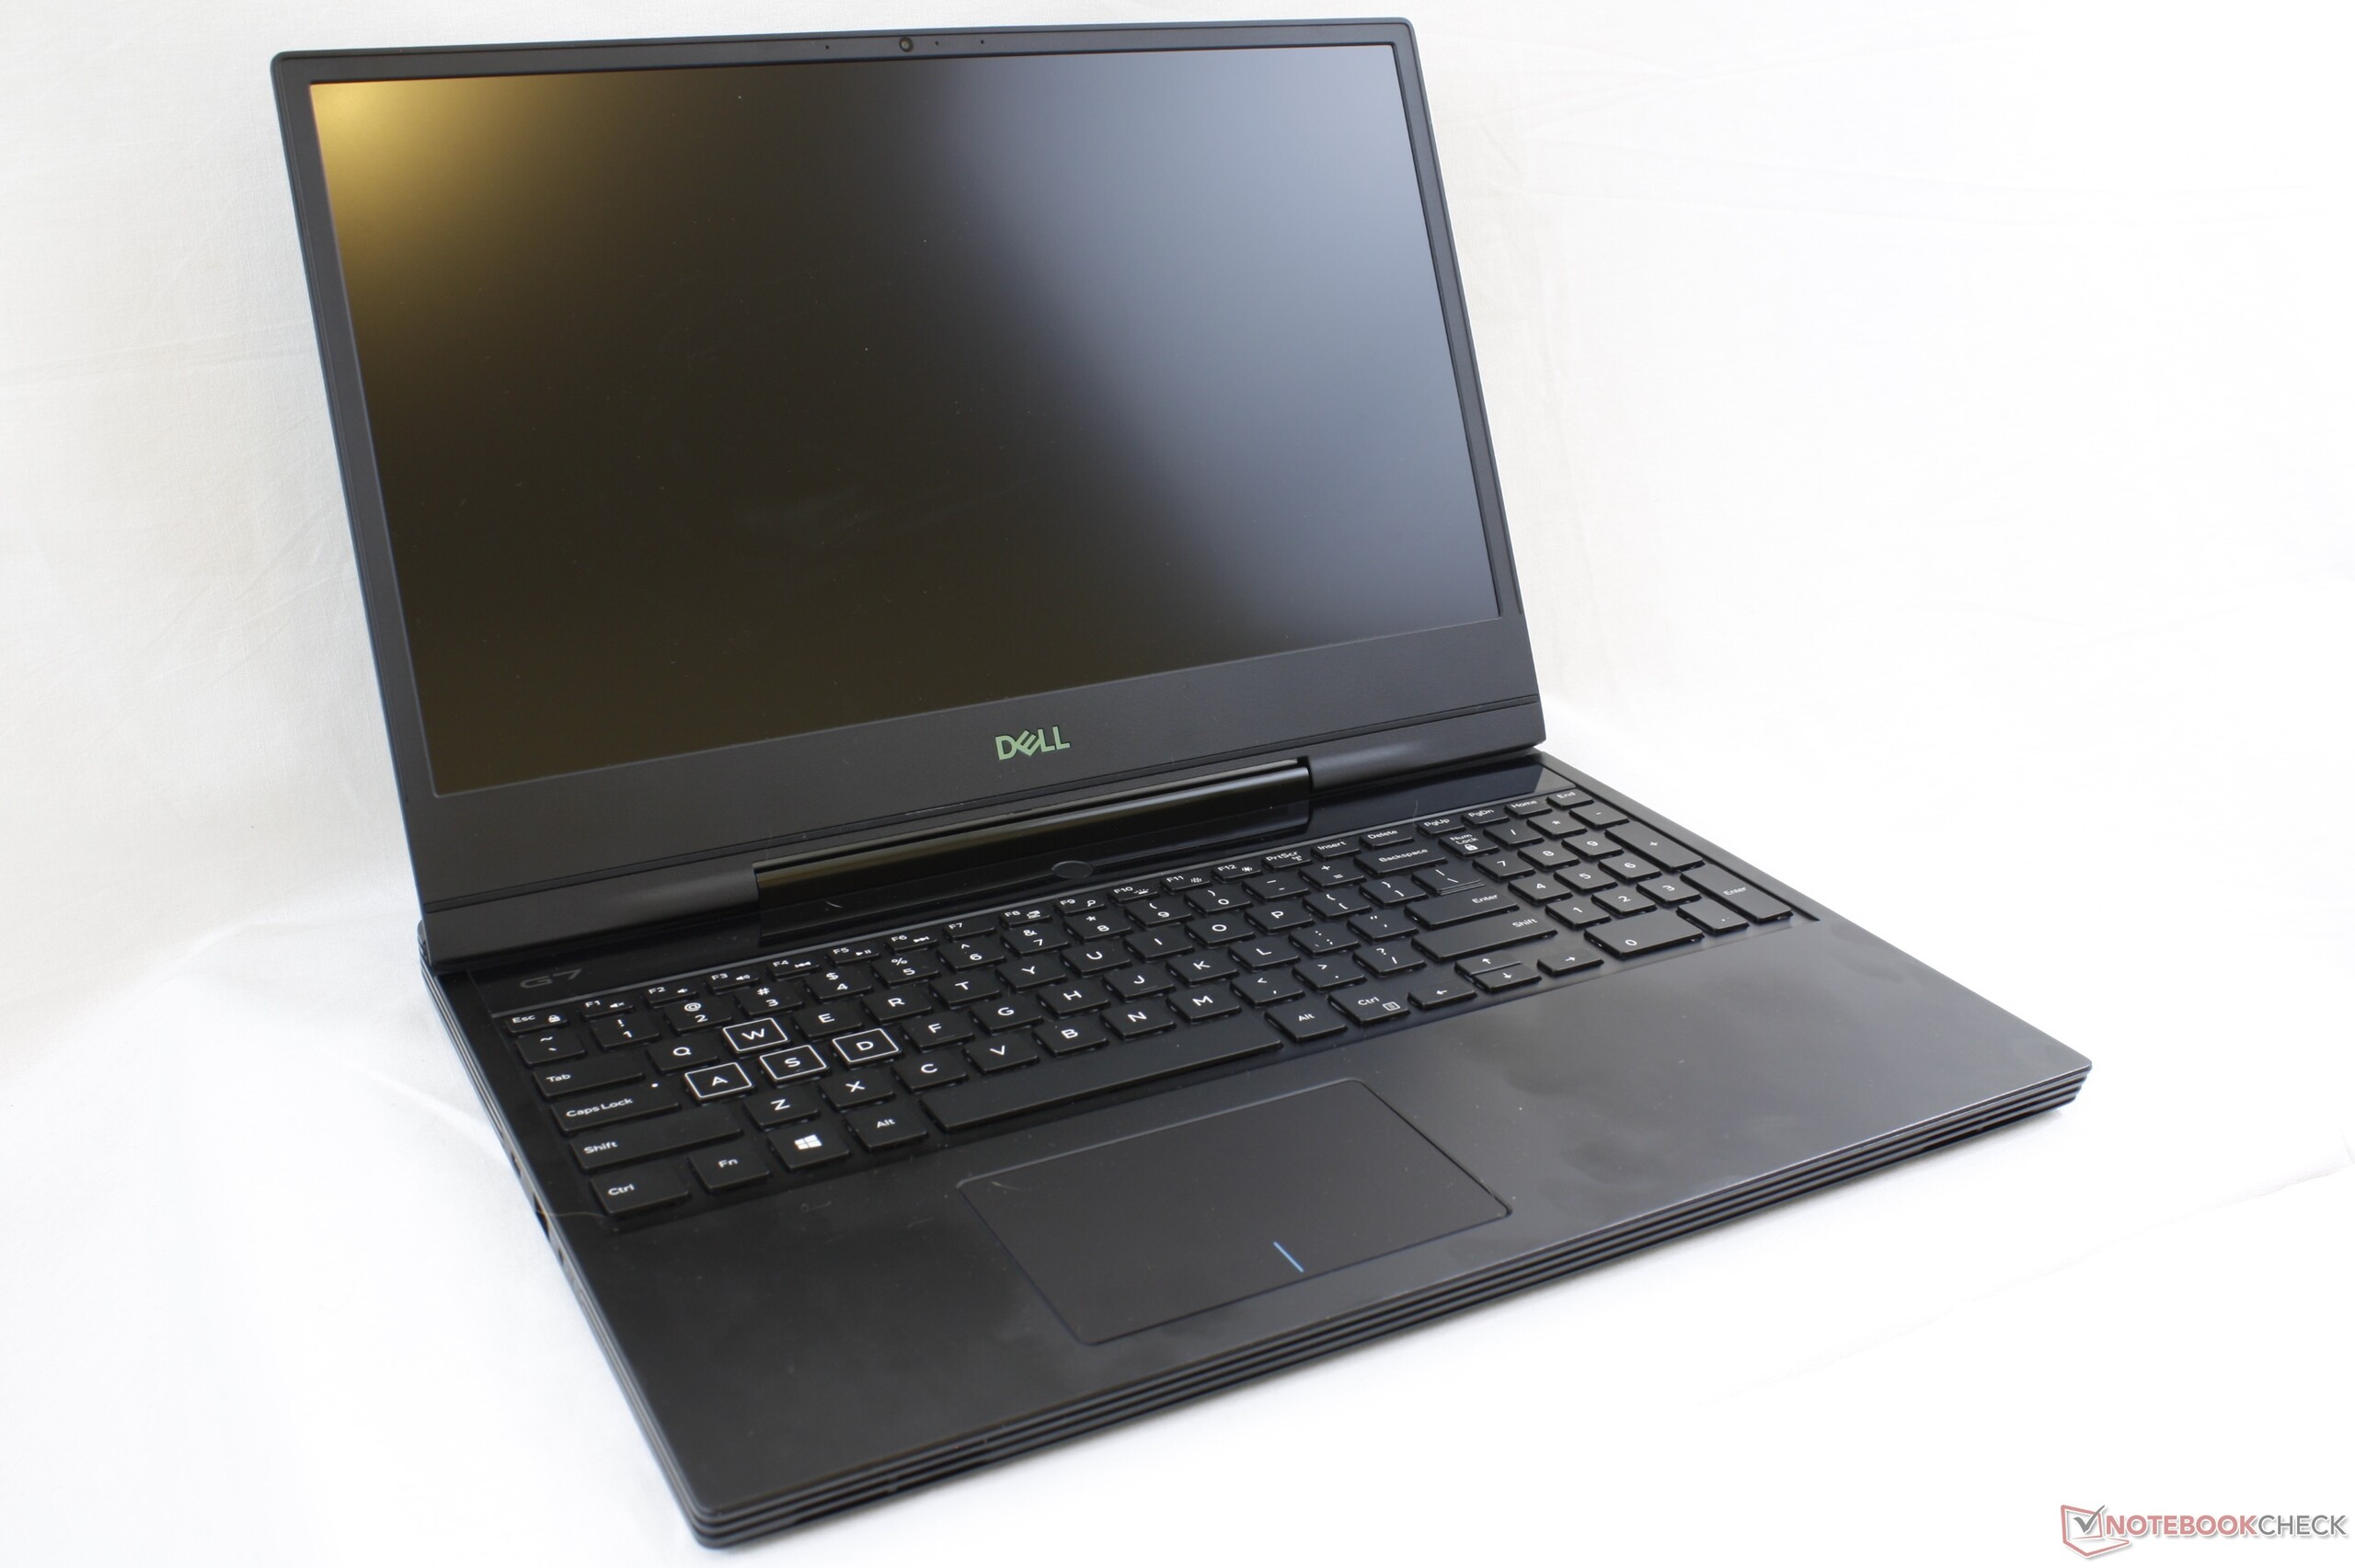
戴尔Dell G7 15 7590笔记本电脑评测:外星人的性能,更低的价格
Rating | Date | Model | Weight | Height | Size | Resolution | Price |
|---|---|---|---|---|---|---|---|
| 82.3 % v7 (old) | 02 / 2020 | Dell G7 7590 i7-9750H, GeForce RTX 2060 Mobile | 2.5 kg | 19.9 mm | 15.60" | 1920x1080 | |
| 80.8 % v7 (old) | MSI GL65 9SEK i7-9750H, GeForce RTX 2060 Mobile | 2.3 kg | 27.5 mm | 15.60" | 1920x1080 | ||
| 85.5 % v6 (old) | 08 / 2019 | Aorus 15-SA i7-9750H, GeForce GTX 1660 Ti Mobile | 2.1 kg | 24.4 mm | 15.60" | 1920x1080 | |
| 84.5 % v6 (old) | 08 / 2018 | Dell G7 15-7588 i7-8750H, GeForce GTX 1060 Max-Q | 2.6 kg | 24.95 mm | 15.60" | 1920x1080 |
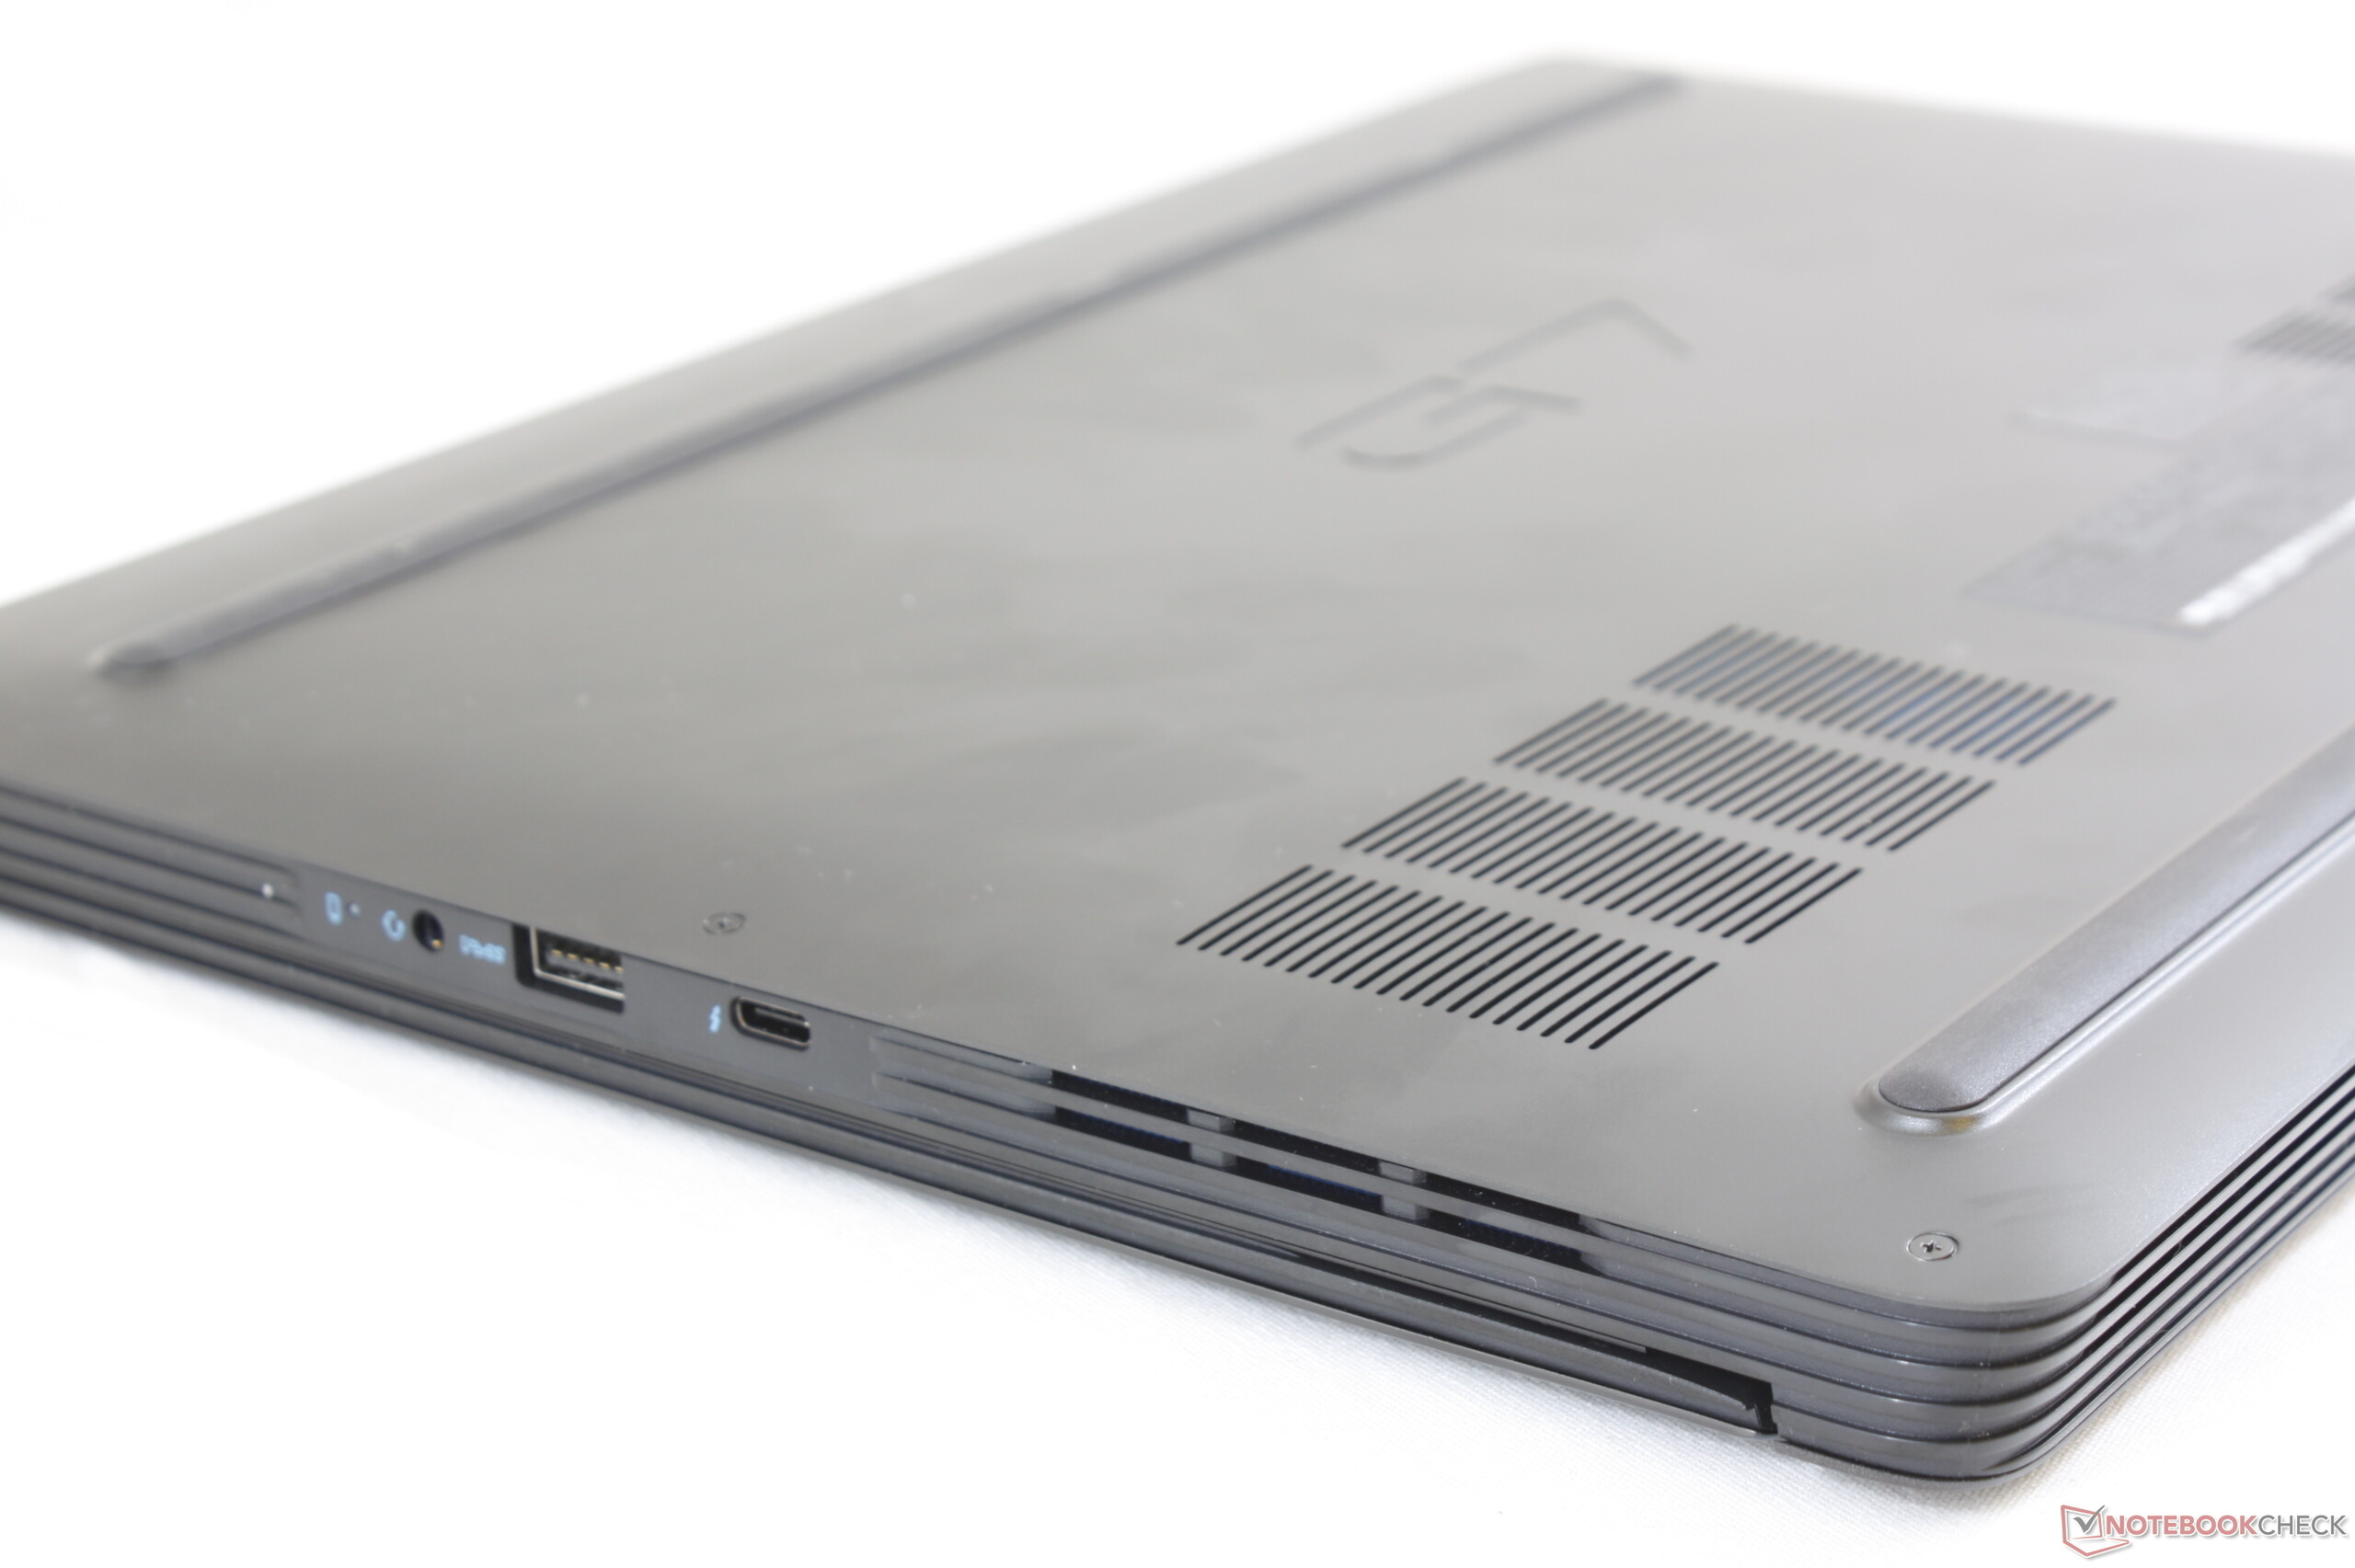
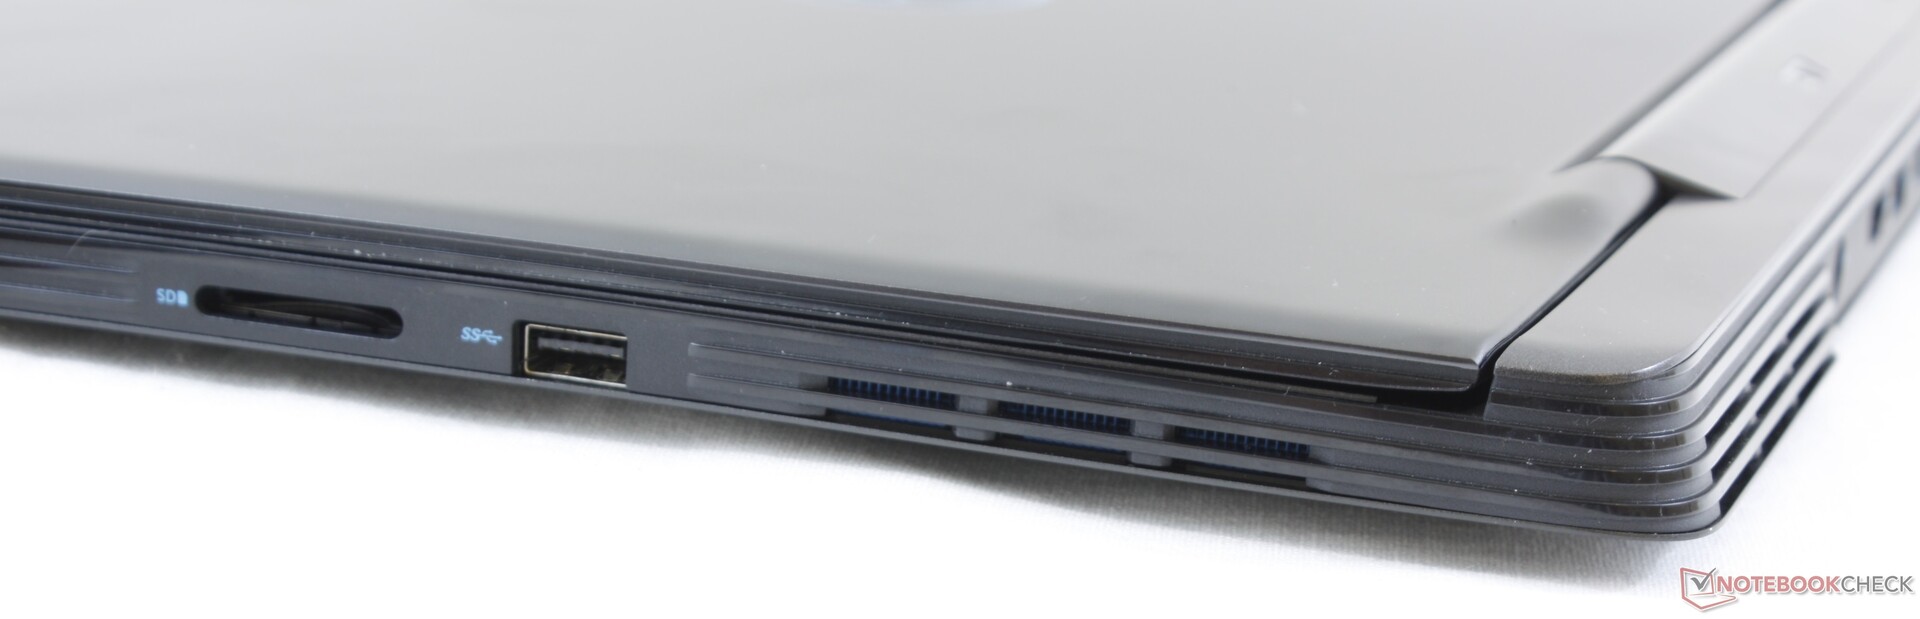
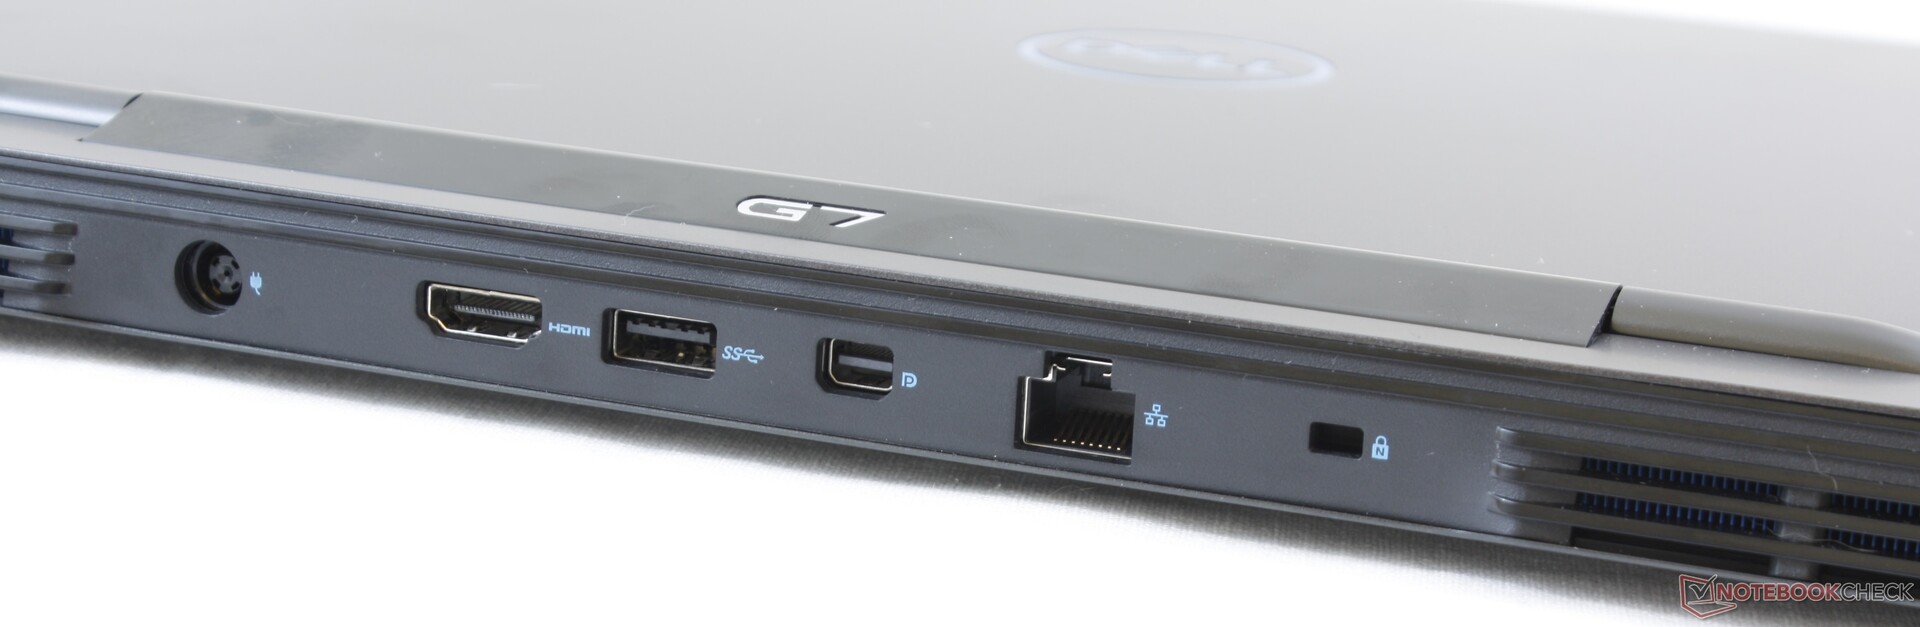
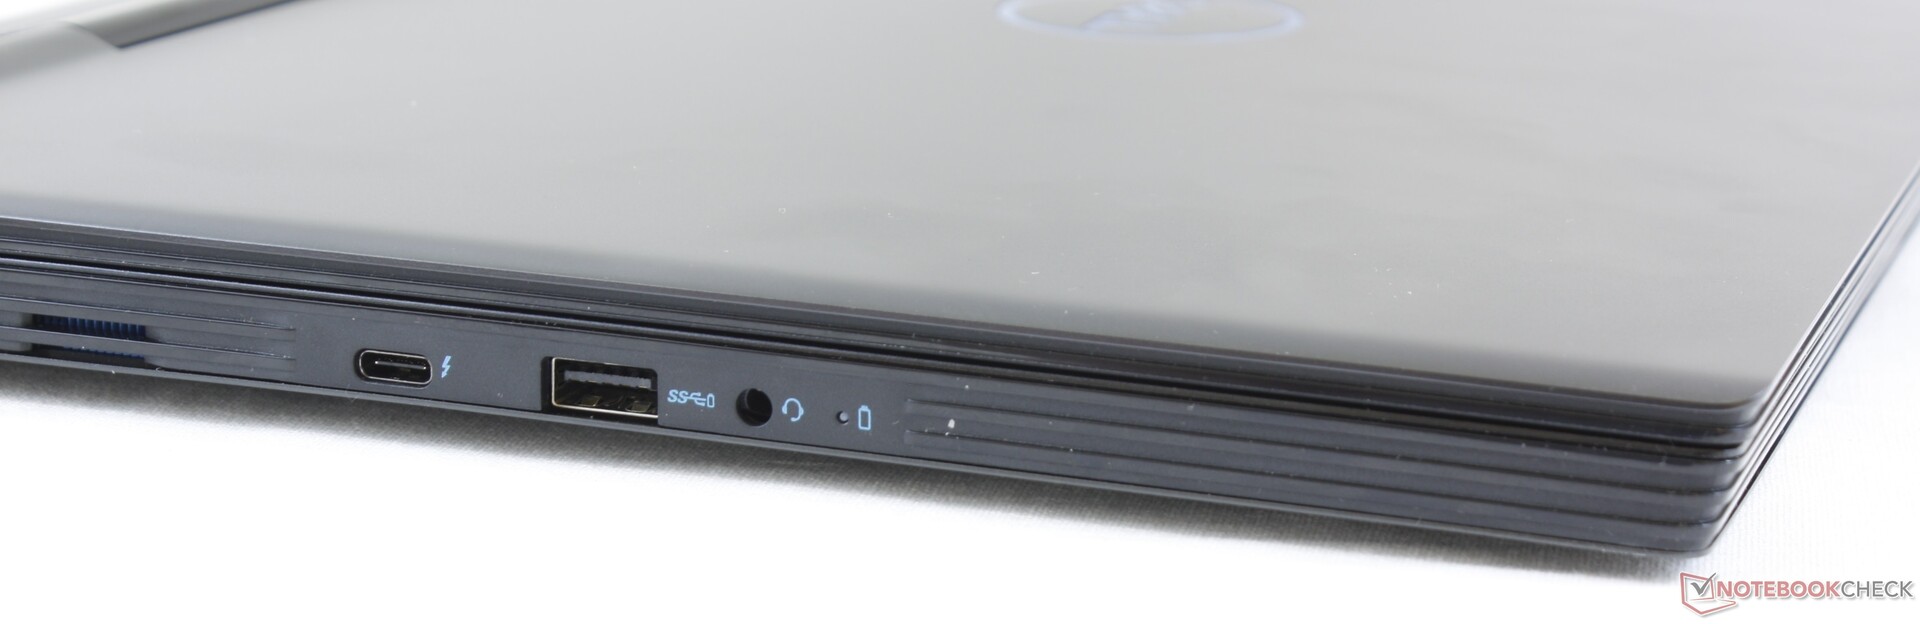
| SD Card Reader | |
| average JPG Copy Test (av. of 3 runs) | |
| Dell XPS 15 7590 i5 iGPU FHD (Toshiba Exceria Pro SDXC 64 GB UHS-II) | |
| Dell XPS 13 7390 2-in-1 Core i7 (Toshiba Exceria Pro M501 64 GB UHS-II) | |
| MSI GL65 9SEK (Toshiba Exceria Pro SDXC 64 GB UHS-II) | |
| Dell G7 7590 (Toshiba Exceria Pro SDXC 64 GB UHS-II) | |
| Dell G3 3590 (Toshiba Exceria Pro SDXC 64 GB UHS-II) | |
| maximum AS SSD Seq Read Test (1GB) | |
| Dell XPS 15 7590 i5 iGPU FHD (Toshiba Exceria Pro SDXC 64 GB UHS-II) | |
| Dell XPS 13 7390 2-in-1 Core i7 (Toshiba Exceria Pro M501 64 GB UHS-II) | |
| Dell G7 7590 (Toshiba Exceria Pro SDXC 64 GB UHS-II) | |
| Dell G3 3590 (Toshiba Exceria Pro SDXC 64 GB UHS-II) | |
| MSI GL65 9SEK (Toshiba Exceria Pro SDXC 64 GB UHS-II) | |
| Networking | |
| iperf3 transmit AX12 | |
| Lenovo Legion Y740-15ICHg | |
| Asus Strix Scar III G531GW-AZ062T | |
| Alienware m15 R2 P87F | |
| Dell G7 7590 | |
| Dell G3 3590 | |
| iperf3 receive AX12 | |
| Dell G7 7590 | |
| Alienware m15 R2 P87F | |
| Asus Strix Scar III G531GW-AZ062T | |
| Lenovo Legion Y740-15ICHg | |
| Dell G3 3590 | |
| |||||||||||||||||||||||||
Brightness Distribution: 91 %
Center on Battery: 330.5 cd/m²
Contrast: 465:1 (Black: 0.71 cd/m²)
ΔE ColorChecker Calman: 5.33 | ∀{0.5-29.43 Ø4.72}
calibrated: 3.63
ΔE Greyscale Calman: 6.7 | ∀{0.09-98 Ø4.97}
89.5% sRGB (Argyll 1.6.3 3D)
58.3% AdobeRGB 1998 (Argyll 1.6.3 3D)
65.3% AdobeRGB 1998 (Argyll 3D)
90% sRGB (Argyll 3D)
64.4% Display P3 (Argyll 3D)
Gamma: 2.24
CCT: 8035 K
| Dell G7 7590 AU Optronics B156HAN, IPS, 15.6", 1920x1080 | Lenovo Legion Y740-15ICHg LP156WFG-SPB2, IPS, 15.6", 1920x1080 | HP Omen X 2S 15-dg0075cl AU Optronics AUO82ED, IPS, 15.6", 1920x1080 | Asus Strix Scar III G531GW-AZ062T Sharp LQ156M1JW09 (SHP14D3), IPS, 15.6", 1920x1080 | Dell G3 3590 BOE NV15N3D, IPS, 15.6", 1920x1080 | Alienware m15 R2 P87F Sharp LQ156M1, IPS, 15.6", 1920x1080 | Dell G7 15-7588 LG Philips LGD053F, IPS, 15.6", 1920x1080 | |
|---|---|---|---|---|---|---|---|
| Display | 0% | 3% | 5% | -36% | 3% | -40% | |
| Display P3 Coverage (%) | 64.4 | 63.5 -1% | 66.2 3% | 66.2 3% | 40.13 -38% | 65.3 1% | 37.82 -41% |
| sRGB Coverage (%) | 90 | 92.4 3% | 92.3 3% | 97.1 8% | 59.8 -34% | 95.1 6% | 56.2 -38% |
| AdobeRGB 1998 Coverage (%) | 65.3 | 64.7 -1% | 67.2 3% | 67.6 4% | 41.47 -36% | 65.9 1% | 39.2 -40% |
| Response Times | -26% | -3% | 7% | -209% | 2% | -158% | |
| Response Time Grey 50% / Grey 80% * (ms) | 14 ? | 18.8 ? -34% | 15.2 ? -9% | 15 ? -7% | 46 ? -229% | 16.4 ? -17% | 38.8 ? -177% |
| Response Time Black / White * (ms) | 11.2 ? | 13.2 ? -18% | 10.8 ? 4% | 9 ? 20% | 32.4 ? -189% | 8.8 ? 21% | 26.8 ? -139% |
| PWM Frequency (Hz) | 250 ? | 200 ? | 23810 ? | ||||
| Screen | 24% | 26% | 21% | 0% | 14% | -21% | |
| Brightness middle (cd/m²) | 330.5 | 320.4 -3% | 324.8 -2% | 309 -7% | 276.2 -16% | 324.2 -2% | 250.9 -24% |
| Brightness (cd/m²) | 324 | 298 -8% | 316 -2% | 284 -12% | 261 -19% | 304 -6% | 246 -24% |
| Brightness Distribution (%) | 91 | 85 -7% | 84 -8% | 88 -3% | 86 -5% | 90 -1% | 89 -2% |
| Black Level * (cd/m²) | 0.71 | 0.42 41% | 0.26 63% | 0.42 41% | 0.24 66% | 0.38 46% | 0.34 52% |
| Contrast (:1) | 465 | 763 64% | 1249 169% | 736 58% | 1151 148% | 853 83% | 738 59% |
| Colorchecker dE 2000 * | 5.33 | 3.21 40% | 4.96 7% | 3.99 25% | 5.56 -4% | 5.01 6% | 7.34 -38% |
| Colorchecker dE 2000 max. * | 11.08 | 5.54 50% | 8.95 19% | 8.3 25% | 23.45 -112% | 12.7 -15% | 28.66 -159% |
| Colorchecker dE 2000 calibrated * | 3.63 | 2.36 35% | 3.23 11% | 1.12 69% | 5.23 -44% | 1.64 55% | 4.42 -22% |
| Greyscale dE 2000 * | 6.7 | 3.6 46% | 5 25% | 5.43 19% | 2.8 58% | 7.9 -18% | 6.8 -1% |
| Gamma | 2.24 98% | 2.27 97% | 2.21 100% | 2.57 86% | 2.37 93% | 2.35 94% | 2.164 102% |
| CCT | 8035 81% | 6503 100% | 7742 84% | 7767 84% | 6710 97% | 8455 77% | 6780 96% |
| Color Space (Percent of AdobeRGB 1998) (%) | 58.3 | 59 1% | 59.8 3% | 63 8% | 37.8 -35% | 60.8 4% | 36 -38% |
| Color Space (Percent of sRGB) (%) | 89.5 | 92 3% | 91.8 3% | 97 8% | 59 -34% | 95.5 7% | 56 -37% |
| Total Average (Program / Settings) | -1% /
13% | 9% /
18% | 11% /
16% | -82% /
-33% | 6% /
11% | -73% /
-42% |
* ... smaller is better
Display Response Times
| ↔ Response Time Black to White | ||
|---|---|---|
| 11.2 ms ... rise ↗ and fall ↘ combined | ↗ 6 ms rise | 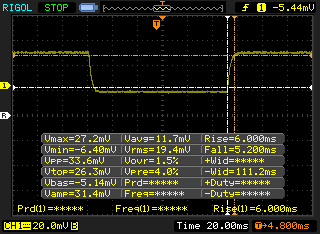 |
| ↘ 5.2 ms fall | ||
| The screen shows good response rates in our tests, but may be too slow for competitive gamers. In comparison, all tested devices range from 0.1 (minimum) to 240 (maximum) ms. » 30 % of all devices are better. This means that the measured response time is better than the average of all tested devices (19.8 ms). | ||
| ↔ Response Time 50% Grey to 80% Grey | ||
| 14 ms ... rise ↗ and fall ↘ combined | ↗ 7.2 ms rise | 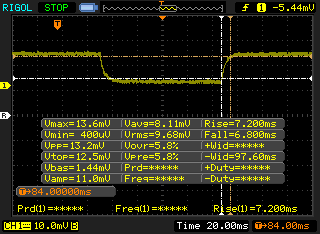 |
| ↘ 6.8 ms fall | ||
| The screen shows good response rates in our tests, but may be too slow for competitive gamers. In comparison, all tested devices range from 0.165 (minimum) to 636 (maximum) ms. » 28 % of all devices are better. This means that the measured response time is better than the average of all tested devices (31 ms). | ||
Screen Flickering / PWM (Pulse-Width Modulation)
| Screen flickering / PWM not detected | 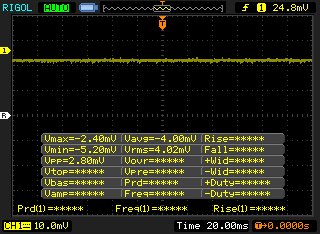 | ||
In comparison: 52 % of all tested devices do not use PWM to dim the display. If PWM was detected, an average of 7778 (minimum: 5 - maximum: 343500) Hz was measured. | |||
| Cinebench R15 | |
| CPU Single 64Bit | |
| Schenker XMG Ultra 15 Turing | |
| HP Omen 17-cb0020ng | |
| Alienware m17 P37E | |
| Average Intel Core i7-9750H (170 - 194, n=82) | |
| Dell XPS 13 7390 2-in-1 Core i7 | |
| Dell G3 3590 | |
| Dell G7 7590 | |
| Razer Blade 15 GTX 1660 Ti | |
| Alienware m15 P79F | |
| Lenovo Legion Y730-15ICH i5-8300H | |
| Asus FX503VM-EH73 | |
| Asus ROG Zephyrus G15 GA502DU | |
| CPU Multi 64Bit | |
| Schenker XMG Ultra 15 Turing | |
| HP Omen 17-cb0020ng | |
| Dell G7 7590 | |
| Alienware m17 P37E | |
| Alienware m15 P79F | |
| Average Intel Core i7-9750H (952 - 1306, n=85) | |
| Razer Blade 15 GTX 1660 Ti | |
| Dell XPS 13 7390 2-in-1 Core i7 | |
| Lenovo Legion Y730-15ICH i5-8300H | |
| Asus ROG Zephyrus G15 GA502DU | |
| Dell G3 3590 | |
| Asus FX503VM-EH73 | |
| PCMark 8 Home Score Accelerated v2 | 4317 points | |
| PCMark 8 Work Score Accelerated v2 | 5558 points | |
| PCMark 10 Score | 5368 points | |
Help | ||
| Dell G7 7590 Toshiba BG3 KBG30ZMS256G | Lenovo Legion Y740-15ICHg Samsung SSD PM981 MZVLB256HAHQ | HP Omen X 2S 15-dg0075cl WDC PC SN720 SDAPNTW-1T00 | Asus Strix Scar III G531GW-AZ062T Intel SSD 660p SSDPEKNW512G8 | Dell G3 3590 Toshiba BG4 KBG40ZNS128G | |
|---|---|---|---|---|---|
| AS SSD | 301% | 436% | 118% | -26% | |
| Seq Read (MB/s) | 1013 | 1953 93% | 2105 108% | 1163 15% | 1174 16% |
| Seq Write (MB/s) | 203.8 | 1629 699% | 2493 1123% | 919 351% | 186 -9% |
| 4K Read (MB/s) | 29.57 | 33.2 12% | 25.01 -15% | 48.88 65% | 34.01 15% |
| 4K Write (MB/s) | 71.4 | 88.1 23% | 108.7 52% | 90.1 26% | 69.4 -3% |
| 4K-64 Read (MB/s) | 332.1 | 757 128% | 1604 383% | 323.8 -2% | 424 28% |
| 4K-64 Write (MB/s) | 152.9 | 1501 882% | 1593 942% | 403.8 164% | 68.8 -55% |
| Access Time Read * (ms) | 0.183 | 0.077 58% | 0.046 75% | 0.24 -31% | 0.168 8% |
| Access Time Write * (ms) | 0.248 | 0.043 83% | 0.102 59% | 0.046 81% | 0.94 -279% |
| Score Read (Points) | 463 | 985 113% | 1840 297% | 489 6% | 575 24% |
| Score Write (Points) | 245 | 1752 615% | 1951 696% | 586 139% | 157 -36% |
| Score Total (Points) | 913 | 3230 254% | 4743 419% | 1332 46% | 987 8% |
| Copy ISO MB/s (MB/s) | 263.6 | 1872 610% | 2250 754% | 1269 381% | 215.7 -18% |
| Copy Program MB/s (MB/s) | 213.8 | 478.2 124% | 896 319% | 452.8 112% | 108.2 -49% |
| Copy Game MB/s (MB/s) | 188 | 1165 520% | 1854 886% | 755 302% | 165.9 -12% |
* ... smaller is better

| 3DMark 11 | |
| 1280x720 Performance GPU | |
| Asus ROG G703GXR | |
| Alienware m15 R2 P87F | |
| HP Omen X 17-ap0xx | |
| MSI RTX 2060 Gaming Z 6G | |
| Alienware 17 R5 | |
| Average NVIDIA GeForce RTX 2060 Mobile (19143 - 24662, n=40) | |
| Dell G7 7590 | |
| Razer Blade 15 GTX 1660 Ti | |
| HP Omen X 2S 15-dg0075cl | |
| Dell G5 15 5587 | |
| Dell G3 3590 | |
| Asus Zephyrus S GX531GM | |
| 1280x720 Performance Combined | |
| MSI RTX 2060 Gaming Z 6G | |
| HP Omen X 2S 15-dg0075cl | |
| Asus ROG G703GXR | |
| Dell G7 7590 | |
| Average NVIDIA GeForce RTX 2060 Mobile (1107 - 14726, n=40) | |
| Razer Blade 15 GTX 1660 Ti | |
| Alienware 17 R5 | |
| Alienware m15 R2 P87F | |
| HP Omen X 17-ap0xx | |
| Dell G3 3590 | |
| Dell G5 15 5587 | |
| Asus Zephyrus S GX531GM | |
| 3DMark 11 Performance | 17814 points | |
| 3DMark Cloud Gate Standard Score | 36639 points | |
| 3DMark Fire Strike Score | 14249 points | |
| 3DMark Time Spy Score | 6192 points | |
Help | ||
| Shadow of the Tomb Raider - 1920x1080 Highest Preset AA:T | |
| MSI RTX 2060 Gaming Z 6G | |
| Alienware m15 R2 P87F | |
| Alienware m15 P79F | |
| Asus Strix Scar III G531GW-AZ062T | |
| MSI GL65 9SEK | |
| Dell G7 7590 | |
| Average NVIDIA GeForce RTX 2060 Mobile (54 - 86, n=22) | |
| Razer Blade 15 GTX 1660 Ti | |
| Asus ROG Zephyrus G15 GA502DU | |
| Asus Zephyrus S GX531GM | |
| The Witcher 3 - 1920x1080 Ultra Graphics & Postprocessing (HBAO+) | |
| Asus ROG G703GXR | |
| HP Omen 17-cb0020ng | |
| Alienware m15 R2 P87F | |
| Alienware m17 P37E | |
| Schenker XMG Ultra 15 Turing | |
| MSI RTX 2060 Gaming Z 6G | |
| Asus Strix Scar III G531GW-AZ062T | |
| HP Omen X 17-ap0xx | |
| Alienware m15 P79F | |
| Alienware 15 R3 Max-Q | |
| Dell G7 7590 | |
| Average NVIDIA GeForce RTX 2060 Mobile (50.6 - 74, n=40) | |
| Alienware 17 R5 | |
| MSI GL65 9SEK | |
| Lenovo Legion Y740-15ICHg | |
| Razer Blade 15 GTX 1660 Ti | |
| Asus ROG Zephyrus G15 GA502DU | |
| Asus Zephyrus S GX531GM | |
| Asus FX503VM-EH73 | |
| Lenovo Legion Y7000P-1060 | |
| Dell G3 3590 | |
| Lenovo Legion Y730-15ICH i5-8300H | |
| Dell XPS 13 7390 2-in-1 Core i7 | |
| low | med. | high | ultra | |
|---|---|---|---|---|
| BioShock Infinite (2013) | 323.1 | 285.3 | 266.3 | 141.5 |
| The Witcher 3 (2015) | 288 | 185.7 | 113.4 | 62.4 |
| Shadow of the Tomb Raider (2018) | 126 | 91 | 84 | 75 |
| Dell G7 7590 GeForce RTX 2060 Mobile, i7-9750H, Toshiba BG3 KBG30ZMS256G | Lenovo Legion Y740-15ICHg GeForce RTX 2070 Max-Q, i7-8750H, Samsung SSD PM981 MZVLB256HAHQ | HP Omen X 2S 15-dg0075cl GeForce RTX 2070 Max-Q, i7-9750H, WDC PC SN720 SDAPNTW-1T00 | Asus Strix Scar III G531GW-AZ062T GeForce RTX 2070 Mobile, i7-9750H, Intel SSD 660p SSDPEKNW512G8 | Dell G3 3590 GeForce GTX 1650 Mobile, i5-9300H, Toshiba BG4 KBG40ZNS128G | Alienware m15 R2 P87F GeForce RTX 2080 Max-Q, i7-9750H, 2x Toshiba XG6 KXG60ZNV512G (RAID 0) | |
|---|---|---|---|---|---|---|
| Noise | 4% | -1% | -2% | 4% | -10% | |
| off / environment * (dB) | 28.4 | 28 1% | 29 -2% | 30 -6% | 28.4 -0% | 28.3 -0% |
| Idle Minimum * (dB) | 29.5 | 32.6 -11% | 30.5 -3% | 30.6 -4% | 29.2 1% | 28.5 3% |
| Idle Average * (dB) | 29.6 | 32.7 -10% | 31.5 -6% | 30.6 -3% | 29.4 1% | 28.5 4% |
| Idle Maximum * (dB) | 29.6 | 32.7 -10% | 31.5 -6% | 37.7 -27% | 29.4 1% | 49 -66% |
| Load Average * (dB) | 45 | 33.3 26% | 40.6 10% | 36.5 19% | 39 13% | 49 -9% |
| Witcher 3 ultra * (dB) | 51.5 | 41.6 19% | 49.5 4% | 52.1 -1% | 49.5 4% | 49 5% |
| Load Maximum * (dB) | 53 | 45.2 15% | 53.4 -1% | 48.1 9% | 49.7 6% | 55 -4% |
* ... smaller is better
Noise level
| Idle |
| 29.5 / 29.6 / 29.6 dB(A) |
| Load |
| 45 / 53 dB(A) |
 | ||
30 dB silent 40 dB(A) audible 50 dB(A) loud |
||
min: | ||
(-) The maximum temperature on the upper side is 52 °C / 126 F, compared to the average of 40.4 °C / 105 F, ranging from 21.2 to 68.8 °C for the class Gaming.
(-) The bottom heats up to a maximum of 48.8 °C / 120 F, compared to the average of 43.2 °C / 110 F
(+) In idle usage, the average temperature for the upper side is 30.7 °C / 87 F, compared to the device average of 33.9 °C / 93 F.
(-) Playing The Witcher 3, the average temperature for the upper side is 39.5 °C / 103 F, compared to the device average of 33.9 °C / 93 F.
(+) The palmrests and touchpad are reaching skin temperature as a maximum (35.4 °C / 95.7 F) and are therefore not hot.
(-) The average temperature of the palmrest area of similar devices was 28.8 °C / 83.8 F (-6.6 °C / -11.9 F).
Dell G7 7590 audio analysis
(+) | speakers can play relatively loud (89.8 dB)
Bass 100 - 315 Hz
(-) | nearly no bass - on average 22.8% lower than median
(±) | linearity of bass is average (8.6% delta to prev. frequency)
Mids 400 - 2000 Hz
(±) | higher mids - on average 5.7% higher than median
(±) | linearity of mids is average (7.3% delta to prev. frequency)
Highs 2 - 16 kHz
(+) | balanced highs - only 4.6% away from median
(±) | linearity of highs is average (9.3% delta to prev. frequency)
Overall 100 - 16.000 Hz
(±) | linearity of overall sound is average (21.9% difference to median)
Compared to same class
» 79% of all tested devices in this class were better, 6% similar, 16% worse
» The best had a delta of 6%, average was 18%, worst was 132%
Compared to all devices tested
» 63% of all tested devices were better, 7% similar, 31% worse
» The best had a delta of 4%, average was 24%, worst was 134%
Apple MacBook 12 (Early 2016) 1.1 GHz audio analysis
(+) | speakers can play relatively loud (83.6 dB)
Bass 100 - 315 Hz
(±) | reduced bass - on average 11.3% lower than median
(±) | linearity of bass is average (14.2% delta to prev. frequency)
Mids 400 - 2000 Hz
(+) | balanced mids - only 2.4% away from median
(+) | mids are linear (5.5% delta to prev. frequency)
Highs 2 - 16 kHz
(+) | balanced highs - only 2% away from median
(+) | highs are linear (4.5% delta to prev. frequency)
Overall 100 - 16.000 Hz
(+) | overall sound is linear (10.2% difference to median)
Compared to same class
» 7% of all tested devices in this class were better, 2% similar, 91% worse
» The best had a delta of 5%, average was 18%, worst was 53%
Compared to all devices tested
» 5% of all tested devices were better, 1% similar, 94% worse
» The best had a delta of 4%, average was 24%, worst was 134%
| Off / Standby | |
| Idle | |
| Load |
|
Key:
min: | |
| Dell G7 7590 i7-9750H, GeForce RTX 2060 Mobile, Toshiba BG3 KBG30ZMS256G, IPS, 1920x1080, 15.6" | Alienware m15 R2 P87F i7-9750H, GeForce RTX 2080 Max-Q, 2x Toshiba XG6 KXG60ZNV512G (RAID 0), IPS, 1920x1080, 15.6" | Razer Blade 15 GTX 1660 Ti i7-9750H, GeForce GTX 1660 Ti Mobile, Samsung SSD PM981 MZVLB256HAHQ, IPS, 1920x1080, 15.6" | Alienware 15 R3 Max-Q i7-7820HK, GeForce GTX 1080 Max-Q, LiteOn CX2-8B256, IPS, 1920x1080, 15.6" | Lenovo Legion Y7000P-1060 i7-8750H, GeForce GTX 1060 Mobile, Samsung SSD PM981 MZVLB256HAHQ, IPS, 1920x1080, 15.6" | MSI GL65 9SEK i7-9750H, GeForce RTX 2060 Mobile, WDC PC SN520 SDAPNUW-512G, IPS, 1920x1080, 15.6" | |
|---|---|---|---|---|---|---|
| Power Consumption | -49% | -22% | -22% | 32% | -75% | |
| Idle Minimum * (Watt) | 11.2 | 19 -70% | 18.7 -67% | 22 -96% | 4.9 56% | 41 -266% |
| Idle Average * (Watt) | 16.3 | 40.5 -148% | 30.7 -88% | 26 -60% | 8.1 50% | 45.3 -178% |
| Idle Maximum * (Watt) | 46.2 | 52 -13% | 33.9 27% | 33 29% | 16.5 64% | 47.1 -2% |
| Load Average * (Watt) | 123.3 | 132.3 -7% | 93.4 24% | 86 30% | 109.2 11% | 94.9 23% |
| Witcher 3 ultra * (Watt) | 135.6 | 183.3 -35% | 158.9 -17% | 159 -17% | 124.6 8% | 149.4 -10% |
| Load Maximum * (Watt) | 181.5 | 217.2 -20% | 195.3 -8% | 215 -18% | 175.2 3% | 214.2 -18% |
* ... smaller is better
| Dell G7 7590 i7-9750H, GeForce RTX 2060 Mobile, 60 Wh | Lenovo Legion Y740-15ICHg i7-8750H, GeForce RTX 2070 Max-Q, 57 Wh | HP Omen X 2S 15-dg0075cl i7-9750H, GeForce RTX 2070 Max-Q, 72 Wh | Asus Strix Scar III G531GW-AZ062T i7-9750H, GeForce RTX 2070 Mobile, 66 Wh | Dell G3 3590 i5-9300H, GeForce GTX 1650 Mobile, 51 Wh | Alienware m15 R2 P87F i7-9750H, GeForce RTX 2080 Max-Q, 76 Wh | |
|---|---|---|---|---|---|---|
| Battery runtime | -53% | -49% | 22% | 15% | -19% | |
| Reader / Idle (h) | 11.1 | 3.9 -65% | 3.7 -67% | 13.5 22% | 9.2 -17% | |
| WiFi v1.3 (h) | 4.6 | 2.8 -39% | 2.2 -52% | 5.6 22% | 6.7 46% | 5.5 20% |
| Load (h) | 1.8 | 0.8 -56% | 1.3 -28% | 1.4 -22% | 0.7 -61% |
Pros
Cons
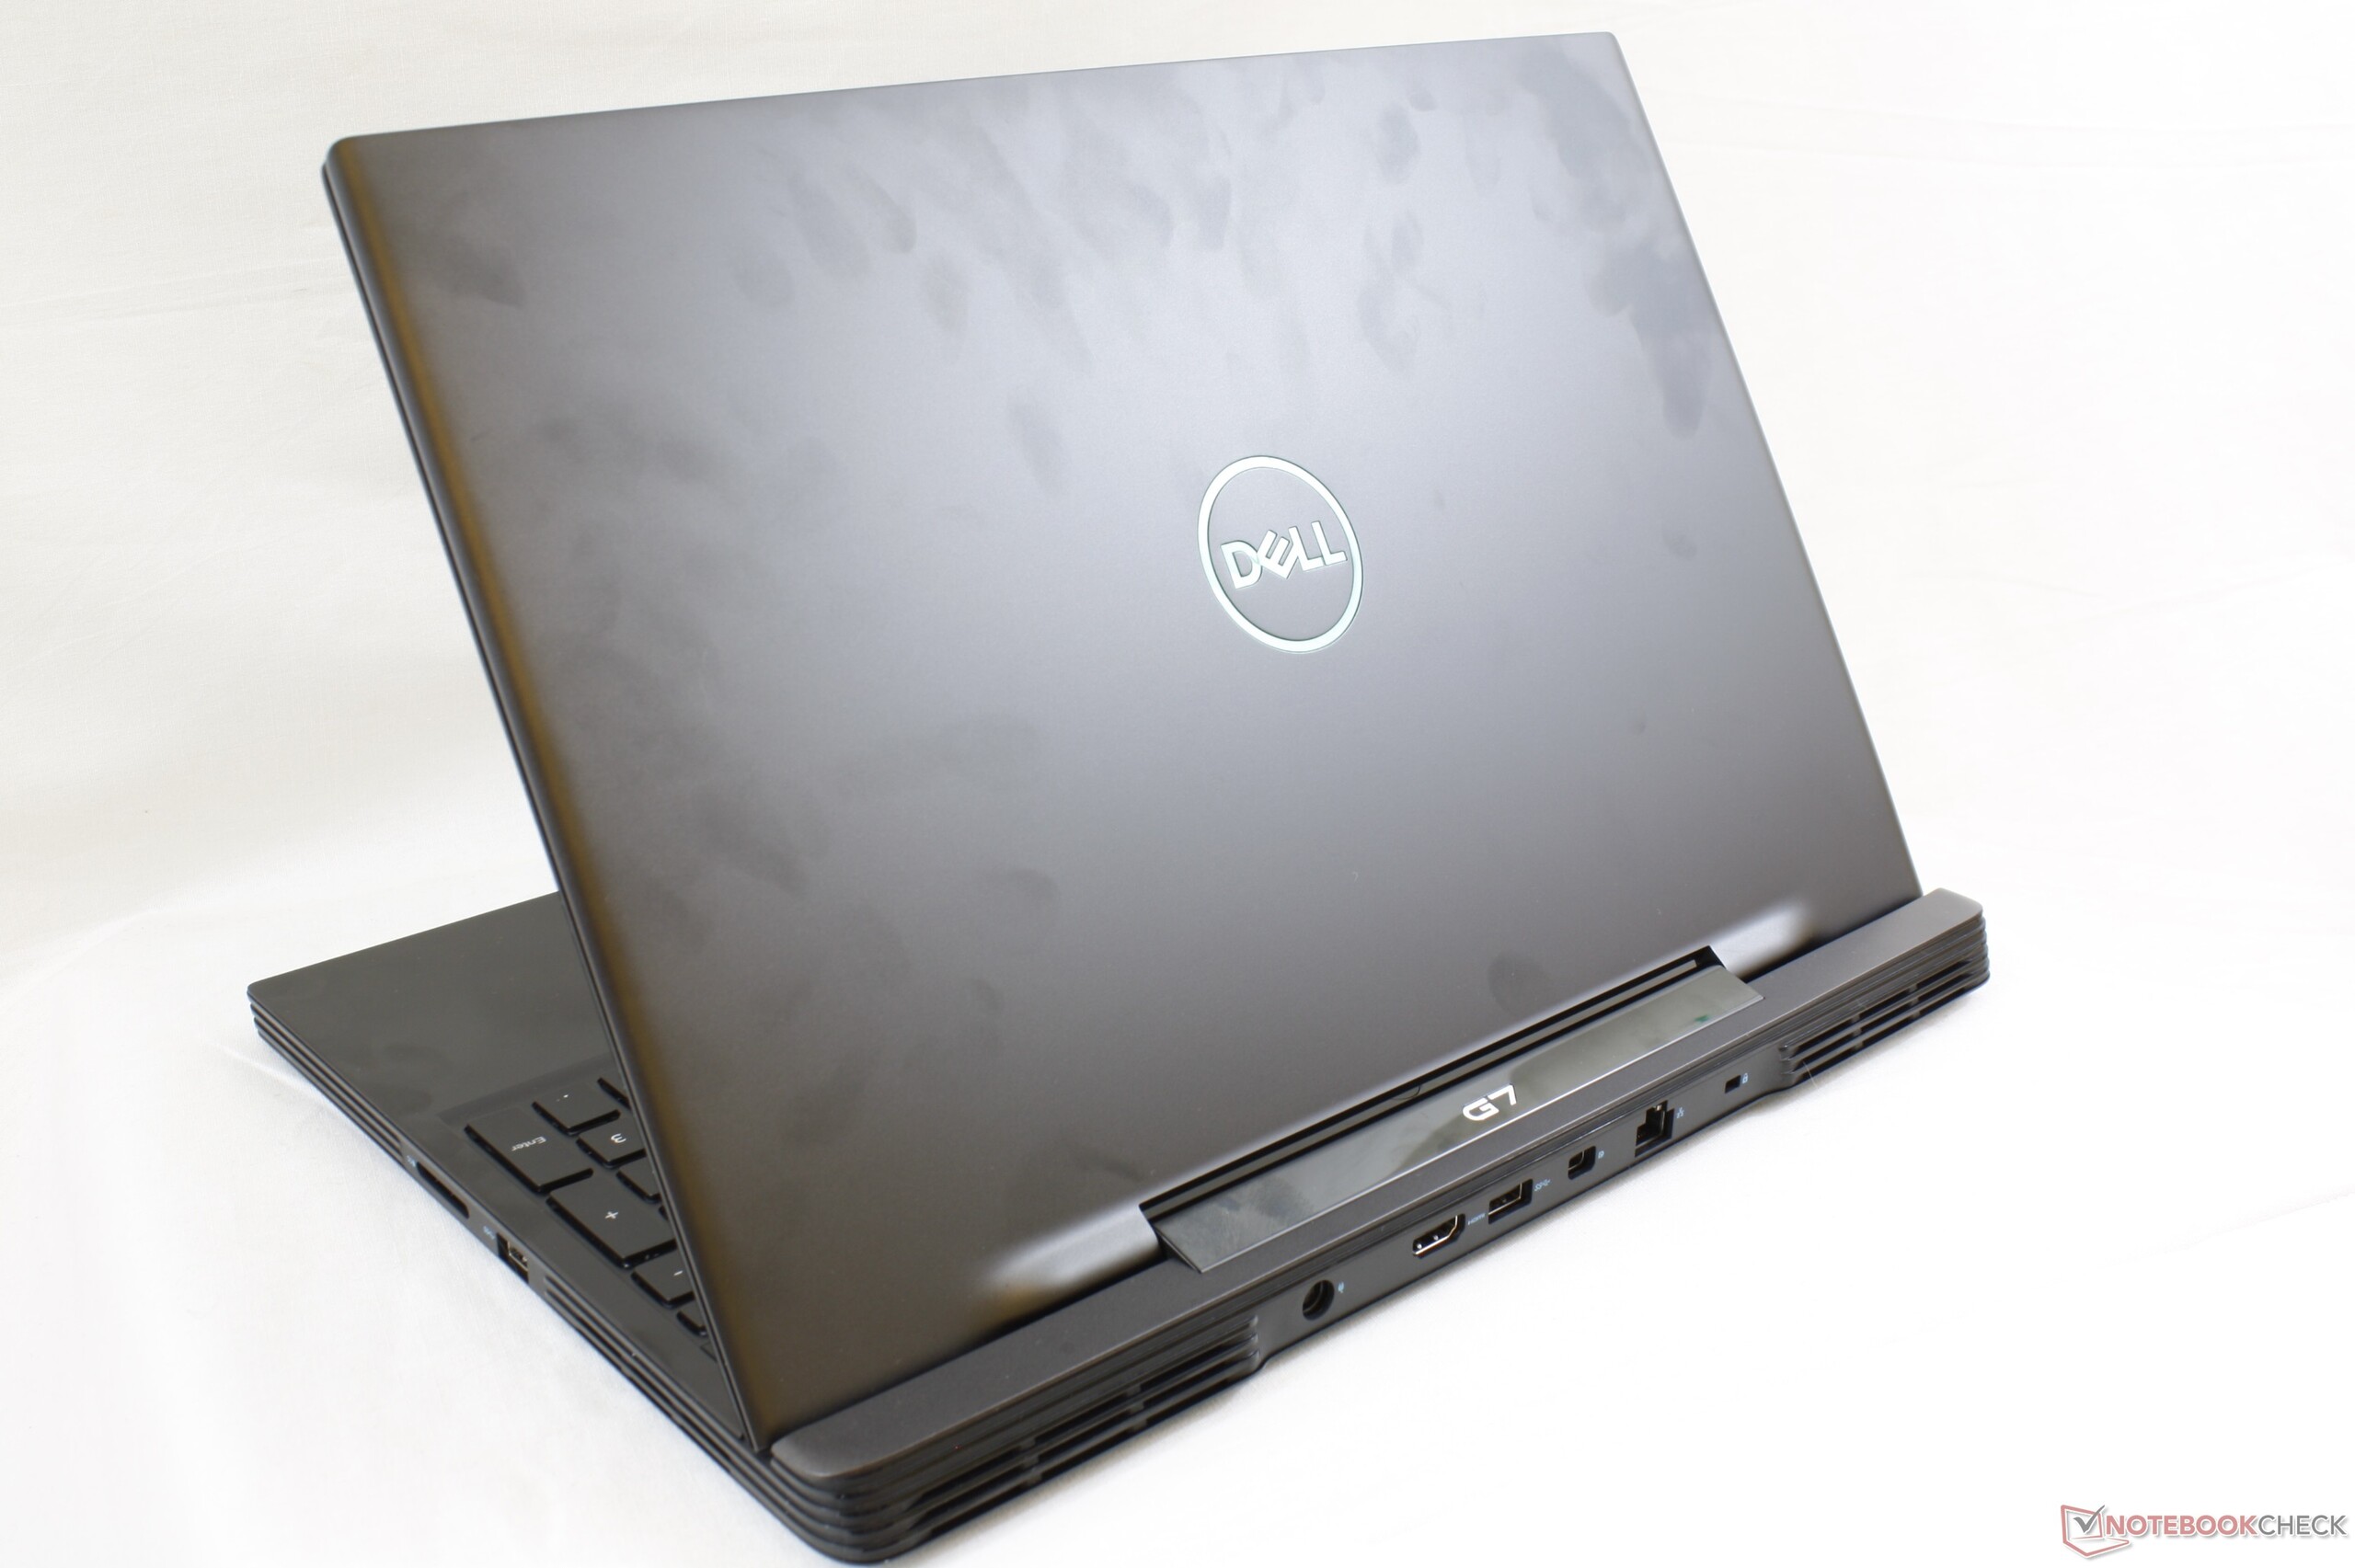
G7 15 7590的定位很有趣。它具有与高端Alienware m15 R2类似的Core i9,GeForce RTX和IPS / OLED选项,但起价较低。如果您希望拥有Alienware笔记本电脑的强大功能,但又因Alienware的浮夸设计而被劝退,那么更为朴实的G7 15 7590可以在不牺牲机身质量或性能的情况下为您省钱。
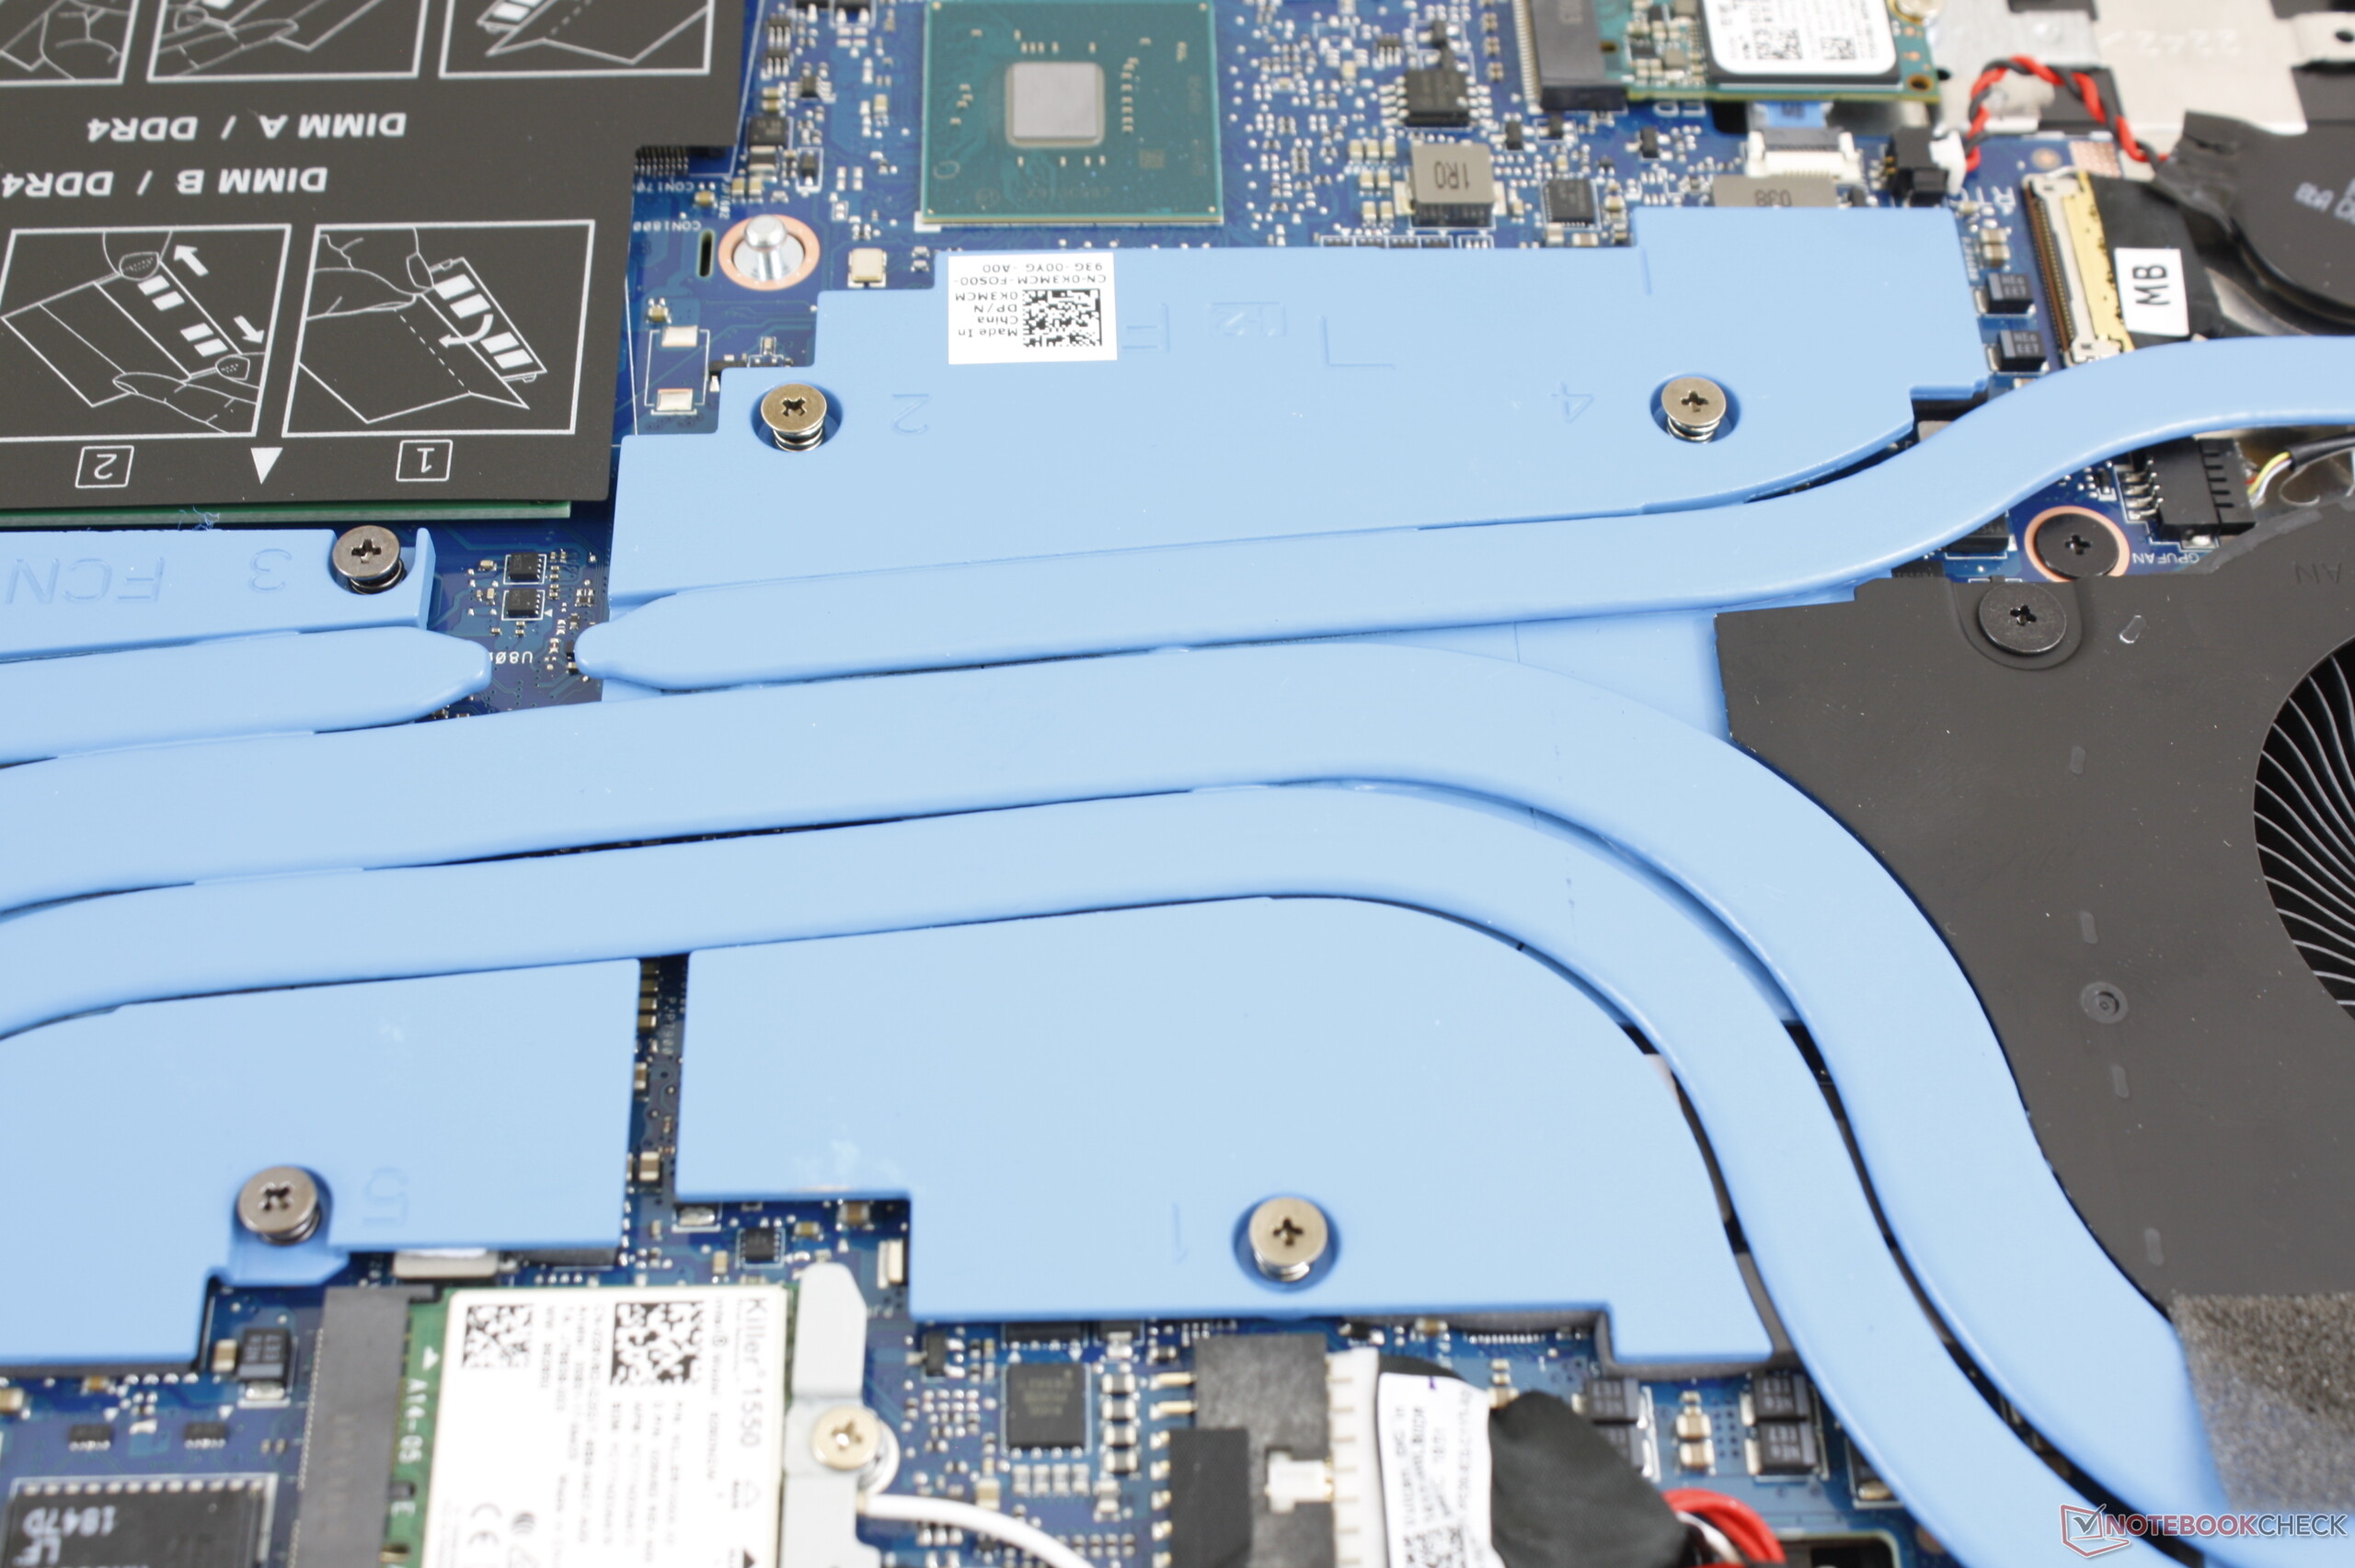
有很大的改进空间。虽然CPU Turbo Boost性能高于平均水平并且易于维修,但对于NVMe固态而言,东芝SSD的速度较慢,低音表现一般,而且出厂时的显示校准也不佳。这些缺点在Dell G3或G5系列的入门级游戏机上更容易宽恕,但中端G7系列不应该任何借口。屏幕盖不够结实,玩游戏时风扇声音大, 联想Y740 或 HP Pavilion 15 Gaming等竞争对手的声音明显要小一些。
戴尔的G7 15 7590是Alienware m15 R2的绝佳替代品,特别是因为它提供了可升级的RAM以及相同的CPU,GPU和显示选项。 CPU Turbo Boost的持续性是我们在任何大小和类别的游戏笔记本电脑上见过的最好的之一。只是要在游戏时为非常响的风扇做好准备。
Dell G7 7590
- 05/15/2020 v7 (old)
Allen Ngo
Price comparison

