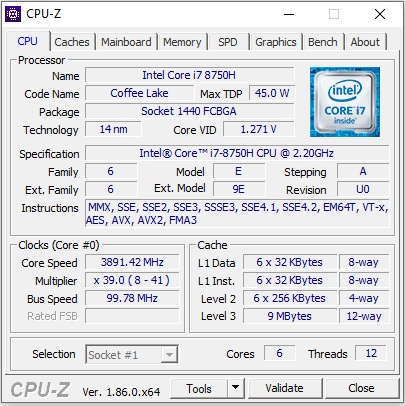
技嘉Aorus 15-W9 (i7-8750H, RTX 2060) 笔记本电脑评测
| |||||||||||||||||||||||||
Brightness Distribution: 80 %
Center on Battery: 295 cd/m²
Contrast: 868:1 (Black: 0.34 cd/m²)
ΔE ColorChecker Calman: 3.89 | ∀{0.5-29.43 Ø4.72}
calibrated: 1.44
ΔE Greyscale Calman: 4.98 | ∀{0.09-98 Ø4.97}
93% sRGB (Argyll 1.6.3 3D)
60% AdobeRGB 1998 (Argyll 1.6.3 3D)
65.6% AdobeRGB 1998 (Argyll 3D)
93.5% sRGB (Argyll 3D)
64.3% Display P3 (Argyll 3D)
Gamma: 2.45
CCT: 6407 K
| Aorus 15 W9 LG Philips LP156WFG-SPB2 (LGD05E8), IPS, 1920x1080 | Aorus 15 X9 LG Philips LP156WFG-SPB2, IPS, 1920x1080 | MSI GS65 Stealth Thin 8RE-051US AUO80ED, IPS, 1920x1080 | Alienware m15 GTX 1070 Max-Q AU Optronics B156HAN, IPS, 1920x1080 | Lenovo Legion Y740-15ICHg LP156WFG-SPB2, IPS, 1920x1080 | Gigabyte Aero 15-X9 LGD05C0, IPS, 1920x1080 | Razer Blade 15 RTX 2070 Max-Q LG Philips LGD05C0, IPS, 1920x1080 | Asus Zephyrus S GX531GM AU Optronics B156HAN08.2, IPS, 1920x1080 | |
|---|---|---|---|---|---|---|---|---|
| Display | 1% | 1% | -2% | -1% | -1% | 1% | -1% | |
| Display P3 Coverage (%) | 64.3 | 64.9 1% | 65.8 2% | 63.5 -1% | 63.5 -1% | 63.5 -1% | 65.3 2% | 64.9 1% |
| sRGB Coverage (%) | 93.5 | 95.6 2% | 92.1 -1% | 89.4 -4% | 92.4 -1% | 93.1 0% | 94.9 1% | 90.1 -4% |
| AdobeRGB 1998 Coverage (%) | 65.6 | 66.3 1% | 67 2% | 64.5 -2% | 64.7 -1% | 64.5 -2% | 66.3 1% | 65.8 0% |
| Response Times | 7% | -7% | -1% | -8% | -2% | 5% | 36% | |
| Response Time Grey 50% / Grey 80% * (ms) | 16.8 ? | 15.2 ? 10% | 20 ? -19% | 18 ? -7% | 18.8 ? -12% | 16.4 ? 2% | 16.8 ? -0% | 7 ? 58% |
| Response Time Black / White * (ms) | 12.8 ? | 12.4 ? 3% | 12 ? 6% | 12 ? 6% | 13.2 ? -3% | 13.6 ? -6% | 11.6 ? 9% | 11 ? 14% |
| PWM Frequency (Hz) | ||||||||
| Screen | 12% | -3% | -5% | -2% | 19% | 8% | 7% | |
| Brightness middle (cd/m²) | 295 | 305.1 3% | 250.9 -15% | 353.6 20% | 320.4 9% | 250 -15% | 314.7 7% | 323 9% |
| Brightness (cd/m²) | 292 | 295 1% | 257 -12% | 346 18% | 298 2% | 235 -20% | 312 7% | 309 6% |
| Brightness Distribution (%) | 80 | 78 -2% | 83 4% | 86 8% | 85 6% | 85 6% | 90 13% | 93 16% |
| Black Level * (cd/m²) | 0.34 | 0.33 3% | 0.32 6% | 0.3 12% | 0.42 -24% | 0.29 15% | 0.38 -12% | 0.29 15% |
| Contrast (:1) | 868 | 925 7% | 784 -10% | 1179 36% | 763 -12% | 862 -1% | 828 -5% | 1114 28% |
| Colorchecker dE 2000 * | 3.89 | 2.58 34% | 2.77 29% | 4.55 -17% | 3.21 17% | 1.46 62% | 2.56 34% | 4.33 -11% |
| Colorchecker dE 2000 max. * | 7.28 | 4.32 41% | 5.89 19% | 7.91 -9% | 5.54 24% | 2.47 66% | 4.89 33% | 7.64 -5% |
| Colorchecker dE 2000 calibrated * | 1.44 | 1.33 8% | 2.5 -74% | 3.37 -134% | 2.36 -64% | 1.71 -19% | ||
| Greyscale dE 2000 * | 4.98 | 3.4 32% | 4 20% | 4.1 18% | 3.6 28% | 1.27 74% | 3.4 32% | 4.12 17% |
| Gamma | 2.45 90% | 2.28 96% | 2.27 97% | 2.27 97% | 2.27 97% | 2.4 92% | 2.3 96% | 2.43 91% |
| CCT | 6407 101% | 6374 102% | 6901 94% | 7434 87% | 6503 100% | 6749 96% | 6435 101% | 7427 88% |
| Color Space (Percent of AdobeRGB 1998) (%) | 60 | 60.7 1% | 60 0% | 57.9 -3% | 59 -2% | 60 0% | 60.7 1% | 59 -2% |
| Color Space (Percent of sRGB) (%) | 93 | 95.2 2% | 92 -1% | 88.9 -4% | 92 -1% | 93 0% | 94.6 2% | 90 -3% |
| Total Average (Program / Settings) | 7% /
9% | -3% /
-3% | -3% /
-4% | -4% /
-2% | 5% /
12% | 5% /
7% | 14% /
9% |
* ... smaller is better
Display Response Times
| ↔ Response Time Black to White | ||
|---|---|---|
| 12.8 ms ... rise ↗ and fall ↘ combined | ↗ 7.6 ms rise |  |
| ↘ 5.2 ms fall | ||
| The screen shows good response rates in our tests, but may be too slow for competitive gamers. In comparison, all tested devices range from 0.1 (minimum) to 240 (maximum) ms. » 33 % of all devices are better. This means that the measured response time is better than the average of all tested devices (19.8 ms). | ||
| ↔ Response Time 50% Grey to 80% Grey | ||
| 16.8 ms ... rise ↗ and fall ↘ combined | ↗ 9.2 ms rise | 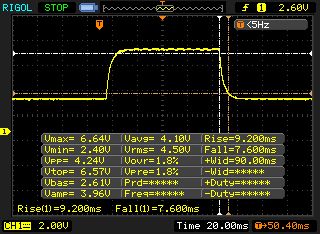 |
| ↘ 7.6 ms fall | ||
| The screen shows good response rates in our tests, but may be too slow for competitive gamers. In comparison, all tested devices range from 0.165 (minimum) to 636 (maximum) ms. » 31 % of all devices are better. This means that the measured response time is better than the average of all tested devices (31 ms). | ||
Screen Flickering / PWM (Pulse-Width Modulation)
| Screen flickering / PWM not detected | 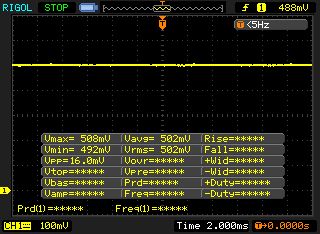 | ||
In comparison: 52 % of all tested devices do not use PWM to dim the display. If PWM was detected, an average of 7753 (minimum: 5 - maximum: 343500) Hz was measured. | |||
| Cinebench R10 | |
| Rendering Single 32Bit | |
| Average of class Gaming (7457 - 11779, n=8, last 2 years) | |
| Asus Zephyrus S GX531GM | |
| Aorus 15 W9 | |
| Gigabyte Aero 15-X9 | |
| Rendering Multiple CPUs 32Bit | |
| Average of class Gaming (42932 - 81339, n=8, last 2 years) | |
| Gigabyte Aero 15-X9 | |
| Aorus 15 W9 | |
| Asus Zephyrus S GX531GM | |
| Cinebench R20 | |
| CPU (Single Core) | |
| Average of class Gaming (442 - 895, n=107, last 2 years) | |
| Aorus 15 W9 | |
| CPU (Multi Core) | |
| Average of class Gaming (4029 - 16108, n=107, last 2 years) | |
| Aorus 15 W9 | |
| Geekbench 3 | |
| 32 Bit Multi-Core Score | |
| Asus Zephyrus S GX531GM | |
| Aorus 15 W9 | |
| Gigabyte Aero 15-X9 | |
| 32 Bit Single-Core Score | |
| Aorus 15 W9 | |
| Asus Zephyrus S GX531GM | |
| Gigabyte Aero 15-X9 | |
| Geekbench 4.4 | |
| 64 Bit Multi-Core Score | |
| Average of class Gaming (89200 - 97490, n=2, last 2 years) | |
| Asus Zephyrus S GX531GM | |
| Aorus 15 W9 | |
| Gigabyte Aero 15-X9 | |
| 64 Bit Single-Core Score | |
| Average of class Gaming (9335 - 9492, n=2, last 2 years) | |
| Aorus 15 W9 | |
| Asus Zephyrus S GX531GM | |
| Gigabyte Aero 15-X9 | |
| Mozilla Kraken 1.1 - Total | |
| Aorus 15 X9 (Edge 42.17134.1.0) | |
| Gigabyte Aero 15-X9 (Edge 44) | |
| Razer Blade 15 RTX 2070 Max-Q (Edge 44.17763.1.0) | |
| Lenovo Legion Y740-15ICHg (Microsoft Edge 44.17763.1.0) | |
| Alienware m15 GTX 1070 Max-Q (Edge 42.17134.1.0) | |
| Aorus 15 W9 (Edge 44) | |
| MSI GS65 Stealth Thin 8RE-051US (Microsoft Edge 42.17134.1.0) | |
| Average of class Gaming (391 - 590, n=102, last 2 years) | |
| Octane V2 - Total Score | |
| Average of class Gaming (93292 - 139447, n=27, last 2 years) | |
| MSI GS65 Stealth Thin 8RE-051US (Microsoft Edge 42.17134.1.0) | |
| Aorus 15 W9 (Edge 44) | |
| Lenovo Legion Y740-15ICHg (Microsoft Edge 44.17763.1.0) | |
| Gigabyte Aero 15-X9 (Edge 44) | |
| Alienware m15 GTX 1070 Max-Q (Edge 42.17134.1.0) | |
| Razer Blade 15 RTX 2070 Max-Q (Edge 44.17763.1.0) | |
| Aorus 15 X9 (Edge 42.17134.1.0) | |
| WebXPRT 3 - Overall | |
| Average of class Gaming (220 - 532, n=98, last 2 years) | |
| Aorus 15 W9 (Edge 44) | |
| Speedometer 2.0 - Result 2.0 | |
| Average of class Gaming (29 - 686, n=27, last 2 years) | |
| Aorus 15 W9 (Edge 44) | |
* ... smaller is better
| PCMark 7 Score | 7400 points | |
| PCMark 8 Home Score Accelerated v2 | 5077 points | |
| PCMark 8 Creative Score Accelerated v2 | 5955 points | |
| PCMark 8 Work Score Accelerated v2 | 5899 points | |
| PCMark 10 Score | 5839 points | |
Help | ||

| Aorus 15 W9 Intel SSD 760p SSDPEKKW512G8 | Aorus 15 X9 Intel SSD 760p SSDPEKKW512G8 | MSI GS65 Stealth Thin 8RE-051US Samsung SSD PM981 MZVLB256HAHQ | Alienware m15 GTX 1070 Max-Q Toshiba XG5 KXG50ZNV512G | Lenovo Legion Y740-15ICHg Samsung SSD PM981 MZVLB256HAHQ | Gigabyte Aero 15-X9 Intel SSD 760p SSDPEKKW010T8 | Razer Blade 15 RTX 2070 Max-Q Samsung SSD PM981 MZVLB512HAJQ | Asus Zephyrus S GX531GM Intel SSD 660p SSDPEKNW512G8 | |
|---|---|---|---|---|---|---|---|---|
| CrystalDiskMark 5.2 / 6 | 35% | -6% | -15% | -10% | -3% | -1% | -20% | |
| Write 4K (MB/s) | 99.2 | 147.2 48% | 91.5 -8% | 107.4 8% | 81 -18% | 97.1 -2% | 93.9 -5% | 100.8 2% |
| Read 4K (MB/s) | 54.1 | 63.7 18% | 40.41 -25% | 42.91 -21% | 36.03 -33% | 53.7 -1% | 40.56 -25% | 48.75 -10% |
| Write Seq (MB/s) | 1524 | 1573 3% | 1528 0% | 467.5 -69% | 1687 11% | 1526 0% | 1468 -4% | 975 -36% |
| Read Seq (MB/s) | 2325 | 2602 12% | 1235 -47% | 2335 0% | 1835 -21% | 2020 -13% | 1540 -34% | 1344 -42% |
| Write 4K Q32T1 (MB/s) | 259.2 | 531 105% | 259 0% | 289.7 12% | 205.3 -21% | 285.6 10% | 293.5 13% | 283.7 9% |
| Read 4K Q32T1 (MB/s) | 328.9 | 598 82% | 364.9 11% | 354.4 8% | 229 -30% | 321.8 -2% | 346 5% | 330.3 0% |
| Write Seq Q32T1 (MB/s) | 1566 | 1592 2% | 1529 -2% | 460.9 -71% | 1683 7% | 1533 -2% | 1941 24% | 986 -37% |
| Read Seq Q32T1 (MB/s) | 2767 | 2981 8% | 3472 25% | 3111 12% | 3363 22% | 2351 -15% | 3266 18% | 1579 -43% |
| 3DMark 06 Standard Score | 36381 points | |
| 3DMark 11 Performance | 16598 points | |
| 3DMark Ice Storm Standard Score | 164238 points | |
| 3DMark Cloud Gate Standard Score | 31982 points | |
| 3DMark Fire Strike Score | 13646 points | |
| 3DMark Time Spy Score | 5984 points | |
Help | ||
| The Witcher 3 - 1920x1080 Ultra Graphics & Postprocessing (HBAO+) | |
| Average of class Gaming (95 - 240, n=7, last 2 years) | |
| Aorus 15 X9 | |
| Razer Blade 15 RTX 2070 Max-Q | |
| Gigabyte Aero 15-X9 | |
| Aorus 15 W9 | |
| Lenovo Legion Y740-15ICHg | |
| Alienware m15 GTX 1070 Max-Q | |
| Asus Zephyrus S GX531GM | |
| MSI GS65 Stealth Thin 8RE-051US | |
| BioShock Infinite - 1920x1080 Ultra Preset, DX11 (DDOF) | |
| Lenovo Legion Y740-15ICHg | |
| MSI GS65 Stealth Thin 8RE-051US | |
| Aorus 15 X9 | |
| Razer Blade 15 RTX 2070 Max-Q | |
| Alienware m15 GTX 1070 Max-Q | |
| Aorus 15 W9 | |
| Gigabyte Aero 15-X9 | |
| Asus Zephyrus S GX531GM | |
| X-Plane 11.11 - 1920x1080 high (fps_test=3) | |
| Average of class Gaming (52.1 - 143.5, n=110, last 2 years) | |
| Aorus 15 W9 | |
| Asus Zephyrus S GX531GM | |
| Gigabyte Aero 15-X9 | |
| low | med. | high | ultra | |
|---|---|---|---|---|
| Tomb Raider (2013) | 439.7 | 393 | 367.3 | 192.9 |
| BioShock Infinite (2013) | 282.4 | 241.1 | 227 | 135.9 |
| The Witcher 3 (2015) | 244.6 | 174.7 | 109.1 | 58 |
| X-Plane 11.11 (2018) | 104.7 | 92.4 | 78.3 | |
| Apex Legends (2019) | 143.7 | 130.4 | 105.2 | 104.4 |
| Far Cry New Dawn (2019) | 86 | 80 | 77 | 69 |
| Metro Exodus (2019) | 109.1 | 67.1 | 50.7 | 41.6 |
| Anthem (2019) | 89.7 | 78.2 | 71 | 68.8 |
| Dirt Rally 2.0 (2019) | 170.7 | 134.6 | 112.5 | 66.3 |
| The Division 2 (2019) | 134 | 108 | 85 | 67 |
Noise level
| Idle |
| 34 / 36 / 38 dB(A) |
| Load |
| 52 / 53 dB(A) |
 | ||
30 dB silent 40 dB(A) audible 50 dB(A) loud |
||
min: | ||
| Aorus 15 W9 i7-8750H, GeForce RTX 2060 Mobile | Aorus 15 X9 i7-8750H, GeForce RTX 2070 Mobile | MSI GS65 Stealth Thin 8RE-051US i7-8750H, GeForce GTX 1060 Mobile | Alienware m15 GTX 1070 Max-Q i7-8750H, GeForce GTX 1070 Max-Q | Lenovo Legion Y740-15ICHg i7-8750H, GeForce RTX 2070 Max-Q | Gigabyte Aero 15-X9 i7-8750H, GeForce RTX 2070 Max-Q | Razer Blade 15 RTX 2070 Max-Q i7-8750H, GeForce RTX 2070 Max-Q | Asus Zephyrus S GX531GM i7-8750H, GeForce GTX 1060 Mobile | |
|---|---|---|---|---|---|---|---|---|
| Noise | 5% | 15% | 14% | 14% | 8% | 18% | 15% | |
| off / environment * (dB) | 29 | 28.2 3% | 28.4 2% | 28.6 1% | 28 3% | 30 -3% | 28.8 1% | 30.3 -4% |
| Idle Minimum * (dB) | 34 | 32.6 4% | 28.4 16% | 28.6 16% | 32.6 4% | 32 6% | 28.8 15% | 30.3 11% |
| Idle Average * (dB) | 36 | 32.7 9% | 28.4 21% | 28.6 21% | 32.7 9% | 34 6% | 28.8 20% | 33.2 8% |
| Idle Maximum * (dB) | 38 | 32.7 14% | 29.6 22% | 28.6 25% | 32.7 14% | 36 5% | 29.4 23% | 33.2 13% |
| Load Average * (dB) | 52 | 38.9 25% | 43.5 16% | 40.8 22% | 33.3 36% | 42 19% | 35.7 31% | 32.3 38% |
| Witcher 3 ultra * (dB) | 52 | 51.8 -0% | 45.7 12% | 49.6 5% | 41.6 20% | 44 15% | 42.5 18% | |
| Load Maximum * (dB) | 53 | 64.1 -21% | 45.7 14% | 49.6 6% | 45.2 15% | 48 9% | 45 15% | 39 26% |
* ... smaller is better
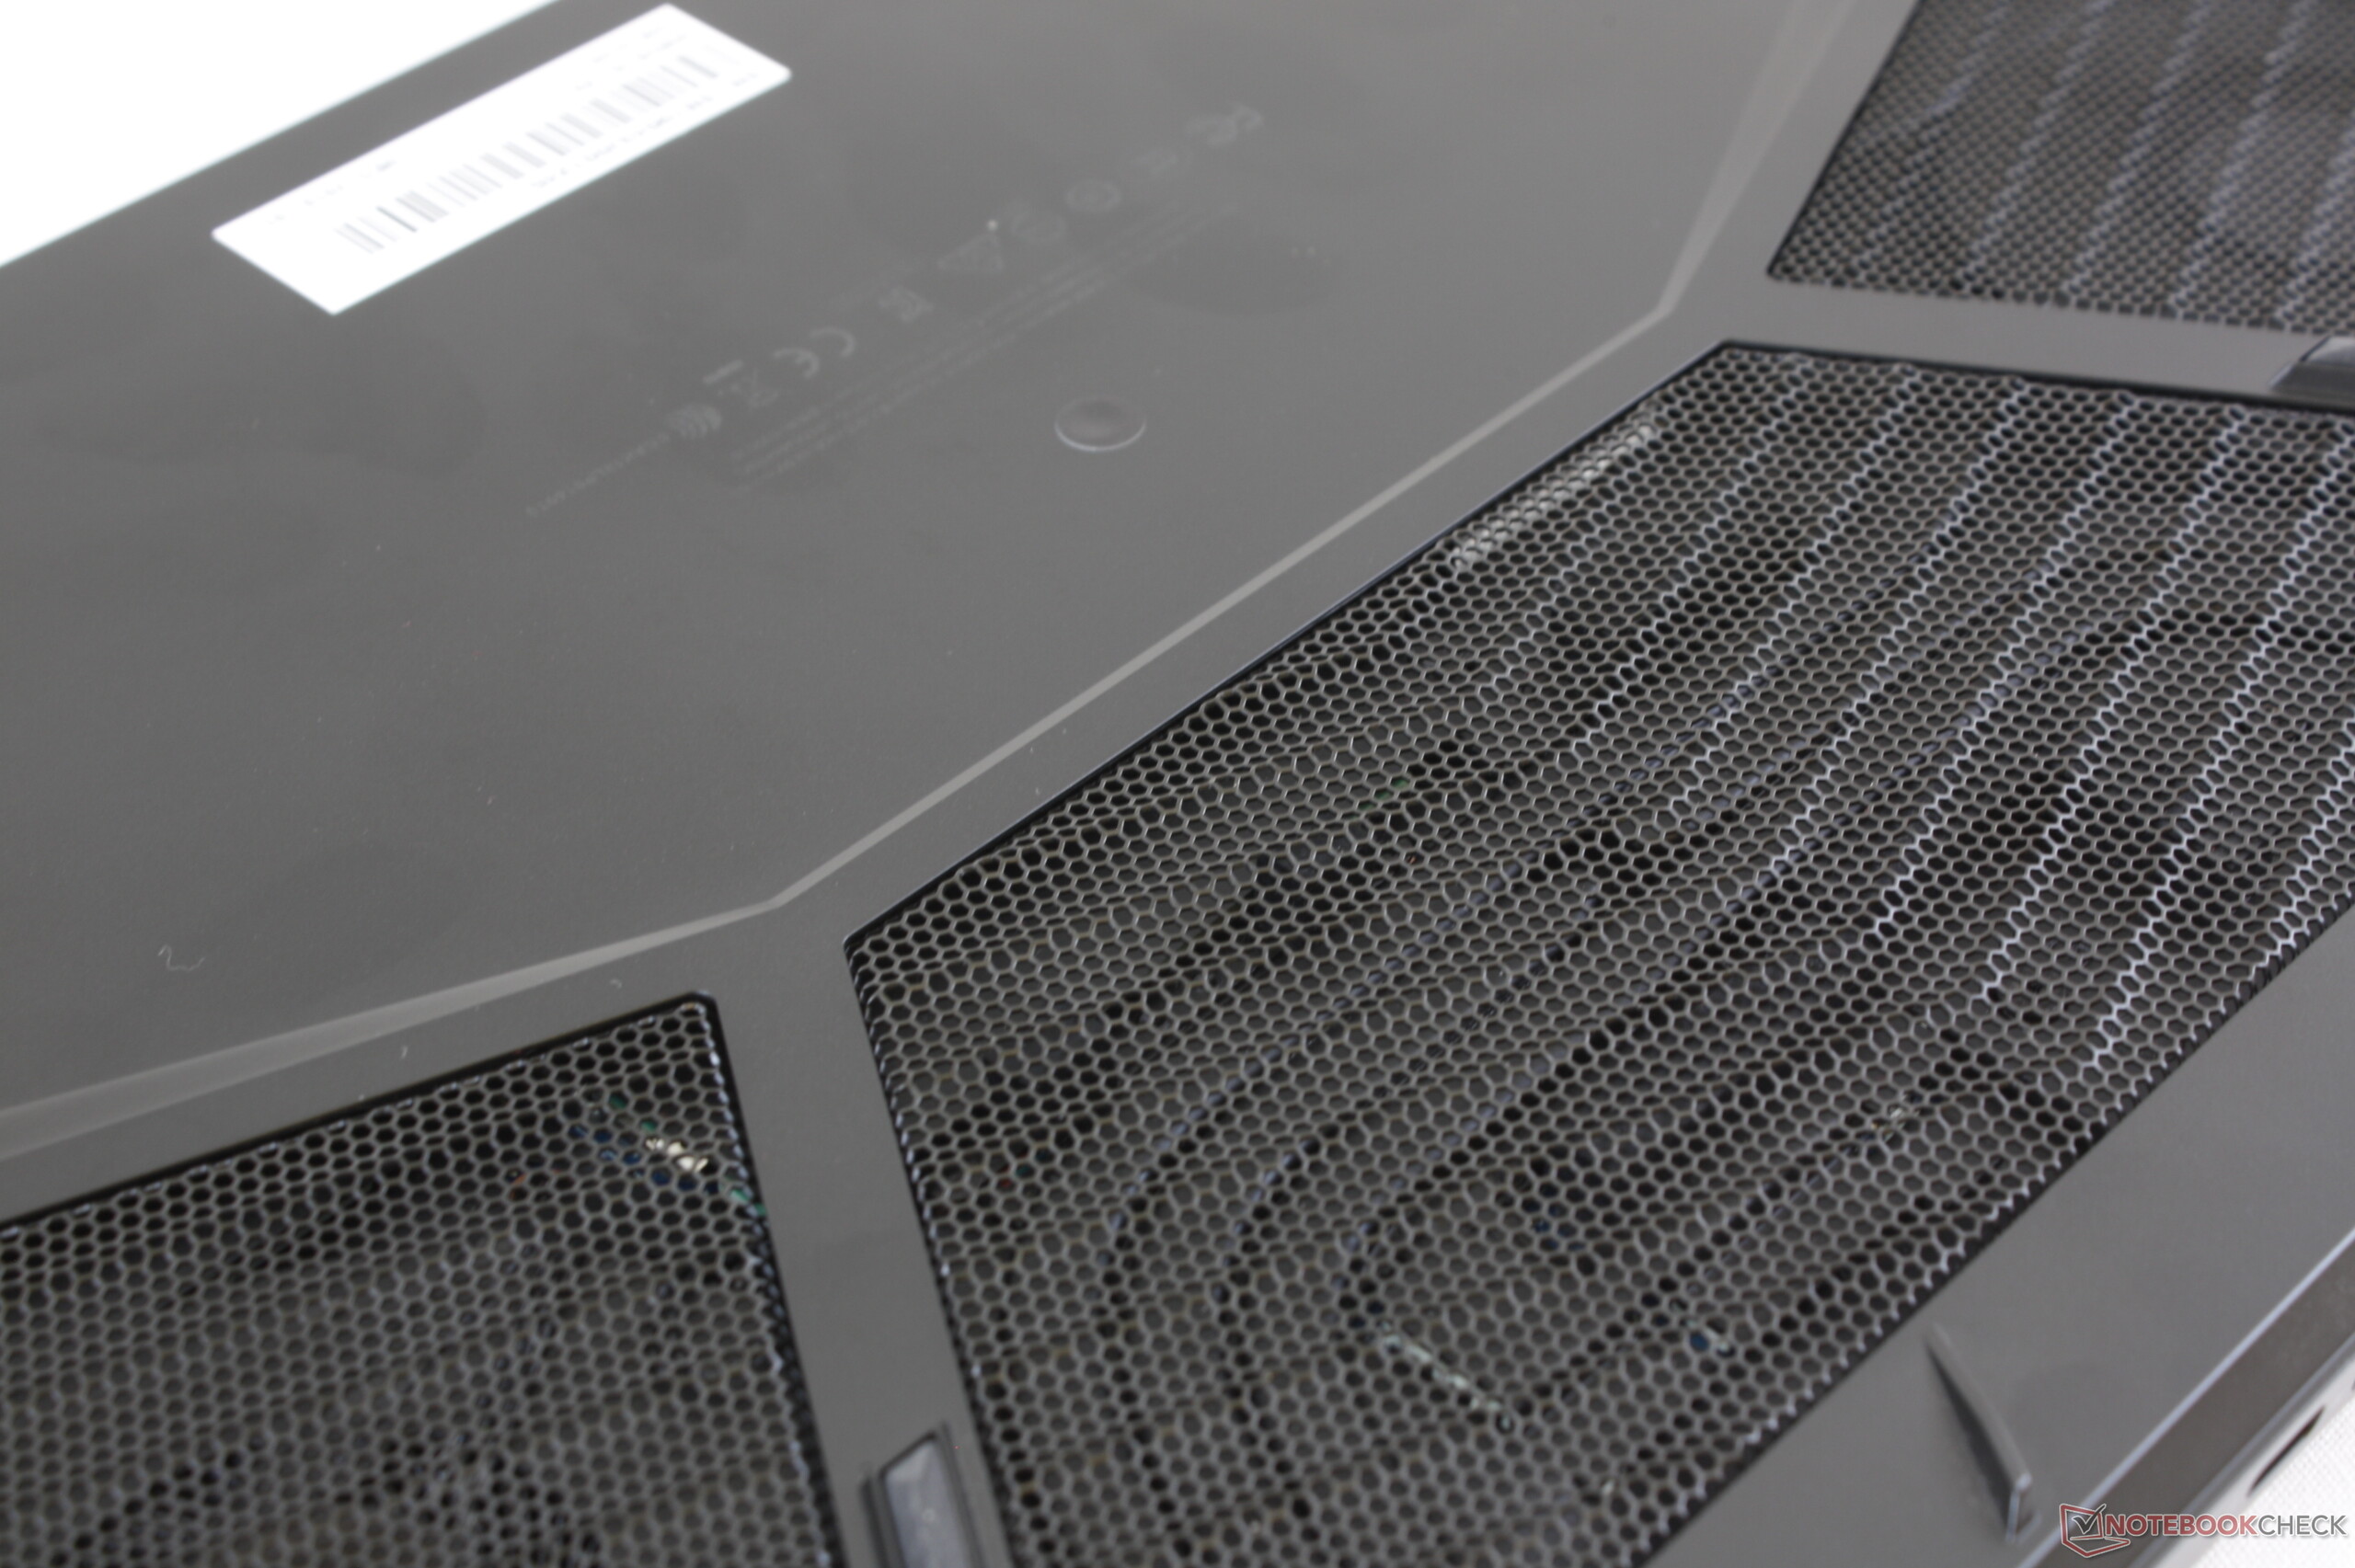
(±) The maximum temperature on the upper side is 44 °C / 111 F, compared to the average of 40.4 °C / 105 F, ranging from 21.2 to 68.8 °C for the class Gaming.
(-) The bottom heats up to a maximum of 63 °C / 145 F, compared to the average of 43.2 °C / 110 F
(+) In idle usage, the average temperature for the upper side is 26.6 °C / 80 F, compared to the device average of 33.9 °C / 93 F.
(-) Playing The Witcher 3, the average temperature for the upper side is 38.3 °C / 101 F, compared to the device average of 33.9 °C / 93 F.
(±) The palmrests and touchpad can get very hot to the touch with a maximum of 38 °C / 100.4 F.
(-) The average temperature of the palmrest area of similar devices was 28.8 °C / 83.8 F (-9.2 °C / -16.6 F).
| Aorus 15 W9 i7-8750H, GeForce RTX 2060 Mobile | Aorus 15 X9 i7-8750H, GeForce RTX 2070 Mobile | MSI GS65 Stealth Thin 8RE-051US i7-8750H, GeForce GTX 1060 Mobile | Alienware m15 GTX 1070 Max-Q i7-8750H, GeForce GTX 1070 Max-Q | Lenovo Legion Y740-15ICHg i7-8750H, GeForce RTX 2070 Max-Q | Gigabyte Aero 15-X9 i7-8750H, GeForce RTX 2070 Max-Q | Razer Blade 15 RTX 2070 Max-Q i7-8750H, GeForce RTX 2070 Max-Q | Asus Zephyrus S GX531GM i7-8750H, GeForce GTX 1060 Mobile | |
|---|---|---|---|---|---|---|---|---|
| Heat | 1% | -7% | -6% | -1% | -6% | 6% | 7% | |
| Maximum Upper Side * (°C) | 44 | 36.6 17% | 46.8 -6% | 52 -18% | 37.6 15% | 56 -27% | 49 -11% | 47.7 -8% |
| Maximum Bottom * (°C) | 63 | 56.8 10% | 59.8 5% | 55.6 12% | 45.2 28% | 66 -5% | 49 22% | 46.1 27% |
| Idle Upper Side * (°C) | 27 | 28.2 -4% | 28.6 -6% | 29.8 -10% | 32.2 -19% | 27 -0% | 25.4 6% | 26.2 3% |
| Idle Bottom * (°C) | 29 | 35 -21% | 34.4 -19% | 31 -7% | 37.2 -28% | 27 7% | 27.2 6% | 27.1 7% |
* ... smaller is better
Aorus 15 W9 audio analysis
(±) | speaker loudness is average but good (76 dB)
Bass 100 - 315 Hz
(-) | nearly no bass - on average 18.3% lower than median
(±) | linearity of bass is average (13% delta to prev. frequency)
Mids 400 - 2000 Hz
(+) | balanced mids - only 2.4% away from median
(+) | mids are linear (3.8% delta to prev. frequency)
Highs 2 - 16 kHz
(+) | balanced highs - only 2.1% away from median
(±) | linearity of highs is average (7.6% delta to prev. frequency)
Overall 100 - 16.000 Hz
(±) | linearity of overall sound is average (17.2% difference to median)
Compared to same class
» 46% of all tested devices in this class were better, 11% similar, 42% worse
» The best had a delta of 6%, average was 18%, worst was 132%
Compared to all devices tested
» 32% of all tested devices were better, 8% similar, 60% worse
» The best had a delta of 4%, average was 23%, worst was 134%
Gigabyte Aero 15-X9 audio analysis
(±) | speaker loudness is average but good (81 dB)
Bass 100 - 315 Hz
(±) | reduced bass - on average 14% lower than median
(±) | linearity of bass is average (13.7% delta to prev. frequency)
Mids 400 - 2000 Hz
(±) | higher mids - on average 6.2% higher than median
(±) | linearity of mids is average (7.9% delta to prev. frequency)
Highs 2 - 16 kHz
(+) | balanced highs - only 4.4% away from median
(±) | linearity of highs is average (9.7% delta to prev. frequency)
Overall 100 - 16.000 Hz
(±) | linearity of overall sound is average (17.5% difference to median)
Compared to same class
» 49% of all tested devices in this class were better, 12% similar, 40% worse
» The best had a delta of 6%, average was 18%, worst was 132%
Compared to all devices tested
» 34% of all tested devices were better, 8% similar, 58% worse
» The best had a delta of 4%, average was 23%, worst was 134%
| Off / Standby | |
| Idle | |
| Load |
|
Key:
min: | |
| Aorus 15 W9 i7-8750H, GeForce RTX 2060 Mobile | Aorus 15 X9 i7-8750H, GeForce RTX 2070 Mobile | MSI GS65 Stealth Thin 8RE-051US i7-8750H, GeForce GTX 1060 Mobile | Alienware m15 GTX 1070 Max-Q i7-8750H, GeForce GTX 1070 Max-Q | Lenovo Legion Y740-15ICHg i7-8750H, GeForce RTX 2070 Max-Q | Gigabyte Aero 15-X9 i7-8750H, GeForce RTX 2070 Max-Q | Razer Blade 15 RTX 2070 Max-Q i7-8750H, GeForce RTX 2070 Max-Q | Asus Zephyrus S GX531GM i7-8750H, GeForce GTX 1060 Mobile | |
|---|---|---|---|---|---|---|---|---|
| Power Consumption | -33% | 22% | 20% | -9% | 9% | 15% | 10% | |
| Idle Minimum * (Watt) | 18 | 26 -44% | 8.7 52% | 7.6 58% | 22.9 -27% | 16 11% | 10.4 42% | 13.8 23% |
| Idle Average * (Watt) | 20 | 30.8 -54% | 13 35% | 13.8 31% | 27.2 -36% | 18 10% | 14.6 27% | 20.9 -5% |
| Idle Maximum * (Watt) | 28 | 34.9 -25% | 14.3 49% | 14.6 48% | 27.5 2% | 23 18% | 16.3 42% | 26 7% |
| Load Average * (Watt) | 87 | 90.7 -4% | 107.4 -23% | 97.6 -12% | 83.4 4% | 88 -1% | 88.5 -2% | 89 -2% |
| Witcher 3 ultra * (Watt) | 135 | 175 -30% | 129 4% | 145.8 -8% | 143.6 -6% | 120 11% | 155.4 -15% | |
| Load Maximum * (Watt) | 175 | 241.2 -38% | 151.5 13% | 172.5 1% | 160.5 8% | 167 5% | 182.4 -4% | 131 25% |
* ... smaller is better
| Aorus 15 W9 i7-8750H, GeForce RTX 2060 Mobile, 62 Wh | Aorus 15 X9 i7-8750H, GeForce RTX 2070 Mobile, 62 Wh | MSI GS65 Stealth Thin 8RE-051US i7-8750H, GeForce GTX 1060 Mobile, 82 Wh | Alienware m15 GTX 1070 Max-Q i7-8750H, GeForce GTX 1070 Max-Q, 90 Wh | Lenovo Legion Y740-15ICHg i7-8750H, GeForce RTX 2070 Max-Q, 57 Wh | Gigabyte Aero 15-X9 i7-8750H, GeForce RTX 2070 Max-Q, 94.24 Wh | Razer Blade 15 RTX 2070 Max-Q i7-8750H, GeForce RTX 2070 Max-Q, 80 Wh | Asus Zephyrus S GX531GM i7-8750H, GeForce GTX 1060 Mobile, 53 Wh | |
|---|---|---|---|---|---|---|---|---|
| Battery runtime | -33% | 72% | 168% | 3% | 164% | 157% | 33% | |
| Reader / Idle (h) | 2.9 | 1.8 -38% | 10.5 262% | 3.9 34% | 9.2 217% | 11.4 293% | ||
| H.264 (h) | 2.3 | 6.1 165% | ||||||
| WiFi v1.3 (h) | 2.4 | 1.6 -33% | 6.2 158% | 7.7 221% | 2.8 17% | 6.4 167% | 6.5 171% | 3.2 33% |
| Load (h) | 1.4 | 1 -29% | 1.2 -14% | 1.7 21% | 0.8 -43% | 2.9 107% | 1.5 7% |
Pros
Cons
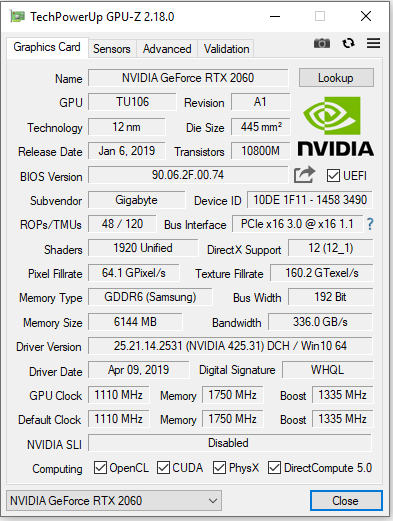
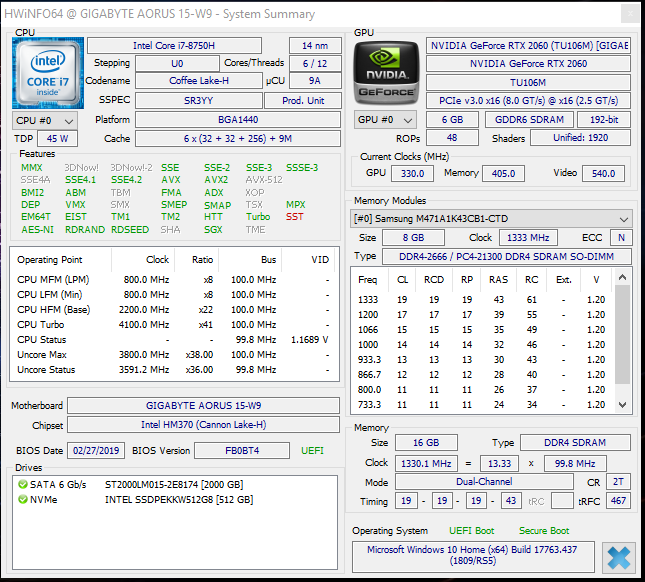
技嘉凭借Aorus 15-W9推出了15.6英寸的游戏笔记本电脑。这是Aorus X5 v8的更紧凑和轻便的继承者。内置的Core-i7-8750H处理器可在未来几年内为所有常用应用领域提供足够的计算能力。 GeForce RTX-2060图形核心可以在1080p画质下流畅运行任何游戏,您可以随时选择高特效。
在负载下,设备会显着升温并产生很多噪音。除了两个风扇的正常呼呼声之外,你还可以听到两个风扇之一产生的一些“吹口哨”声。
虽然Aorus 15-W9可以做到它应该做的事情,即流畅运行游戏,但它也有缺点。
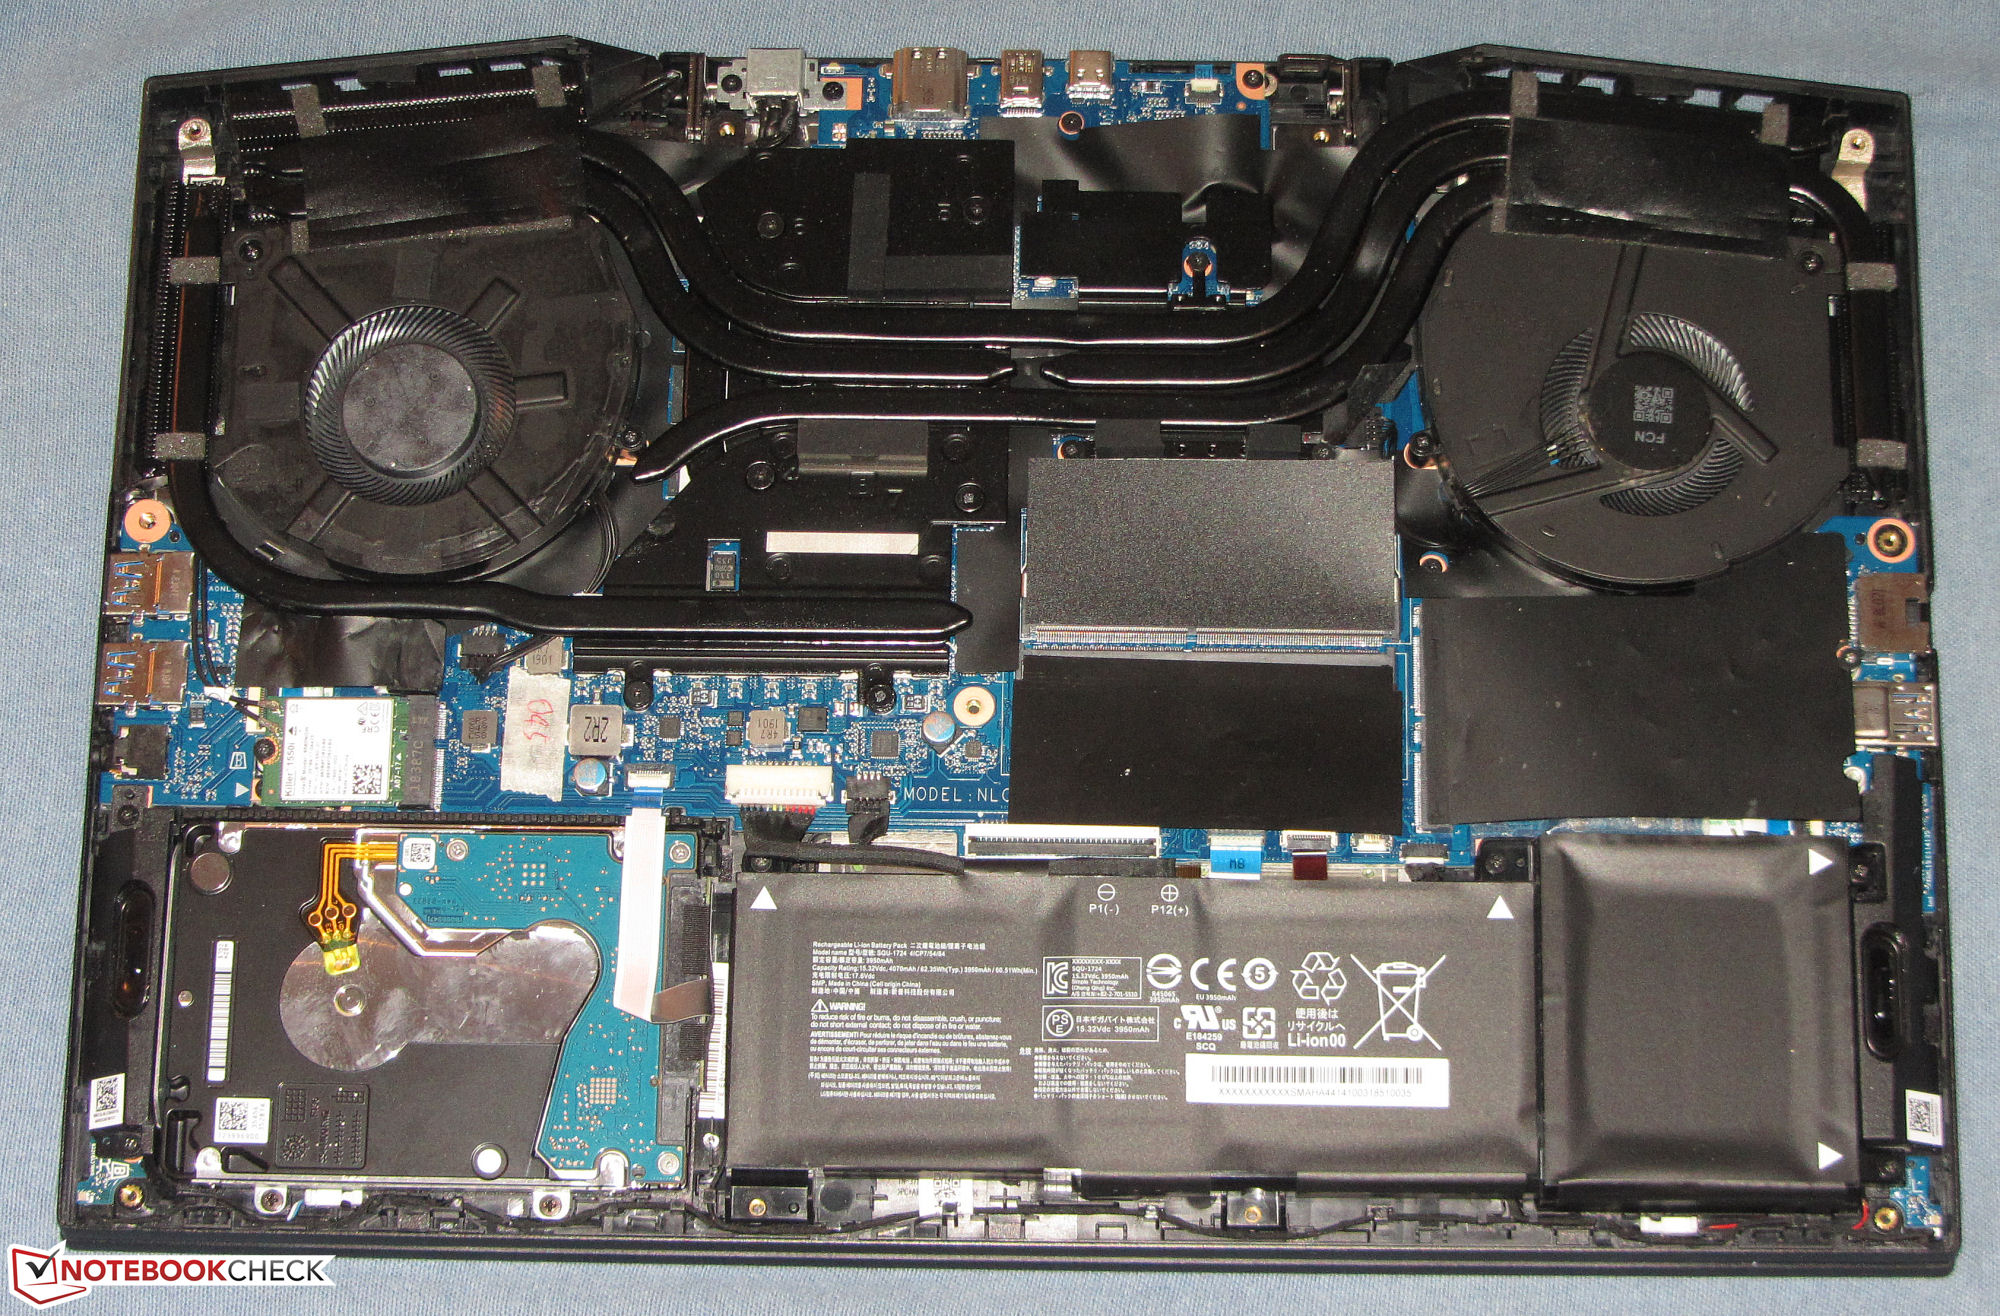
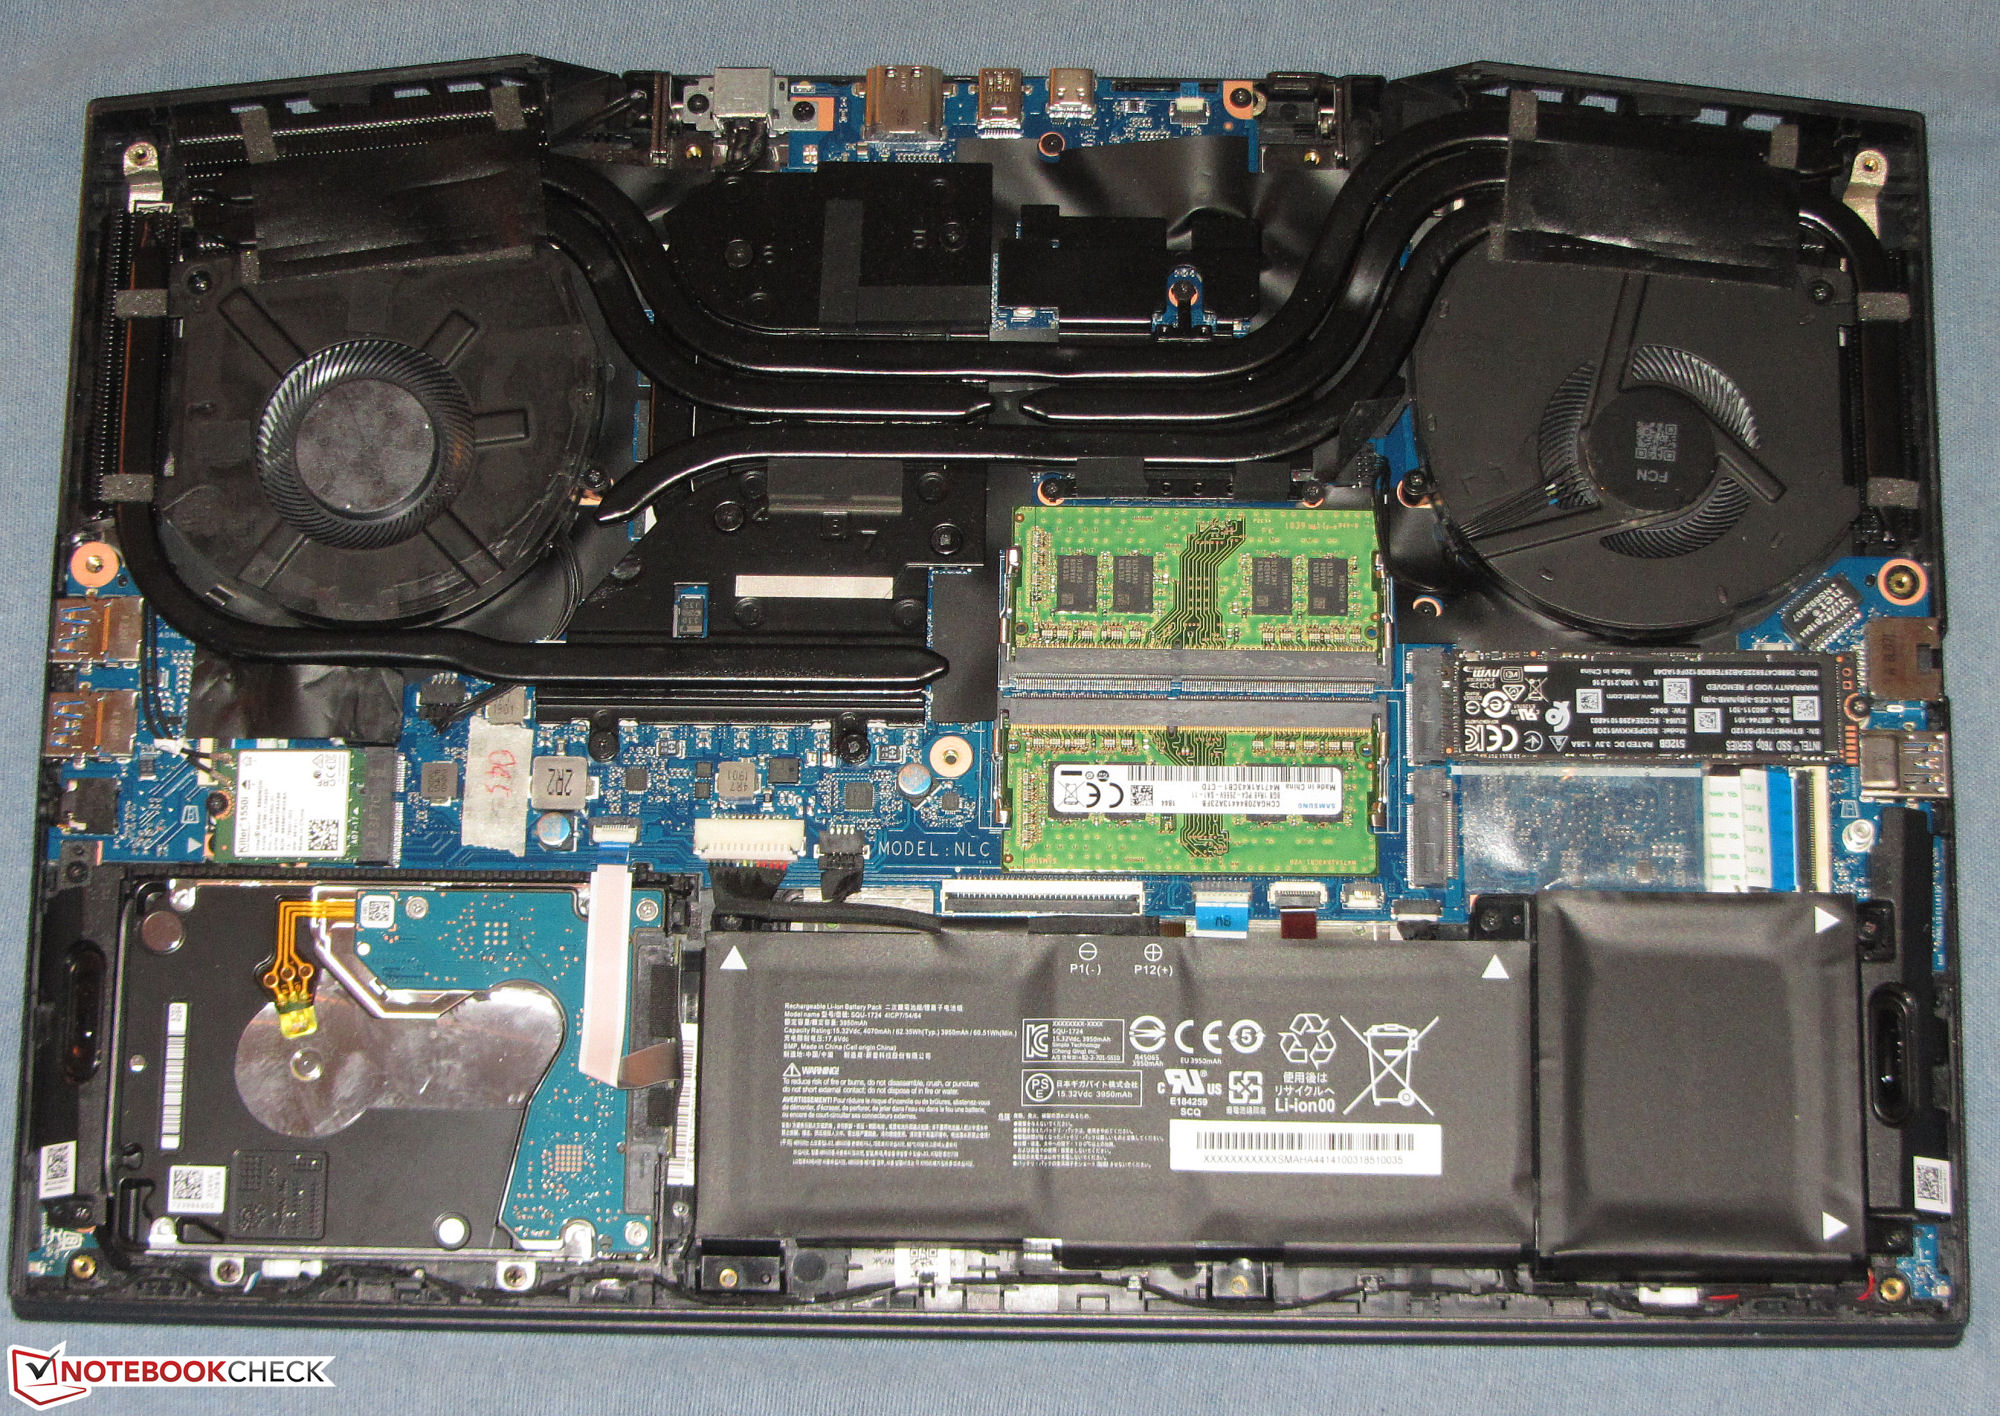
高速NVMe SSD可确保系统运行平稳,并且还有一个额外的2 TB硬盘驱动器,因此一段时间内不会缺少存储空间。还有一个扩展存储的选项,因为笔记本电脑提供了第二个未占用的M.2-2280存储插槽。
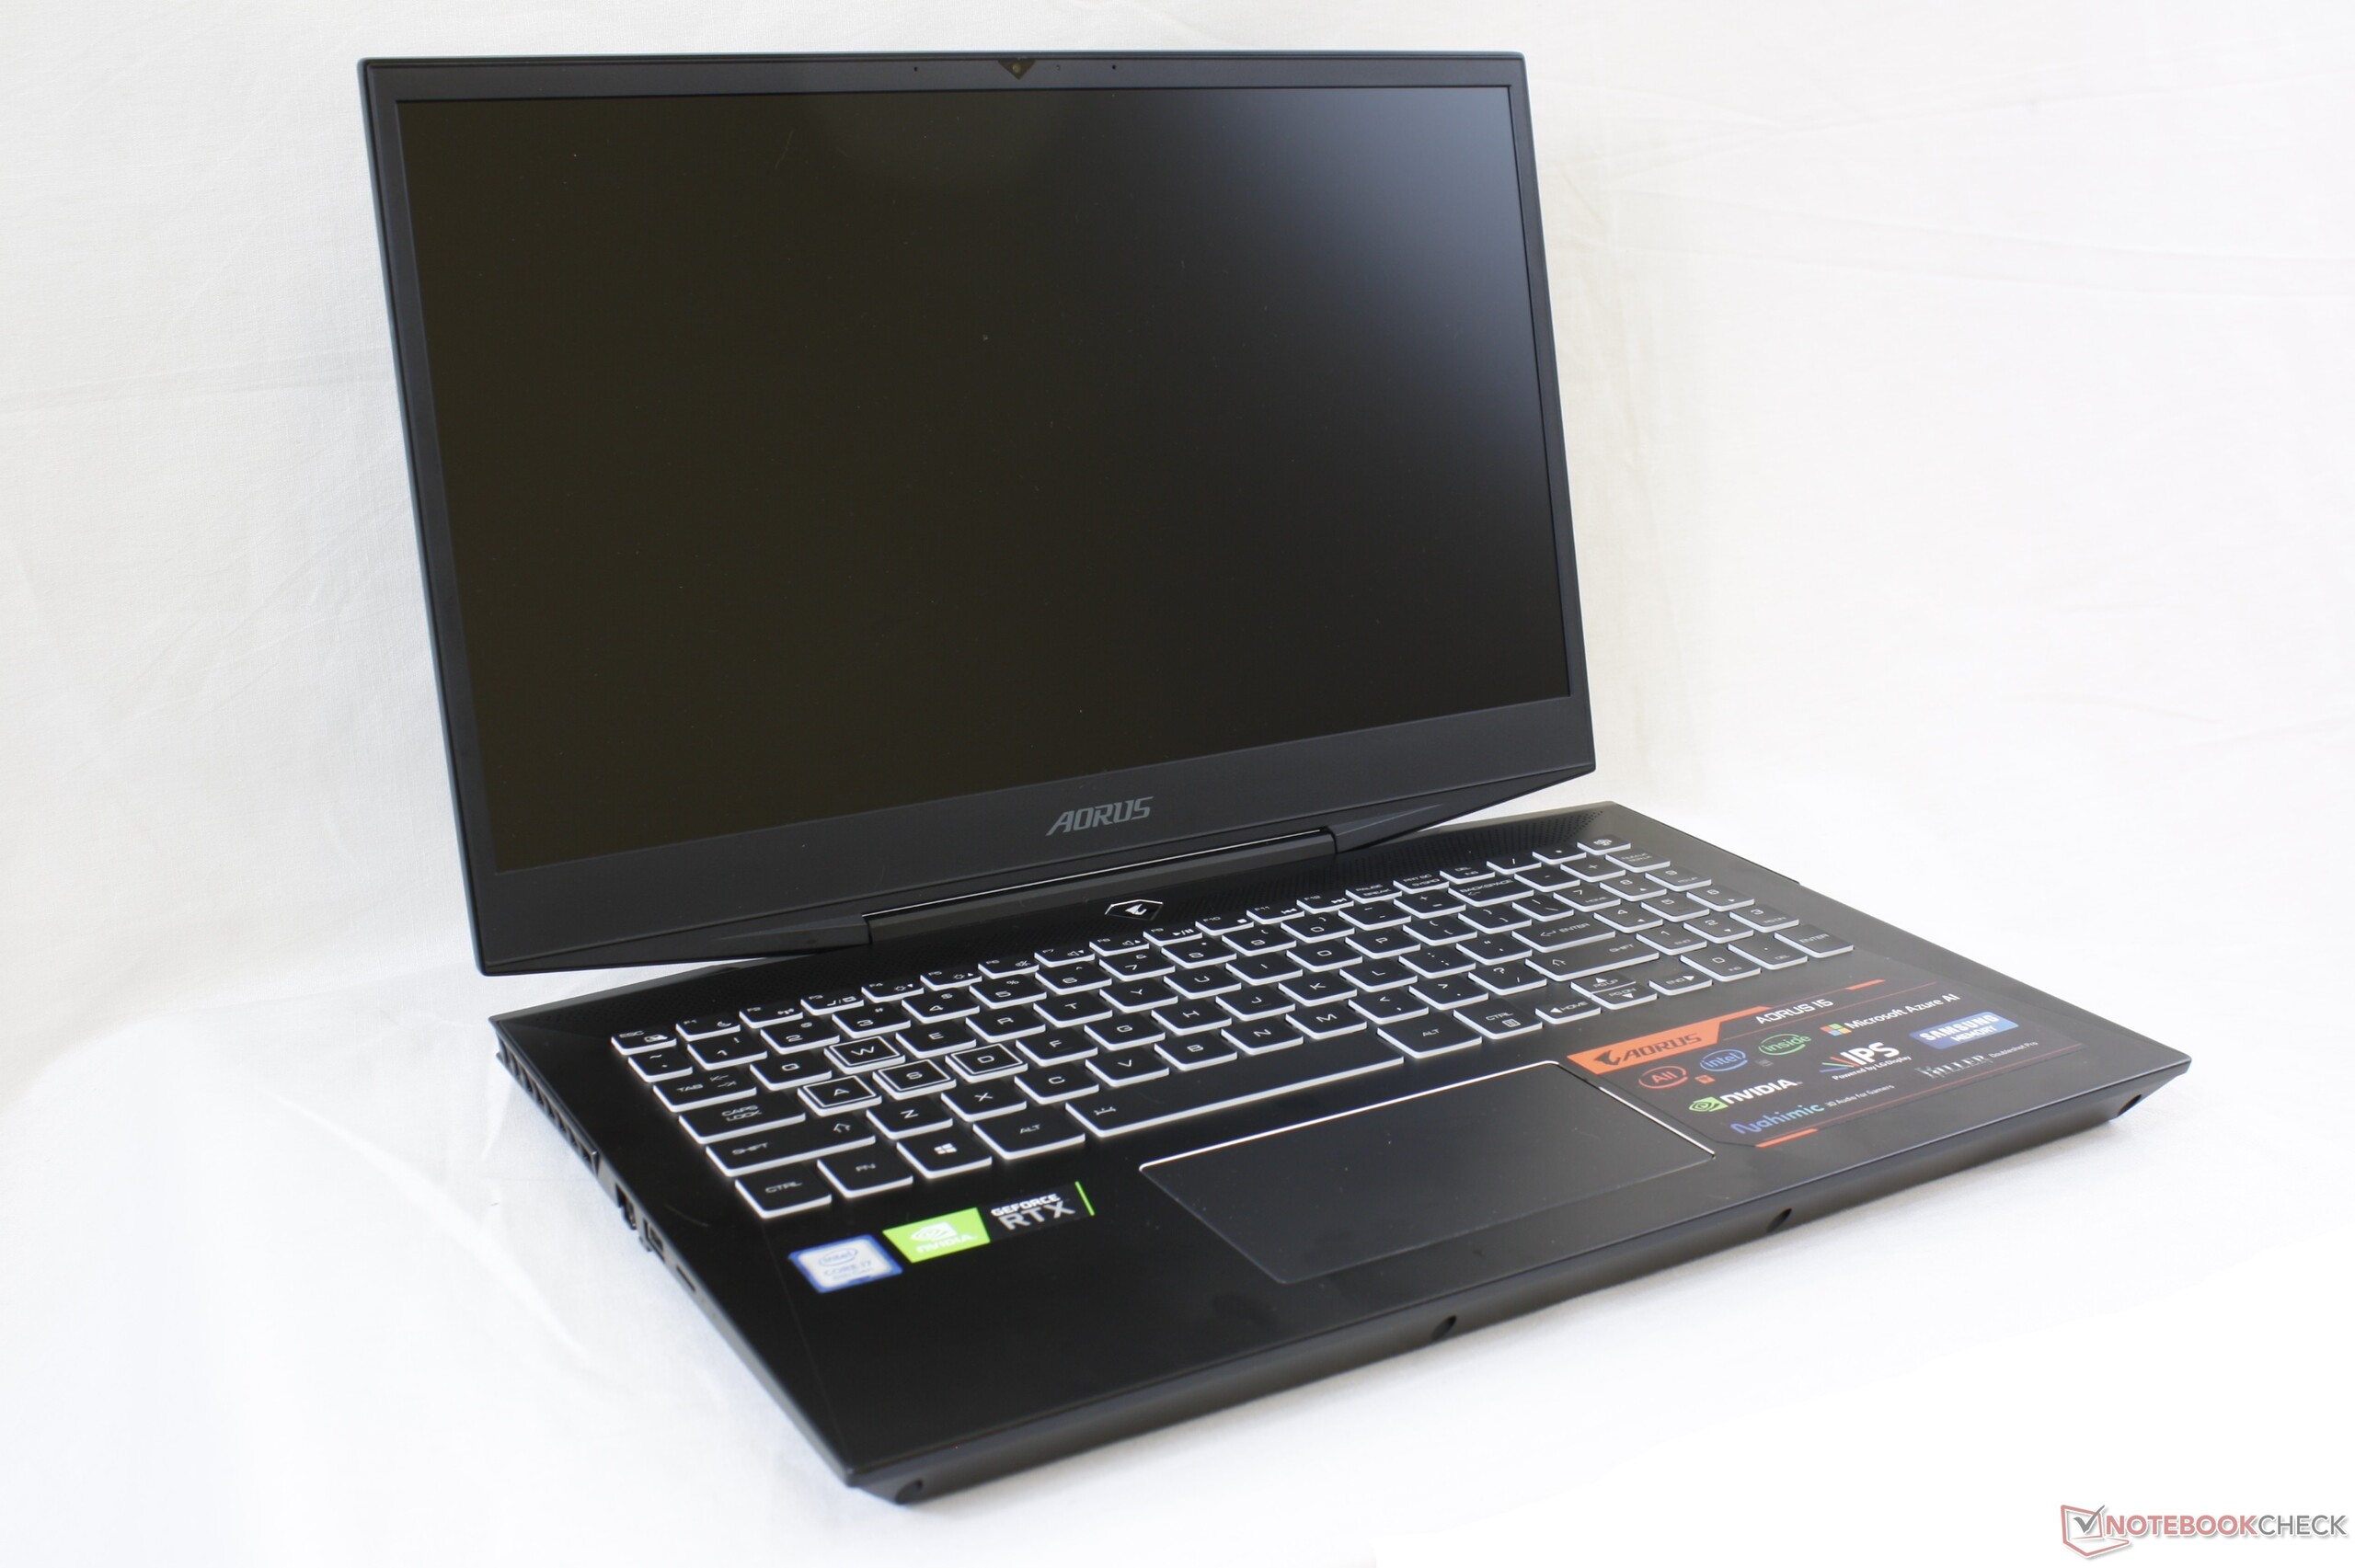
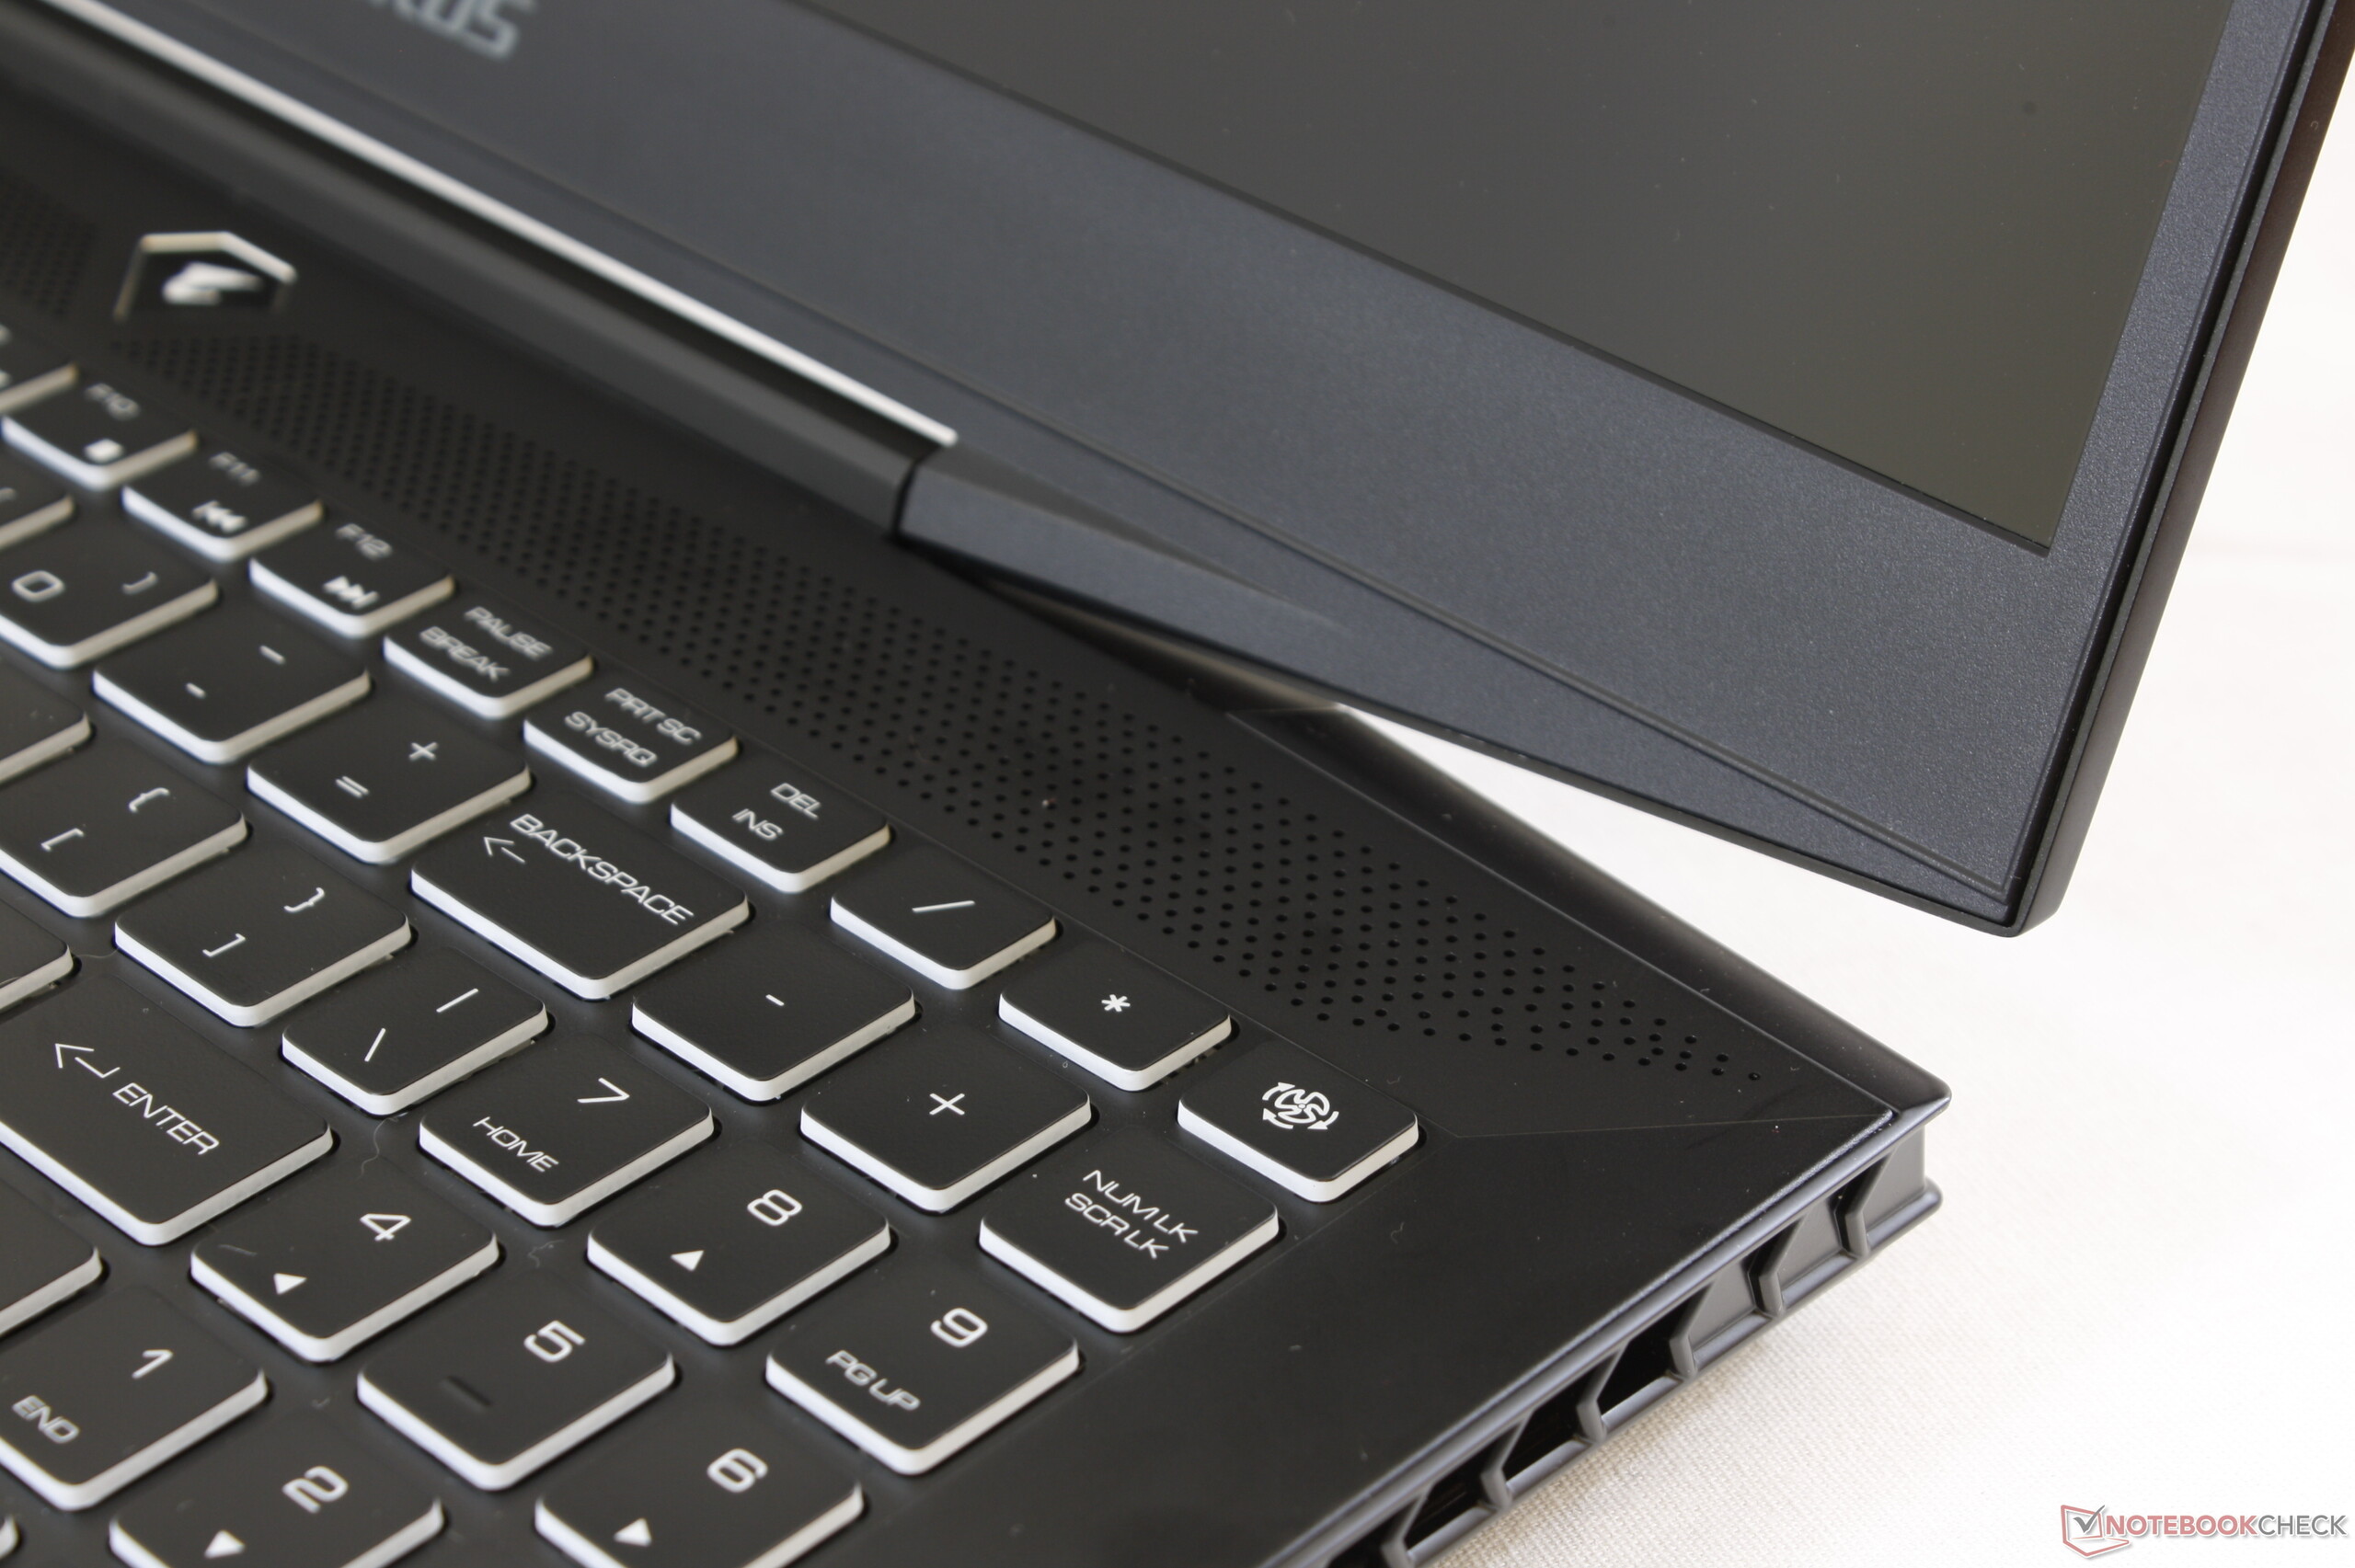
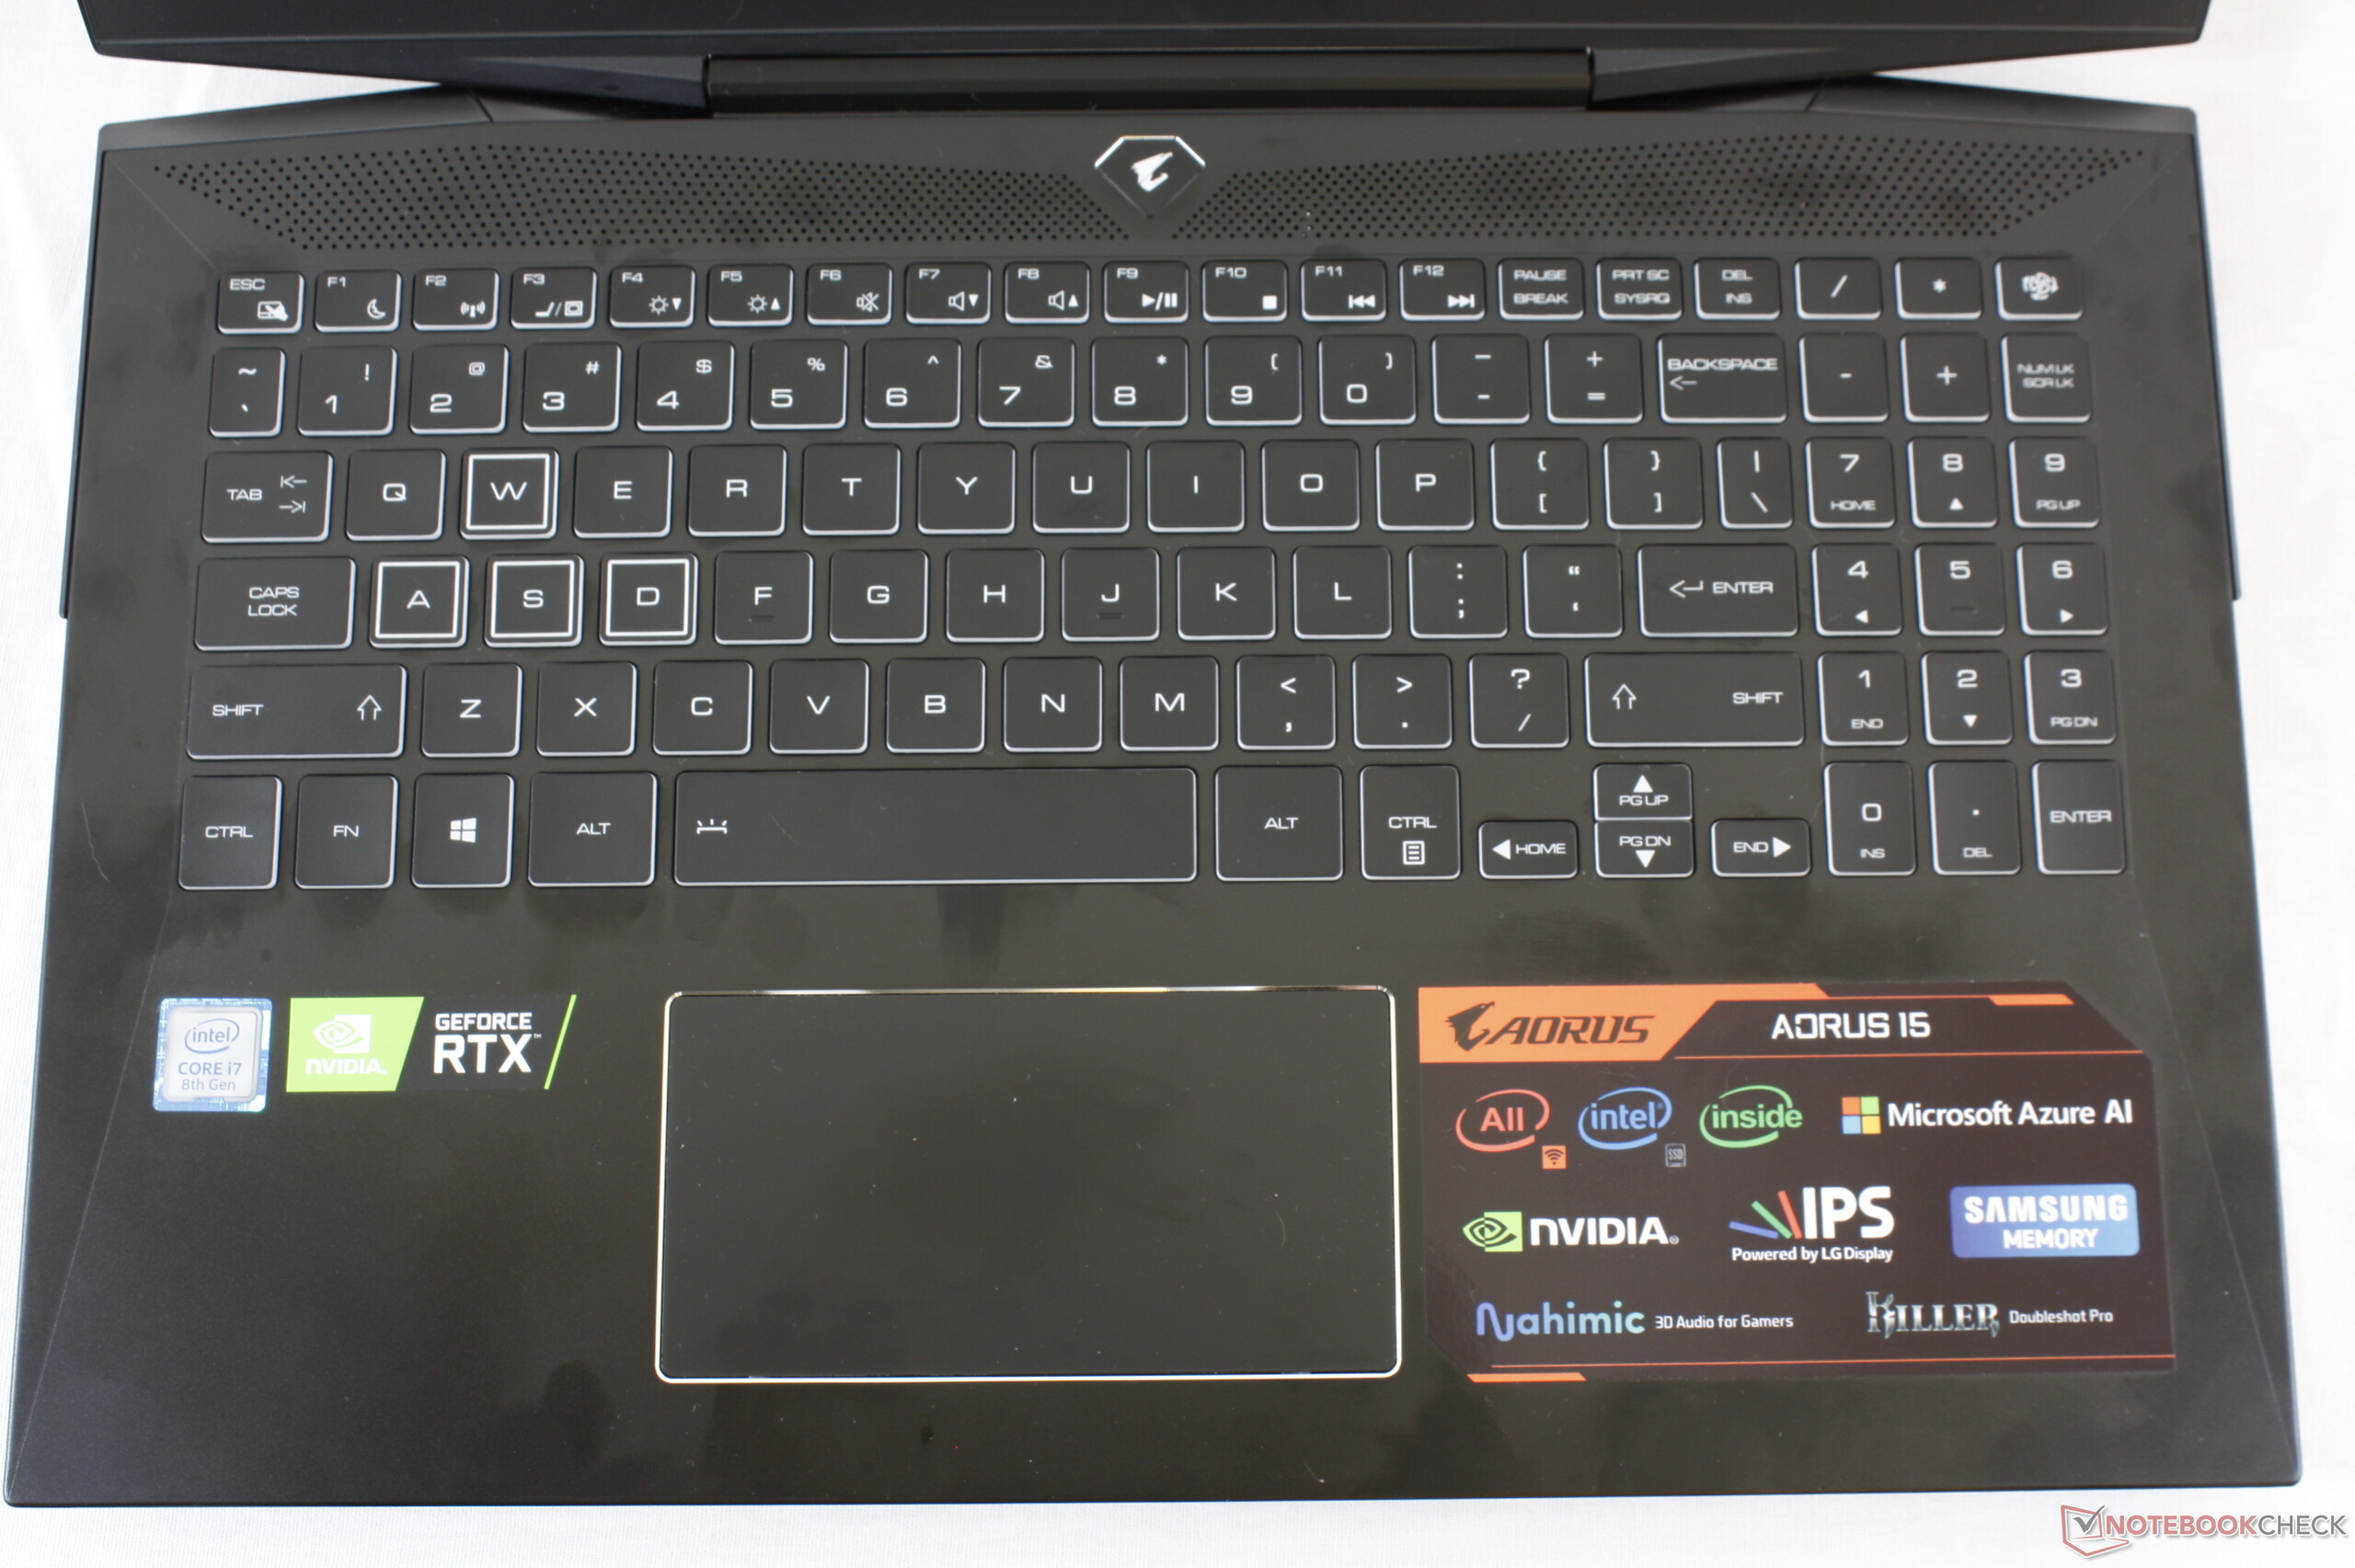
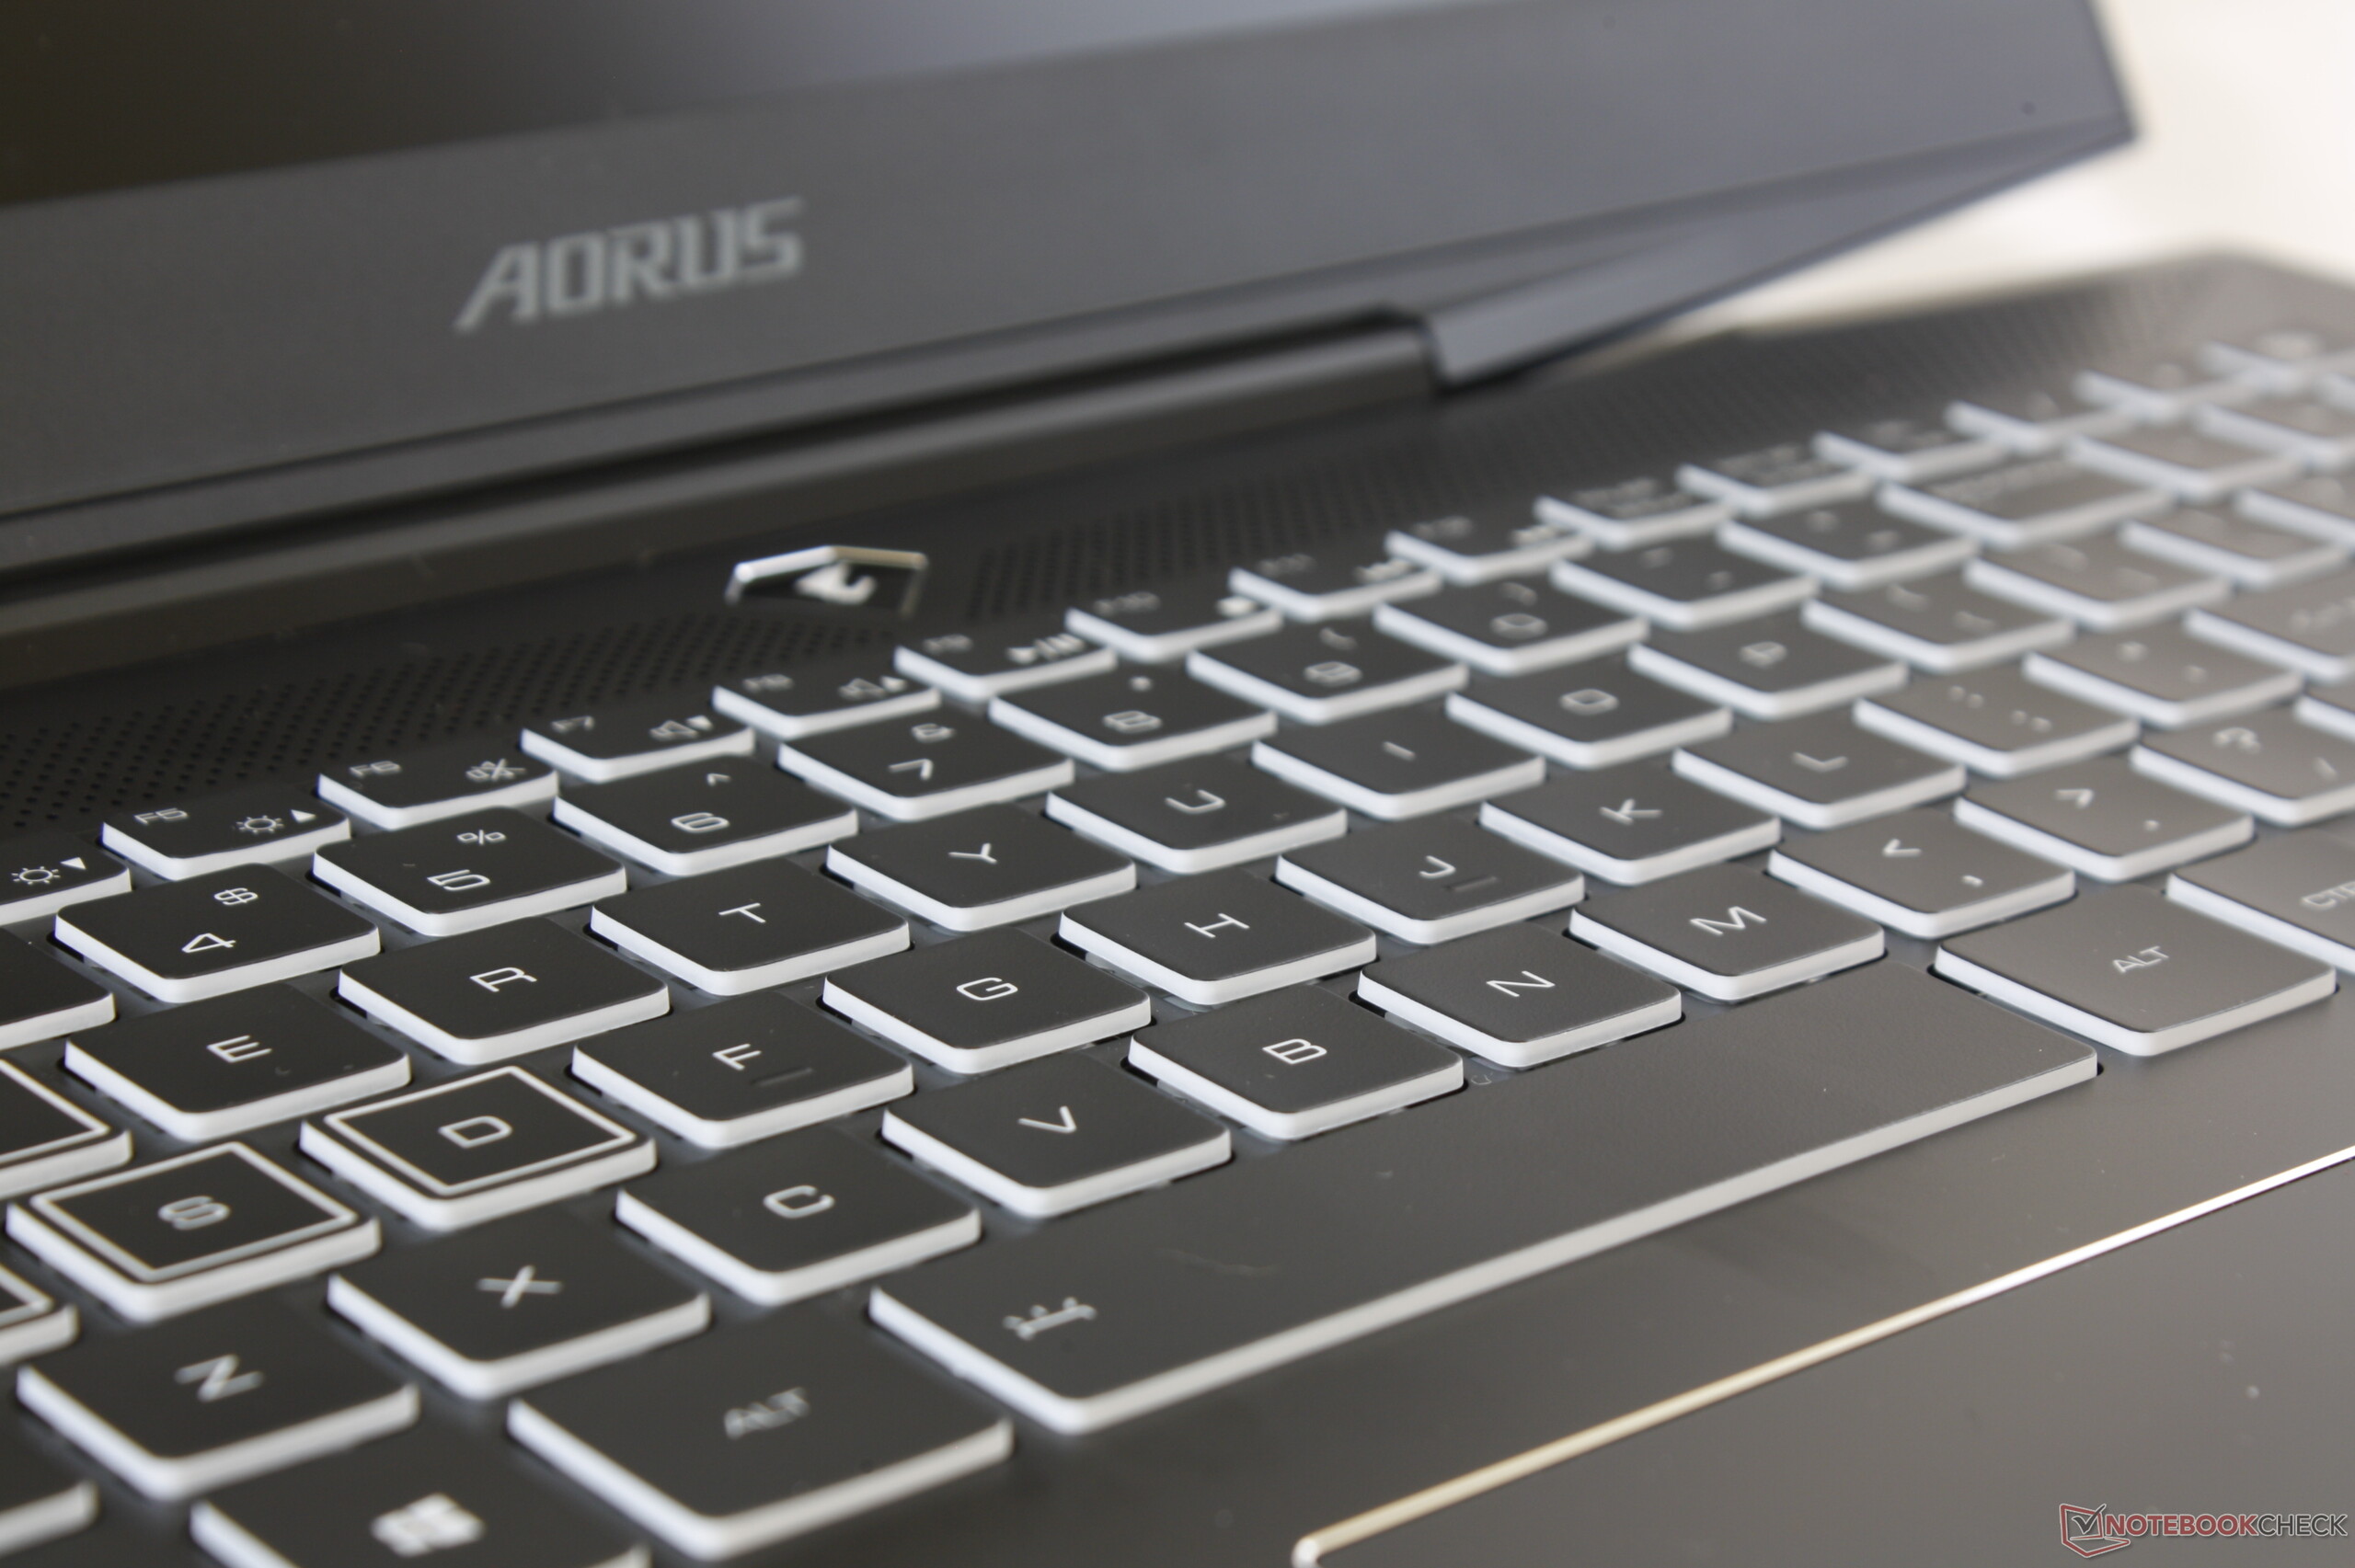
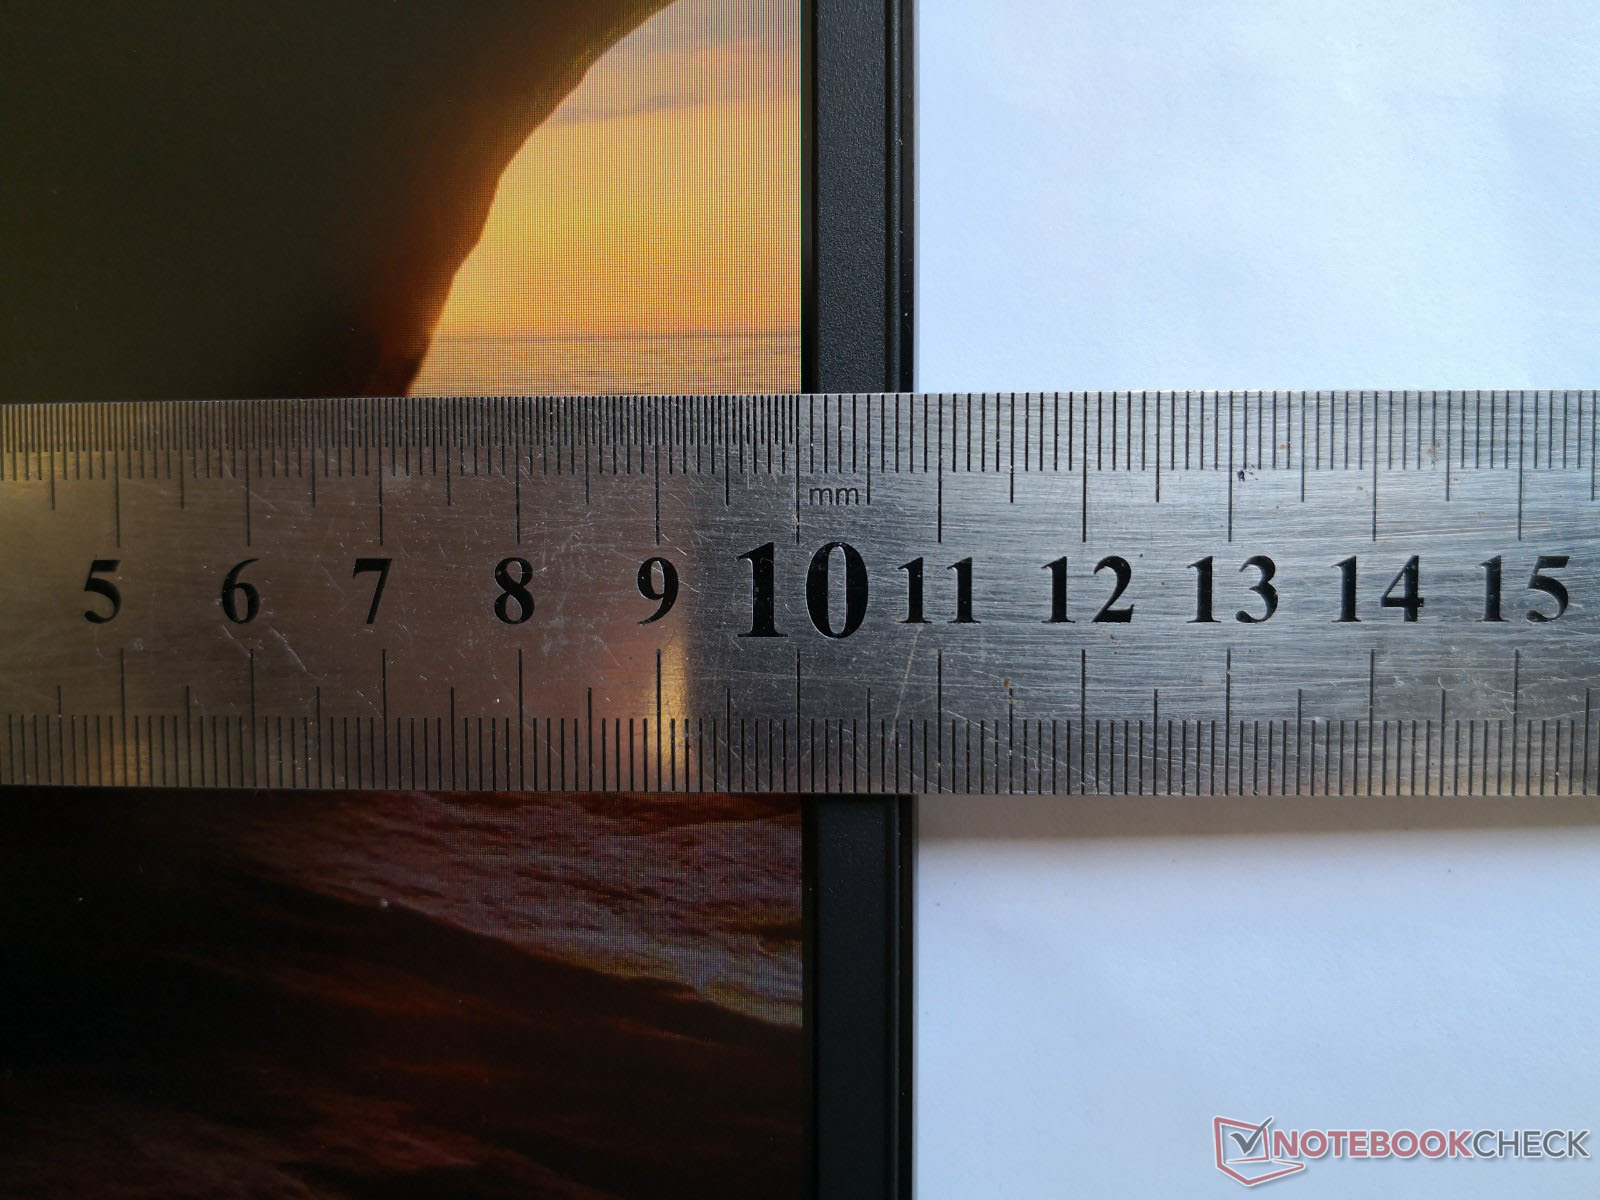
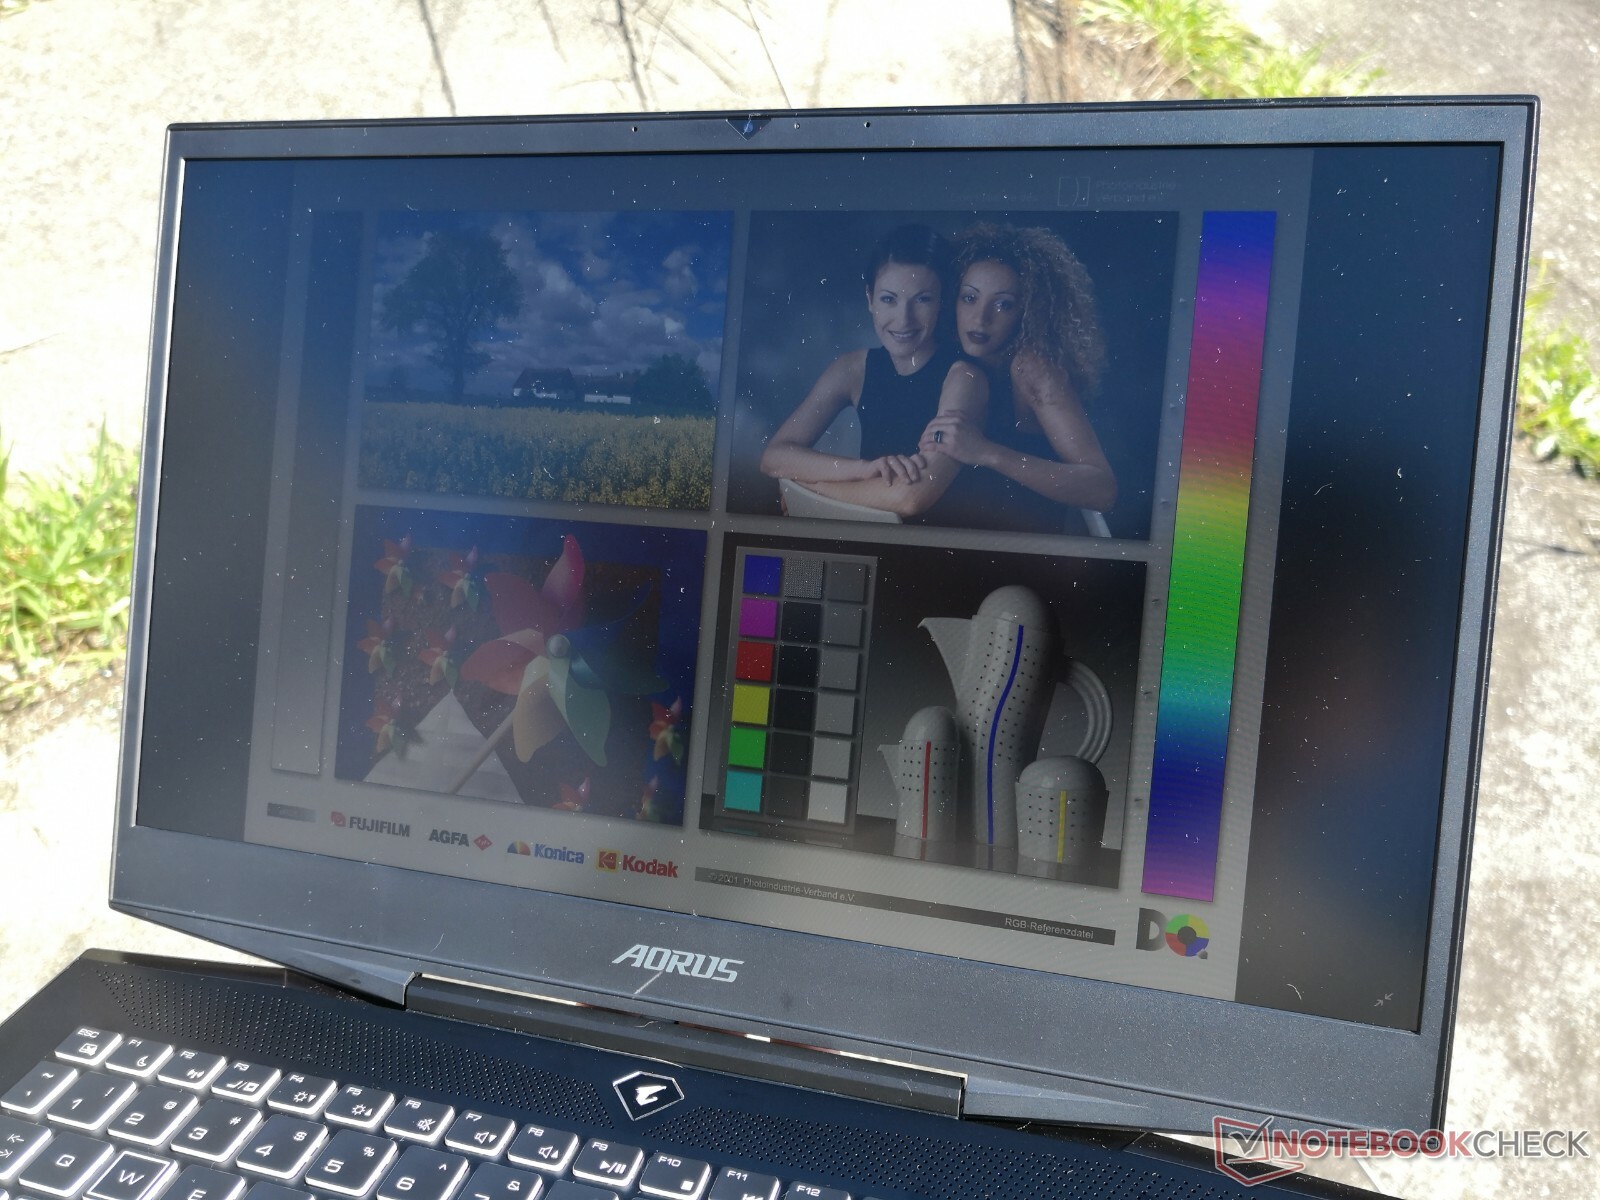
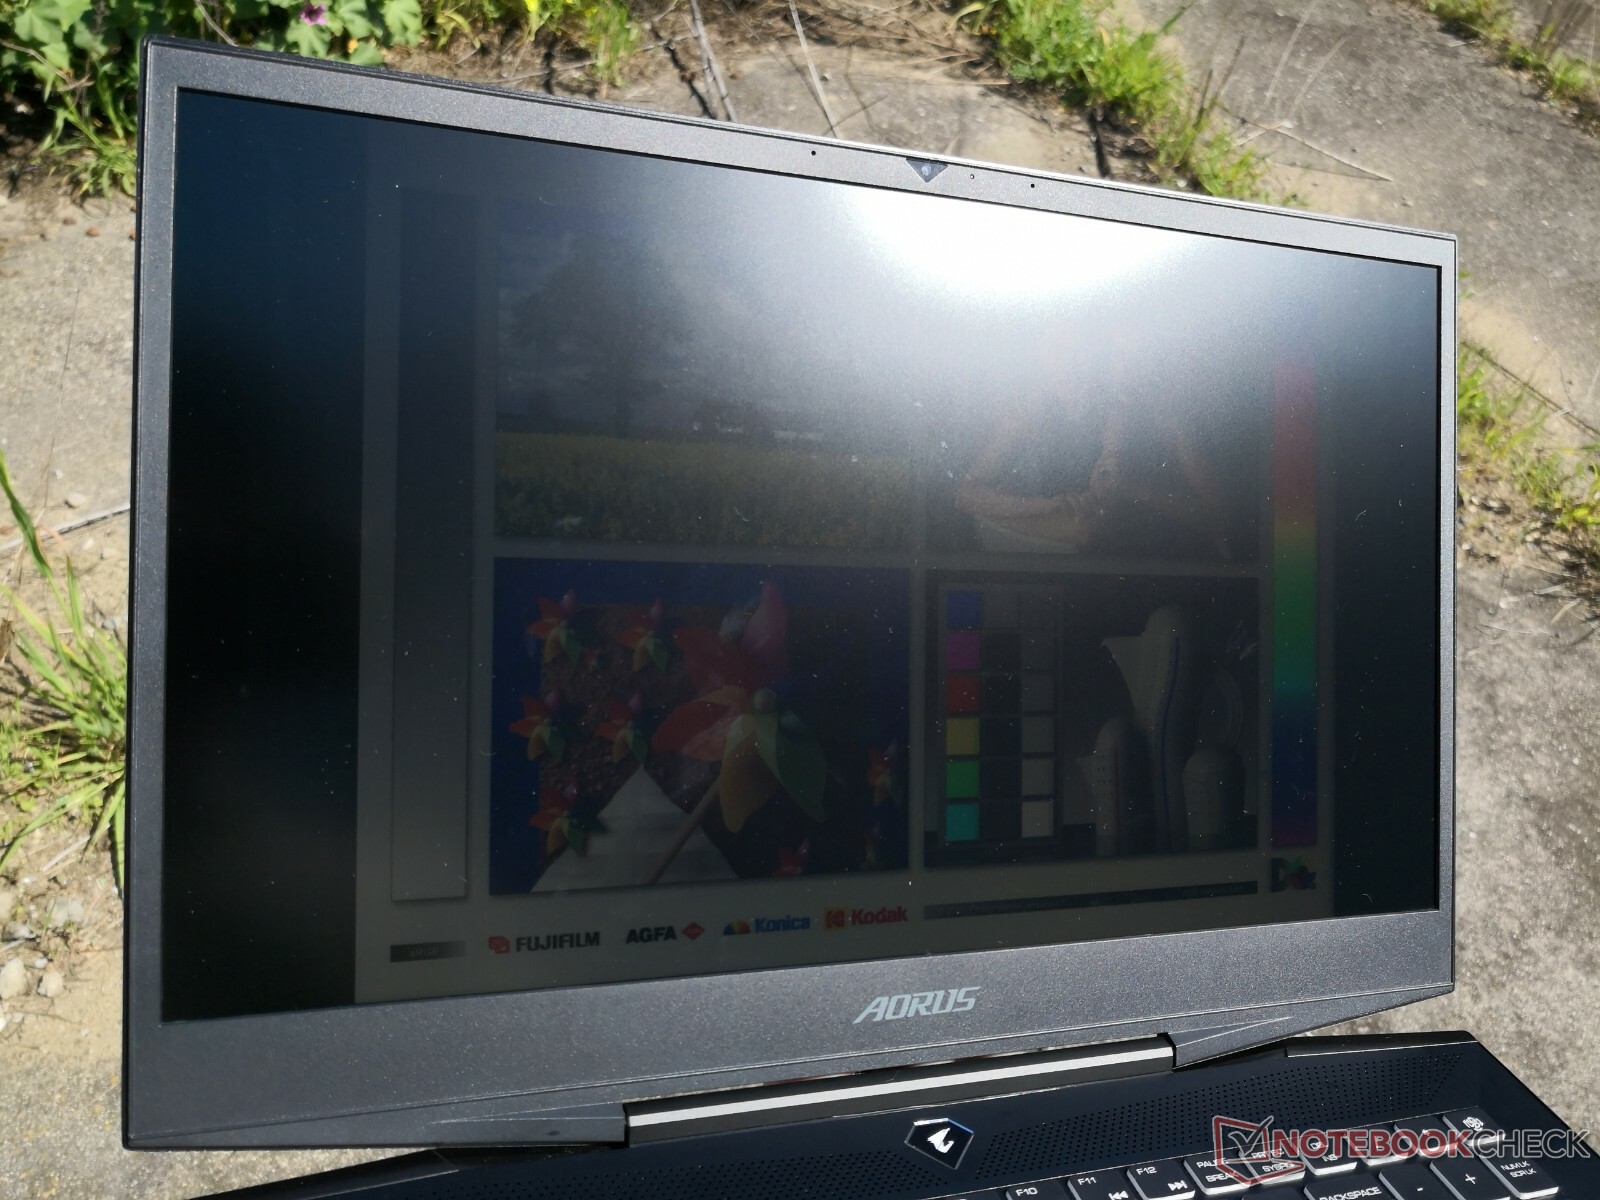
144 Hz IPS显示屏具有稳定的视角和较快的响应时间。虽然亮度和对比度是可以接受的,但在这个价格范围的笔记本电脑应该有更好的屏幕。内置键盘给我们留下了良好的印象。但续航时间很一般。
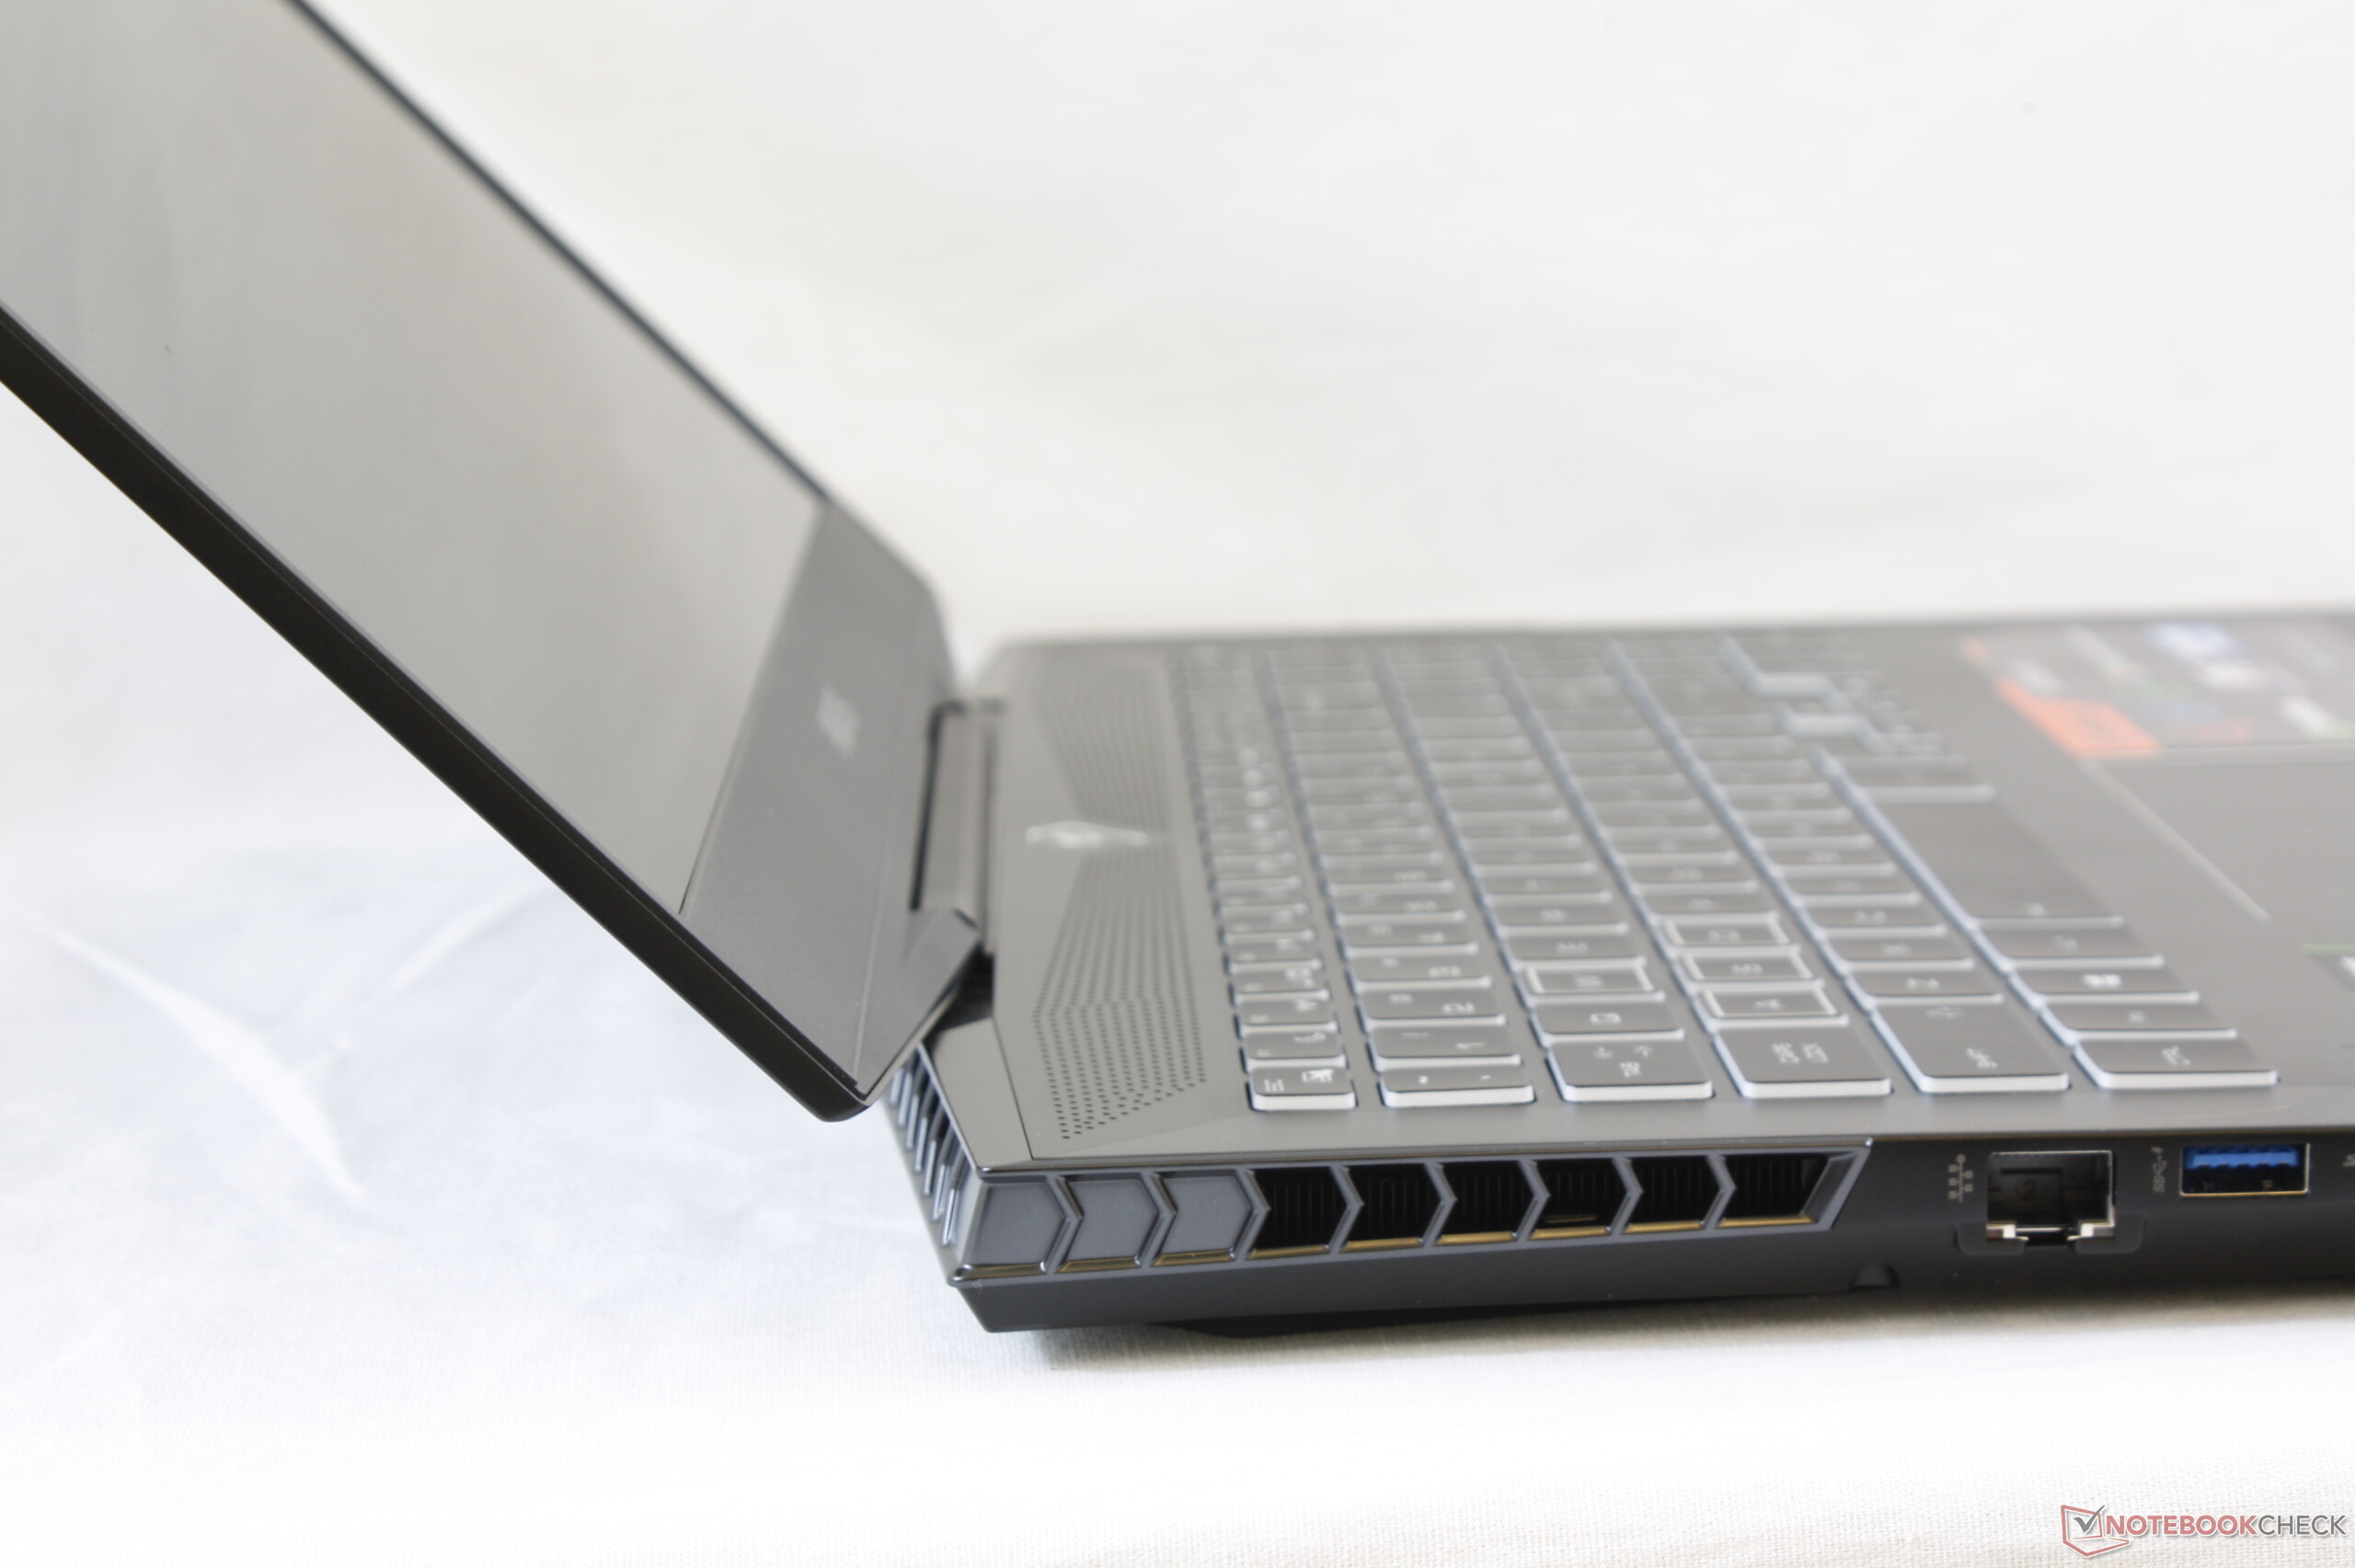
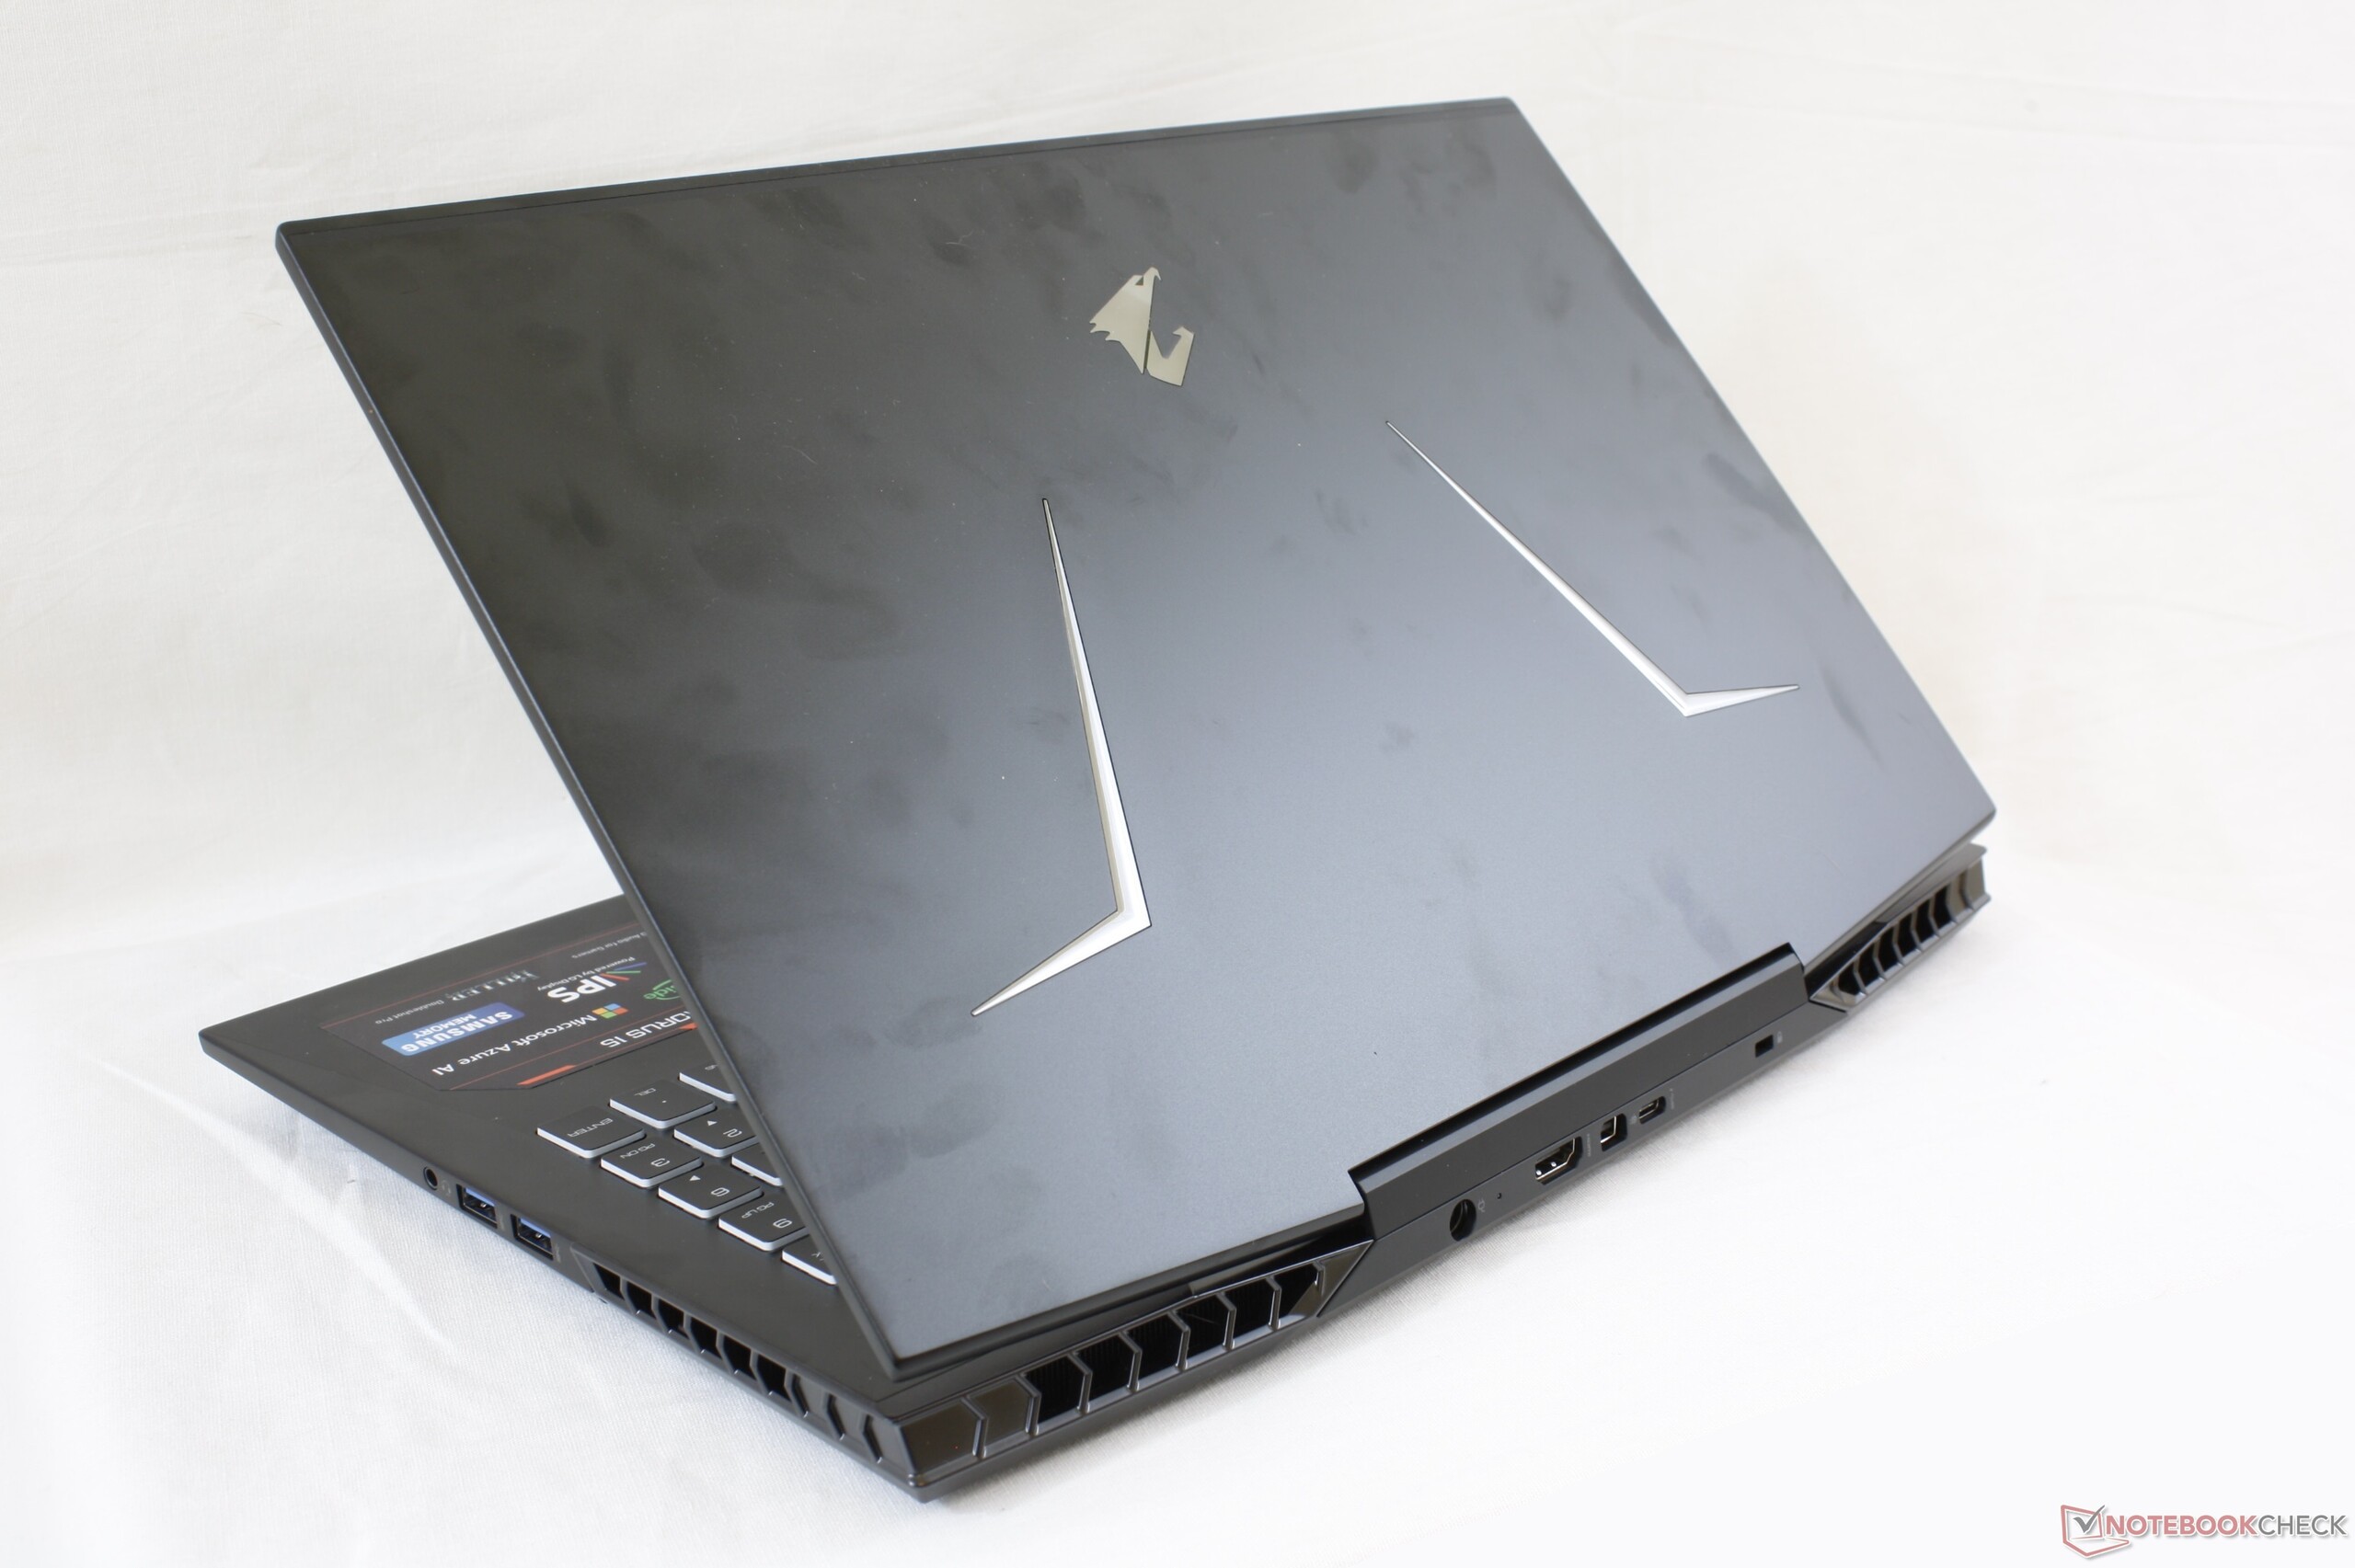
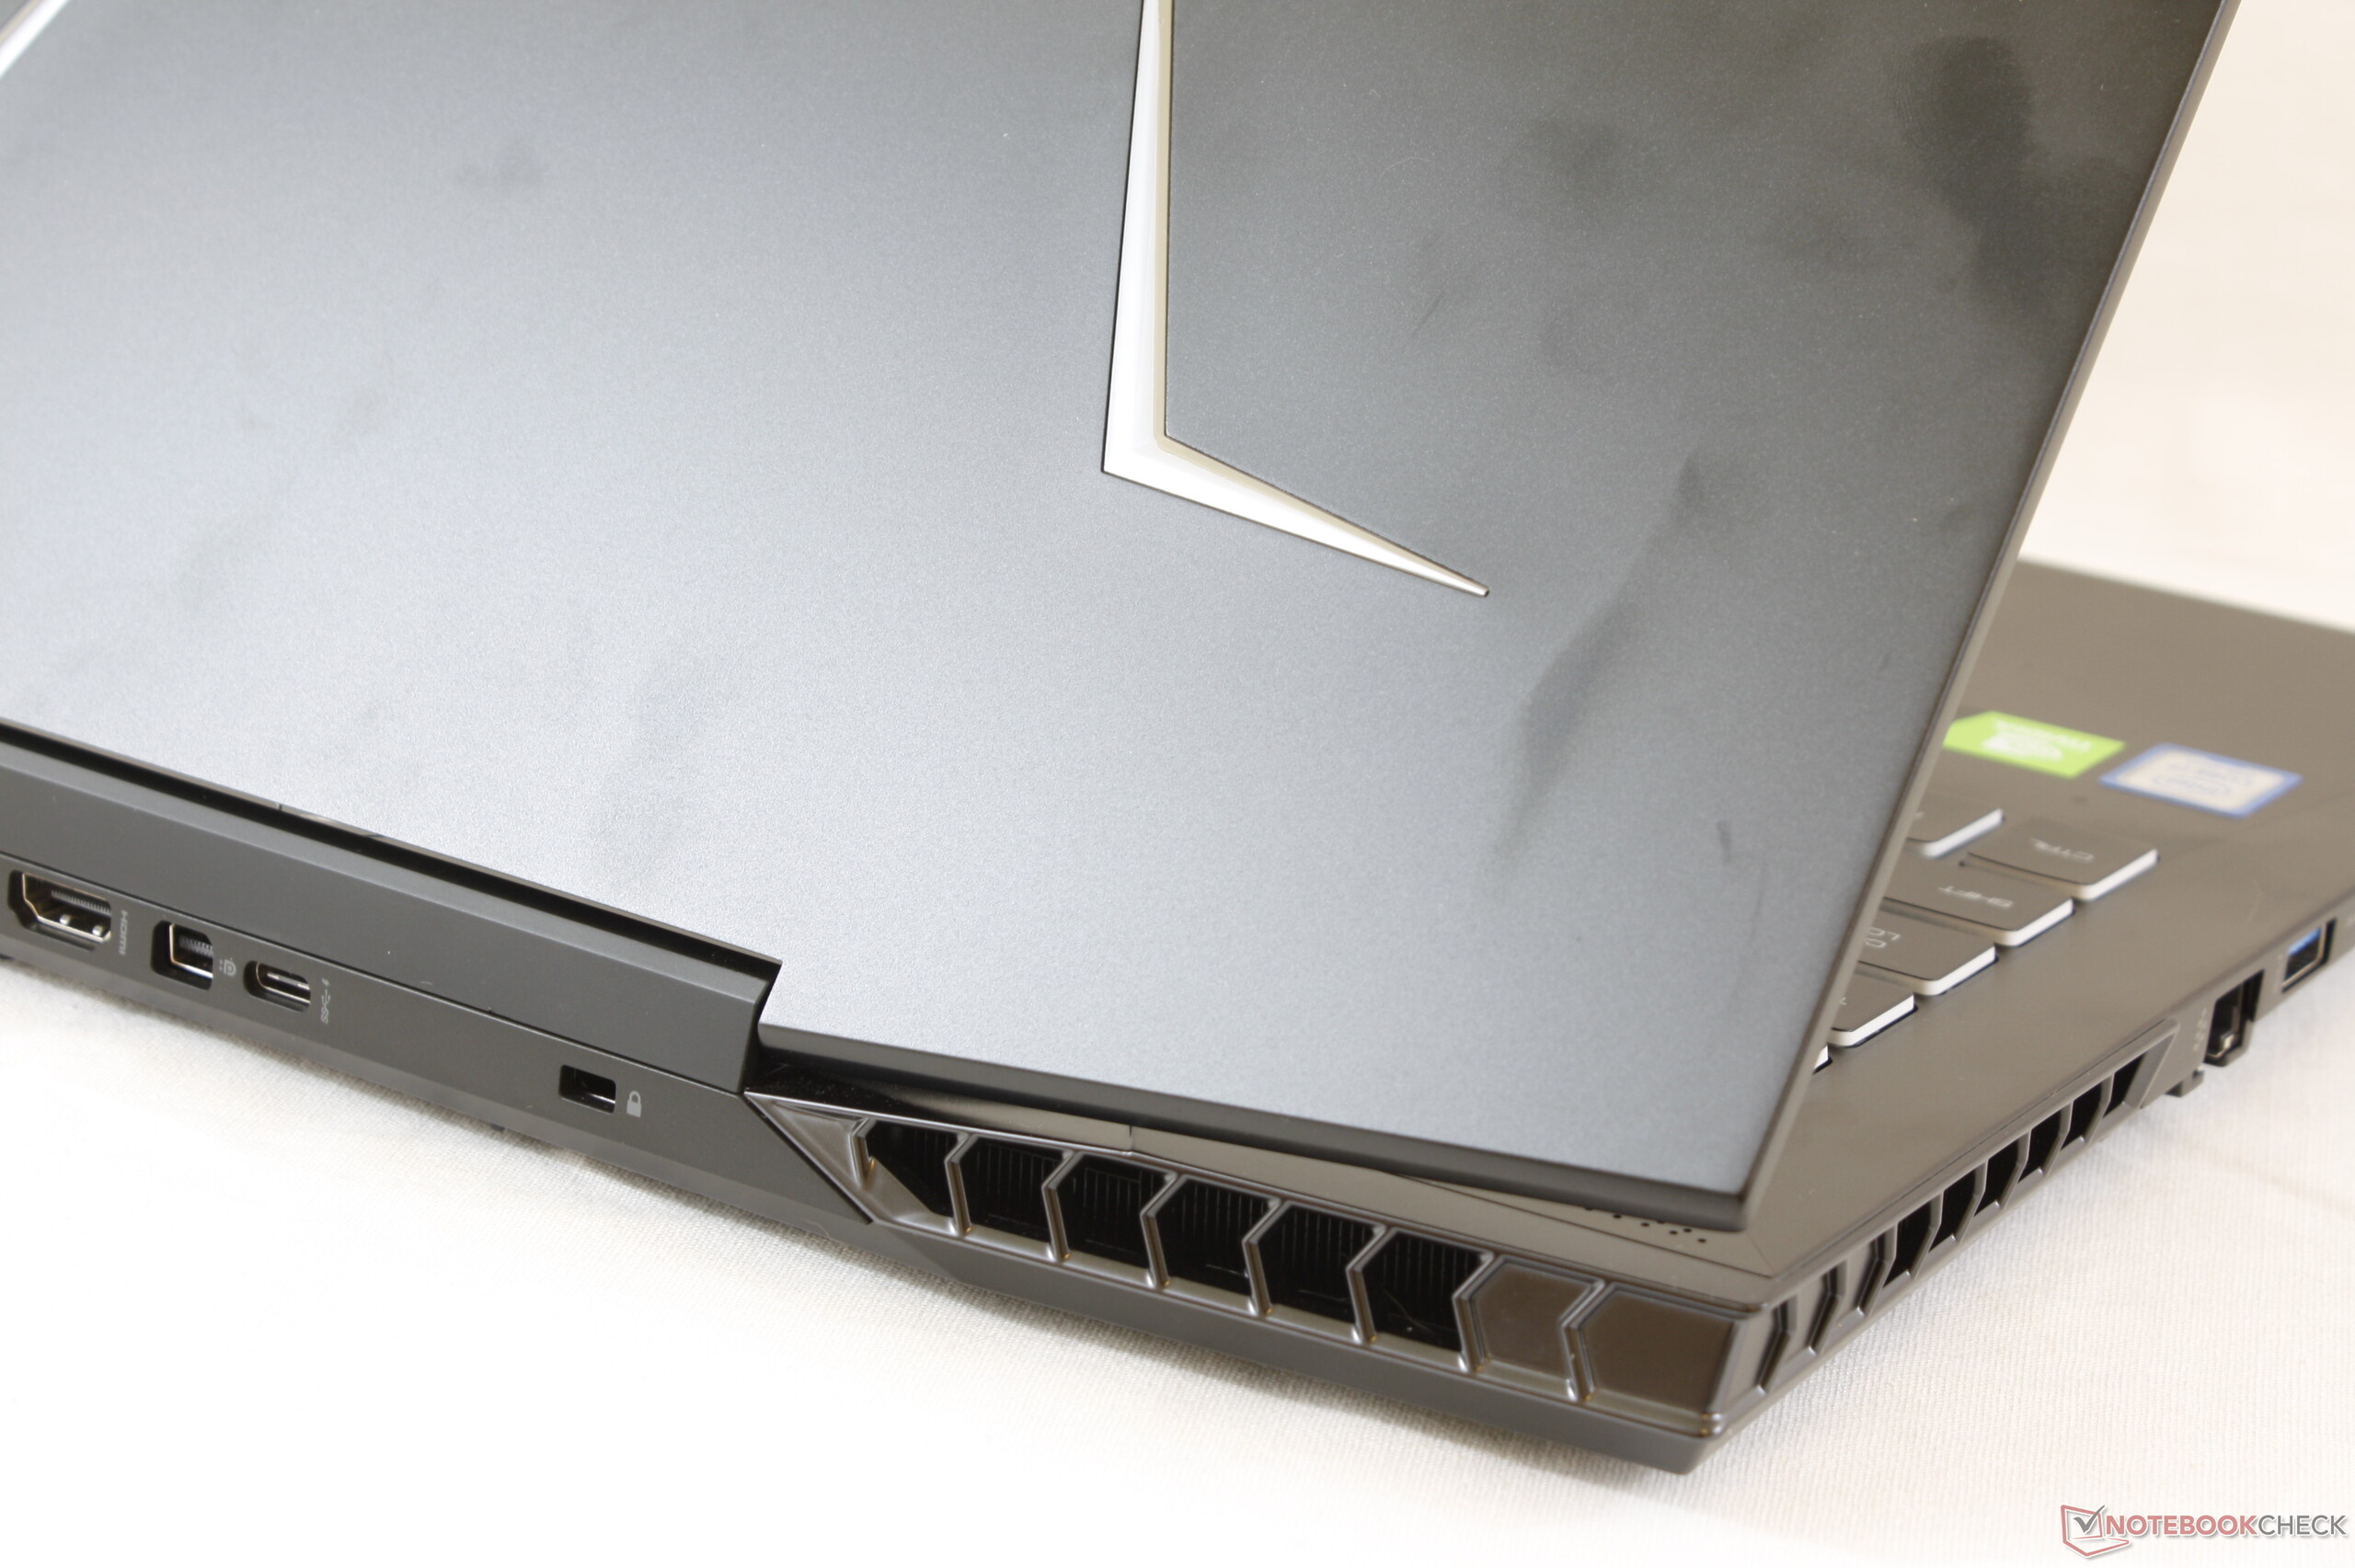
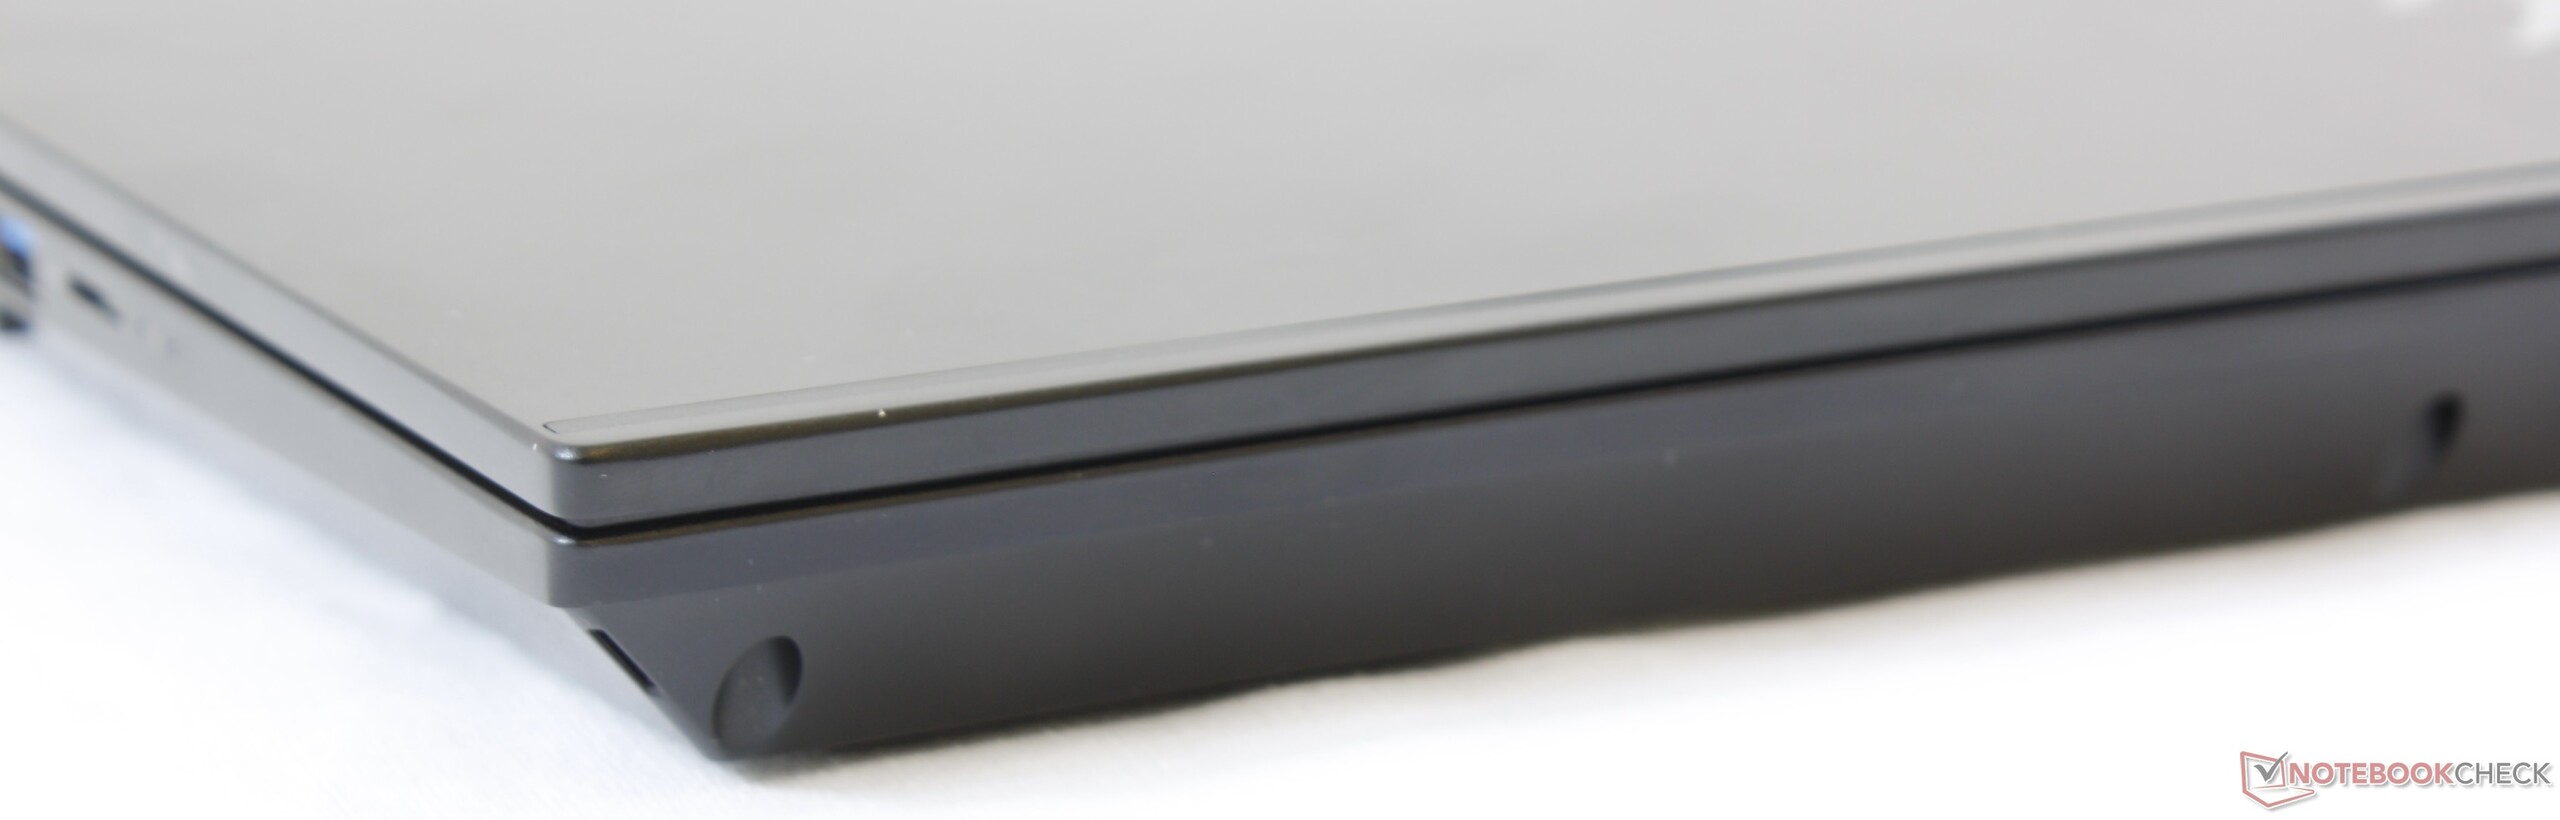
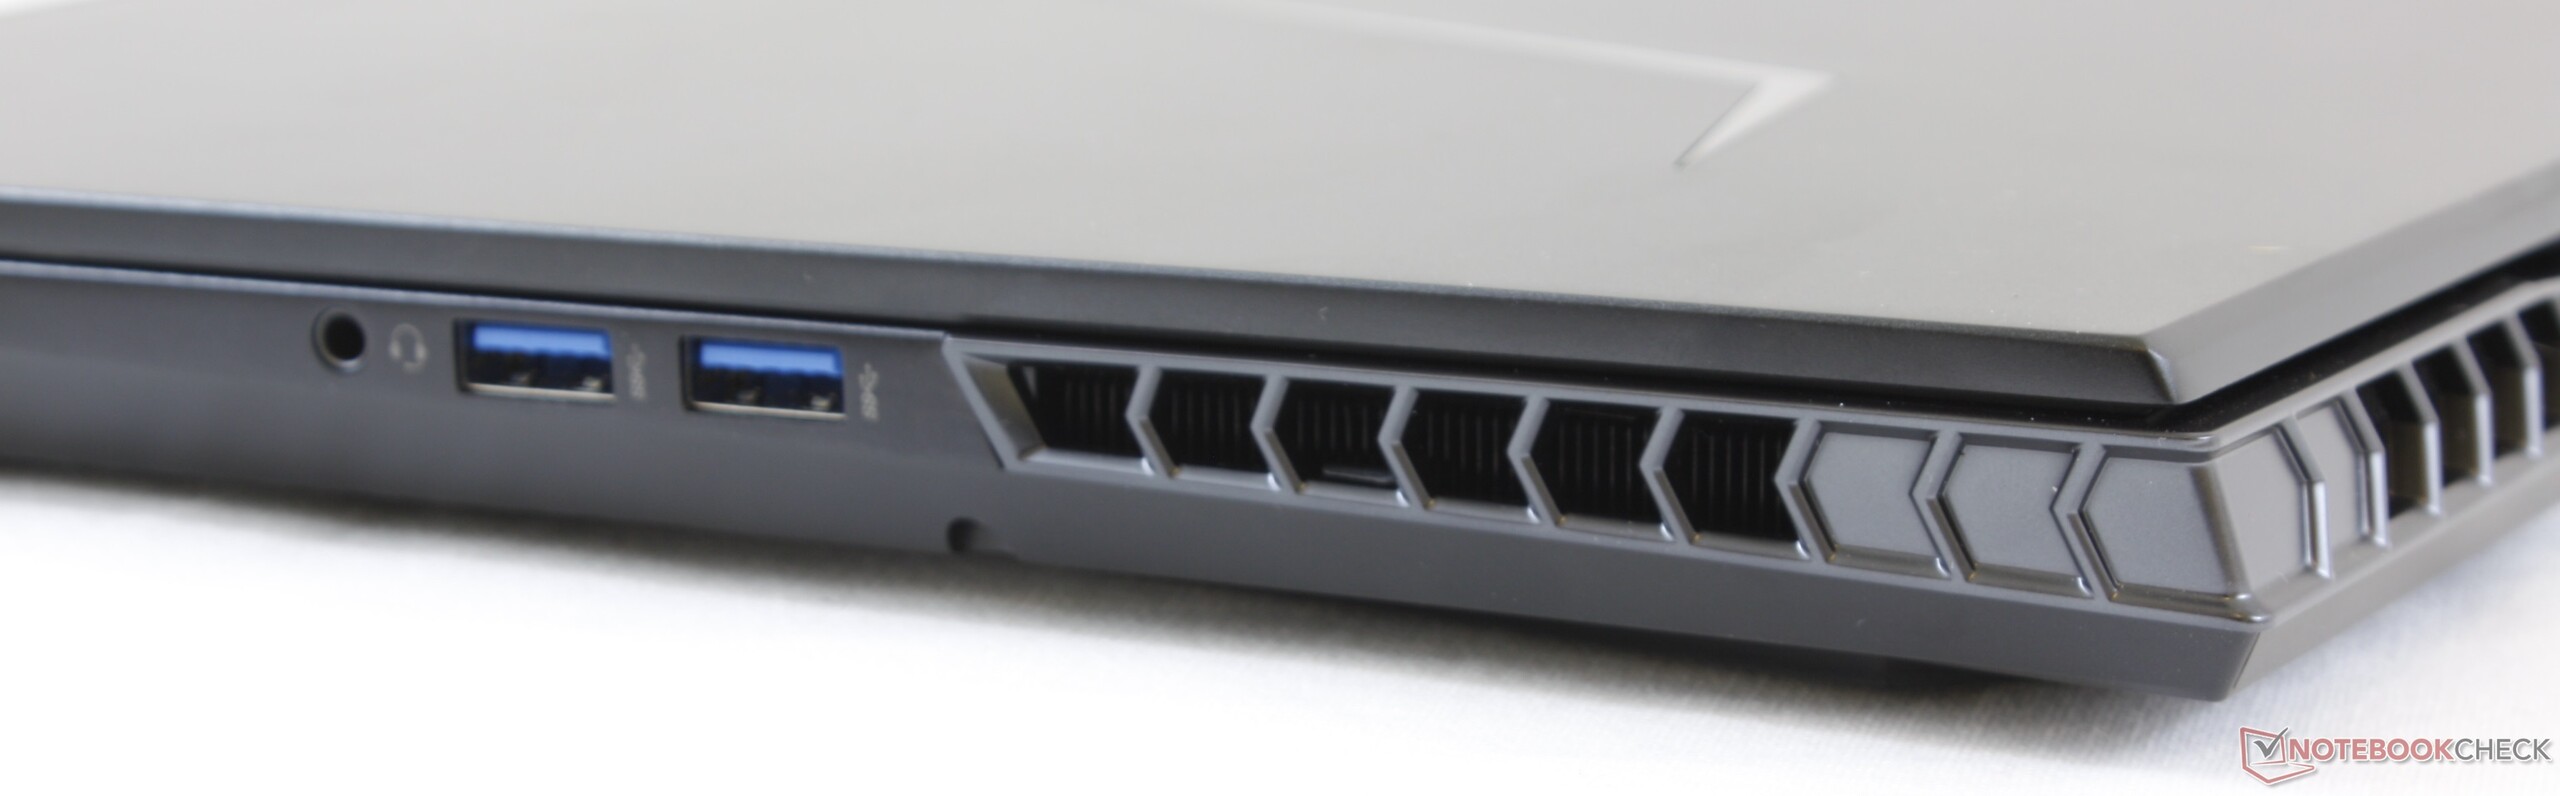
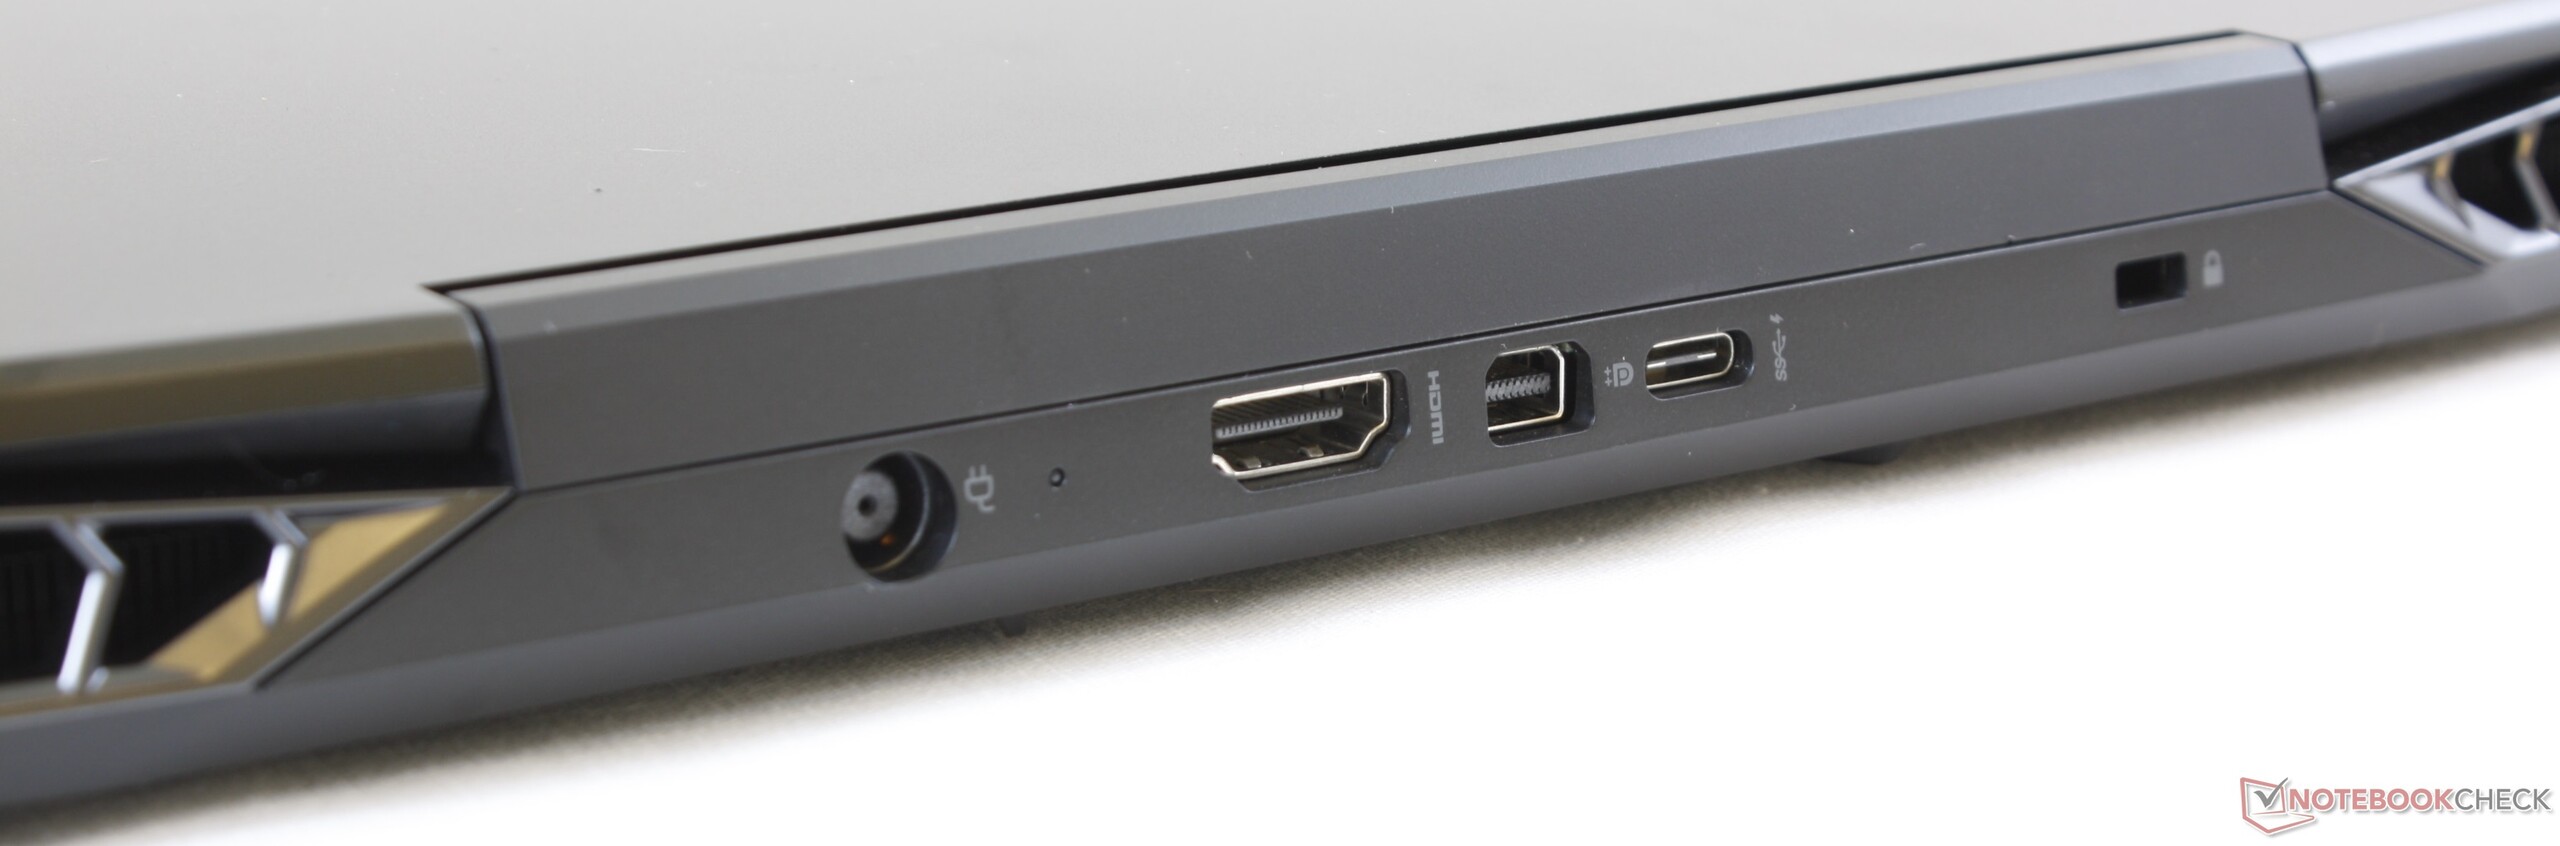
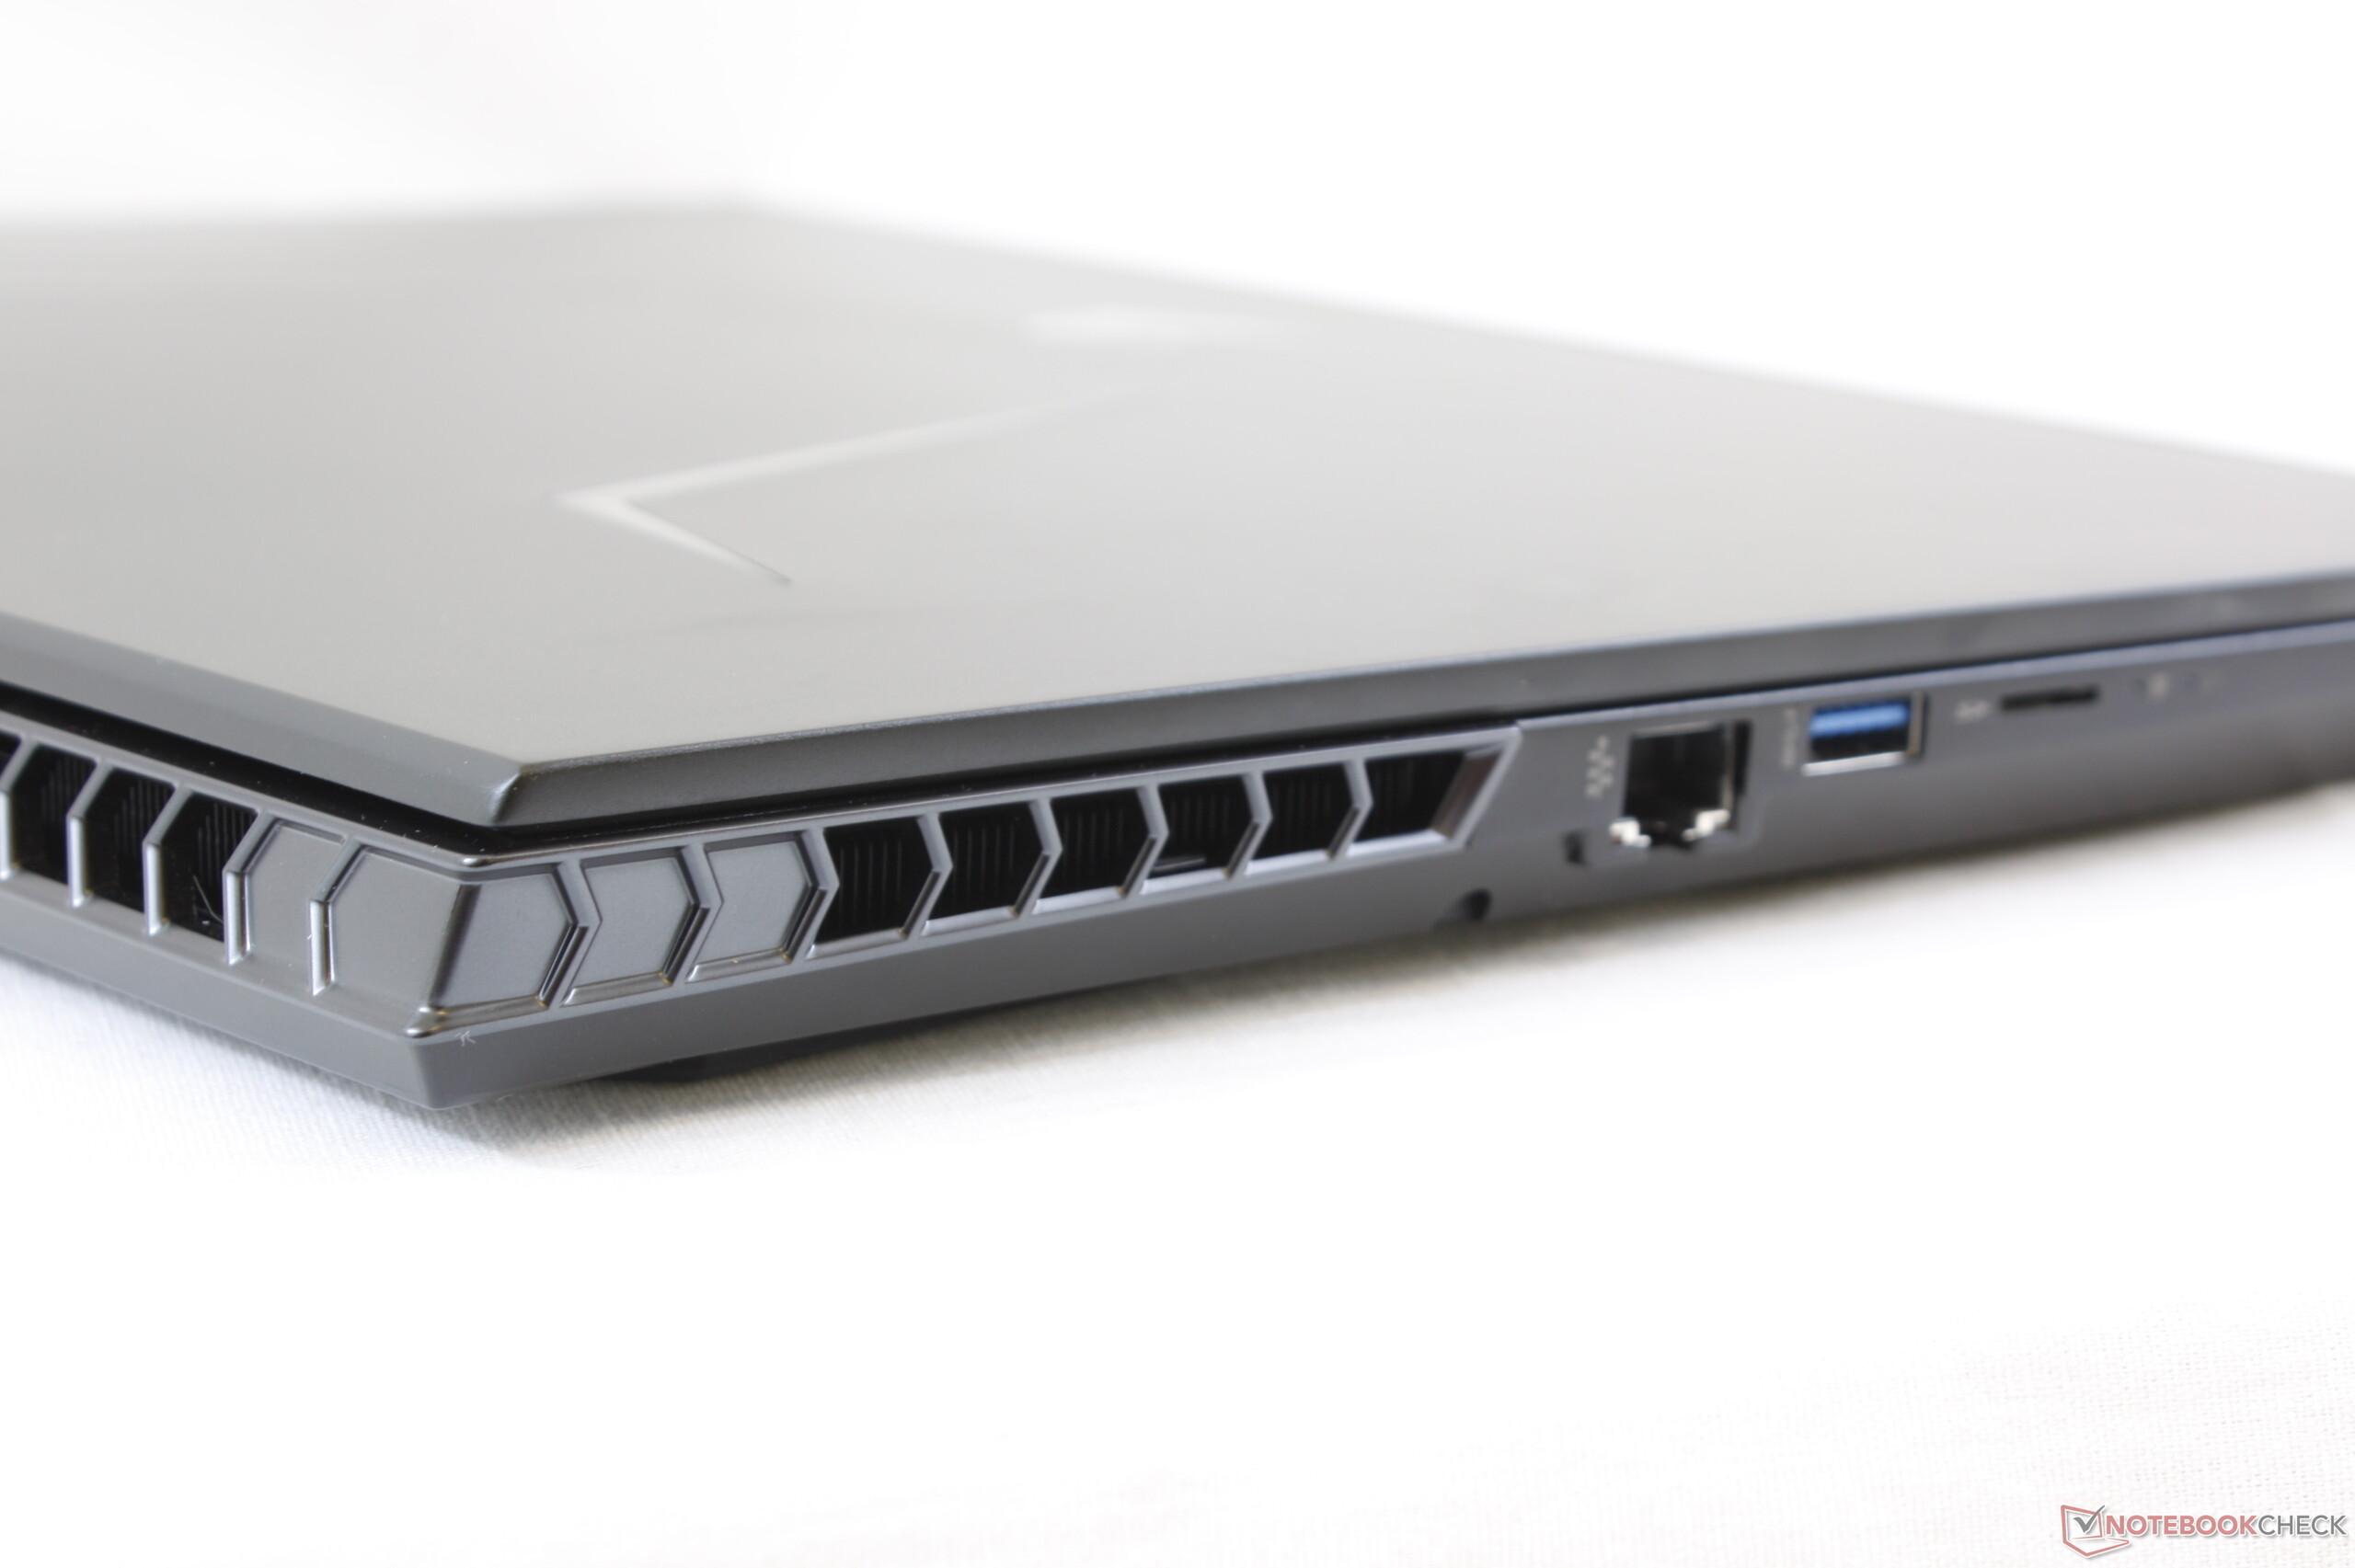
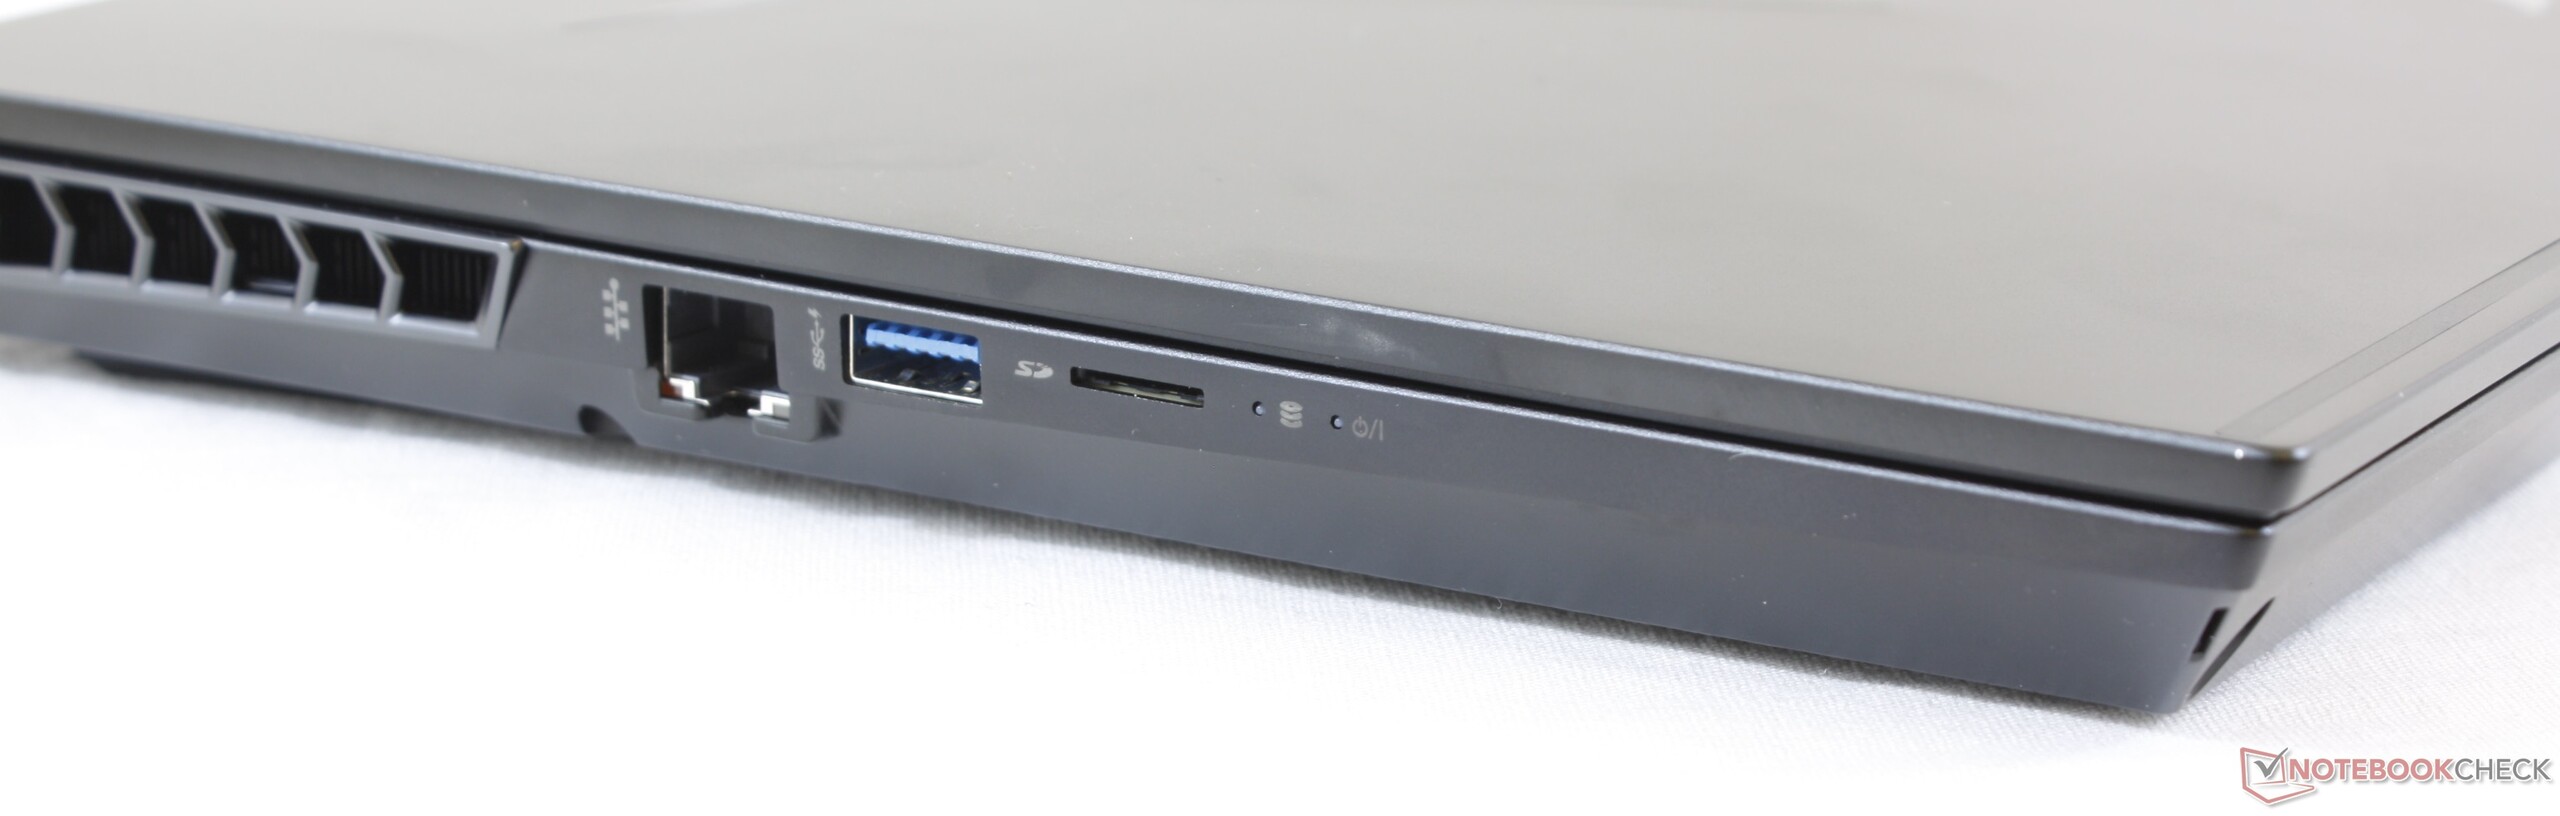
想要更换到Aorus 15-W9(或配备更强GPU的Aorus 15-X9)的Aorus-X5型号的用户可能会感到失望,因为他们必须做出一些妥协。例如,X5的全尺寸存储卡读卡器被15-W9中的microSD型号取代。也没有G-Sync,电池续航时间比X5低。此外,Aorus X5 v8中仍然可用的Thunderbolt-3连接已经被USB-3.1 Gen-2型号取代,这是一个退步。因此,对于许多感兴趣的买家来说,技嘉的Aero-15系列的型号可能是更好的选择。
Aorus 15 W9
- 04/21/2019 v6 (old)
Sascha Mölck
Price comparison

