Alienware外星人m15(i7-8750H, GTX 1070 Max-Q)笔记本电脑评测
| Networking | |
| iperf3 transmit AX12 | |
| Asus Zephyrus S GX531GS | |
| Alienware 15 R4 | |
| Alienware m15 GTX 1070 Max-Q | |
| Razer Blade 15 2018 | |
| MSI GS65 Stealth Thin 8RE-051US | |
| iperf3 receive AX12 | |
| Alienware 15 R4 | |
| Alienware m15 GTX 1070 Max-Q | |
| Asus Zephyrus S GX531GS | |
| Razer Blade 15 2018 | |
| MSI GS65 Stealth Thin 8RE-051US | |
| |||||||||||||||||||||||||
Brightness Distribution: 86 %
Center on Battery: 353.6 cd/m²
Contrast: 1179:1 (Black: 0.3 cd/m²)
ΔE ColorChecker Calman: 4.55 | ∀{0.5-29.43 Ø4.72}
calibrated: 3.37
ΔE Greyscale Calman: 4.1 | ∀{0.09-98 Ø4.97}
88.9% sRGB (Argyll 1.6.3 3D)
57.9% AdobeRGB 1998 (Argyll 1.6.3 3D)
64.5% AdobeRGB 1998 (Argyll 3D)
89.4% sRGB (Argyll 3D)
63.5% Display P3 (Argyll 3D)
Gamma: 2.27
CCT: 7434 K
| Alienware m15 GTX 1070 Max-Q AU Optronics B156HAN, IPS, 15.6", 1920x1080 | Razer Blade 15 2018 LGD05C0, IPS, 15.6", 1920x1080 | Alienware 15 R4 LG Philips LP156WF6 (LGD0540), IPS, 15.6", 1920x1080 | MSI GS65 8RF-019DE Stealth Thin AU Optronics B156HAN08.0 (AUO80ED), IPS, 15.6", 1920x1080 | Asus Zephyrus S GX531GS AU Optronics B156HAN08.2 (AUO82ED), IPS, 15.6", 1920x1080 | Gigabyte Aero 15X v8 LGD05C0, IPS, 15.6", 1920x1080 | |
|---|---|---|---|---|---|---|
| Display | 3% | -1% | 4% | 3% | 2% | |
| Display P3 Coverage (%) | 63.5 | 64.3 1% | 65.7 3% | 66.2 4% | 66.7 5% | 63.6 0% |
| sRGB Coverage (%) | 89.4 | 93.7 5% | 86.4 -3% | 92.1 3% | 91.2 2% | 93.8 5% |
| AdobeRGB 1998 Coverage (%) | 64.5 | 65.5 2% | 63.1 -2% | 67.2 4% | 66.7 3% | 64.9 1% |
| Response Times | 2% | -105% | -3% | 38% | 7% | |
| Response Time Grey 50% / Grey 80% * (ms) | 18 ? | 17.2 ? 4% | 37.6 ? -109% | 17.6 ? 2% | 7.4 ? 59% | 16.8 ? 7% |
| Response Time Black / White * (ms) | 12 ? | 12 ? -0% | 24 ? -100% | 12.8 ? -7% | 10 ? 17% | 11.2 ? 7% |
| PWM Frequency (Hz) | 20830 ? | |||||
| Screen | 10% | -7% | 16% | 13% | 18% | |
| Brightness middle (cd/m²) | 353.6 | 290 -18% | 292 -17% | 254 -28% | 294 -17% | 313 -11% |
| Brightness (cd/m²) | 346 | 281 -19% | 278 -20% | 262 -24% | 275 -21% | 300 -13% |
| Brightness Distribution (%) | 86 | 82 -5% | 88 2% | 89 3% | 84 -2% | 78 -9% |
| Black Level * (cd/m²) | 0.3 | 0.3 -0% | 0.29 3% | 0.22 27% | 0.24 20% | 0.33 -10% |
| Contrast (:1) | 1179 | 967 -18% | 1007 -15% | 1155 -2% | 1225 4% | 948 -20% |
| Colorchecker dE 2000 * | 4.55 | 2.85 37% | 4.9 -8% | 2.37 48% | 2.57 44% | 1.29 72% |
| Colorchecker dE 2000 max. * | 7.91 | 6.27 21% | 10.08 -27% | 4.71 40% | 4.88 38% | 2.04 74% |
| Colorchecker dE 2000 calibrated * | 3.37 | 1.39 59% | 2.27 33% | 1.84 45% | 2.14 36% | |
| Greyscale dE 2000 * | 4.1 | 2.4 41% | 4.89 -19% | 1.58 61% | 2.41 41% | 0.69 83% |
| Gamma | 2.27 97% | 2.34 94% | 2.36 93% | 2.48 89% | 2.5 88% | 2.43 91% |
| CCT | 7434 87% | 6718 97% | 7598 86% | 6785 96% | 6370 102% | 6550 99% |
| Color Space (Percent of AdobeRGB 1998) (%) | 57.9 | 60 4% | 56 -3% | 60 4% | 59 2% | 60 4% |
| Color Space (Percent of sRGB) (%) | 88.9 | 94 6% | 86 -3% | 92 3% | 91 2% | 94 6% |
| Total Average (Program / Settings) | 5% /
8% | -38% /
-18% | 6% /
11% | 18% /
15% | 9% /
13% |
* ... smaller is better
Display Response Times
| ↔ Response Time Black to White | ||
|---|---|---|
| 12 ms ... rise ↗ and fall ↘ combined | ↗ 6.8 ms rise | 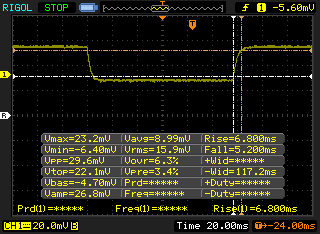 |
| ↘ 5.2 ms fall | ||
| The screen shows good response rates in our tests, but may be too slow for competitive gamers. In comparison, all tested devices range from 0.1 (minimum) to 240 (maximum) ms. » 32 % of all devices are better. This means that the measured response time is better than the average of all tested devices (19.8 ms). | ||
| ↔ Response Time 50% Grey to 80% Grey | ||
| 18 ms ... rise ↗ and fall ↘ combined | ↗ 9.2 ms rise | 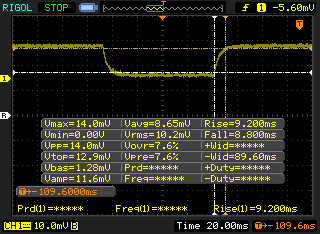 |
| ↘ 8.8 ms fall | ||
| The screen shows good response rates in our tests, but may be too slow for competitive gamers. In comparison, all tested devices range from 0.165 (minimum) to 636 (maximum) ms. » 32 % of all devices are better. This means that the measured response time is better than the average of all tested devices (31 ms). | ||
Screen Flickering / PWM (Pulse-Width Modulation)
| Screen flickering / PWM not detected |  | ||
In comparison: 52 % of all tested devices do not use PWM to dim the display. If PWM was detected, an average of 7763 (minimum: 5 - maximum: 343500) Hz was measured. | |||
| Cinebench R15 | |
| CPU Single 64Bit | |
| Schenker XMG Ultra 17 Coffee Lake Refresh | |
| Alienware 15 R4 | |
| Alienware m15 GTX 1070 Max-Q | |
| Average Intel Core i7-8750H (163 - 177, n=86) | |
| Dell G3 15 3579 | |
| Dell XPS 13 9370 i7 UHD | |
| Dell Inspiron 15 7000 7577 4K | |
| Xiaomi Mi Gaming Laptop 7300HQ 1050Ti | |
| CPU Multi 64Bit | |
| Schenker XMG Ultra 17 Coffee Lake Refresh | |
| Alienware m15 GTX 1070 Max-Q | |
| Average Intel Core i7-8750H (863 - 1251, n=93) | |
| Alienware 15 R4 | |
| Dell G3 15 3579 | |
| Dell Inspiron 15 7000 7577 4K | |
| Dell XPS 13 9370 i7 UHD | |
| Xiaomi Mi Gaming Laptop 7300HQ 1050Ti | |
| Cinebench R11.5 | |
| CPU Single 64Bit | |
| Schenker XMG Ultra 17 Coffee Lake Refresh | |
| Alienware 15 R4 | |
| Average Intel Core i7-8750H (1.89 - 2, n=40) | |
| Dell XPS 13 9370 i7 UHD | |
| Dell Inspiron 15 7000 7577 4K | |
| CPU Multi 64Bit | |
| Schenker XMG Ultra 17 Coffee Lake Refresh | |
| Alienware 15 R4 | |
| Average Intel Core i7-8750H (9.54 - 13.5, n=41) | |
| Dell Inspiron 15 7000 7577 4K | |
| Dell XPS 13 9370 i7 UHD | |
| Cinebench R10 | |
| Rendering Multiple CPUs 32Bit | |
| Schenker XMG Ultra 17 Coffee Lake Refresh | |
| Average Intel Core i7-8750H (29664 - 35307, n=25) | |
| Dell Inspiron 15 7000 7577 4K | |
| Dell XPS 13 9370 i7 UHD | |
| Rendering Single 32Bit | |
| Schenker XMG Ultra 17 Coffee Lake Refresh | |
| Average Intel Core i7-8750H (6236 - 6645, n=25) | |
| Dell XPS 13 9370 i7 UHD | |
| Dell Inspiron 15 7000 7577 4K | |
| wPrime 2.10 - 1024m | |
| Dell XPS 13 9370 i7 UHD | |
| Dell Inspiron 15 7000 7577 4K | |
| Average Intel Core i7-8750H (125.5 - 180.5, n=6) | |
* ... smaller is better
| PCMark 8 | |
| Home Score Accelerated v2 | |
| Alienware 15 R4 | |
| MSI GS65 Stealth Thin 8RE-051US | |
| Razer Blade 15 2018 | |
| Asus Zephyrus S GX531GS | |
| Average Intel Core i7-8750H, NVIDIA GeForce GTX 1070 Max-Q (4393 - 5130, n=10) | |
| Gigabyte Aero 15X v8 | |
| Alienware m15 GTX 1070 Max-Q | |
| Work Score Accelerated v2 | |
| MSI GS65 Stealth Thin 8RE-051US | |
| Asus Zephyrus S GX531GS | |
| Gigabyte Aero 15X v8 | |
| Razer Blade 15 2018 | |
| Alienware 15 R4 | |
| Average Intel Core i7-8750H, NVIDIA GeForce GTX 1070 Max-Q (5323 - 5818, n=10) | |
| Alienware m15 GTX 1070 Max-Q | |
| PCMark 8 Home Score Accelerated v2 | 4418 points | |
| PCMark 8 Work Score Accelerated v2 | 5407 points | |
| PCMark 10 Score | 5426 points | |
Help | ||
| Alienware m15 GTX 1070 Max-Q Toshiba XG5 KXG50ZNV512G | Razer Blade 15 2018 Samsung PM961 NVMe MZVLW512HMJP | Alienware 15 R4 Toshiba XG5 KXG50ZNV256G | MSI GS65 Stealth Thin 8RE-051US Samsung SSD PM981 MZVLB256HAHQ | Asus Zephyrus S GX531GS WDC PC SN520 SDAPNUW-512G | Gigabyte Aero 15X v8 Toshiba NVMe THNSN5512GPU7 | |
|---|---|---|---|---|---|---|
| AS SSD | 42% | -24% | 0% | 21% | -0% | |
| Seq Read (MB/s) | 1967 | 2376 21% | 2441 24% | 1612 -18% | 903 -54% | 2213 13% |
| Seq Write (MB/s) | 1135 | 1521 34% | 300.4 -74% | 1475 30% | 1261 11% | 1163 2% |
| 4K Read (MB/s) | 29.17 | 46.45 59% | 32.87 13% | 43.09 48% | 40.02 37% | 23.36 -20% |
| 4K Write (MB/s) | 93.4 | 93.6 0% | 94.8 1% | 83.8 -10% | 103.6 11% | 80.4 -14% |
| 4K-64 Read (MB/s) | 995 | 1300 31% | 437.4 -56% | 611 -39% | 1030 4% | 847 -15% |
| 4K-64 Write (MB/s) | 656 | 1204 84% | 310.5 -53% | 570 -13% | 1285 96% | 742 13% |
| Access Time Read * (ms) | 0.116 | 0.051 56% | 0.116 -0% | 0.071 39% | 0.129 -11% | 0.119 -3% |
| Access Time Write * (ms) | 0.063 | 0.038 40% | 0.053 16% | 0.045 29% | 0.036 43% | 0.046 27% |
| Score Read (Points) | 1221 | 1584 30% | 714 -42% | 815 -33% | 1161 -5% | 1092 -11% |
| Score Write (Points) | 862 | 1450 68% | 435 -50% | 802 -7% | 1515 76% | 939 9% |
| Score Total (Points) | 2667 | 3806 43% | 1416 -47% | 2039 -24% | 3294 24% | 2536 -5% |
| Copy ISO MB/s (MB/s) | 642 | |||||
| Copy Program MB/s (MB/s) | 431.5 | |||||
| Copy Game MB/s (MB/s) | 706 | |||||
| CrystalDiskMark 5.2 / 6 | 49% | -10% | 49% | 36% | 36% | |
| Write 4K (MB/s) | 107.4 | 94.2 -12% | 96.8 -10% | 91.5 -15% | 98.2 -9% | 94.4 -12% |
| Read 4K (MB/s) | 42.91 | 39.23 -9% | 35.73 -17% | 40.41 -6% | 39.43 -8% | 37.65 -12% |
| Write Seq (MB/s) | 467.5 | 1483 217% | 362.3 -23% | 1528 227% | 1386 196% | 1335 186% |
| Read Seq (MB/s) | 2335 | 1371 -41% | 2110 -10% | 1235 -47% | 1100 -53% | 1404 -40% |
| Write 4K Q32T1 (MB/s) | 289.7 | 296.2 2% | 318.6 10% | 259 -11% | 270.3 -7% | 268.6 -7% |
| Read 4K Q32T1 (MB/s) | 354.4 | 342.5 -3% | 366.7 3% | 364.9 3% | 340.3 -4% | 332.8 -6% |
| Write Seq Q32T1 (MB/s) | 460.9 | 1527 231% | 351 -24% | 1529 232% | 1454 215% | 1375 198% |
| Read Seq Q32T1 (MB/s) | 3111 | 3280 5% | 2813 -10% | 3472 12% | 1681 -46% | 2627 -16% |
| Total Average (Program / Settings) | 46% /
45% | -17% /
-18% | 25% /
21% | 29% /
27% | 18% /
15% |
* ... smaller is better

| 3DMark 11 | |
| 1280x720 Performance GPU | |
| Schenker XMG Ultra 17 Coffee Lake Refresh | |
| Alienware 15 R3 Max-Q | |
| Alienware 15 R4 | |
| Alienware m15 GTX 1070 Max-Q | |
| Razer Blade 15 2018 | |
| Average NVIDIA GeForce GTX 1070 Max-Q (17680 - 20829, n=18) | |
| MSI GS65 Stealth Thin 8RE-051US | |
| Dell Inspiron 15 7000 7577 4K | |
| Xiaomi Mi Gaming Laptop 7300HQ 1050Ti | |
| HP Pavilion Gaming 15-cx0003ng | |
| Dell G3 15 3579 | |
| HP Pavilion 17 FHD V3A33AV | |
| 1280x720 Performance Combined | |
| Schenker XMG Ultra 17 Coffee Lake Refresh | |
| Alienware m15 GTX 1070 Max-Q | |
| Alienware 15 R4 | |
| MSI GS65 Stealth Thin 8RE-051US | |
| Average NVIDIA GeForce GTX 1070 Max-Q (7458 - 12069, n=18) | |
| Alienware 15 R3 Max-Q | |
| Dell Inspiron 15 7000 7577 4K | |
| Razer Blade 15 2018 | |
| HP Pavilion Gaming 15-cx0003ng | |
| Dell G3 15 3579 | |
| Xiaomi Mi Gaming Laptop 7300HQ 1050Ti | |
| HP Pavilion 17 FHD V3A33AV | |
| 3DMark 11 Performance | 17408 points | |
| 3DMark Cloud Gate Standard Score | 35886 points | |
| 3DMark Fire Strike Score | 14119 points | |
Help | ||
| low | med. | high | ultra | |
|---|---|---|---|---|
| BioShock Infinite (2013) | 291.6 | 247.6 | 242.8 | 136.8 |
| The Witcher 3 (2015) | 254 | 173.9 | 101.6 | 54.2 |
| Rise of the Tomb Raider (2016) | 217.5 | 166 | 102.8 | 85.1 |
| Alienware m15 GTX 1070 Max-Q GeForce GTX 1070 Max-Q, i7-8750H, Toshiba XG5 KXG50ZNV512G | Razer Blade 15 2018 GeForce GTX 1070 Max-Q, i7-8750H, Samsung PM961 NVMe MZVLW512HMJP | Alienware 15 R4 GeForce GTX 1070 Mobile, i9-8950HK, Toshiba XG5 KXG50ZNV256G | MSI GS65 Stealth Thin 8RE-051US GeForce GTX 1060 Mobile, i7-8750H, Samsung SSD PM981 MZVLB256HAHQ | Asus Zephyrus S GX531GS GeForce GTX 1070 Max-Q, i7-8750H, WDC PC SN520 SDAPNUW-512G | Gigabyte Aero 15X v8 GeForce GTX 1070 Max-Q, i7-8750H, Toshiba NVMe THNSN5512GPU7 | |
|---|---|---|---|---|---|---|
| Noise | -6% | -19% | 1% | -14% | -10% | |
| off / environment * (dB) | 28.6 | 29 -1% | 29 -1% | 28.4 1% | 29 -1% | 29 -1% |
| Idle Minimum * (dB) | 28.6 | 29 -1% | 32 -12% | 28.4 1% | 33 -15% | 30 -5% |
| Idle Average * (dB) | 28.6 | 30 -5% | 33 -15% | 28.4 1% | 34 -19% | 31 -8% |
| Idle Maximum * (dB) | 28.6 | 38 -33% | 50 -75% | 29.6 -3% | 40 -40% | 35 -22% |
| Load Average * (dB) | 40.8 | 46 -13% | 50 -23% | 43.5 -7% | 47 -15% | 49 -20% |
| Witcher 3 ultra * (dB) | 49.6 | 49 1% | 51 -3% | 45.7 8% | 51 -3% | 51 -3% |
| Load Maximum * (dB) | 49.6 | 46 7% | 51 -3% | 45.7 8% | 53 -7% | 54 -9% |
* ... smaller is better
Noise level
| Idle |
| 28.6 / 28.6 / 28.6 dB(A) |
| Load |
| 40.8 / 49.6 dB(A) |
 | ||
30 dB silent 40 dB(A) audible 50 dB(A) loud |
||
min: | ||
(-) The maximum temperature on the upper side is 52 °C / 126 F, compared to the average of 40.4 °C / 105 F, ranging from 21.2 to 68.8 °C for the class Gaming.
(-) The bottom heats up to a maximum of 55.6 °C / 132 F, compared to the average of 43.2 °C / 110 F
(+) In idle usage, the average temperature for the upper side is 27.6 °C / 82 F, compared to the device average of 33.9 °C / 93 F.
(-) Playing The Witcher 3, the average temperature for the upper side is 38.5 °C / 101 F, compared to the device average of 33.9 °C / 93 F.
(+) The palmrests and touchpad are cooler than skin temperature with a maximum of 30.6 °C / 87.1 F and are therefore cool to the touch.
(±) The average temperature of the palmrest area of similar devices was 28.8 °C / 83.8 F (-1.8 °C / -3.3 F).
Alienware m15 GTX 1070 Max-Q audio analysis
(±) | speaker loudness is average but good (78.9 dB)
Bass 100 - 315 Hz
(-) | nearly no bass - on average 19.7% lower than median
(±) | linearity of bass is average (10.8% delta to prev. frequency)
Mids 400 - 2000 Hz
(±) | higher mids - on average 8.5% higher than median
(±) | linearity of mids is average (11.6% delta to prev. frequency)
Highs 2 - 16 kHz
(+) | balanced highs - only 2.5% away from median
(±) | linearity of highs is average (8.5% delta to prev. frequency)
Overall 100 - 16.000 Hz
(±) | linearity of overall sound is average (24.7% difference to median)
Compared to same class
» 89% of all tested devices in this class were better, 3% similar, 8% worse
» The best had a delta of 6%, average was 18%, worst was 132%
Compared to all devices tested
» 75% of all tested devices were better, 5% similar, 20% worse
» The best had a delta of 4%, average was 23%, worst was 134%
Apple MacBook 12 (Early 2016) 1.1 GHz audio analysis
(+) | speakers can play relatively loud (83.6 dB)
Bass 100 - 315 Hz
(±) | reduced bass - on average 11.3% lower than median
(±) | linearity of bass is average (14.2% delta to prev. frequency)
Mids 400 - 2000 Hz
(+) | balanced mids - only 2.4% away from median
(+) | mids are linear (5.5% delta to prev. frequency)
Highs 2 - 16 kHz
(+) | balanced highs - only 2% away from median
(+) | highs are linear (4.5% delta to prev. frequency)
Overall 100 - 16.000 Hz
(+) | overall sound is linear (10.2% difference to median)
Compared to same class
» 7% of all tested devices in this class were better, 2% similar, 91% worse
» The best had a delta of 5%, average was 18%, worst was 53%
Compared to all devices tested
» 5% of all tested devices were better, 1% similar, 94% worse
» The best had a delta of 4%, average was 23%, worst was 134%
| Off / Standby | |
| Idle | |
| Load |
|
Key:
min: | |
| Alienware m15 GTX 1070 Max-Q i7-8750H, GeForce GTX 1070 Max-Q, Toshiba XG5 KXG50ZNV512G, IPS, 1920x1080, 15.6" | Razer Blade 15 2018 i7-8750H, GeForce GTX 1070 Max-Q, Samsung PM961 NVMe MZVLW512HMJP, IPS, 1920x1080, 15.6" | Alienware 15 R4 i9-8950HK, GeForce GTX 1070 Mobile, Toshiba XG5 KXG50ZNV256G, IPS, 1920x1080, 15.6" | MSI GS65 Stealth Thin 8RE-051US i7-8750H, GeForce GTX 1060 Mobile, Samsung SSD PM981 MZVLB256HAHQ, IPS, 1920x1080, 15.6" | Asus Zephyrus S GX531GS i7-8750H, GeForce GTX 1070 Max-Q, WDC PC SN520 SDAPNUW-512G, IPS, 1920x1080, 15.6" | Alienware 15 R3 Max-Q i7-7820HK, GeForce GTX 1080 Max-Q, LiteOn CX2-8B256, IPS, 1920x1080, 15.6" | |
|---|---|---|---|---|---|---|
| Power Consumption | -25% | -77% | 1% | -52% | -71% | |
| Idle Minimum * (Watt) | 7.6 | 14 -84% | 23 -203% | 8.7 -14% | 17 -124% | 22 -189% |
| Idle Average * (Watt) | 13.8 | 17 -23% | 26 -88% | 13 6% | 20 -45% | 26 -88% |
| Idle Maximum * (Watt) | 14.6 | 21 -44% | 30 -105% | 14.3 2% | 29 -99% | 33 -126% |
| Load Average * (Watt) | 97.6 | 95 3% | 111 -14% | 107.4 -10% | 112 -15% | 86 12% |
| Witcher 3 ultra * (Watt) | 145.8 | 141 3% | 182 -25% | 129 12% | 152 -4% | 159 -9% |
| Load Maximum * (Watt) | 172.5 | 179 -4% | 222 -29% | 151.5 12% | 211 -22% | 215 -25% |
* ... smaller is better
| Alienware m15 GTX 1070 Max-Q i7-8750H, GeForce GTX 1070 Max-Q, 90 Wh | Razer Blade 15 2018 i7-8750H, GeForce GTX 1070 Max-Q, 80 Wh | Alienware 15 R4 i9-8950HK, GeForce GTX 1070 Mobile, 99 Wh | MSI GS65 Stealth Thin 8RE-051US i7-8750H, GeForce GTX 1060 Mobile, 82 Wh | Asus Zephyrus S GX531GS i7-8750H, GeForce GTX 1070 Max-Q, 50 Wh | Gigabyte Aero 15X v8 i7-8750H, GeForce GTX 1070 Max-Q, 94.24 Wh | |
|---|---|---|---|---|---|---|
| Battery runtime | -33% | -39% | -24% | -64% | 29% | |
| Reader / Idle (h) | 10.5 | 6.4 -39% | 6.2 -41% | 3.6 -66% | 12.7 21% | |
| WiFi v1.3 (h) | 7.7 | 5.4 -30% | 5.1 -34% | 6.2 -19% | 2.6 -66% | 8.6 12% |
| Load (h) | 1.7 | 1.2 -29% | 1 -41% | 1.2 -29% | 0.7 -59% | 2.6 53% |
Pros
Cons
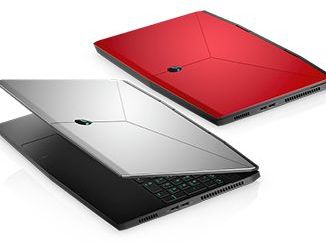
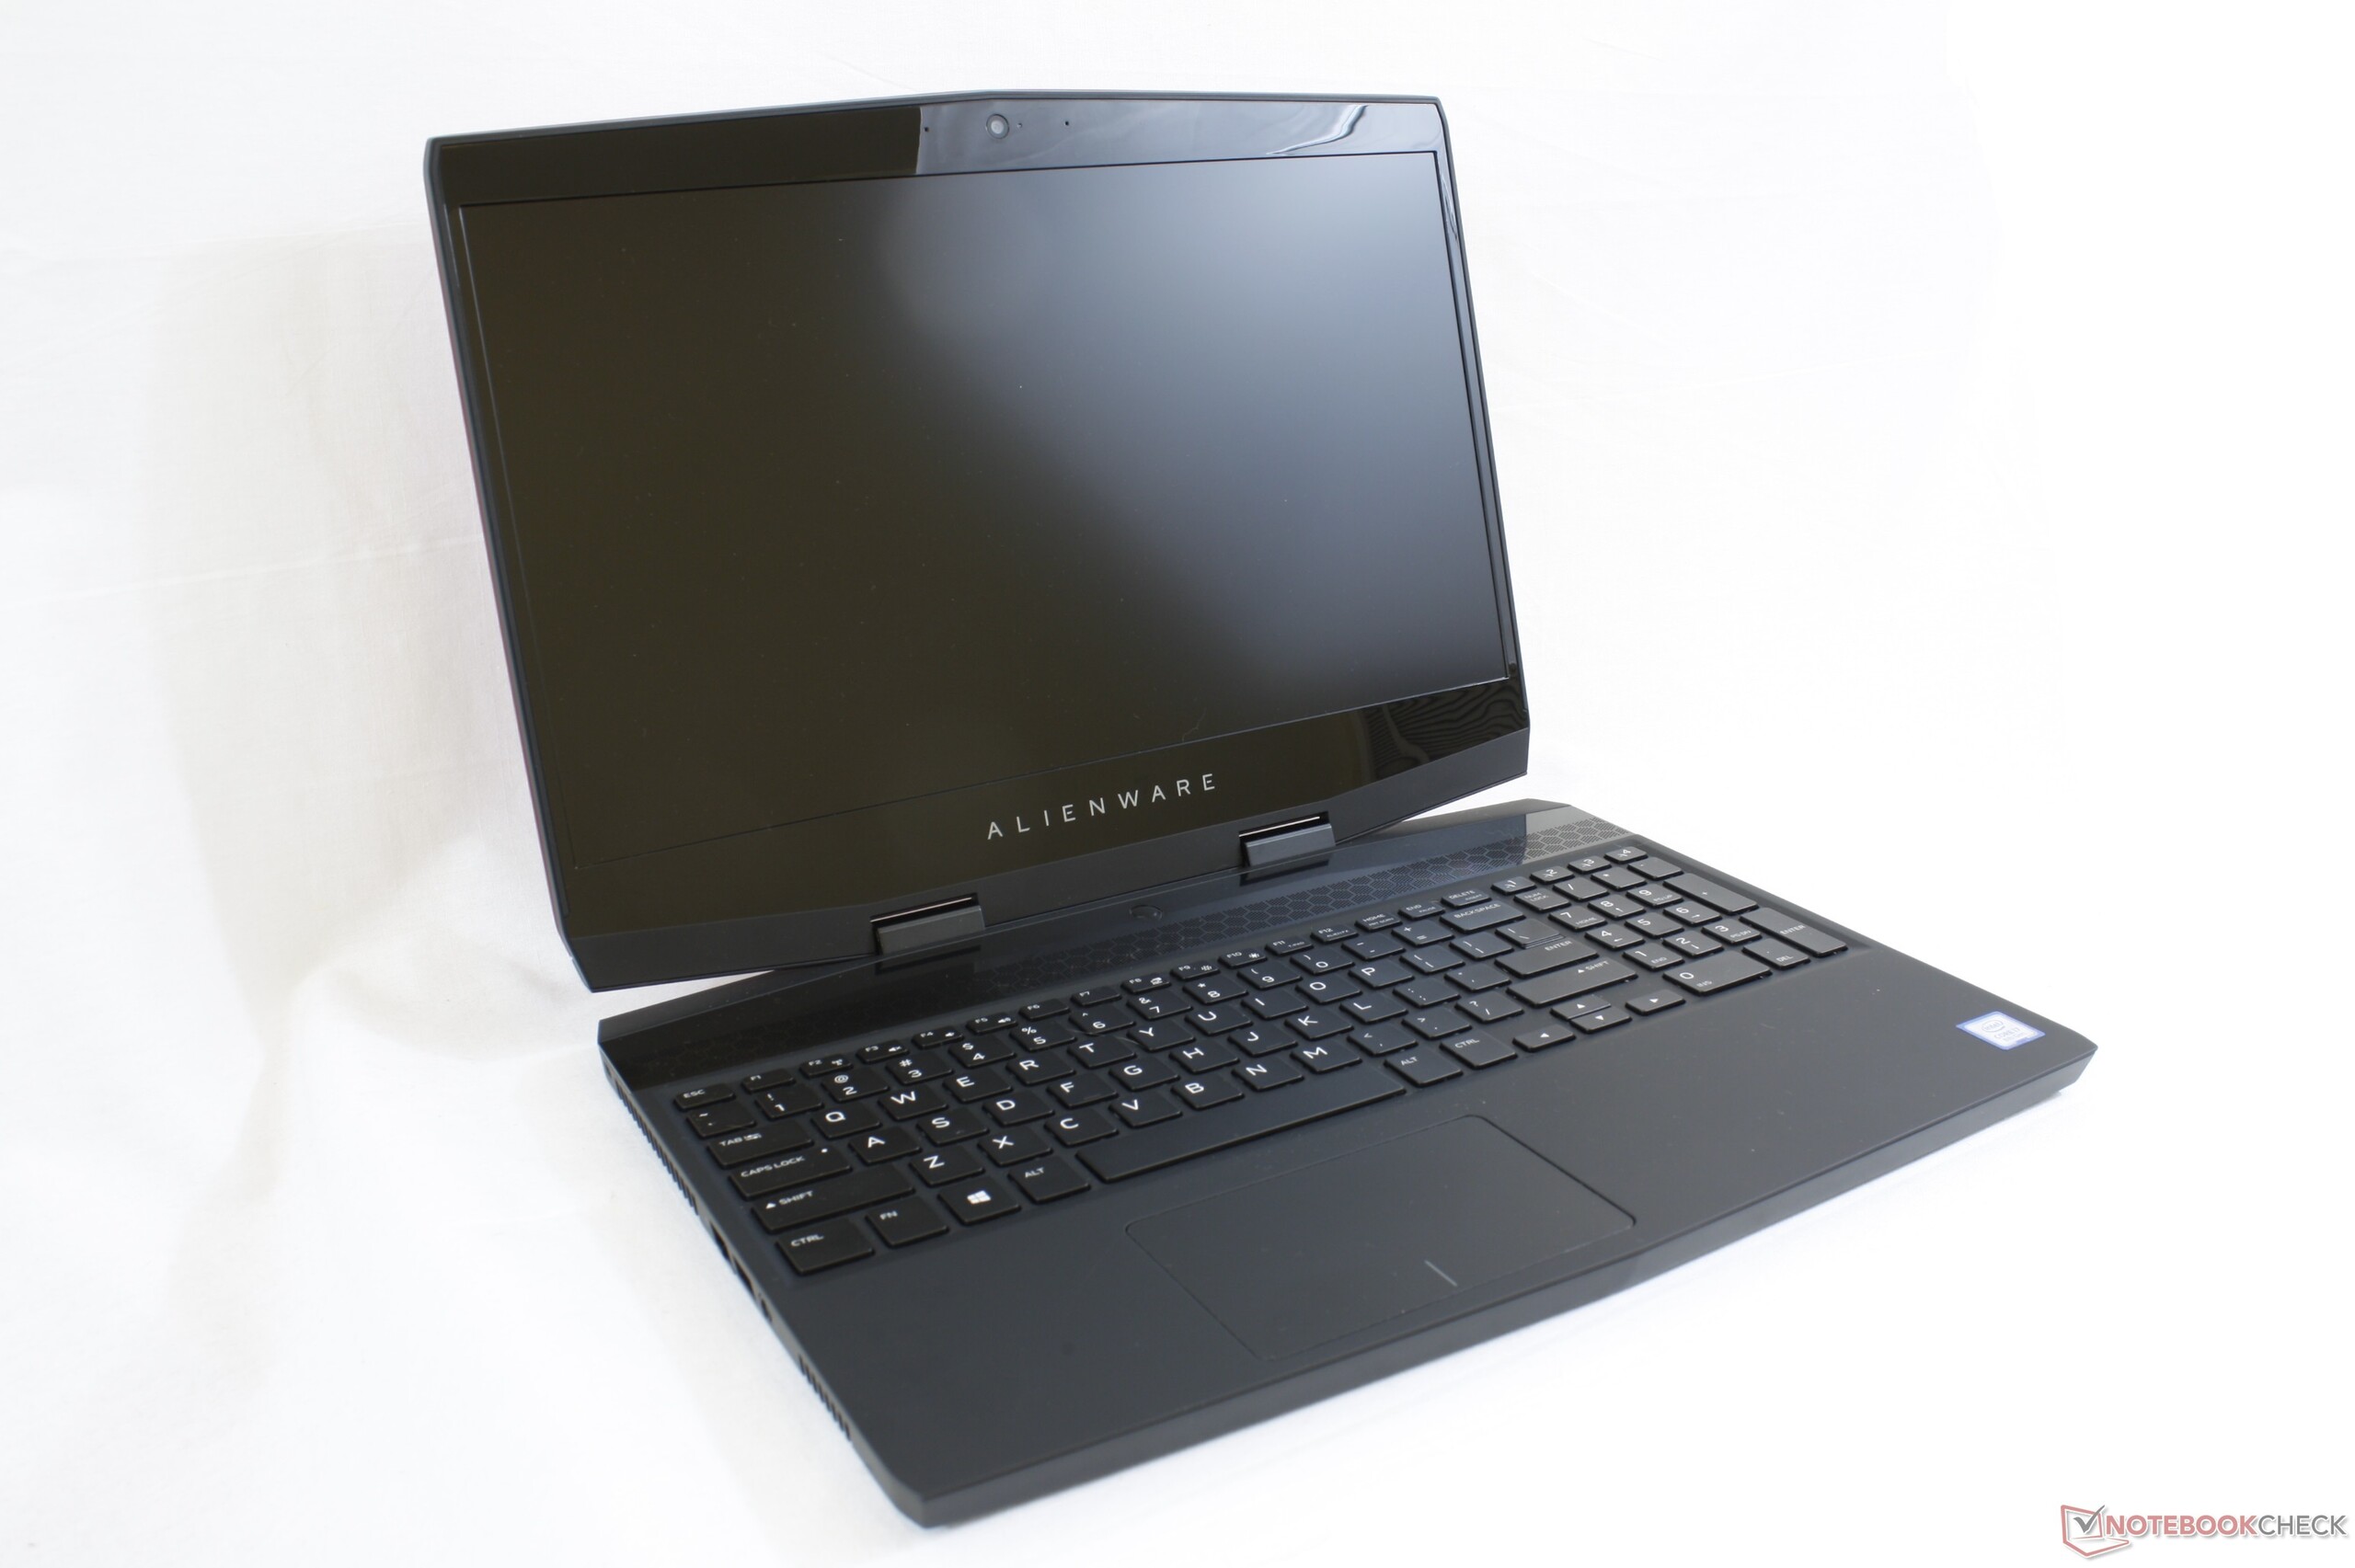
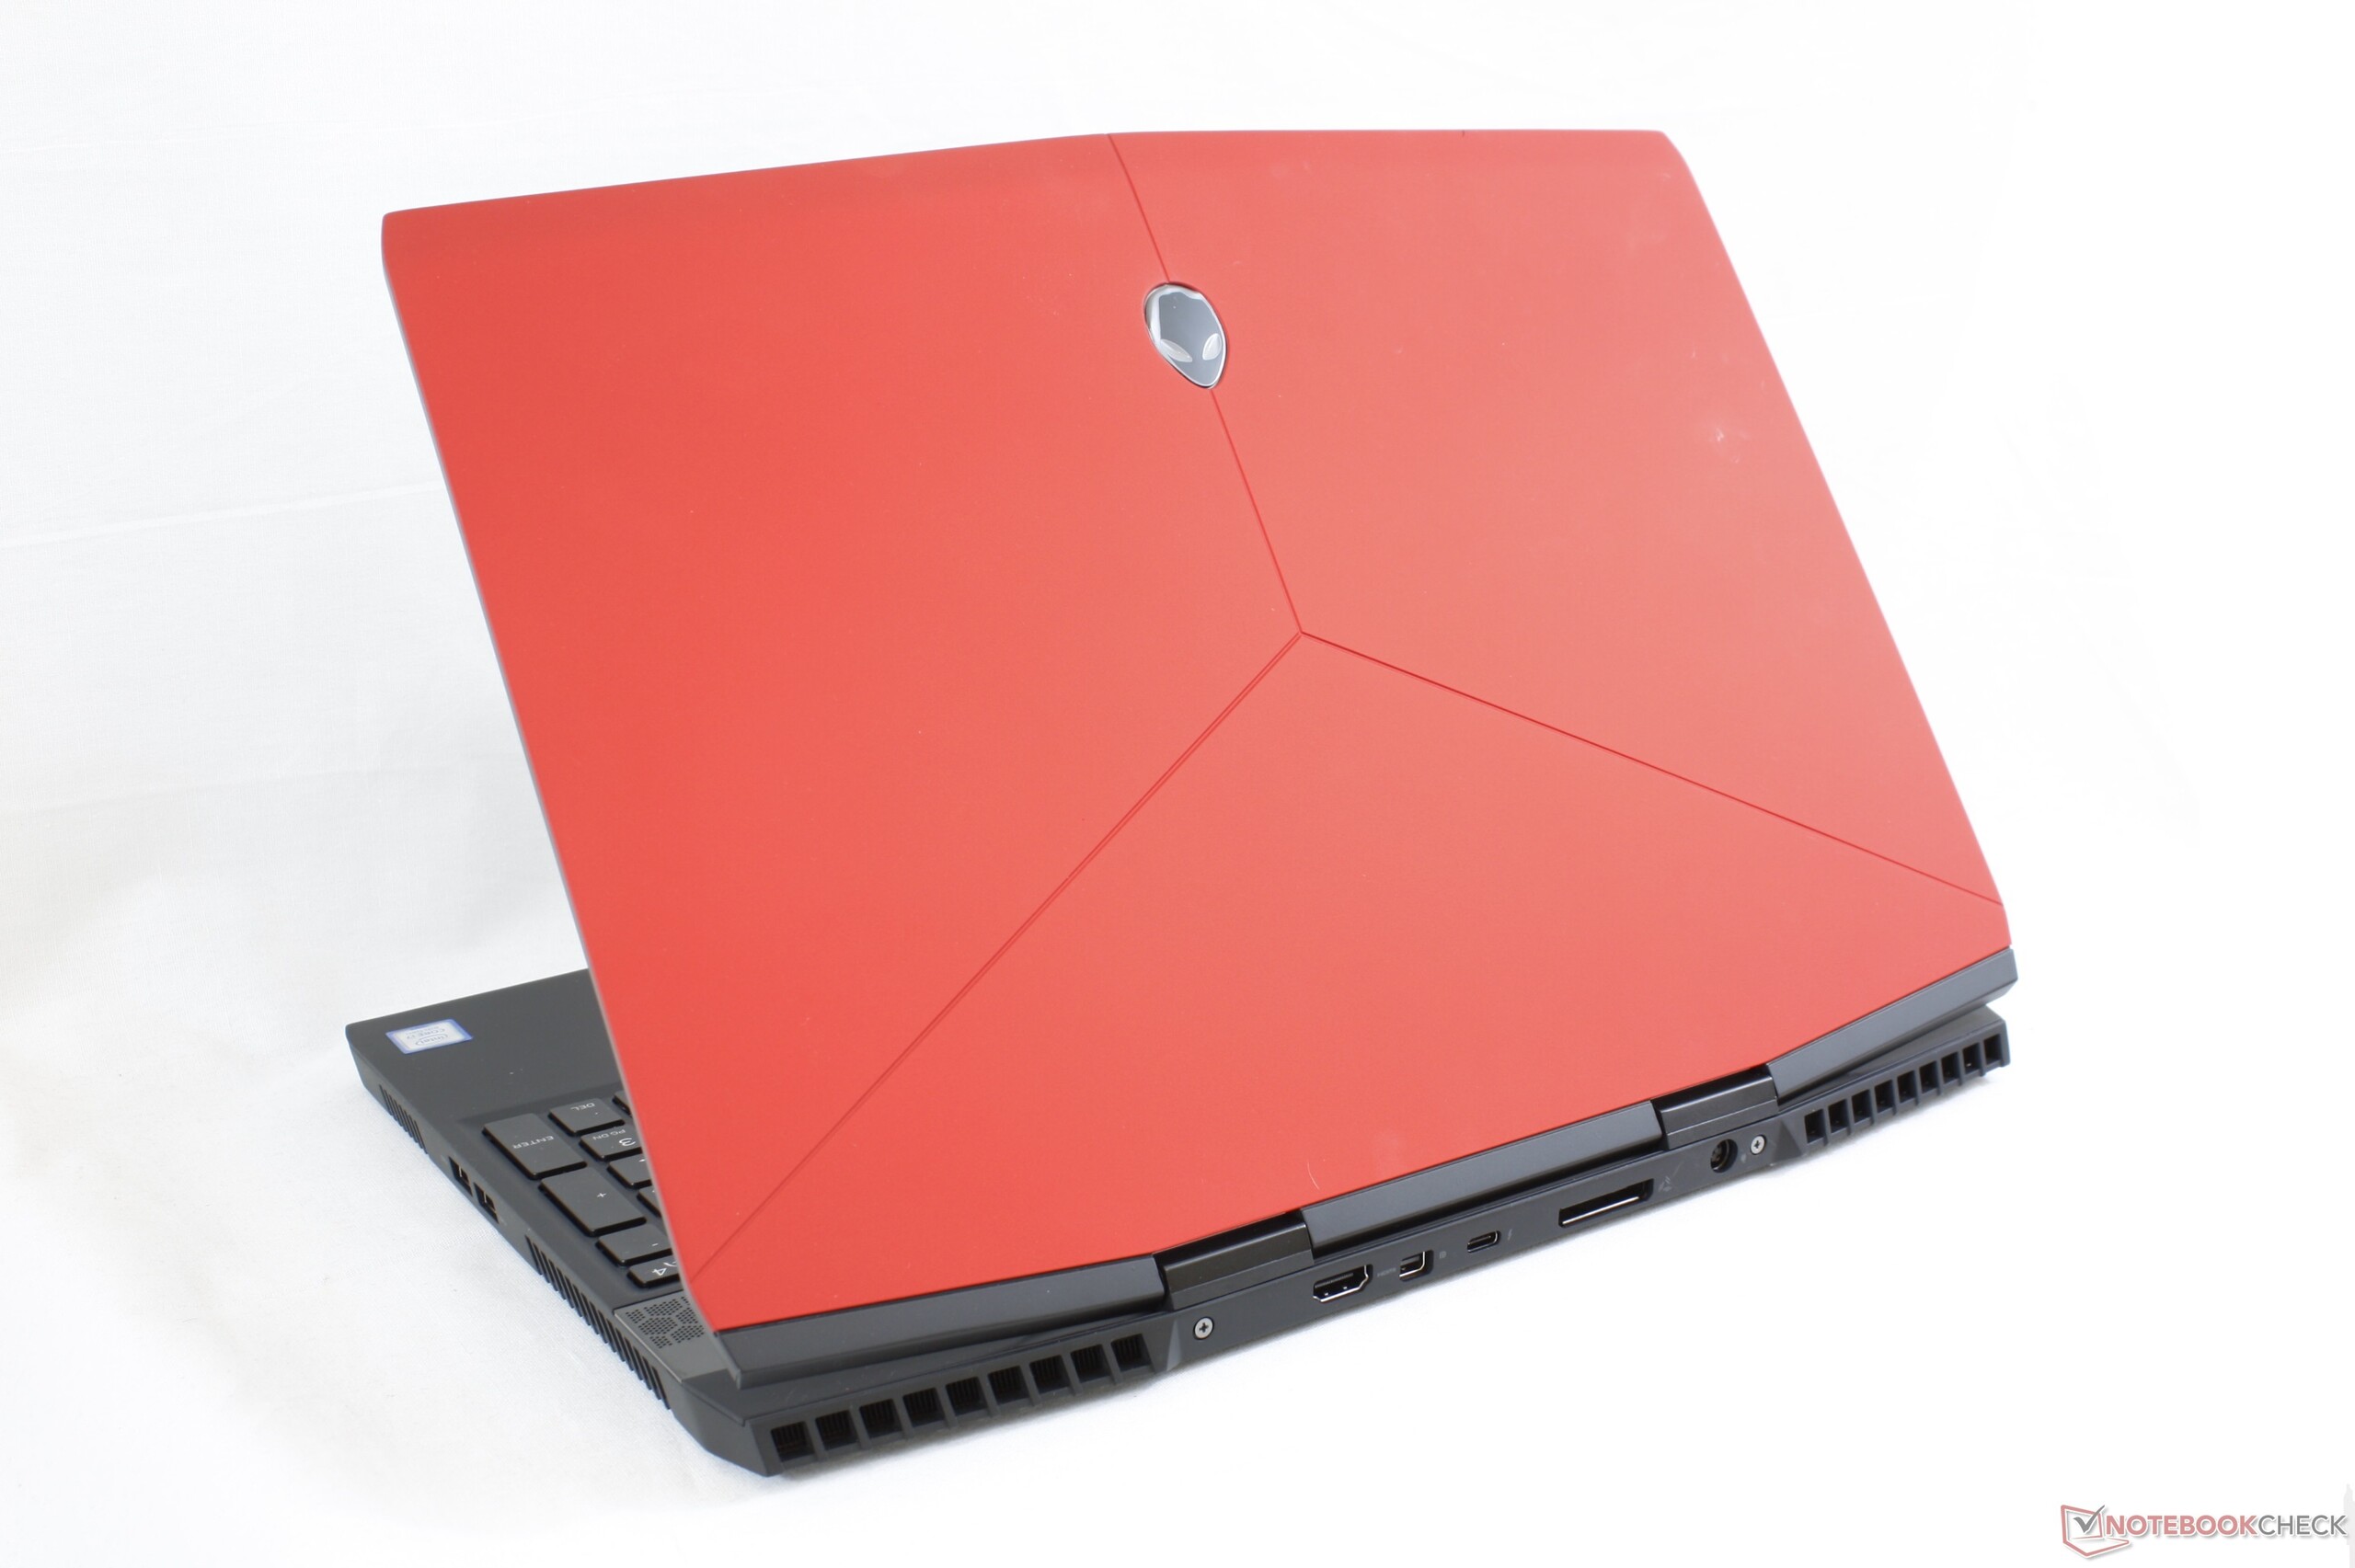
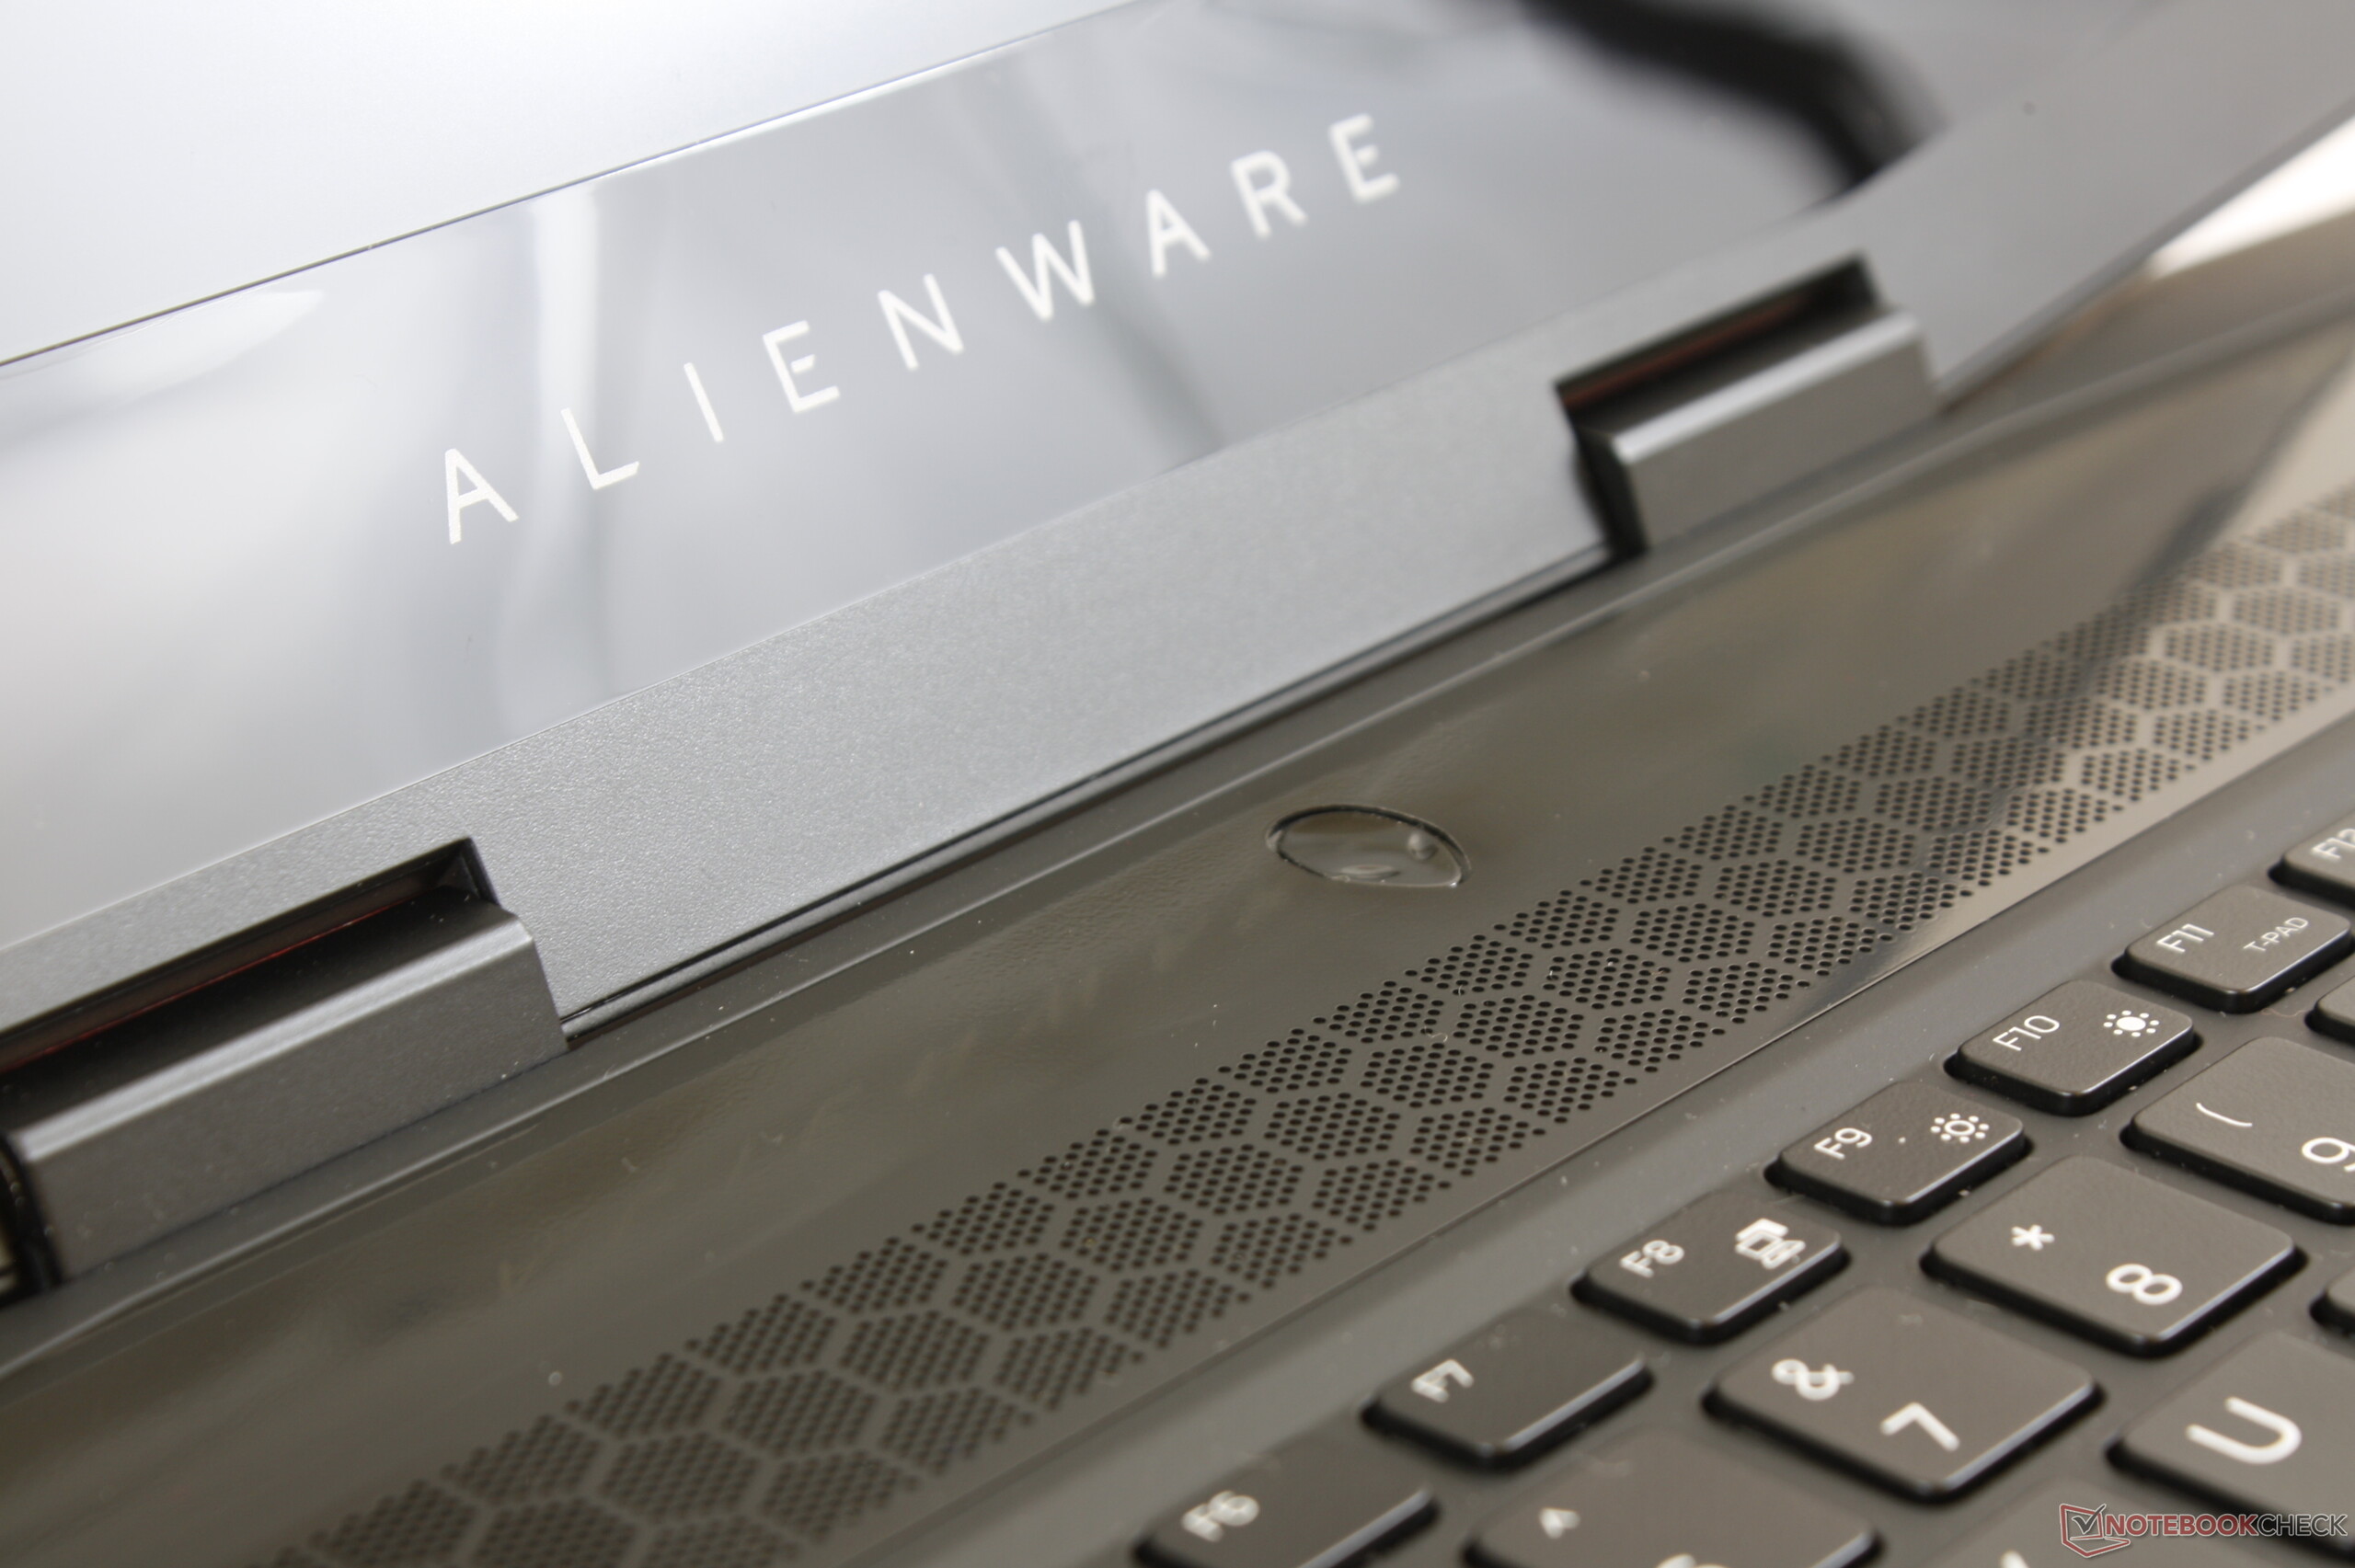
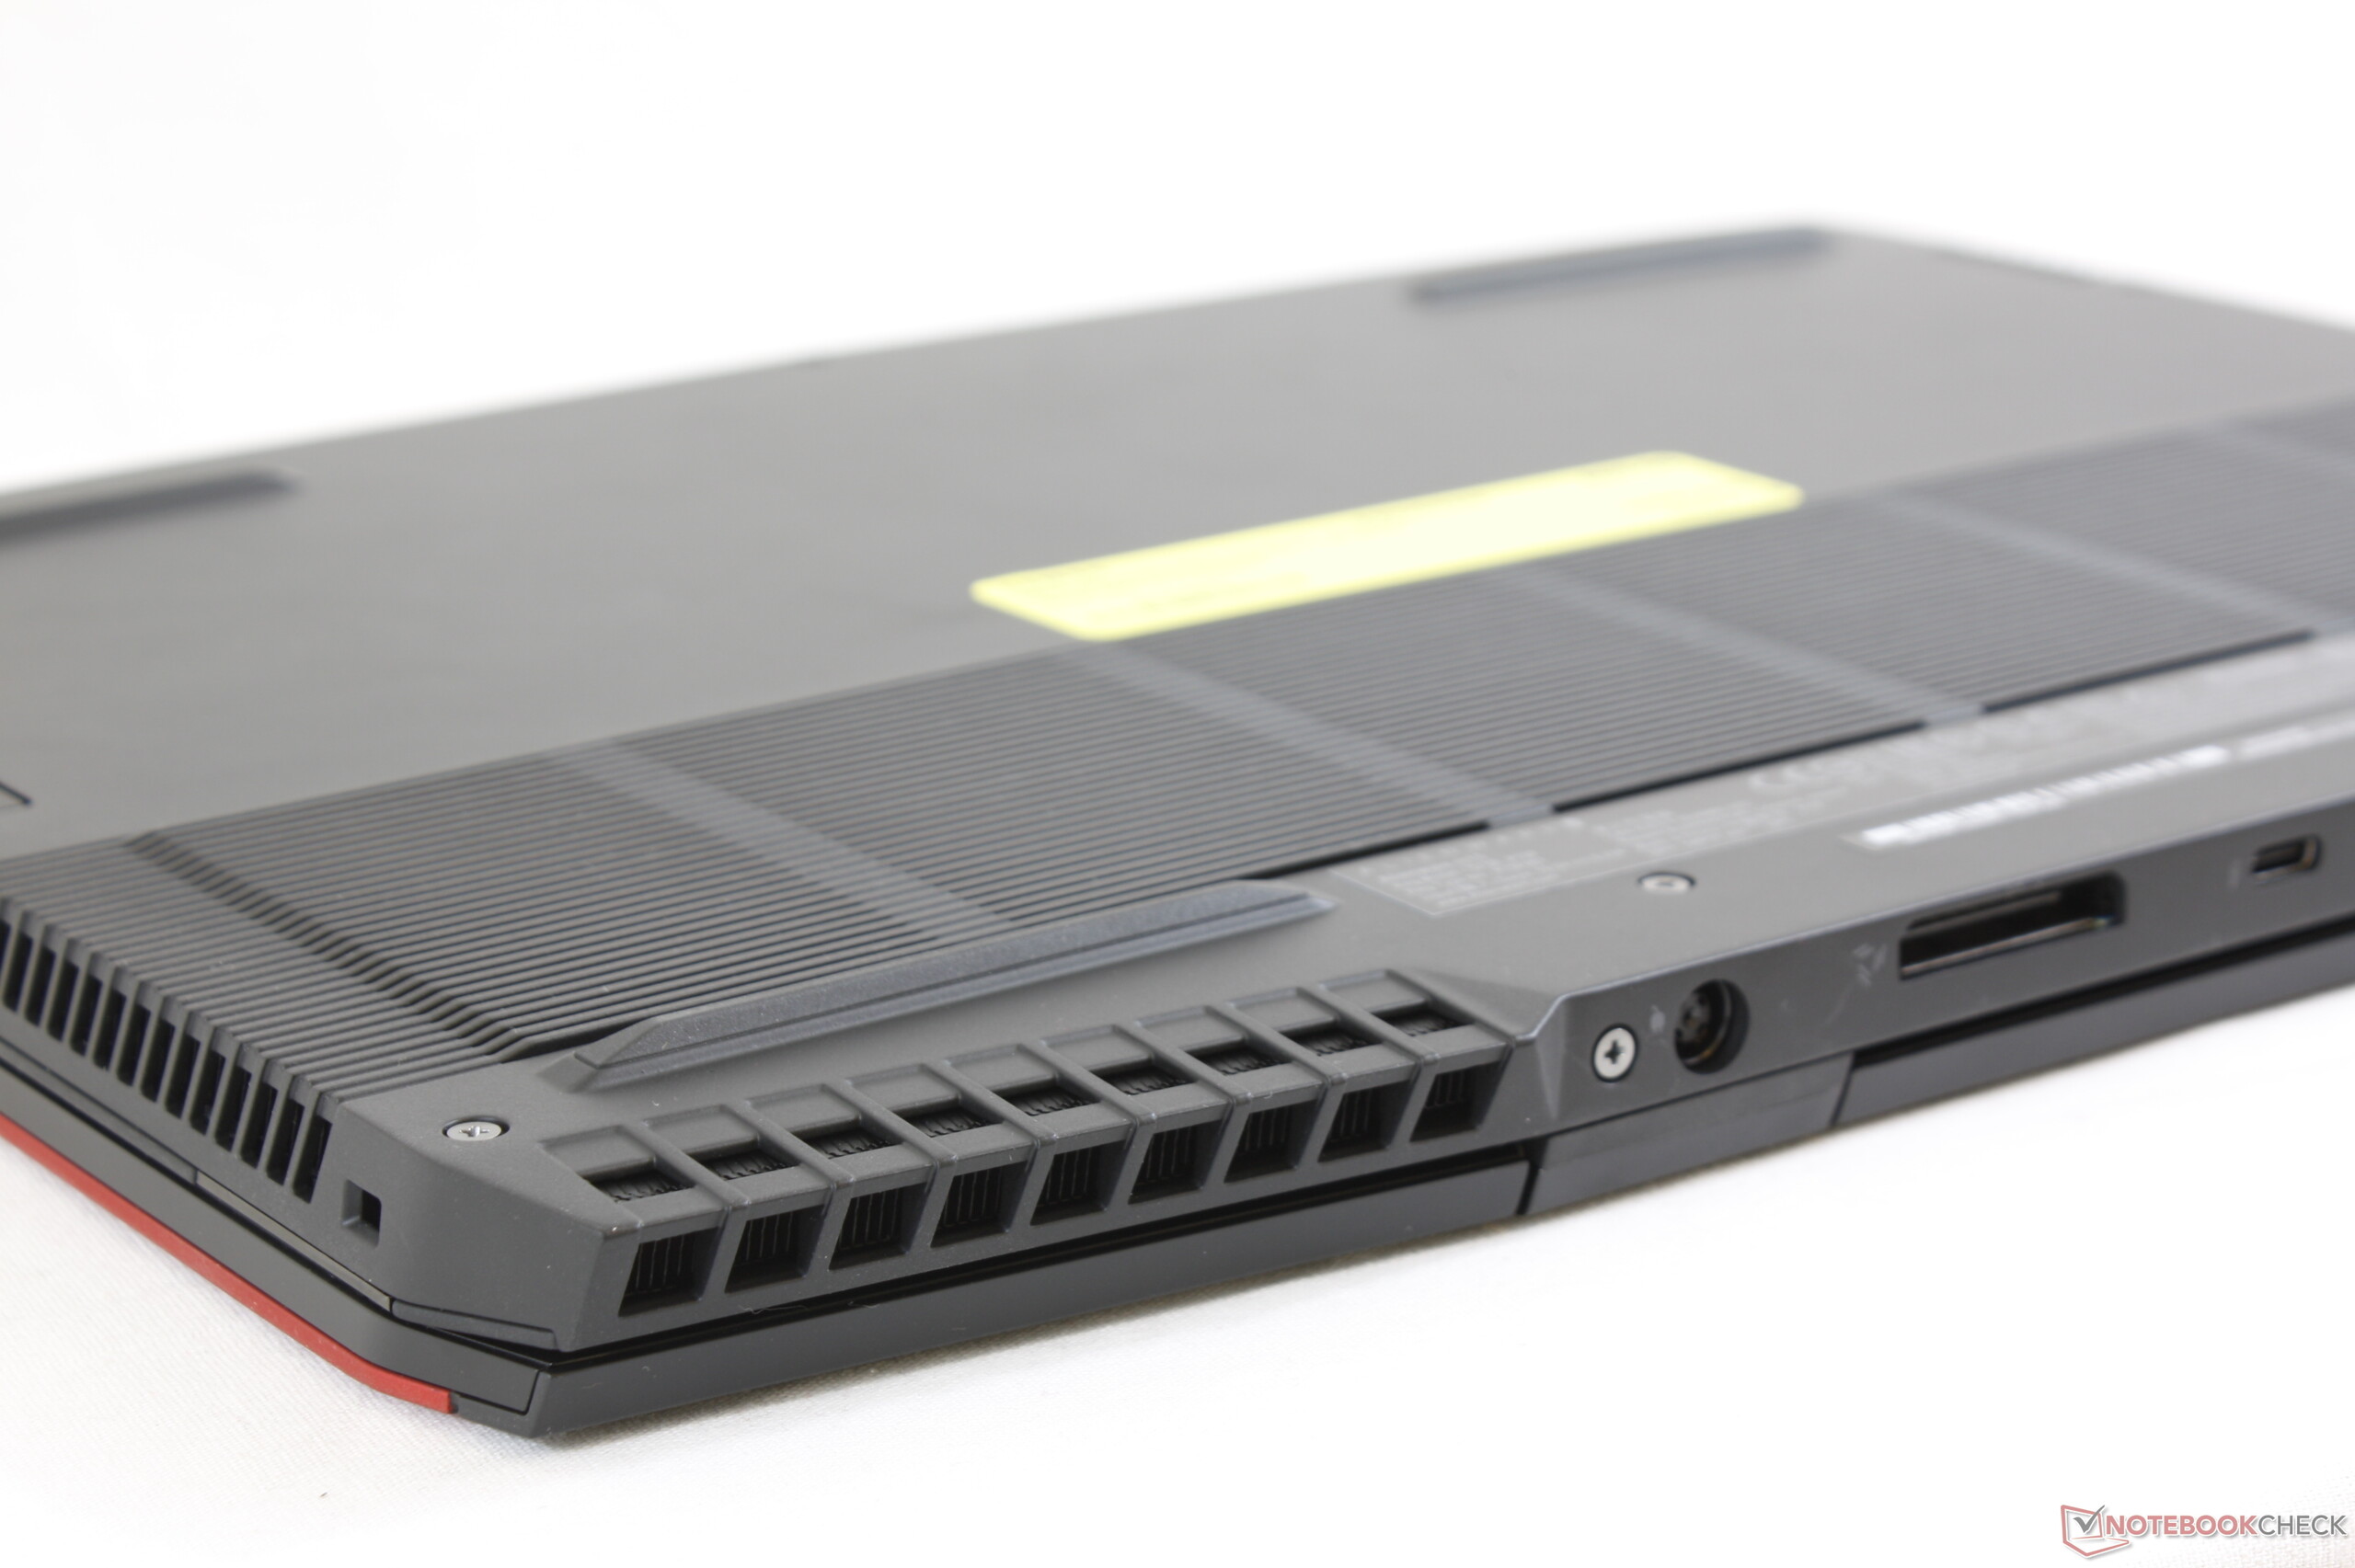
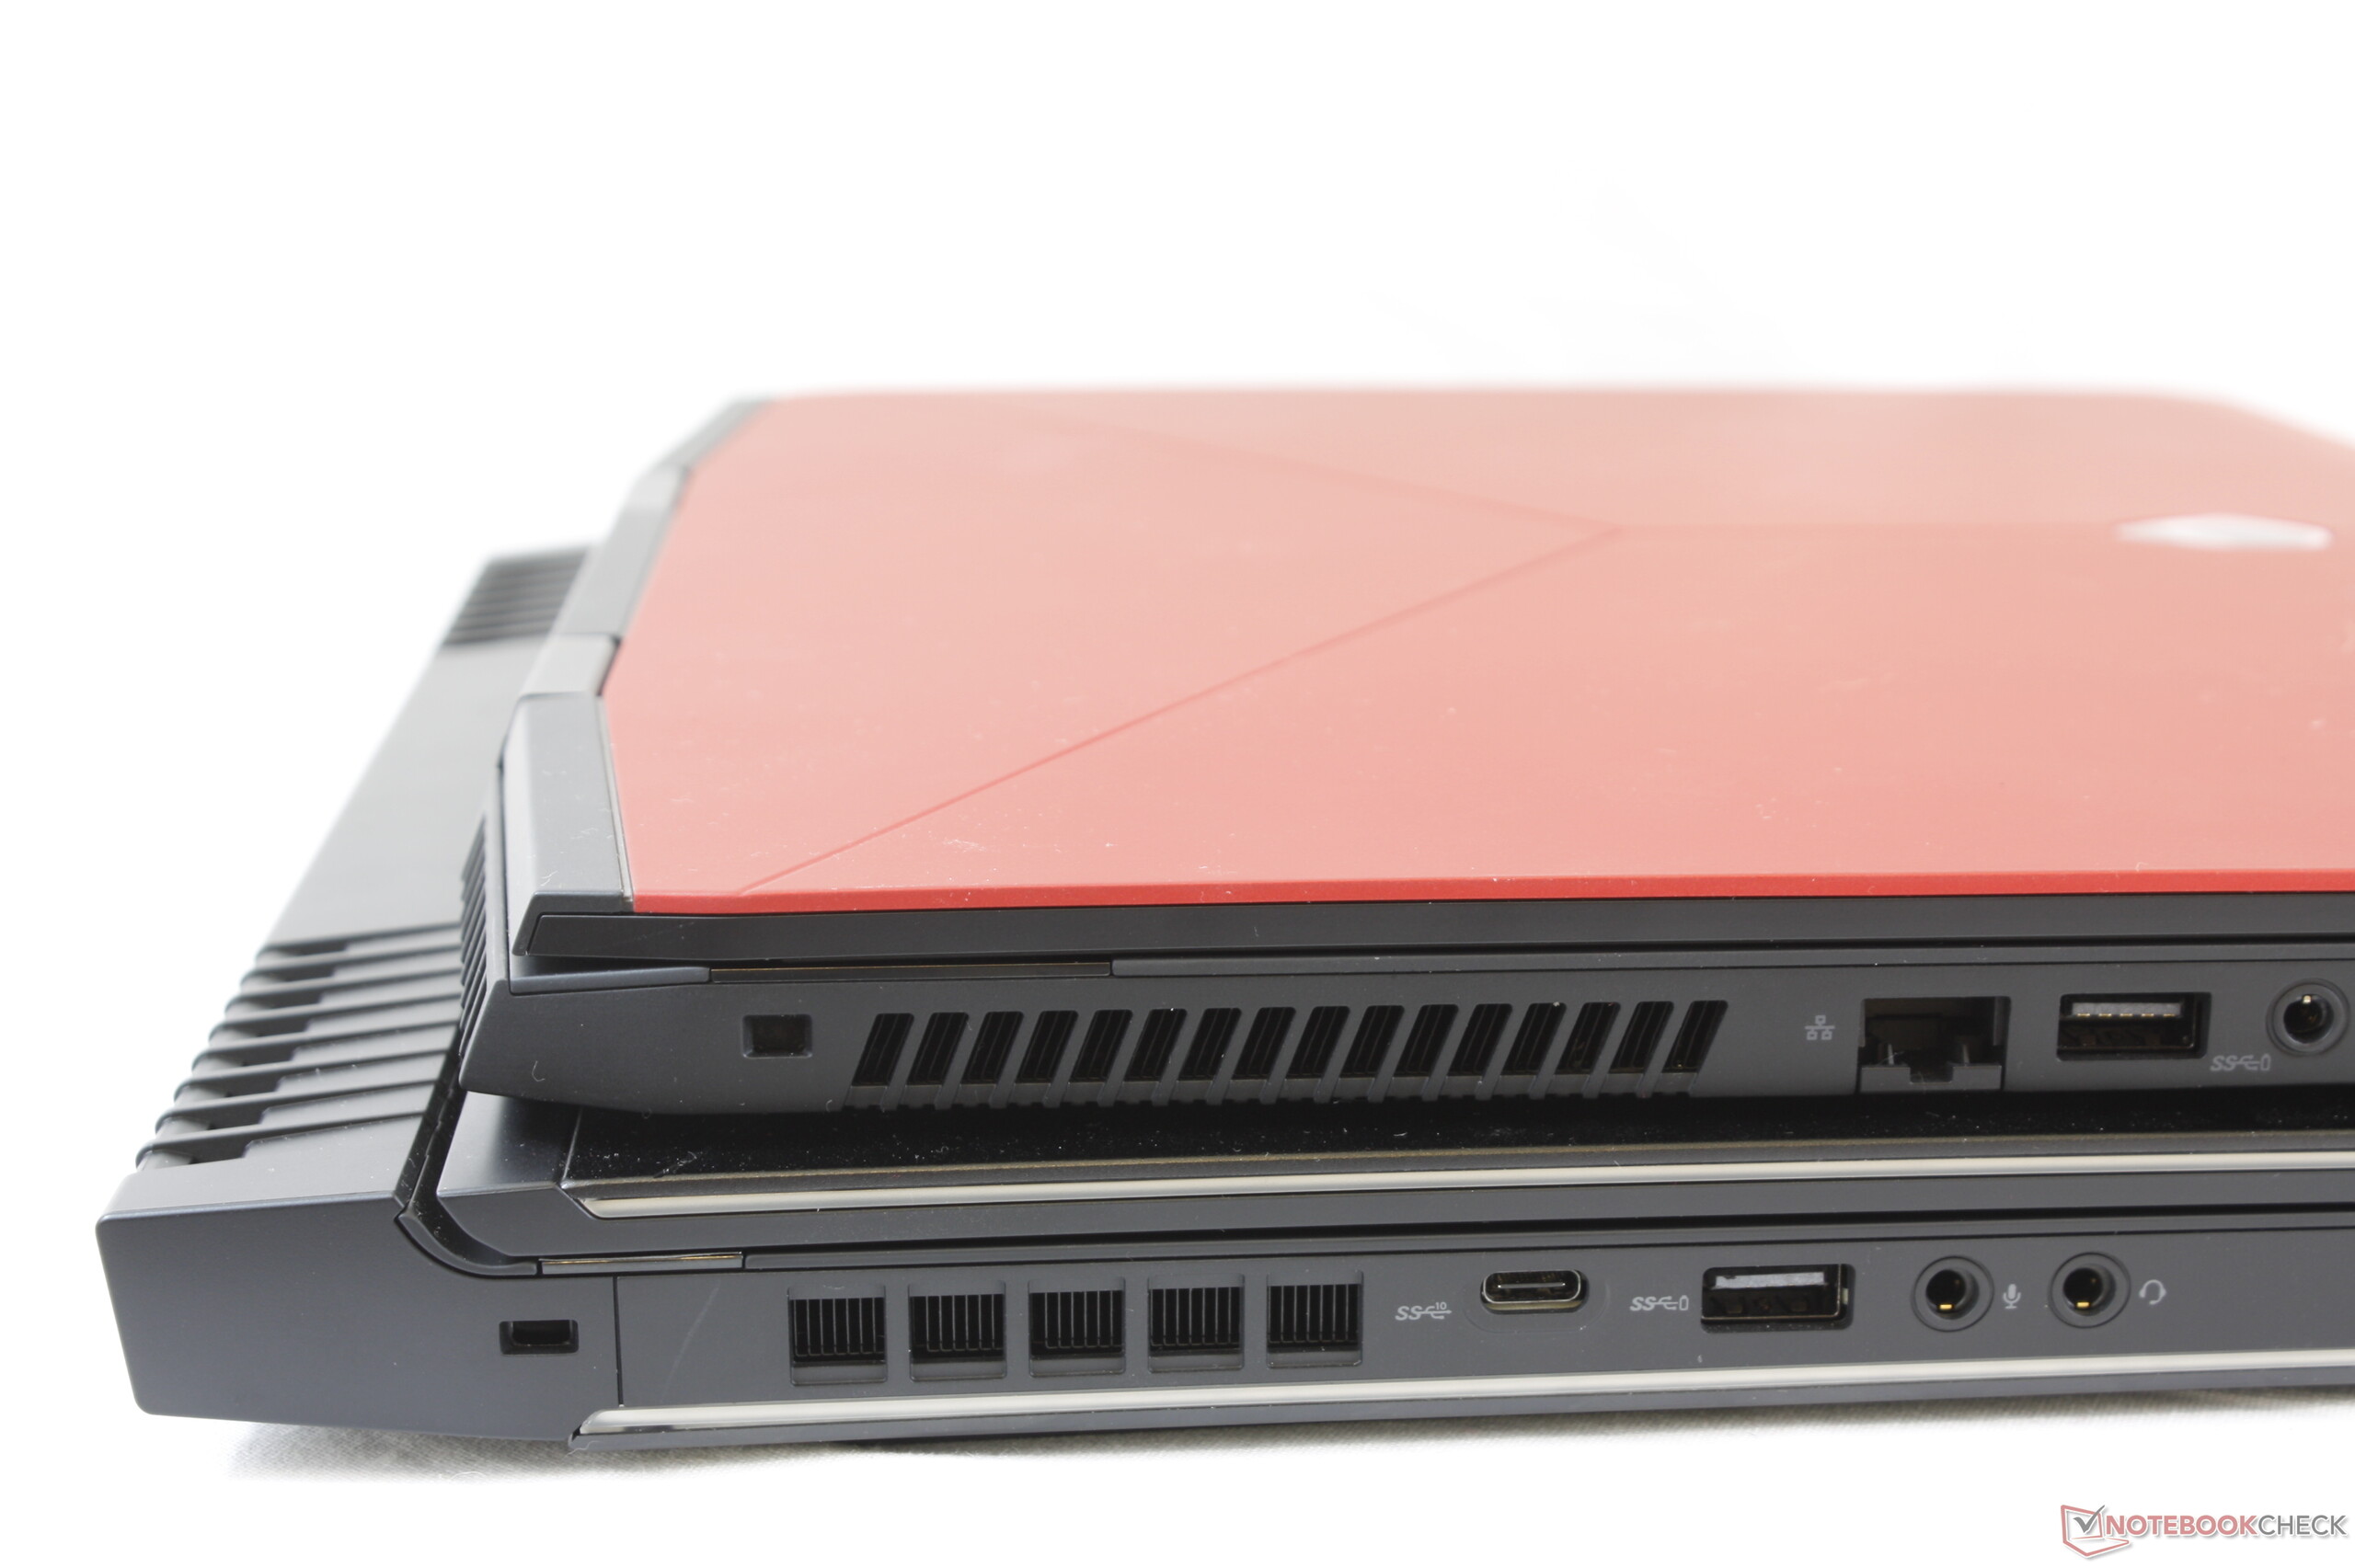
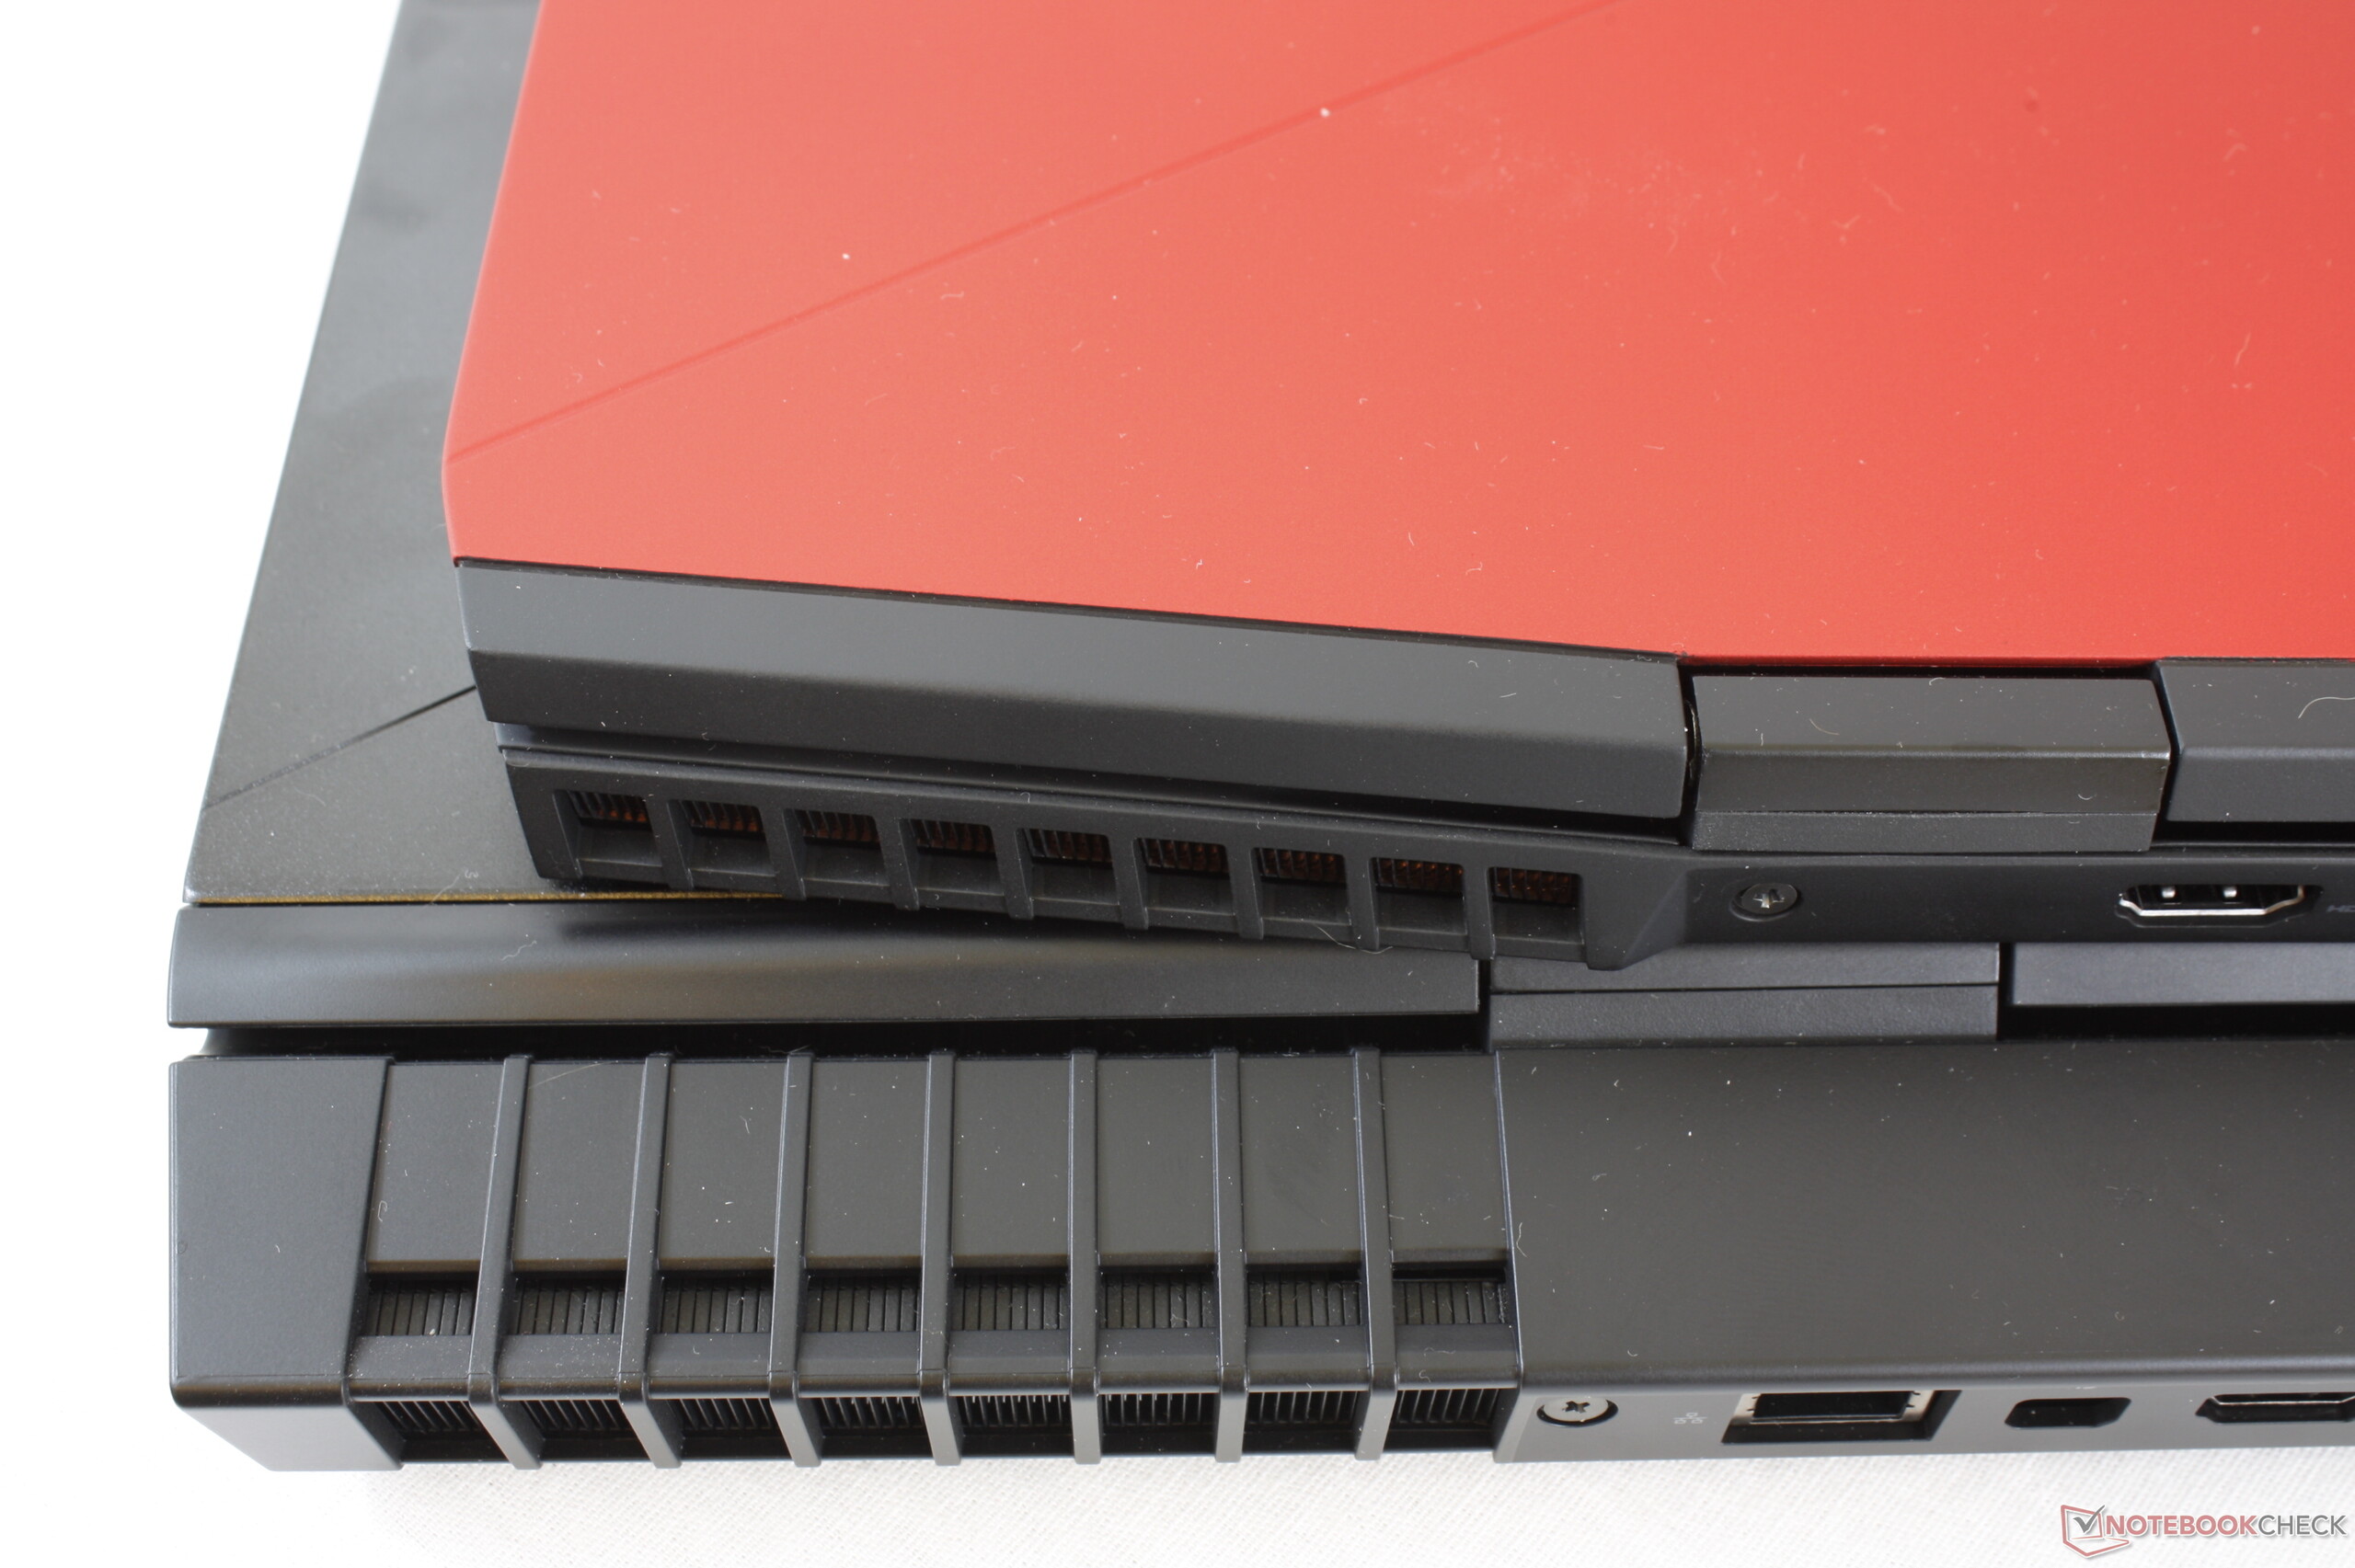
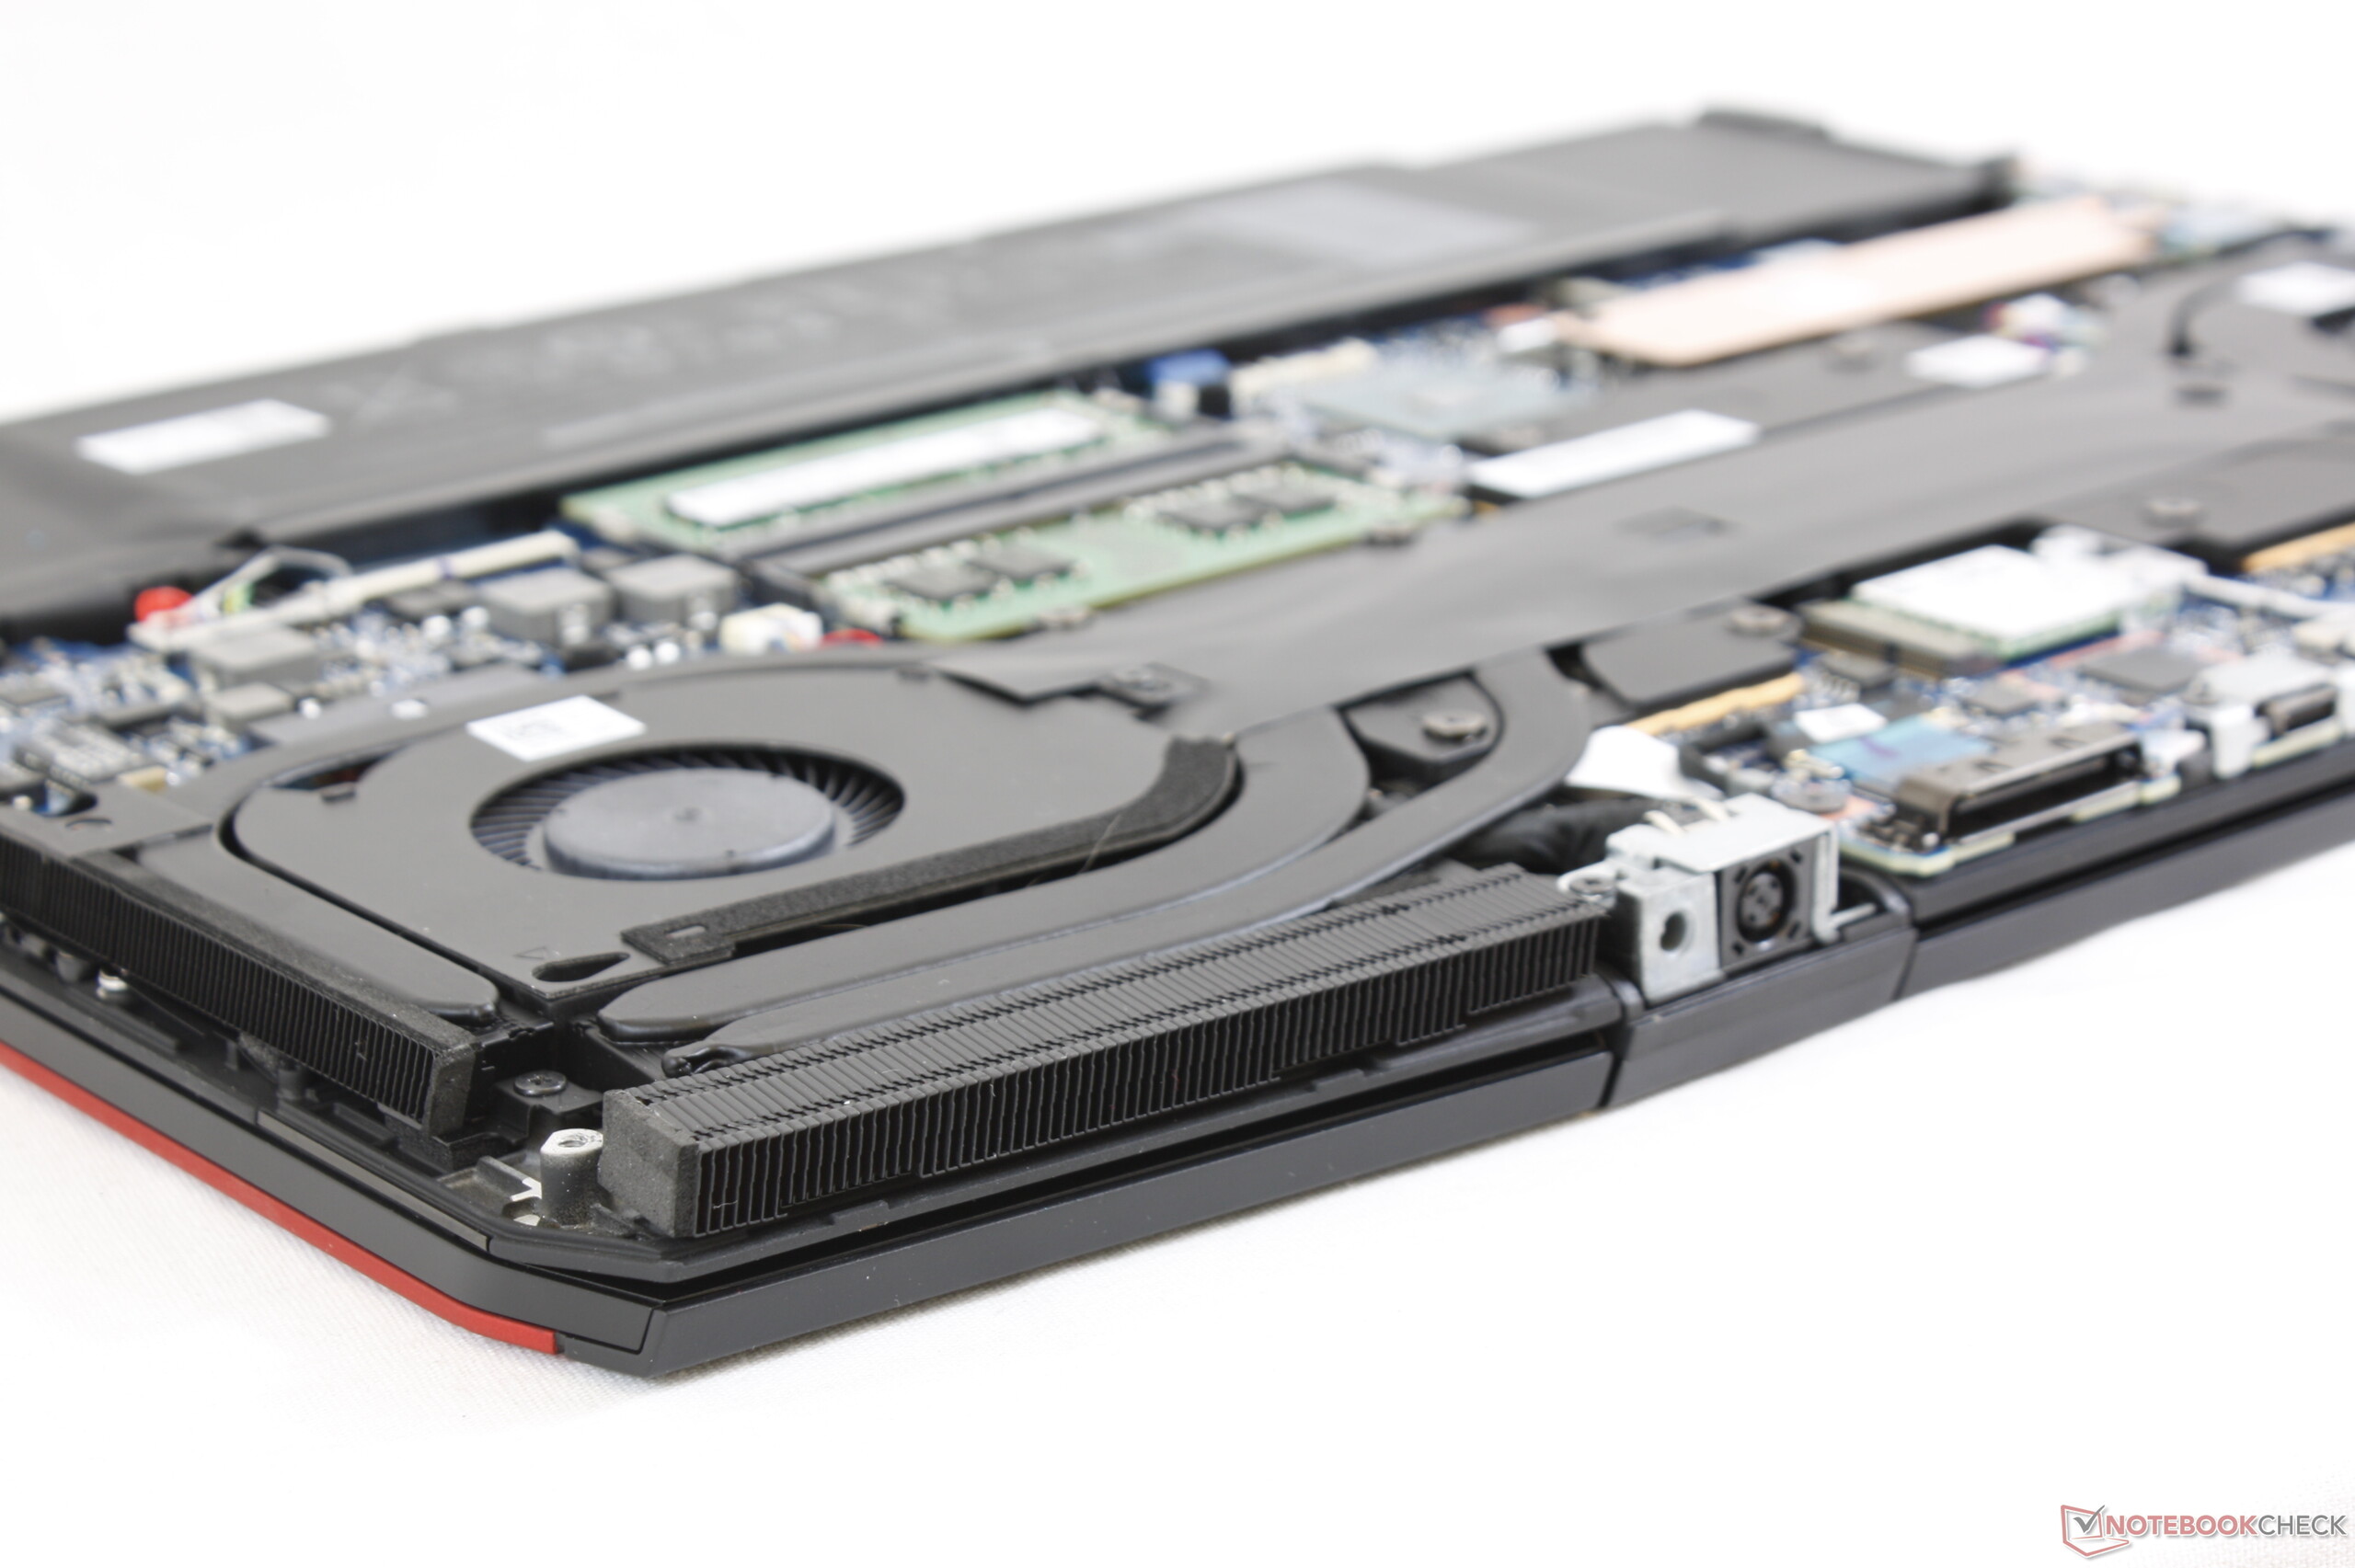
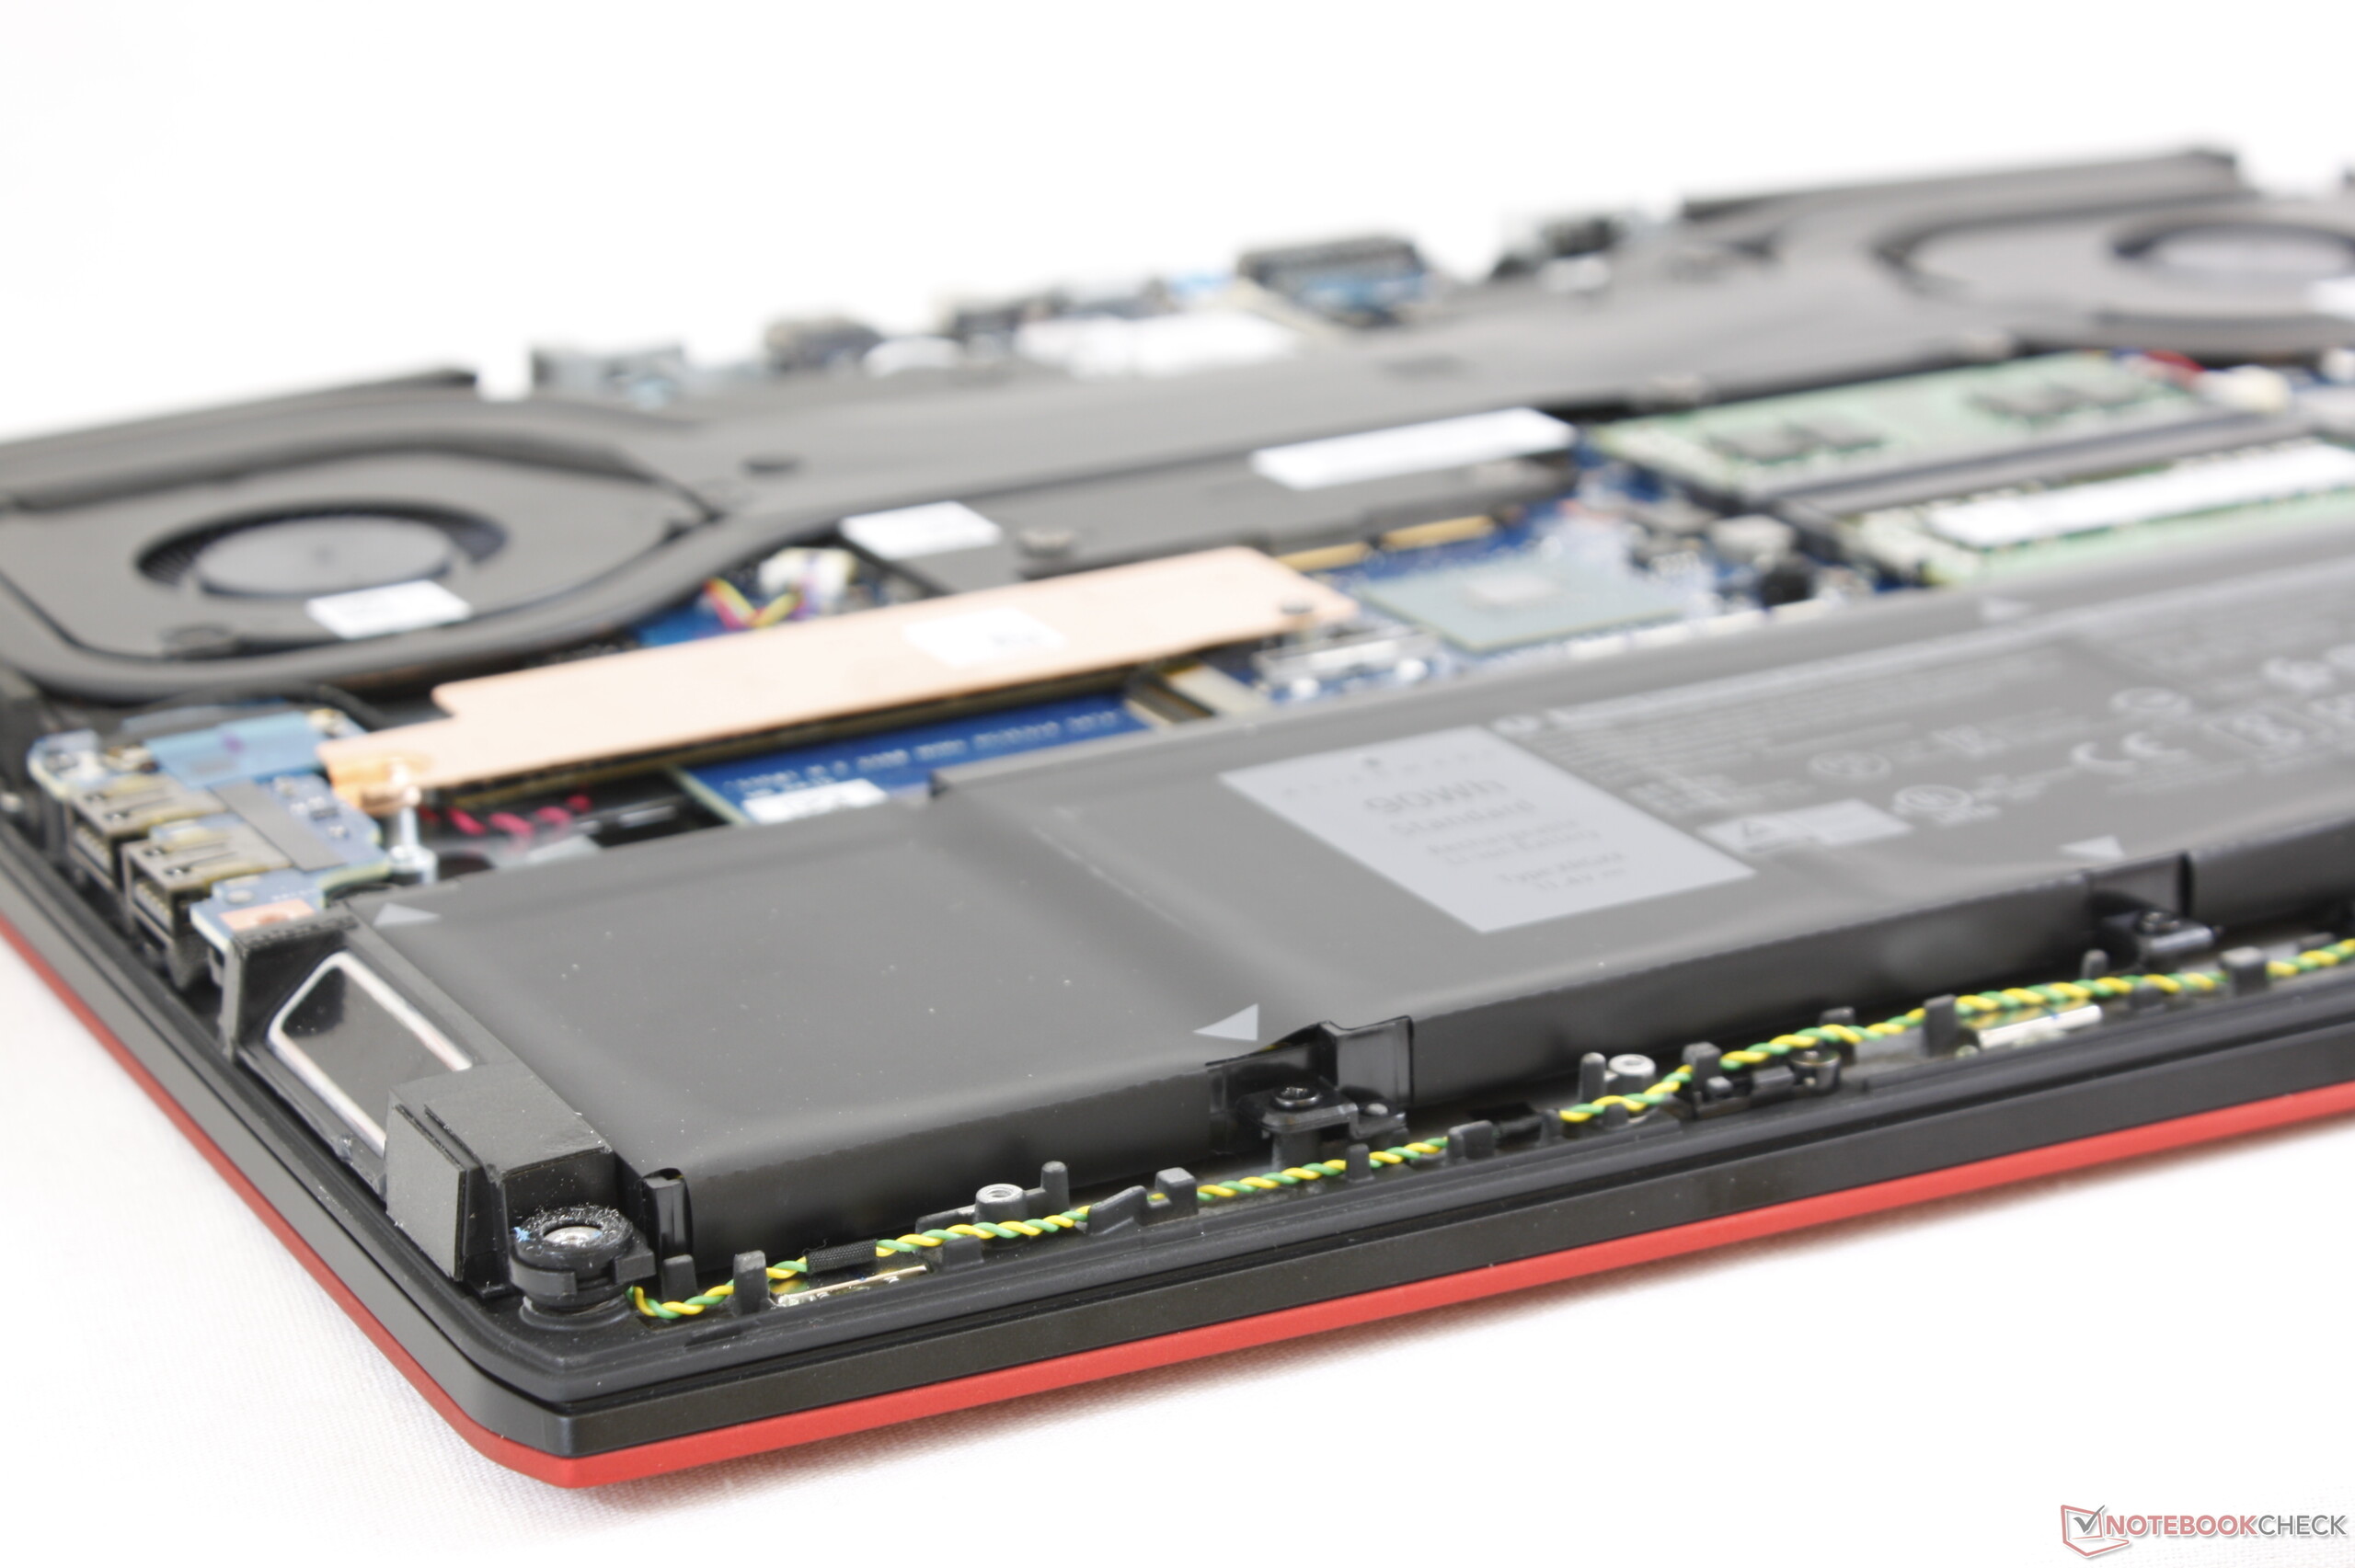
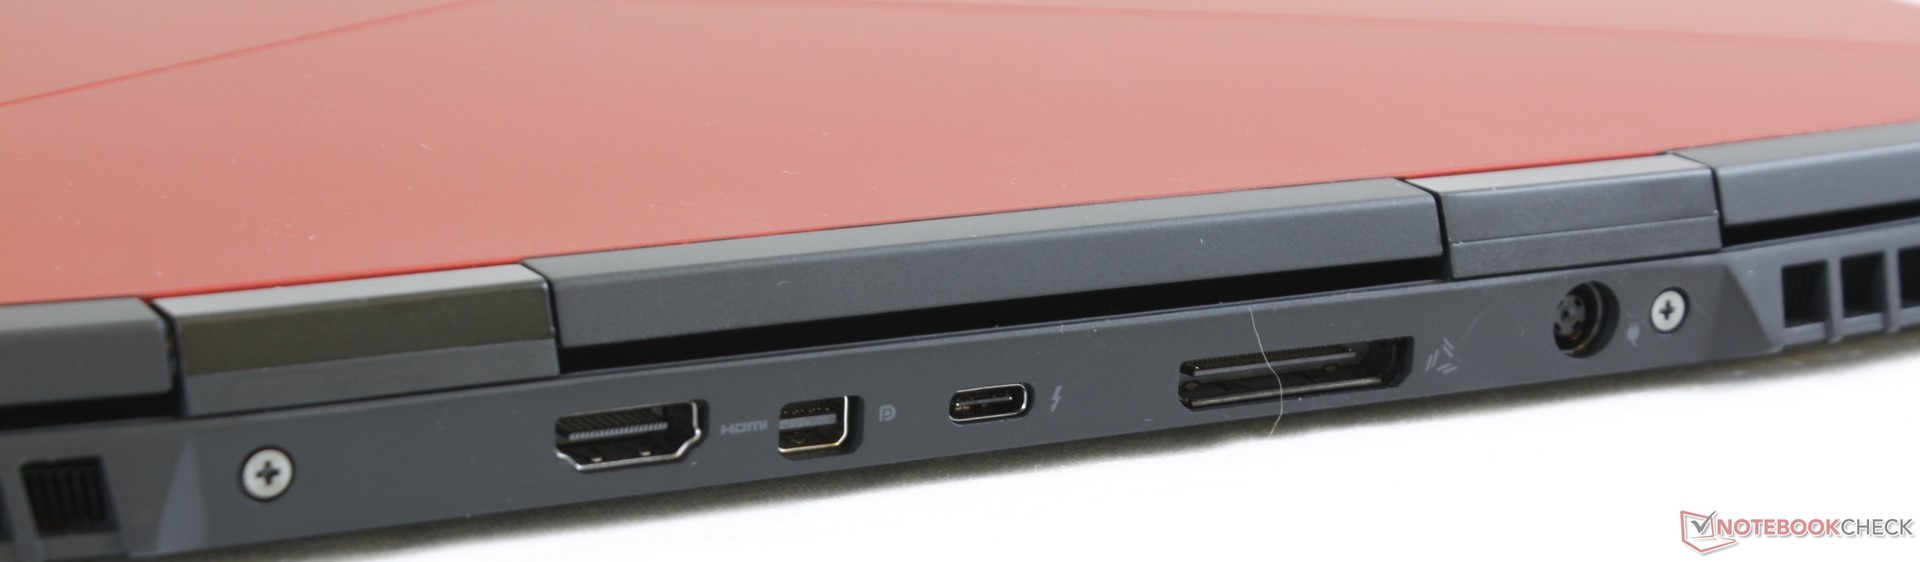
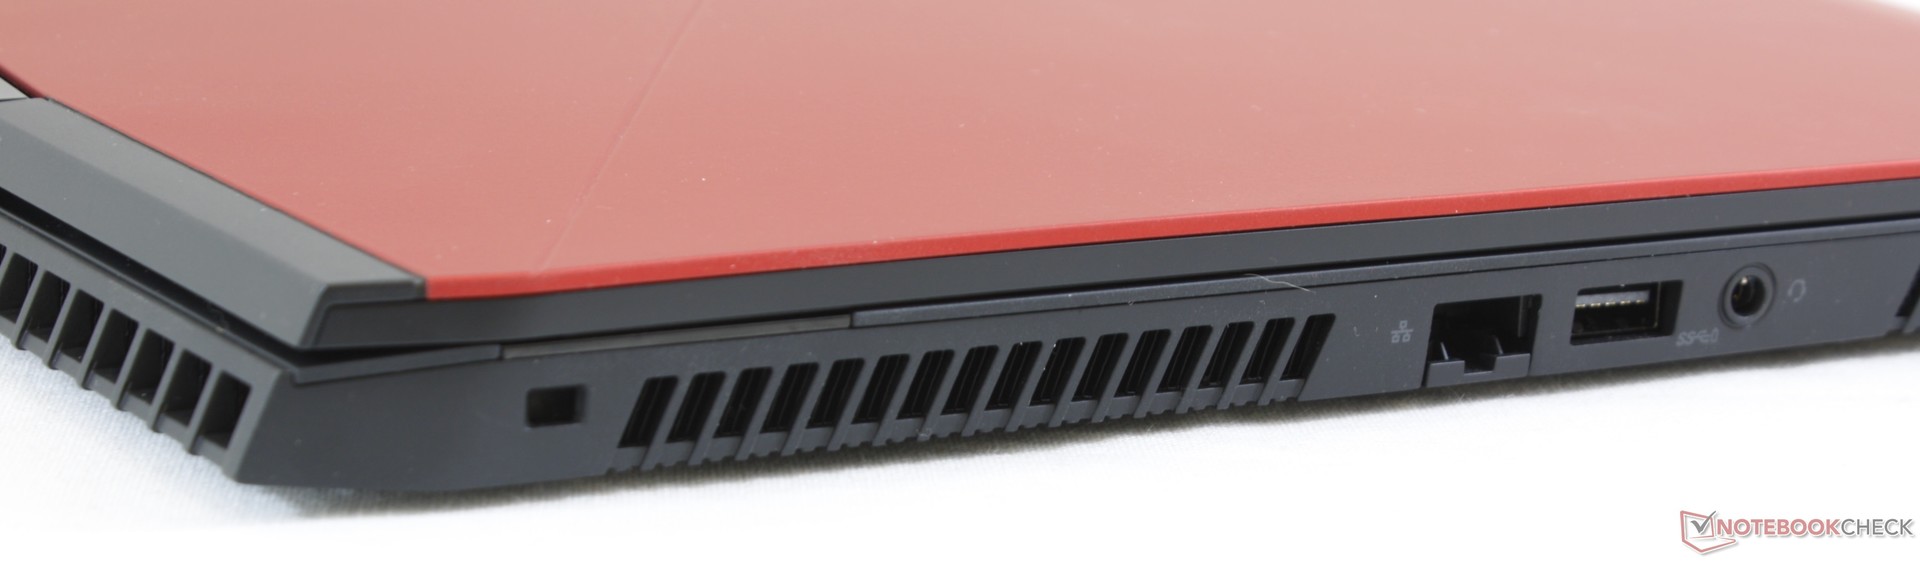
Alienware笔记本电脑传统上会比竞争对手更大,更坚固,更丰富多彩。这使得Alienware m15可能成为一个非常具有挑战性的设计理念,因为它必须平衡所有上述因素,同时看起来像Razer Blade 15或MSI GS65一样轻薄。确实,新机身小于Alienware 15 R4,而在接口选择,RGB照明,铰链刚性,存储托架和电池容量都有小幅削减,但明显更轻的重量可能非常值得特殊用户群体。事实上,它甚至提供了一些更大的替代品所没有的功能,包括更长的续航时间和小键盘。
将Alienware m15和GS65,Blade 15,Aero 15x,Zephyrus GX531或Predator Triton 700相比较会更加公平。该设备比许多超薄替代品更厚更重,但它也比大多数更加坚固,具有更长的续航时间和更多的内部存储选项。最令人惊喜的可能是其卓越的CPU睿频时间,m15可以提供比其他配备i7-8750H处理器的轻薄本更强的CPU性能。
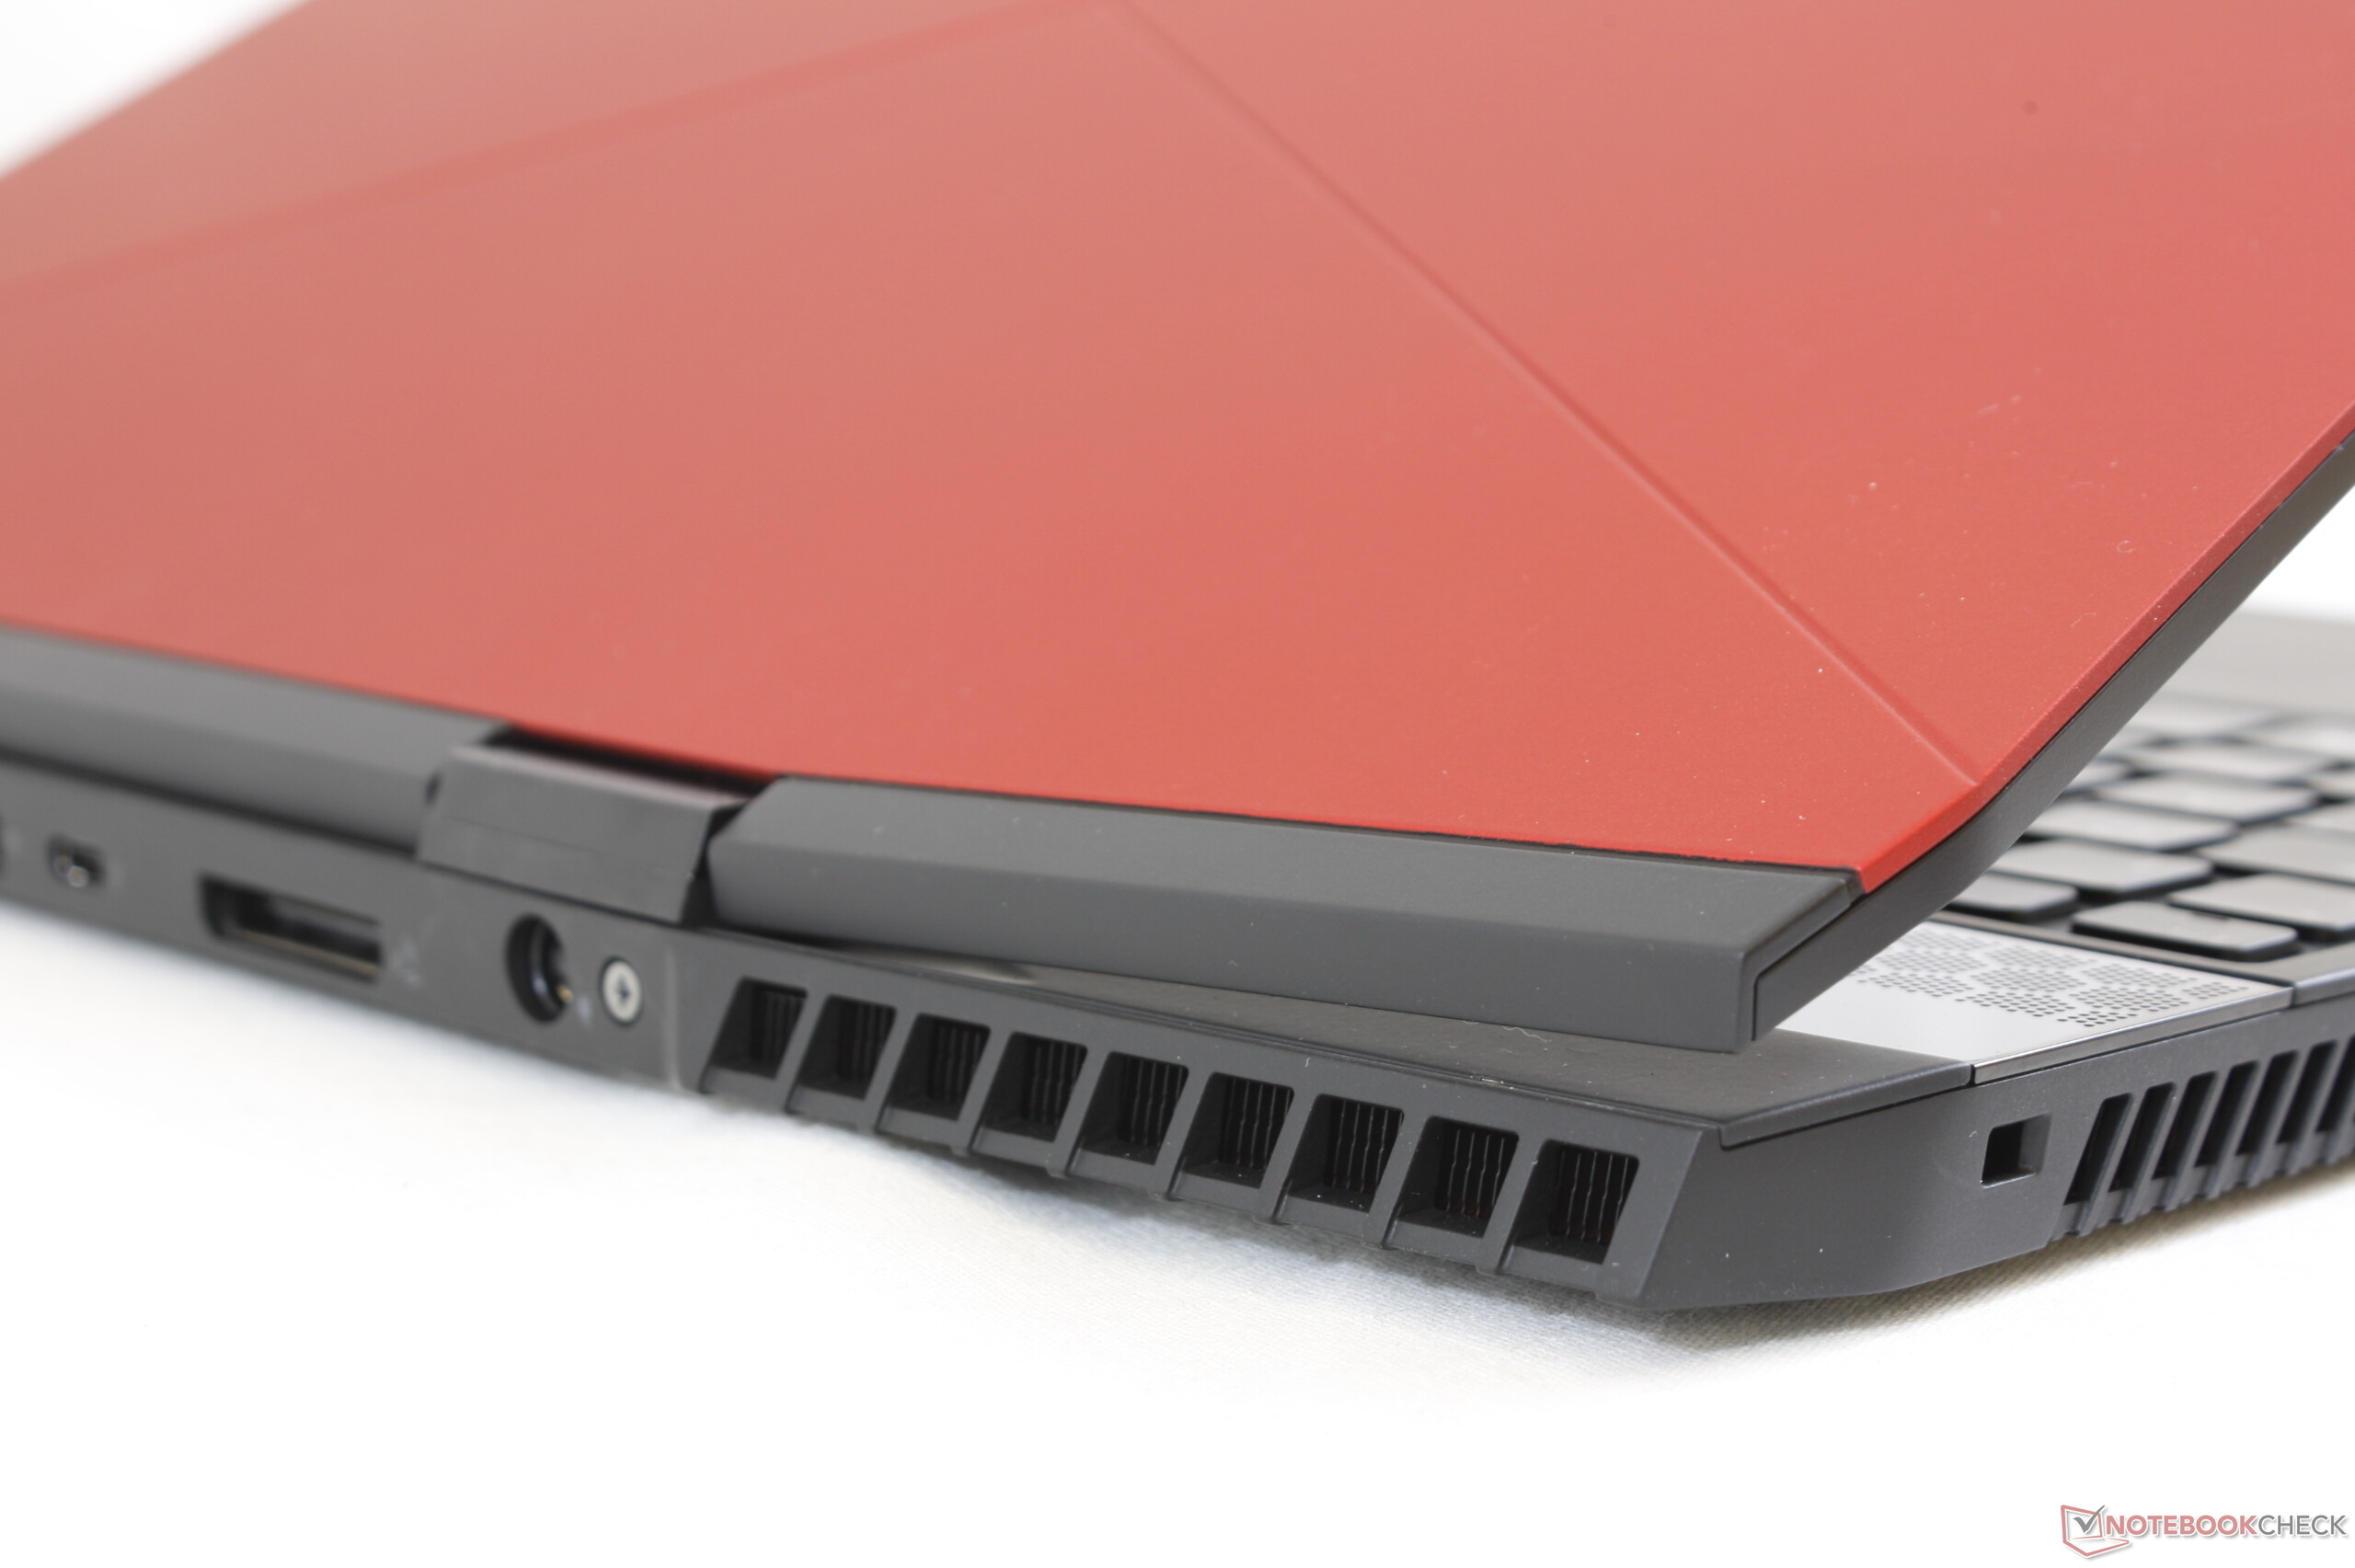
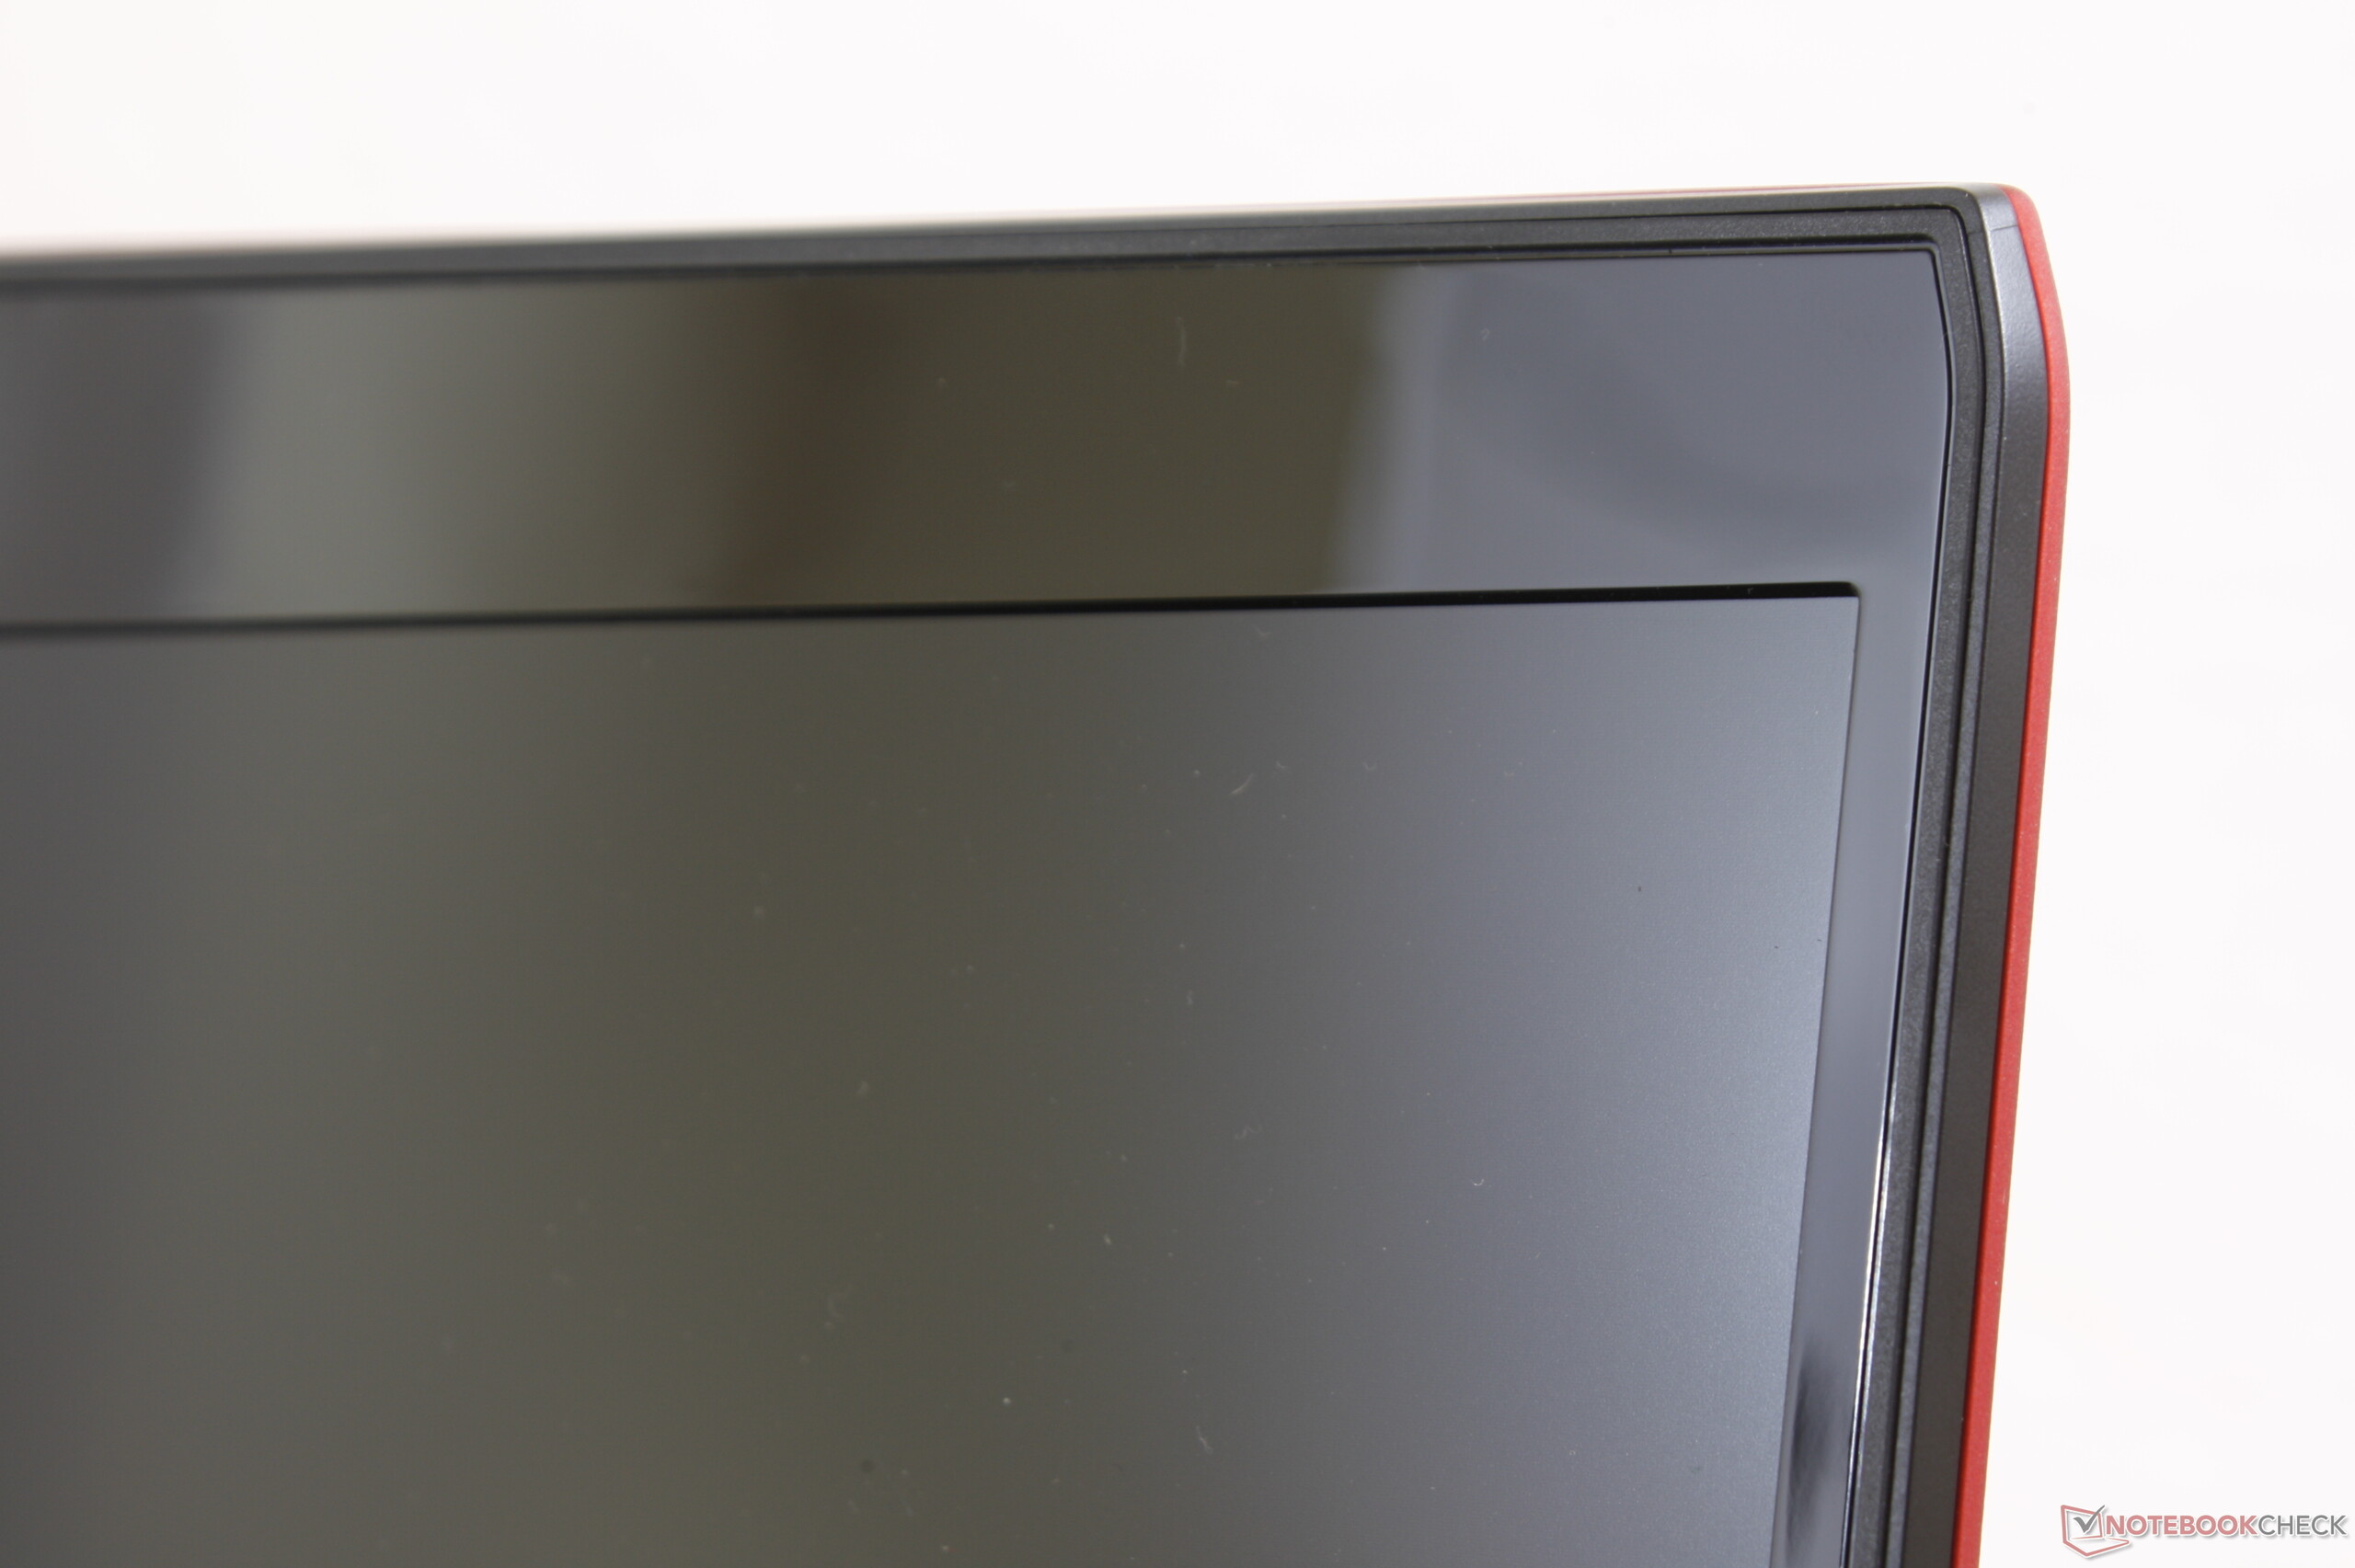
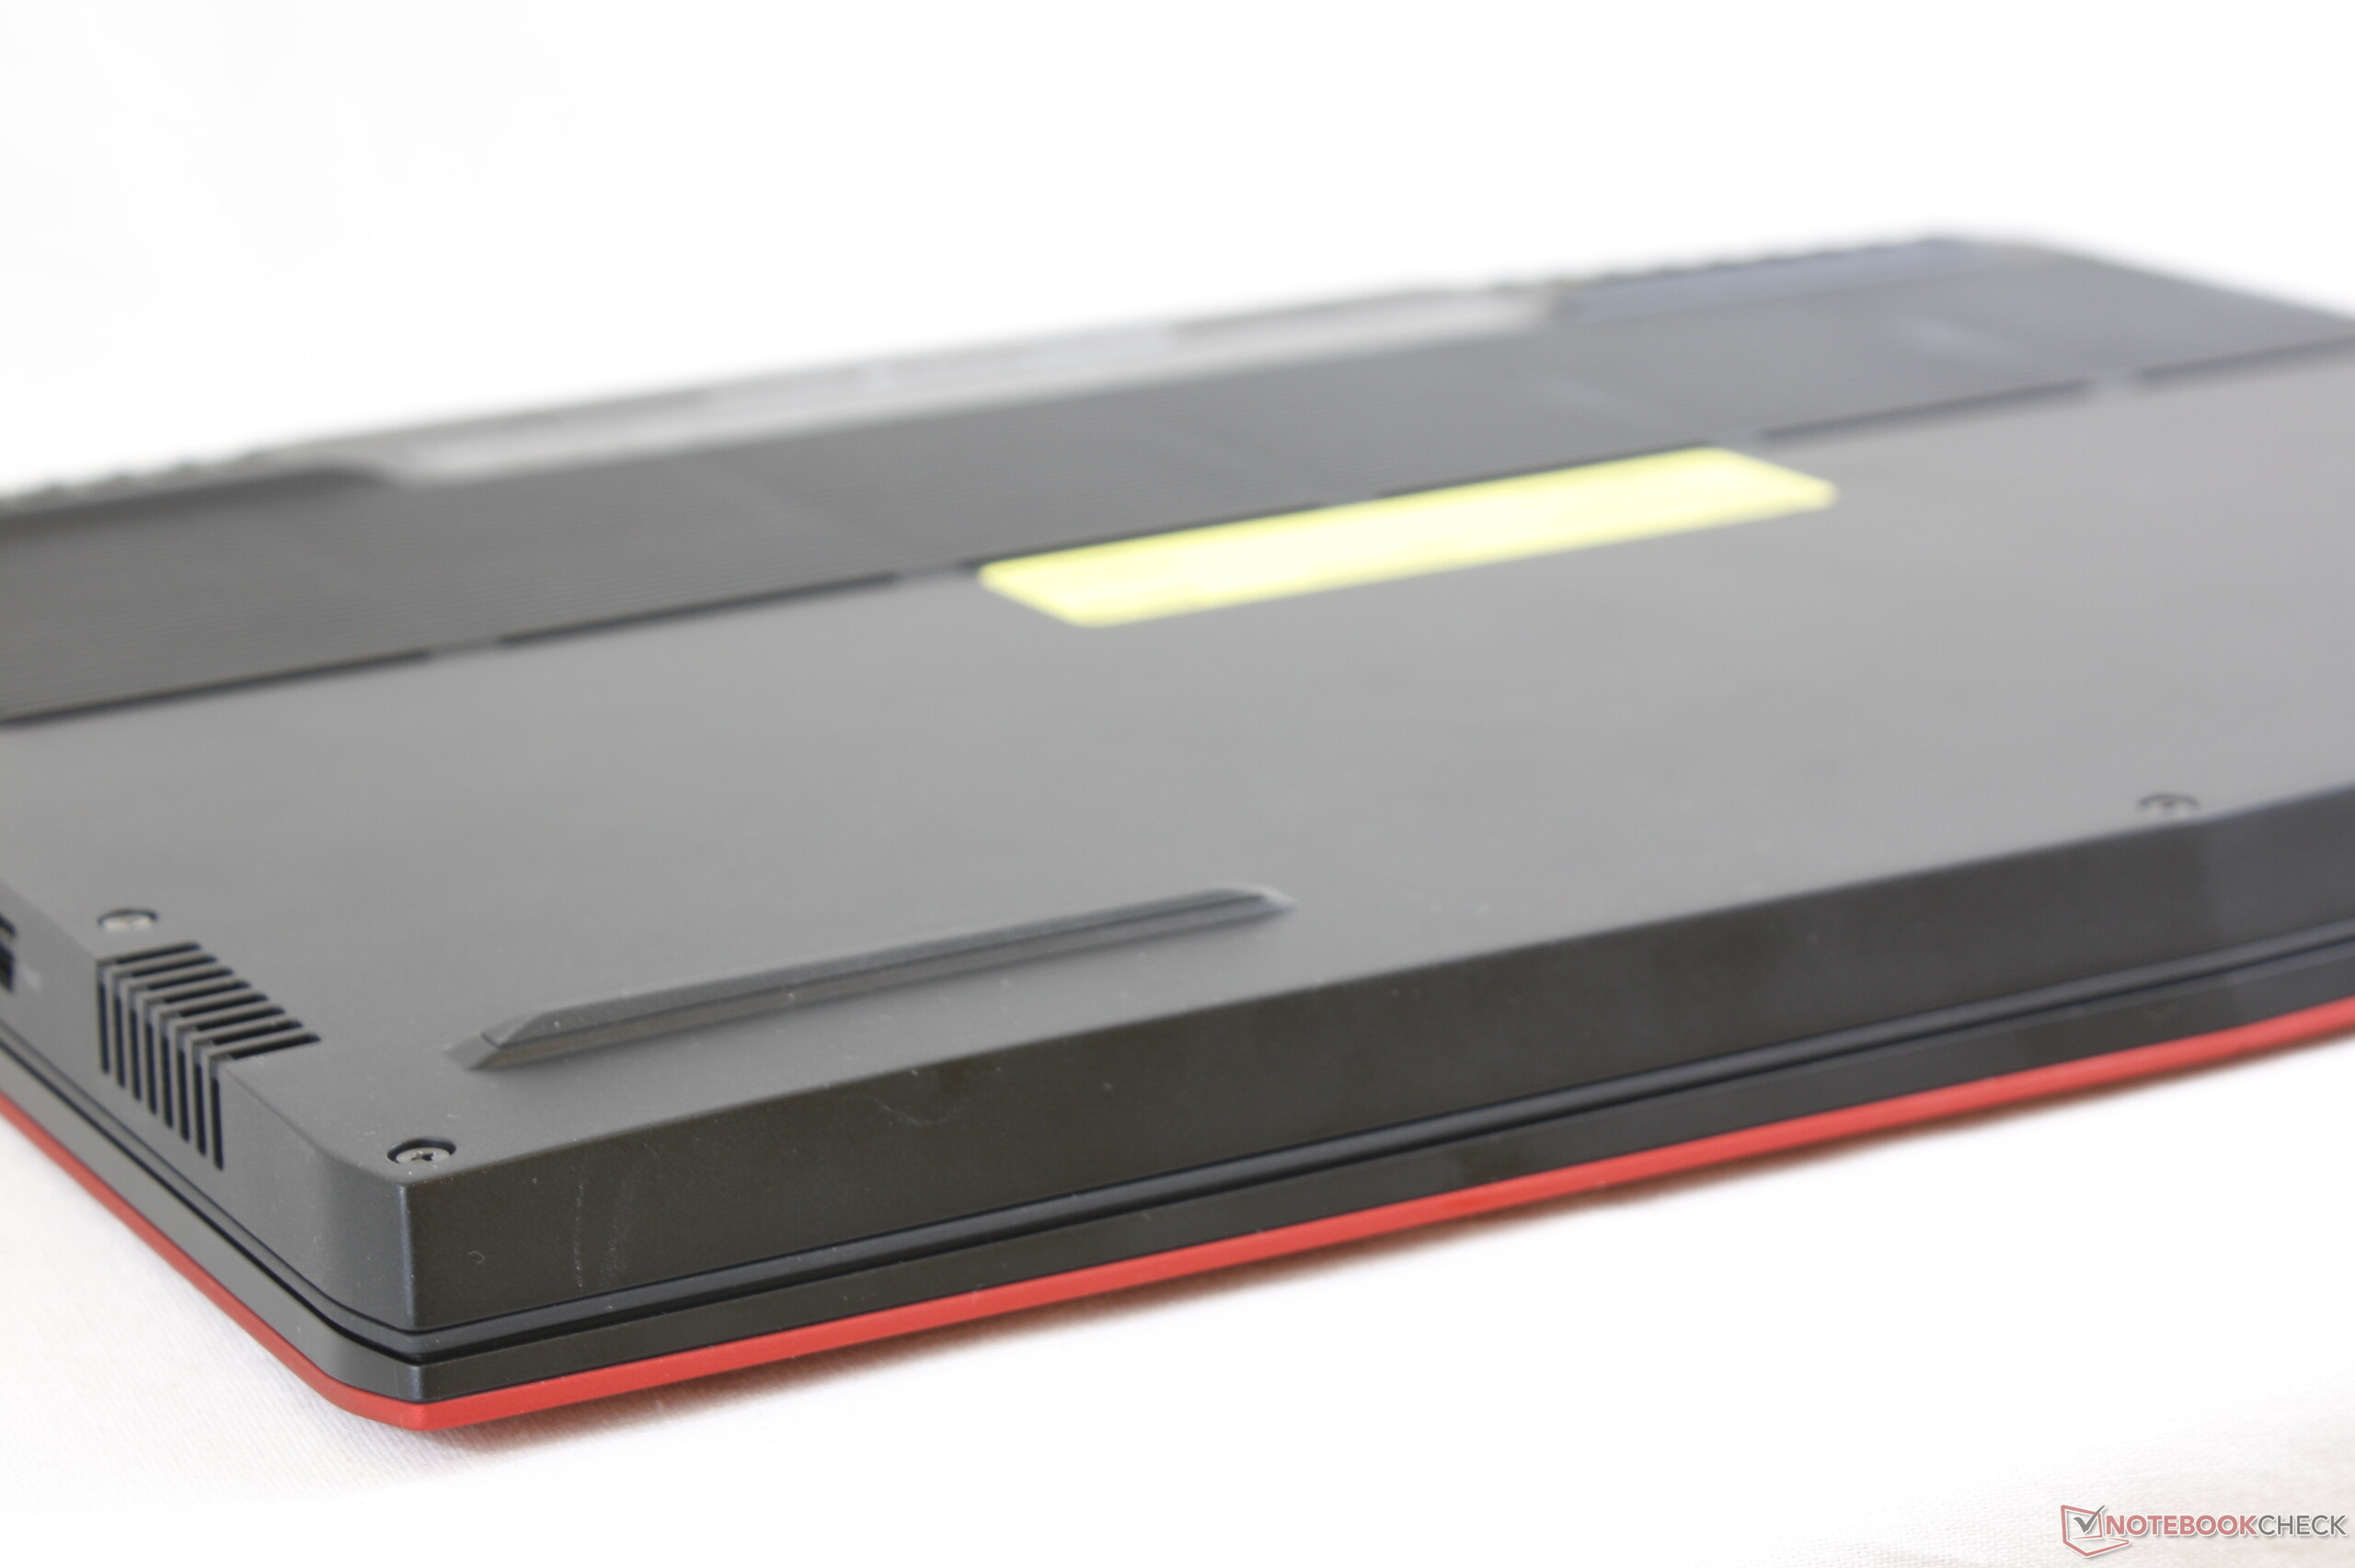
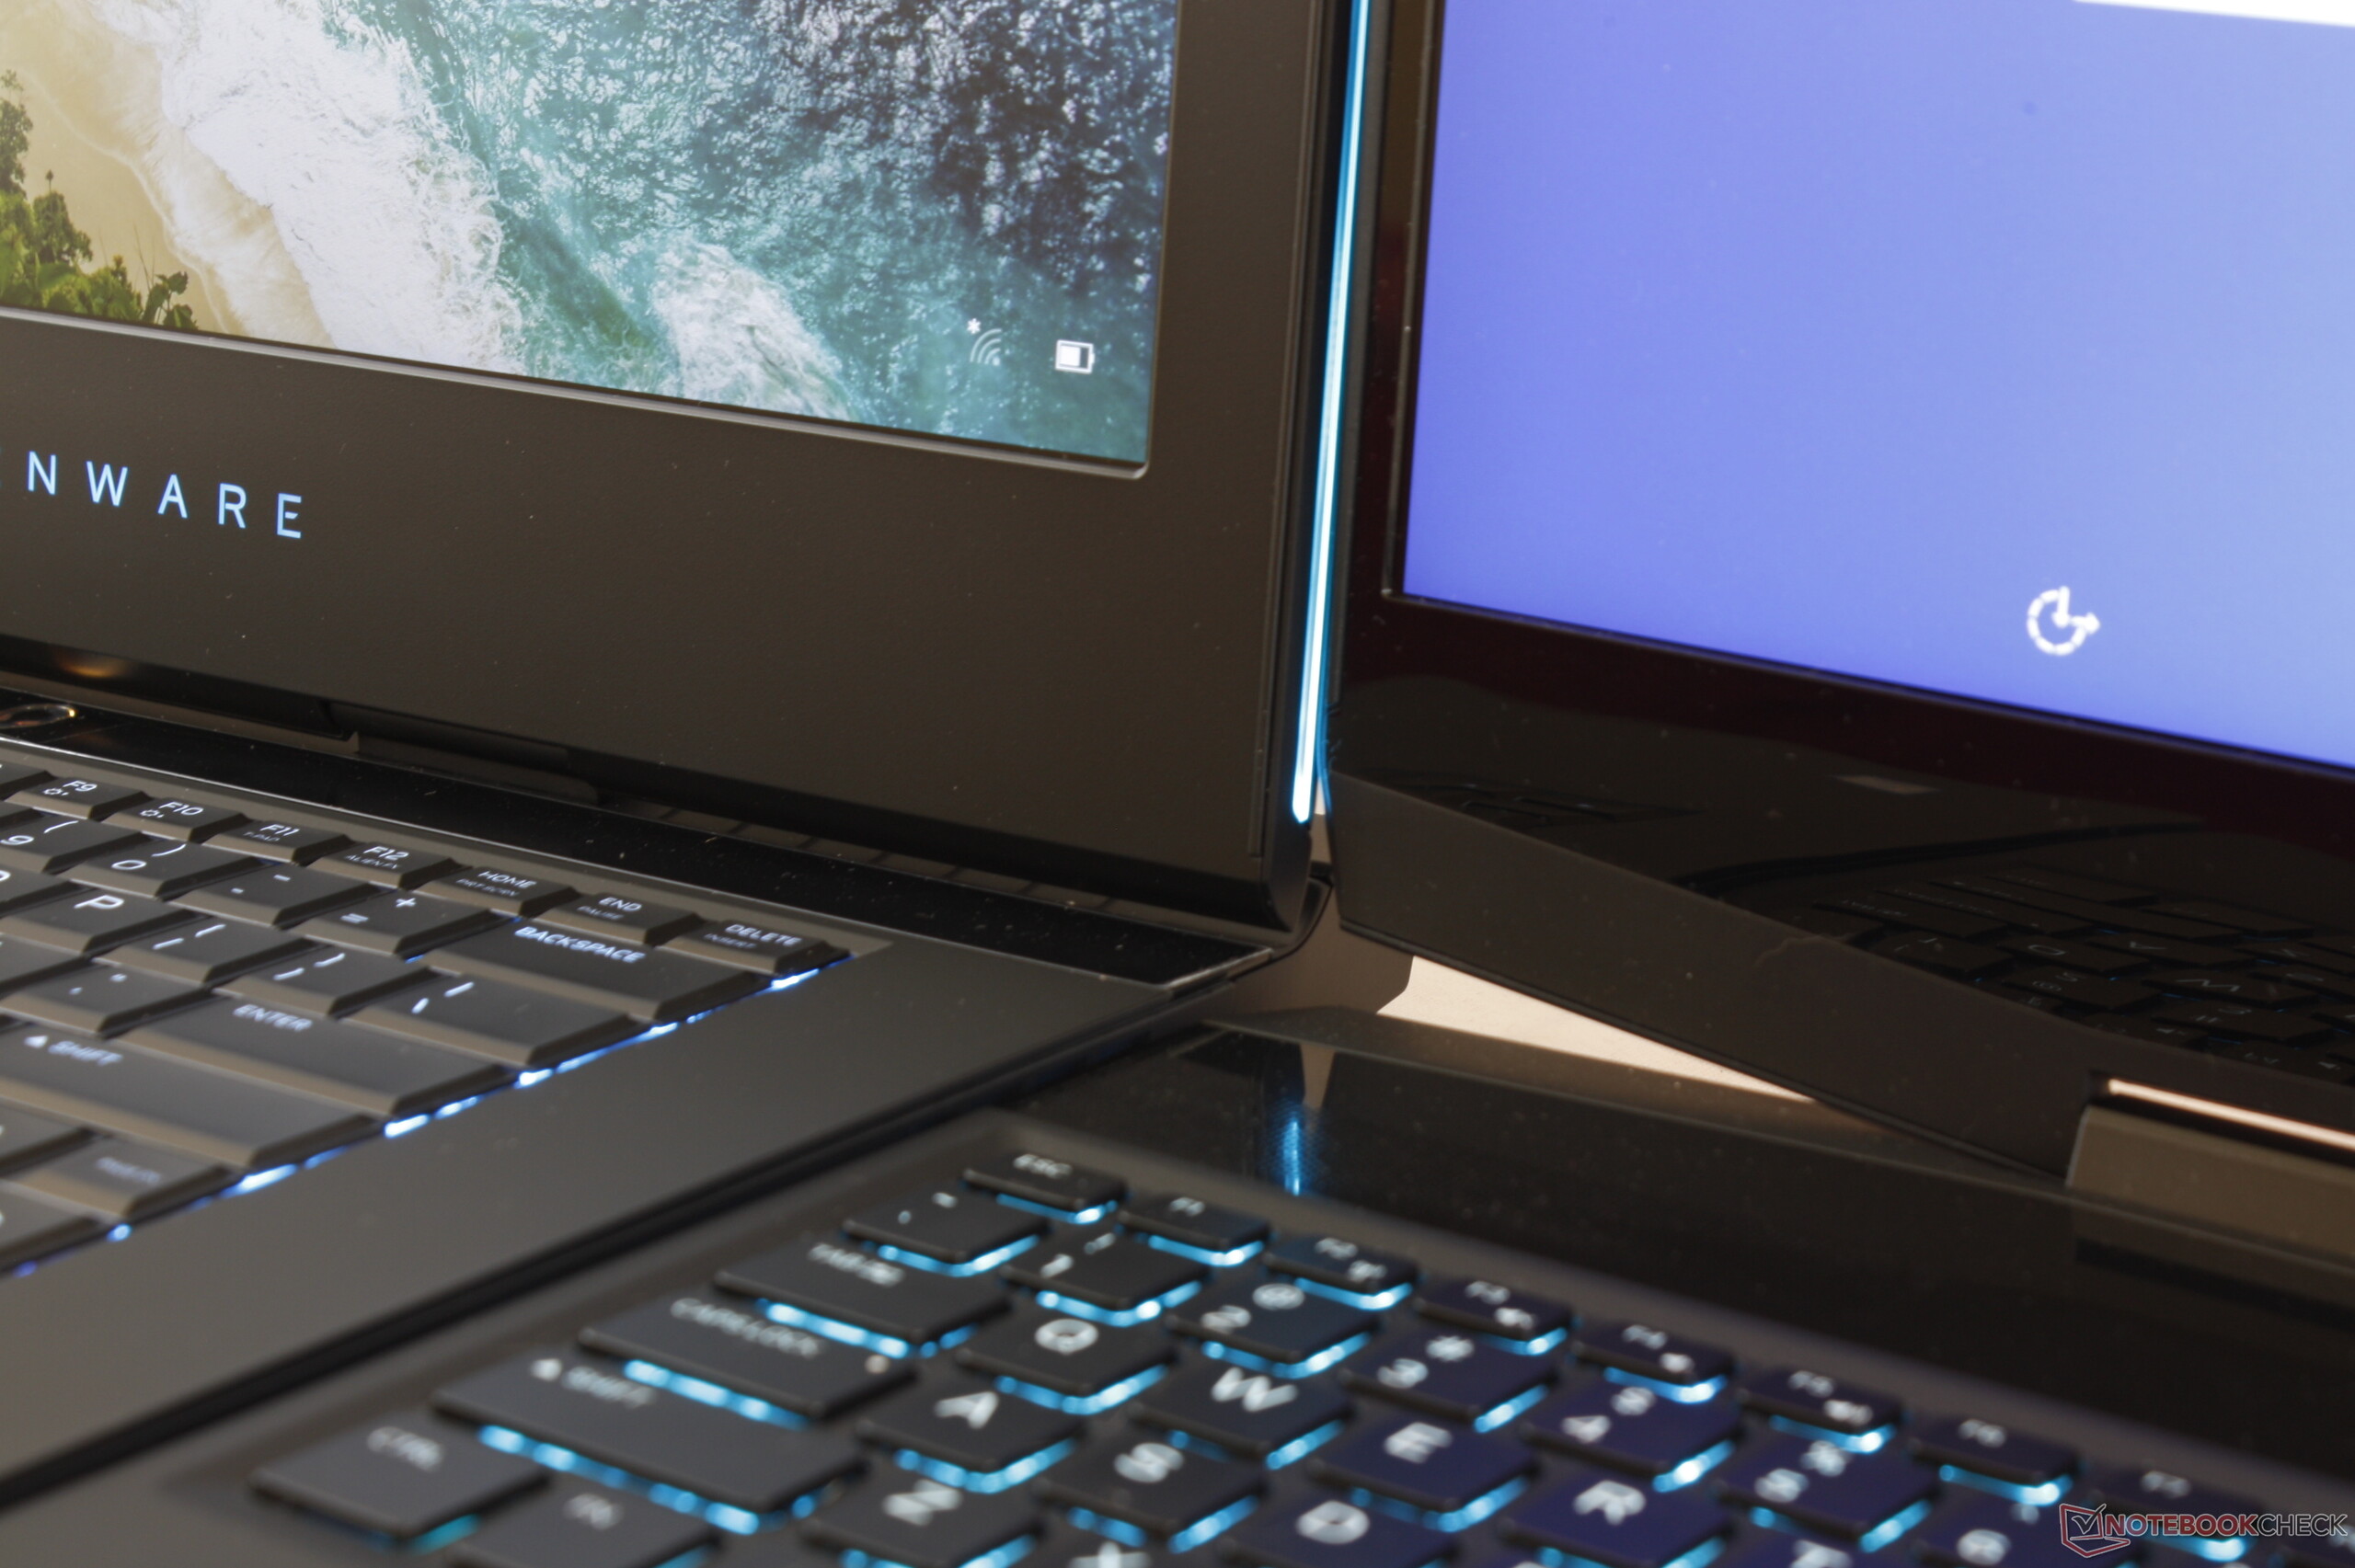
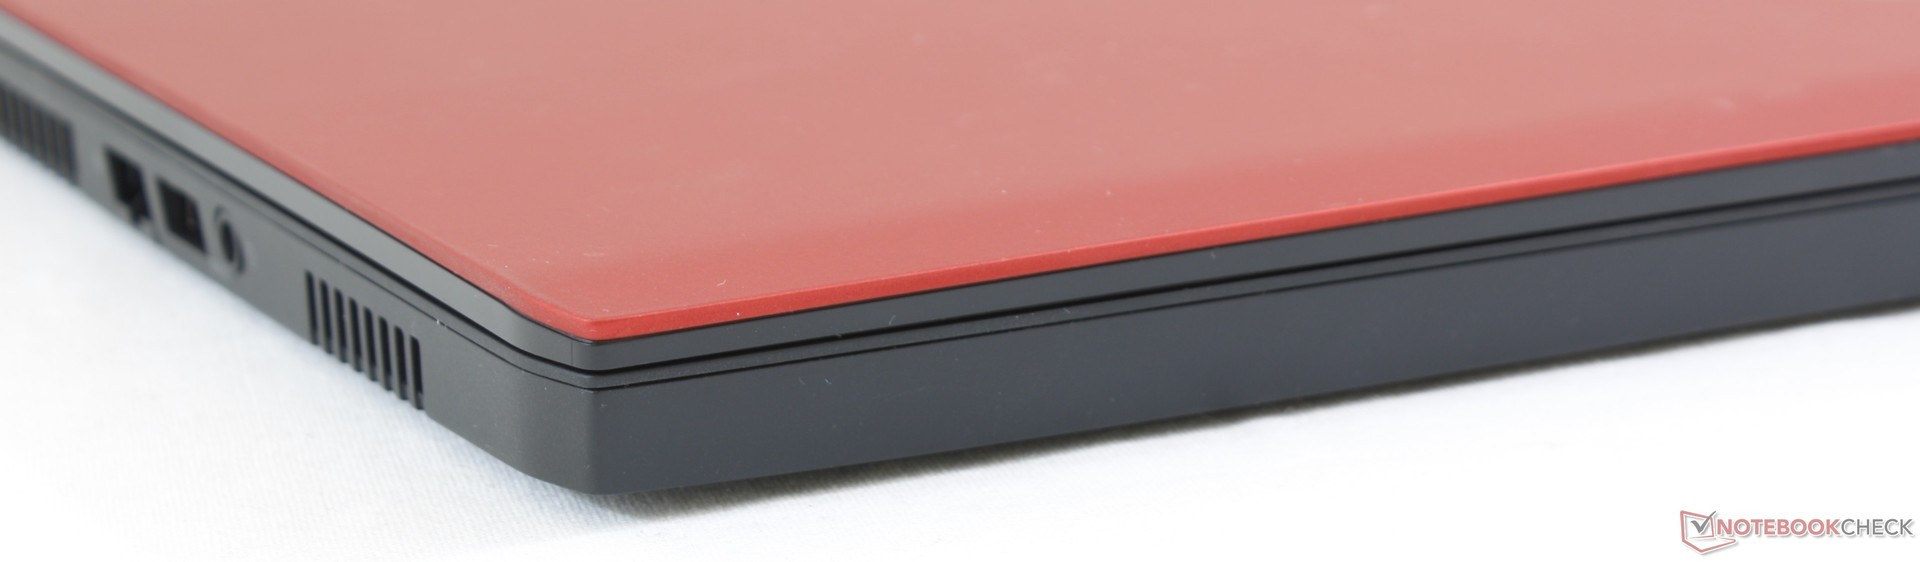
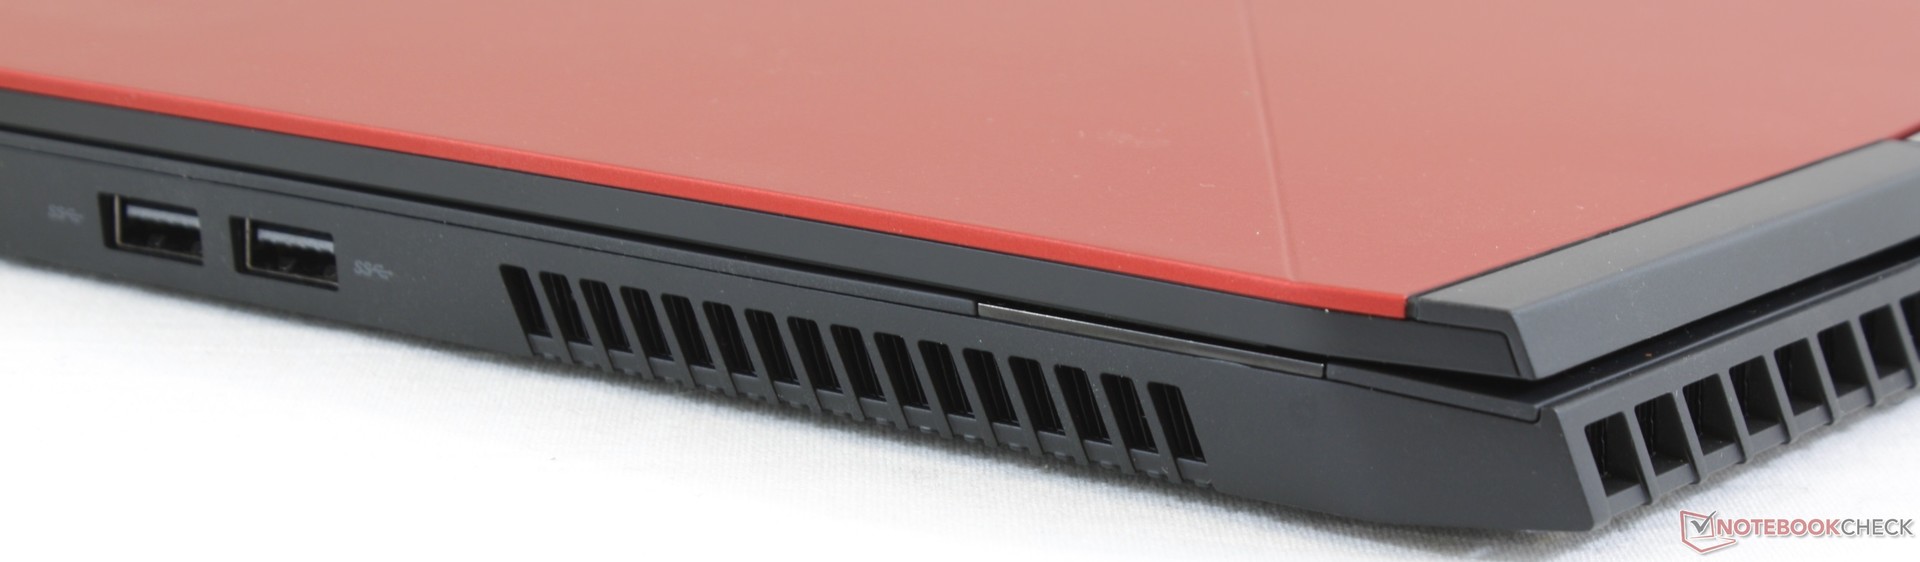
但有一些缺点阻止了m15成为超薄游戏本的佼佼者。除了稍微厚一些的外形,缺乏按键RGB照明之外,按键反馈,点击反馈,风扇噪音和扬声器质量都没有什么特别的。在外观方面,一些用户可能会被有光泽的边框,易于沾染指纹的掌托或难以触及的后接口劝退。尽管如此,任何考虑Alienware 15 R4或超其他超薄游戏本的用户都应该考虑一下Alienware m15,因为它提供了其竞品所没有的一些优势。
“Alienware m15是那些想要超薄设计而又不牺牲机身刚性的游戏玩家的心头好。考虑到其小巧的机身尺寸,其超长睿频时间和长续航在竞争中具有令人意想不到的优势。”
Alienware m15 GTX 1070 Max-Q
- 12/11/2018 v6 (old)
Allen Ngo
Price comparison

