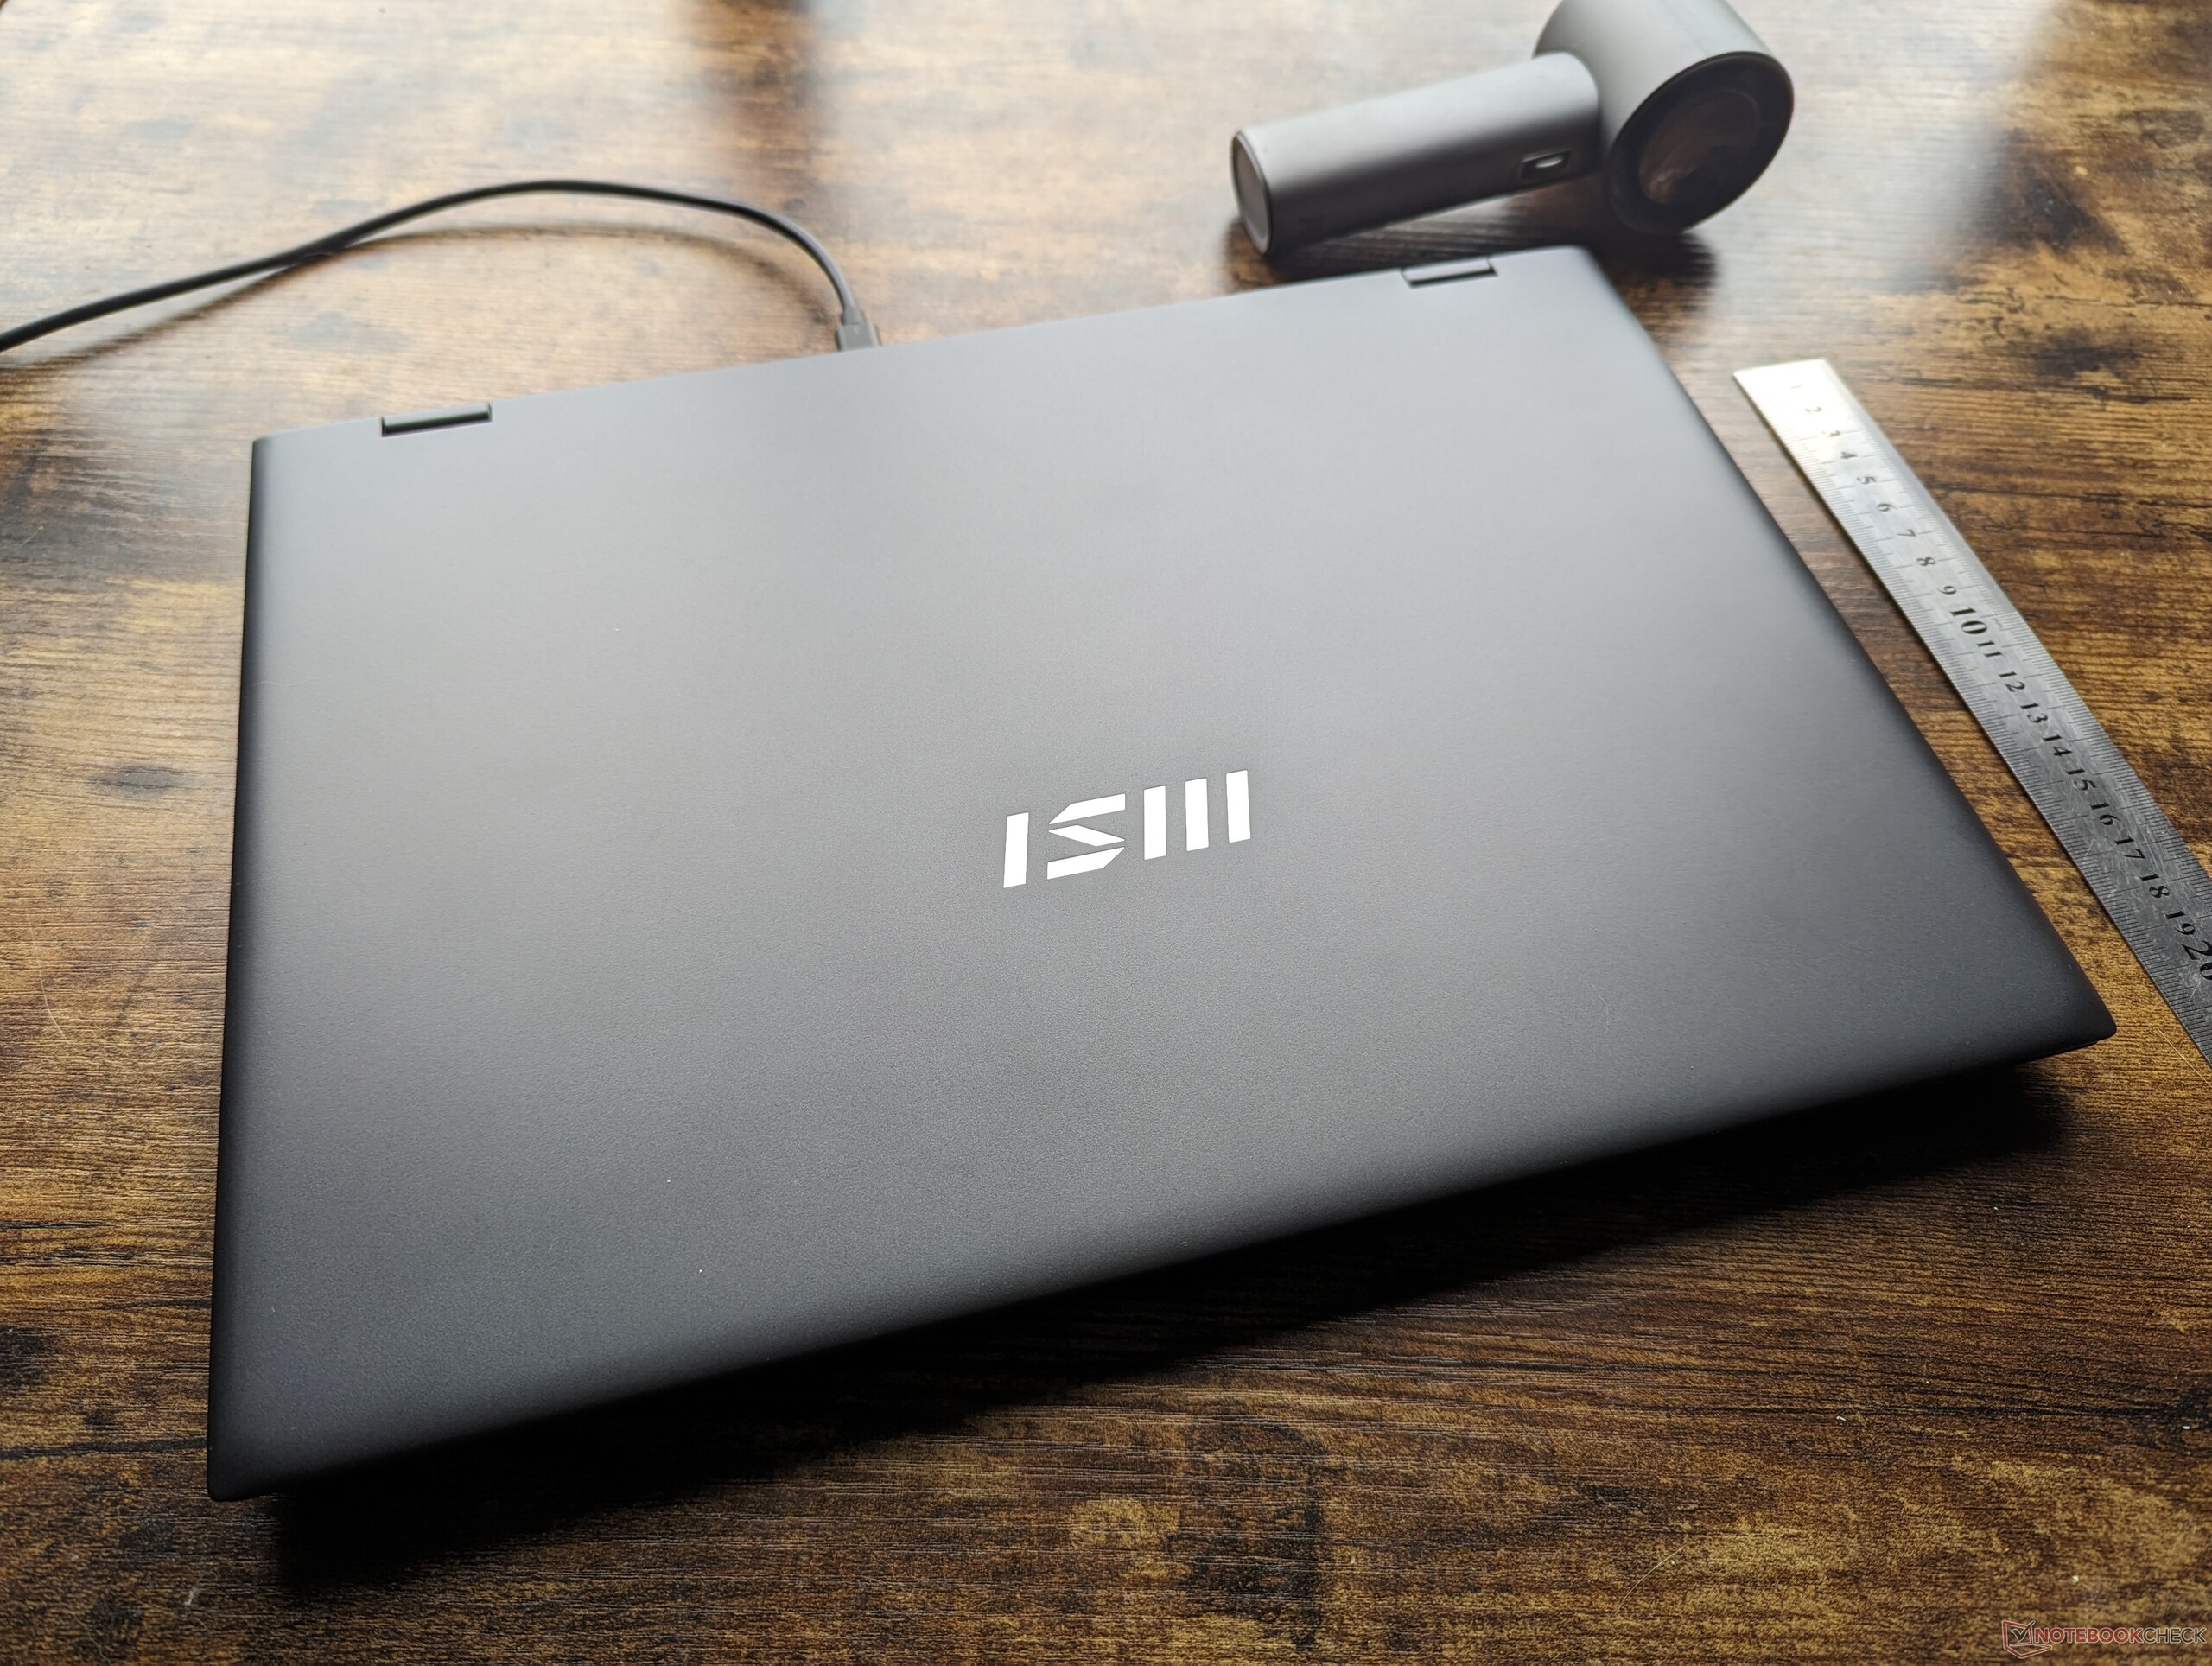
微星 Prestige 16 B1MG 笔记本电脑评测:从酷睿 i7 Xe 到酷睿 Ultra 7 Arc

16 英寸微星 Prestige 16 AI B1MG 是市场上首批搭载第 14 代酷睿 Ultra 流星湖处理器的笔记本电脑之一。它接替了旧款 15.6 英寸 威望 15的继任者,其内部和外部均进行了改进,为用户带来了全新的使用体验。微星 Prestige 系列由介于低端和中端之间的中高端笔记本电脑组成。 现代系列和高端 家族.
我们评测的配置是一款零售价为 1400 美元的产品,配备酷睿至尊 7 155H CPU、集成 Arc 8 图形处理器、1600p IPS 显示屏、32 GB LPDDR5-6400 MHz 内存和 2 TB NVMe 固态硬盘。此外,还提供配备 Core Ultra 9 185H、GeForce RTX 4060 或 4070 显卡、Arc 370M 显卡和 4K (2400p) OLED 的高端 SKU。
Prestige 16 的竞争对手包括其他轻薄型多媒体或内容创作笔记本电脑,如 戴尔 XPS 系列, 华硕 VivoBook Pro 16,LG Gram 16 2-in-1或 联想 Yoga Pro 9i 16.
更多微星评论:
潜在的竞争对手比较
Rating | Date | Model | Weight | Height | Size | Resolution | Price |
|---|---|---|---|---|---|---|---|
| 88.1 % v7 (old) | 12 / 2023 | MSI Prestige 16 B1MG-001US Ultra 7 155H, Arc 8-Core | 1.6 kg | 19.1 mm | 16.00" | 2560x1600 | |
| 85.4 % v7 (old) | 12 / 2022 | MSI Prestige 15 A12UD-093 i7-1280P, GeForce RTX 3050 Ti Laptop GPU | 1.8 kg | 20.1 mm | 15.60" | 3840x2160 | |
| 85.8 % v7 (old) | 11 / 2023 | LG Gram 2in1 16 16T90R - G.AA78G i7-1360P, Iris Xe G7 96EUs | 1.5 kg | 17.2 mm | 16.00" | 2560x1600 | |
| 85.7 % v7 (old) | 11 / 2023 | Lenovo ThinkBook 16 G6 ABP R5 7530U, Vega 7 | 1.8 kg | 17.5 mm | 16.00" | 1920x1200 | |
| 87.6 % v7 (old) | 11 / 2023 | Asus VivoBook Pro 16 K6602VU i9-13900H, GeForce RTX 4050 Laptop GPU | 1.9 kg | 19 mm | 16.00" | 3200x2000 | |
| 87.1 % v7 (old) | 08 / 2023 | Dell Inspiron 16 Plus 7630 i7-13700H, GeForce RTX 4060 Laptop GPU | 2.2 kg | 19.95 mm | 16.00" | 2560x1600 |
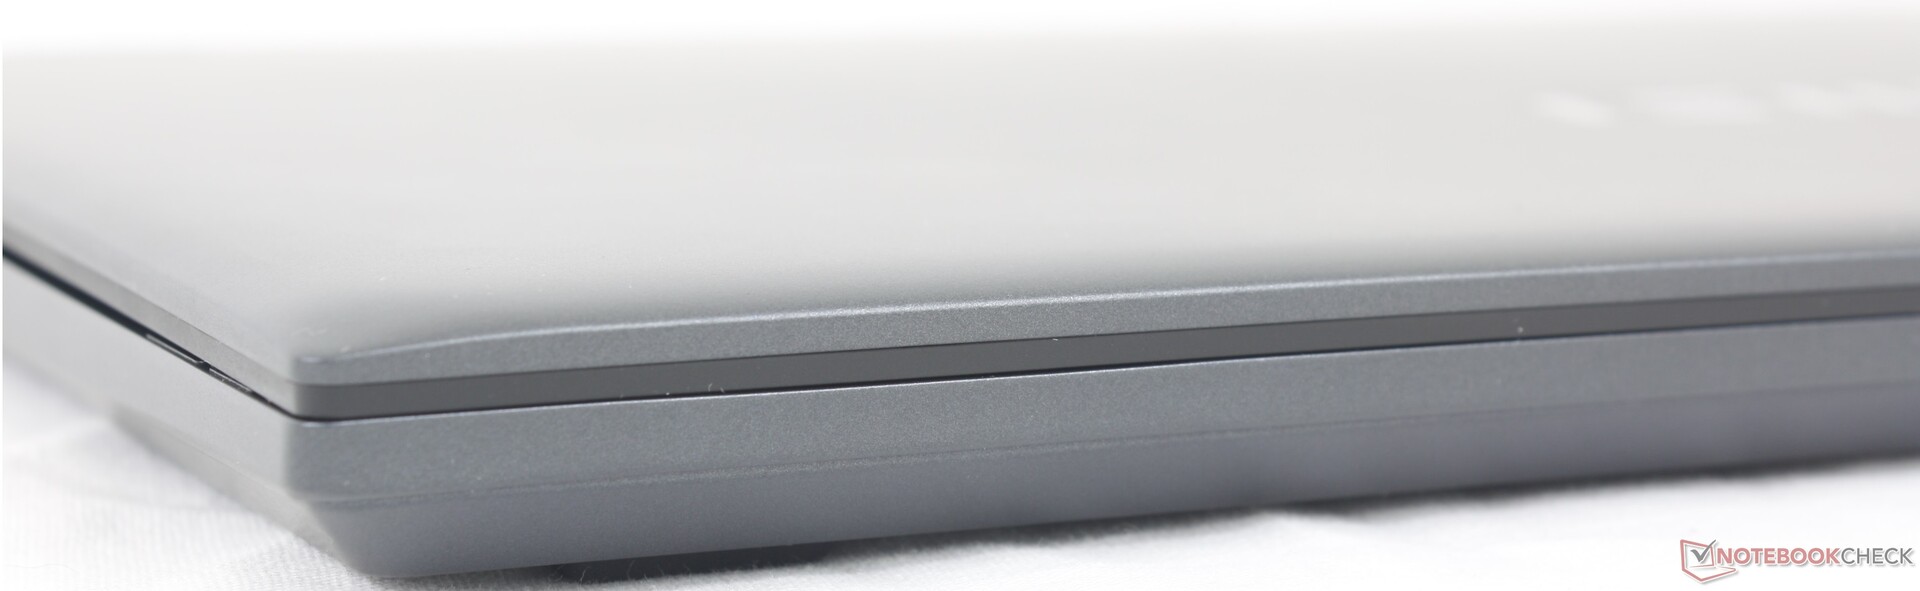
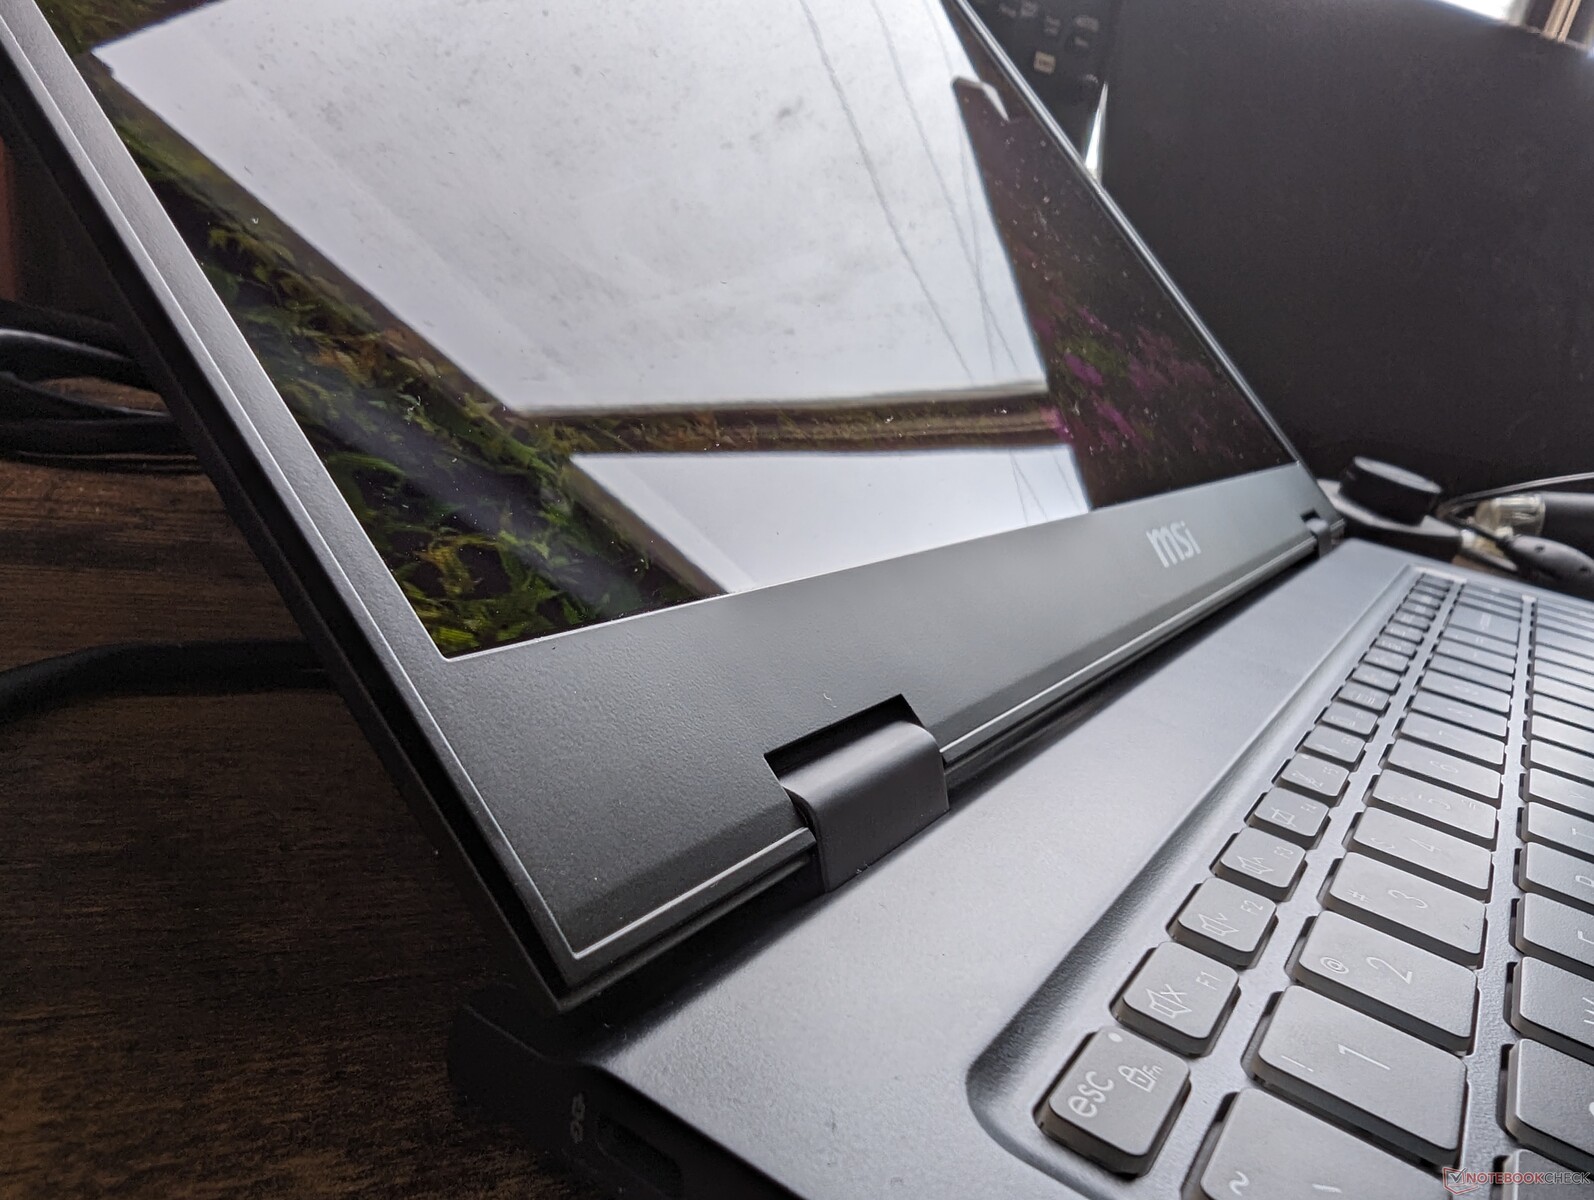
外壳 - 薄外观,薄材料
金属机身比价格较低的微星Modern或华硕VivoBook系列更加坚固。例如,对键盘中心施加压力,表面几乎不会变形。相对来说,键盘盖更容易扭曲和损坏,尤其是因为它没有大猩猩玻璃加固。如果对外盖中心施加压力,其表面的翘曲程度将超出我们的预期。在这种情况下,惠普 Spectre 或 Razer Blade 等替代产品虽然更重,但却更坚固。
16:10 的长宽比使得 Prestige 16 的占地面积比 Prestige 15 更大。不过,它以更薄的外形和更轻的重量弥补了这一差距。事实上,Prestige 16 是最轻的 16 英寸多媒体笔记本电脑之一,可与 LG Gram 16 2 合 1.不过,我们预计配备独立显卡的型号会更重一些。
连接性 - 准备使用 Wi-Fi 7
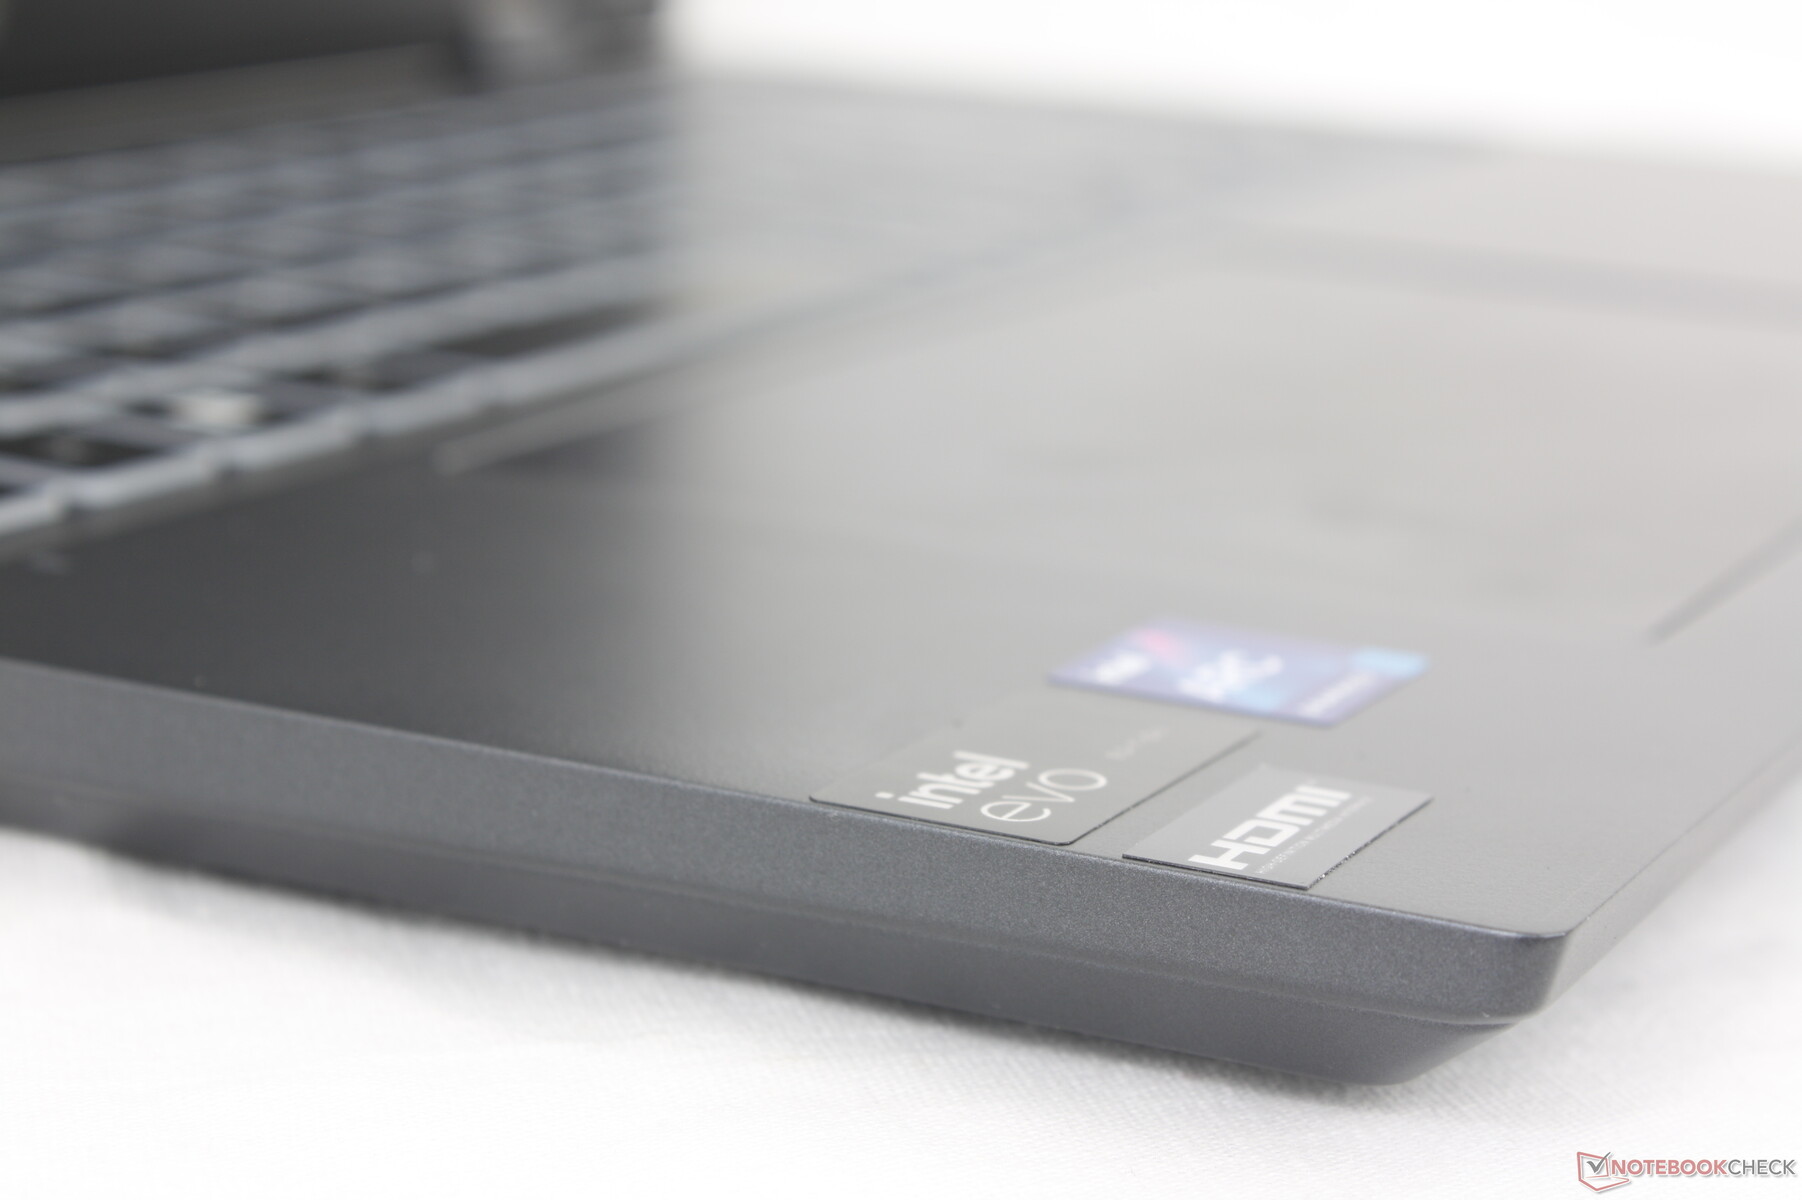
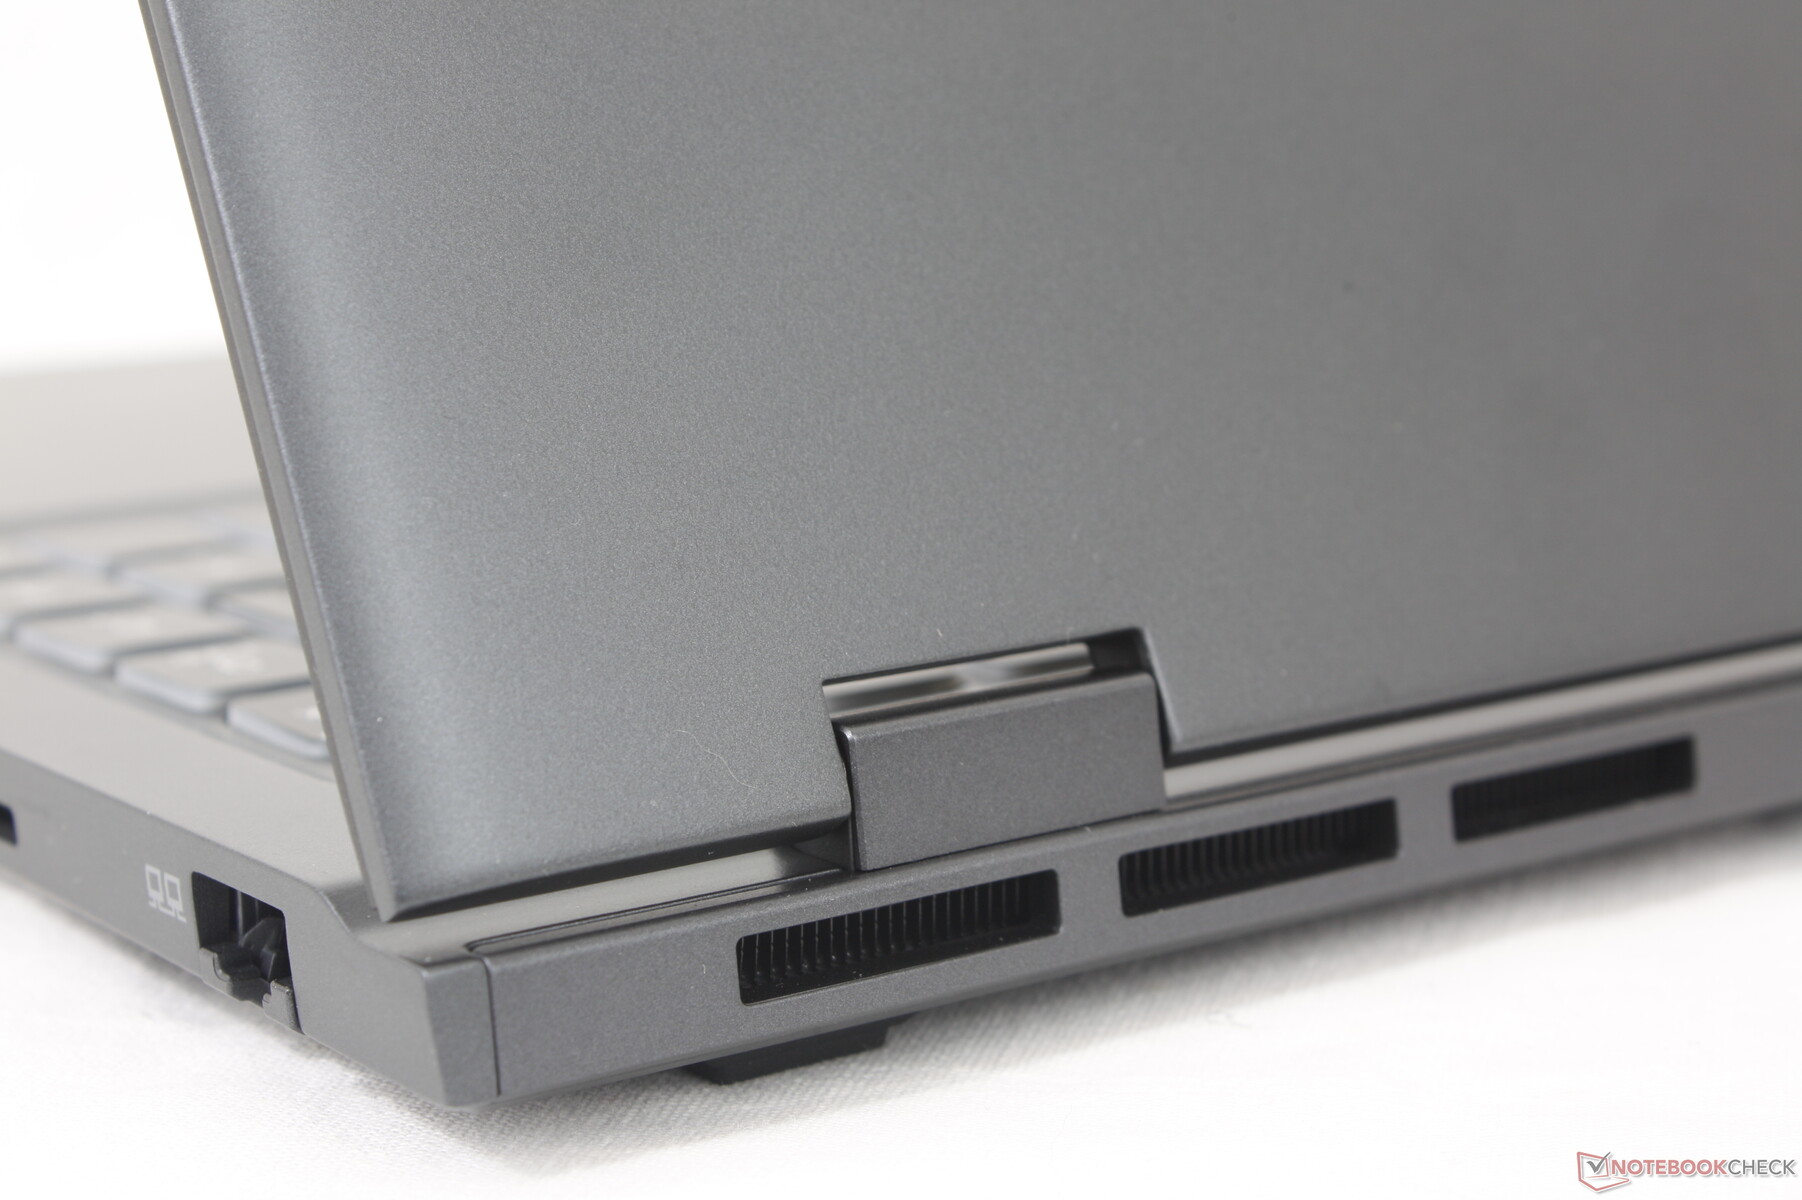
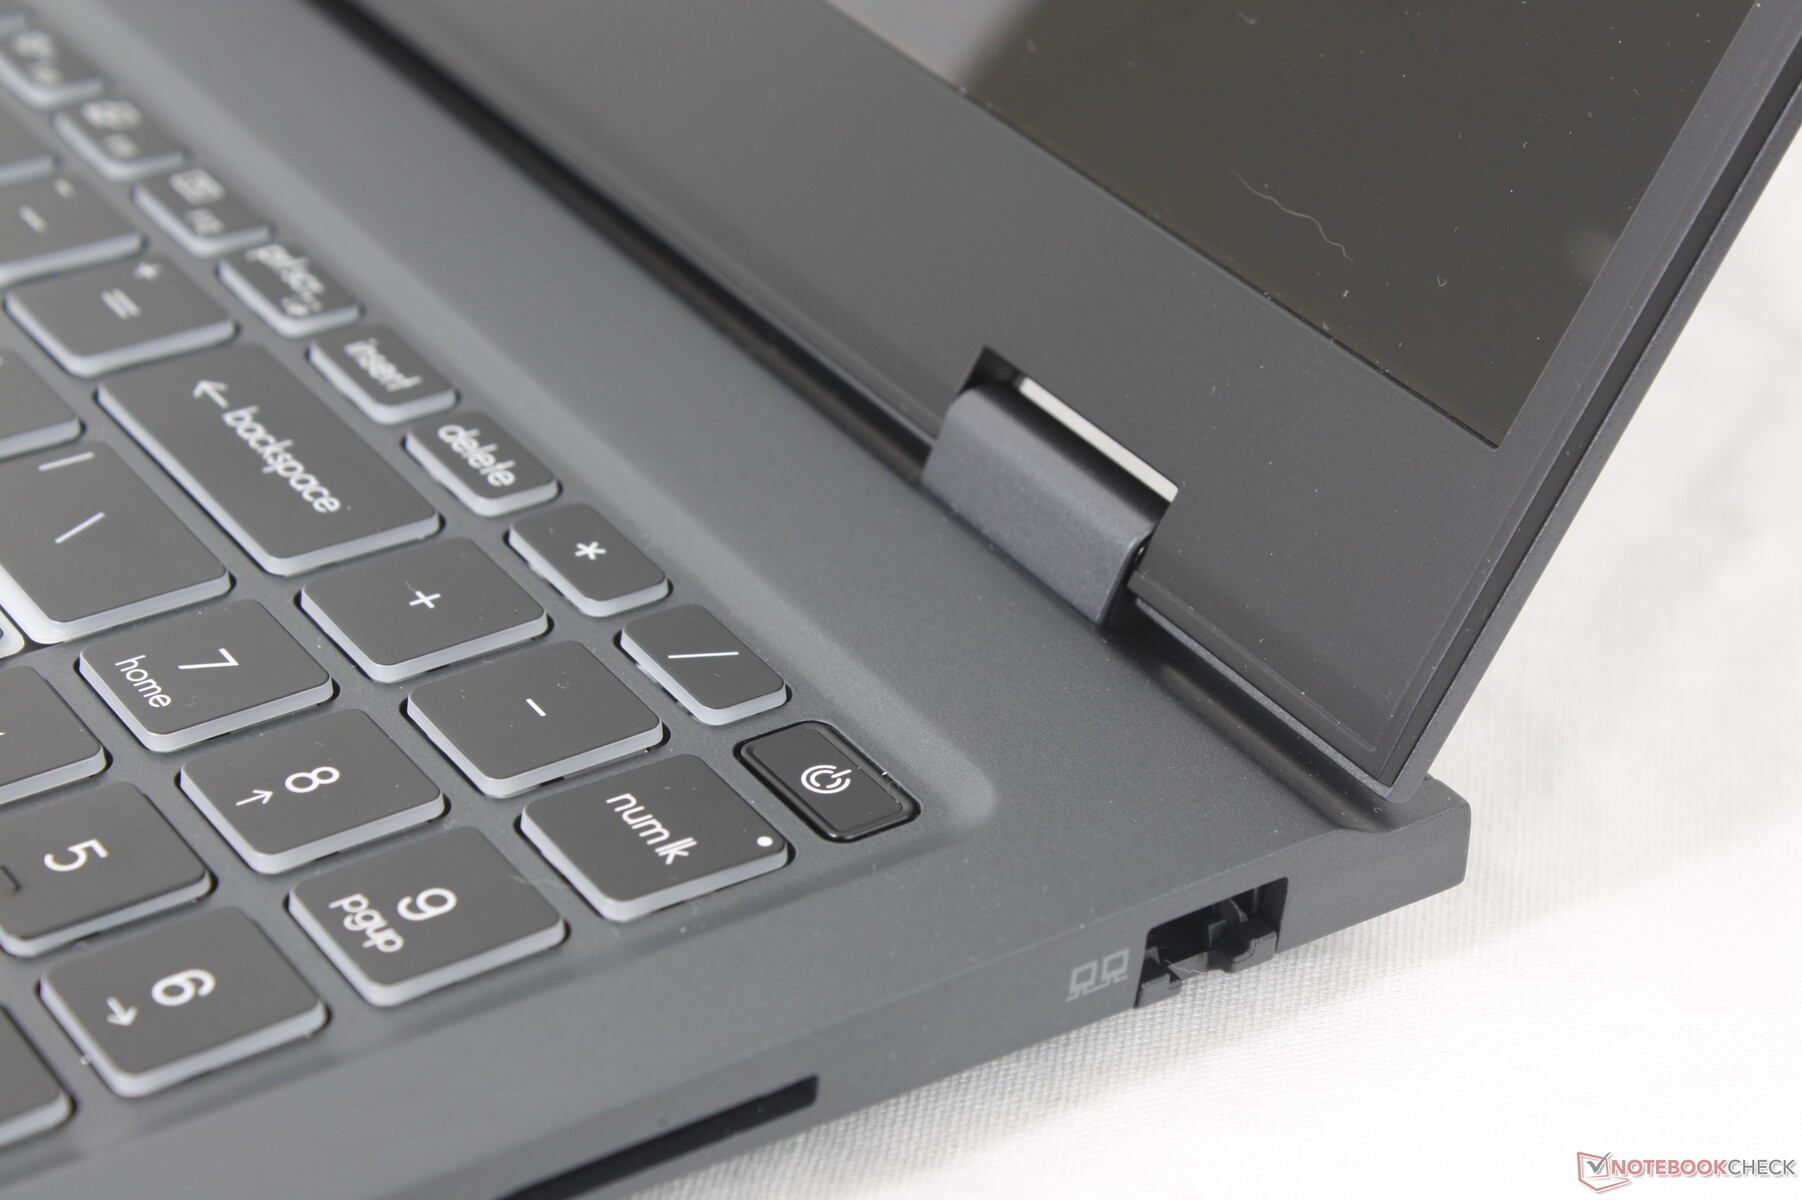
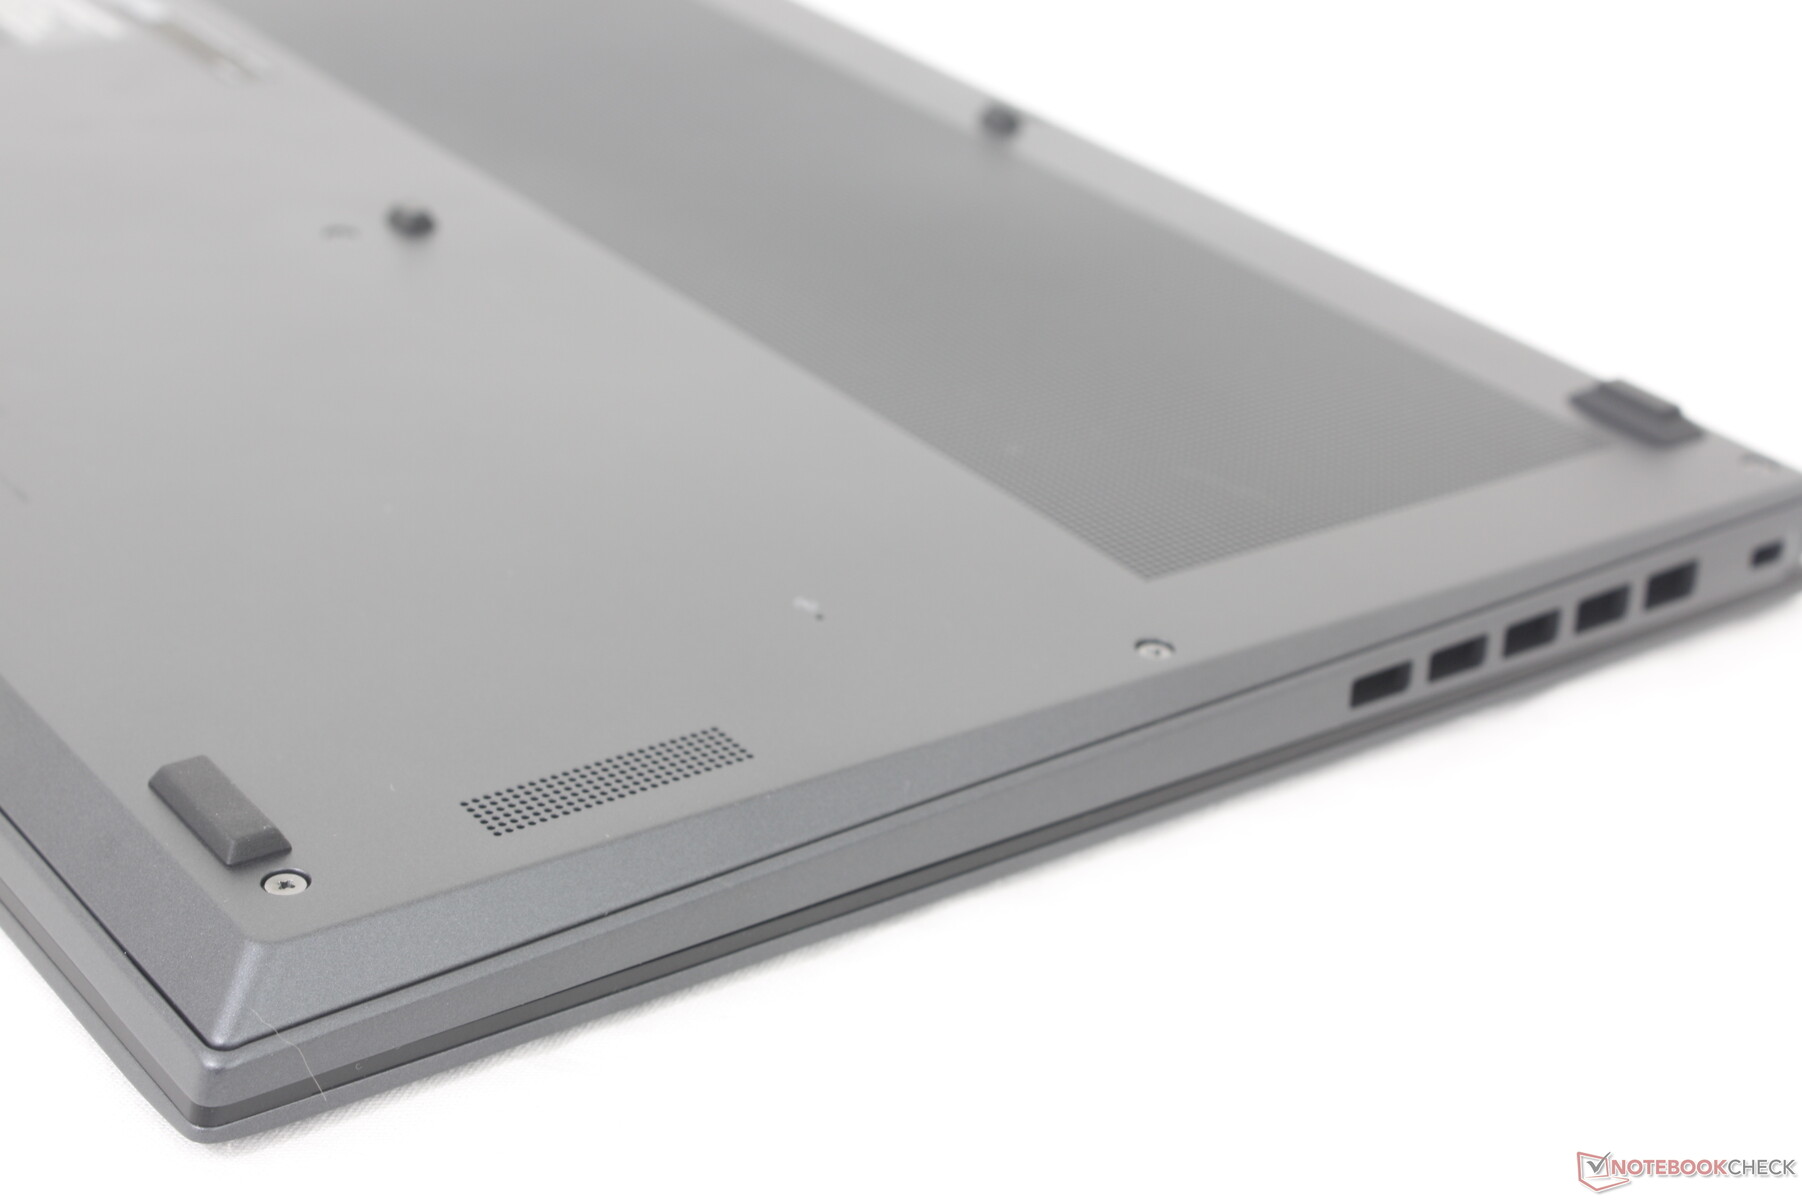
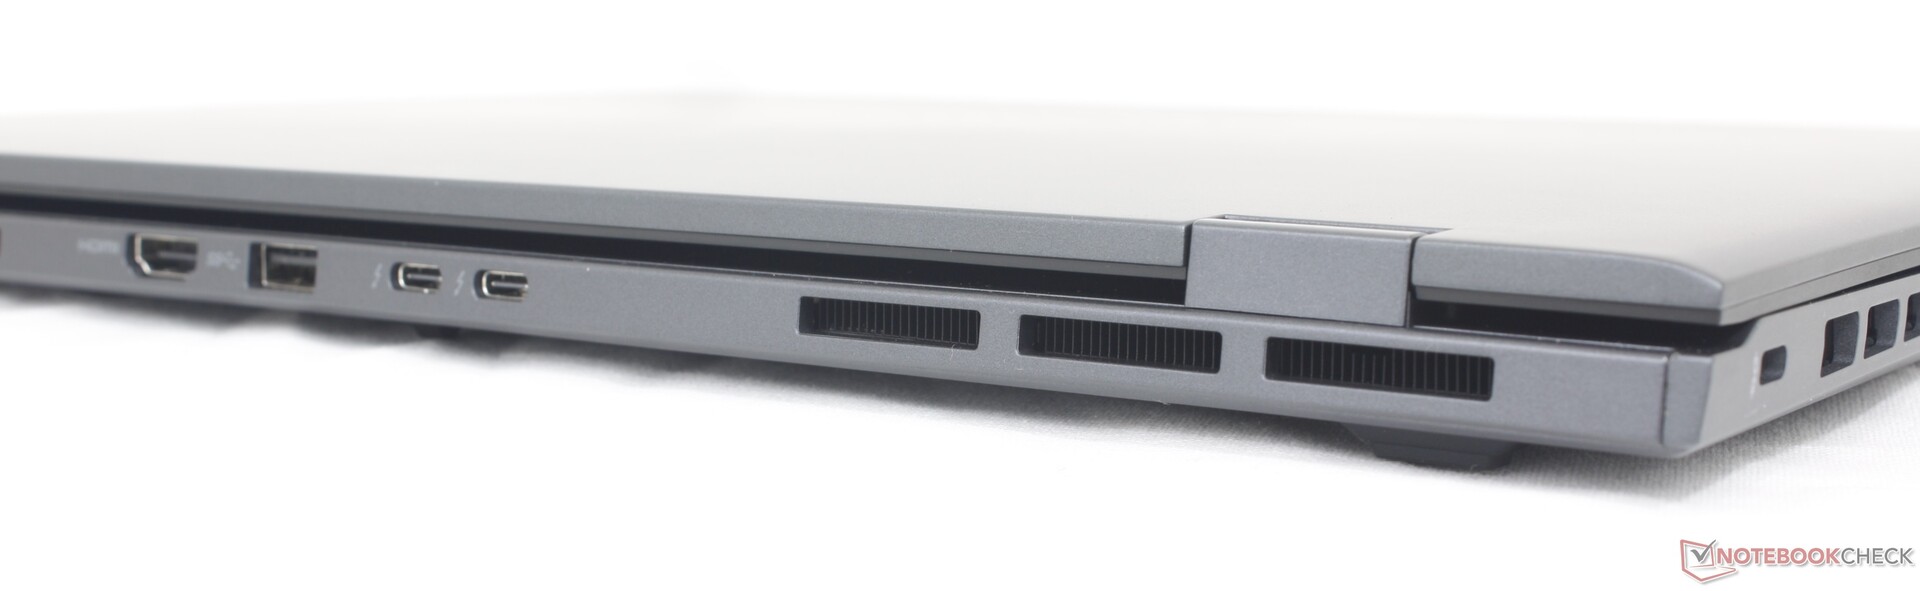
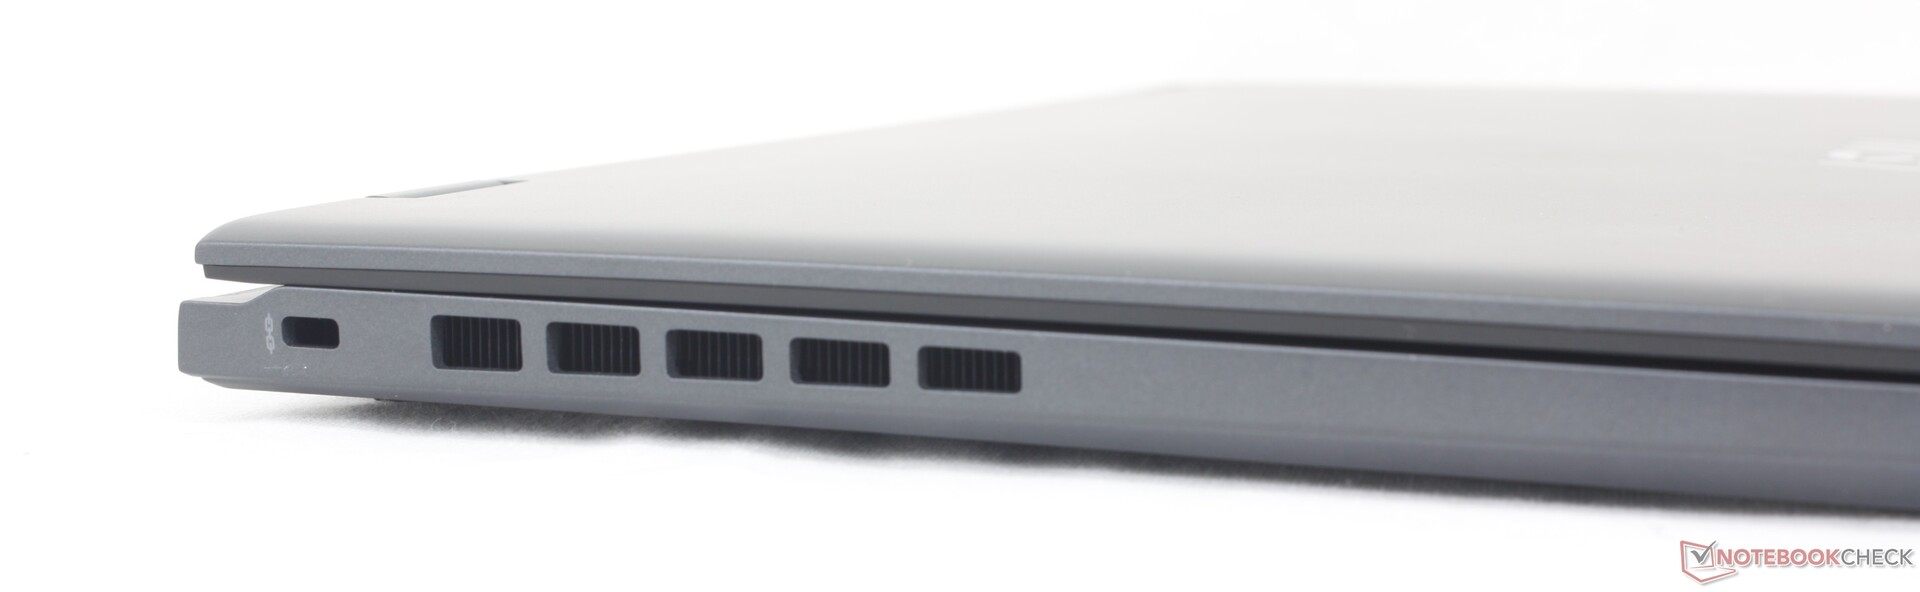
与其他大多数超极本不同的是,Prestige 16 的端口都集中在机身后部,而不是侧面。这种设计方法使侧面的通风效果更好,但代价是端口的可及性较差。HDMI、USB-C 甚至 USB-A 等常用端口都集中在后部,这对于大多数用户来说可能并不理想。
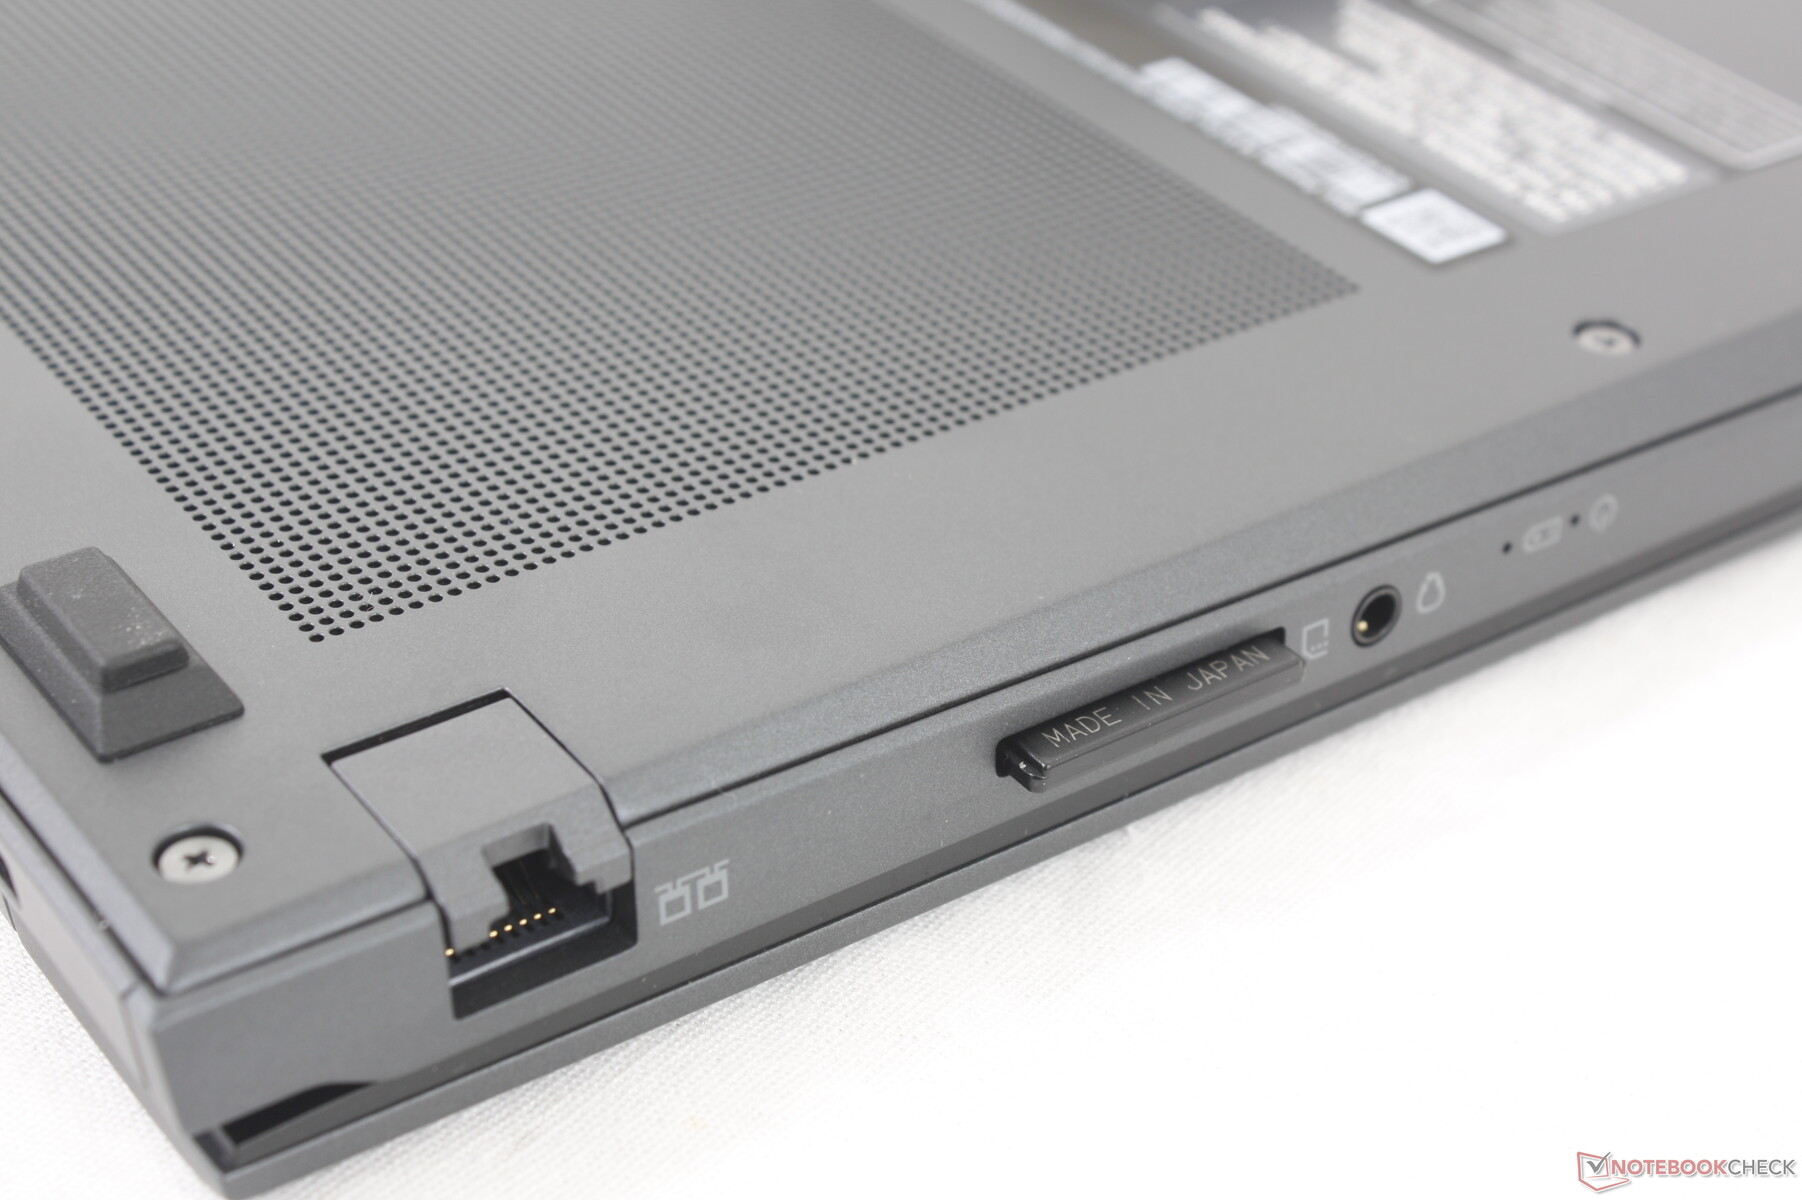
与 Prestige 15 相比,Prestige 16 将一个 USB-A 端口换成了 RJ-45 端口。对于仅配备集成显卡的产品,两个 Thunderbolt 4 端口保持不变。如果配置独立显卡,两个 USB-C 端口中只有一个兼容 Thunderbolt。

SD 读卡器
集成的 SD 读卡器经过升级,速度更快。从我们的 UHS-II 测试卡传输 1 GB 的照片到桌面仅需不到 6 秒,而 Prestige 15 则需要 12 秒以上。
| SD Card Reader | |
| average JPG Copy Test (av. of 3 runs) | |
| MSI Prestige 16 B1MG-001US (Toshiba Exceria Pro SDXC 64 GB UHS-II) | |
| Asus VivoBook Pro 16 K6602VU (Angelbird AV Pro V60) | |
| Lenovo ThinkBook 16 G6 ABP (Angelbird AV Pro V60) | |
| MSI Prestige 15 A12UD-093 (AV Pro SD microSD 128 GB V60) | |
| LG Gram 2in1 16 16T90R - G.AA78G | |
| Dell Inspiron 16 Plus 7630 (AV Pro SD microSD 128 GB V60) | |
| maximum AS SSD Seq Read Test (1GB) | |
| Asus VivoBook Pro 16 K6602VU (Angelbird AV Pro V60) | |
| MSI Prestige 16 B1MG-001US (Toshiba Exceria Pro SDXC 64 GB UHS-II) | |
| Lenovo ThinkBook 16 G6 ABP (Angelbird AV Pro V60) | |
| MSI Prestige 15 A12UD-093 (AV Pro SD microSD 128 GB V60) | |
| Dell Inspiron 16 Plus 7630 (AV Pro SD microSD 128 GB V60) | |
| LG Gram 2in1 16 16T90R - G.AA78G | |
交流
Prestige 16 是首批配备 Killer BE1750W WLAN 模块的笔记本电脑之一,兼容 Wi-Fi 7。不过,Wi-Fi 7 路由器尚未广泛普及,因此目前加入 Wi-Fi 7 更多的是为了面向未来,而不是带来任何直接的好处。不过,在与 Wi-Fi 6E 测试路由器配对时,我们没有遇到任何连接问题。
网络摄像头
标配 200 万像素网络摄像头,带红外和物理隐私快门。替代产品如 惠普 Spectre等产品已经开始配备分辨率更高的 500 万像素传感器。


维护
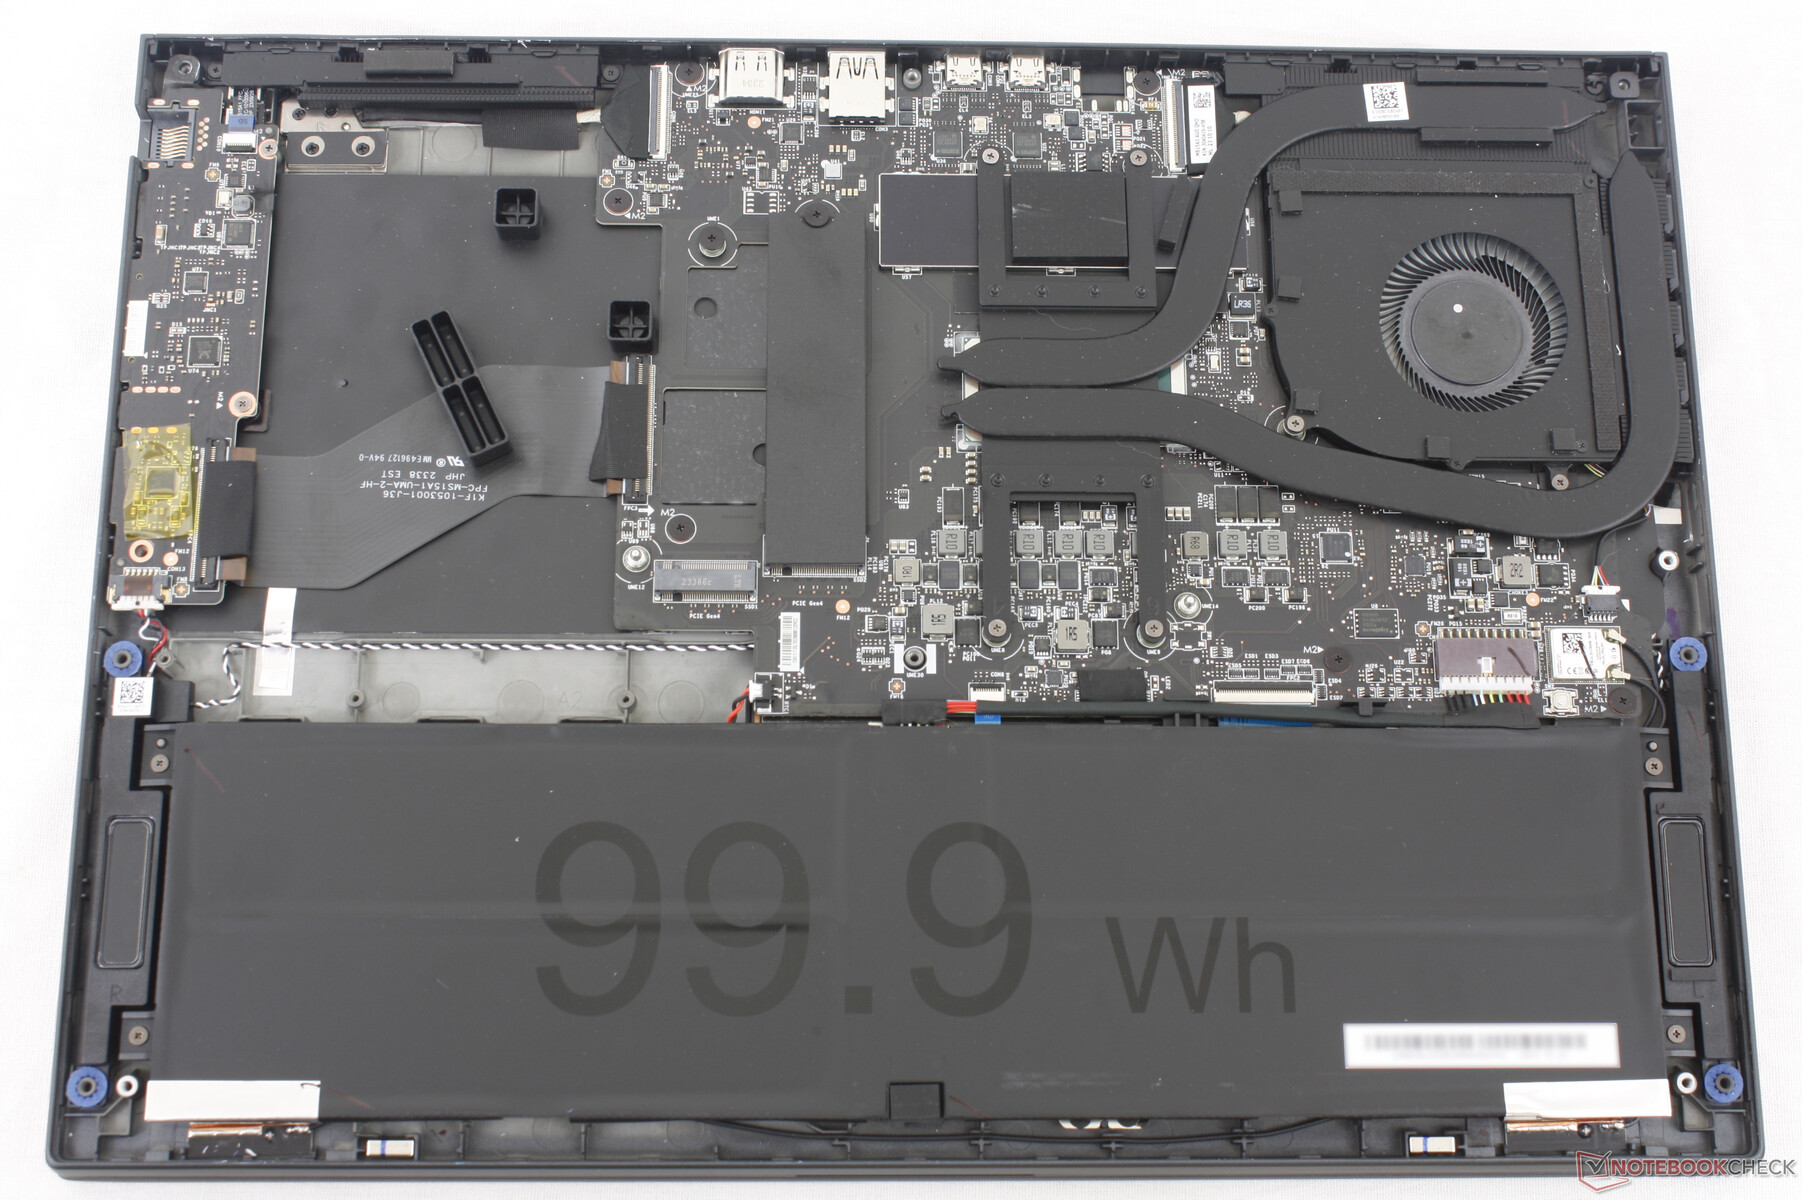
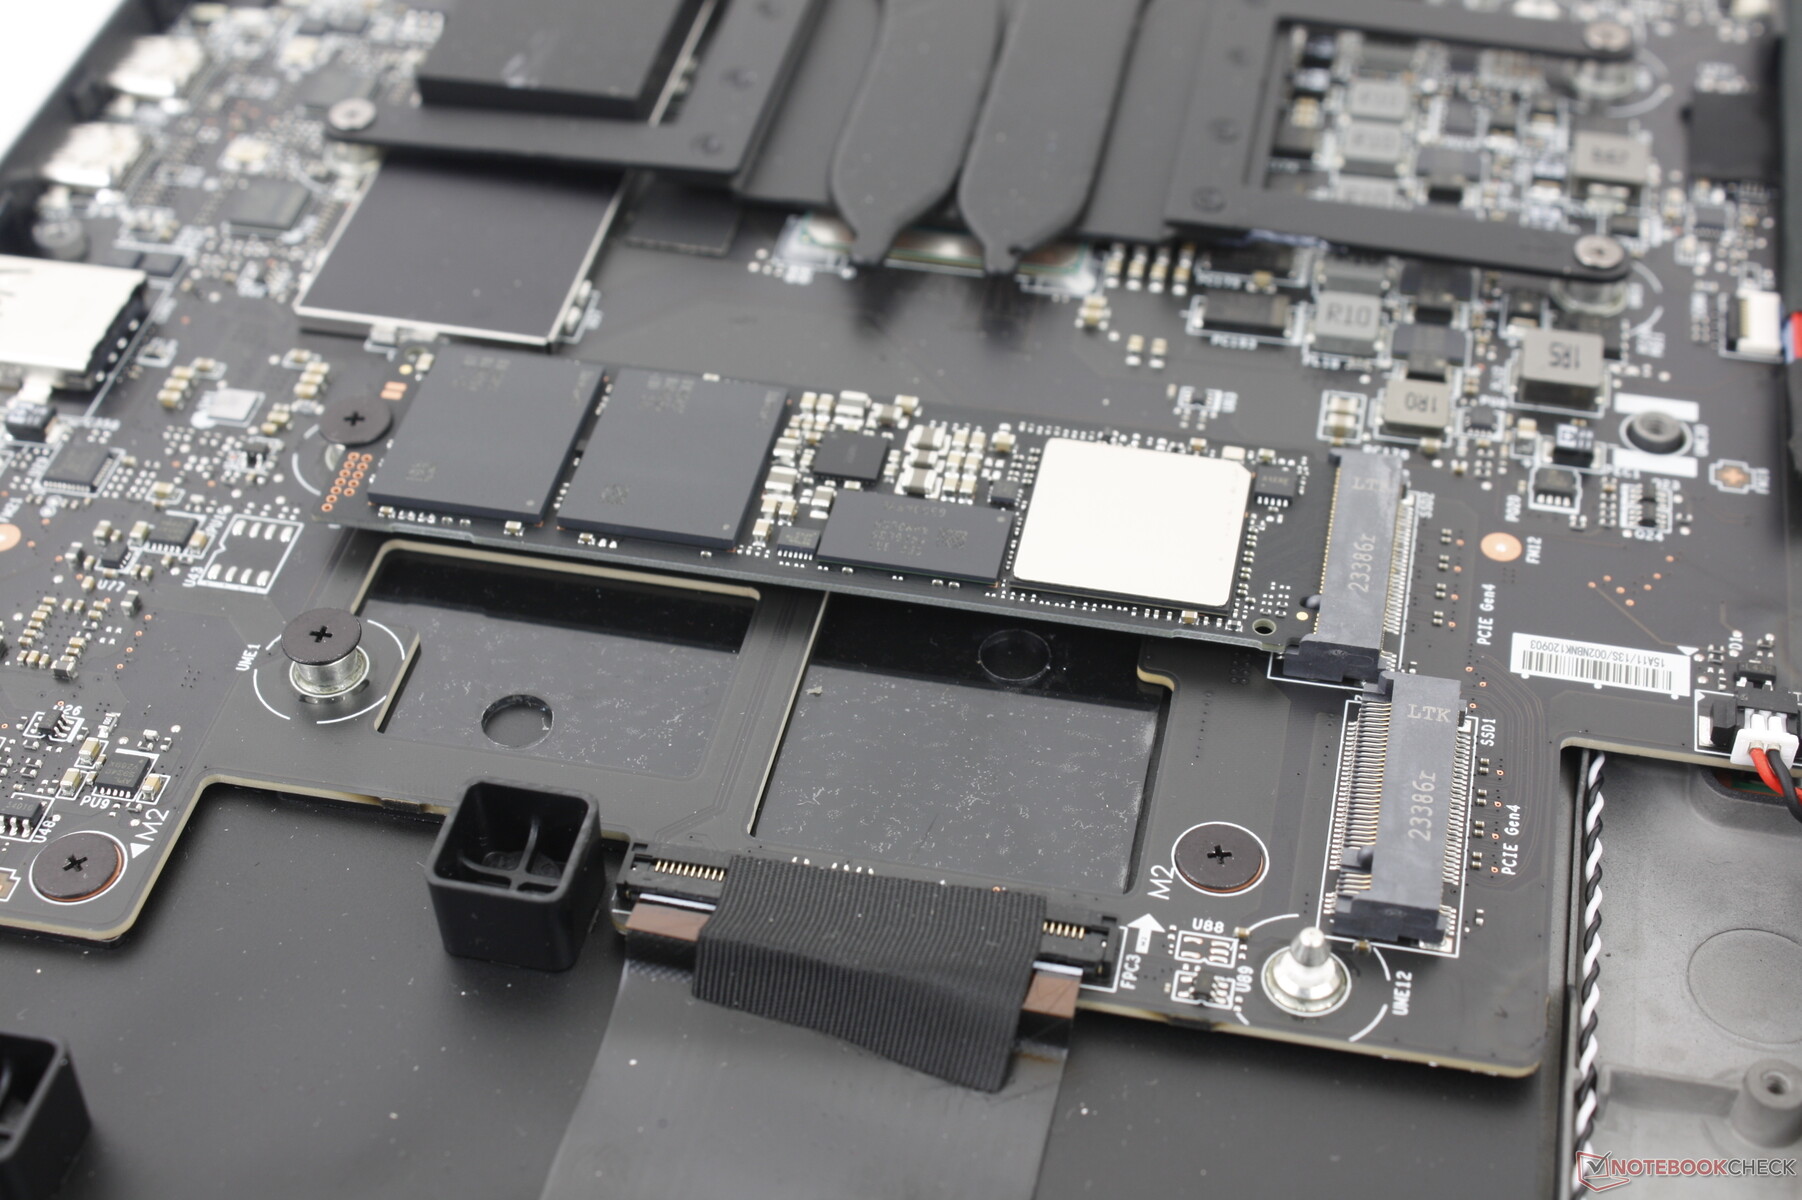
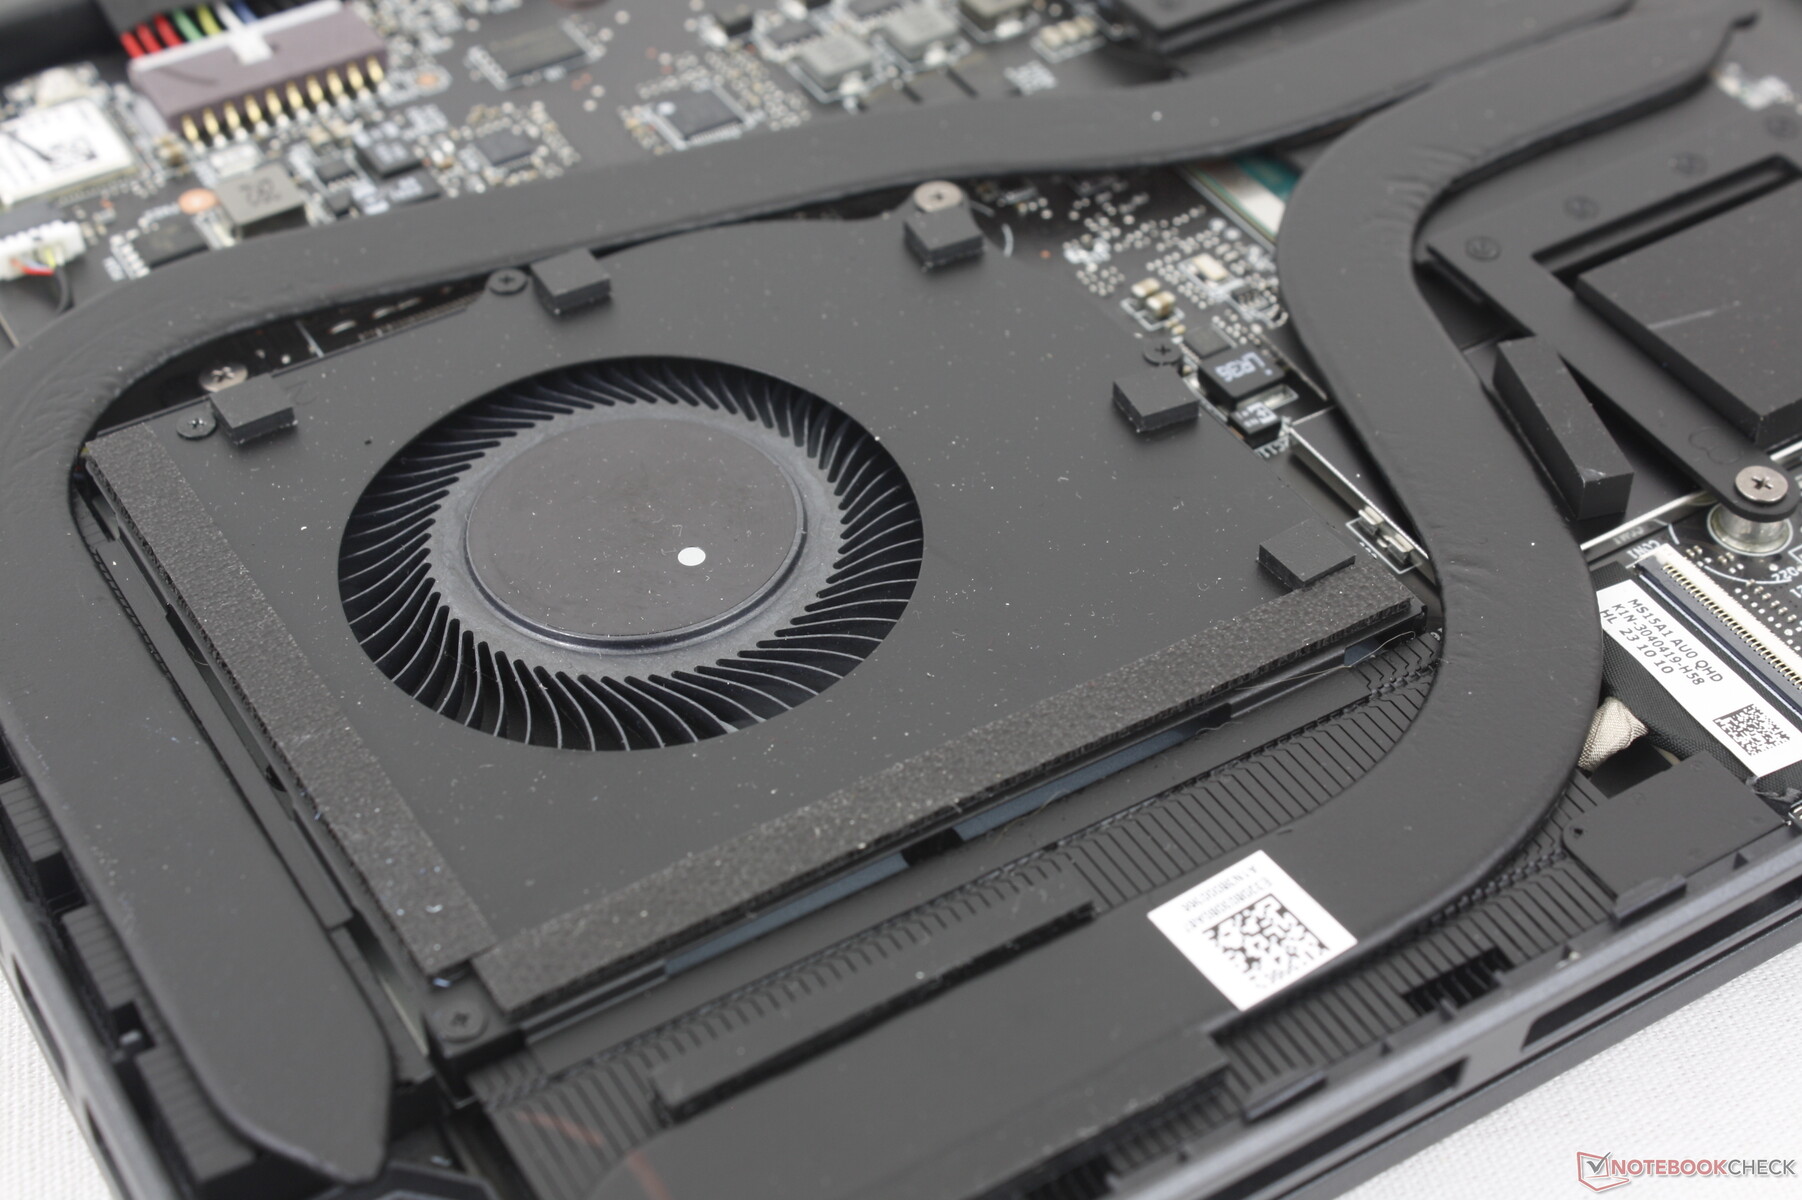
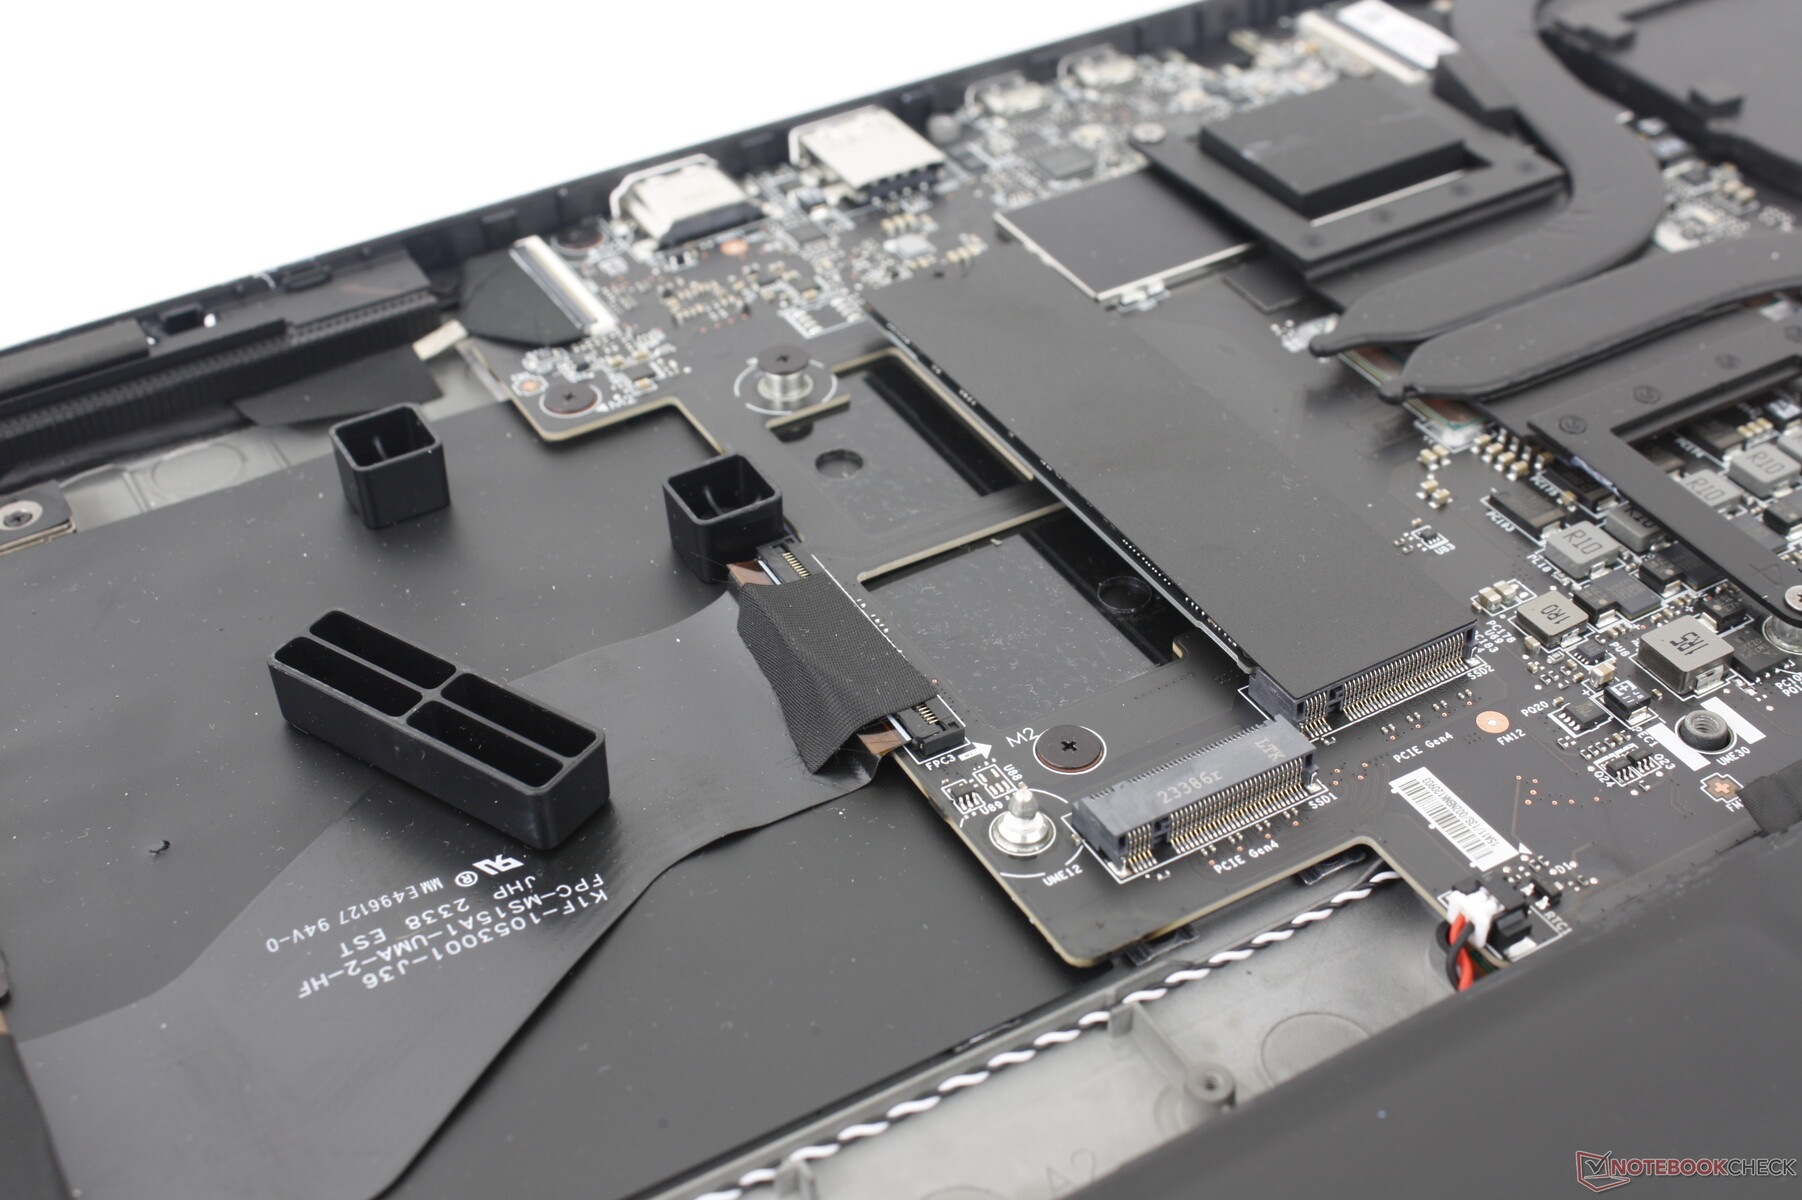
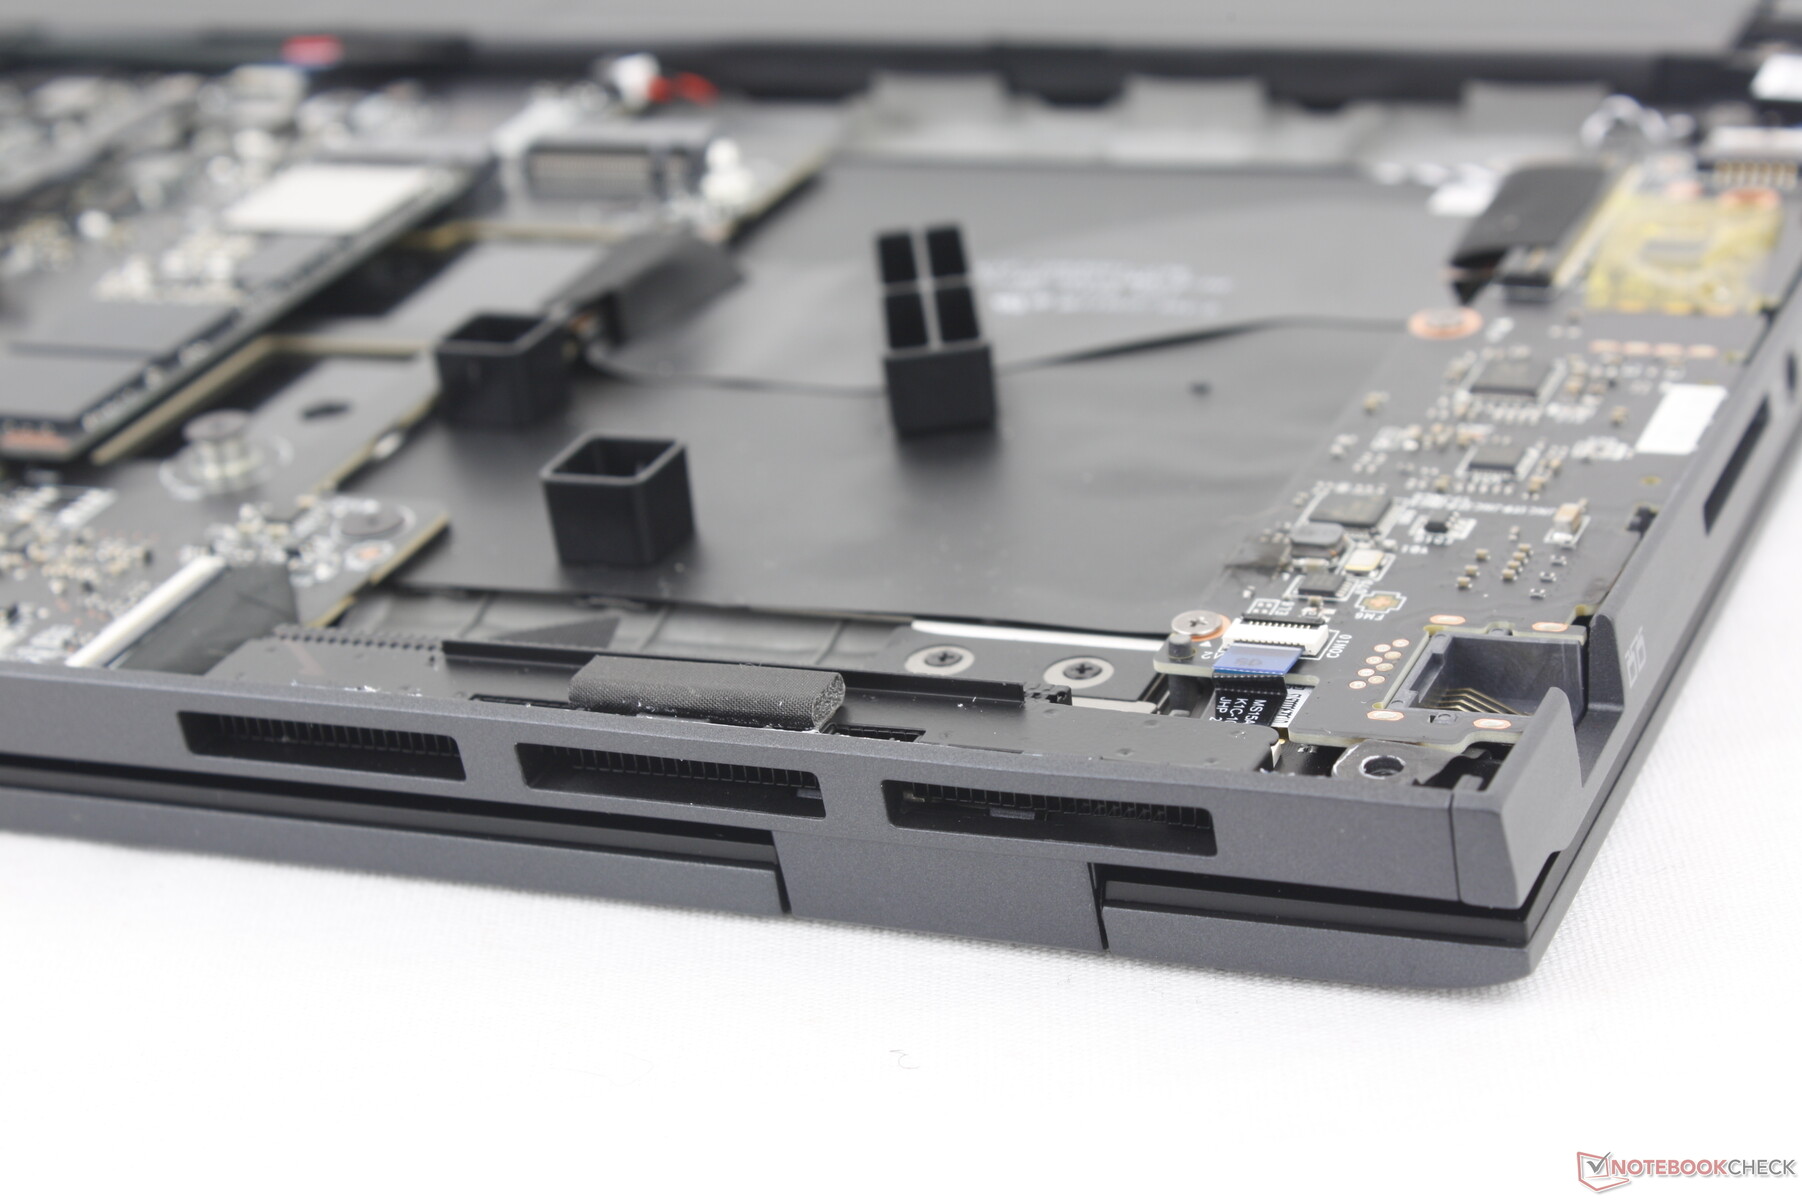
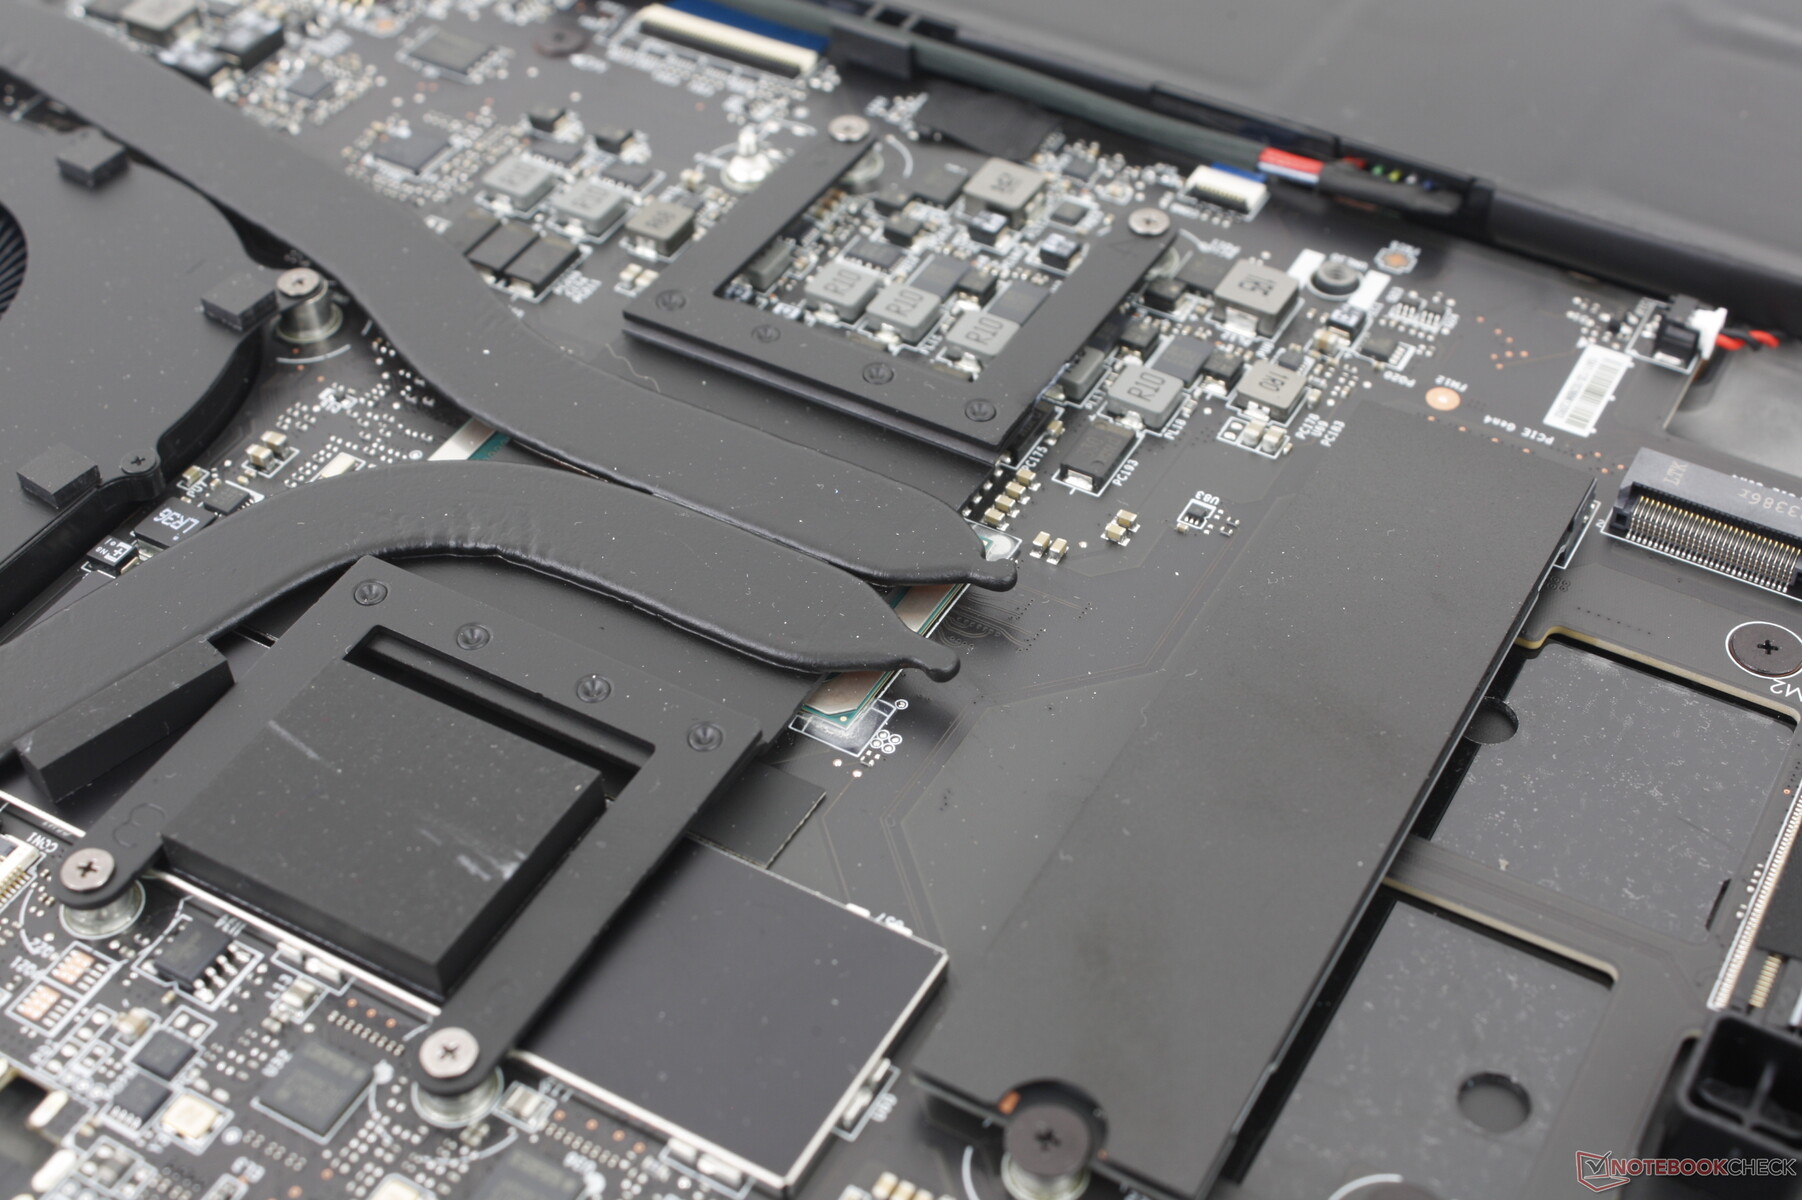
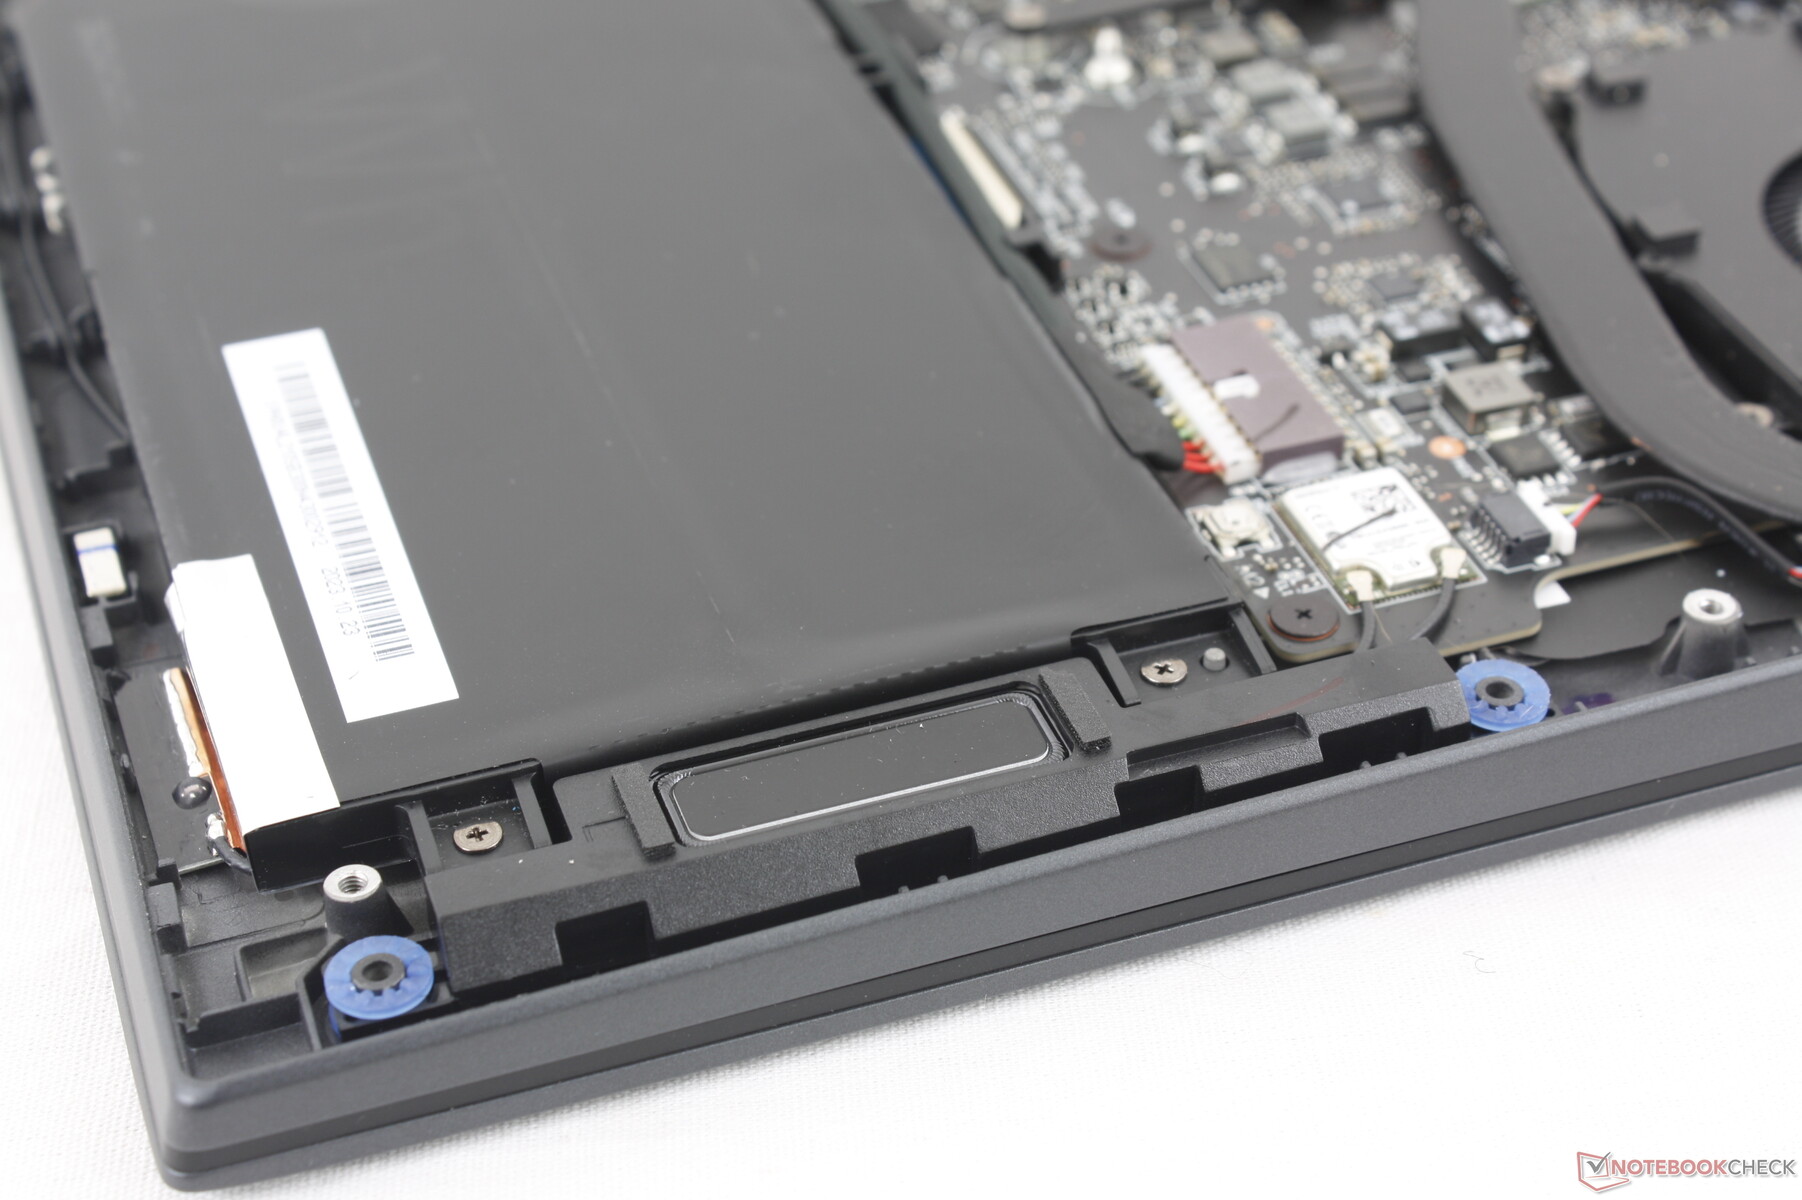
卸下八颗十字螺丝后,底部面板很容易就会弹开。请注意 工厂密封贴纸必须撕开才能进入内部。
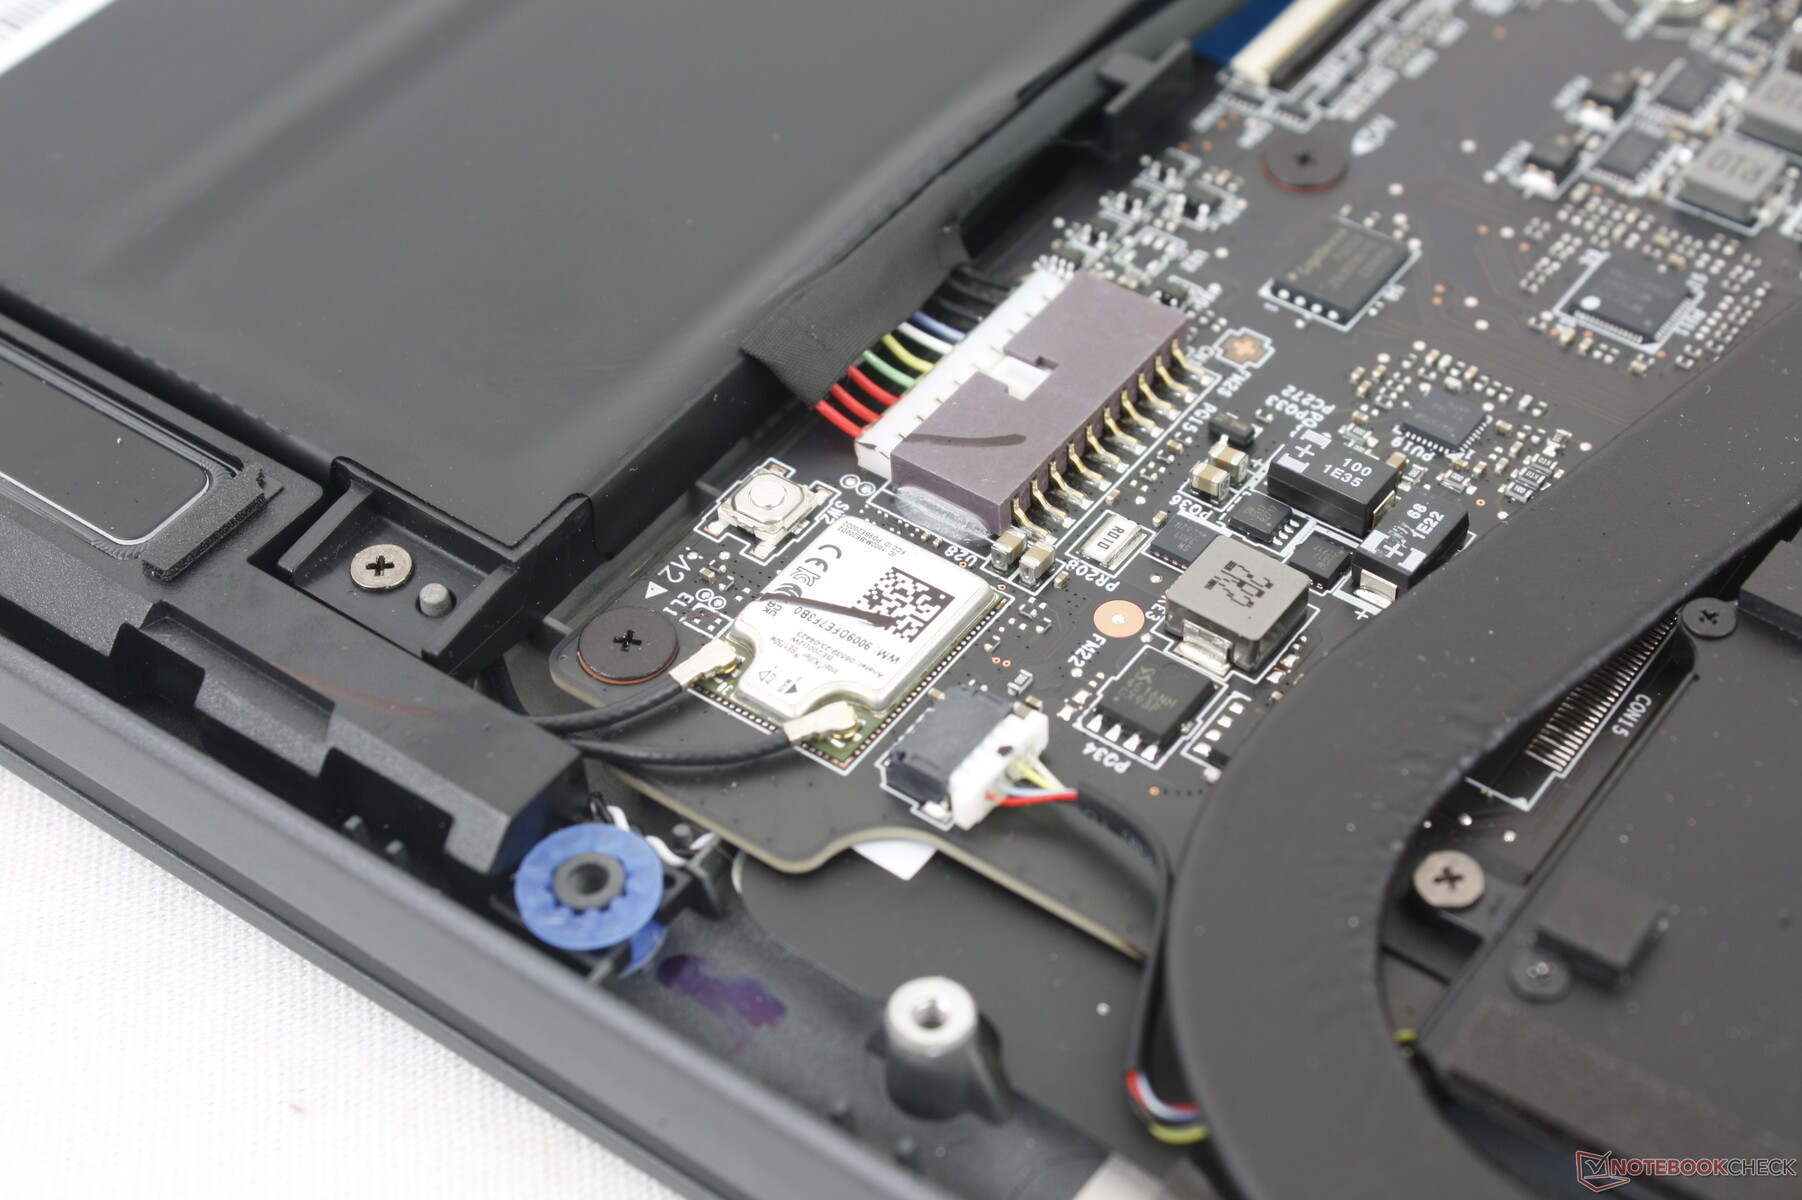
进入内部后,用户可以使用两个 M.2 2280 PCIe4 x4 NVMe 固态硬盘插槽,而内存和 WLAN 模块都是焊接的。相比之下,老款 Prestige 15 的所有这些模块都是可拆卸的。
请注意为配备独立显卡的 SKU 预留的大片空白。如果配置专用 GPU,该机型会配备更多的热管、额外的风扇和重新排列的 M.2 SSD。
配件和保修
包装盒内除了交流适配器和文件外,没有任何其他附件。如果在美国购买,通常适用一年有限保修。
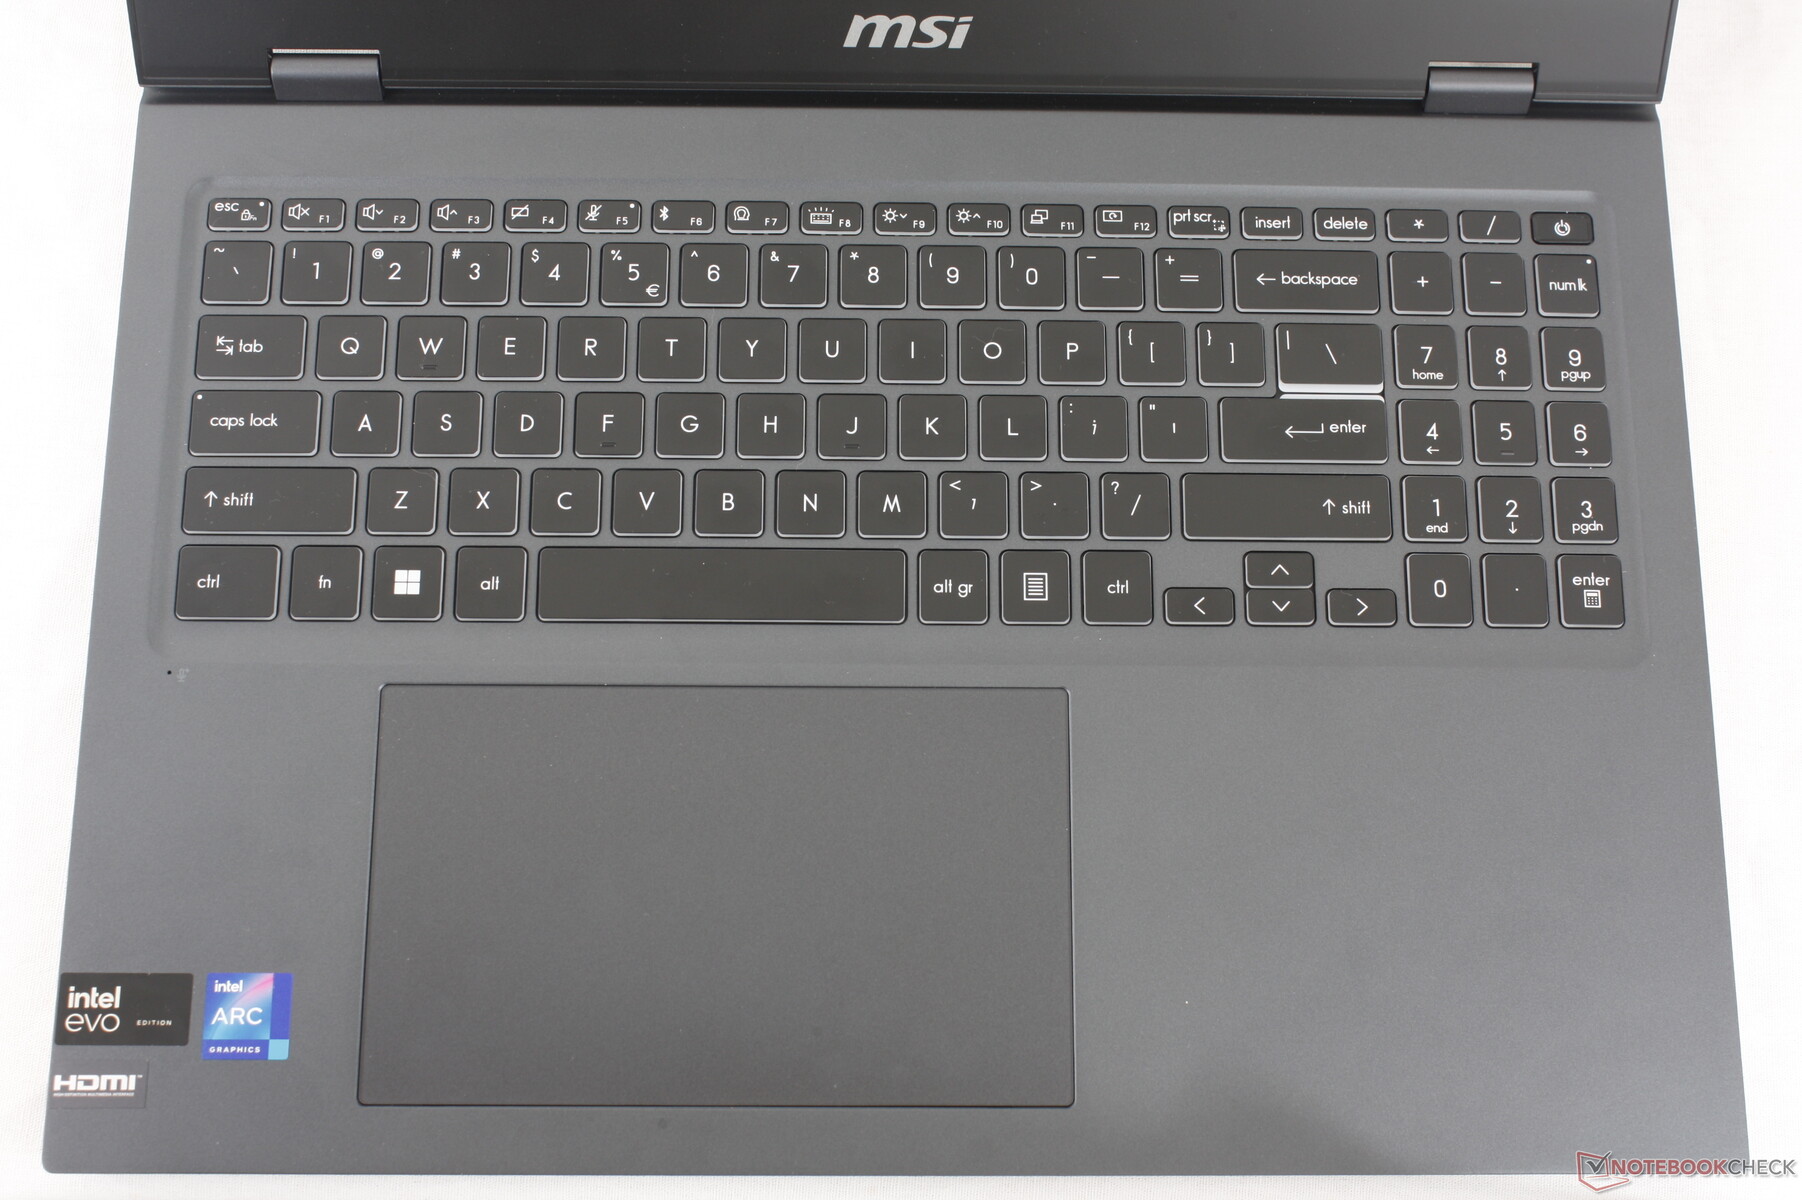
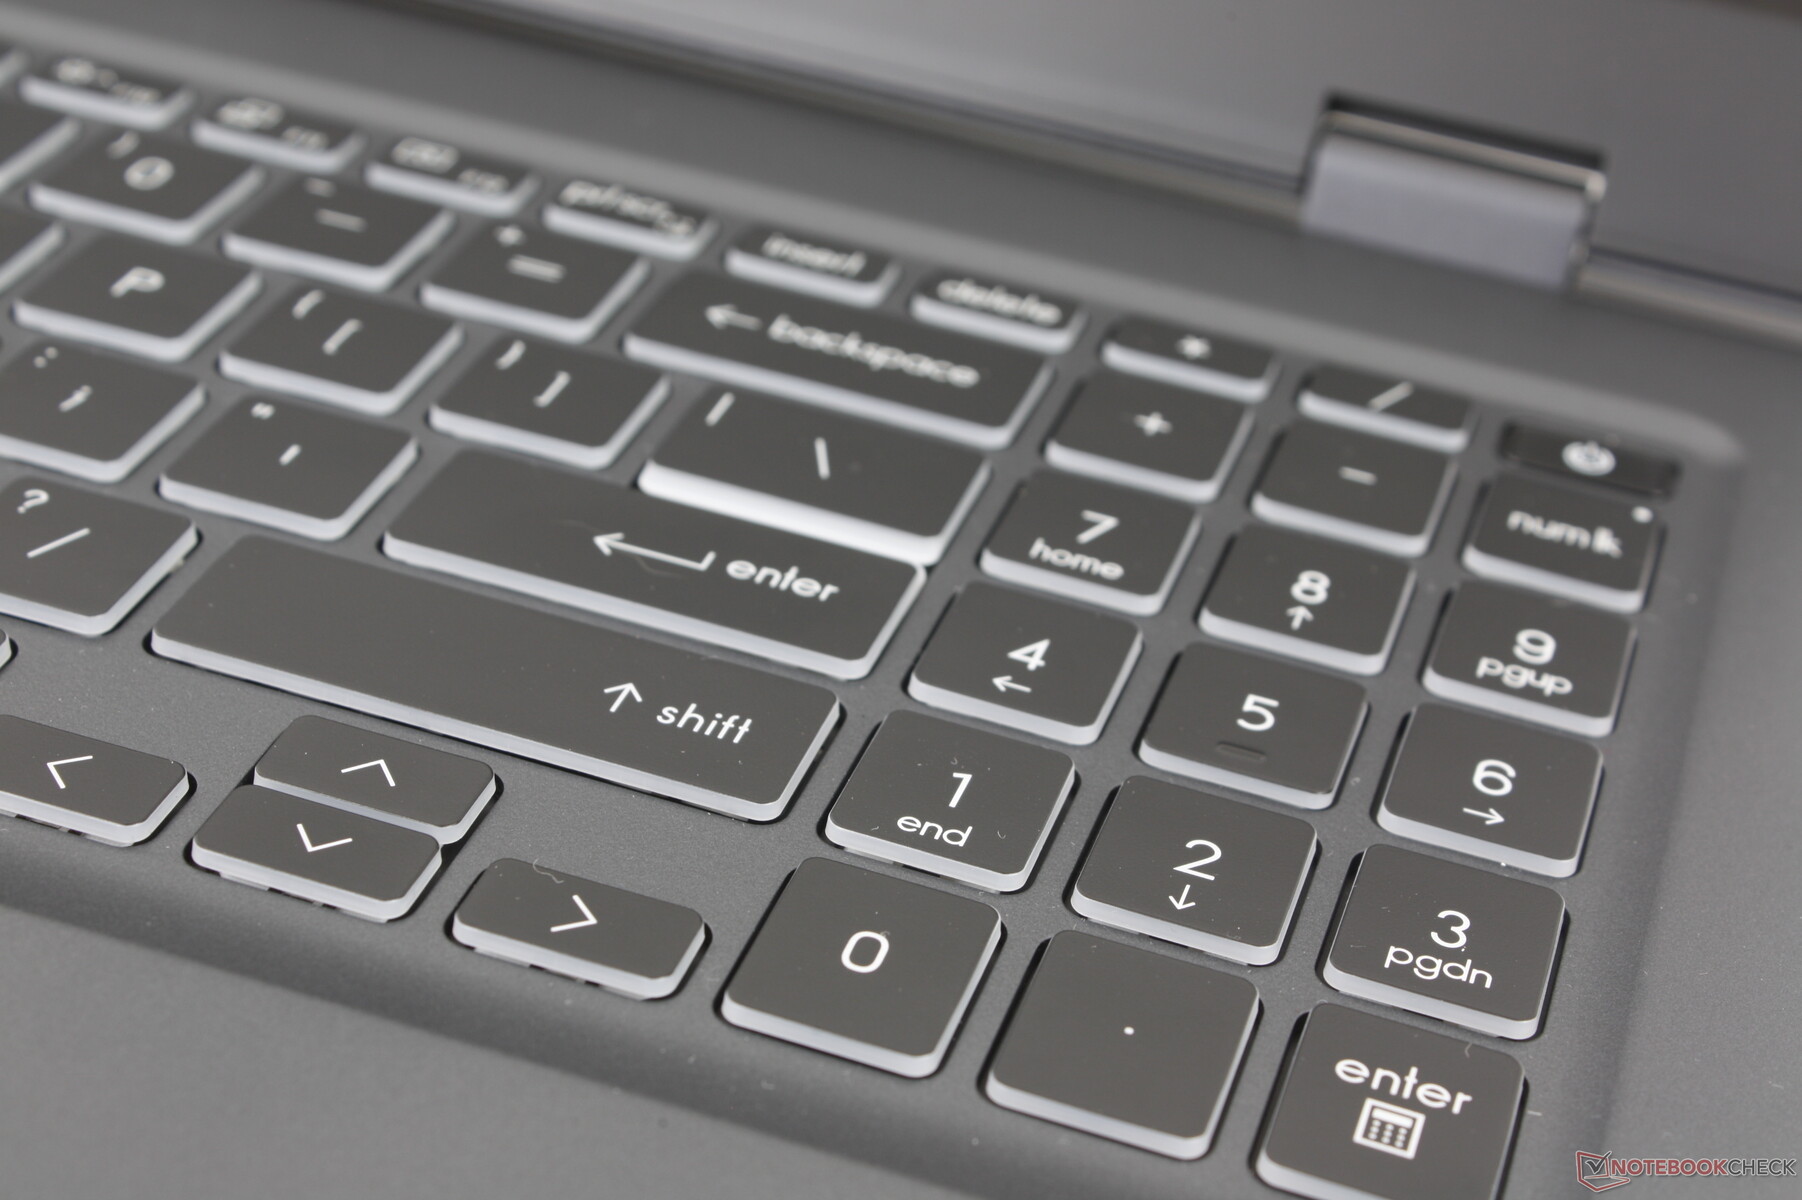
输入设备 - 比以往更大
键盘
键盘经过改进,集成了数字键盘。除此之外,尽管键盘布局有所改变,但按键反馈感觉与 Prestige 15 相同,可提供类似的键入体验。与微星游戏笔记本电脑或同类产品相比,我们仍然发现键程明显较浅。 惠普 Spectre 系列.按键并不过分柔软或不舒适,但每次按下时都能获得更坚硬或更清晰的反馈也无妨。
触摸板
现在的点击板要大得多(15 x 9 厘米),以解决旧款机型点击板尺寸狭窄的问题。 威望 15设计。即使在较慢的速度下滑行,牵引力也平稳可靠,没有粘滞感。
点击时的反馈效果一般,甚至有点偏软。按压时手指需要用力,因此如果没有外接鼠标,操作起来会很累。

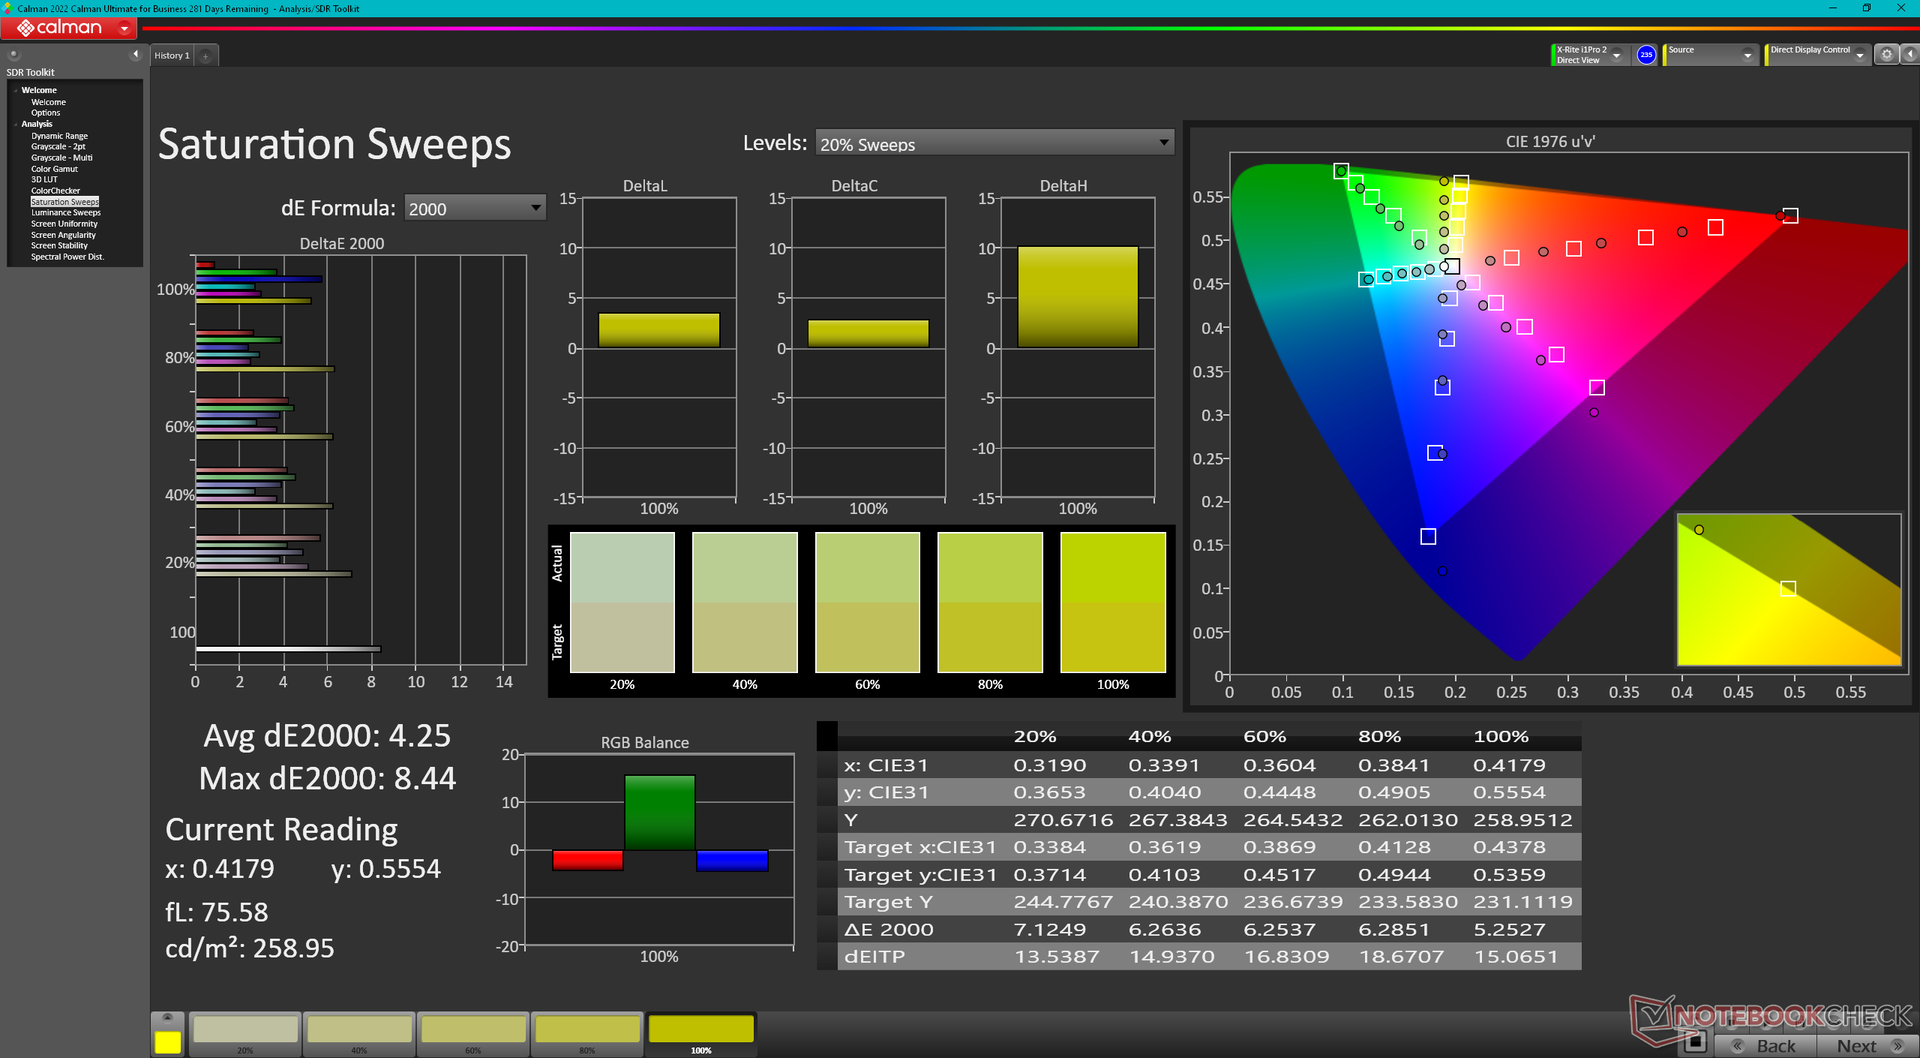
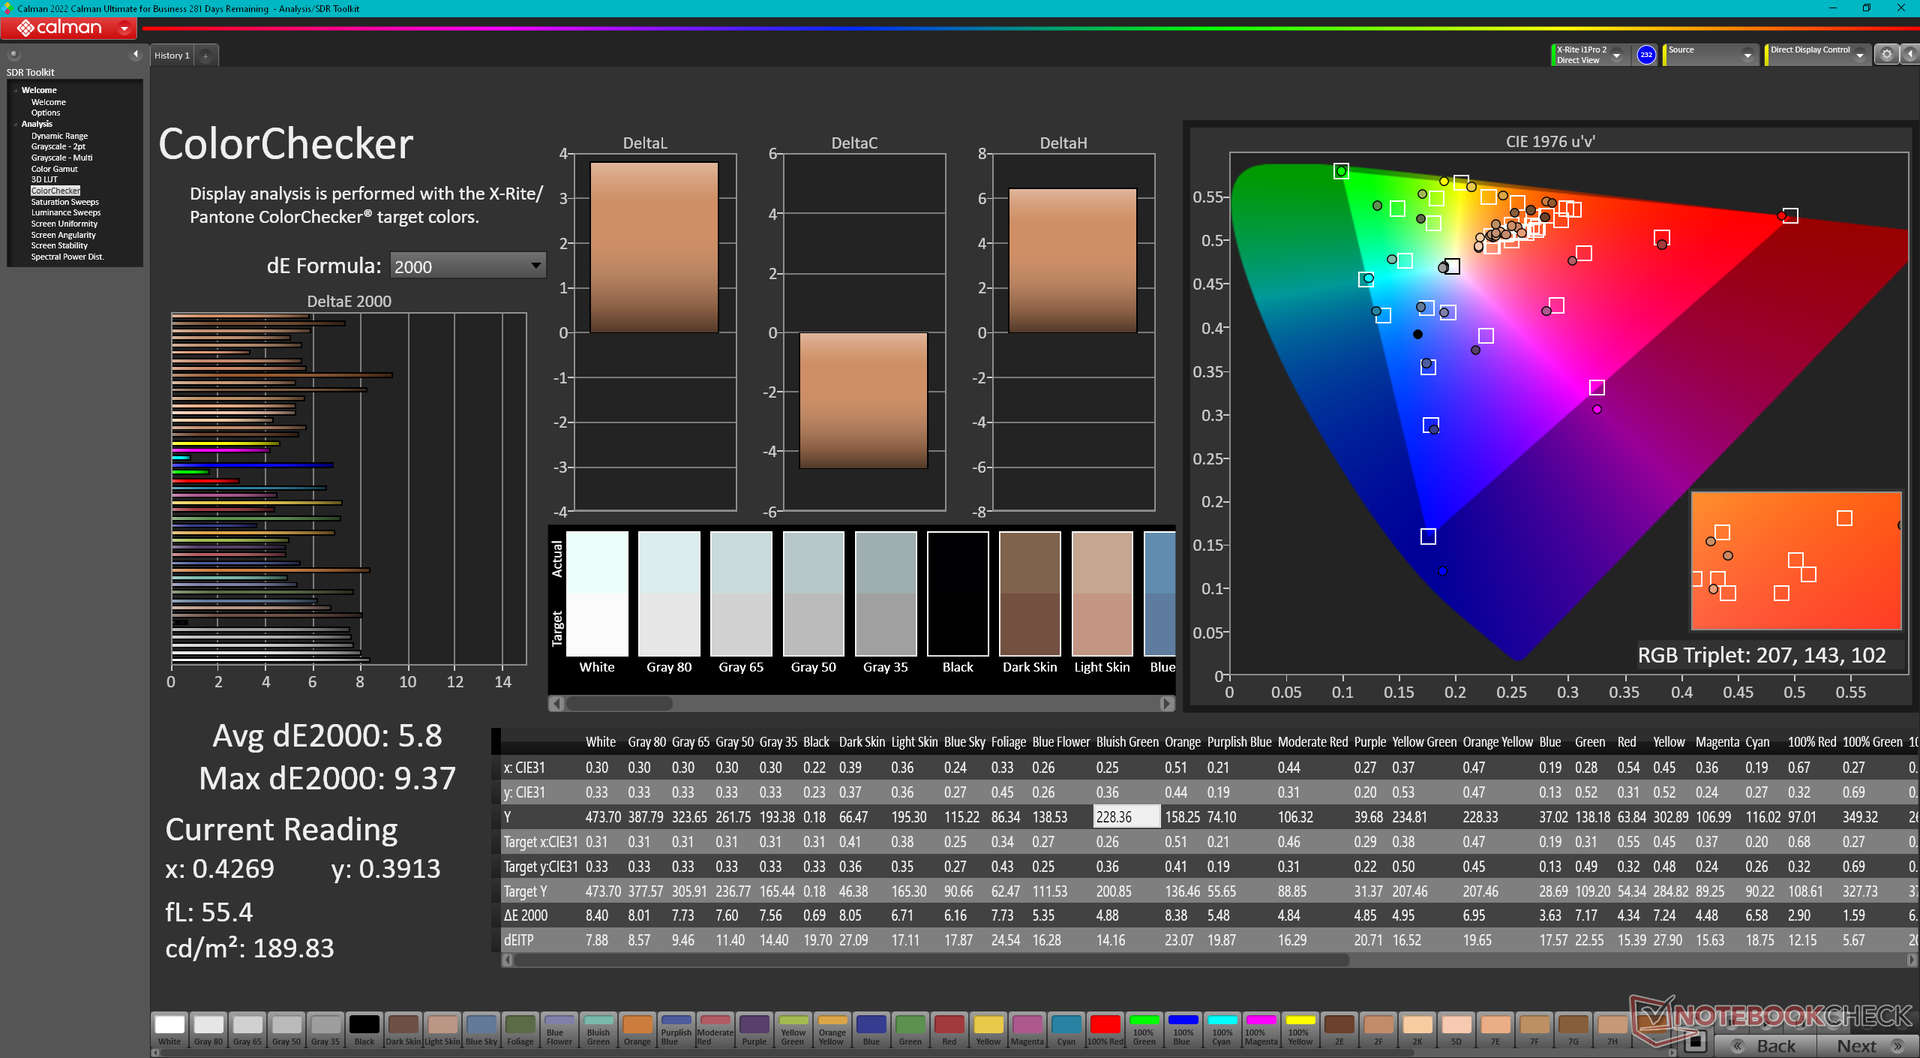
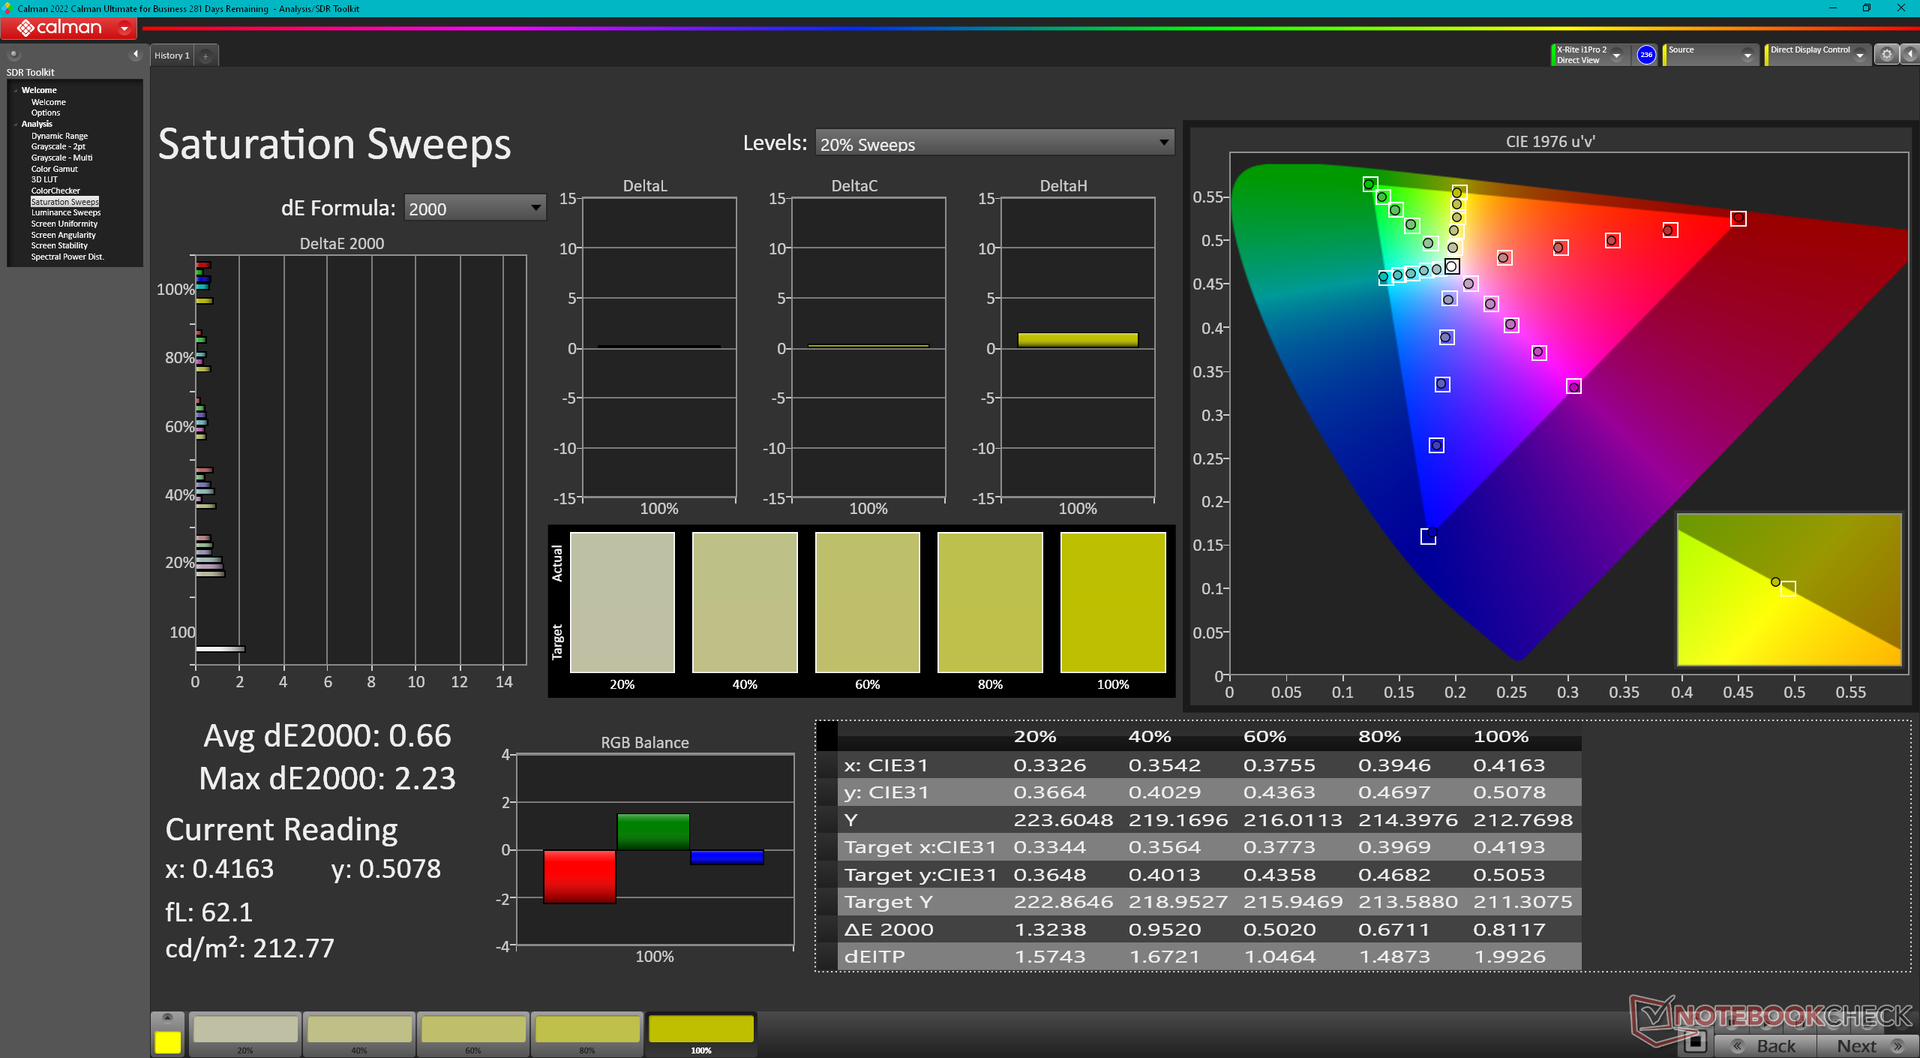
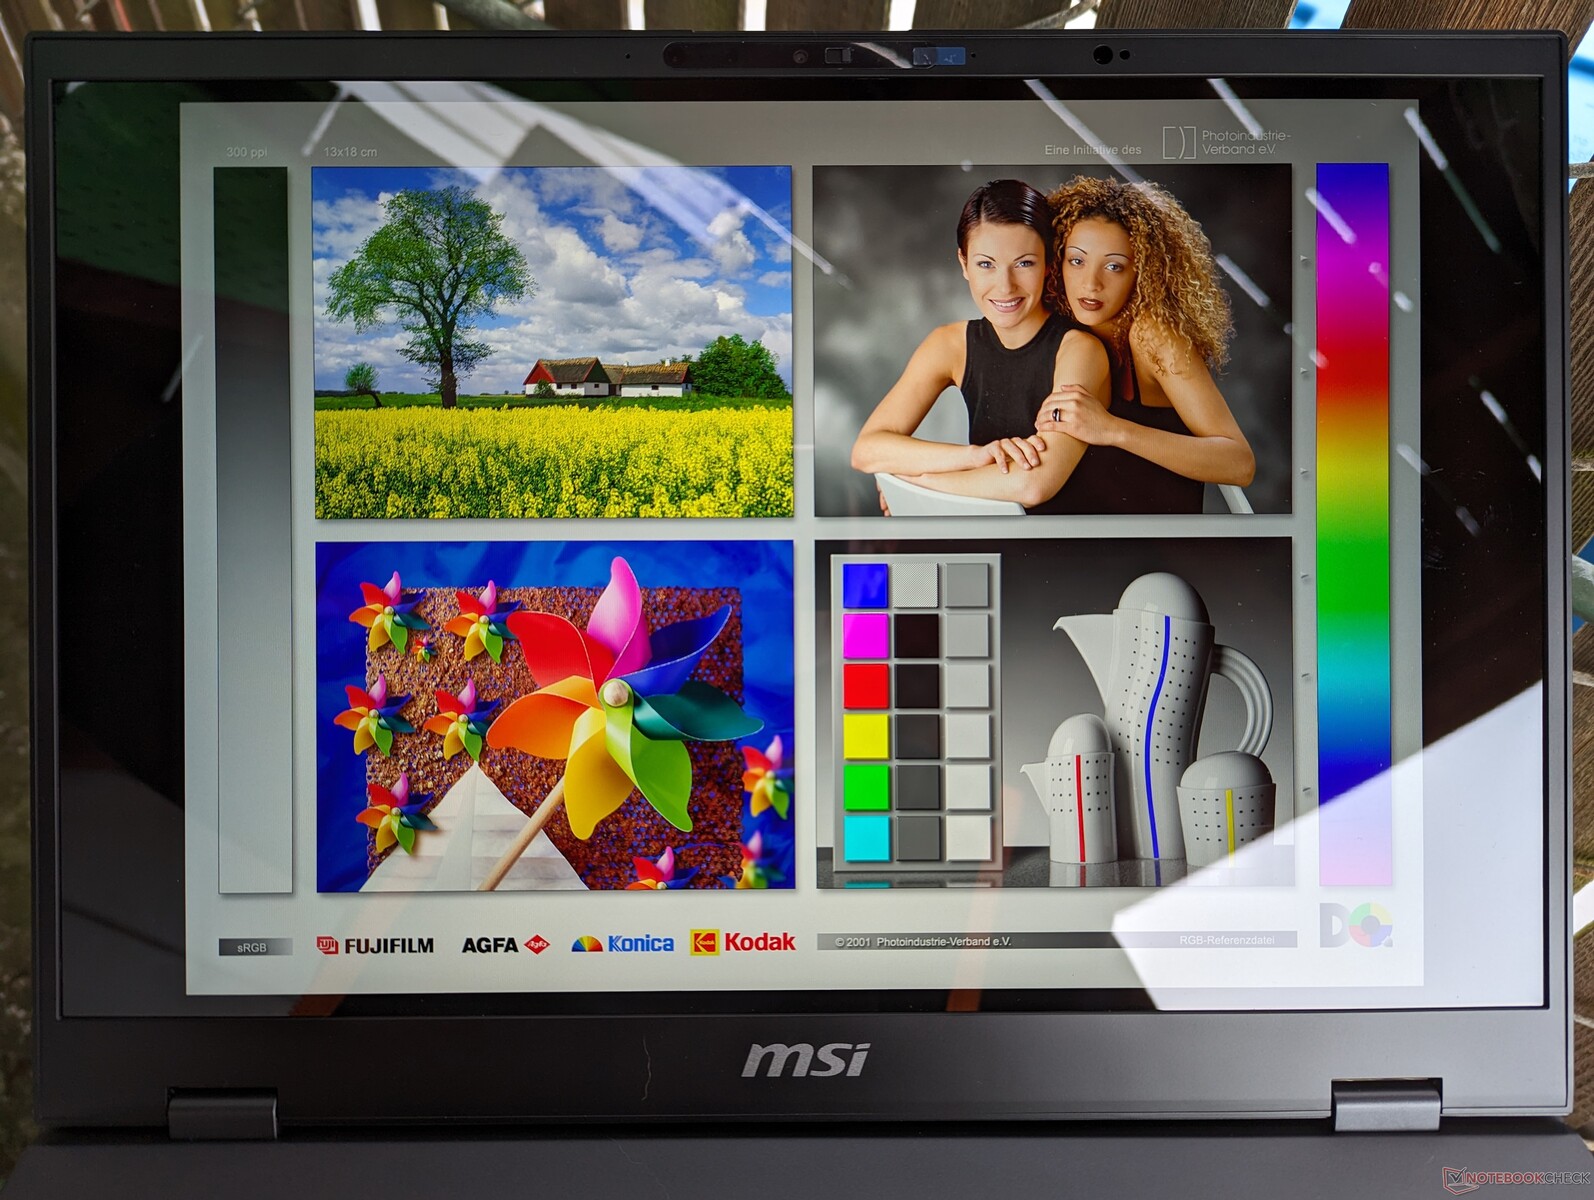
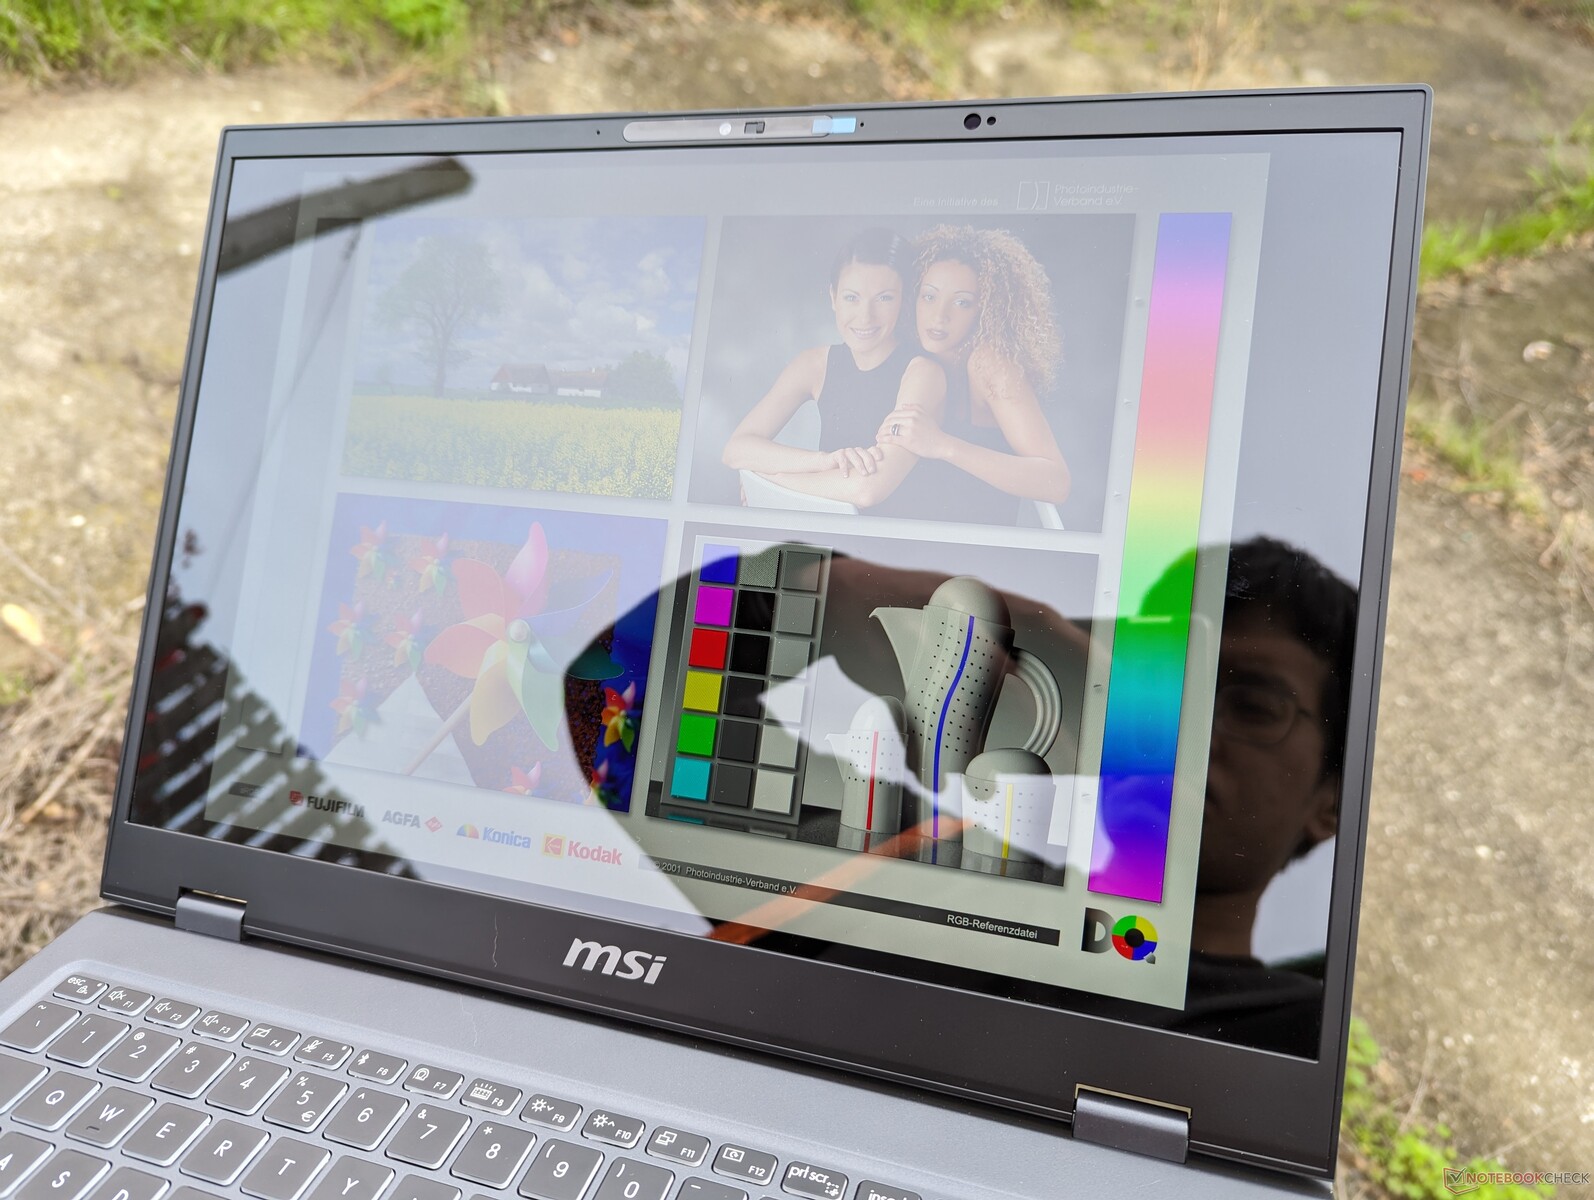
显示屏 - 所有 SKU 均为全 DCI-P3
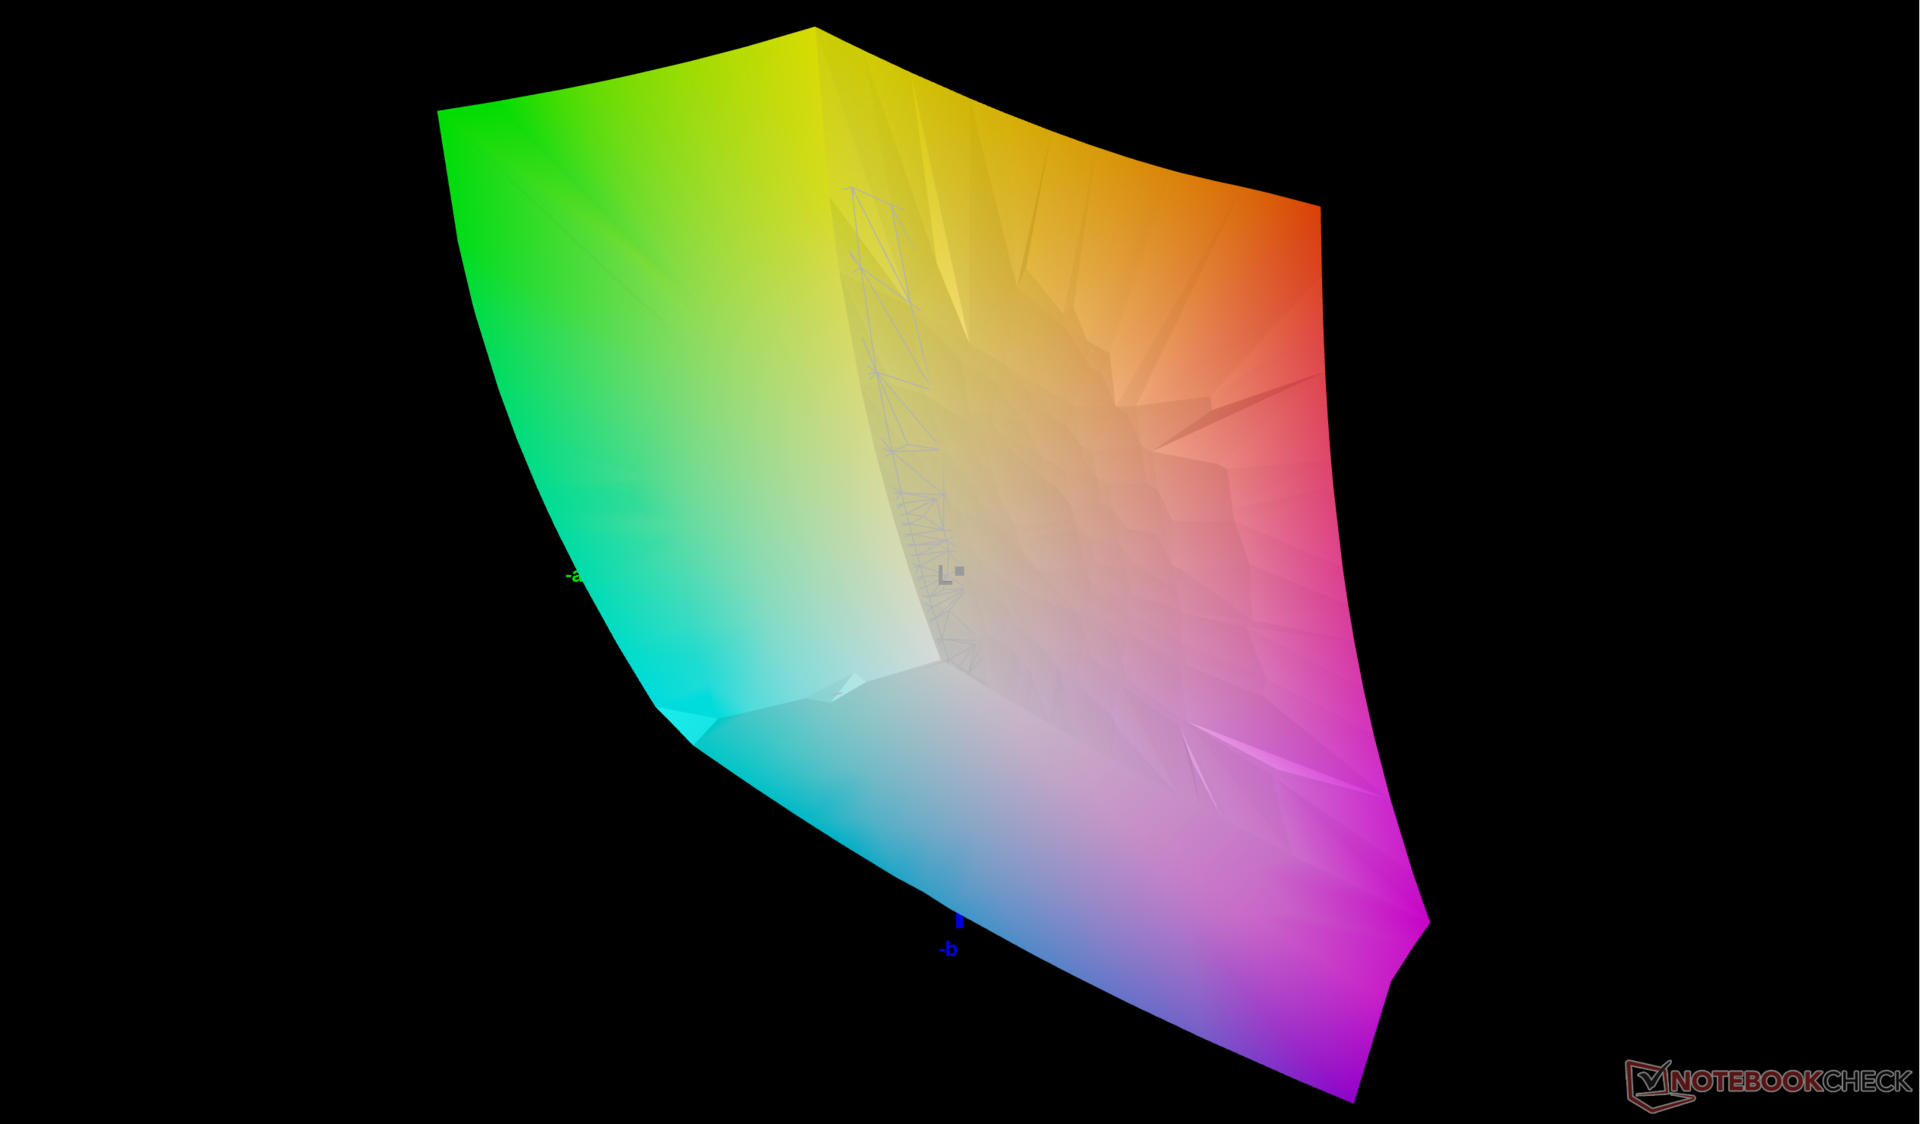
Prestige 16 是我们数据库中第一款配备友达光电 B160QAN03.R 的产品。这款明亮光洁的 IPS 面板质量非常高,具有完整的 DCI-P3 色彩,没有任何颗粒感问题。不过,它的黑白响应时间较慢,缺乏自适应同步功能,刷新率也只有 60 Hz,因此更适合图形编辑而非游戏。
第二款显示屏采用 OLED 技术,原生分辨率更高。两款面板均不支持触摸屏功能。


| |||||||||||||||||||||||||
Brightness Distribution: 87 %
Center on Battery: 473.6 cd/m²
Contrast: 2493:1 (Black: 0.19 cd/m²)
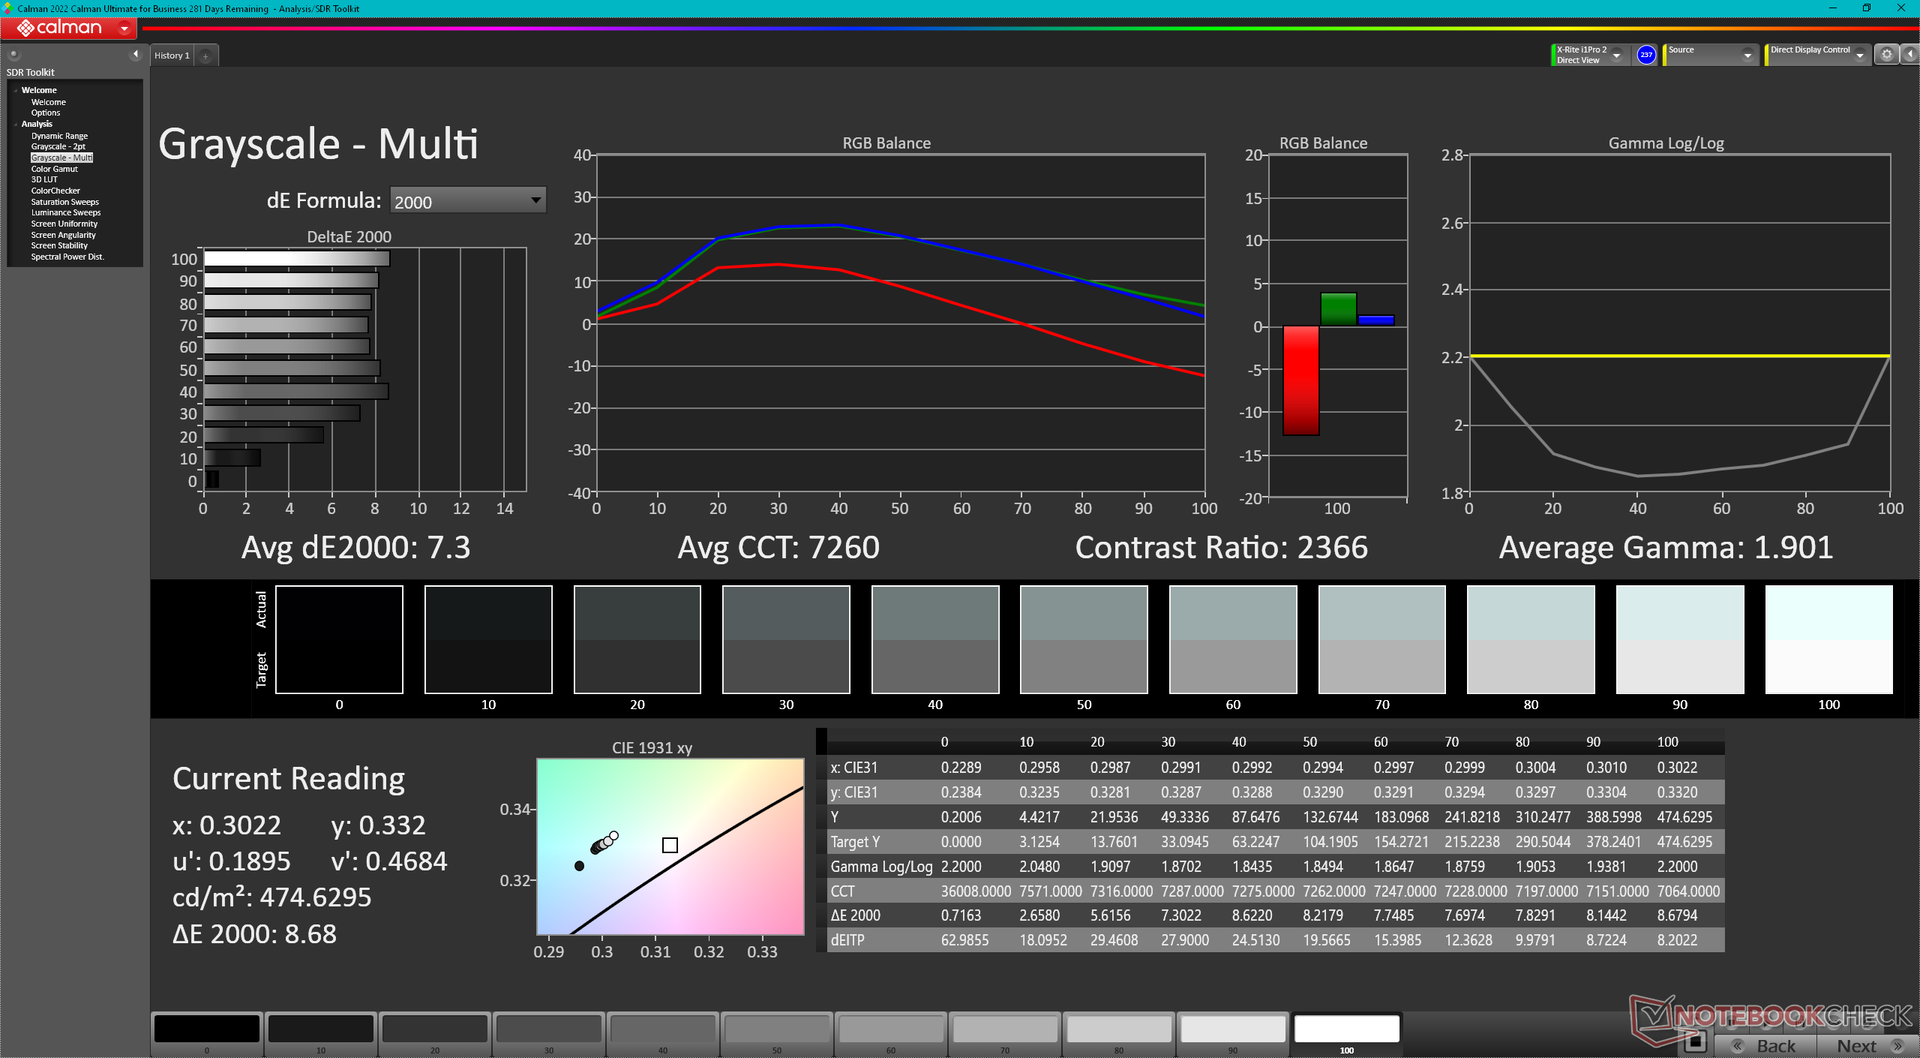
ΔE ColorChecker Calman: 5.9 | ∀{0.5-29.43 Ø4.71}
calibrated: 0.89
ΔE Greyscale Calman: 7.3 | ∀{0.09-98 Ø4.96}
84.6% AdobeRGB 1998 (Argyll 3D)
99.8% sRGB (Argyll 3D)
96.7% Display P3 (Argyll 3D)
Gamma: 1.9
CCT: 7260 K
| MSI Prestige 16 B1MG-001US AU Optronics B160QAN03.R, IPS, 2560x1600, 16" | MSI Prestige 15 A12UD-093 Sharp LQ156D1JW42, IPS, 3840x2160, 15.6" | LG Gram 2in1 16 16T90R - G.AA78G LP160WQ1-SPB2, IPS, 2560x1600, 16" | Lenovo ThinkBook 16 G6 ABP LEN160WUXGA, IPS, 1920x1200, 16" | Asus VivoBook Pro 16 K6602VU Samsung ATNA60BX01-1, OLED, 3200x2000, 16" | Dell Inspiron 16 Plus 7630 LG Philips 160WQ2, IPS, 2560x1600, 16" | |
|---|---|---|---|---|---|---|
| Display | -3% | 0% | -49% | 5% | -14% | |
| Display P3 Coverage (%) | 96.7 | 80.48 -17% | 96.5 0% | 40.4 -58% | 98.7 2% | 70.1 -28% |
| sRGB Coverage (%) | 99.8 | 96.95 -3% | 99.9 0% | 59.8 -40% | 99.7 0% | 99.6 0% |
| AdobeRGB 1998 Coverage (%) | 84.6 | 94.02 11% | 84.6 0% | 42 -50% | 96.5 14% | 72.3 -15% |
| Response Times | 10% | 30% | 32% | 80% | 29% | |
| Response Time Grey 50% / Grey 80% * (ms) | 49.4 ? | 51 ? -3% | 38.4 ? 22% | 32.8 ? 34% | 0.68 ? 99% | 35 ? 29% |
| Response Time Black / White * (ms) | 33.9 ? | 26 ? 23% | 21.4 ? 37% | 23.9 ? 29% | 13.2 ? 61% | 24.2 ? 29% |
| PWM Frequency (Hz) | 240 ? | |||||
| Screen | 27% | -19% | -83% | -13% | 0% | |
| Brightness middle (cd/m²) | 473.6 | 441 -7% | 329 -31% | 310 -35% | 353 -25% | 299.4 -37% |
| Brightness (cd/m²) | 456 | 416 -9% | 310 -32% | 290 -36% | 354 -22% | 290 -36% |
| Brightness Distribution (%) | 87 | 85 -2% | 88 1% | 86 -1% | 98 13% | 92 6% |
| Black Level * (cd/m²) | 0.19 | 0.155 18% | 0.39 -105% | 0.22 -16% | 0.21 -11% | |
| Contrast (:1) | 2493 | 2845 14% | 844 -66% | 1409 -43% | 1426 -43% | |
| Colorchecker dE 2000 * | 5.9 | 1.51 74% | 3.52 40% | 6.2 -5% | 4.23 28% | 4.25 28% |
| Colorchecker dE 2000 max. * | 9.37 | 3.56 62% | 6.96 26% | 24.7 -164% | 7.13 24% | 6.71 28% |
| Colorchecker dE 2000 calibrated * | 0.89 | 1.15 -29% | 5.3 -496% | 2.42 -172% | 0.52 42% | |
| Greyscale dE 2000 * | 7.3 | 2.49 66% | 5.75 21% | 3.8 48% | 2.5 66% | 5.5 25% |
| Gamma | 1.9 116% | 2.17 101% | 2.137 103% | 2.22 99% | 2.4 92% | 2.35 94% |
| CCT | 7260 90% | 6292 103% | 7584 86% | 6011 108% | 6642 98% | 6368 102% |
| Total Average (Program / Settings) | 11% /
17% | 4% /
-8% | -33% /
-60% | 24% /
7% | 5% /
1% |
* ... smaller is better
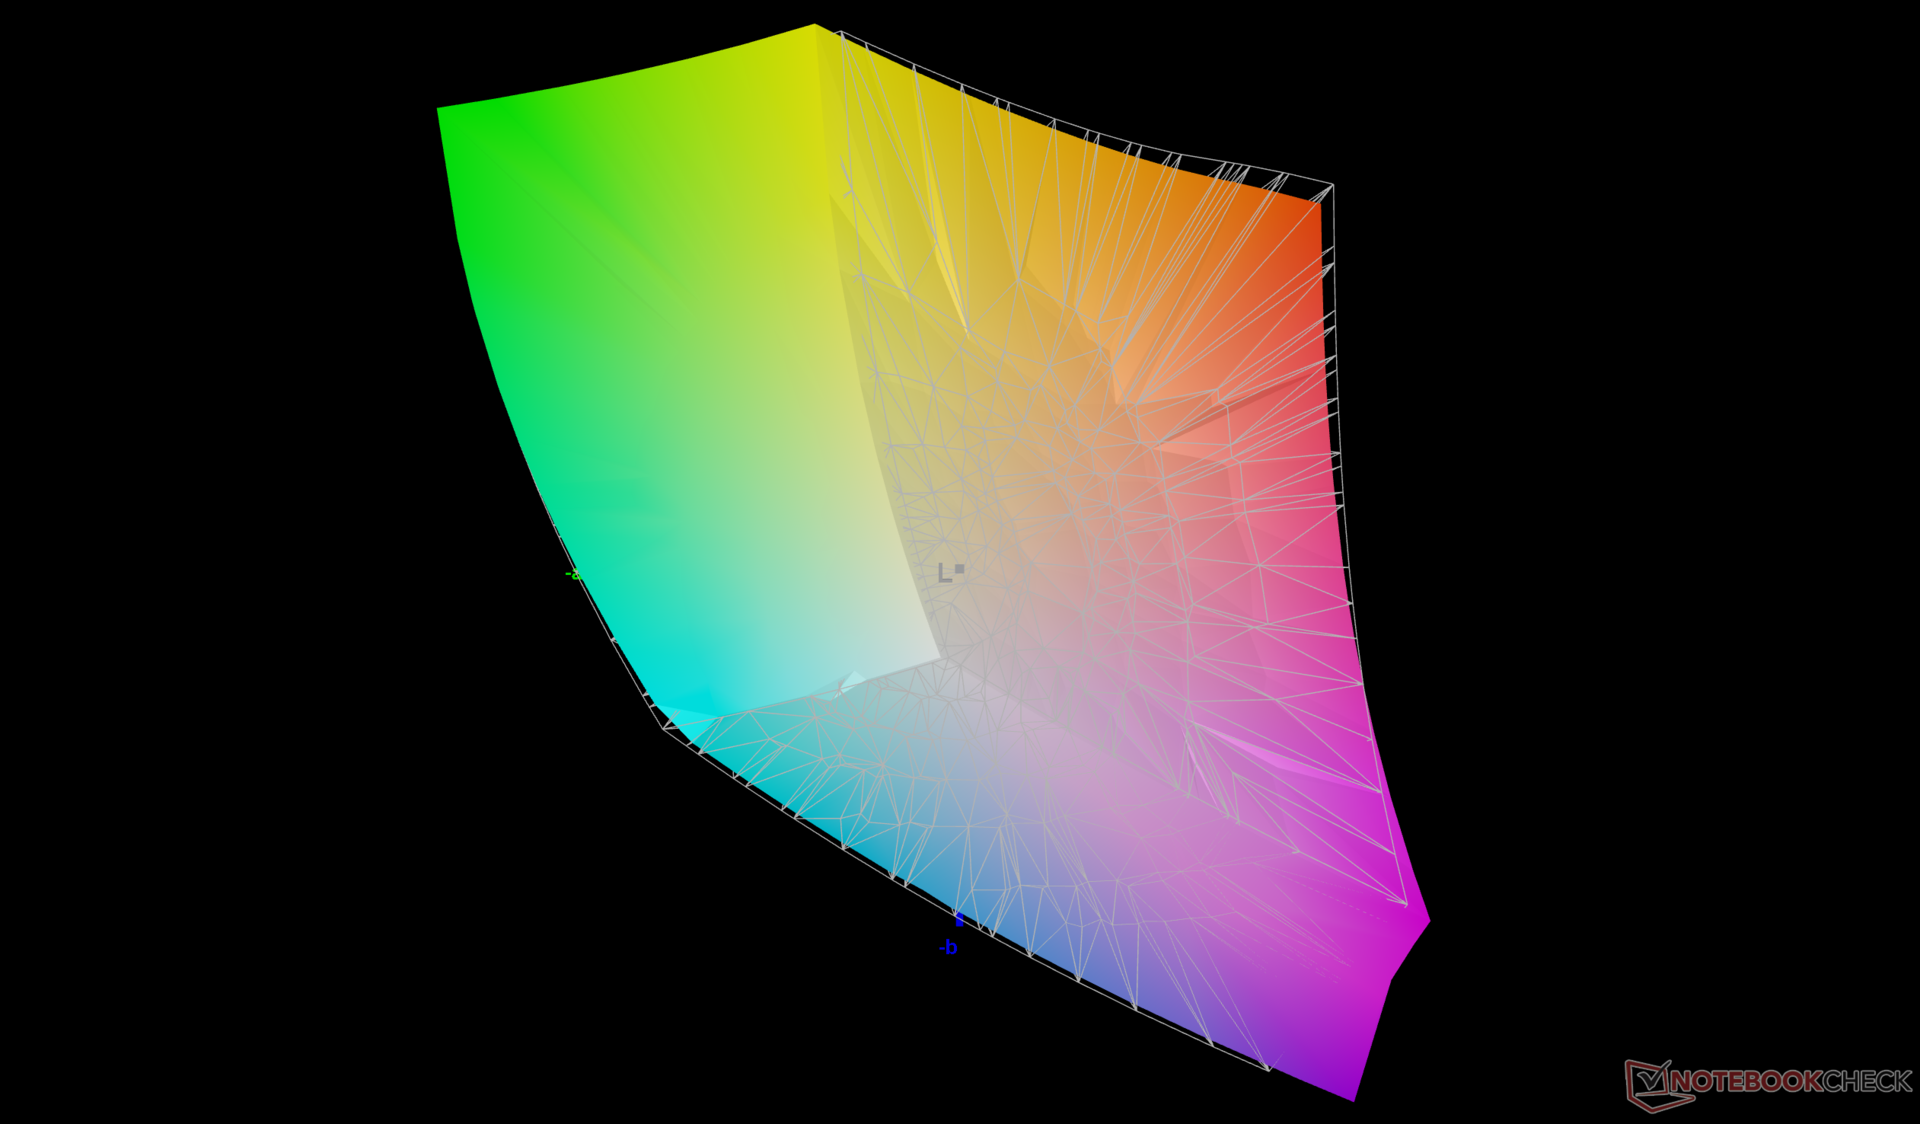
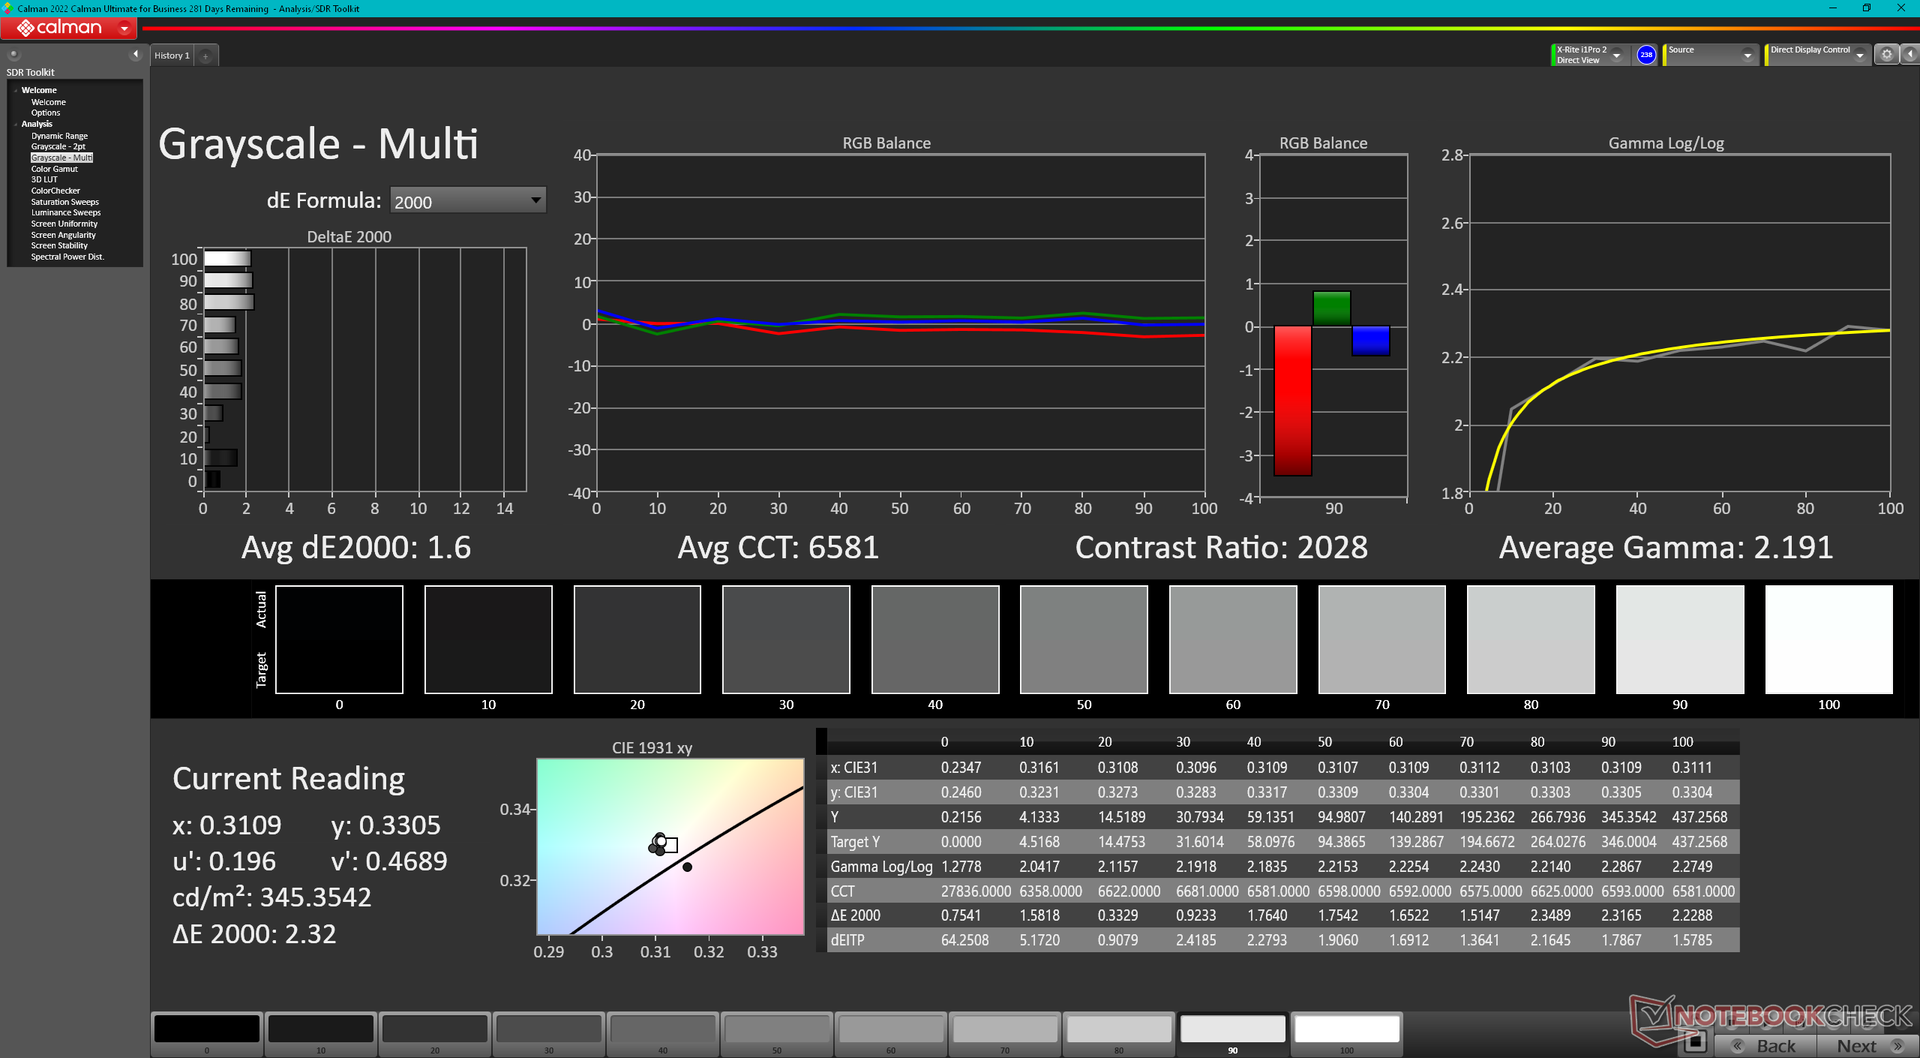
由于所有产品都支持 DCI-P3 色彩,因此显示屏没有经过预校准,这是一个遗憾。色温过冷,灰度和色彩 DeltaE 平均值相对较高,分别为 7.3 和 5.8。自行校准面板可将这些平均值分别降至小于 2。我们的校准 ICM 配置文件可在上面免费下载。
Display Response Times
| ↔ Response Time Black to White | ||
|---|---|---|
| 33.9 ms ... rise ↗ and fall ↘ combined | ↗ 15.6 ms rise | 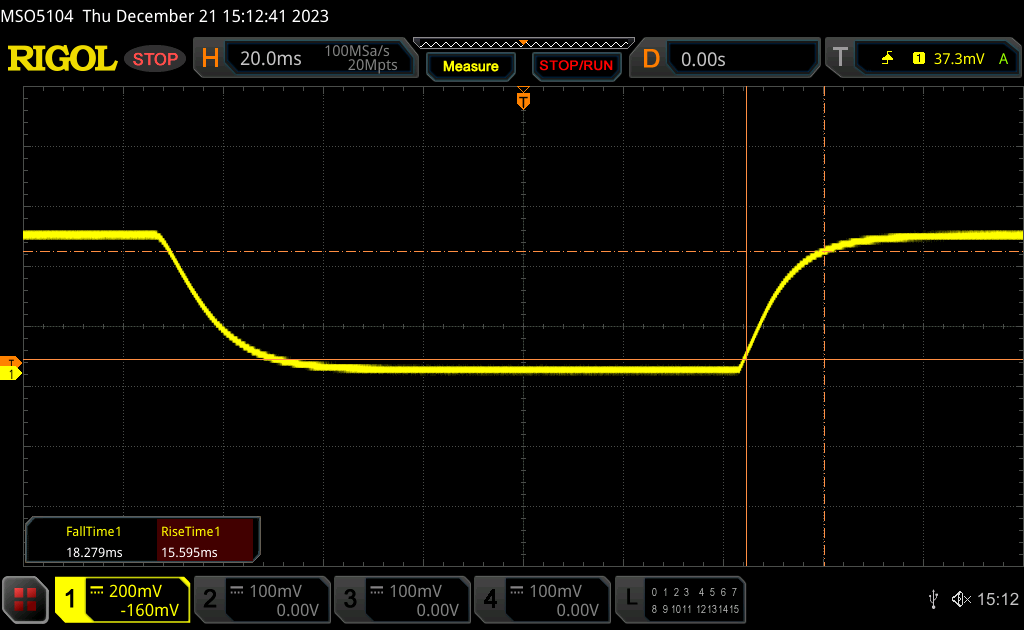 |
| ↘ 18.3 ms fall | ||
| The screen shows slow response rates in our tests and will be unsatisfactory for gamers. In comparison, all tested devices range from 0.1 (minimum) to 240 (maximum) ms. » 91 % of all devices are better. This means that the measured response time is worse than the average of all tested devices (19.8 ms). | ||
| ↔ Response Time 50% Grey to 80% Grey | ||
| 49.4 ms ... rise ↗ and fall ↘ combined | ↗ 22.6 ms rise | 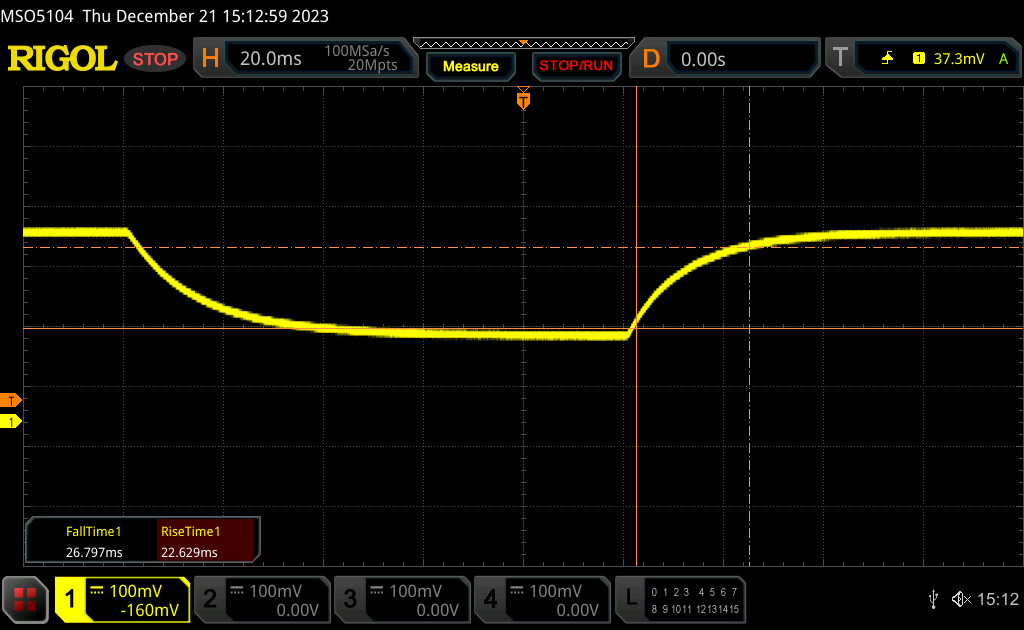 |
| ↘ 26.8 ms fall | ||
| The screen shows slow response rates in our tests and will be unsatisfactory for gamers. In comparison, all tested devices range from 0.165 (minimum) to 636 (maximum) ms. » 85 % of all devices are better. This means that the measured response time is worse than the average of all tested devices (31 ms). | ||
Screen Flickering / PWM (Pulse-Width Modulation)
| Screen flickering / PWM not detected | 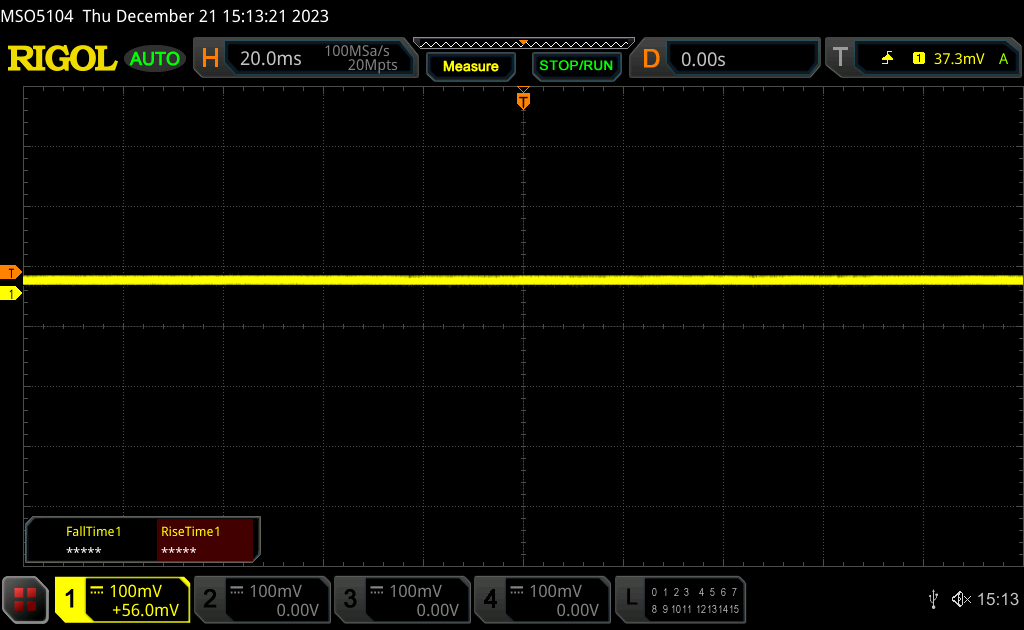 | ||
In comparison: 52 % of all tested devices do not use PWM to dim the display. If PWM was detected, an average of 7757 (minimum: 5 - maximum: 343500) Hz was measured. | |||
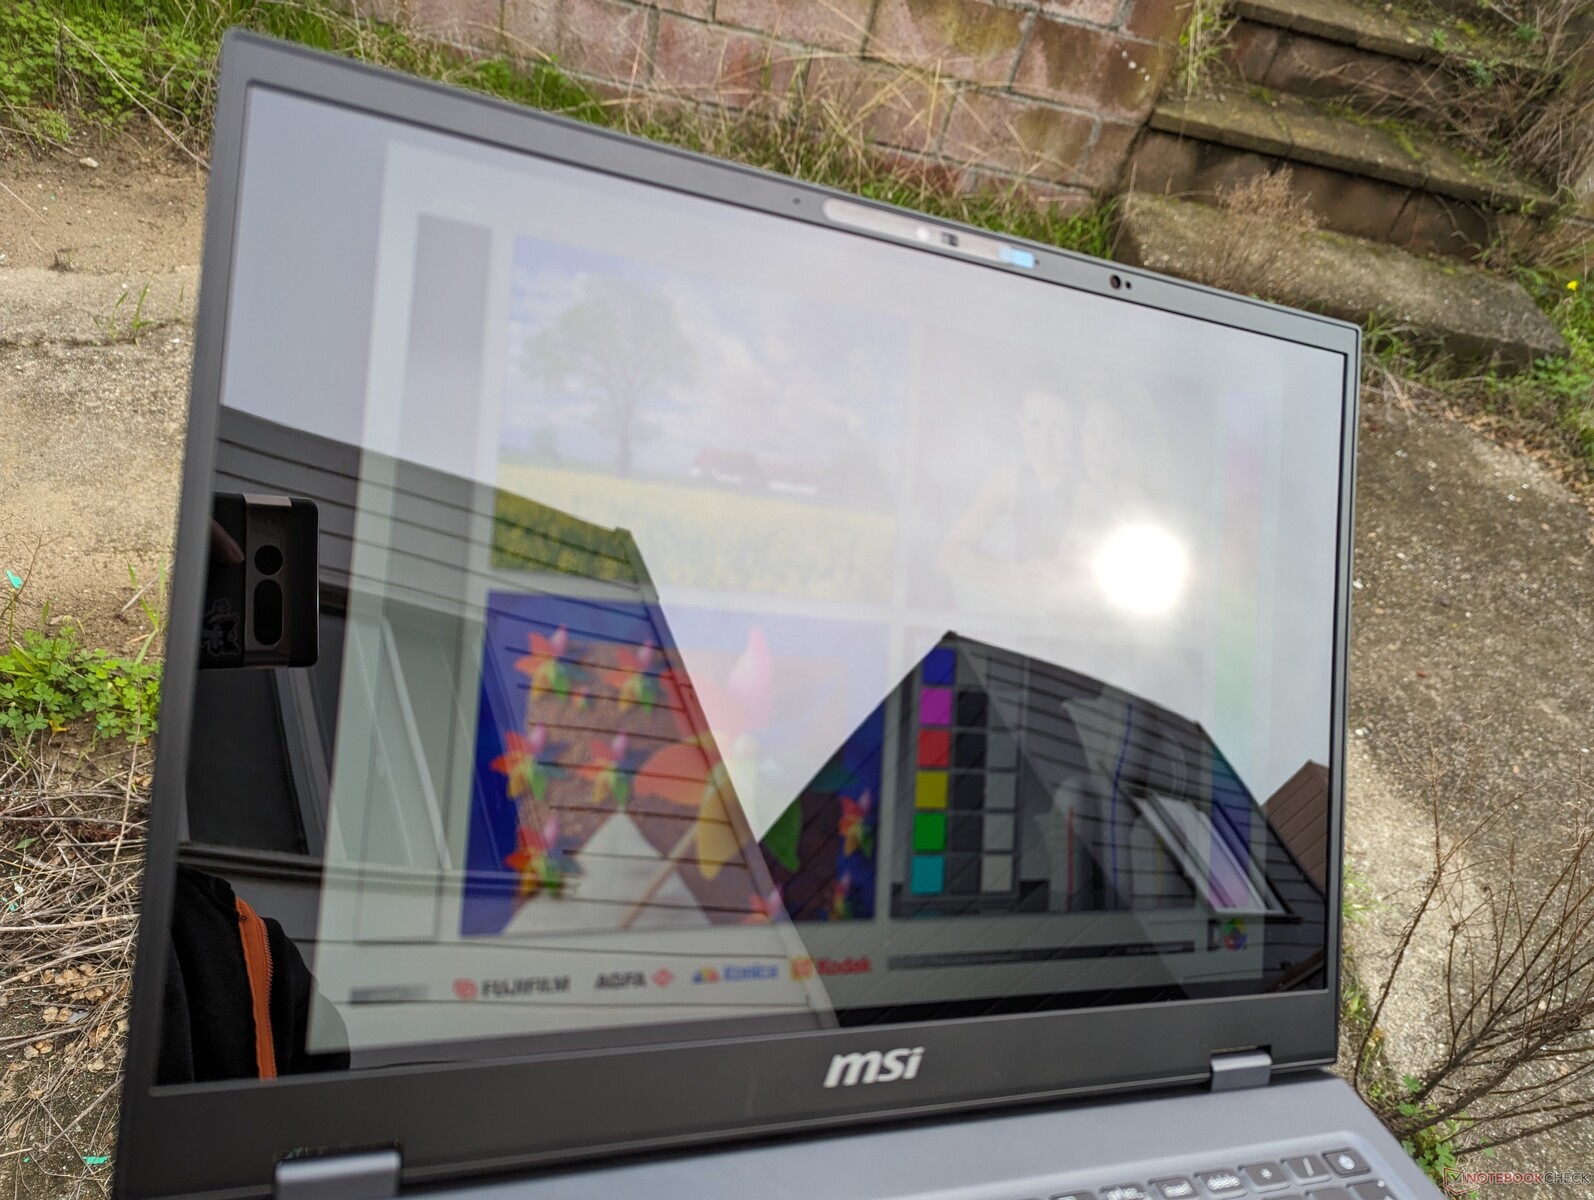
超亮屏幕可能有助于获得更清晰的图像,但在大多数使用场景下也会造成过度眩光,尤其是在户外。MacBook Pro 16 的 Mini-LED 屏幕 MacBook Pro 16 的 Mini-LED 屏幕比微星的亮度高约 30%,在明亮的环境光线下一般能获得更好的可视性。

业绩--如日中天
测试条件
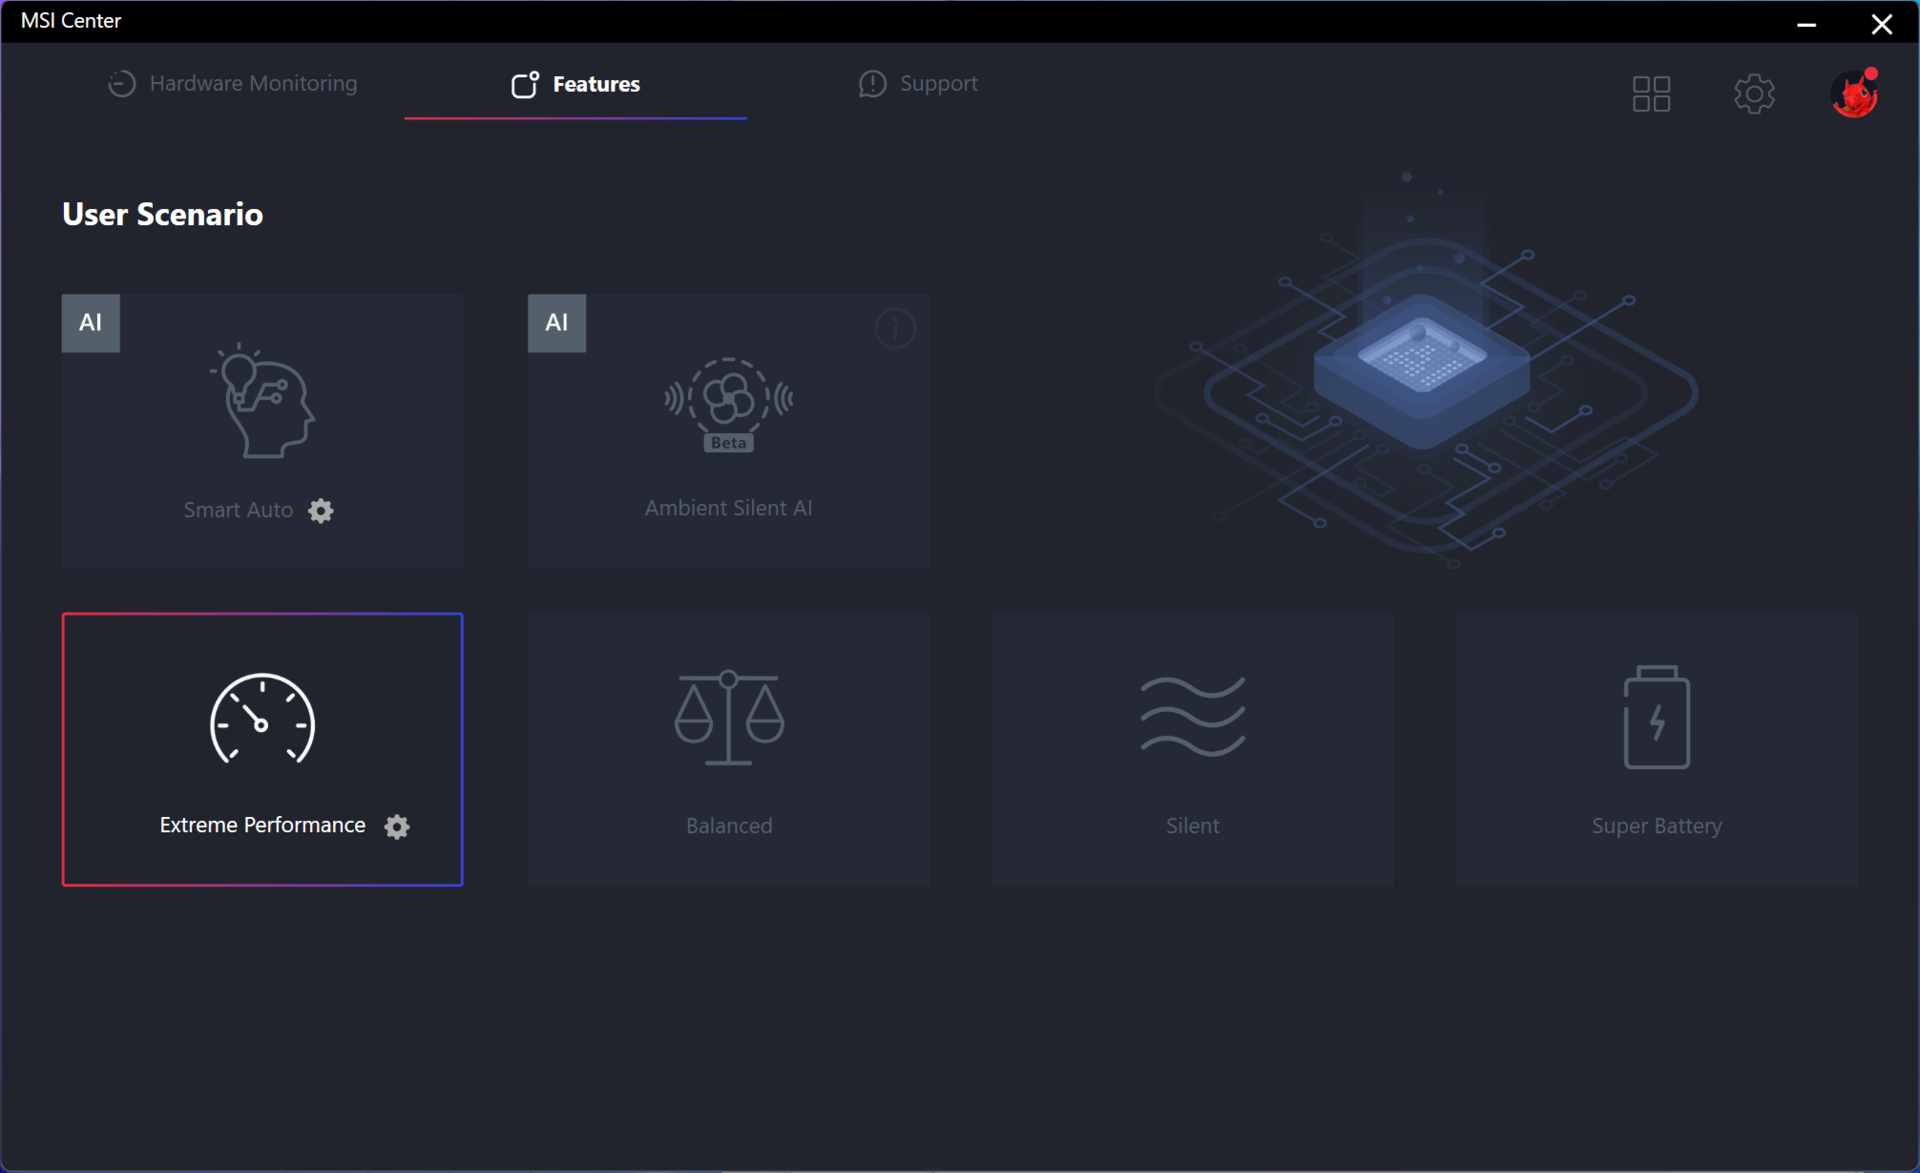
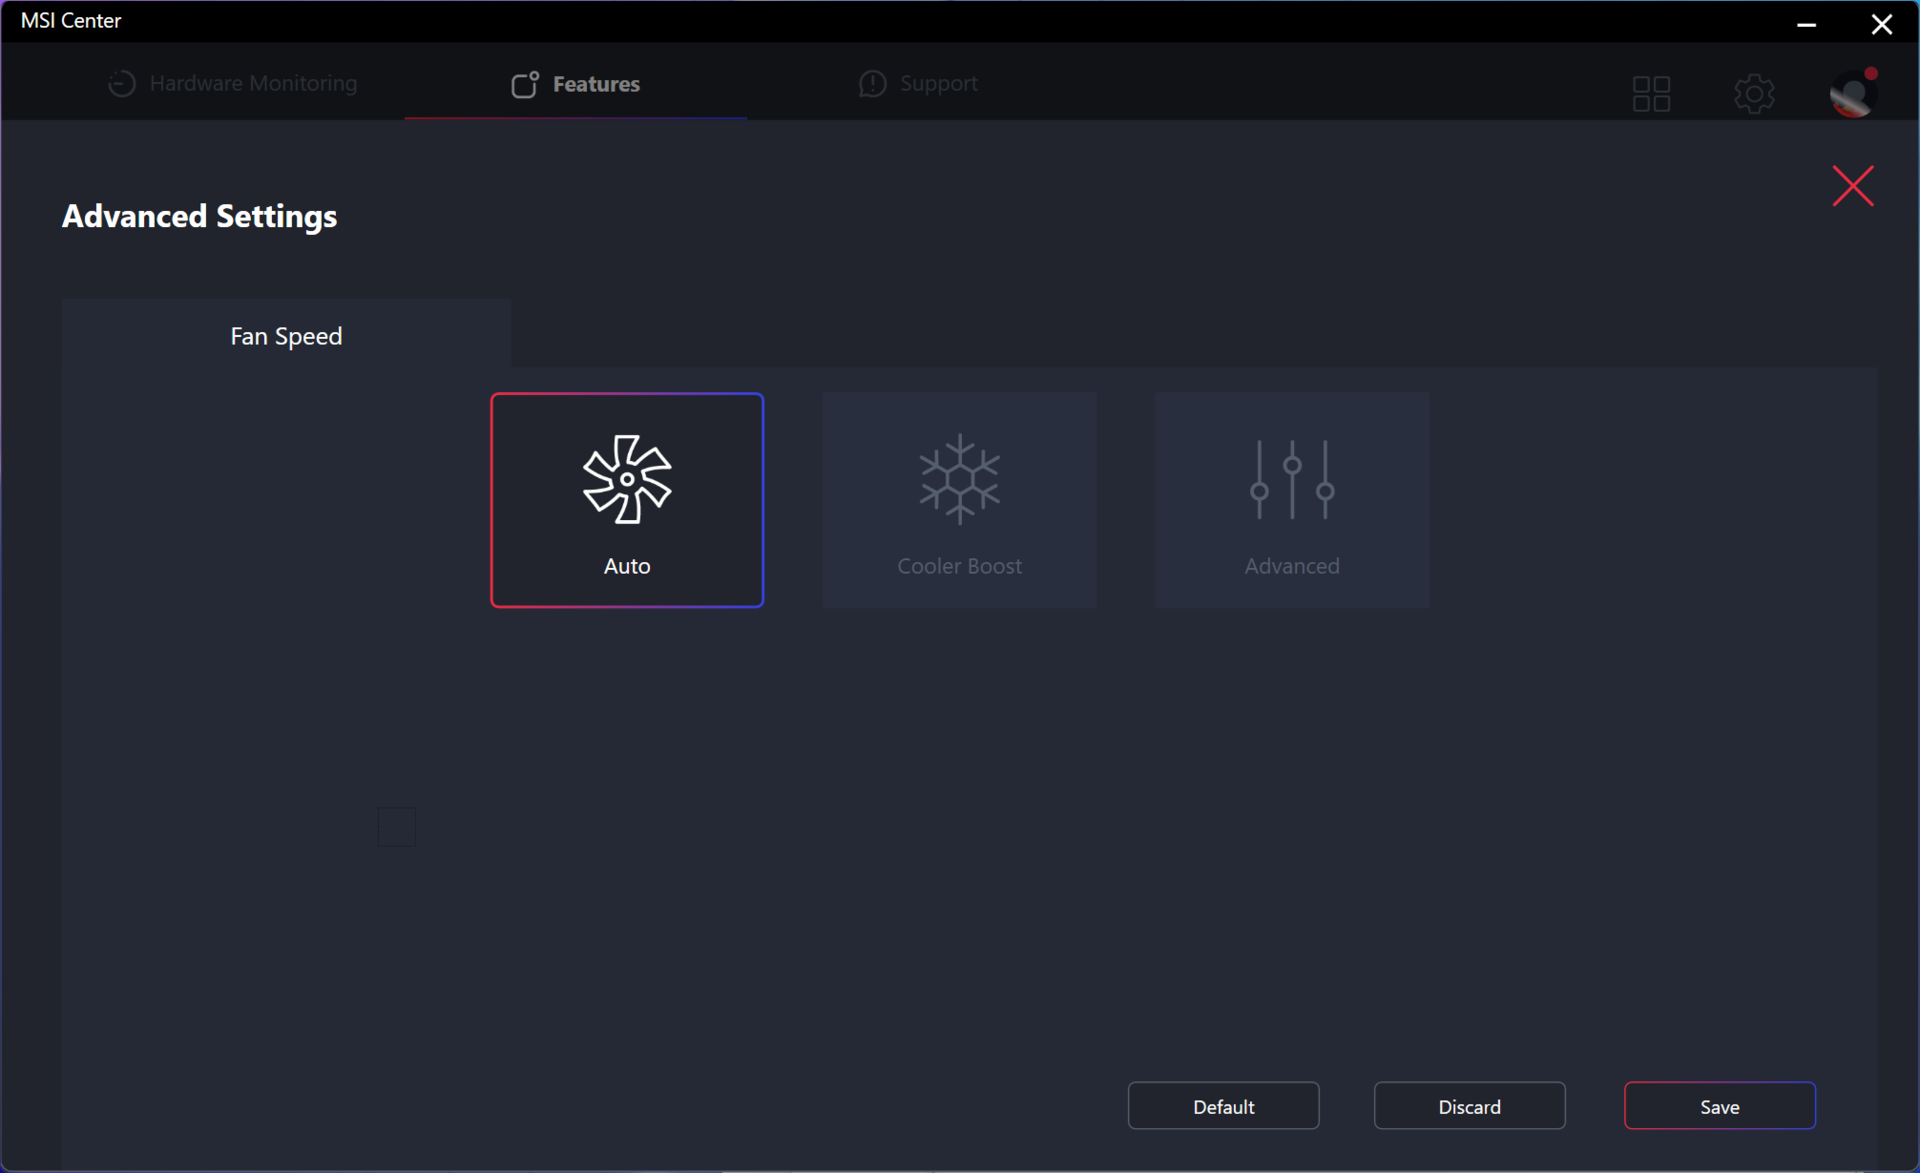
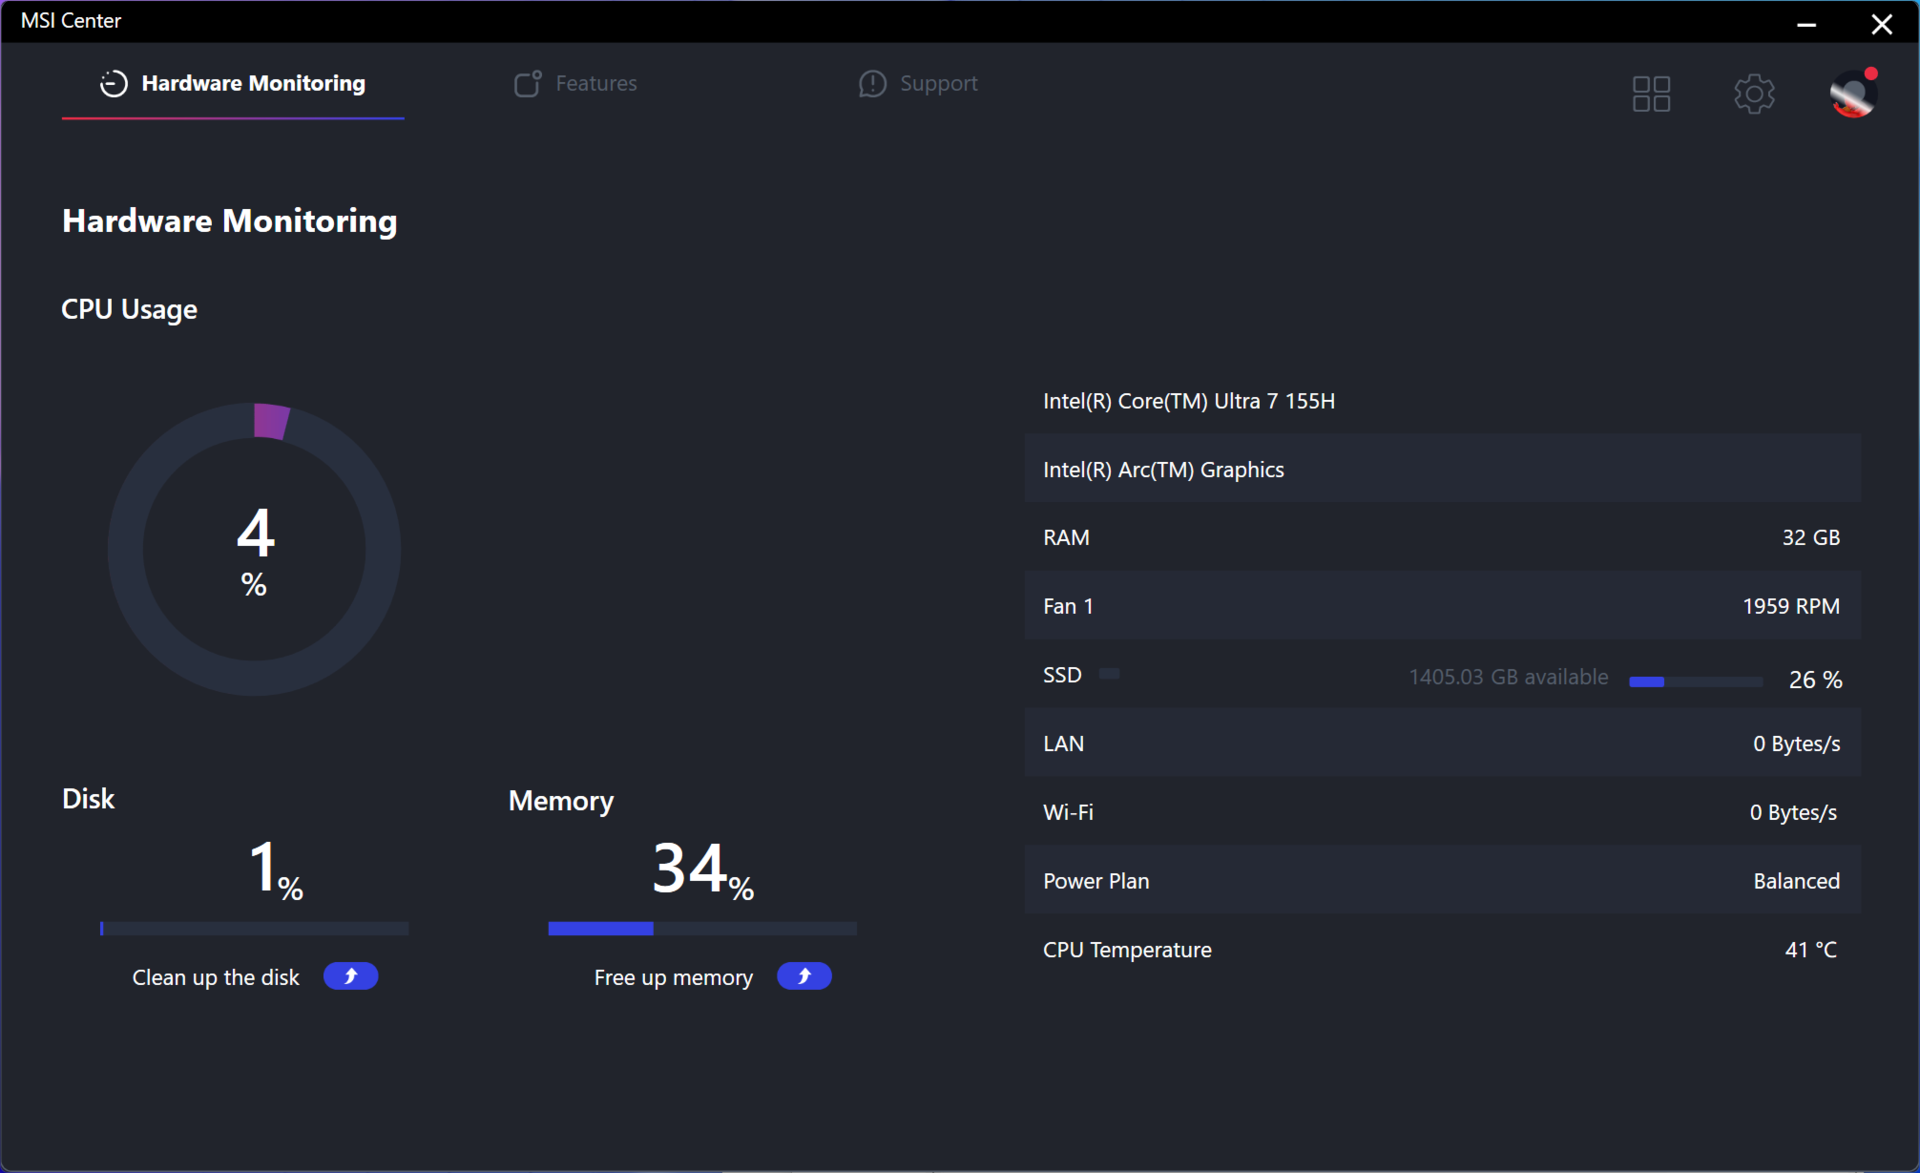
在运行以下基准测试之前,我们将 Windows 设置为 "性能模式",将 MSI Center 设置为 "极致性能模式"。用户应该熟悉微星中心,因为它是微星特定更新和功能的中心。
处理器
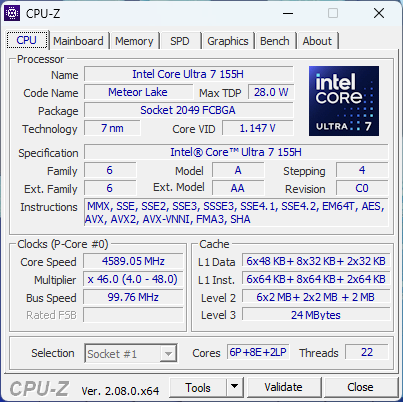
与上一代酷睿 U 和酷睿 P 相比,CPU 性能实现了巨大飞跃。我们的 酷睿至尊 7 155H领先 20% 至 25%。 酷睿 i7-1360P和 AMD 最快的 Zen 4 U 系列产品 Ryzen 7 7840U.
期待比第 13 代酷睿 H 处理器有明显提升的用户可能仍然会失望。例如,原始单线程和多线程性能略低于 酷睿 i7-13700H.13 代酷睿 H 和 14 代酷睿 H 最大的区别在于 iGPU 和 AI 加速的改进。
更高端的 酷睿至尊 9 185H但我们预计它的性能不会比我们的 Core Ultra 7 155H 配置快多少,因为这两款 CPU 的内核数量完全相同,只是时钟频率略有不同。
Cinebench R15 Multi Loop
Cinebench R23: Multi Core | Single Core
Cinebench R20: CPU (Multi Core) | CPU (Single Core)
Cinebench R15: CPU Multi 64Bit | CPU Single 64Bit
Blender: v2.79 BMW27 CPU
7-Zip 18.03: 7z b 4 | 7z b 4 -mmt1
Geekbench 5.5: Multi-Core | Single-Core
HWBOT x265 Benchmark v2.2: 4k Preset
LibreOffice : 20 Documents To PDF
R Benchmark 2.5: Overall mean
* ... smaller is better
AIDA64: FP32 Ray-Trace | FPU Julia | CPU SHA3 | CPU Queen | FPU SinJulia | FPU Mandel | CPU AES | CPU ZLib | FP64 Ray-Trace | CPU PhotoWorxx
| Performance rating | |
| MSI Prestige 16 B1MG-001US | |
| Asus VivoBook Pro 16 K6602VU | |
| Average Intel Core Ultra 7 155H | |
| Dell Inspiron 16 Plus 7630 | |
| MSI Prestige 15 A12UD-093 | |
| LG Gram 2in1 16 16T90R - G.AA78G | |
| Lenovo ThinkBook 16 G6 ABP | |
| AIDA64 / FP32 Ray-Trace | |
| MSI Prestige 16 B1MG-001US | |
| Dell Inspiron 16 Plus 7630 | |
| Asus VivoBook Pro 16 K6602VU | |
| Average Intel Core Ultra 7 155H (6670 - 18470, n=50) | |
| Lenovo ThinkBook 16 G6 ABP | |
| MSI Prestige 15 A12UD-093 | |
| LG Gram 2in1 16 16T90R - G.AA78G | |
| LG Gram 2in1 16 16T90R - G.AA78G | |
| AIDA64 / FPU Julia | |
| MSI Prestige 16 B1MG-001US | |
| Asus VivoBook Pro 16 K6602VU | |
| Average Intel Core Ultra 7 155H (40905 - 93181, n=50) | |
| Lenovo ThinkBook 16 G6 ABP | |
| Dell Inspiron 16 Plus 7630 | |
| MSI Prestige 15 A12UD-093 | |
| LG Gram 2in1 16 16T90R - G.AA78G | |
| AIDA64 / CPU SHA3 | |
| MSI Prestige 16 B1MG-001US | |
| Asus VivoBook Pro 16 K6602VU | |
| Average Intel Core Ultra 7 155H (1940 - 4436, n=50) | |
| Dell Inspiron 16 Plus 7630 | |
| MSI Prestige 15 A12UD-093 | |
| LG Gram 2in1 16 16T90R - G.AA78G | |
| Lenovo ThinkBook 16 G6 ABP | |
| AIDA64 / CPU Queen | |
| Dell Inspiron 16 Plus 7630 | |
| Asus VivoBook Pro 16 K6602VU | |
| MSI Prestige 16 B1MG-001US | |
| Average Intel Core Ultra 7 155H (64698 - 94181, n=50) | |
| LG Gram 2in1 16 16T90R - G.AA78G | |
| MSI Prestige 15 A12UD-093 | |
| Lenovo ThinkBook 16 G6 ABP | |
| AIDA64 / FPU SinJulia | |
| MSI Prestige 16 B1MG-001US | |
| Lenovo ThinkBook 16 G6 ABP | |
| Average Intel Core Ultra 7 155H (5639 - 10647, n=50) | |
| Dell Inspiron 16 Plus 7630 | |
| Asus VivoBook Pro 16 K6602VU | |
| MSI Prestige 15 A12UD-093 | |
| LG Gram 2in1 16 16T90R - G.AA78G | |
| AIDA64 / FPU Mandel | |
| MSI Prestige 16 B1MG-001US | |
| Lenovo ThinkBook 16 G6 ABP | |
| Average Intel Core Ultra 7 155H (18236 - 47685, n=50) | |
| Asus VivoBook Pro 16 K6602VU | |
| Dell Inspiron 16 Plus 7630 | |
| MSI Prestige 15 A12UD-093 | |
| LG Gram 2in1 16 16T90R - G.AA78G | |
| AIDA64 / CPU AES | |
| Asus VivoBook Pro 16 K6602VU | |
| MSI Prestige 15 A12UD-093 | |
| LG Gram 2in1 16 16T90R - G.AA78G | |
| Average Intel Core Ultra 7 155H (45713 - 152179, n=50) | |
| MSI Prestige 16 B1MG-001US | |
| Dell Inspiron 16 Plus 7630 | |
| Lenovo ThinkBook 16 G6 ABP | |
| AIDA64 / CPU ZLib | |
| MSI Prestige 16 B1MG-001US | |
| Asus VivoBook Pro 16 K6602VU | |
| Average Intel Core Ultra 7 155H (557 - 1250, n=50) | |
| Dell Inspiron 16 Plus 7630 | |
| LG Gram 2in1 16 16T90R - G.AA78G | |
| MSI Prestige 15 A12UD-093 | |
| Lenovo ThinkBook 16 G6 ABP | |
| AIDA64 / FP64 Ray-Trace | |
| MSI Prestige 16 B1MG-001US | |
| Asus VivoBook Pro 16 K6602VU | |
| Dell Inspiron 16 Plus 7630 | |
| Average Intel Core Ultra 7 155H (3569 - 9802, n=50) | |
| Lenovo ThinkBook 16 G6 ABP | |
| MSI Prestige 15 A12UD-093 | |
| LG Gram 2in1 16 16T90R - G.AA78G | |
| AIDA64 / CPU PhotoWorxx | |
| Average Intel Core Ultra 7 155H (32719 - 54223, n=50) | |
| MSI Prestige 16 B1MG-001US | |
| MSI Prestige 15 A12UD-093 | |
| LG Gram 2in1 16 16T90R - G.AA78G | |
| Asus VivoBook Pro 16 K6602VU | |
| Dell Inspiron 16 Plus 7630 | |
| Lenovo ThinkBook 16 G6 ABP | |
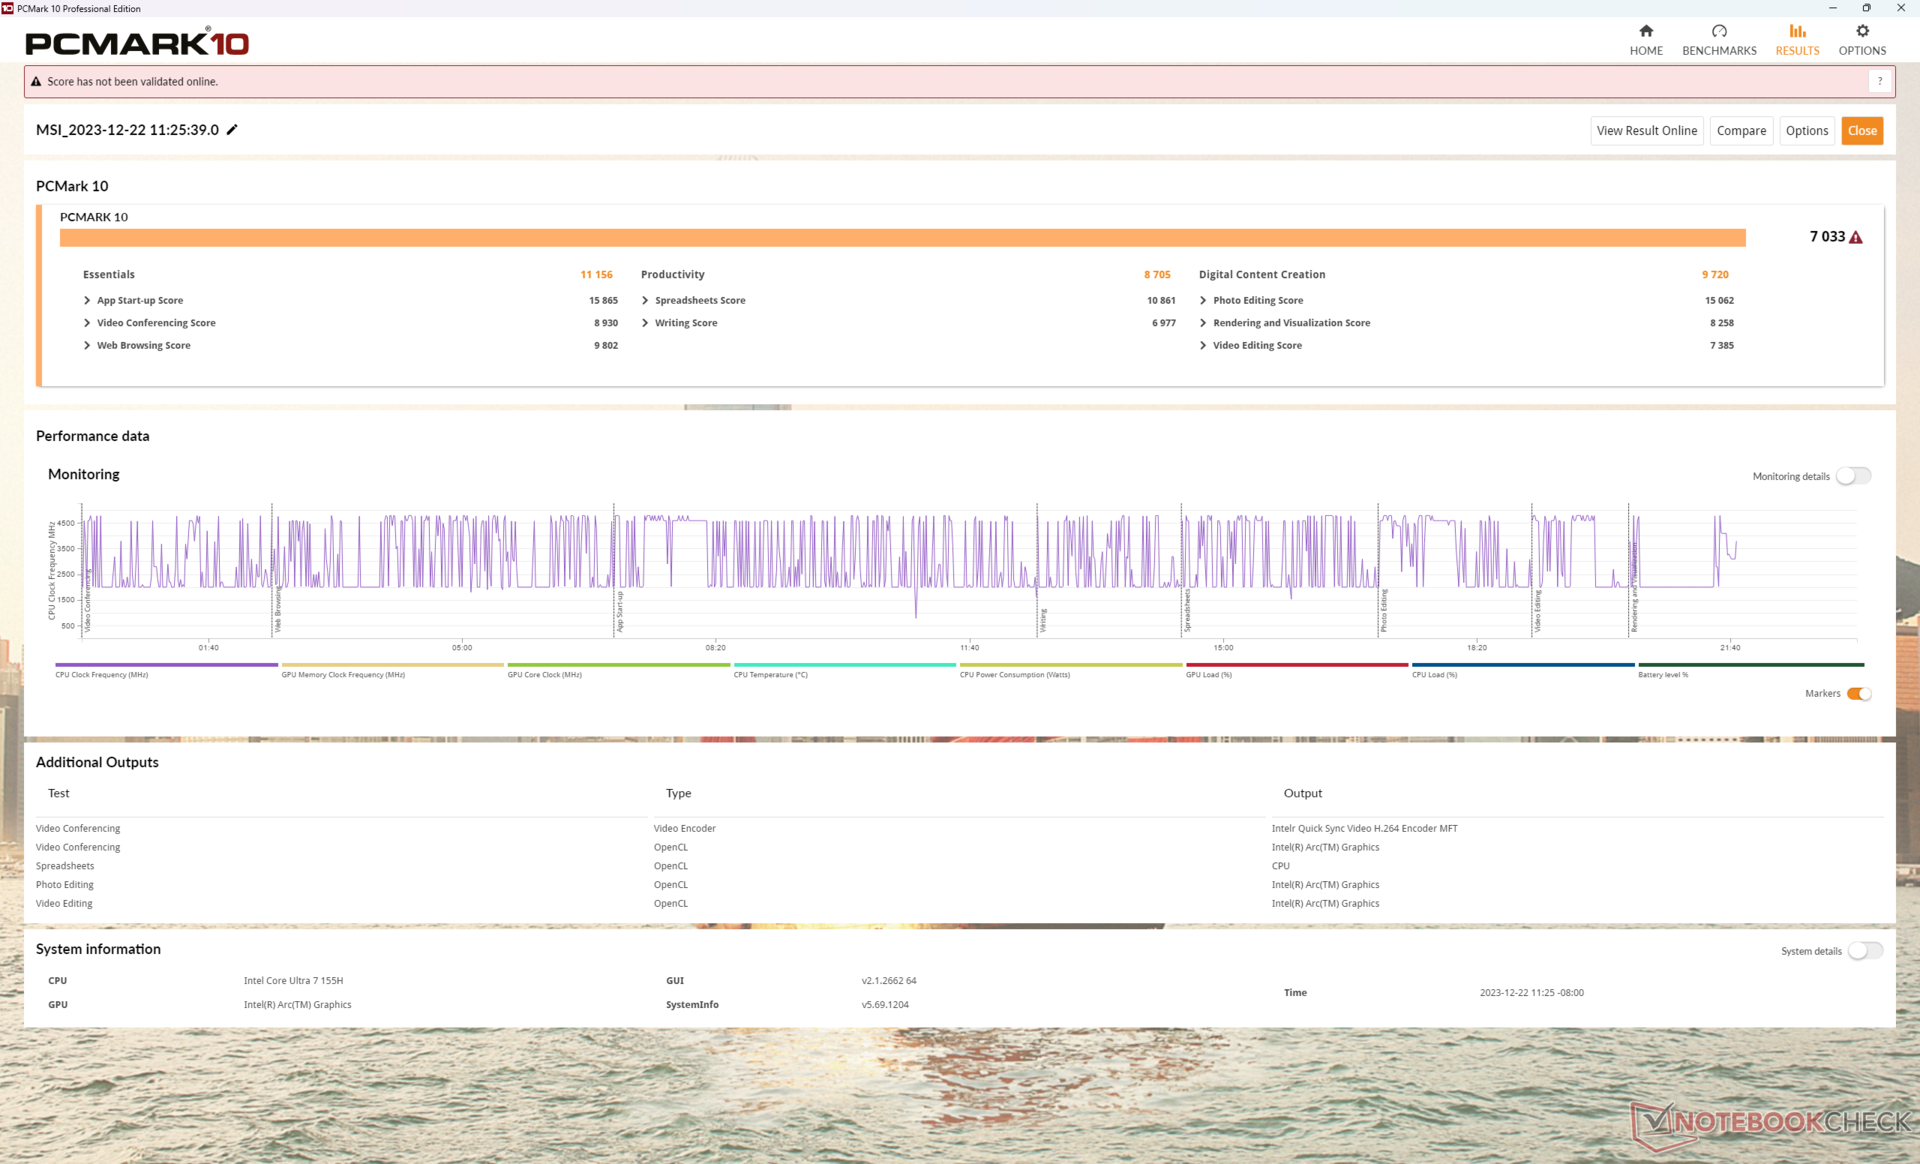
系统性能
PCMark 结果可与配备中端独立显卡的多媒体笔记本电脑媲美,例如 华硕 VivoBook Pro 16.不过,分数的意义值得商榷,因为 iGPU 和 dGPU 笔记本电脑之间的数据难以直接比较。
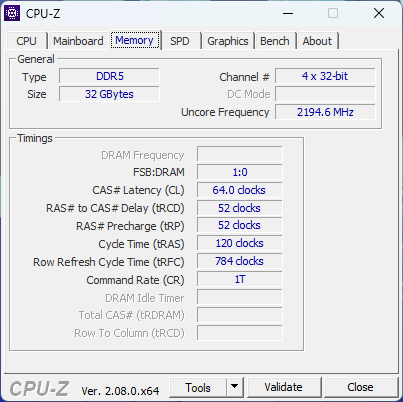
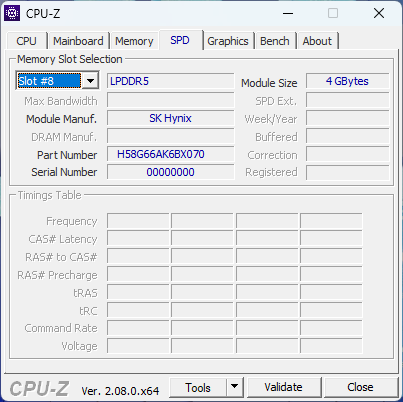
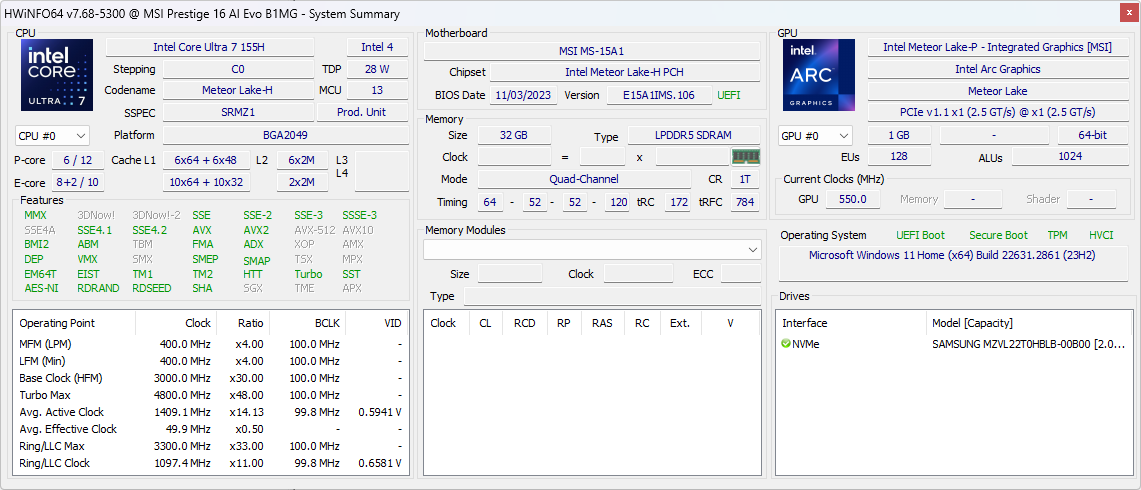
6400 MHz 快速系统内存值得一提,特别是因为 iGPU 性能与内存性能密切相关。
CrossMark: Overall | Productivity | Creativity | Responsiveness
WebXPRT 3: Overall
WebXPRT 4: Overall
Mozilla Kraken 1.1: Total
| PCMark 10 / Score | |
| Dell Inspiron 16 Plus 7630 | |
| Asus VivoBook Pro 16 K6602VU | |
| MSI Prestige 16 B1MG-001US | |
| Average Intel Core Ultra 7 155H, Intel Arc 8-Core iGPU (4809 - 7529, n=34) | |
| MSI Prestige 15 A12UD-093 | |
| Lenovo ThinkBook 16 G6 ABP | |
| LG Gram 2in1 16 16T90R - G.AA78G | |
| PCMark 10 / Essentials | |
| LG Gram 2in1 16 16T90R - G.AA78G | |
| Dell Inspiron 16 Plus 7630 | |
| MSI Prestige 16 B1MG-001US | |
| Lenovo ThinkBook 16 G6 ABP | |
| Average Intel Core Ultra 7 155H, Intel Arc 8-Core iGPU (7605 - 11289, n=34) | |
| Asus VivoBook Pro 16 K6602VU | |
| MSI Prestige 15 A12UD-093 | |
| PCMark 10 / Productivity | |
| Dell Inspiron 16 Plus 7630 | |
| Lenovo ThinkBook 16 G6 ABP | |
| MSI Prestige 15 A12UD-093 | |
| MSI Prestige 16 B1MG-001US | |
| Asus VivoBook Pro 16 K6602VU | |
| Average Intel Core Ultra 7 155H, Intel Arc 8-Core iGPU (6042 - 10591, n=34) | |
| LG Gram 2in1 16 16T90R - G.AA78G | |
| PCMark 10 / Digital Content Creation | |
| Dell Inspiron 16 Plus 7630 | |
| Asus VivoBook Pro 16 K6602VU | |
| MSI Prestige 16 B1MG-001US | |
| Average Intel Core Ultra 7 155H, Intel Arc 8-Core iGPU (4985 - 10709, n=34) | |
| MSI Prestige 15 A12UD-093 | |
| LG Gram 2in1 16 16T90R - G.AA78G | |
| Lenovo ThinkBook 16 G6 ABP | |
| CrossMark / Overall | |
| Dell Inspiron 16 Plus 7630 | |
| MSI Prestige 16 B1MG-001US | |
| Asus VivoBook Pro 16 K6602VU | |
| MSI Prestige 15 A12UD-093 | |
| Average Intel Core Ultra 7 155H, Intel Arc 8-Core iGPU (1366 - 1903, n=34) | |
| LG Gram 2in1 16 16T90R - G.AA78G | |
| Lenovo ThinkBook 16 G6 ABP | |
| CrossMark / Productivity | |
| Dell Inspiron 16 Plus 7630 | |
| MSI Prestige 16 B1MG-001US | |
| Asus VivoBook Pro 16 K6602VU | |
| MSI Prestige 15 A12UD-093 | |
| Average Intel Core Ultra 7 155H, Intel Arc 8-Core iGPU (1291 - 1798, n=33) | |
| LG Gram 2in1 16 16T90R - G.AA78G | |
| Lenovo ThinkBook 16 G6 ABP | |
| CrossMark / Creativity | |
| Dell Inspiron 16 Plus 7630 | |
| MSI Prestige 16 B1MG-001US | |
| Asus VivoBook Pro 16 K6602VU | |
| Average Intel Core Ultra 7 155H, Intel Arc 8-Core iGPU (1519 - 1929, n=33) | |
| MSI Prestige 15 A12UD-093 | |
| LG Gram 2in1 16 16T90R - G.AA78G | |
| Lenovo ThinkBook 16 G6 ABP | |
| CrossMark / Responsiveness | |
| MSI Prestige 15 A12UD-093 | |
| Dell Inspiron 16 Plus 7630 | |
| MSI Prestige 16 B1MG-001US | |
| Asus VivoBook Pro 16 K6602VU | |
| LG Gram 2in1 16 16T90R - G.AA78G | |
| Average Intel Core Ultra 7 155H, Intel Arc 8-Core iGPU (939 - 1802, n=33) | |
| Lenovo ThinkBook 16 G6 ABP | |
| WebXPRT 3 / Overall | |
| Dell Inspiron 16 Plus 7630 | |
| MSI Prestige 16 B1MG-001US | |
| Average Intel Core Ultra 7 155H, Intel Arc 8-Core iGPU (252 - 299, n=34) | |
| Lenovo ThinkBook 16 G6 ABP | |
| LG Gram 2in1 16 16T90R - G.AA78G | |
| MSI Prestige 15 A12UD-093 | |
| WebXPRT 4 / Overall | |
| Dell Inspiron 16 Plus 7630 | |
| MSI Prestige 16 B1MG-001US | |
| Average Intel Core Ultra 7 155H, Intel Arc 8-Core iGPU (166.4 - 309, n=29) | |
| Asus VivoBook Pro 16 K6602VU | |
| Lenovo ThinkBook 16 G6 ABP | |
| Mozilla Kraken 1.1 / Total | |
| MSI Prestige 15 A12UD-093 | |
| LG Gram 2in1 16 16T90R - G.AA78G | |
| Lenovo ThinkBook 16 G6 ABP | |
| Asus VivoBook Pro 16 K6602VU | |
| Average Intel Core Ultra 7 155H, Intel Arc 8-Core iGPU (517 - 614, n=35) | |
| MSI Prestige 16 B1MG-001US | |
| Dell Inspiron 16 Plus 7630 | |
* ... smaller is better
| PCMark 10 Score | 7033 points | |
Help | ||
| AIDA64 / Memory Copy | |
| Average Intel Core Ultra 7 155H (62397 - 96791, n=50) | |
| MSI Prestige 16 B1MG-001US | |
| MSI Prestige 15 A12UD-093 | |
| LG Gram 2in1 16 16T90R - G.AA78G | |
| Dell Inspiron 16 Plus 7630 | |
| Asus VivoBook Pro 16 K6602VU | |
| Lenovo ThinkBook 16 G6 ABP | |
| AIDA64 / Memory Read | |
| Average Intel Core Ultra 7 155H (60544 - 90647, n=50) | |
| MSI Prestige 16 B1MG-001US | |
| Dell Inspiron 16 Plus 7630 | |
| Asus VivoBook Pro 16 K6602VU | |
| MSI Prestige 15 A12UD-093 | |
| LG Gram 2in1 16 16T90R - G.AA78G | |
| Lenovo ThinkBook 16 G6 ABP | |
| AIDA64 / Memory Write | |
| LG Gram 2in1 16 16T90R - G.AA78G | |
| MSI Prestige 16 B1MG-001US | |
| Average Intel Core Ultra 7 155H (58692 - 93451, n=50) | |
| MSI Prestige 15 A12UD-093 | |
| Asus VivoBook Pro 16 K6602VU | |
| Dell Inspiron 16 Plus 7630 | |
| Lenovo ThinkBook 16 G6 ABP | |
| AIDA64 / Memory Latency | |
| Average Intel Core Ultra 7 155H (116.2 - 233, n=50) | |
| MSI Prestige 16 B1MG-001US | |
| LG Gram 2in1 16 16T90R - G.AA78G | |
| MSI Prestige 15 A12UD-093 | |
| Lenovo ThinkBook 16 G6 ABP | |
| Dell Inspiron 16 Plus 7630 | |
| Asus VivoBook Pro 16 K6602VU | |
* ... smaller is better
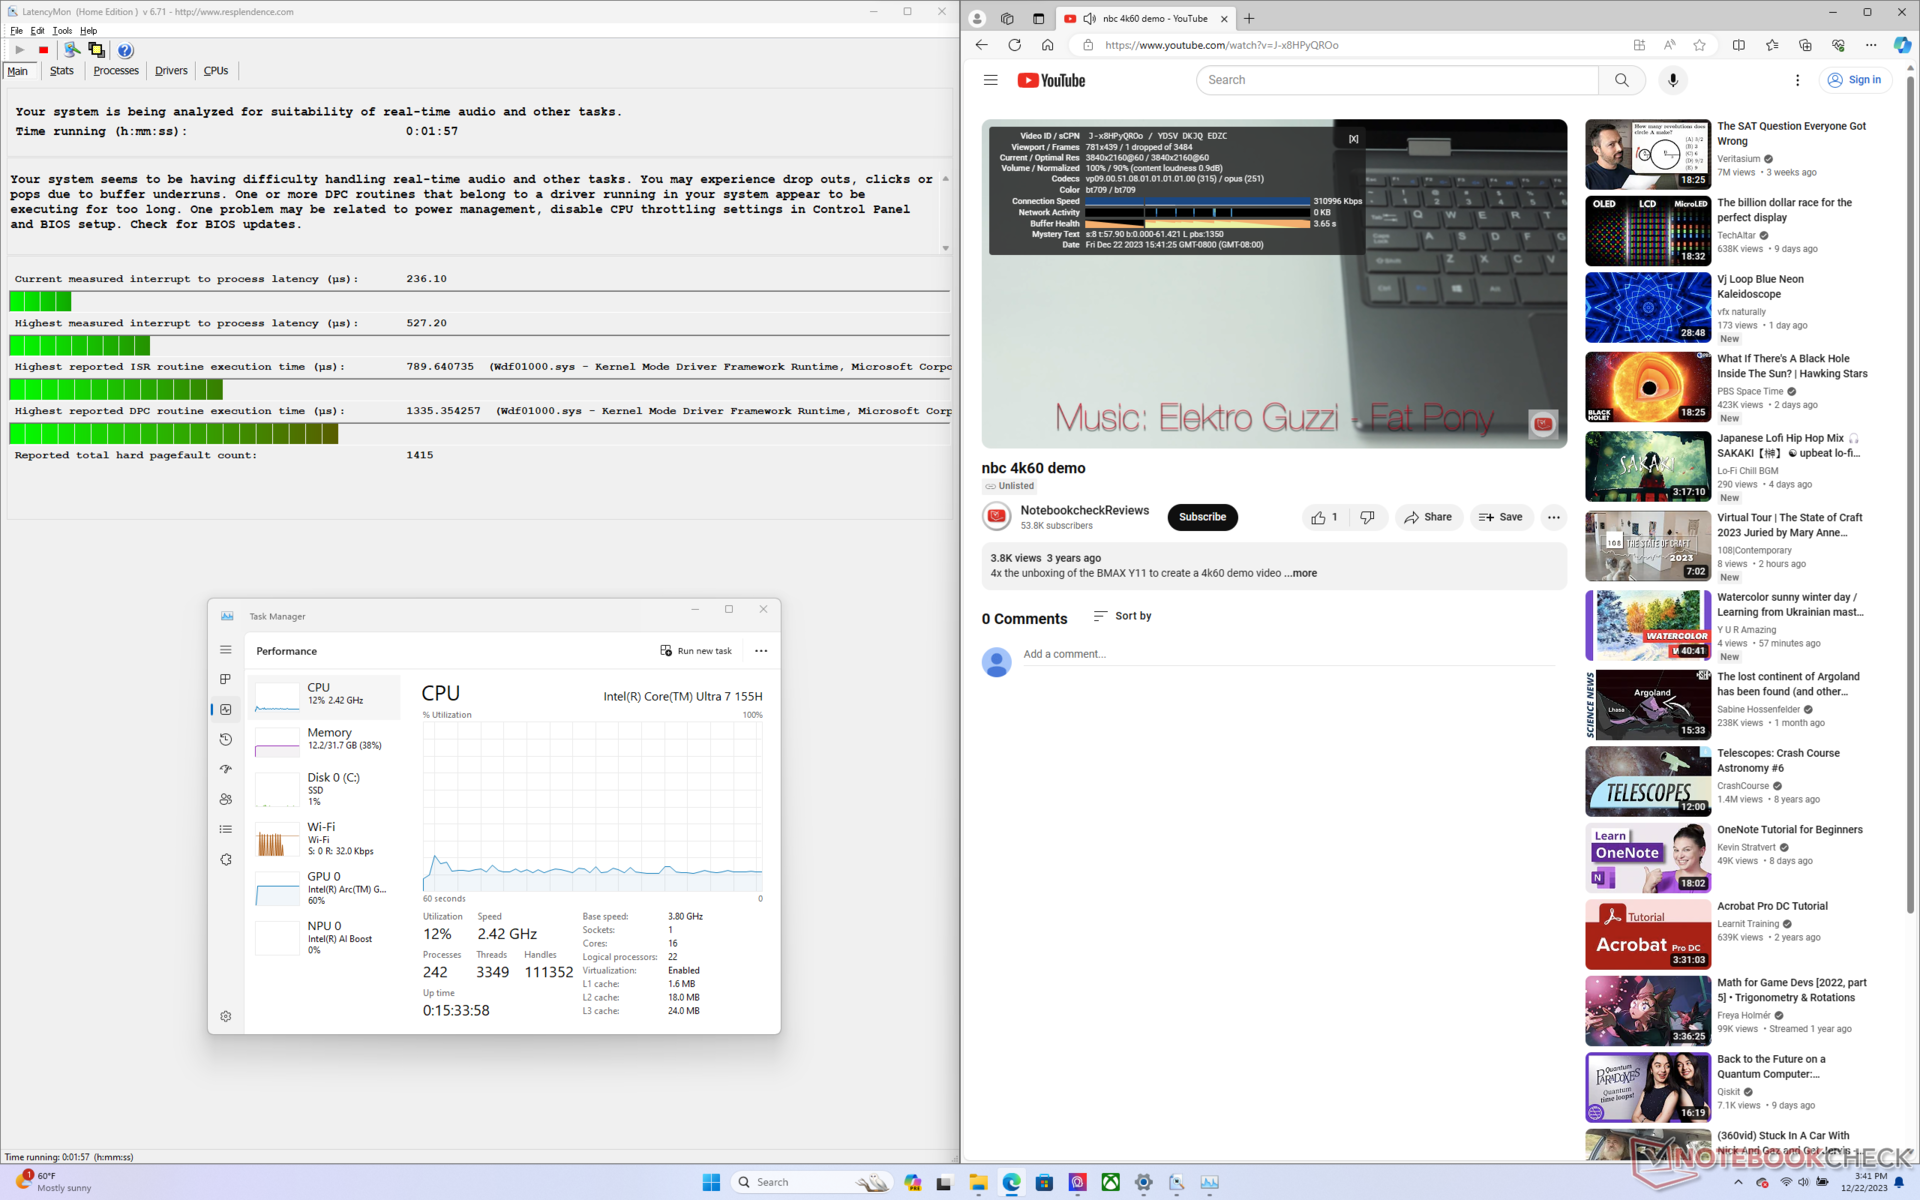
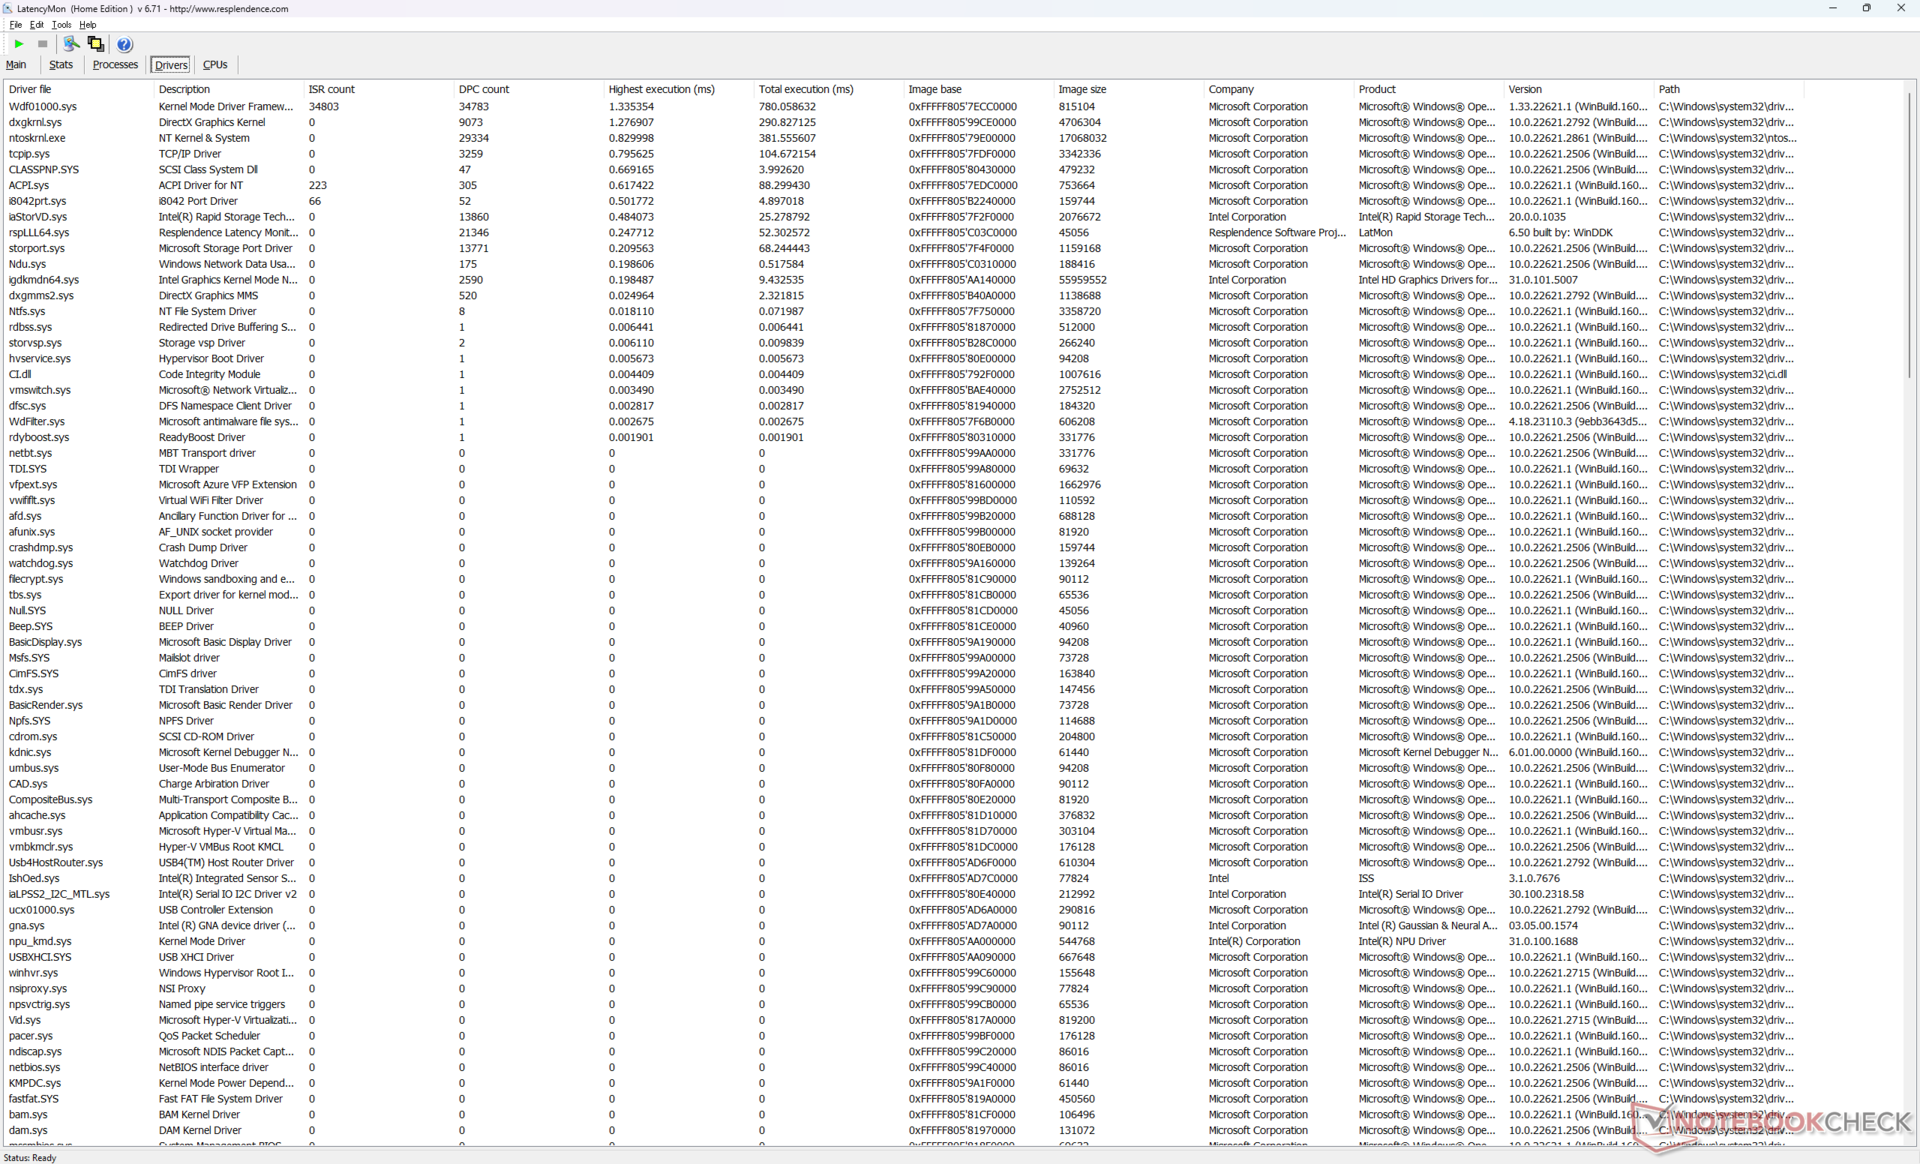
DPC 延迟
在打开我们主页的多个浏览器标签页时,LatencyMon 仅显示出轻微的 DPC 问题。60 FPS 的 4K 视频回放几乎完美,在 60 秒的测试视频中仅记录到一个丢帧。
| DPC Latencies / LatencyMon - interrupt to process latency (max), Web, Youtube, Prime95 | |
| LG Gram 2in1 16 16T90R - G.AA78G | |
| Asus VivoBook Pro 16 K6602VU | |
| MSI Prestige 15 A12UD-093 | |
| Lenovo ThinkBook 16 G6 ABP | |
| Dell Inspiron 16 Plus 7630 | |
| MSI Prestige 16 B1MG-001US | |
* ... smaller is better
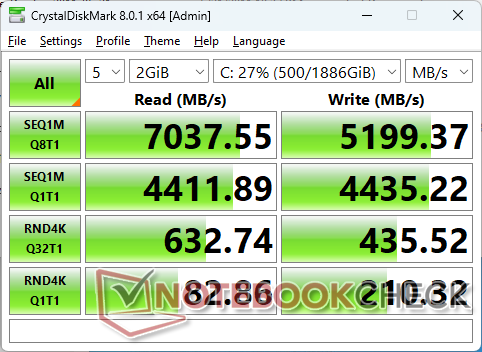
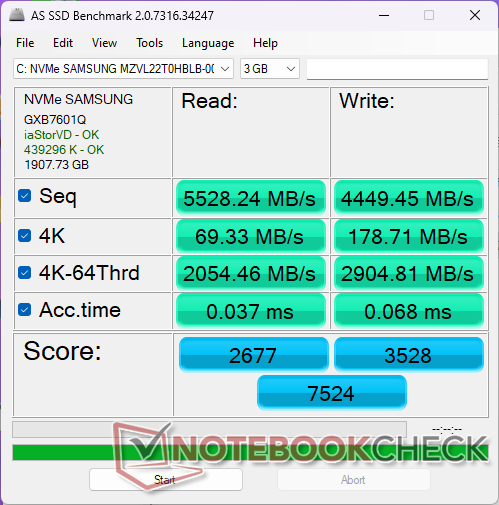
存储设备
我们的设备配备了 2 TB 三星 PM9A1这是目前最快的消费级 PCIe4 x4 NVMe 固态硬盘之一,也是我们旧款 Prestige 15 上的美光 3400 的升级版。即使在压力下,该硬盘也能保持 ~7100 MB/s 的速度,考虑到机箱的轻薄,这一点令人印象深刻。

| Drive Performance rating - Percent | |
| MSI Prestige 16 B1MG-001US | |
| LG Gram 2in1 16 16T90R - G.AA78G | |
| MSI Prestige 15 A12UD-093 | |
| Dell Inspiron 16 Plus 7630 | |
| Lenovo ThinkBook 16 G6 ABP | |
| Asus VivoBook Pro 16 K6602VU | |
* ... smaller is better
Disk Throttling: DiskSpd Read Loop, Queue Depth 8
图形处理器性能 - 重夺集成显卡桂冠
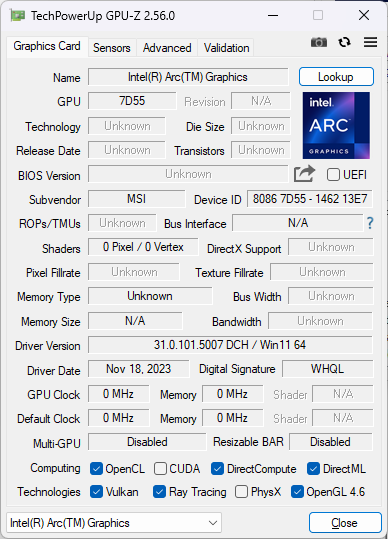
在经历了过去几年的停滞不前之后,英特尔终于对其集成 GPU 进行了改进,以增强其与竞争对手的竞争力 Radeon 680M和 780M 系列的竞争中更具竞争力。我们的 弧 8在支持 DX12 的游戏中领先 Radeon 780M 约 20%,甚至高达 50%。从普通 Iris Xe 96 EUs的用户,原始性能有望提升约 1.5 倍至 2 倍。虽然还达不到GeForce RTX 3050 Ti 的水平,但其性能绝对已接近 GeForce RTX 2050.
| 电源配置文件 | 物理分数 | 图形分数 | 综合得分 |
| 极致性能(开启 Cooler Boost) | 26439 | 8796 | 3242 |
| 极致性能(关闭冷却器增强功能) | 26460 (-0%) | 8614 (-2%) | 3187 (-2%) |
| 平衡模式 | 25110 (-5%) | 8814 (-0%) | 3306 (-0%) |
| 电池模式 | 21717 (-18%) | 7425 (-16%) | 2761 (-15%) |
根据我们的Fire Strike 结果表,启用 Cooler Boost 似乎不会对性能产生重大影响。在平衡模式下运行仅会对 CPU 性能产生轻微影响,而在电池模式下运行则会使性能大幅降低约 15%。
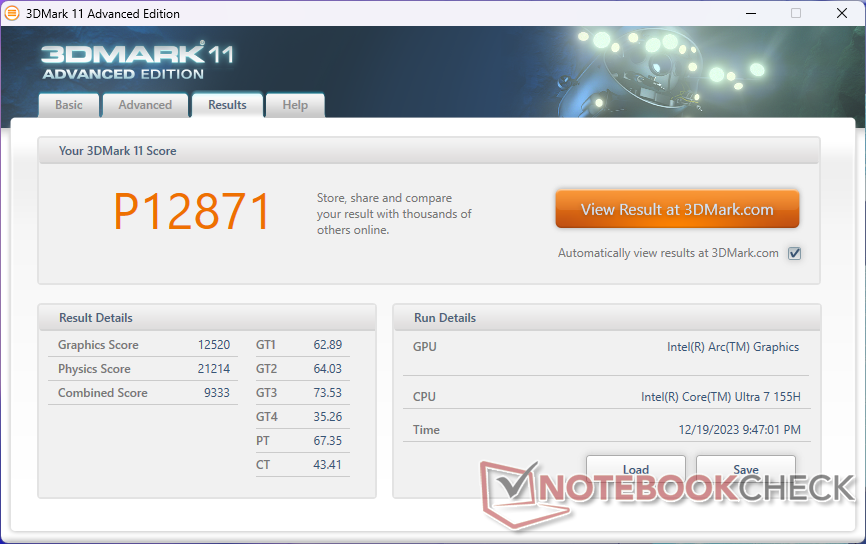
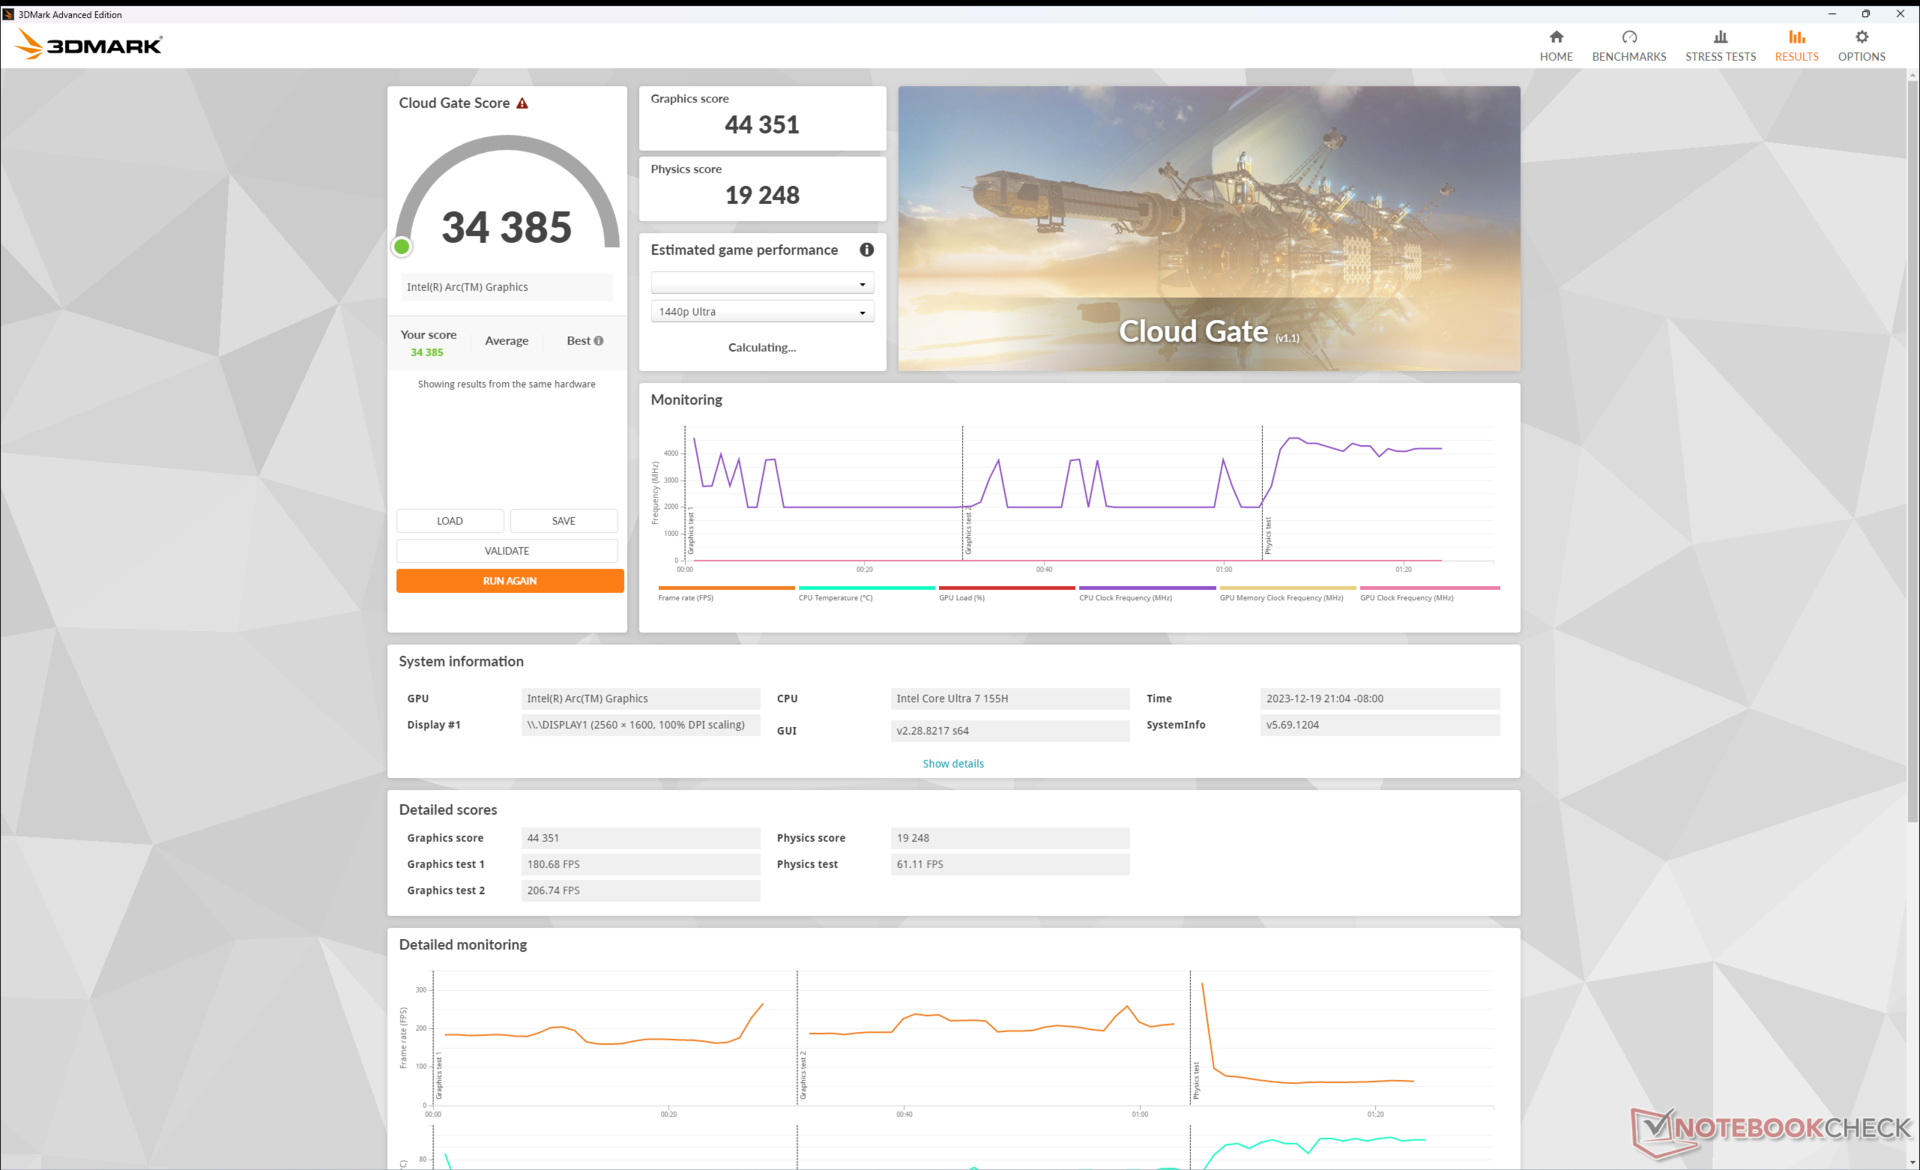
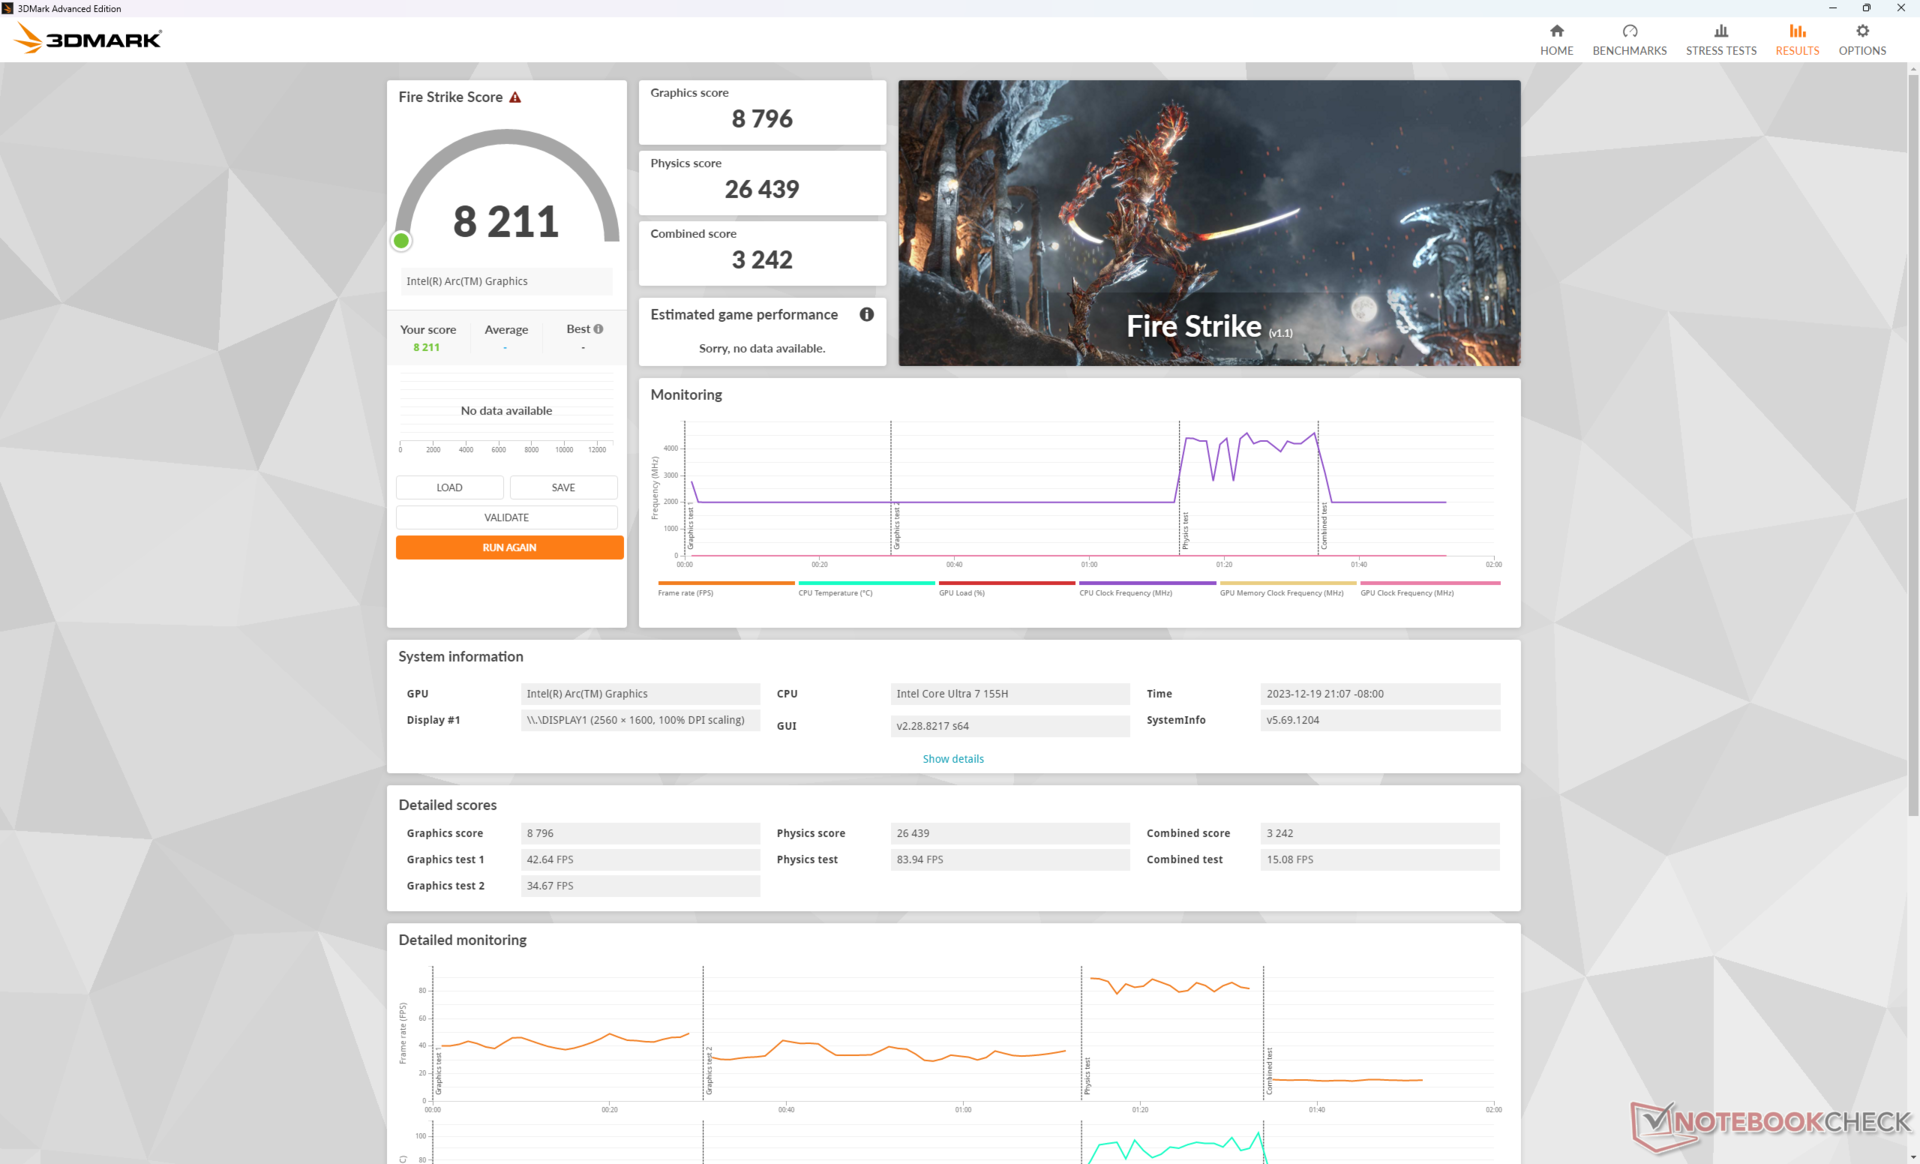
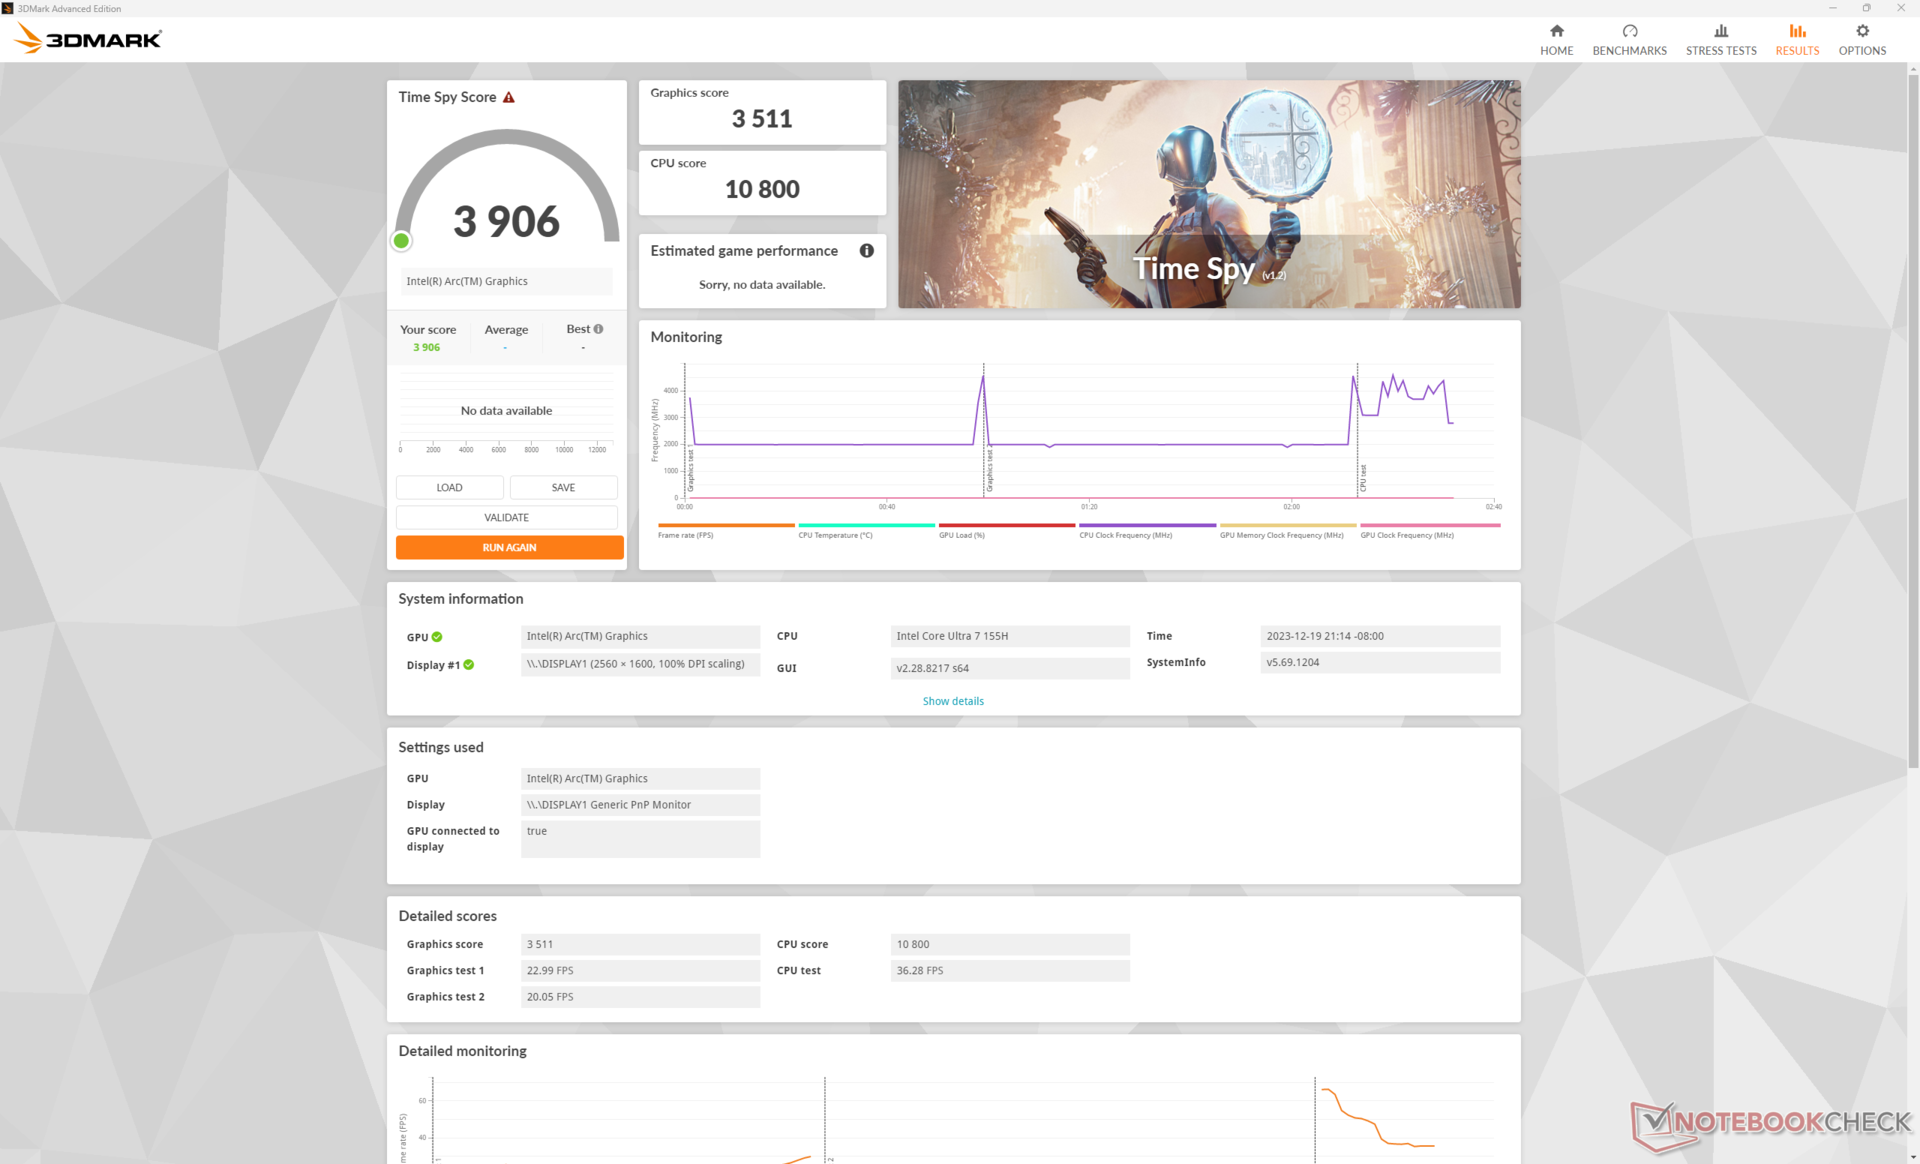
| 3DMark 11 Performance | 12871 points | |
| 3DMark Cloud Gate Standard Score | 34385 points | |
| 3DMark Fire Strike Score | 8211 points | |
| 3DMark Time Spy Score | 3906 points | |
Help | ||
* ... smaller is better
游戏性能
运行游戏时的实际性能非常出色,可与 GeForce 3050 Ti从上面的合成基准测试结果可以看出,其性能可与去年的 Prestige 15 中的 3050 Ti 相媲美。例如,《Far Cry 5》和《F1 22》的性能仅为 Prestige 15 的 5%至 15%。请记住,Prestige 15 中的GeForce GPU 会出现值得注意的节流问题,这对其性能影响很大;绝大多数其他GeForce RTX 3050 Ti 笔记本电脑,如 华硕 Vivobook Pro 16X运行游戏的速度仍然明显快于我们集成的 Arc 8。
不过,在所有测试游戏中,总体性能始终比 Radeon 780M 高出 5% 到 20%。一些 DX12 游戏,如《Tiny Tina's Wonderlands》和《F1 22》,在新的英特尔 GPU 上运行时甚至能提高 50% 到 60%。
| The Witcher 3 - 1920x1080 Ultra Graphics & Postprocessing (HBAO+) | |
| Dell Inspiron 16 Plus 7630 | |
| Asus VivoBook Pro 16 K6602VU | |
| MSI Prestige 16 B1MG-001US | |
| MSI Prestige 15 A12UD-093 | |
| LG Gram 2in1 16 16T90R - G.AA78G | |
| Lenovo ThinkBook 16 G6 ABP | |
| GTA V - 1920x1080 Highest AA:4xMSAA + FX AF:16x | |
| Asus VivoBook Pro 16 K6602VU | |
| MSI Prestige 15 A12UD-093 | |
| Lenovo ThinkBook 16 G6 ABP | |
| LG Gram 2in1 16 16T90R - G.AA78G | |
| Final Fantasy XV Benchmark - 1920x1080 High Quality | |
| Dell Inspiron 16 Plus 7630 | |
| Asus VivoBook Pro 16 K6602VU | |
| MSI Prestige 16 B1MG-001US | |
| MSI Prestige 15 A12UD-093 | |
| LG Gram 2in1 16 16T90R - G.AA78G | |
| Lenovo ThinkBook 16 G6 ABP | |
| Strange Brigade - 1920x1080 ultra AA:ultra AF:16 | |
| Dell Inspiron 16 Plus 7630 | |
| Asus VivoBook Pro 16 K6602VU | |
| MSI Prestige 16 B1MG-001US | |
| MSI Prestige 15 A12UD-093 | |
| LG Gram 2in1 16 16T90R - G.AA78G | |
| Lenovo ThinkBook 16 G6 ABP | |
| Dota 2 Reborn - 1920x1080 ultra (3/3) best looking | |
| Dell Inspiron 16 Plus 7630 | |
| Asus VivoBook Pro 16 K6602VU | |
| MSI Prestige 16 B1MG-001US | |
| MSI Prestige 15 A12UD-093 | |
| LG Gram 2in1 16 16T90R - G.AA78G | |
| Lenovo ThinkBook 16 G6 ABP | |
| X-Plane 11.11 - 1920x1080 high (fps_test=3) | |
| Dell Inspiron 16 Plus 7630 | |
| Asus VivoBook Pro 16 K6602VU | |
| MSI Prestige 15 A12UD-093 | |
| LG Gram 2in1 16 16T90R - G.AA78G | |
| MSI Prestige 16 B1MG-001US | |
| Lenovo ThinkBook 16 G6 ABP | |
| Baldur's Gate 3 | |
| 1280x720 Low Preset AA:SM | |
| MSI Prestige 16 B1MG-001US | |
| Average Intel Arc 8-Core iGPU (31.8 - 57.6, n=15) | |
| 1920x1080 Low Preset AA:SM | |
| MSI Prestige 16 B1MG-001US | |
| Average Intel Arc 8-Core iGPU (21 - 40.3, n=27) | |
| 1920x1080 Medium Preset AA:T | |
| MSI Prestige 16 B1MG-001US | |
| Average Intel Arc 8-Core iGPU (16.3 - 31.1, n=28) | |
| 1920x1080 High Preset AA:T | |
| MSI Prestige 16 B1MG-001US | |
| Average Intel Arc 8-Core iGPU (15.4 - 27.7, n=27) | |
| 1920x1080 Ultra Preset AA:T | |
| MSI Prestige 16 B1MG-001US | |
| Average Intel Arc 8-Core iGPU (14.2 - 26.2, n=26) | |
| Cyberpunk 2077 | |
| 1280x720 Low Preset (FSR off) | |
| MSI Prestige 16 B1MG-001US | |
| Average Intel Arc 8-Core iGPU (34.5 - 58, n=20) | |
| LG Gram 2in1 16 16T90R - G.AA78G | |
| 1920x1080 Low Preset (FSR off) | |
| MSI Prestige 16 B1MG-001US | |
| Average Intel Arc 8-Core iGPU (11.3 - 38, n=38) | |
| LG Gram 2in1 16 16T90R - G.AA78G | |
| 1920x1080 Medium Preset (FSR off) | |
| MSI Prestige 16 B1MG-001US | |
| Average Intel Arc 8-Core iGPU (9.42 - 31.4, n=36) | |
| LG Gram 2in1 16 16T90R - G.AA78G | |
| 1920x1080 High Preset (FSR off) | |
| MSI Prestige 16 B1MG-001US | |
| Average Intel Arc 8-Core iGPU (7.3 - 27.6, n=36) | |
| LG Gram 2in1 16 16T90R - G.AA78G | |
| 1920x1080 Ultra Preset (FSR off) | |
| MSI Prestige 16 B1MG-001US | |
| Average Intel Arc 8-Core iGPU (13 - 24.7, n=28) | |
| LG Gram 2in1 16 16T90R - G.AA78G | |
Witcher 3 FPS Chart
| low | med. | high | ultra | |
|---|---|---|---|---|
| The Witcher 3 (2015) | 135.6 | 88.2 | 54.1 | 25.2 |
| Dota 2 Reborn (2015) | 101.7 | 92.8 | 79.1 | 75.6 |
| Final Fantasy XV Benchmark (2018) | 61 | 37.3 | 24.6 | |
| X-Plane 11.11 (2018) | 52.2 | 46.7 | 37.8 | |
| Far Cry 5 (2018) | 63 | 39 | 36 | 34 |
| Strange Brigade (2018) | 179.5 | 71 | 57.8 | 46.1 |
| Tiny Tina's Wonderlands (2022) | 53.3 | 41.2 | 30.1 | 25.1 |
| F1 22 (2022) | 77.7 | 71.6 | 53.3 | 15.3 |
| Baldur's Gate 3 (2023) | 31.9 | 28.2 | 24.1 | 23.4 |
| Cyberpunk 2077 (2023) | 35.7 | 29.5 | 25.2 | 22.1 |
排放--对于集成显卡的笔记本电脑来说太吵了
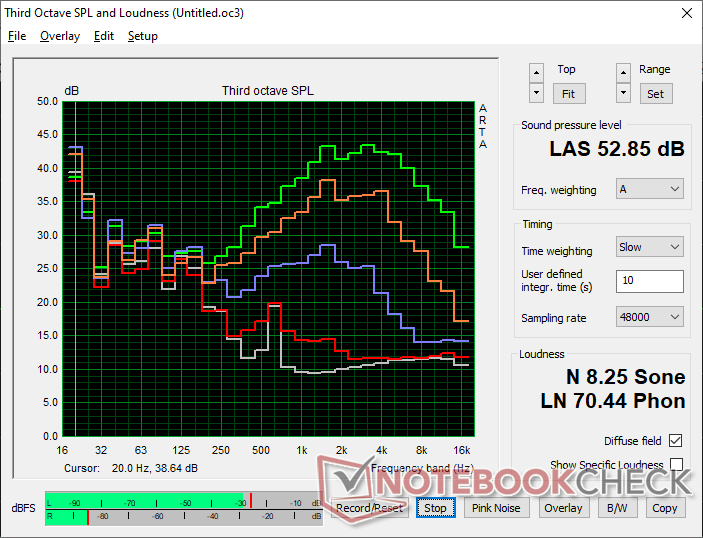
系统噪音
风扇噪音比 威望 15在低负载运行时,风扇噪音比 Prestige 15 更小,而在高负载运行时则相反。例如,在浏览或视频流媒体时,风扇噪音往往在 26 至 37 dB(A)之间,而旧机型则在 31 至 42 dB(A)之间。运行要求较高的负载,如 Witcher 3等高负荷运行时,风扇噪音会增加到 46 dB(A),如果启动 Cooler Boost,噪音甚至会达到 53 dB(A)。对于仅使用集成显卡运行的笔记本电脑来说,40 分贝(A)左右的噪音是相当大的。
我们希望配备独立显卡的产品的风扇噪音表现与我们在 iGPU 测试机上体验到的不同。
Noise level
| Idle |
| 24.5 / 26.3 / 26.3 dB(A) |
| Load |
| 36.5 / 52.9 dB(A) |
 | ||
30 dB silent 40 dB(A) audible 50 dB(A) loud |
||
min: | ||
| MSI Prestige 16 B1MG-001US Arc 8-Core, Ultra 7 155H, Samsung PM9A1 MZVL22T0HBLB | MSI Prestige 15 A12UD-093 GeForce RTX 3050 Ti Laptop GPU, i7-1280P, Micron 3400 1TB MTFDKBA1T0TFH | LG Gram 2in1 16 16T90R - G.AA78G Iris Xe G7 96EUs, i7-1360P, Samsung PM9A1 MZVL21T0HCLR | Lenovo ThinkBook 16 G6 ABP Vega 7, R5 7530U, SK hynix HFS512GEJ9X125N | Asus VivoBook Pro 16 K6602VU GeForce RTX 4050 Laptop GPU, i9-13900H, Micron 2400 MTFDKBA1T0QFM | Dell Inspiron 16 Plus 7630 GeForce RTX 4060 Laptop GPU, i7-13700H, WD PC SN740 SDDPTQD-1T00 | |
|---|---|---|---|---|---|---|
| Noise | -6% | 8% | 13% | -4% | 4% | |
| off / environment * (dB) | 24.5 | 26 -6% | 25.1 -2% | 24.3 1% | 20.96 14% | 23.2 5% |
| Idle Minimum * (dB) | 24.5 | 26 -6% | 25.1 -2% | 24.3 1% | 25.28 -3% | 23.2 5% |
| Idle Average * (dB) | 26.3 | 30.7 -17% | 25.1 5% | 24.3 8% | 25.28 4% | 23.2 12% |
| Idle Maximum * (dB) | 26.3 | 30.7 -17% | 26.1 1% | 24.3 8% | 25.28 4% | 23.2 12% |
| Load Average * (dB) | 36.5 | 41.9 -15% | 31.4 14% | 29.7 19% | 51.88 -42% | 35.1 4% |
| Witcher 3 ultra * (dB) | 46.3 | 41.1 11% | 32.1 31% | 49 -6% | 52.5 -13% | |
| Load Maximum * (dB) | 52.9 | 40.7 23% | 36.6 31% | 41.4 22% | 51.8 2% | 52.5 1% |
* ... smaller is better
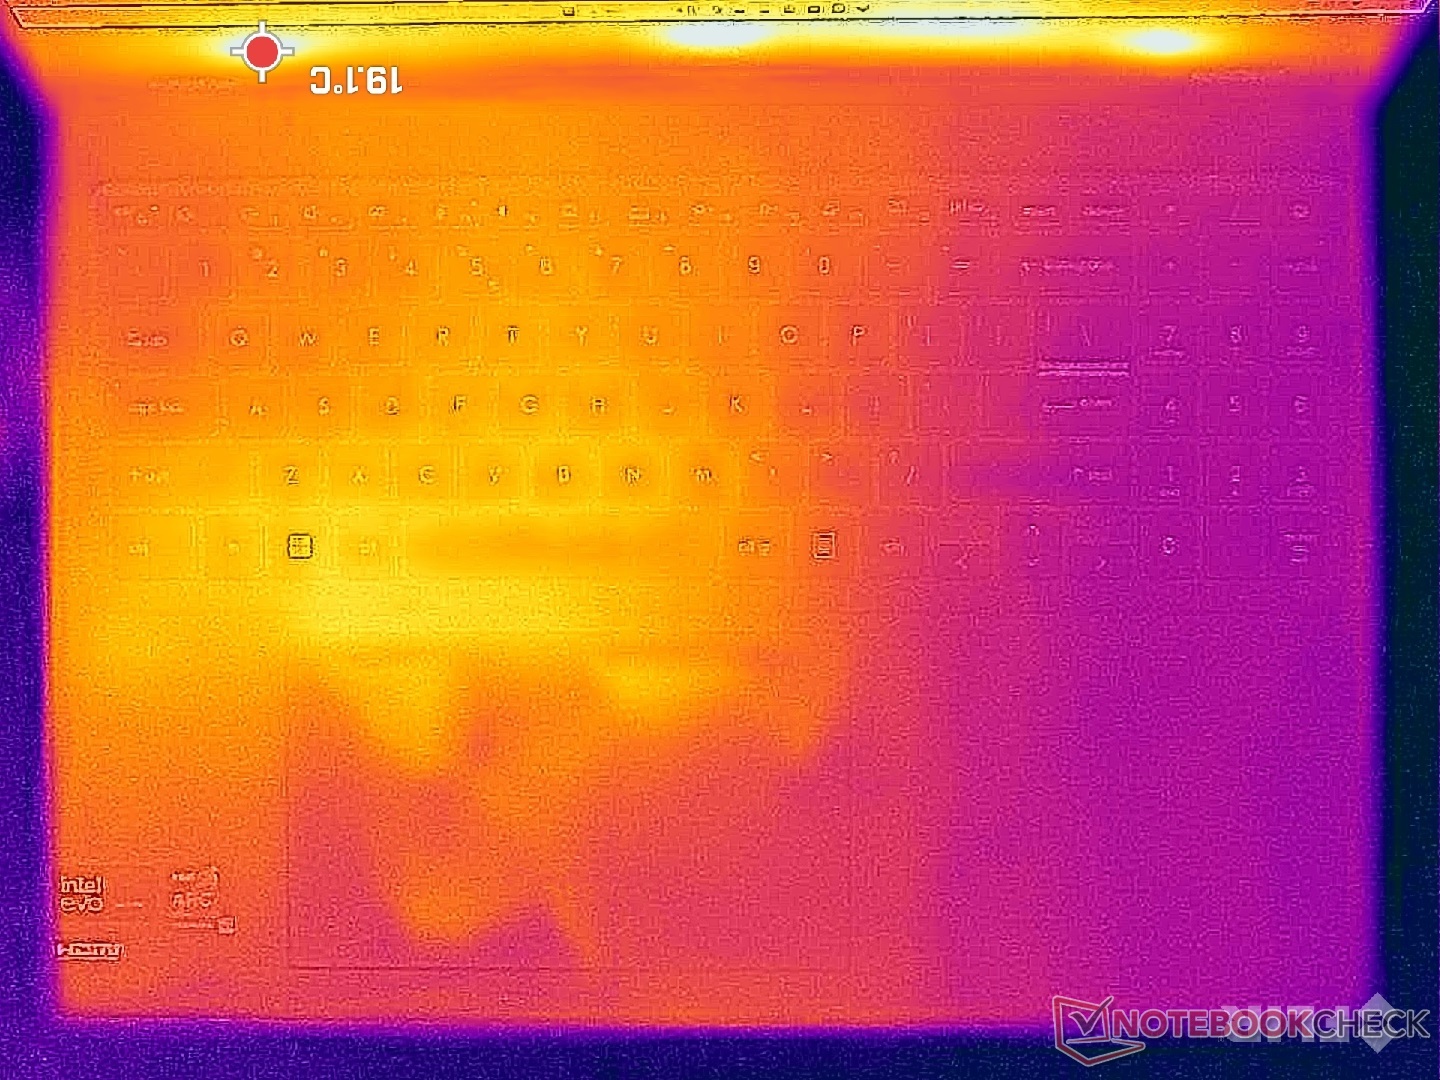
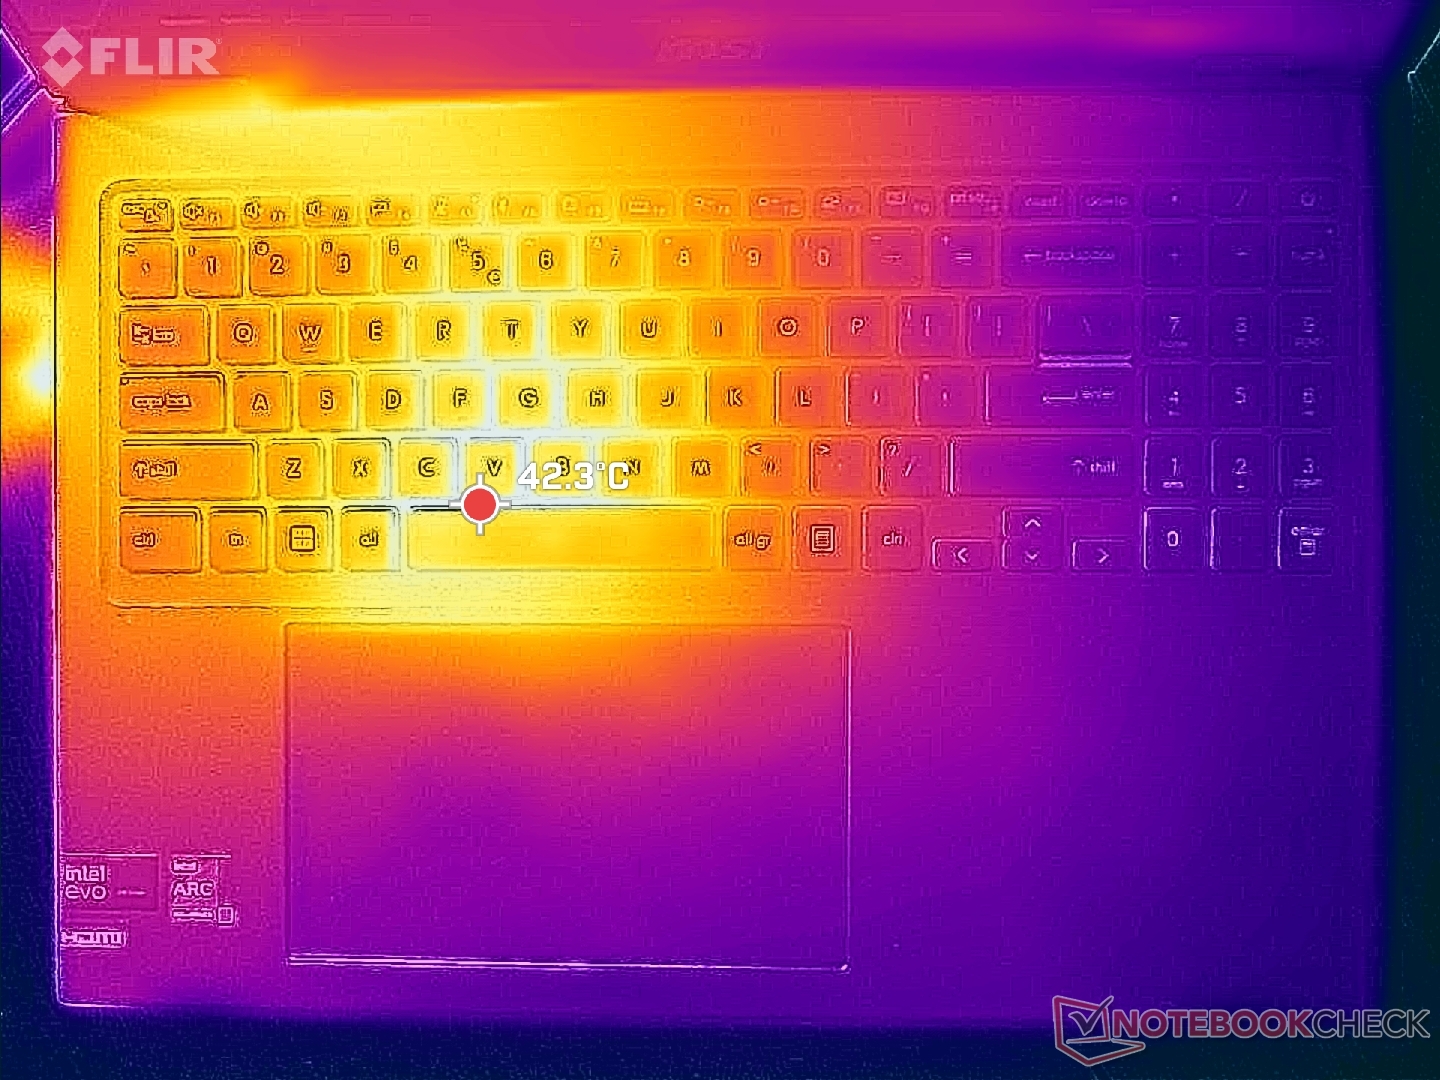
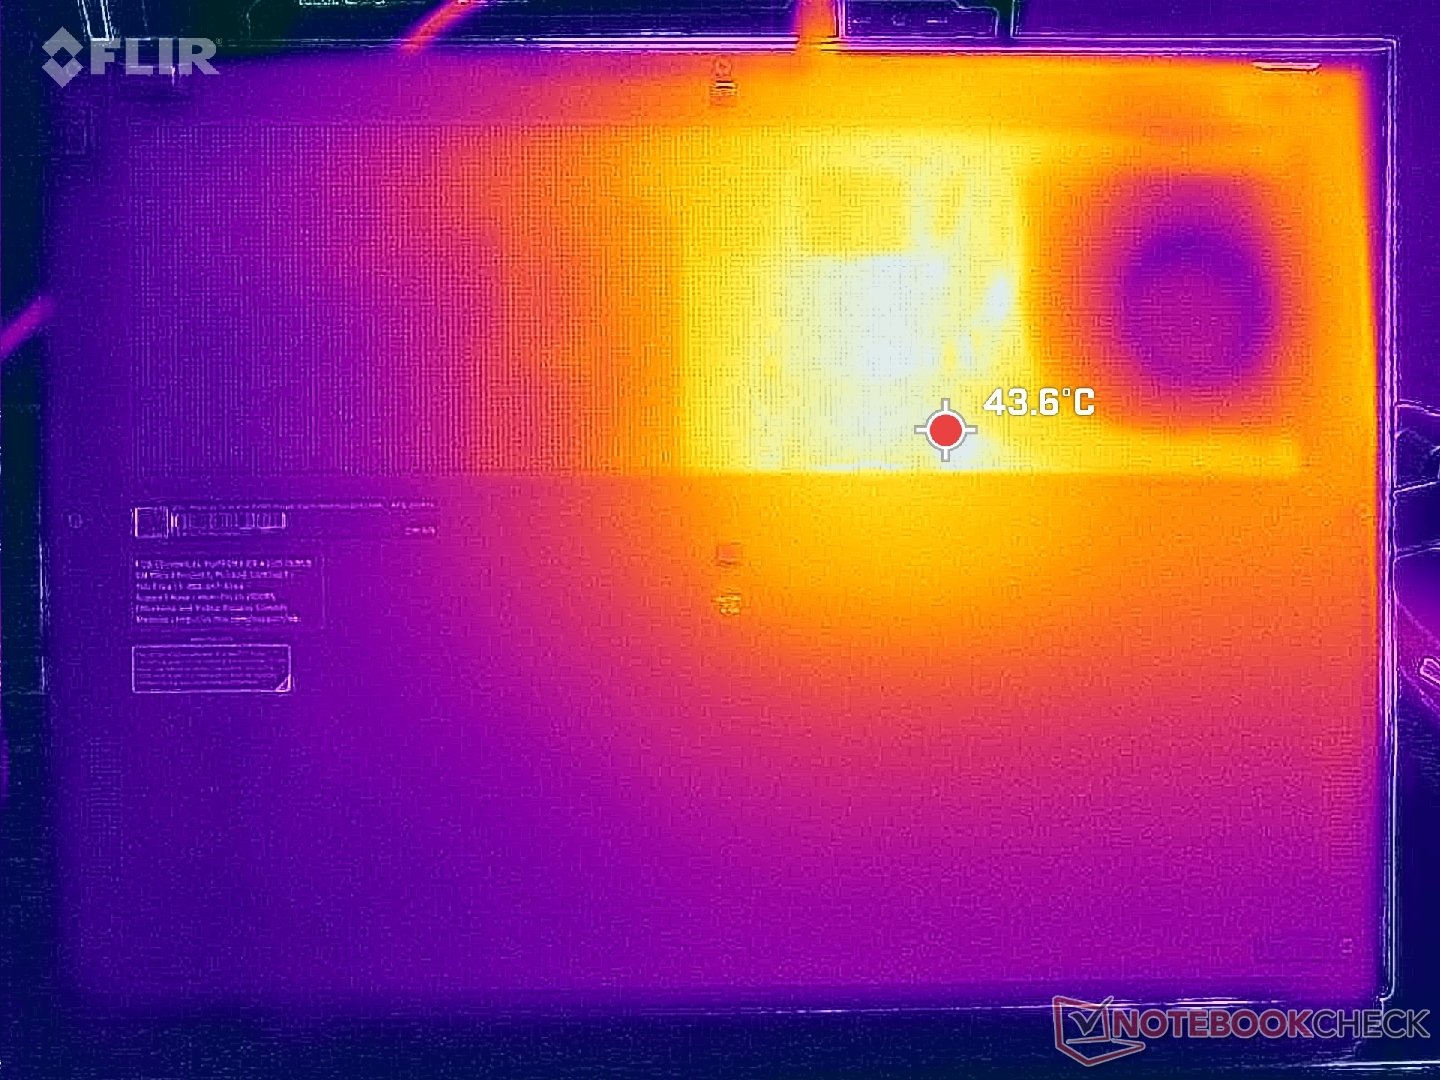
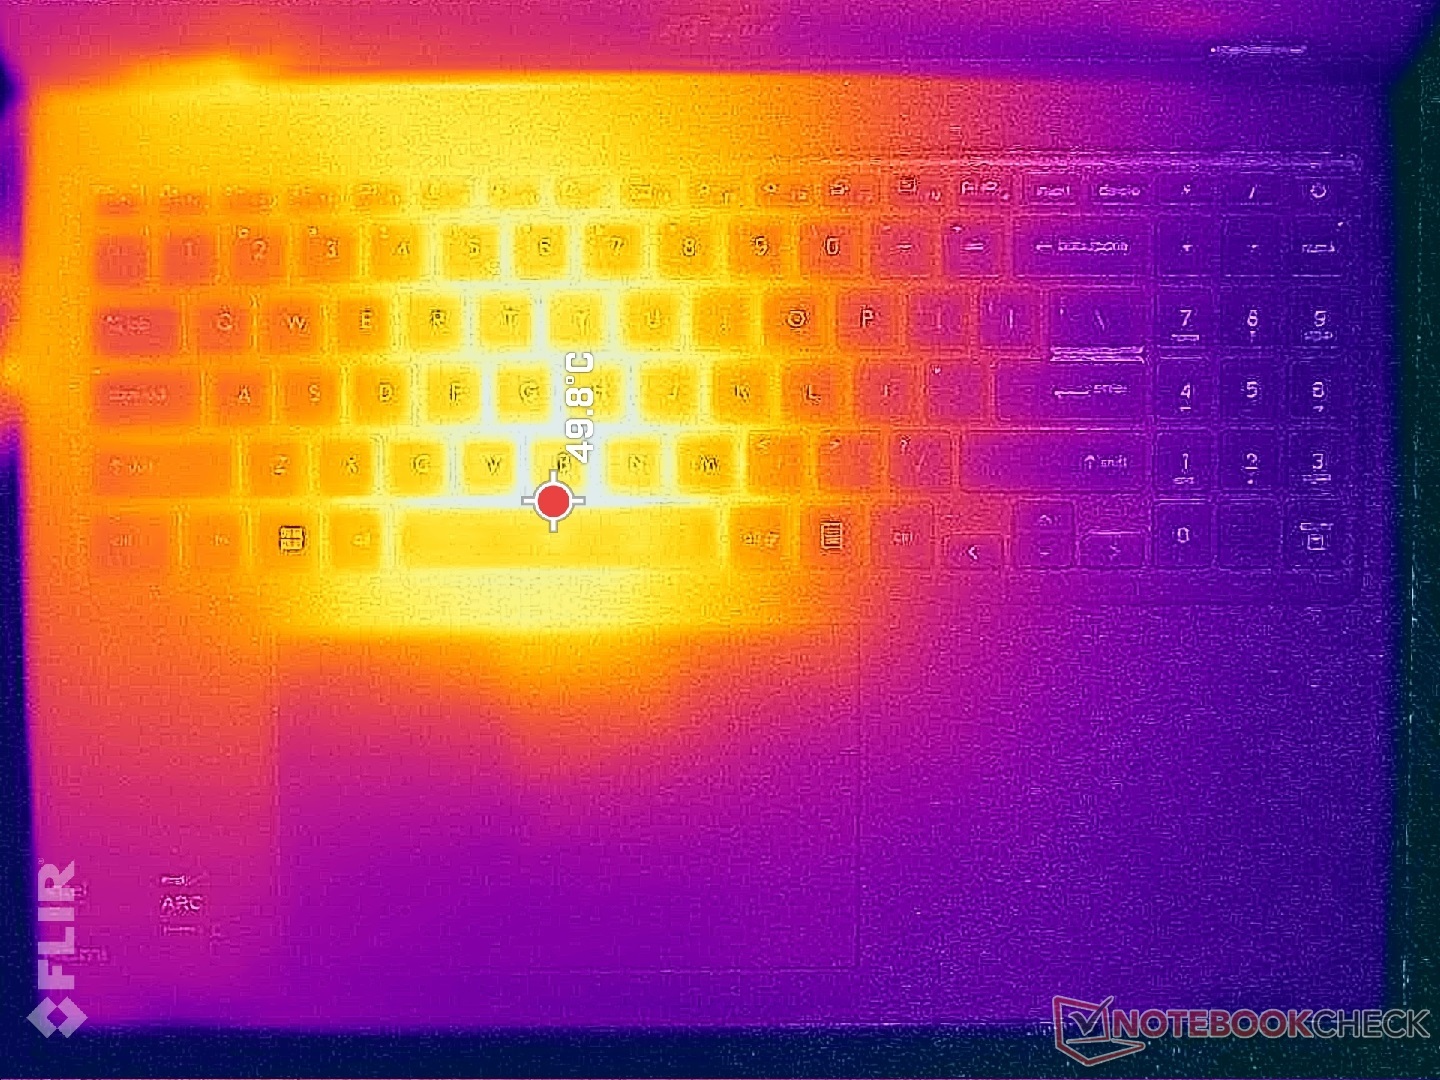
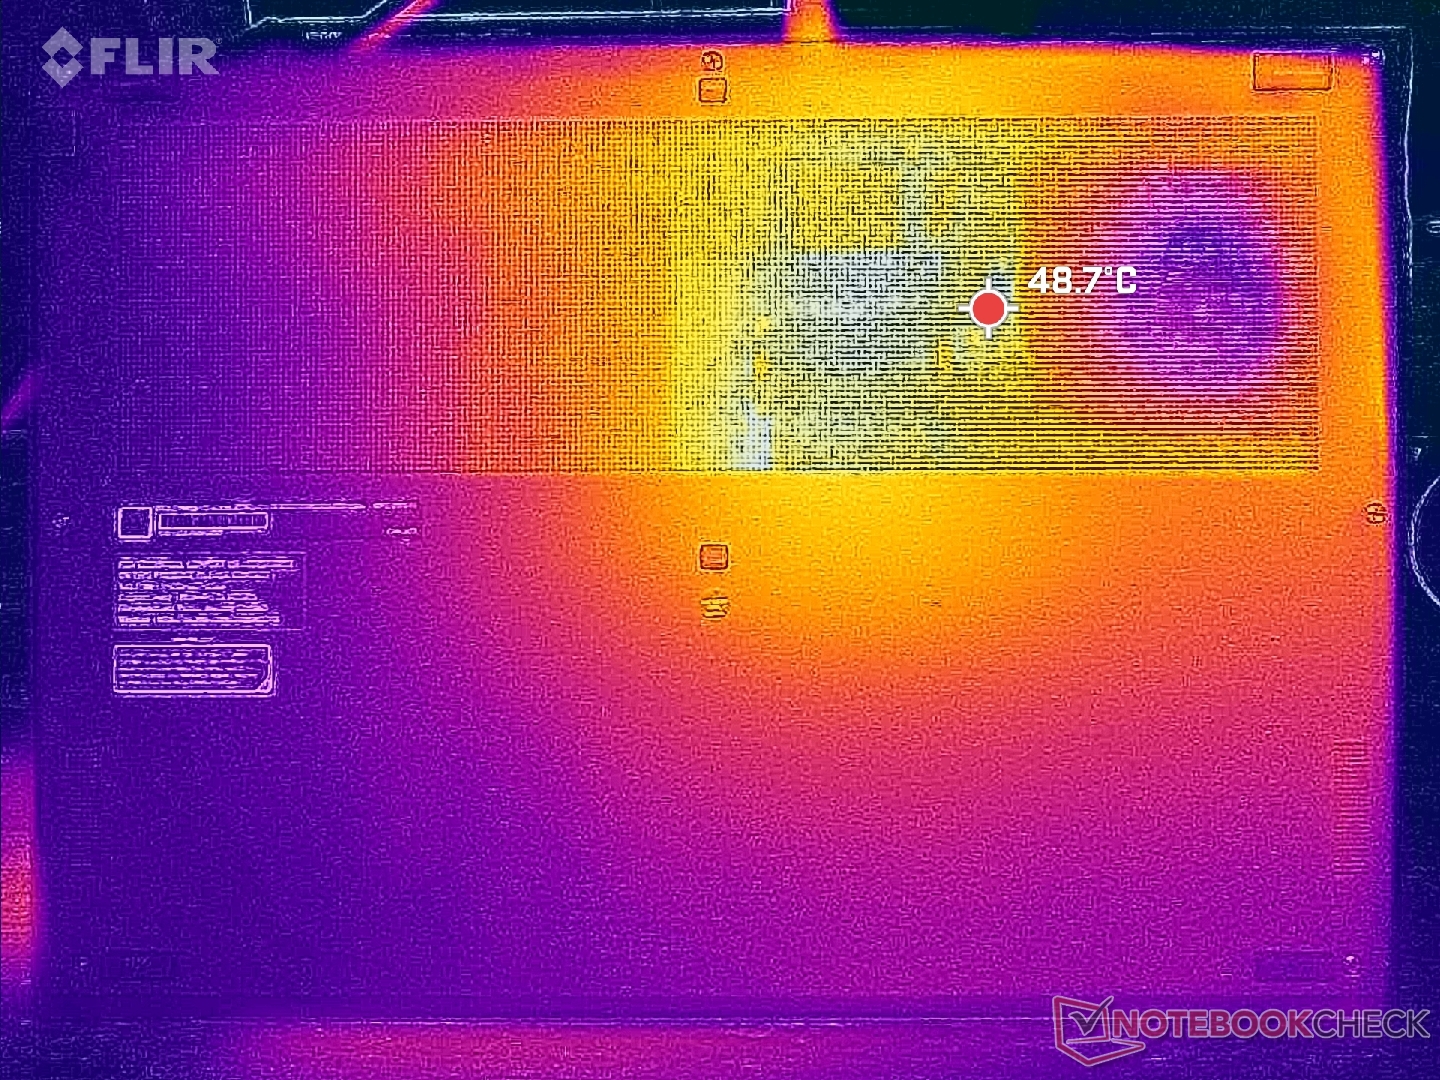
温度
由于 CPU 的位置和内部的冷却解决方案,笔记本电脑左半部分的表面温度高于右半部分。在运行高负荷负载时,空格键附近的热点可高达 50 摄氏度,这与去年配备专用GeForce RTX GPU 的 Prestige 15 上的热点相似。因此,WASD 键在游戏时会感觉相当热,但掌托和方向键会保持更低的温度。由于设计紧凑,Prestige 笔记本在负载情况下通常比普通超极本温度更高,Prestige 16 也不例外。
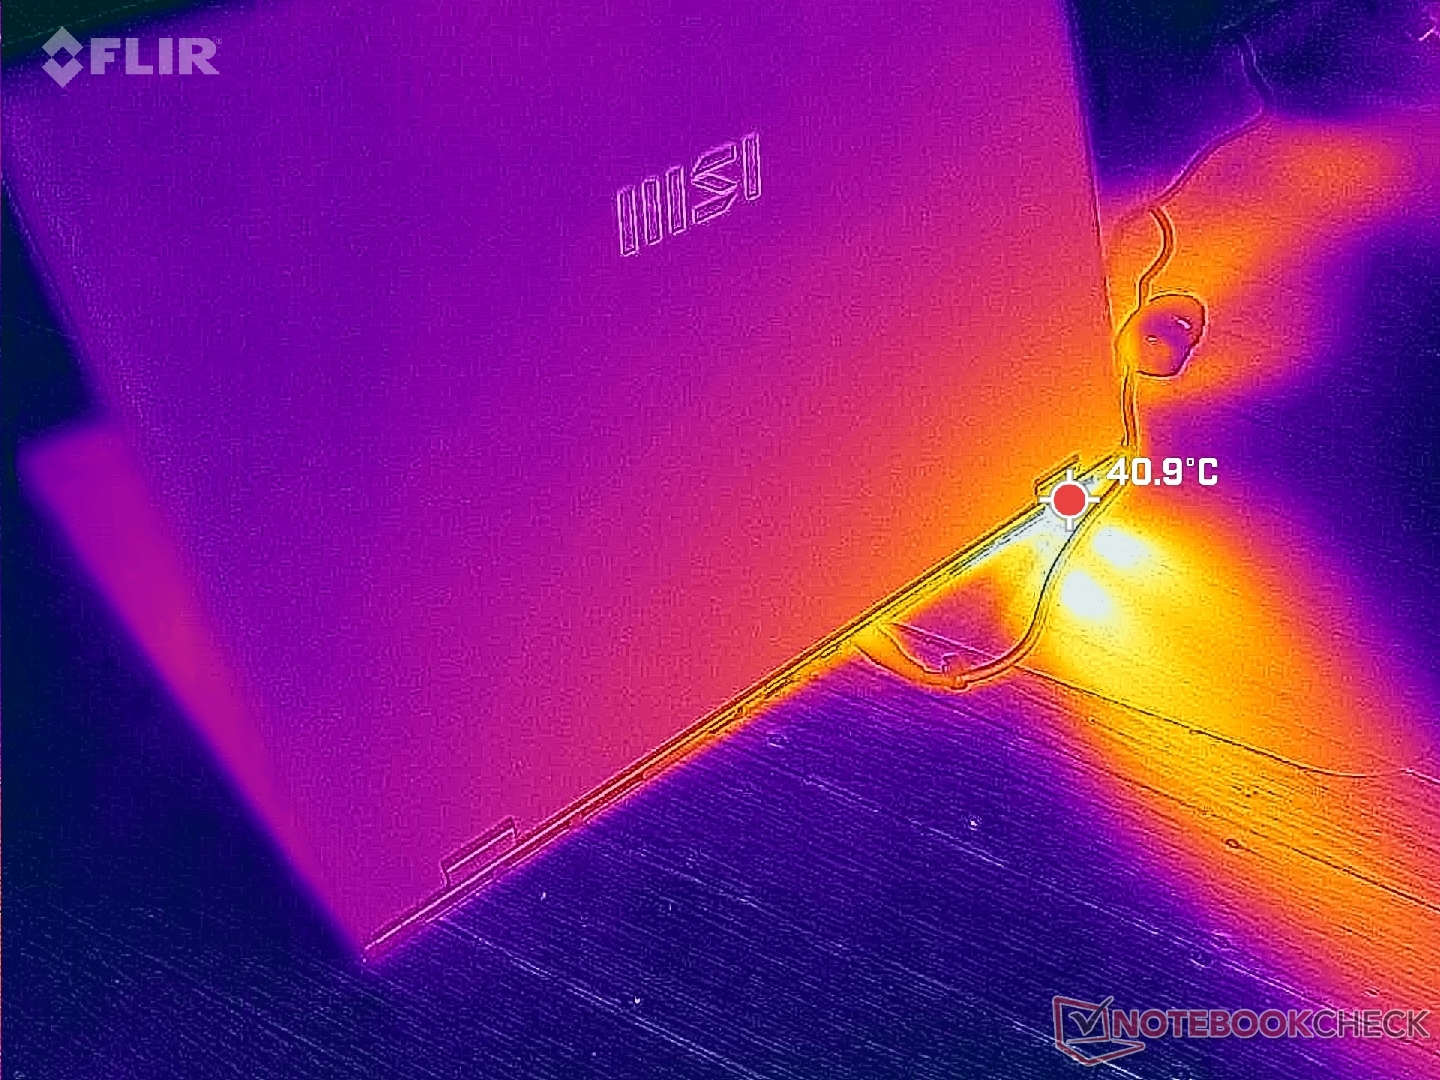
(-) The maximum temperature on the upper side is 48.8 °C / 120 F, compared to the average of 36.8 °C / 98 F, ranging from 21 to 71 °C for the class Multimedia.
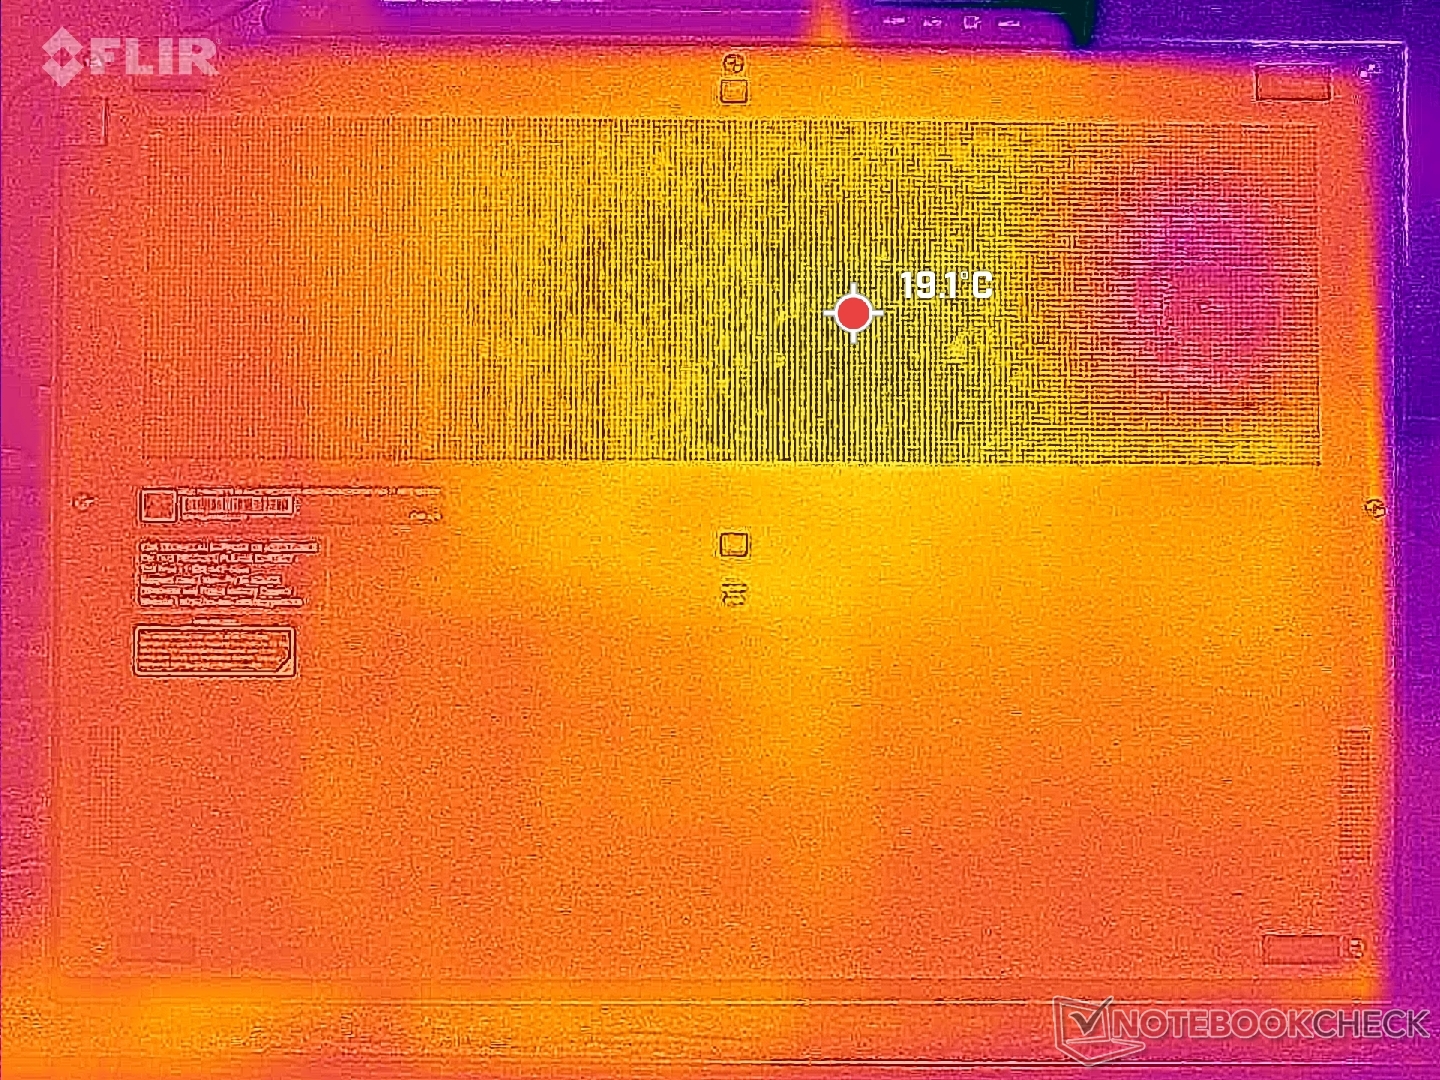
(-) The bottom heats up to a maximum of 47.6 °C / 118 F, compared to the average of 39.1 °C / 102 F
(+) In idle usage, the average temperature for the upper side is 23 °C / 73 F, compared to the device average of 31.3 °C / 88 F.
(±) Playing The Witcher 3, the average temperature for the upper side is 33.3 °C / 92 F, compared to the device average of 31.3 °C / 88 F.
(+) The palmrests and touchpad are cooler than skin temperature with a maximum of 30 °C / 86 F and are therefore cool to the touch.
(±) The average temperature of the palmrest area of similar devices was 28.7 °C / 83.7 F (-1.3 °C / -2.3 F).
| MSI Prestige 16 B1MG-001US Intel Core Ultra 7 155H, Intel Arc 8-Core iGPU | MSI Prestige 15 A12UD-093 Intel Core i7-1280P, NVIDIA GeForce RTX 3050 Ti Laptop GPU | LG Gram 2in1 16 16T90R - G.AA78G Intel Core i7-1360P, Intel Iris Xe Graphics G7 96EUs | Lenovo ThinkBook 16 G6 ABP AMD Ryzen 5 7530U, AMD Radeon RX Vega 7 | Asus VivoBook Pro 16 K6602VU Intel Core i9-13900H, NVIDIA GeForce RTX 4050 Laptop GPU | Dell Inspiron 16 Plus 7630 Intel Core i7-13700H, NVIDIA GeForce RTX 4060 Laptop GPU | |
|---|---|---|---|---|---|---|
| Heat | -16% | -25% | -15% | -30% | -20% | |
| Maximum Upper Side * (°C) | 48.8 | 49 -0% | 55 -13% | 40.8 16% | 42.6 13% | 47.8 2% |
| Maximum Bottom * (°C) | 47.6 | 52.6 -11% | 55.4 -16% | 50.5 -6% | 48.4 -2% | 42.2 11% |
| Idle Upper Side * (°C) | 24.2 | 29.7 -23% | 34.9 -44% | 29.3 -21% | 39.4 -63% | 35.2 -45% |
| Idle Bottom * (°C) | 23.6 | 30.7 -30% | 30 -27% | 35.2 -49% | 39.8 -69% | 35 -48% |
* ... smaller is better
压力测试
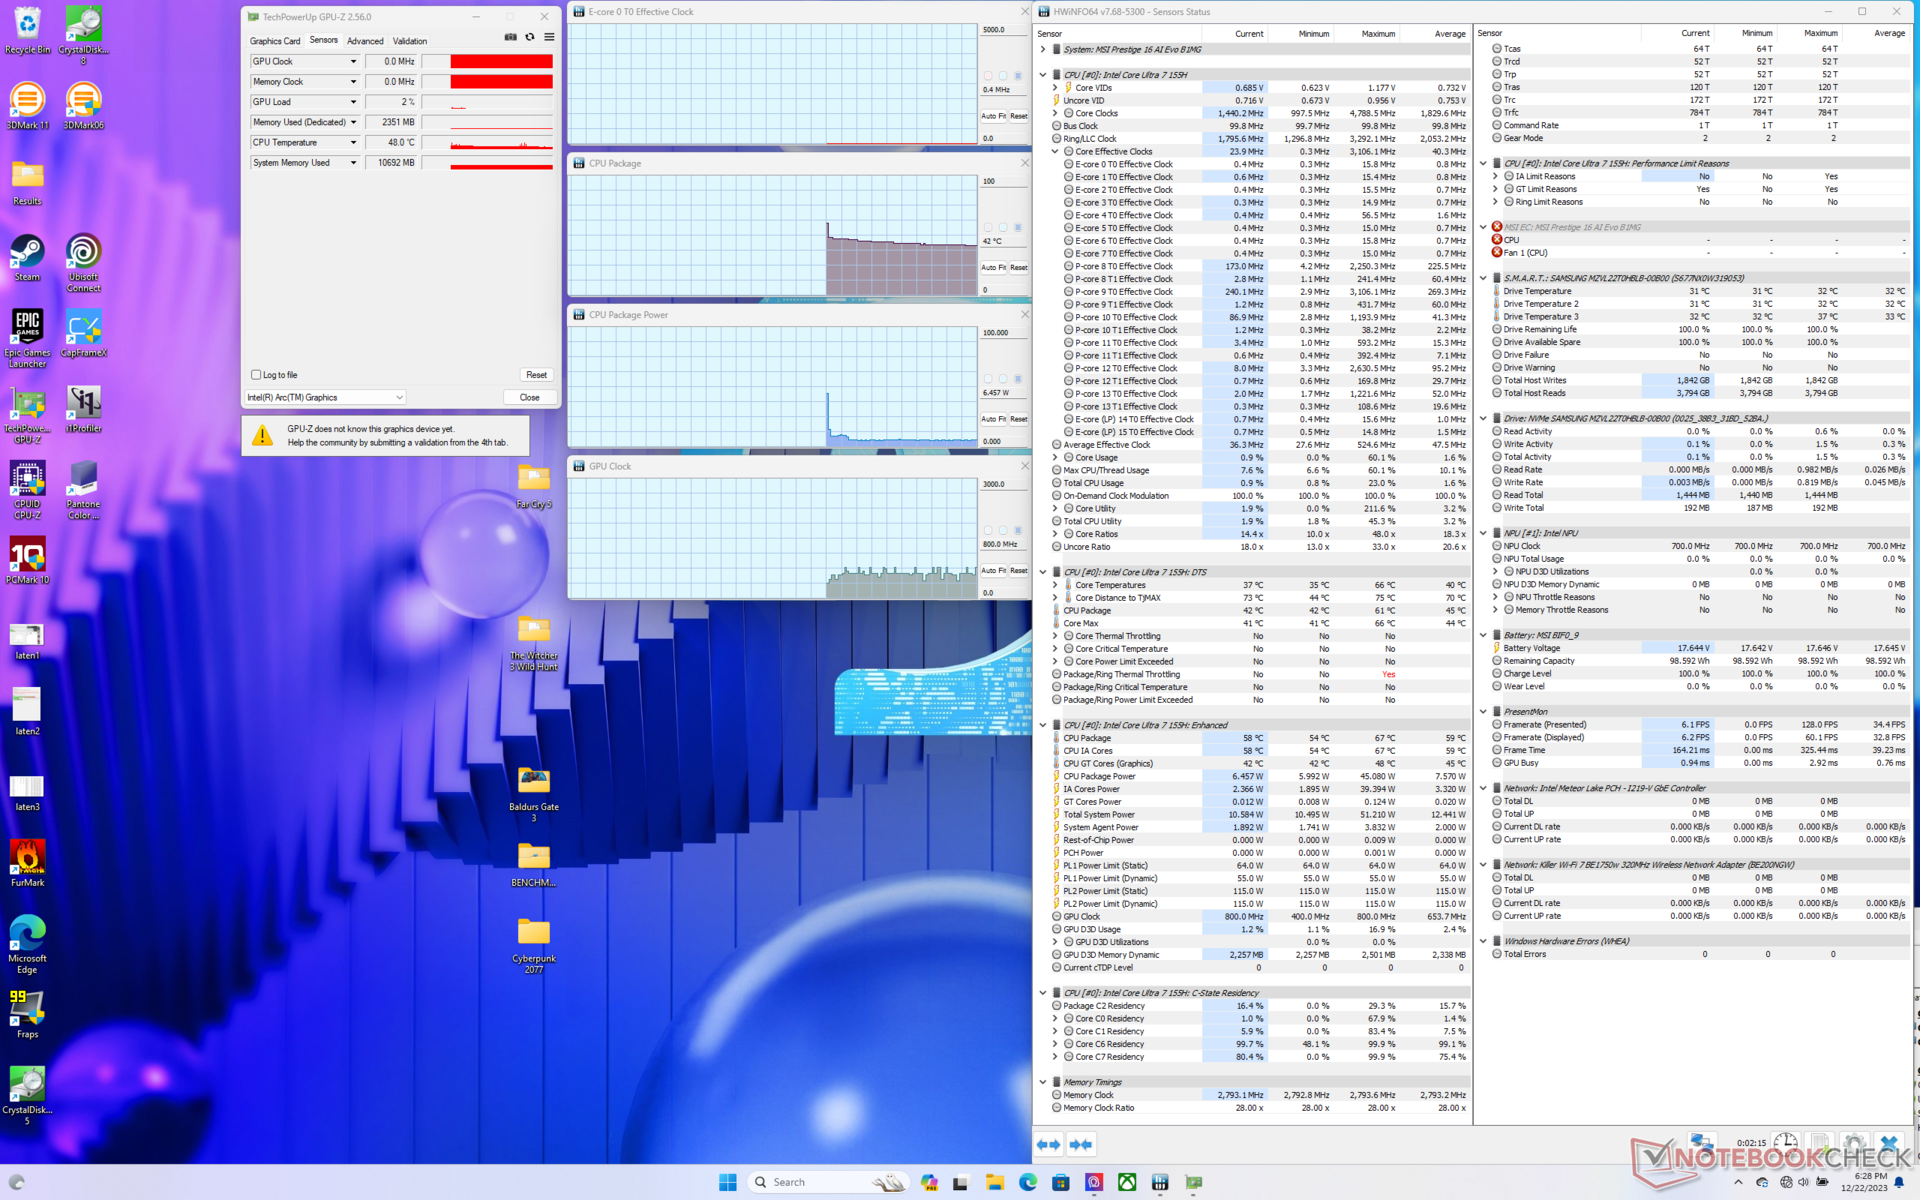
在启动 Prime95 压力测试时,CPU 封装功率会在短短几秒钟内升至 110 W、2.8 GHz 和 96 C,然后迅速下降并稳定在 2.2 GHz、44 W 和 83 C。宏碁 宏碁 Swift Edge SFE16例如,搭载 Ryzen 7 7840U 的宏碁 Swift Edge SFE16 将稳定在较低的 64 摄氏度,而搭载酷睿 H 处理器的 联想 Slim Pro 9i 16IRP8在类似条件下,温度均稳定在 77 摄氏度。
在激活 Cooler Boost 的情况下运行似乎不会影响性能。例如,在关闭 Cooler Boost 的情况下,CPU 的稳定温度为 85 摄氏度。 Witcher 3CPU 将稳定在 85 摄氏度,而开启 Cooler Boost 时为 77 摄氏度,GPU 时钟速率保持不变。除非核心温度是一个问题,否则一般不需要使用 Cooler Boost 模式来获得最高性能。这一观察结果与我们在许多其他配备 Cooler Boost 的微星笔记本电脑上的体验一致。
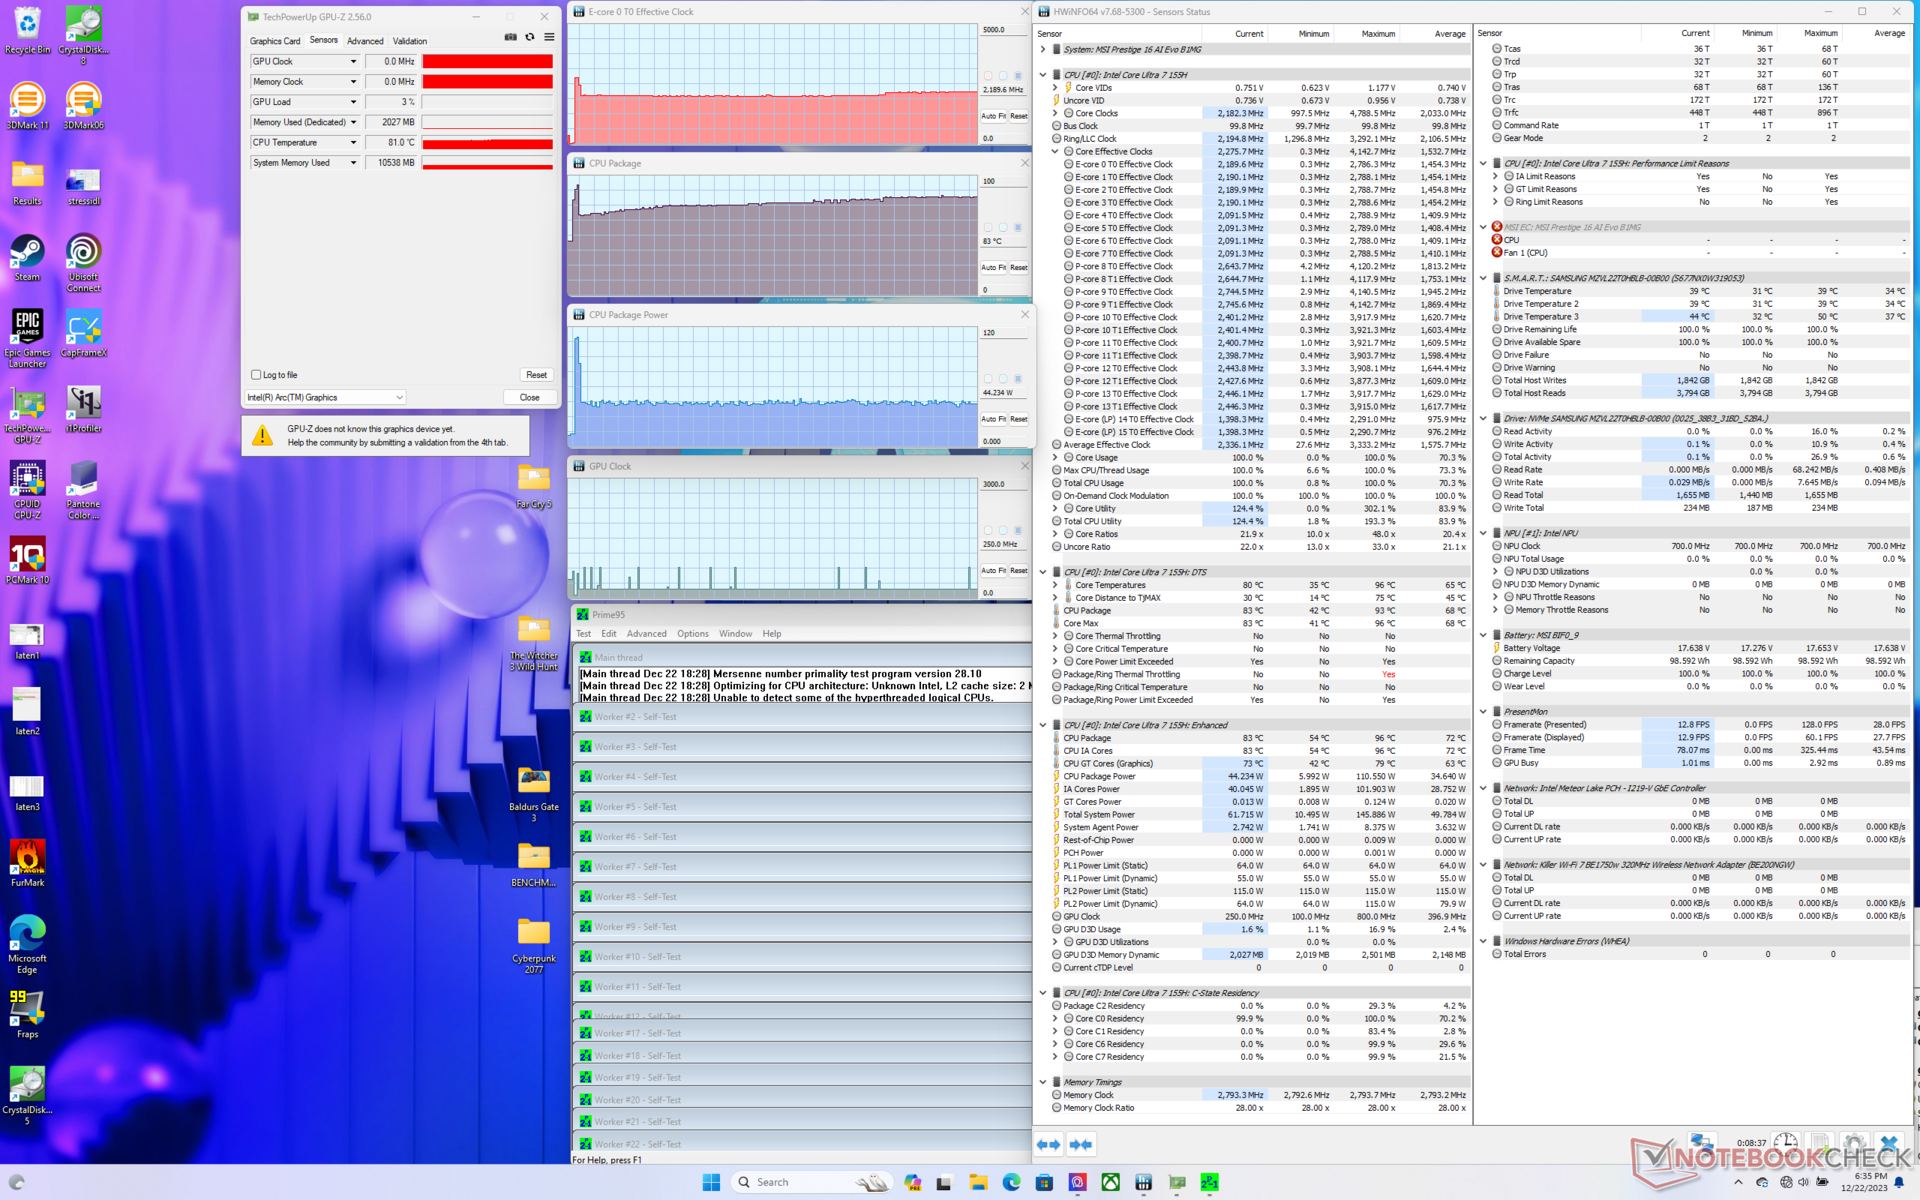
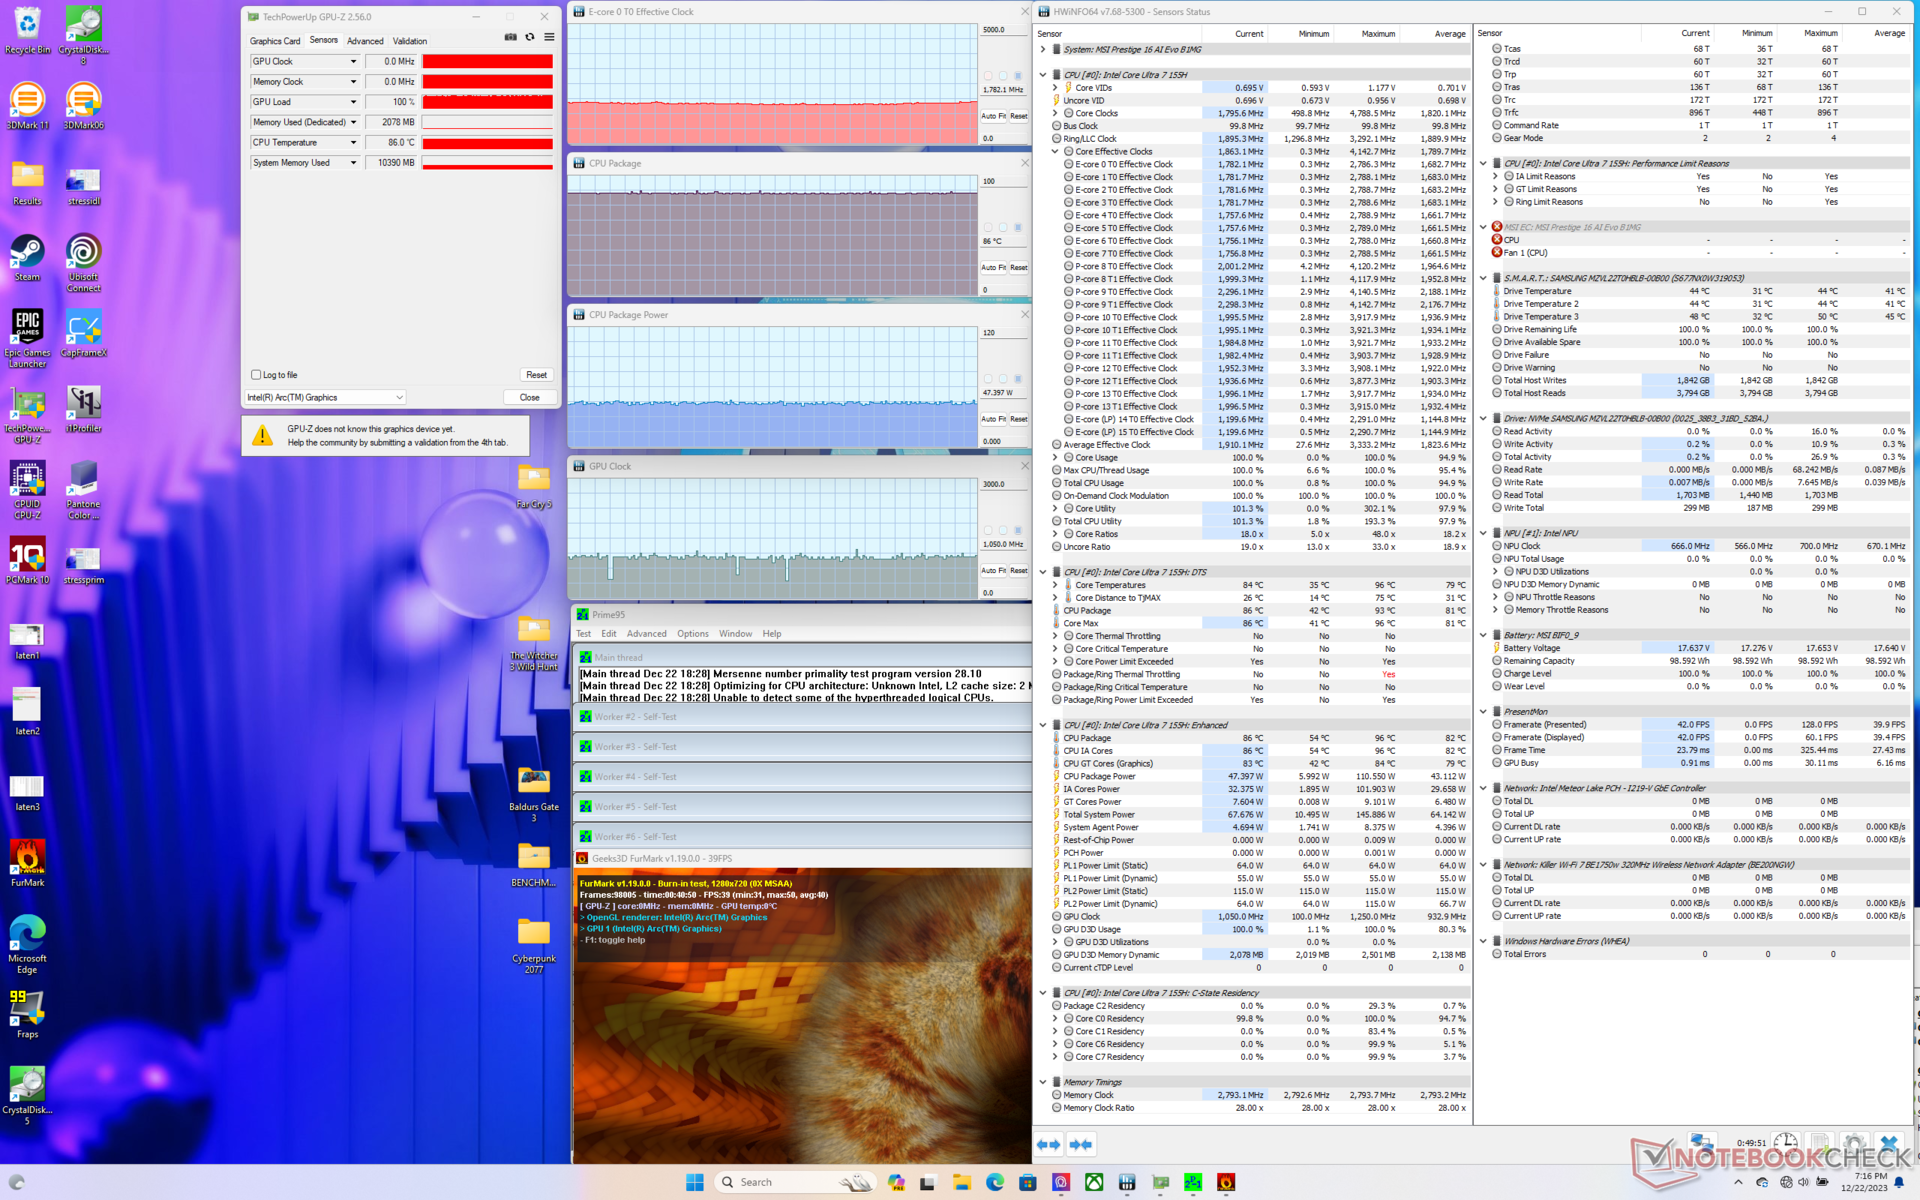

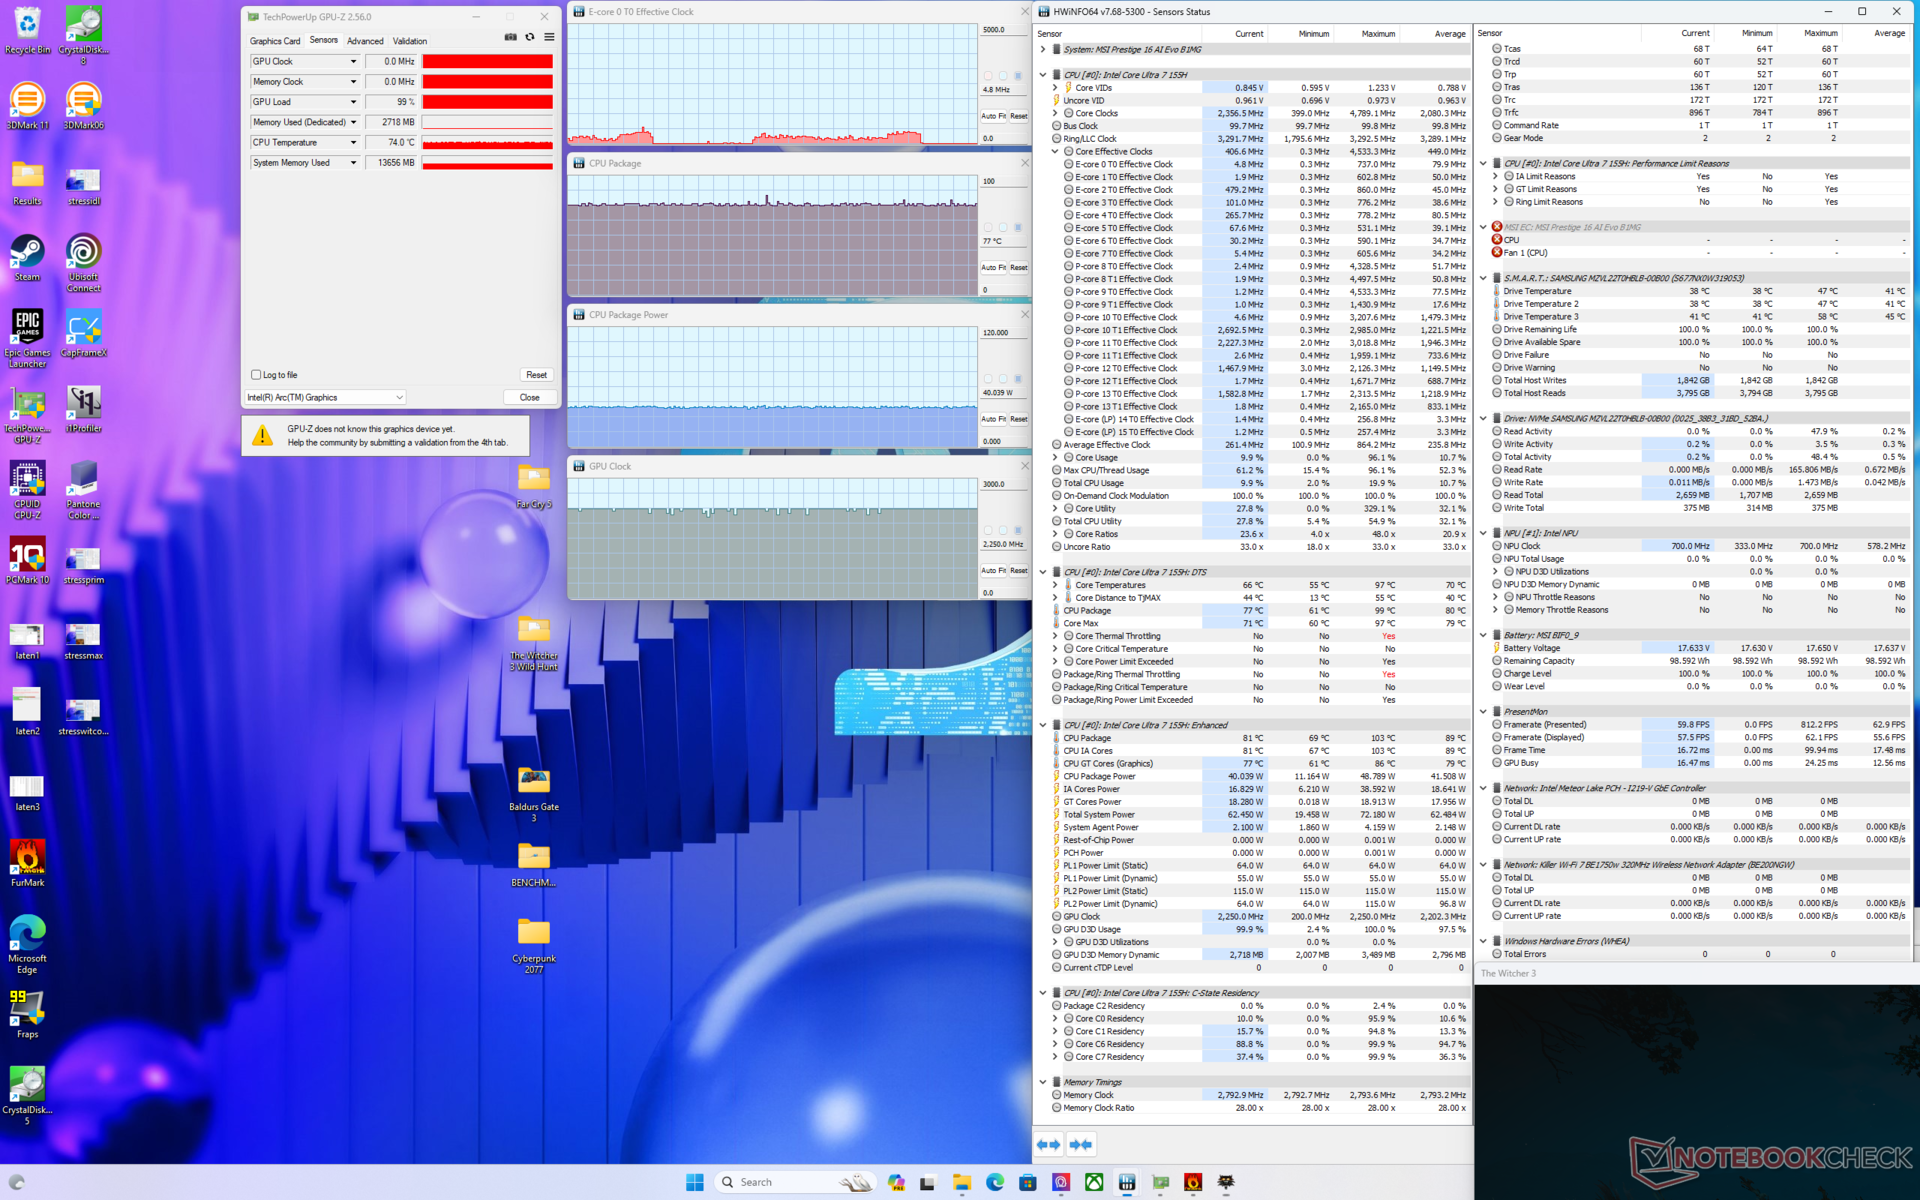
| CPU 时钟 (GHz) | GPU 时钟 (MHz) | CPU 平均温度 (°C) | |
| 系统闲置 | -- | -- | 42 |
| Prime95 压力 | 2.2 | -- | 83 |
| Prime95 + FurMark Stress | 1.8 | 1050 | 86 |
| Witcher 3 压力(极致性能,冷却器升压关闭) | 0.5 | 2250 | 85 |
| Witcher 3 压力(极致性能,开启散热器升压) | 0.5 | 2250 | 77 |
发言人
MSI Prestige 16 B1MG-001US audio analysis
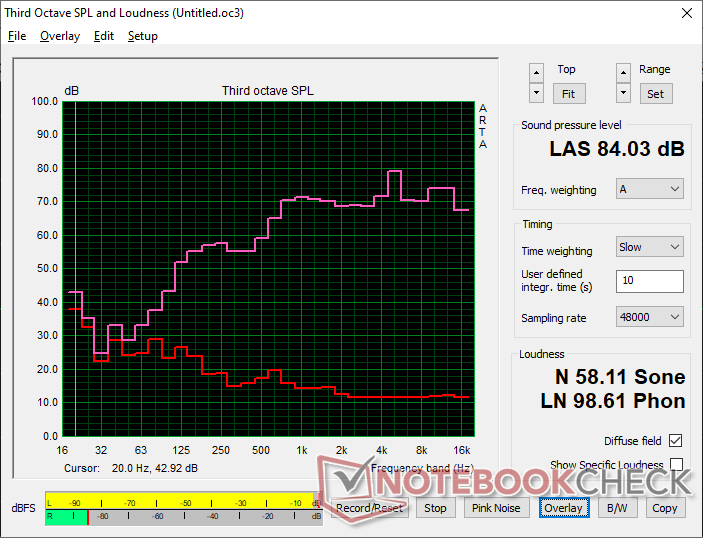
(+) | speakers can play relatively loud (84 dB)
Bass 100 - 315 Hz
(-) | nearly no bass - on average 15.3% lower than median
(±) | linearity of bass is average (7% delta to prev. frequency)
Mids 400 - 2000 Hz
(+) | balanced mids - only 4.3% away from median
(+) | mids are linear (4.3% delta to prev. frequency)
Highs 2 - 16 kHz
(+) | balanced highs - only 3.2% away from median
(+) | highs are linear (6.5% delta to prev. frequency)
Overall 100 - 16.000 Hz
(+) | overall sound is linear (13.3% difference to median)
Compared to same class
» 28% of all tested devices in this class were better, 4% similar, 68% worse
» The best had a delta of 5%, average was 17%, worst was 45%
Compared to all devices tested
» 14% of all tested devices were better, 3% similar, 83% worse
» The best had a delta of 4%, average was 23%, worst was 134%
Apple MacBook Pro 16 2021 M1 Pro audio analysis
(+) | speakers can play relatively loud (84.7 dB)
Bass 100 - 315 Hz
(+) | good bass - only 3.8% away from median
(+) | bass is linear (5.2% delta to prev. frequency)
Mids 400 - 2000 Hz
(+) | balanced mids - only 1.3% away from median
(+) | mids are linear (2.1% delta to prev. frequency)
Highs 2 - 16 kHz
(+) | balanced highs - only 1.9% away from median
(+) | highs are linear (2.7% delta to prev. frequency)
Overall 100 - 16.000 Hz
(+) | overall sound is linear (4.6% difference to median)
Compared to same class
» 0% of all tested devices in this class were better, 0% similar, 100% worse
» The best had a delta of 5%, average was 17%, worst was 45%
Compared to all devices tested
» 0% of all tested devices were better, 0% similar, 100% worse
» The best had a delta of 4%, average was 23%, worst was 134%
能源管理 - 低点更高
耗电量
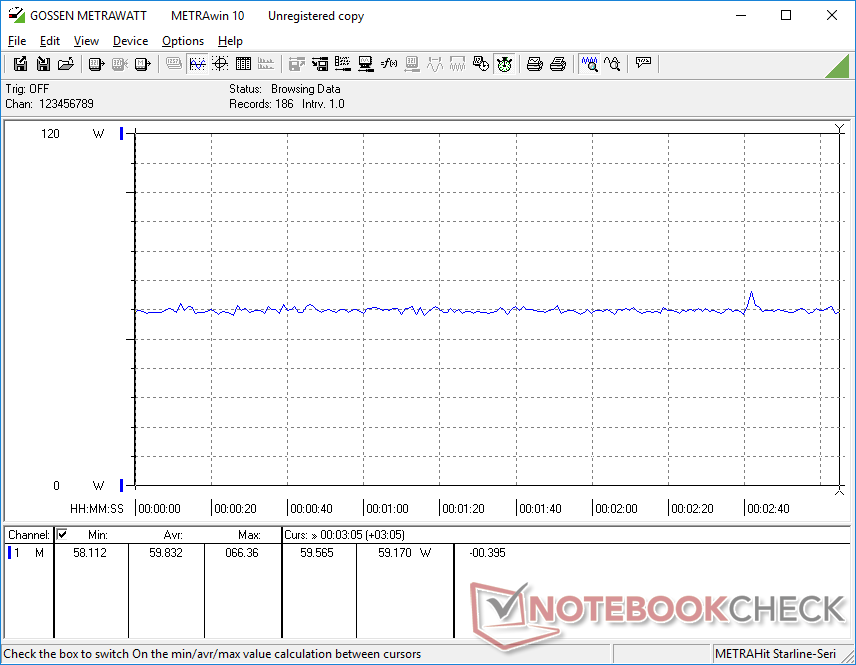
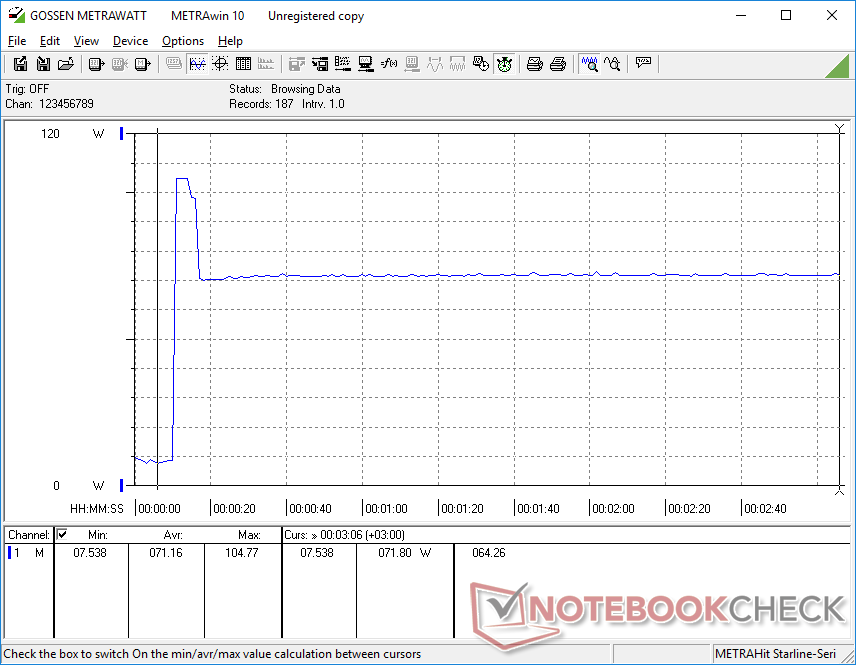
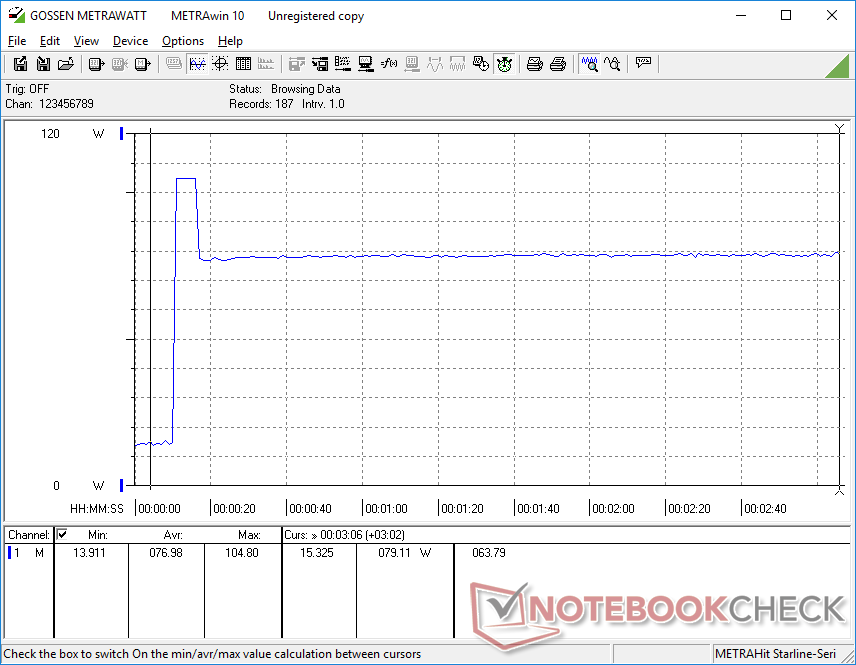
空闲时的功耗可低至 3 W,是我们测试过的所有 16 英寸英特尔笔记本电脑中功耗最低的之一。在下面的章节中,超长的电池续航时间很可能就得益于极低的功耗。
另一方面,在运行要求更高的负载时,耗电量似乎比其他大多数 U 系列笔记本电脑更大。例如,运行 3DMark 06 或游戏时,耗电量在 60 W 至 70 W 之间,而微星 Prestige 15 为 40 W 至 55 W、 LG Gram 16 2 合 1、宏碁 Swift Edge SFE16 或搭载酷睿 H 处理器的 申克 Vision 14在类似条件下也是如此。在使用 Prime95 对 CPU 进行充分压力测试时,情况也是如此。尽管如此,每瓦特性能仍然有利于较新的第 14 代 CPU,因此功耗较高并不一定是缺点。
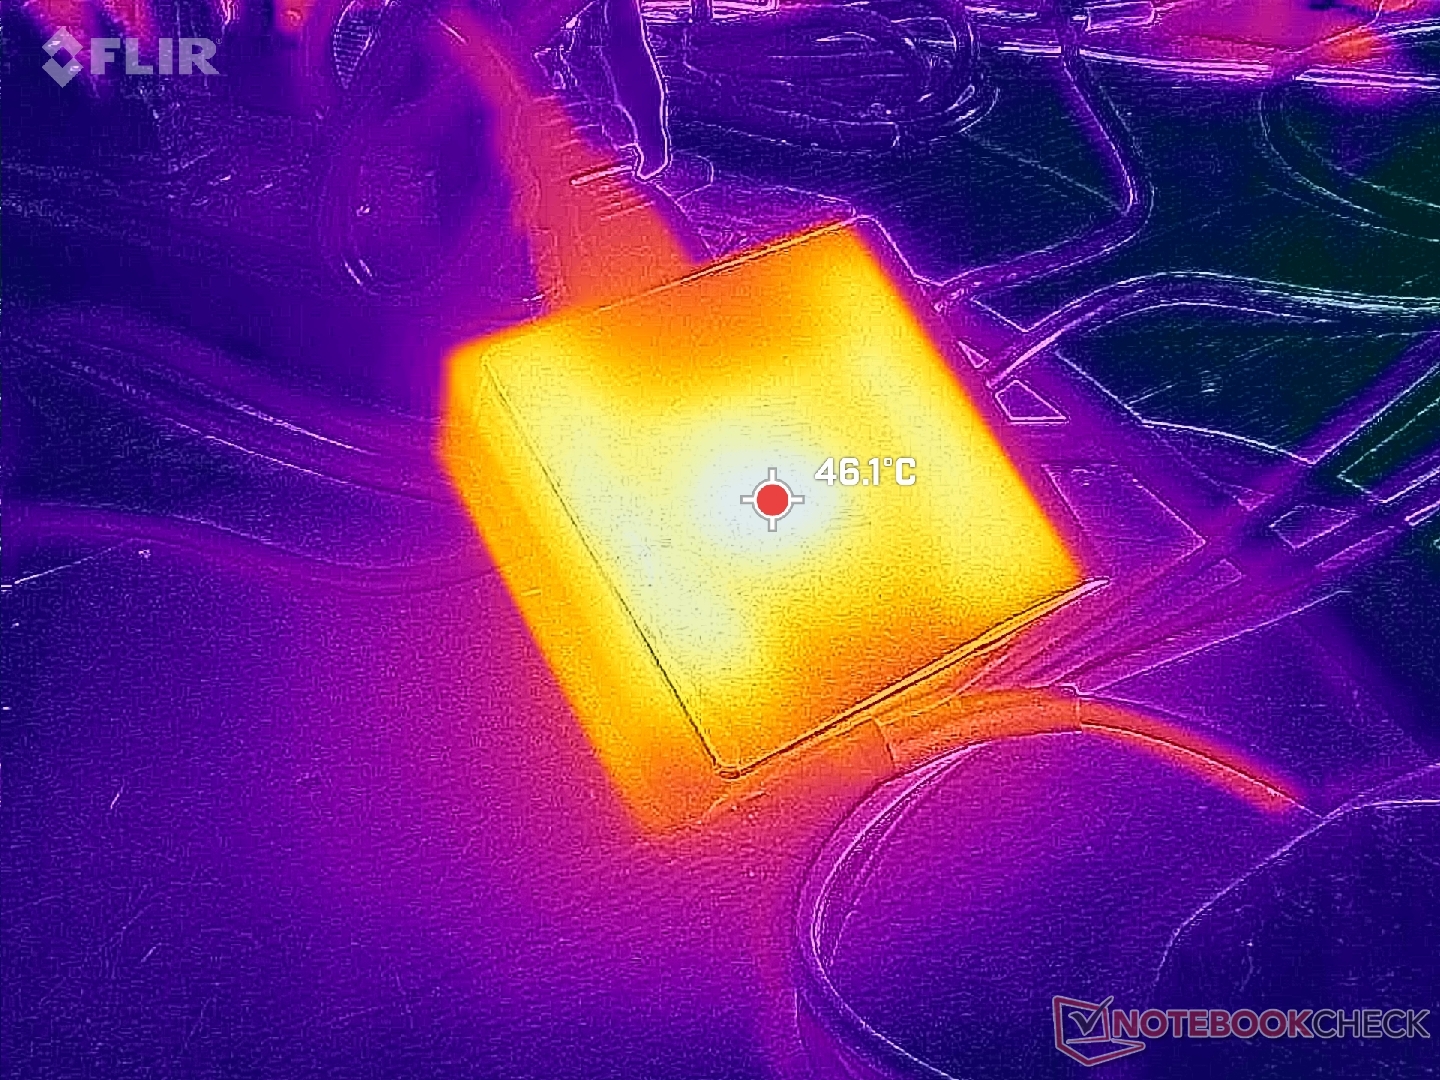
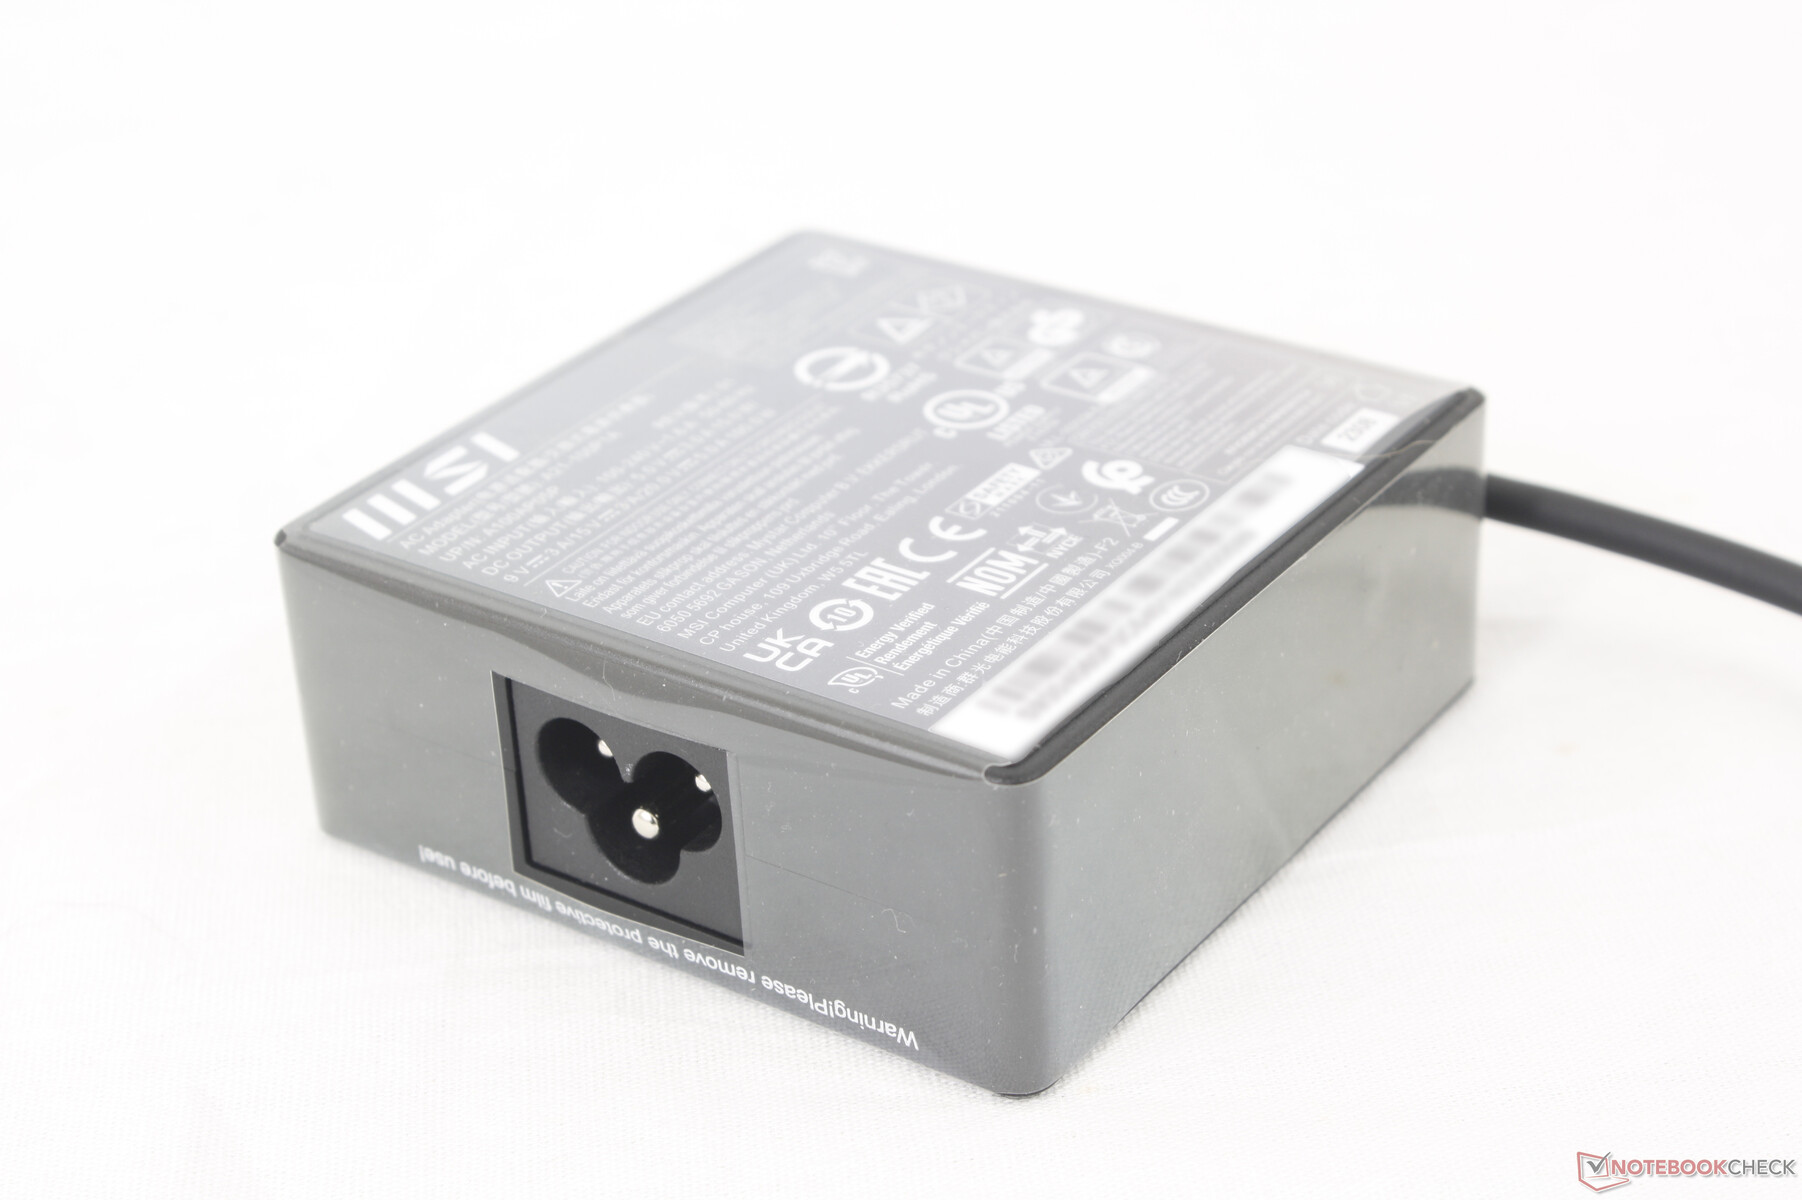
当 CPU 的使用率达到 100% 时,我们可以通过小型(约 7.5 x 7.5 x 3 厘米)100 W USB-C 交流适配器记录到 105 W 的最大功耗。由于 Turbo Boost 的潜力有限,这个功率只是暂时的,因此在运行大负载时,它往往会稳定在 70 W 左右。请注意,配备独立 RTX 4060 或 4070 显卡的 SKU 将使用更大的 140 W USB-C AC 适配器。

| Off / Standby | |
| Idle | |
| Load |
|
Key:
min: | |
| MSI Prestige 16 B1MG-001US Ultra 7 155H, Arc 8-Core, Samsung PM9A1 MZVL22T0HBLB, IPS, 2560x1600, 16" | MSI Prestige 15 A12UD-093 i7-1280P, GeForce RTX 3050 Ti Laptop GPU, Micron 3400 1TB MTFDKBA1T0TFH, IPS, 3840x2160, 15.6" | LG Gram 2in1 16 16T90R - G.AA78G i7-1360P, Iris Xe G7 96EUs, Samsung PM9A1 MZVL21T0HCLR, IPS, 2560x1600, 16" | Lenovo ThinkBook 16 G6 ABP R5 7530U, Vega 7, SK hynix HFS512GEJ9X125N, IPS, 1920x1200, 16" | Asus VivoBook Pro 16 K6602VU i9-13900H, GeForce RTX 4050 Laptop GPU, Micron 2400 MTFDKBA1T0QFM, OLED, 3200x2000, 16" | Dell Inspiron 16 Plus 7630 i7-13700H, GeForce RTX 4060 Laptop GPU, WD PC SN740 SDDPTQD-1T00, IPS, 2560x1600, 16" | |
|---|---|---|---|---|---|---|
| Power Consumption | -2% | 2% | 24% | -161% | -124% | |
| Idle Minimum * (Watt) | 3 | 5.4 -80% | 5.5 -83% | 3.7 -23% | 21.06 -602% | 15.6 -420% |
| Idle Average * (Watt) | 9.5 | 11.8 -24% | 7.2 24% | 7.1 25% | 24.27 -155% | 17.7 -86% |
| Idle Maximum * (Watt) | 12 | 12.7 -6% | 12.9 -8% | 7.7 36% | 25.12 -109% | 20.6 -72% |
| Load Average * (Watt) | 68.3 | 45.9 33% | 55 19% | 43.9 36% | 52.4 23% | 87.4 -28% |
| Witcher 3 ultra * (Watt) | 59.8 | 45.7 24% | 47 21% | 40.8 32% | 110.2 -84% | 121.7 -104% |
| Load Maximum * (Watt) | 104.8 | 63 40% | 63.6 39% | 66.6 36% | 146 -39% | 138 -32% |
* ... smaller is better
Power Consumption Witcher 3 / Stresstest
Power Consumption external Monitor
电池寿命
电池容量从 Prestige 15 的 80 Wh 增加到 Prestige 16 的 99 Wh。再加上新的第 14 代英特尔 CPU 的效率,您可以获得超长的运行时间,实际 WLAN 浏览时间接近 18.5 小时。这是我们测试过的最持久的 Windows 笔记本电脑之一,其效果可与 MacBook 系列媲美。
从空电到满电大约需要 90 分钟。
| MSI Prestige 16 B1MG-001US Ultra 7 155H, Arc 8-Core, 99.9 Wh | MSI Prestige 15 A12UD-093 i7-1280P, GeForce RTX 3050 Ti Laptop GPU, 80 Wh | LG Gram 2in1 16 16T90R - G.AA78G i7-1360P, Iris Xe G7 96EUs, 80 Wh | Lenovo ThinkBook 16 G6 ABP R5 7530U, Vega 7, 45 Wh | Asus VivoBook Pro 16 K6602VU i9-13900H, GeForce RTX 4050 Laptop GPU, 96 Wh | Dell Inspiron 16 Plus 7630 i7-13700H, GeForce RTX 4060 Laptop GPU, 86 Wh | |
|---|---|---|---|---|---|---|
| Battery runtime | -51% | -32% | -45% | -45% | -43% | |
| Reader / Idle (h) | 25.1 | 17.6 -30% | ||||
| WiFi v1.3 (h) | 18.3 | 8.9 -51% | 11.9 -35% | 10.1 -45% | 10.1 -45% | 9.4 -49% |
| Load (h) | 2.8 | 1.4 -50% | 2 -29% | 1.4 -50% | ||
| H.264 (h) | 7.1 | 11.6 | 9.8 |
Pros
Cons
评语 - 至臻完美的尊贵系列
事实证明,第 14 代英特尔处理器对微星 Prestige 16 等超极本来说是一个巨大的福音。虽然 CPU 的原始性能与上一代相比并没有太大提升,但集成显卡性能和电池续航时间的提升对于超极本类别来说可以说同样重要。英特尔 Arc 8 以明显的优势成功超越了 AMD Radeon 780M,大多数休闲游戏玩家和图片编辑都会对它的性能感到满意。
该机型有几个方面可以改进。首先,缺乏高刷新率或触摸屏选项意味着惠普 Spectre或华硕 Vivobook 等替代产品仍有一些优势。其次,IPS 配置的重影现象非常明显,即使是休闲游戏玩家也可能会受到其影响的困扰。因此,尽管电池寿命不可避免地会受到影响,但 OLED SKU 仍然值得购买。最后,与其他大多数 U 系列超极本相比,iGPU 性能更高的代价是运行 GPU 密集型任务时功耗更高、风扇噪音更大。
Prestige 16 具有超长的电池续航时间、清晰的 DCI-P3 显示屏和丰富的图形选项,学生们一定会喜欢它,认为它值得作为 MacBook Pro 的替代品。
便携式设计、多彩屏幕、超长电池续航时间、快速集成显卡和快速 SD 读卡器是 Prestige 16 的主要亮点。用户应充分利用这些优势,让微星的这款机型发挥最大作用。
价格和供应情况
MSI Prestige 16 B1MG-001US
- 12/28/2023 v7 (old)
Allen Ngo
Transparency
The selection of devices to be reviewed is made by our editorial team. The test sample was freely purchased by the author at his/her own expense. The lender had no influence on this review, nor did the manufacturer receive a copy of this review before publication. There was no obligation to publish this review. As an independent media company, Notebookcheck is not subjected to the authority of manufacturers, retailers or publishers.
This is how Notebookcheck is testing
Every year, Notebookcheck independently reviews hundreds of laptops and smartphones using standardized procedures to ensure that all results are comparable. We have continuously developed our test methods for around 20 years and set industry standards in the process. In our test labs, high-quality measuring equipment is utilized by experienced technicians and editors. These tests involve a multi-stage validation process. Our complex rating system is based on hundreds of well-founded measurements and benchmarks, which maintains objectivity. Further information on our test methods can be found here.
Price comparison

