戴尔Latitude 7424 Rugged Extreme (i7-8650U, RX540) 笔记本电脑评测


| SD Card Reader | |
| average JPG Copy Test (av. of 3 runs) | |
| Dell Latitude 5420 Rugged-P85G (Toshiba Exceria Pro SDXC 64 GB UHS-II) | |
| Dell Latitude 7424 Rugged Extreme (Toshiba Exceria Pro SDXC 64 GB UHS-II) | |
| Lenovo ThinkPad P52 20MAS03N00 (Toshiba Exceria Pro SDXC 64 GB UHS-II) | |
| Panasonic Toughbook CF-54G2999VM (Toshiba Exceria Pro SDXC 64 GB UHS-II) | |
| Average of class Workstation (49.6 - 681, n=14, last 2 years) | |
| Panasonic Toughbook CF-XZ6 (Toshiba Exceria Pro SDXC 64 GB UHS-II) | |
| Getac S410 (Toshiba Exceria Pro SDXC 64 GB UHS-II) | |
| Lenovo ThinkPad T480-20L50010US (Toshiba Exceria Pro SDXC 64 GB UHS-II) | |
| maximum AS SSD Seq Read Test (1GB) | |
| Panasonic Toughbook CF-XZ6 (Toshiba Exceria Pro SDXC 64 GB UHS-II) | |
| Dell Latitude 5420 Rugged-P85G (Toshiba Exceria Pro SDXC 64 GB UHS-II) | |
| Dell Latitude 7424 Rugged Extreme (Toshiba Exceria Pro SDXC 64 GB UHS-II) | |
| Average of class Workstation (87.6 - 1455, n=14, last 2 years) | |
| Lenovo ThinkPad P52 20MAS03N00 (Toshiba Exceria Pro SDXC 64 GB UHS-II) | |
| Panasonic Toughbook CF-54G2999VM (Toshiba Exceria Pro SDXC 64 GB UHS-II) | |
| Lenovo ThinkPad T480-20L50010US (Toshiba Exceria Pro SDXC 64 GB UHS-II) | |
| Getac S410 (Toshiba Exceria Pro SDXC 64 GB UHS-II) | |
| Networking | |
| iperf3 transmit AX12 | |
| Panasonic Toughbook CF-XZ6 | |
| Lenovo ThinkPad P52 20MAS03N00 | |
| Dell Latitude 7424 Rugged Extreme | |
| Dell Latitude 5420 Rugged-P85G | |
| Getac S410 | |
| Lenovo ThinkPad T480-20L50010US | |
| Panasonic Toughbook CF-54G2999VM | |
| iperf3 receive AX12 | |
| Dell Latitude 5420 Rugged-P85G | |
| Getac S410 | |
| Dell Latitude 7424 Rugged Extreme | |
| Panasonic Toughbook CF-54G2999VM | |
| Lenovo ThinkPad P52 20MAS03N00 | |
| Lenovo ThinkPad T480-20L50010US | |
| Panasonic Toughbook CF-XZ6 | |
| |||||||||||||||||||||||||
Brightness Distribution: 88 %
Center on Battery: 844 cd/m²
Contrast: 1563:1 (Black: 0.54 cd/m²)
ΔE ColorChecker Calman: 4.8 | ∀{0.5-29.43 Ø4.73}
calibrated: 1.15
ΔE Greyscale Calman: 7.6 | ∀{0.09-98 Ø4.97}
97% sRGB (Argyll 1.6.3 3D)
62% AdobeRGB 1998 (Argyll 1.6.3 3D)
67.3% AdobeRGB 1998 (Argyll 3D)
96.9% sRGB (Argyll 3D)
65.3% Display P3 (Argyll 3D)
Gamma: 2.334
CCT: 6546 K
| Dell Latitude 7424 Rugged Extreme AU Optronics AUO523D, IPS, 14", 1920x1080 | Getac S410 CMN N140BGE-E33, TN PED, 14", 1366x768 | Panasonic Toughbook CF-54G2999VM B140XTN, AUO2E3C, TN LED, 14", 1366x768 | Panasonic Toughbook CF-XZ6 Semi-Matte Beschichtung, IPS LED, 12", 2160x1440 | Dell Latitude 5420 Rugged-P85G AU Optronics AUO523D, IPS, 14", 1920x1080 | Lenovo ThinkPad T480-20L50010US B140HAK01.0, TFT-LCD, 14", 1920x1080 | Lenovo ThinkPad P52 20MAS03N00 N156HCE-EN1, IPS LED, 15.6", 1920x1080 | |
|---|---|---|---|---|---|---|---|
| Display | -38% | -43% | -29% | -5% | -44% | -3% | |
| Display P3 Coverage (%) | 65.3 | 40.46 -38% | 37.36 -43% | 46.47 -29% | 62.5 -4% | 36.31 -44% | 65.6 0% |
| sRGB Coverage (%) | 96.9 | 60.9 -37% | 56.1 -42% | 70 -28% | 92.4 -5% | 54.5 -44% | 90.3 -7% |
| AdobeRGB 1998 Coverage (%) | 67.3 | 41.8 -38% | 38.62 -43% | 48.01 -29% | 64.2 -5% | 37.51 -44% | 65.9 -2% |
| Response Times | 50% | 44% | 32% | 4% | 31% | 37% | |
| Response Time Grey 50% / Grey 80% * (ms) | 62.8 ? | 41.2 ? 34% | 43.2 ? 31% | 39 ? 38% | 68 ? -8% | 39.2 ? 38% | 39.2 ? 38% |
| Response Time Black / White * (ms) | 40 ? | 14 ? 65% | 17.2 ? 57% | 30 ? 25% | 33.6 ? 16% | 30.8 ? 23% | 26 ? 35% |
| PWM Frequency (Hz) | 763 | 877 ? | 694 ? | 735 ? | 25250 ? | ||
| Screen | -86% | -92% | -7% | -9% | -61% | -14% | |
| Brightness middle (cd/m²) | 844 | 265.1 -69% | 174.5 -79% | 565 -33% | 1111.7 32% | 276.7 -67% | 304 -64% |
| Brightness (cd/m²) | 793 | 246 -69% | 164 -79% | 538 -32% | 1026 29% | 272 -66% | 293 -63% |
| Brightness Distribution (%) | 88 | 81 -8% | 71 -19% | 82 -7% | 80 -9% | 90 2% | 88 0% |
| Black Level * (cd/m²) | 0.54 | 0.58 -7% | 0.6 -11% | 0.4 26% | 0.81 -50% | 0.21 61% | 0.26 52% |
| Contrast (:1) | 1563 | 457 -71% | 291 -81% | 1413 -10% | 1372 -12% | 1318 -16% | 1169 -25% |
| Colorchecker dE 2000 * | 4.8 | 14.24 -197% | 12.05 -151% | 5.06 -5% | 3.83 20% | 7.22 -50% | 4.5 6% |
| Colorchecker dE 2000 max. * | 11.88 | 26.66 -124% | 27.5 -131% | 8.1 32% | 7.85 34% | 25.87 -118% | 7.7 35% |
| Colorchecker dE 2000 calibrated * | 1.15 | 3.94 -243% | 4.34 -277% | 2.98 -159% | 5.01 -336% | 2.4 -109% | |
| Greyscale dE 2000 * | 7.6 | 14.2 -87% | 14.8 -95% | 6.4 16% | 5.6 26% | 6.7 12% | 5.2 32% |
| Gamma | 2.334 94% | 2.03 108% | 1.4 157% | 2.25 98% | 2.306 95% | 2.321 95% | 2.26 97% |
| CCT | 6546 99% | 17152 38% | 14529 45% | 5794 112% | 7676 85% | 6656 98% | 6789 96% |
| Color Space (Percent of AdobeRGB 1998) (%) | 62 | 38.7 -38% | 35.7 -42% | 44 -29% | 59 -5% | 34 -45% | 53.8 -13% |
| Color Space (Percent of sRGB) (%) | 97 | 61 -37% | 56.2 -42% | 70 -28% | 93 -4% | 54 -44% | 90.1 -7% |
| Total Average (Program / Settings) | -25% /
-60% | -30% /
-65% | -1% /
-6% | -3% /
-7% | -25% /
-46% | 7% /
-6% |
* ... smaller is better
Display Response Times
| ↔ Response Time Black to White | ||
|---|---|---|
| 40 ms ... rise ↗ and fall ↘ combined | ↗ 24.4 ms rise | 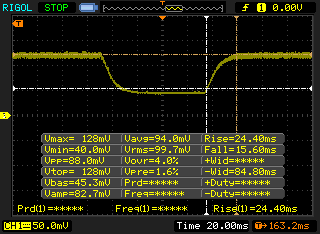 |
| ↘ 15.6 ms fall | ||
| The screen shows slow response rates in our tests and will be unsatisfactory for gamers. In comparison, all tested devices range from 0.1 (minimum) to 240 (maximum) ms. » 97 % of all devices are better. This means that the measured response time is worse than the average of all tested devices (19.9 ms). | ||
| ↔ Response Time 50% Grey to 80% Grey | ||
| 62.8 ms ... rise ↗ and fall ↘ combined | ↗ 35.6 ms rise | 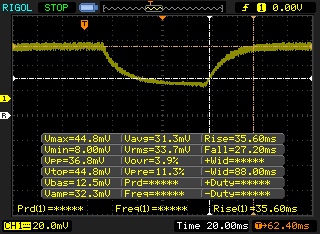 |
| ↘ 27.2 ms fall | ||
| The screen shows slow response rates in our tests and will be unsatisfactory for gamers. In comparison, all tested devices range from 0.165 (minimum) to 636 (maximum) ms. » 97 % of all devices are better. This means that the measured response time is worse than the average of all tested devices (31.1 ms). | ||
Screen Flickering / PWM (Pulse-Width Modulation)
| Screen flickering / PWM detected | 763 Hz | 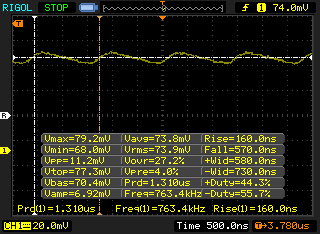 | |
The display backlight flickers at 763 Hz (worst case, e.g., utilizing PWM) . The frequency of 763 Hz is quite high, so most users sensitive to PWM should not notice any flickering. In comparison: 52 % of all tested devices do not use PWM to dim the display. If PWM was detected, an average of 7798 (minimum: 5 - maximum: 343500) Hz was measured. | |||
| Cinebench R15 | |
| CPU Single 64Bit | |
| Average of class Workstation (191.4 - 328, n=25, last 2 years) | |
| Schenker XMG Neo 15 Turing | |
| Lenovo IdeaPad 330-17IKB 81DM | |
| Average Intel Core i7-8650U (128 - 178, n=17) | |
| Getac S410 | |
| Acer Nitro 5 AN515-42-R6V0 | |
| Acer Swift 3 SF313-51-59SZ | |
| HP Pavilion x360 14-cd0002ng | |
| Lenovo ThinkPad A285-20MX0002GE | |
| Dell Latitude 7424 Rugged Extreme | |
| HP 15-db0500ng | |
| CPU Multi 64Bit | |
| Average of class Workstation (2489 - 5810, n=25, last 2 years) | |
| Schenker XMG Neo 15 Turing | |
| Acer Nitro 5 AN515-42-R6V0 | |
| Average Intel Core i7-8650U (451 - 675, n=19) | |
| Acer Swift 3 SF313-51-59SZ | |
| Lenovo IdeaPad 330-17IKB 81DM | |
| Lenovo ThinkPad A285-20MX0002GE | |
| Getac S410 | |
| Dell Latitude 7424 Rugged Extreme | |
| HP Pavilion x360 14-cd0002ng | |
| HP 15-db0500ng | |
| wPrime 2.10 - 1024m | |
| Acer Swift 3 SF313-51-59SZ | |
| Average Intel Core i7-8650U (268 - 335, n=3) | |
| Average of class Workstation (n=1last 2 years) | |
* ... smaller is better
| PCMark 8 | |
| Home Score Accelerated v2 | |
| Getac S410 | |
| Dell Latitude 7424 Rugged Extreme | |
| Average Intel Core i7-8650U, AMD Radeon RX 540 (4038 - 4052, n=2) | |
| Dell Latitude 5420 Rugged-P85G | |
| Lenovo ThinkPad P52 20MAS03N00 | |
| Panasonic Toughbook CF-54G2999VM | |
| Lenovo ThinkPad T480-20L50010US | |
| Panasonic Toughbook CF-XZ6 | |
| Work Score Accelerated v2 | |
| Lenovo ThinkPad P52 20MAS03N00 | |
| Dell Latitude 7424 Rugged Extreme | |
| Average Intel Core i7-8650U, AMD Radeon RX 540 (5170 - 5231, n=2) | |
| Dell Latitude 5420 Rugged-P85G | |
| Panasonic Toughbook CF-XZ6 | |
| PCMark 8 Home Score Accelerated v2 | 4052 points | |
| PCMark 8 Work Score Accelerated v2 | 5231 points | |
| PCMark 10 Score | 4497 points | |
Help | ||
| Dell Latitude 7424 Rugged Extreme SK Hynix PC401 512GB M.2 (HFS512GD9TNG) | Getac S410 CUKUSA 1 TB SATA SSD Q0526A | Panasonic Toughbook CF-54G2999VM Seagate BarraCuda Compute 1TB ST1000LM048 | Panasonic Toughbook CF-XZ6 Samsung SSD PM871a MZNLN256HMHQ | Dell Latitude 5420 Rugged-P85G SK hynix PC401 NVMe 500 GB | Lenovo ThinkPad T480-20L50010US Samsung SSD PM981 MZVLB512HAJQ | Lenovo ThinkPad P52 20MAS03N00 Samsung SSD PM981 MZVLB512HAJQ | Average SK Hynix PC401 512GB M.2 (HFS512GD9TNG) | |
|---|---|---|---|---|---|---|---|---|
| CrystalDiskMark 5.2 / 6 | -51% | -97% | -41% | -18% | -9% | 10% | 19% | |
| Write 4K (MB/s) | 114.4 | 74 -35% | 1.145 -99% | 97.7 -15% | 98.8 -14% | 123.2 8% | 108.5 -5% | 143.3 ? 25% |
| Read 4K (MB/s) | 43.86 | 31.85 -27% | 0.453 -99% | 34.76 -21% | 38.51 -12% | 44.43 1% | 42.78 -2% | 45.3 ? 3% |
| Write Seq (MB/s) | 1281 | 460.6 -64% | 52.2 -96% | 479.4 -63% | 843 -34% | 845 -34% | 1645 28% | 1514 ? 18% |
| Read Seq (MB/s) | 1918 | 514 -73% | 122.7 -94% | 507 -74% | 1282 -33% | 865 -55% | 1485 -23% | 1758 ? -8% |
| Write 4K Q32T1 (MB/s) | 422.5 | 211.4 -50% | 2.428 -99% | 273.5 -35% | 355.5 -16% | 287.3 -32% | 269.2 -36% | 425 ? 1% |
| Read 4K Q32T1 (MB/s) | 260.6 | 203.5 -22% | 1.063 -100% | 296.3 14% | 241.4 -7% | 360.9 38% | 348.7 34% | 459 ? 76% |
| Write Seq Q32T1 (MB/s) | 1282 | 523 -59% | 73.7 -94% | 524 -59% | 893 -30% | 1718 34% | 1877 46% | 1531 ? 19% |
| Read Seq Q32T1 (MB/s) | 2515 | 554 -78% | 120.4 -95% | 554 -78% | 2478 -1% | 1779 -29% | 3419 36% | 2895 ? 15% |
| Write 4K Q8T8 (MB/s) | 1523 | 918 ? | ||||||
| Read 4K Q8T8 (MB/s) | 1614 | 819 ? |

| 3DMark 11 | |
| 1280x720 Performance GPU | |
| Average of class Workstation (10888 - 69594, n=25, last 2 years) | |
| MSI GL73 8RD-418US | |
| HP Spectre x360 15-df0126ng | |
| Asus TUF FX505DY | |
| MSI PS63 Modern 8RC | |
| Dell Latitude 7424 Rugged Extreme | |
| Lenovo IdeaPad 330-17IKB 81DM | |
| Average AMD Radeon RX 540 (4443 - 4983, n=5) | |
| Honor Magicbook | |
| Acer TravelMate X3410-M-50DD | |
| Lenovo ThinkPad A285-20MX0002GE | |
| Dell Latitude 15 3590-K8JP | |
| Getac S410 | |
| 1280x720 Performance Combined | |
| Average of class Workstation (7847 - 27772, n=25, last 2 years) | |
| HP Spectre x360 15-df0126ng | |
| MSI GL73 8RD-418US | |
| MSI PS63 Modern 8RC | |
| Asus TUF FX505DY | |
| Dell Latitude 7424 Rugged Extreme | |
| Average AMD Radeon RX 540 (4334 - 6040, n=4) | |
| Lenovo IdeaPad 330-17IKB 81DM | |
| Acer TravelMate X3410-M-50DD | |
| Dell Latitude 15 3590-K8JP | |
| Honor Magicbook | |
| Lenovo ThinkPad A285-20MX0002GE | |
| Getac S410 | |
| 3DMark | |
| 1280x720 Cloud Gate Standard Graphics | |
| Average of class Workstation (46927 - 152418, n=15, last 2 years) | |
| MSI GL73 8RD-418US | |
| HP Spectre x360 15-df0126ng | |
| MSI PS63 Modern 8RC | |
| Asus TUF FX505DY | |
| Dell Latitude 7424 Rugged Extreme | |
| Average AMD Radeon RX 540 (18704 - 25616, n=4) | |
| Lenovo IdeaPad 330-17IKB 81DM | |
| Honor Magicbook | |
| Acer TravelMate X3410-M-50DD | |
| Lenovo ThinkPad A285-20MX0002GE | |
| Dell Latitude 15 3590-K8JP | |
| 1920x1080 Fire Strike Graphics | |
| Average of class Workstation (7578 - 52560, n=25, last 2 years) | |
| MSI GL73 8RD-418US | |
| HP Spectre x360 15-df0126ng | |
| Asus TUF FX505DY | |
| MSI PS63 Modern 8RC | |
| Dell Latitude 7424 Rugged Extreme | |
| Lenovo IdeaPad 330-17IKB 81DM | |
| Average AMD Radeon RX 540 (3242 - 3876, n=4) | |
| Acer TravelMate X3410-M-50DD | |
| Honor Magicbook | |
| Lenovo ThinkPad A285-20MX0002GE | |
| Dell Latitude 15 3590-K8JP | |
| 3DMark 11 Performance | 5273 points | |
| 3DMark Cloud Gate Standard Score | 13804 points | |
| 3DMark Fire Strike Score | 3488 points | |
Help | ||
| The Witcher 3 - 1366x768 Medium Graphics & Postprocessing | |
| Average of class Workstation (81.6 - 175, n=2, last 2 years) | |
| Asus TUF FX505DY | |
| Dell Latitude 7424 Rugged Extreme | |
| Average AMD Radeon RX 540 (29.3 - 39, n=3) | |
| low | med. | high | ultra | |
|---|---|---|---|---|
| The Witcher 3 (2015) | 37 |
Noise level
| Idle |
| 28.6 / 28.6 / 28.6 dB(A) |
| Load |
| 32.9 / 39 dB(A) |
 | ||
30 dB silent 40 dB(A) audible 50 dB(A) loud |
||
min: | ||
(±) The maximum temperature on the upper side is 41.6 °C / 107 F, compared to the average of 38.2 °C / 101 F, ranging from 22.2 to 69.8 °C for the class Workstation.
(-) The bottom heats up to a maximum of 47.6 °C / 118 F, compared to the average of 41.1 °C / 106 F
(+) In idle usage, the average temperature for the upper side is 25.4 °C / 78 F, compared to the device average of 32 °C / 90 F.
(+) The palmrests and touchpad are cooler than skin temperature with a maximum of 27 °C / 80.6 F and are therefore cool to the touch.
(±) The average temperature of the palmrest area of similar devices was 27.8 °C / 82 F (+0.8 °C / 1.4 F).
Dell Latitude 7424 Rugged Extreme audio analysis
(±) | speaker loudness is average but good (81.7 dB)
Bass 100 - 315 Hz
(-) | nearly no bass - on average 16.6% lower than median
(±) | linearity of bass is average (11.4% delta to prev. frequency)
Mids 400 - 2000 Hz
(+) | balanced mids - only 4.7% away from median
(±) | linearity of mids is average (7.6% delta to prev. frequency)
Highs 2 - 16 kHz
(+) | balanced highs - only 4.6% away from median
(±) | linearity of highs is average (7.6% delta to prev. frequency)
Overall 100 - 16.000 Hz
(±) | linearity of overall sound is average (17.7% difference to median)
Compared to same class
» 55% of all tested devices in this class were better, 9% similar, 35% worse
» The best had a delta of 7%, average was 17%, worst was 35%
Compared to all devices tested
» 35% of all tested devices were better, 8% similar, 57% worse
» The best had a delta of 4%, average was 24%, worst was 134%
Getac S410 audio analysis
(±) | speaker loudness is average but good (76.2 dB)
Bass 100 - 315 Hz
(±) | reduced bass - on average 13.6% lower than median
(+) | bass is linear (6.1% delta to prev. frequency)
Mids 400 - 2000 Hz
(±) | higher mids - on average 6.5% higher than median
(±) | linearity of mids is average (8.4% delta to prev. frequency)
Highs 2 - 16 kHz
(+) | balanced highs - only 3.1% away from median
(+) | highs are linear (6.2% delta to prev. frequency)
Overall 100 - 16.000 Hz
(±) | linearity of overall sound is average (19.9% difference to median)
Compared to same class
» 42% of all tested devices in this class were better, 9% similar, 50% worse
» The best had a delta of 7%, average was 21%, worst was 53%
Compared to all devices tested
» 51% of all tested devices were better, 7% similar, 42% worse
» The best had a delta of 4%, average was 24%, worst was 134%
Panasonic Toughbook CF-54G2999VM audio analysis
(-) | not very loud speakers (65.9 dB)
Bass 100 - 315 Hz
(-) | nearly no bass - on average 25.6% lower than median
(+) | bass is linear (5% delta to prev. frequency)
Mids 400 - 2000 Hz
(±) | higher mids - on average 7.8% higher than median
(-) | mids are not linear (17.3% delta to prev. frequency)
Highs 2 - 16 kHz
(+) | balanced highs - only 4.3% away from median
(±) | linearity of highs is average (7.9% delta to prev. frequency)
Overall 100 - 16.000 Hz
(-) | overall sound is not linear (39.6% difference to median)
Compared to same class
» 99% of all tested devices in this class were better, 1% similar, 1% worse
» The best had a delta of 7%, average was 21%, worst was 53%
Compared to all devices tested
» 95% of all tested devices were better, 0% similar, 5% worse
» The best had a delta of 4%, average was 24%, worst was 134%
| Off / Standby | |
| Idle | |
| Load |
|
Key:
min: | |
| Dell Latitude 7424 Rugged Extreme i7-8650U, Radeon RX 540, SK Hynix PC401 512GB M.2 (HFS512GD9TNG), IPS, 1920x1080, 14" | Getac S410 i5-8550U, UHD Graphics 620, CUKUSA 1 TB SATA SSD Q0526A, TN PED, 1366x768, 14" | Panasonic Toughbook CF-54G2999VM i5-7300U, HD Graphics 620, Seagate BarraCuda Compute 1TB ST1000LM048, TN LED, 1366x768, 14" | Panasonic Toughbook CF-XZ6 i5-7300U, HD Graphics 620, Samsung SSD PM871a MZNLN256HMHQ, IPS LED, 2160x1440, 12" | Dell Latitude 5420 Rugged-P85G i7-8650U, Radeon RX 540, SK hynix PC401 NVMe 500 GB, IPS, 1920x1080, 14" | Lenovo ThinkPad T480-20L50010US i7-8650U, UHD Graphics 620, Samsung SSD PM981 MZVLB512HAJQ, TFT-LCD, 1920x1080, 14" | Lenovo ThinkPad P52 20MAS03N00 i7-8750H, Quadro P1000, Samsung SSD PM981 MZVLB512HAJQ, IPS LED, 1920x1080, 15.6" | |
|---|---|---|---|---|---|---|---|
| Power Consumption | 45% | 52% | 64% | 9% | 44% | 7% | |
| Idle Minimum * (Watt) | 6.5 | 5.6 14% | 4.4 32% | 3.15 52% | 4.8 26% | 3.8 42% | 4.02 38% |
| Idle Average * (Watt) | 15.1 | 7.9 48% | 6.3 58% | 6 60% | 13.6 10% | 7.7 49% | 7.2 52% |
| Idle Maximum * (Watt) | 16.1 | 8.4 48% | 6.5 60% | 6.3 61% | 13.8 14% | 9.3 42% | 11.46 29% |
| Load Average * (Watt) | 70.5 | 32.8 53% | 36.3 49% | 21 70% | 67.8 4% | 45.7 35% | 76.3 -8% |
| Witcher 3 ultra * (Watt) | 68.1 | 69.1 -1% | 74 -9% | ||||
| Load Maximum * (Watt) | 95.2 | 34.3 64% | 38.3 60% | 23 76% | 93.5 2% | 46.1 52% | 154 -62% |
* ... smaller is better
| Dell Latitude 7424 Rugged Extreme i7-8650U, Radeon RX 540, 102 Wh | Getac S410 i5-8550U, UHD Graphics 620, 46.6 Wh | Panasonic Toughbook CF-54G2999VM i5-7300U, HD Graphics 620, 33 Wh | Panasonic Toughbook CF-XZ6 i5-7300U, HD Graphics 620, 76 Wh | Dell Latitude 5420 Rugged-P85G i7-8650U, Radeon RX 540, 102 Wh | Lenovo ThinkPad T480-20L50010US i7-8650U, UHD Graphics 620, 24 Wh | Lenovo ThinkPad P52 20MAS03N00 i7-8750H, Quadro P1000, 96 Wh | |
|---|---|---|---|---|---|---|---|
| Battery runtime | -56% | -50% | 18% | 29% | -38% | -31% | |
| WiFi v1.3 (h) | 11.7 | 5.2 -56% | 5.9 -50% | 14 20% | 16.2 38% | 7.3 -38% | 10.6 -9% |
| Load (h) | 2.7 | 3.1 15% | 3.2 19% | 1.3 -52% | |||
| Reader / Idle (h) | 22.1 | 31.4 | 25.3 |
Pros
Cons
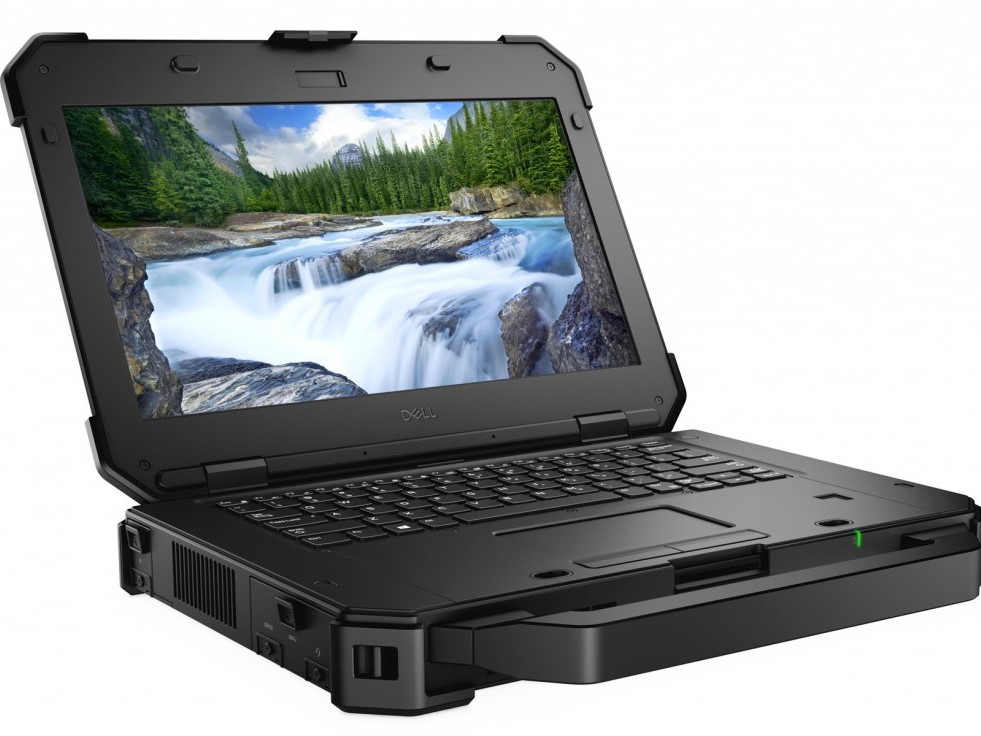
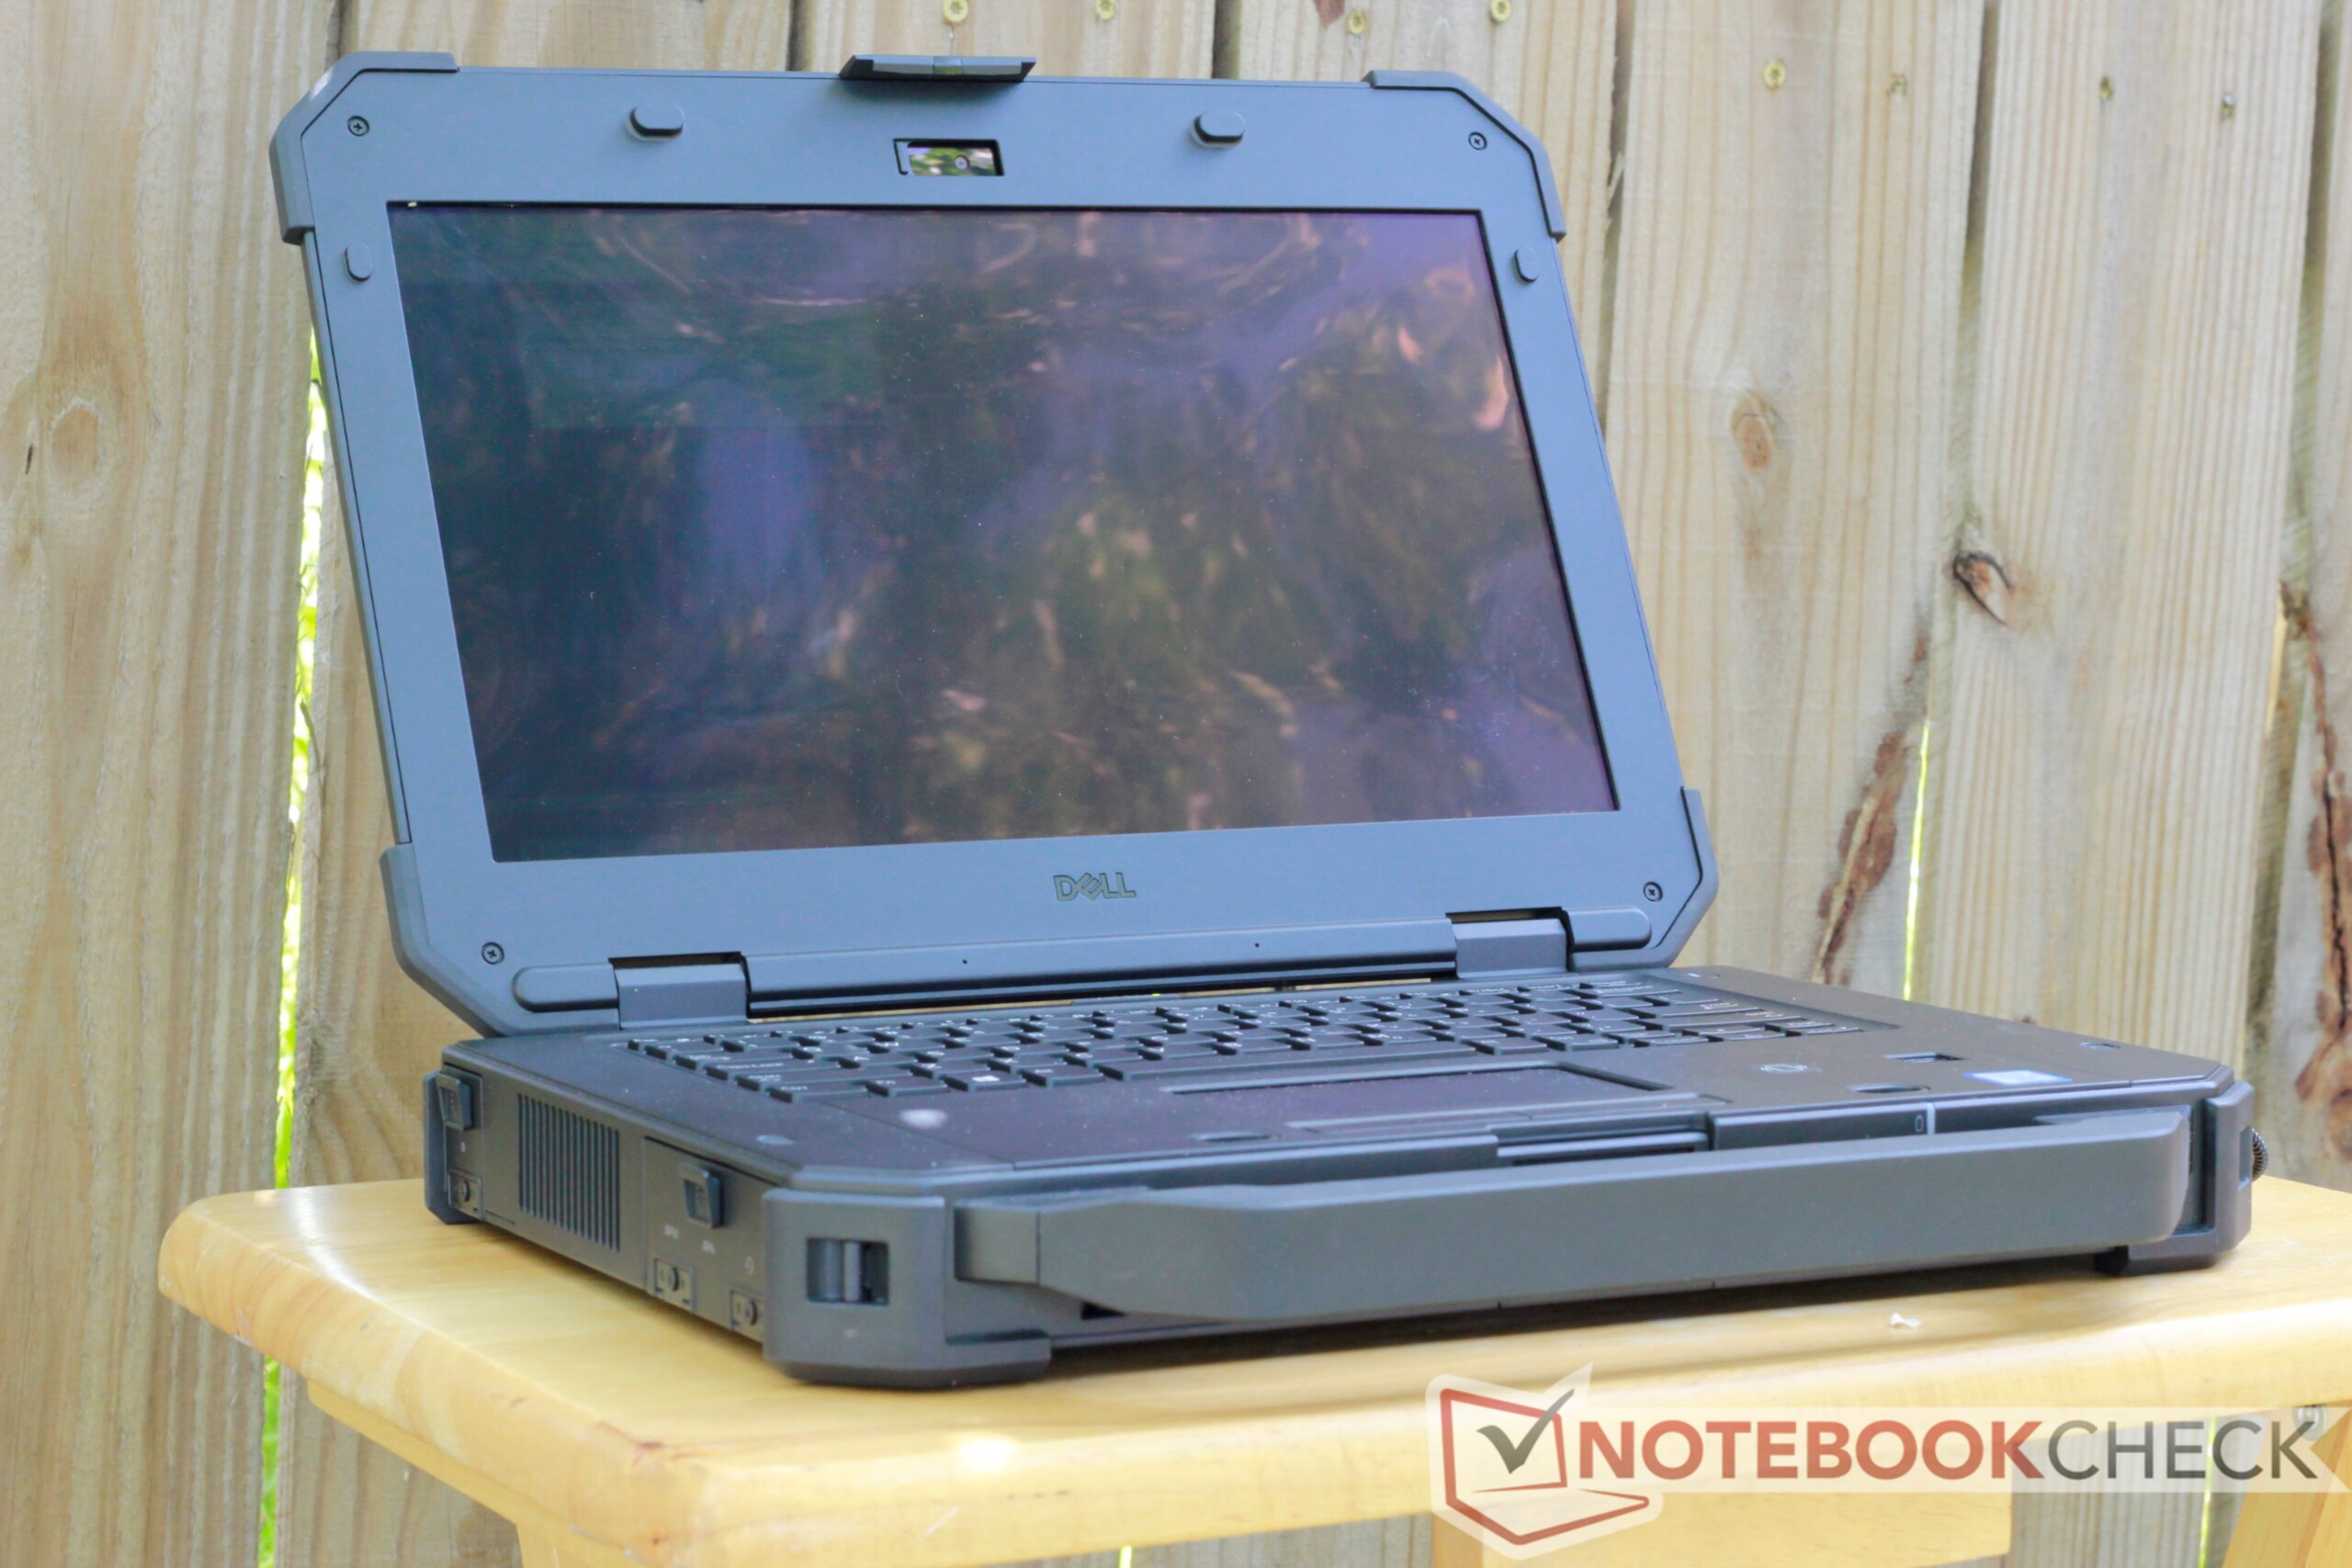
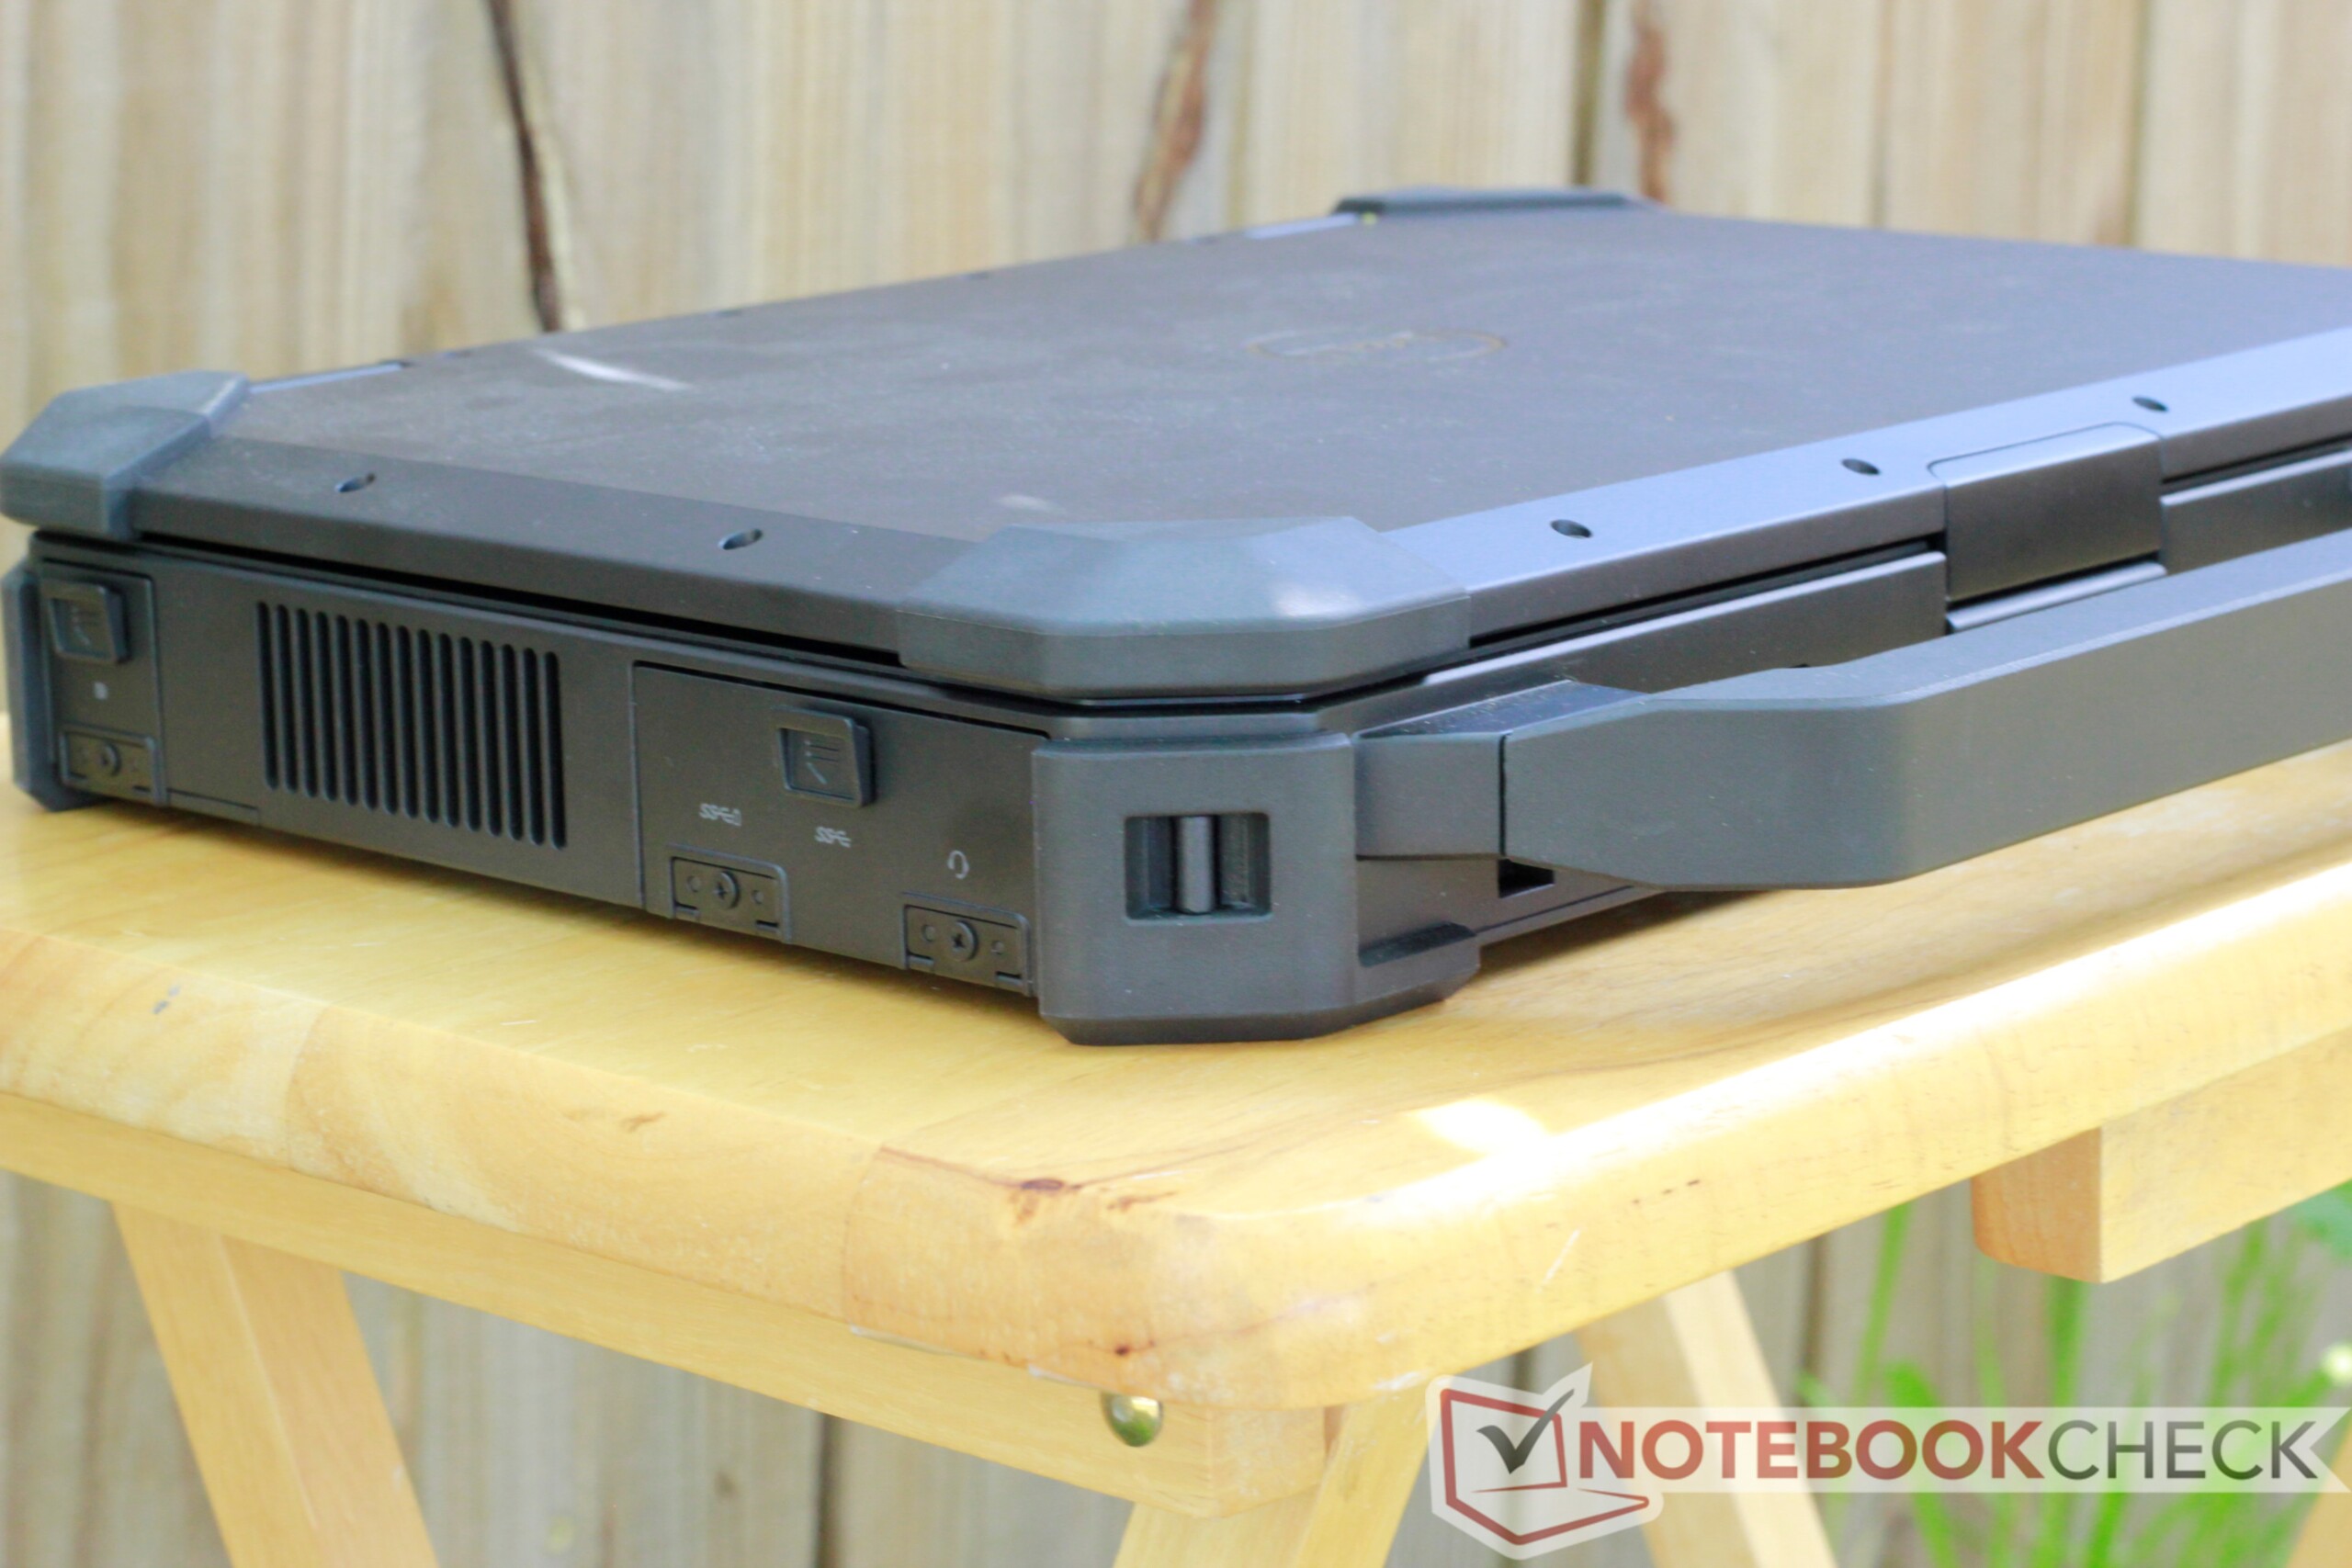
戴尔Latitude 7424 Rugged Extreme是坚固型笔记本电脑的标杆。它很厚,很重,但它很耐用。该机器具有防尘和防水功能,因此适用于建筑工地和野外作业等恶劣的工作环境。该机器是一个称职的主力机器,可以流畅地处理各种工作流程,并且功能多样。
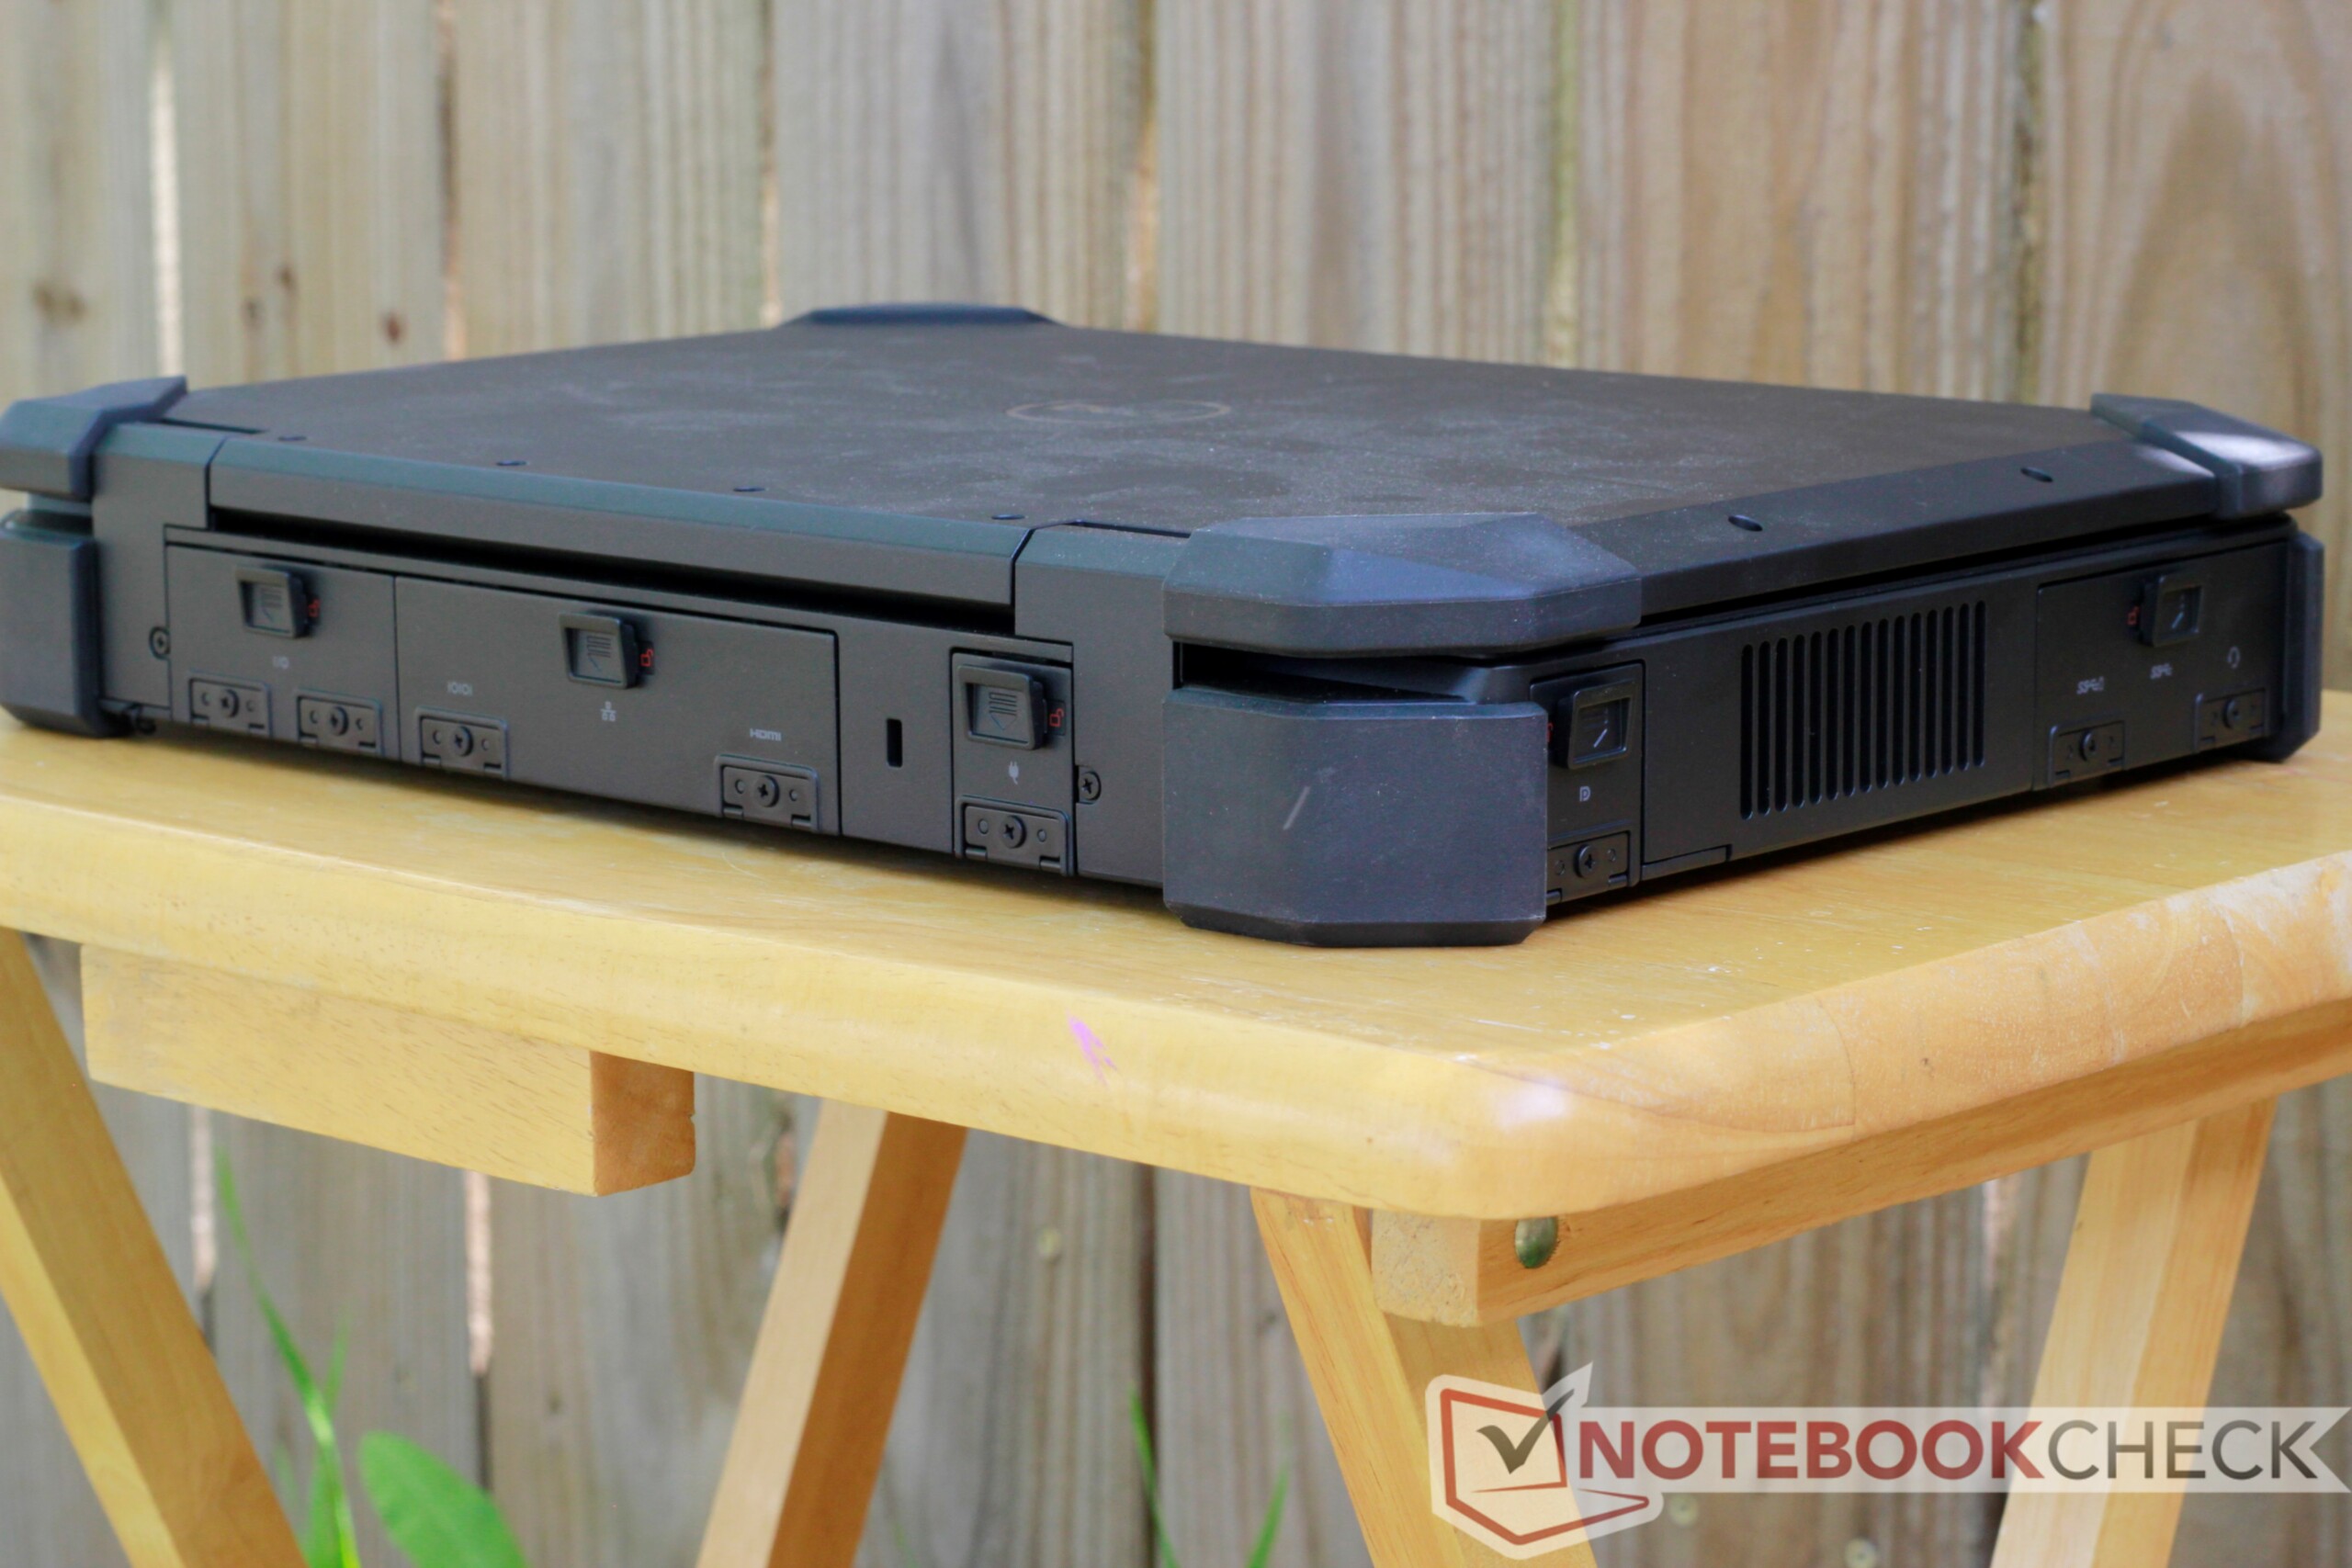
也就是说,与戴尔Latitude 5420 Rugged相比,它相形见绌。由于其更薄的外形,5420更便携。 5420还具差不多的•性能,更好的显示屏和更长的电池续航。 7424 Rugged Extreme的最大优点是其出色的防风雨性和对于手套输入的友好性。7424的性能比5420稍微强一点,但差距最小。
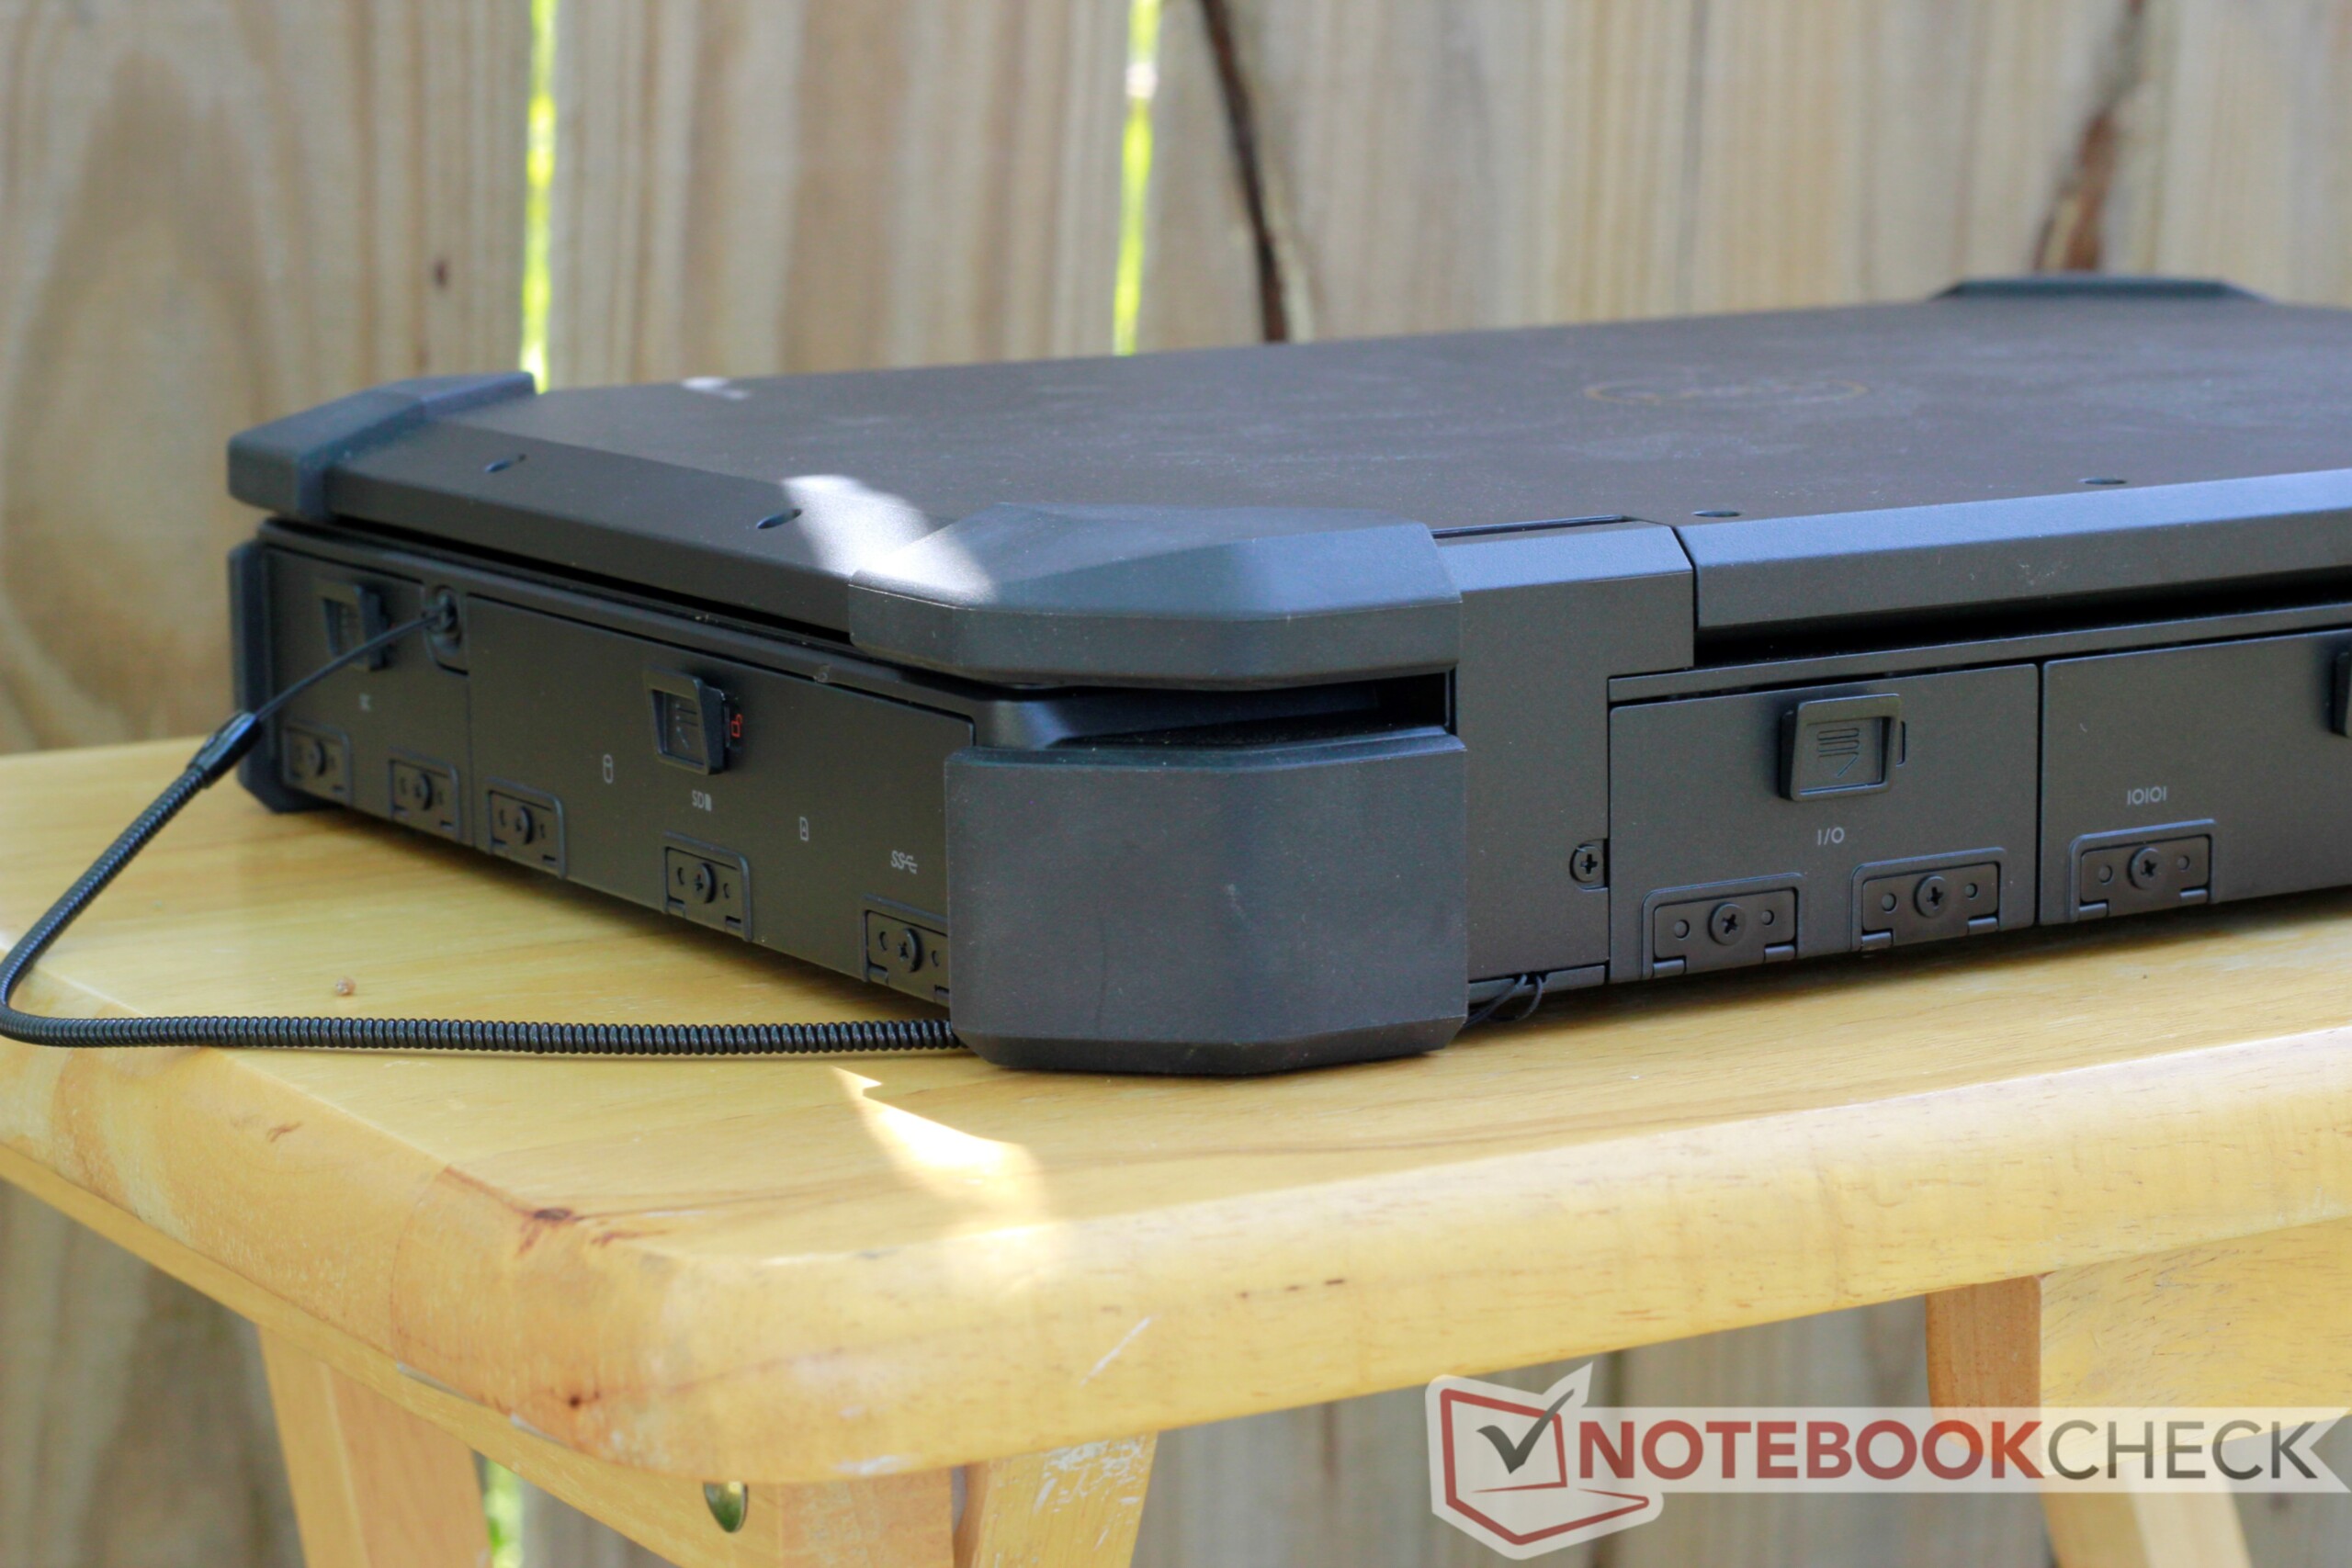
总而言之,戴尔Latitude 7424 Rugged Extreme是一款坚固耐用的笔记本电脑,可提供出色的全方位性能,但你有更好的选择。除非你需要增加水和灰尘保护或经常使用手套,Latitude 5420 Rugged是一个更好的选择。
Dell Latitude 7424 Rugged Extreme
- 03/30/2019 v6 (old)
Sam Medley
Price comparison

