评语:ThinkPad T16g Gen 3 功能齐全,但性能不佳
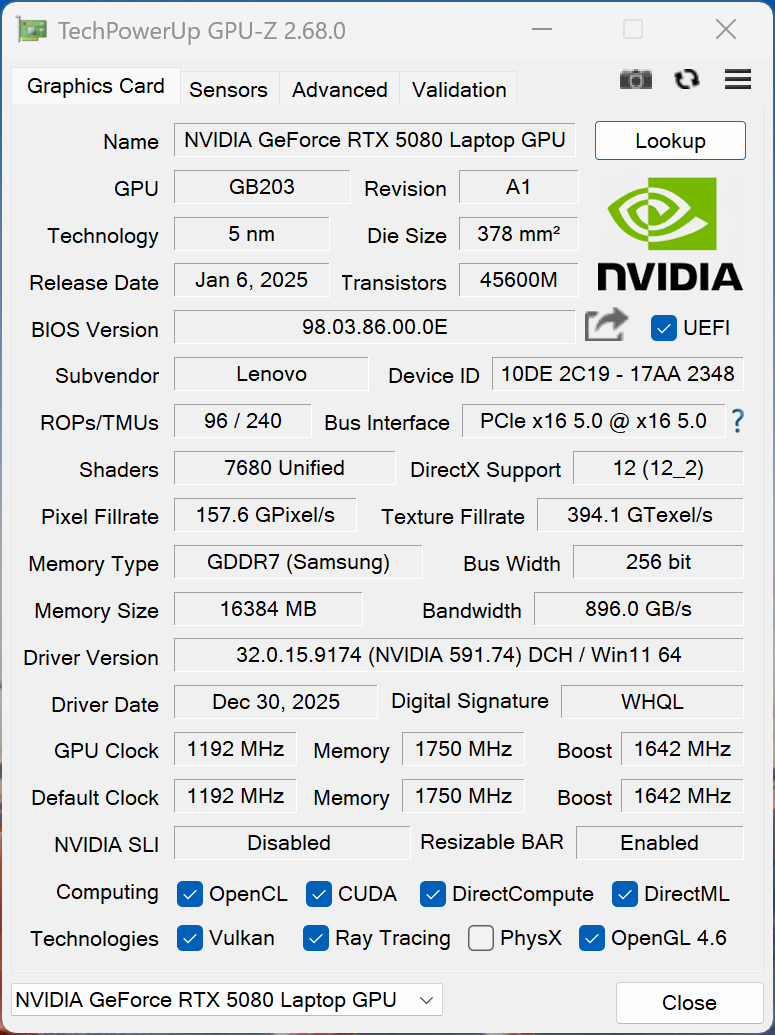
说到大型移动工作站,人们对其出色性能的期望是无可厚非的。然而,联想在新推出的 ThinkPad T16g Gen 3 和 ThinkPad P16 Gen 3 上只使用了微弱的 180 瓦电源,给自己制造了不必要的麻烦。虽然 CPU 性能非常不错,但它却是我们迄今为止测试过的最慢的GeForce RTX 5080(105 瓦 TGP)。即使是搭载 RTX 5070 Ti 的竞争对手也普遍速度更快,这些限制自然也适用于 ThinkPad P16 Gen 3 中的 RTX PRO GPU。此外,只要你真正将这些组件设置为任务,电池就会因为供电不足而反复耗尽,风扇的声音也会变得恼人。
在功能、维护选项和整体功能方面,ThinkPad T16g Gen 3 的得分都很高,因此总体而言是一款 "不错 "的工作站。亚光串联 OLED 显示屏也提供了良好的图像质量,尽管亚光触摸屏使显示的图像略显粗糙。
虽然新机箱提高了便携性,但你不得不怀疑是否牺牲了太多性能。
Pros
Cons
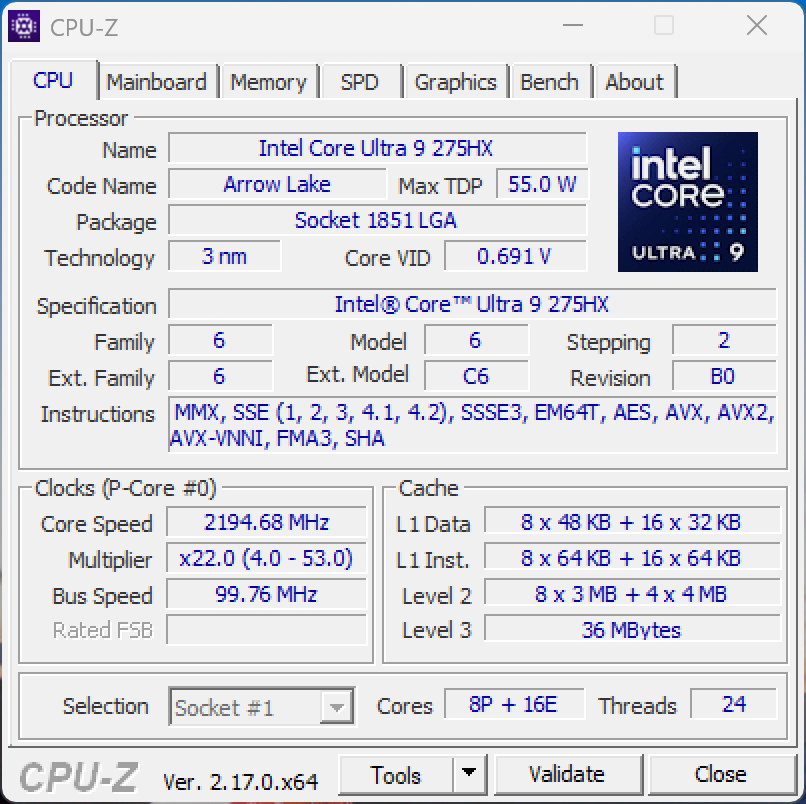
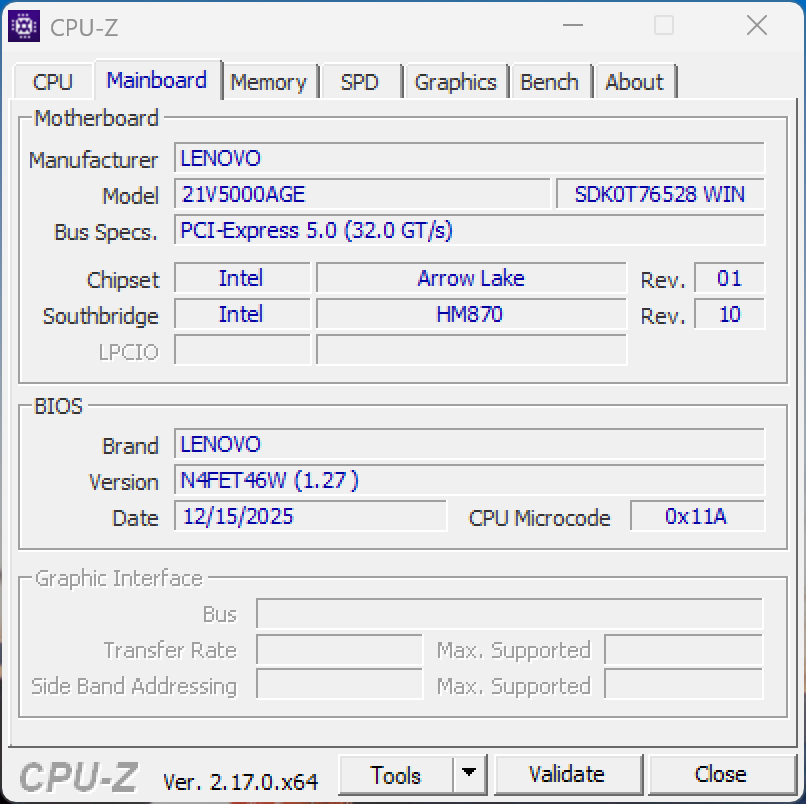
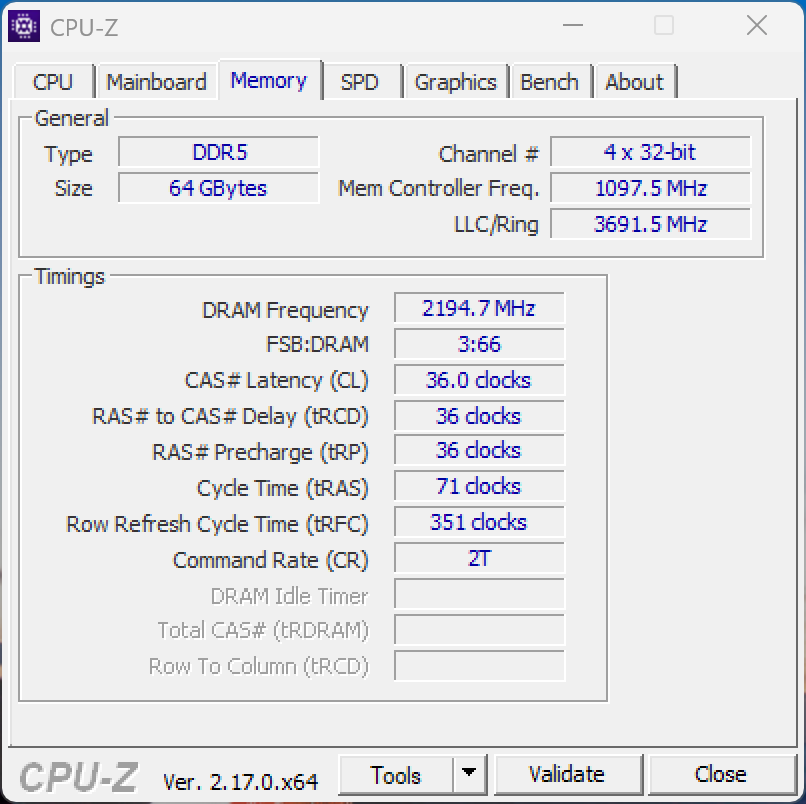
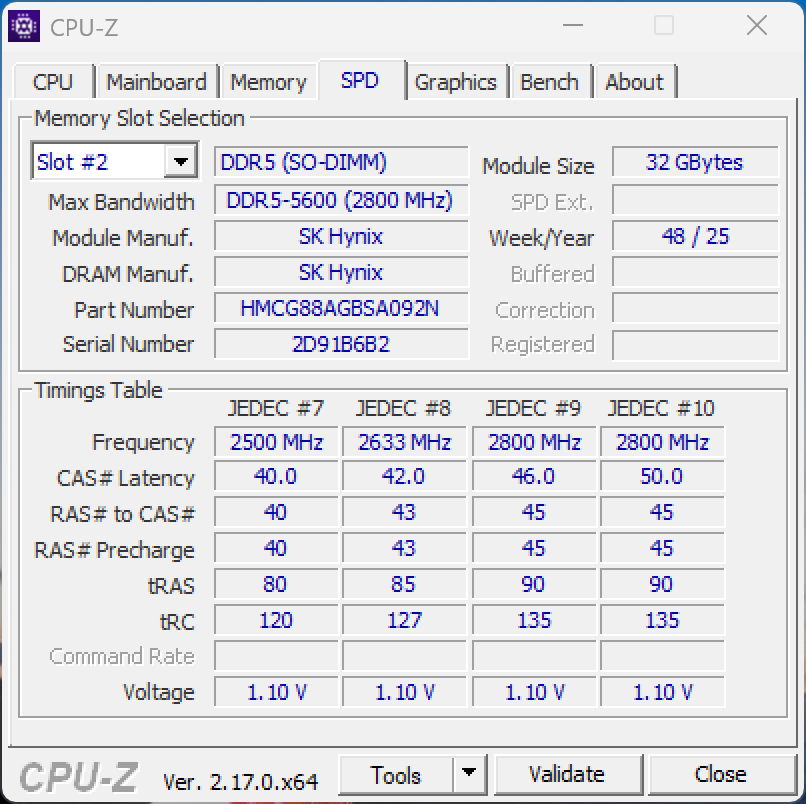
今年,联想完全重新设计了其大型 ThinkPad P16 Gen 3工作站,制造商还推出了几乎完全相同的 ThinkPad T16g Gen 3,用普通的GeForce GPU 取代了 RTX PRO GPU。我们评测了配备酷睿 Ultra 9 275HX、GeForce RTX 5080 笔记本显卡、64 GB 内存和雾面串联 OLED 触摸屏的高端版本,售价约为 5600 美元。
规格
外壳和功能
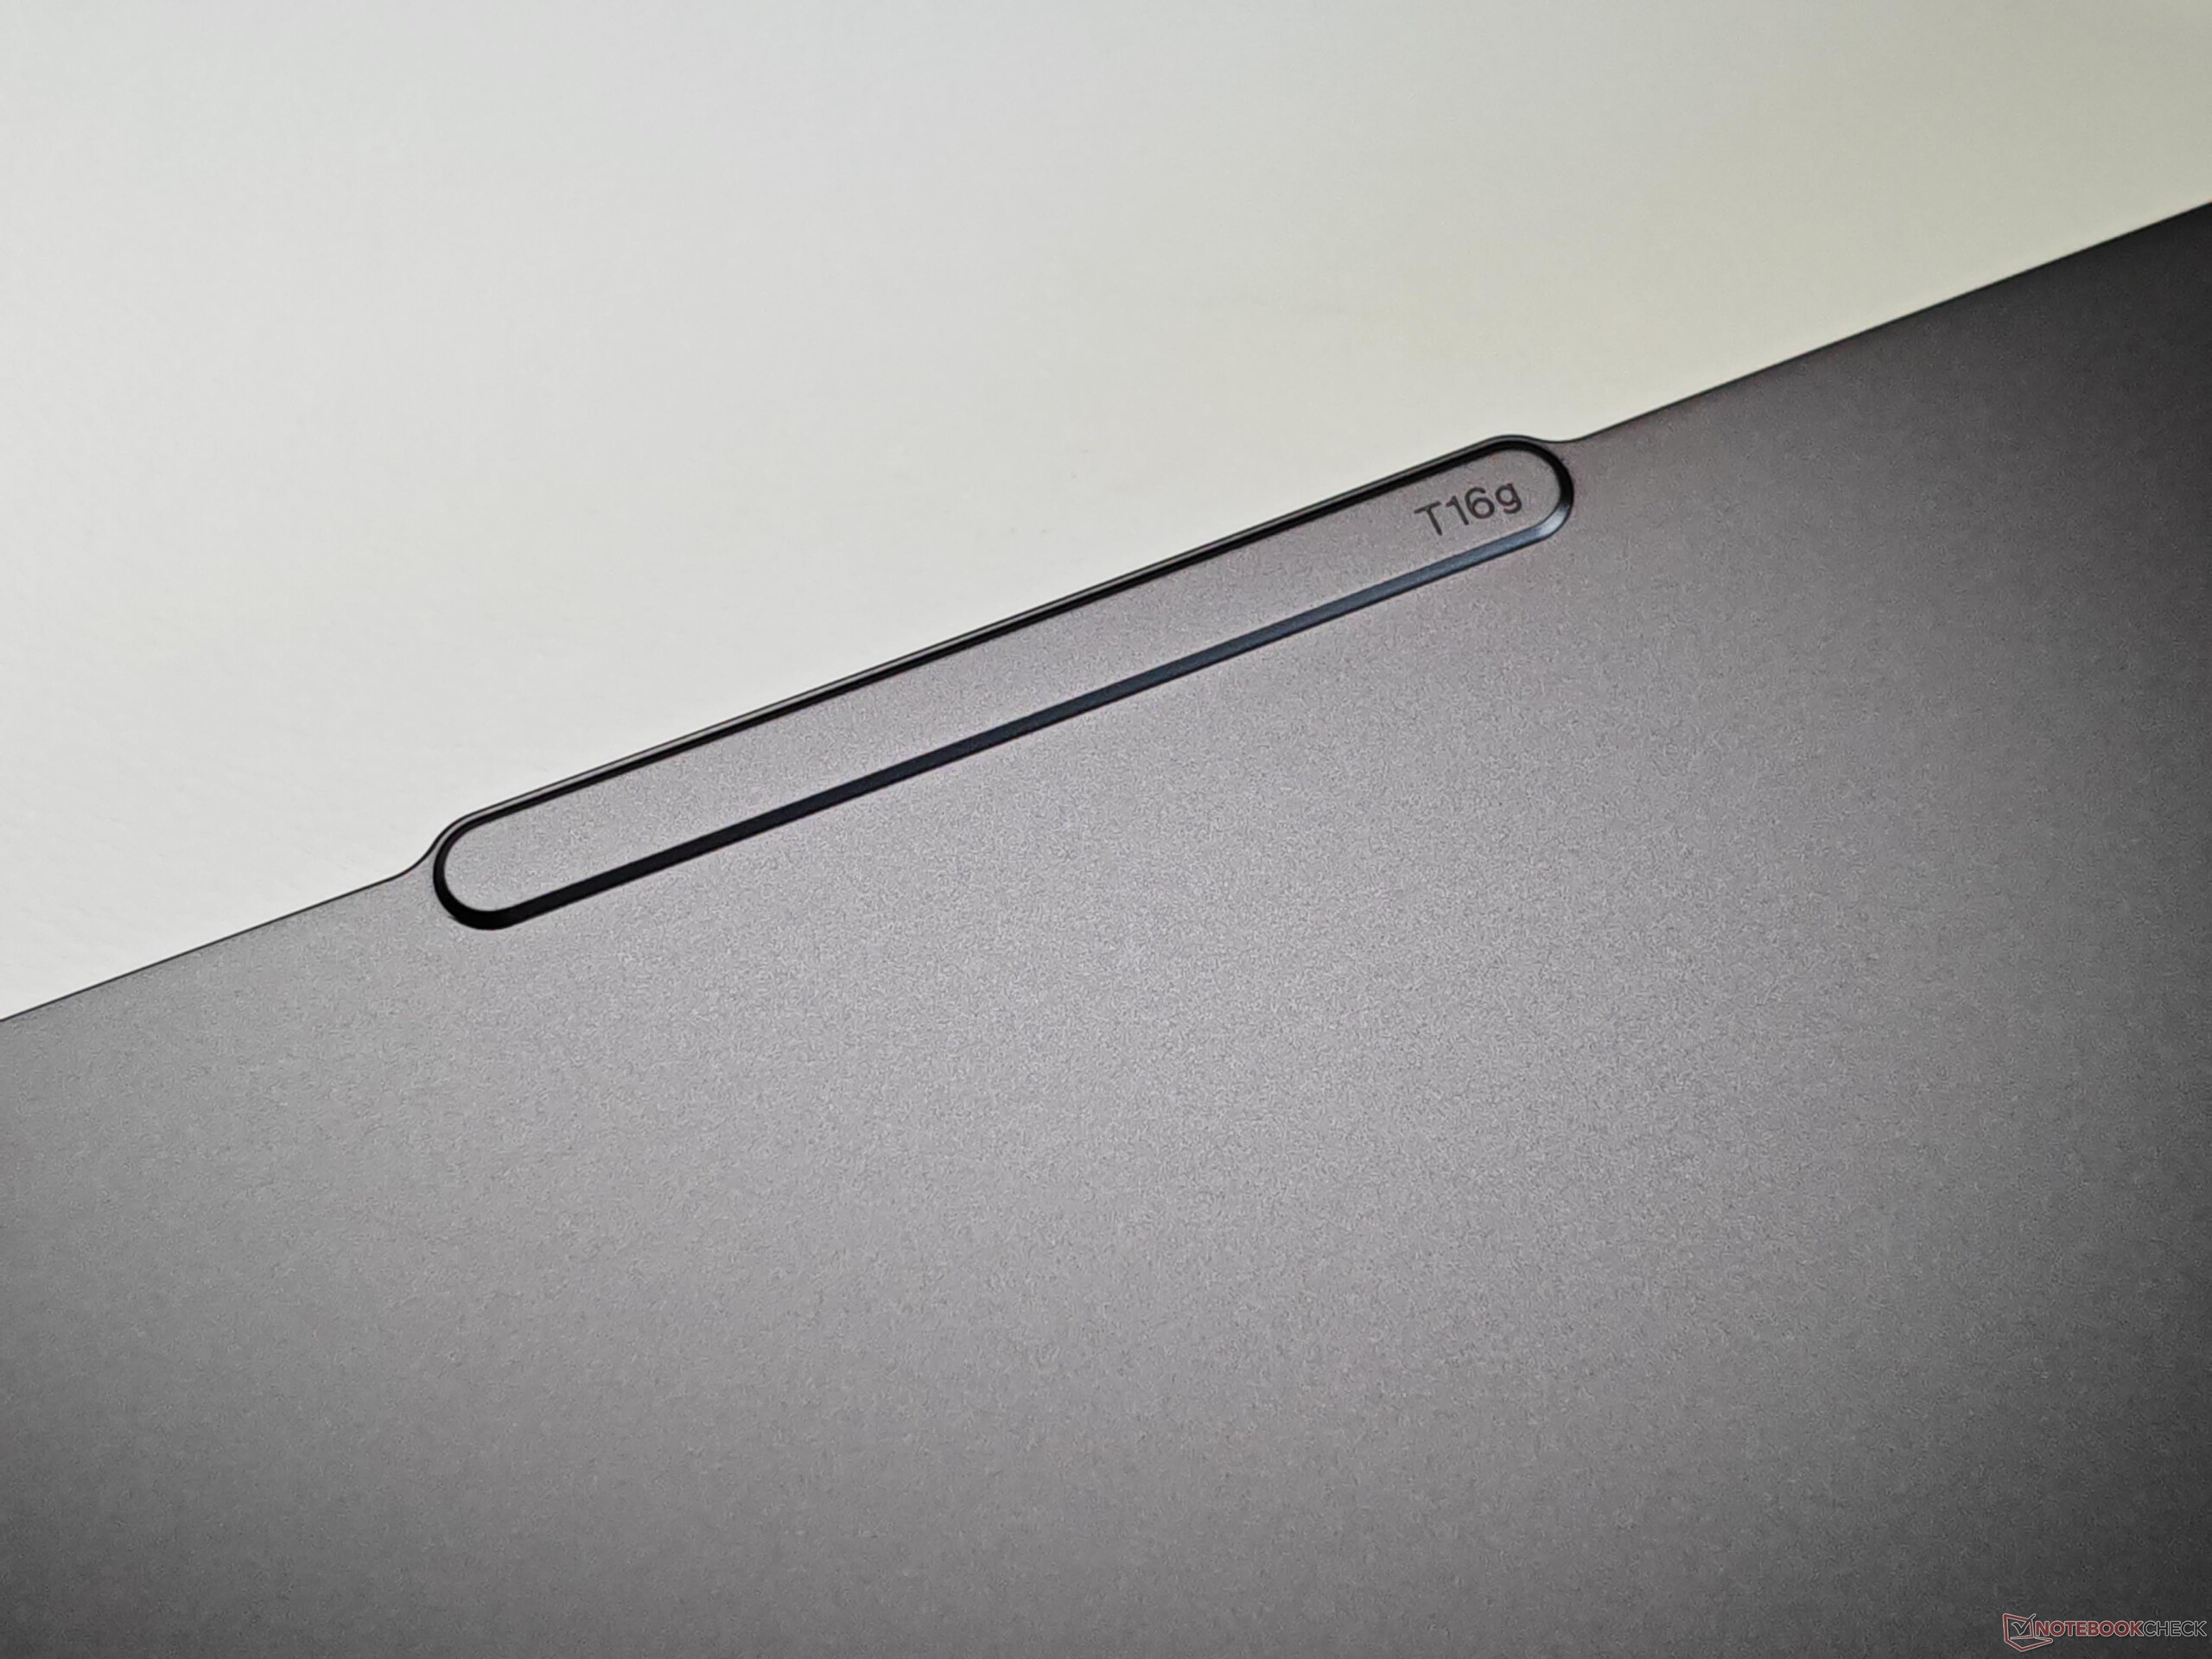
与旧款 ThinkPad P16 Gen 2联想对其外壳进行了彻底改造,更加注重移动性和可维护性。新机型重约 2.6 千克,比上一代产品轻了近 500 克,但高度仅略有降低(30.2 毫米对 29.8 毫米)。重量的减轻并没有影响稳定性,底座和显示屏盖都非常坚固。铝制显示屏盖很容易沾染指纹,但底座顶部的碳纤维增强塑料在这方面表现较好。从视觉角度来看,T16g Gen 3 延续了 ThinkPad 目前的设计,包括突出的摄像头凸起。
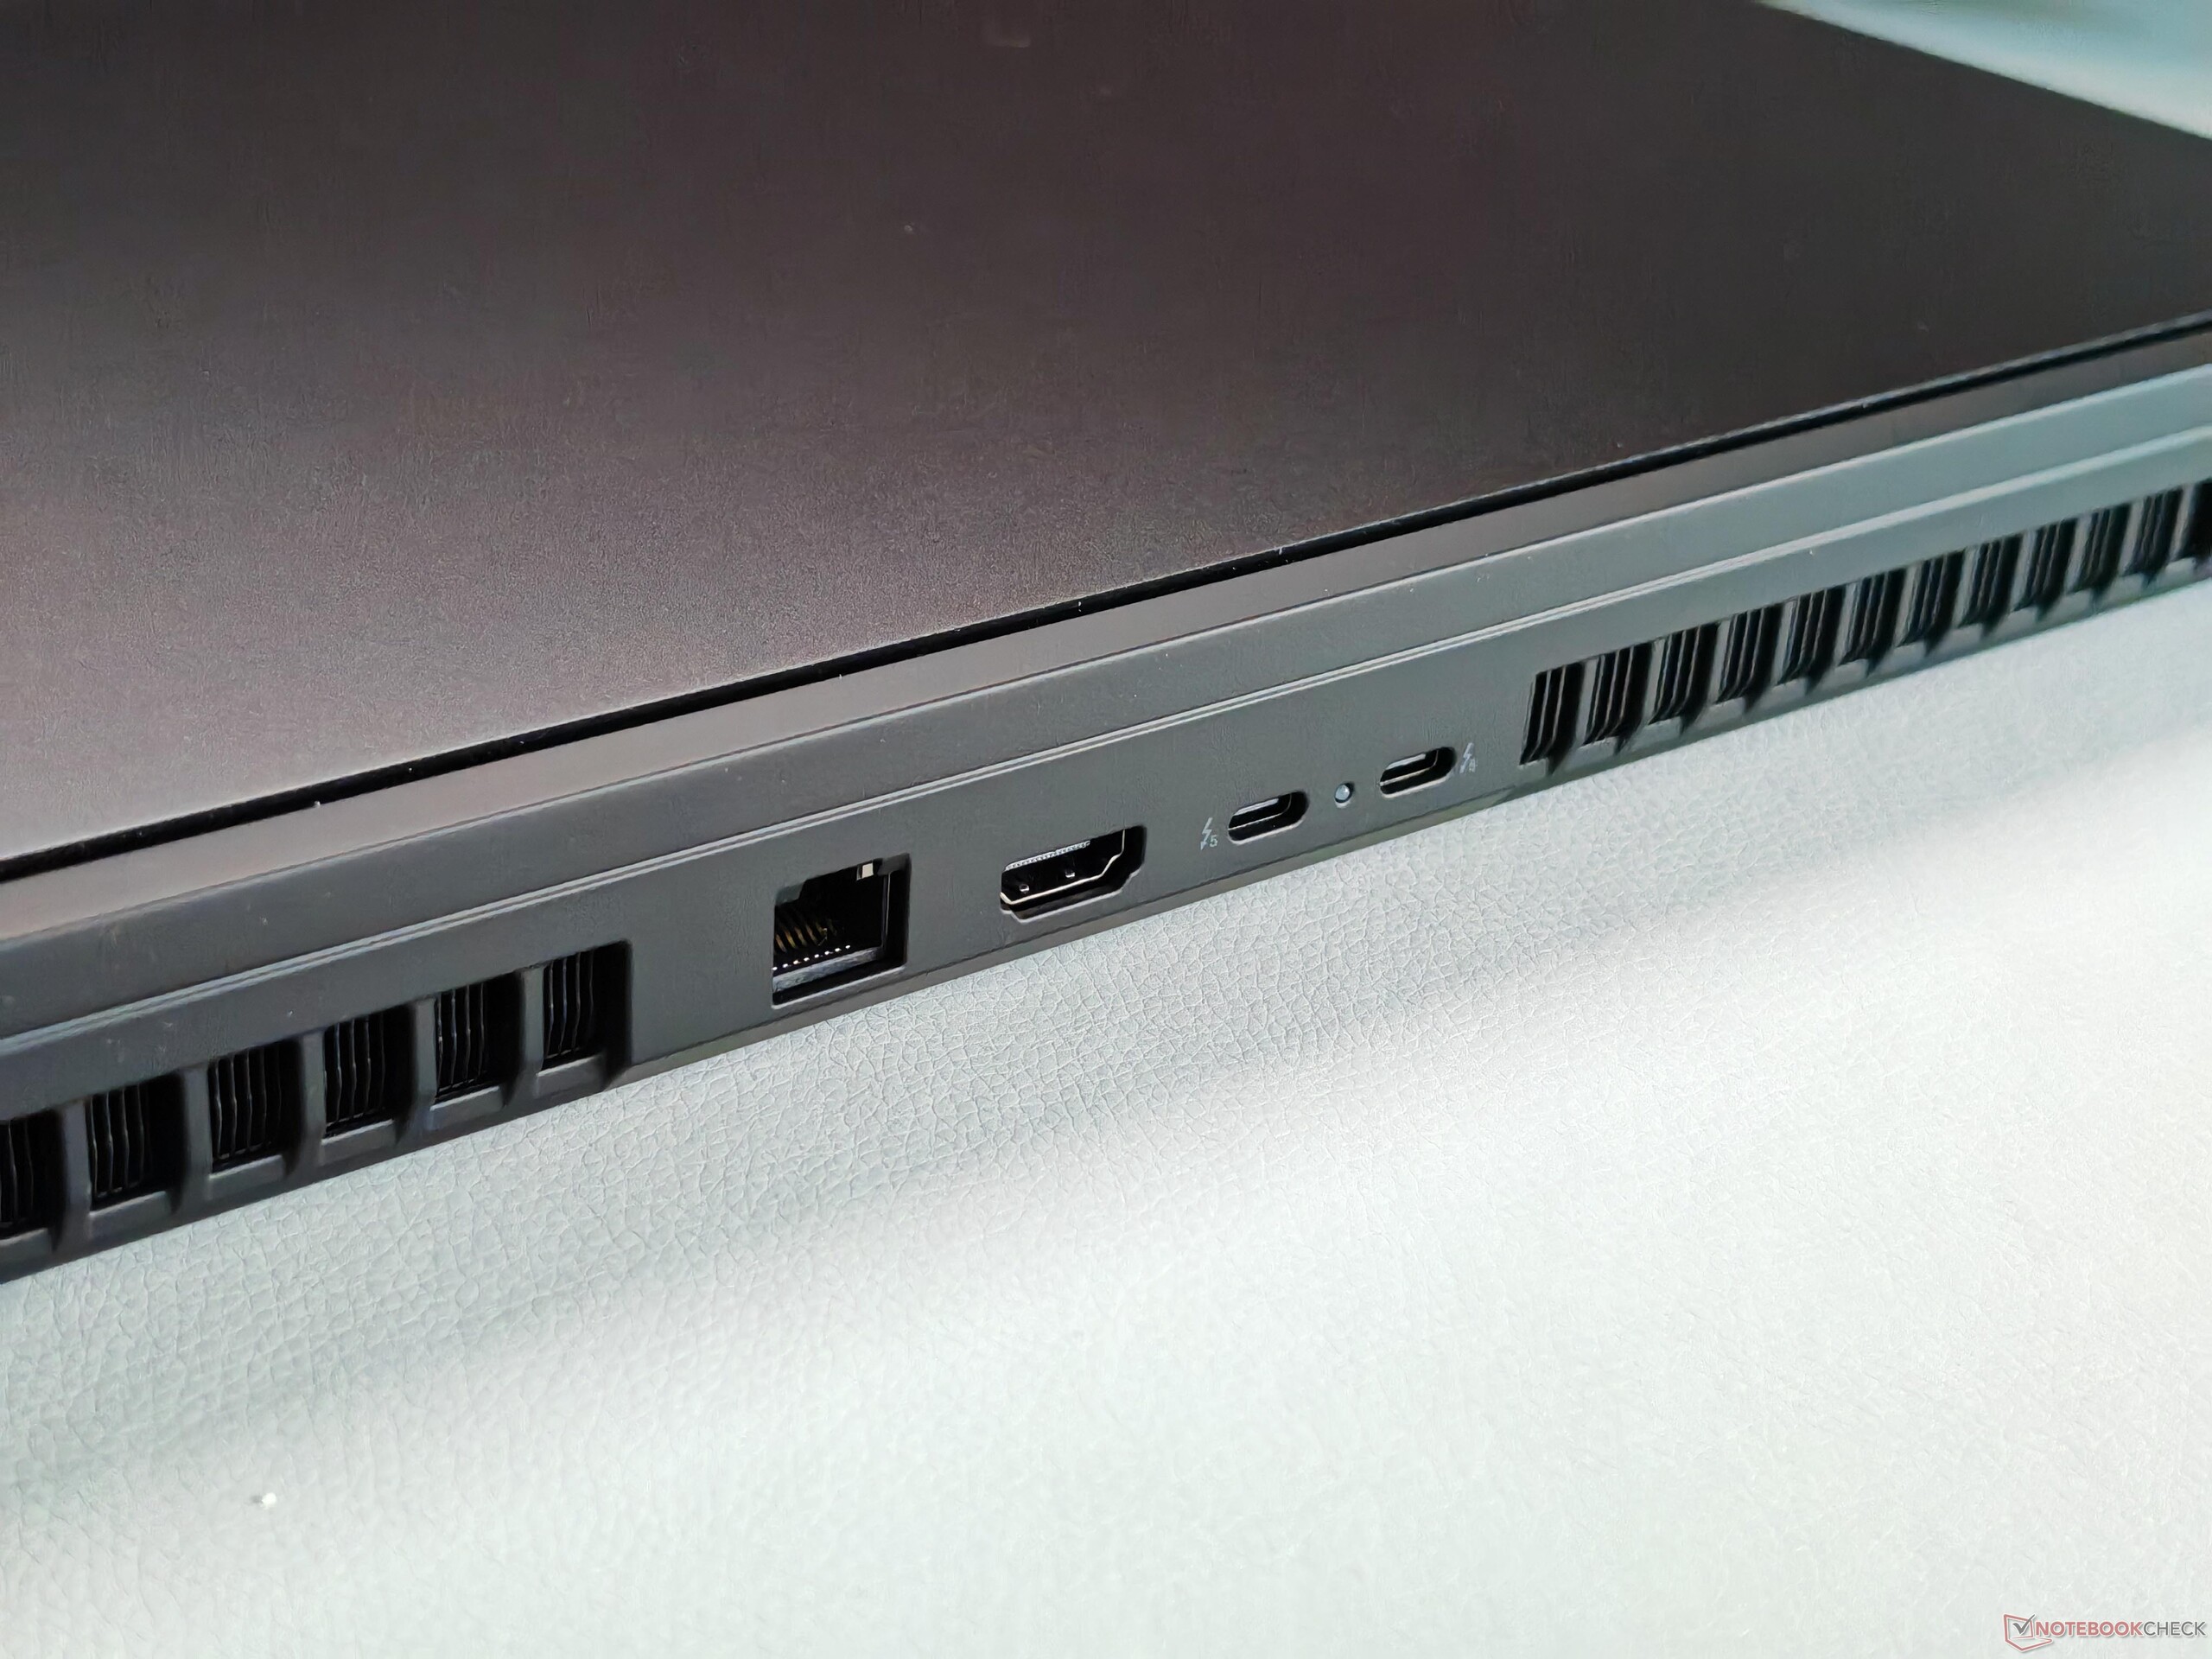
在功能方面,T16g 提供了你所希望的一切(Thunderbolt 5、2.5 Gbps 以太网、Wi-Fi 7),智能卡读写器和 5G 调制解调器也可作为选件,但必须同时订购(不能加装)。读卡器已支持 SD Express 8.0,使用兼容卡,我们的传输速度超过了 1.4 GB/s。500 万像素摄像头(具有机械光圈和红外人脸识别功能)拍摄的照片效果不错。SlimTip 充电接口已被移除,T16g 只能通过 USB-C 接口充电。


| SD Card Reader | |
| average JPG Copy Test (av. of 3 runs) | |
| Lenovo ThinkPad T16g Gen 3 RTX 5080 (ADATA SD8.0 Express 512 GB) | |
| Lenovo ThinkPad T16g Gen 3 RTX 5080 (Angelbird AV Pro V60) | |
| Average of class Workstation (49.6 - 681, n=14, last 2 years) | |
| Schenker XMG Pro 16 (E25) (Angelbird AV Pro V60) | |
| HP ZBook Fury 16 G11 (Toshiba Exceria Pro SDXC 64 GB UHS-II) | |
| Lenovo ThinkPad P16 Gen 2 (Toshiba Exceria Pro SDXC 64 GB UHS-II) | |
| Dell Pro Max 16 Plus (Toshiba Exceria Pro SDXC 64 GB UHS-II) | |
| maximum AS SSD Seq Read Test (1GB) | |
| Lenovo ThinkPad T16g Gen 3 RTX 5080 (ADATA SD8.0 Express 512 GB) | |
| Lenovo ThinkPad T16g Gen 3 RTX 5080 (Angelbird AV Pro V60) | |
| Schenker XMG Pro 16 (E25) (Angelbird AV Pro V60) | |
| Average of class Workstation (87.6 - 1455, n=14, last 2 years) | |
| HP ZBook Fury 16 G11 (Toshiba Exceria Pro SDXC 64 GB UHS-II) | |
| Dell Pro Max 16 Plus (Toshiba Exceria Pro SDXC 64 GB UHS-II) | |
| Lenovo ThinkPad P16 Gen 2 (Toshiba Exceria Pro SDXC 64 GB UHS-II) | |
| Networking | |
| Lenovo ThinkPad T16g Gen 3 RTX 5080 | |
| iperf3 transmit AXE11000 | |
| iperf3 receive AXE11000 | |
| HP ZBook Studio 16 G11 | |
| iperf3 transmit AXE11000 | |
| iperf3 receive AXE11000 | |
| iperf3 transmit AXE11000 6GHz | |
| iperf3 receive AXE11000 6GHz | |
| Dell Pro Max 16 Plus | |
| iperf3 transmit AXE11000 | |
| iperf3 receive AXE11000 | |
| iperf3 transmit AXE11000 6GHz | |
| iperf3 receive AXE11000 6GHz | |
| Lenovo ThinkPad P16 Gen 2 | |
| iperf3 transmit AXE11000 | |
| iperf3 receive AXE11000 | |
| iperf3 transmit AXE11000 6GHz | |
| iperf3 receive AXE11000 6GHz | |
| HP ZBook Fury 16 G11 | |
| iperf3 transmit AXE11000 | |
| iperf3 receive AXE11000 | |
| iperf3 transmit AXE11000 6GHz | |
| iperf3 receive AXE11000 6GHz | |
| Schenker XMG Pro 16 (E25) | |
| iperf3 transmit AXE11000 | |
| iperf3 receive AXE11000 | |


维护
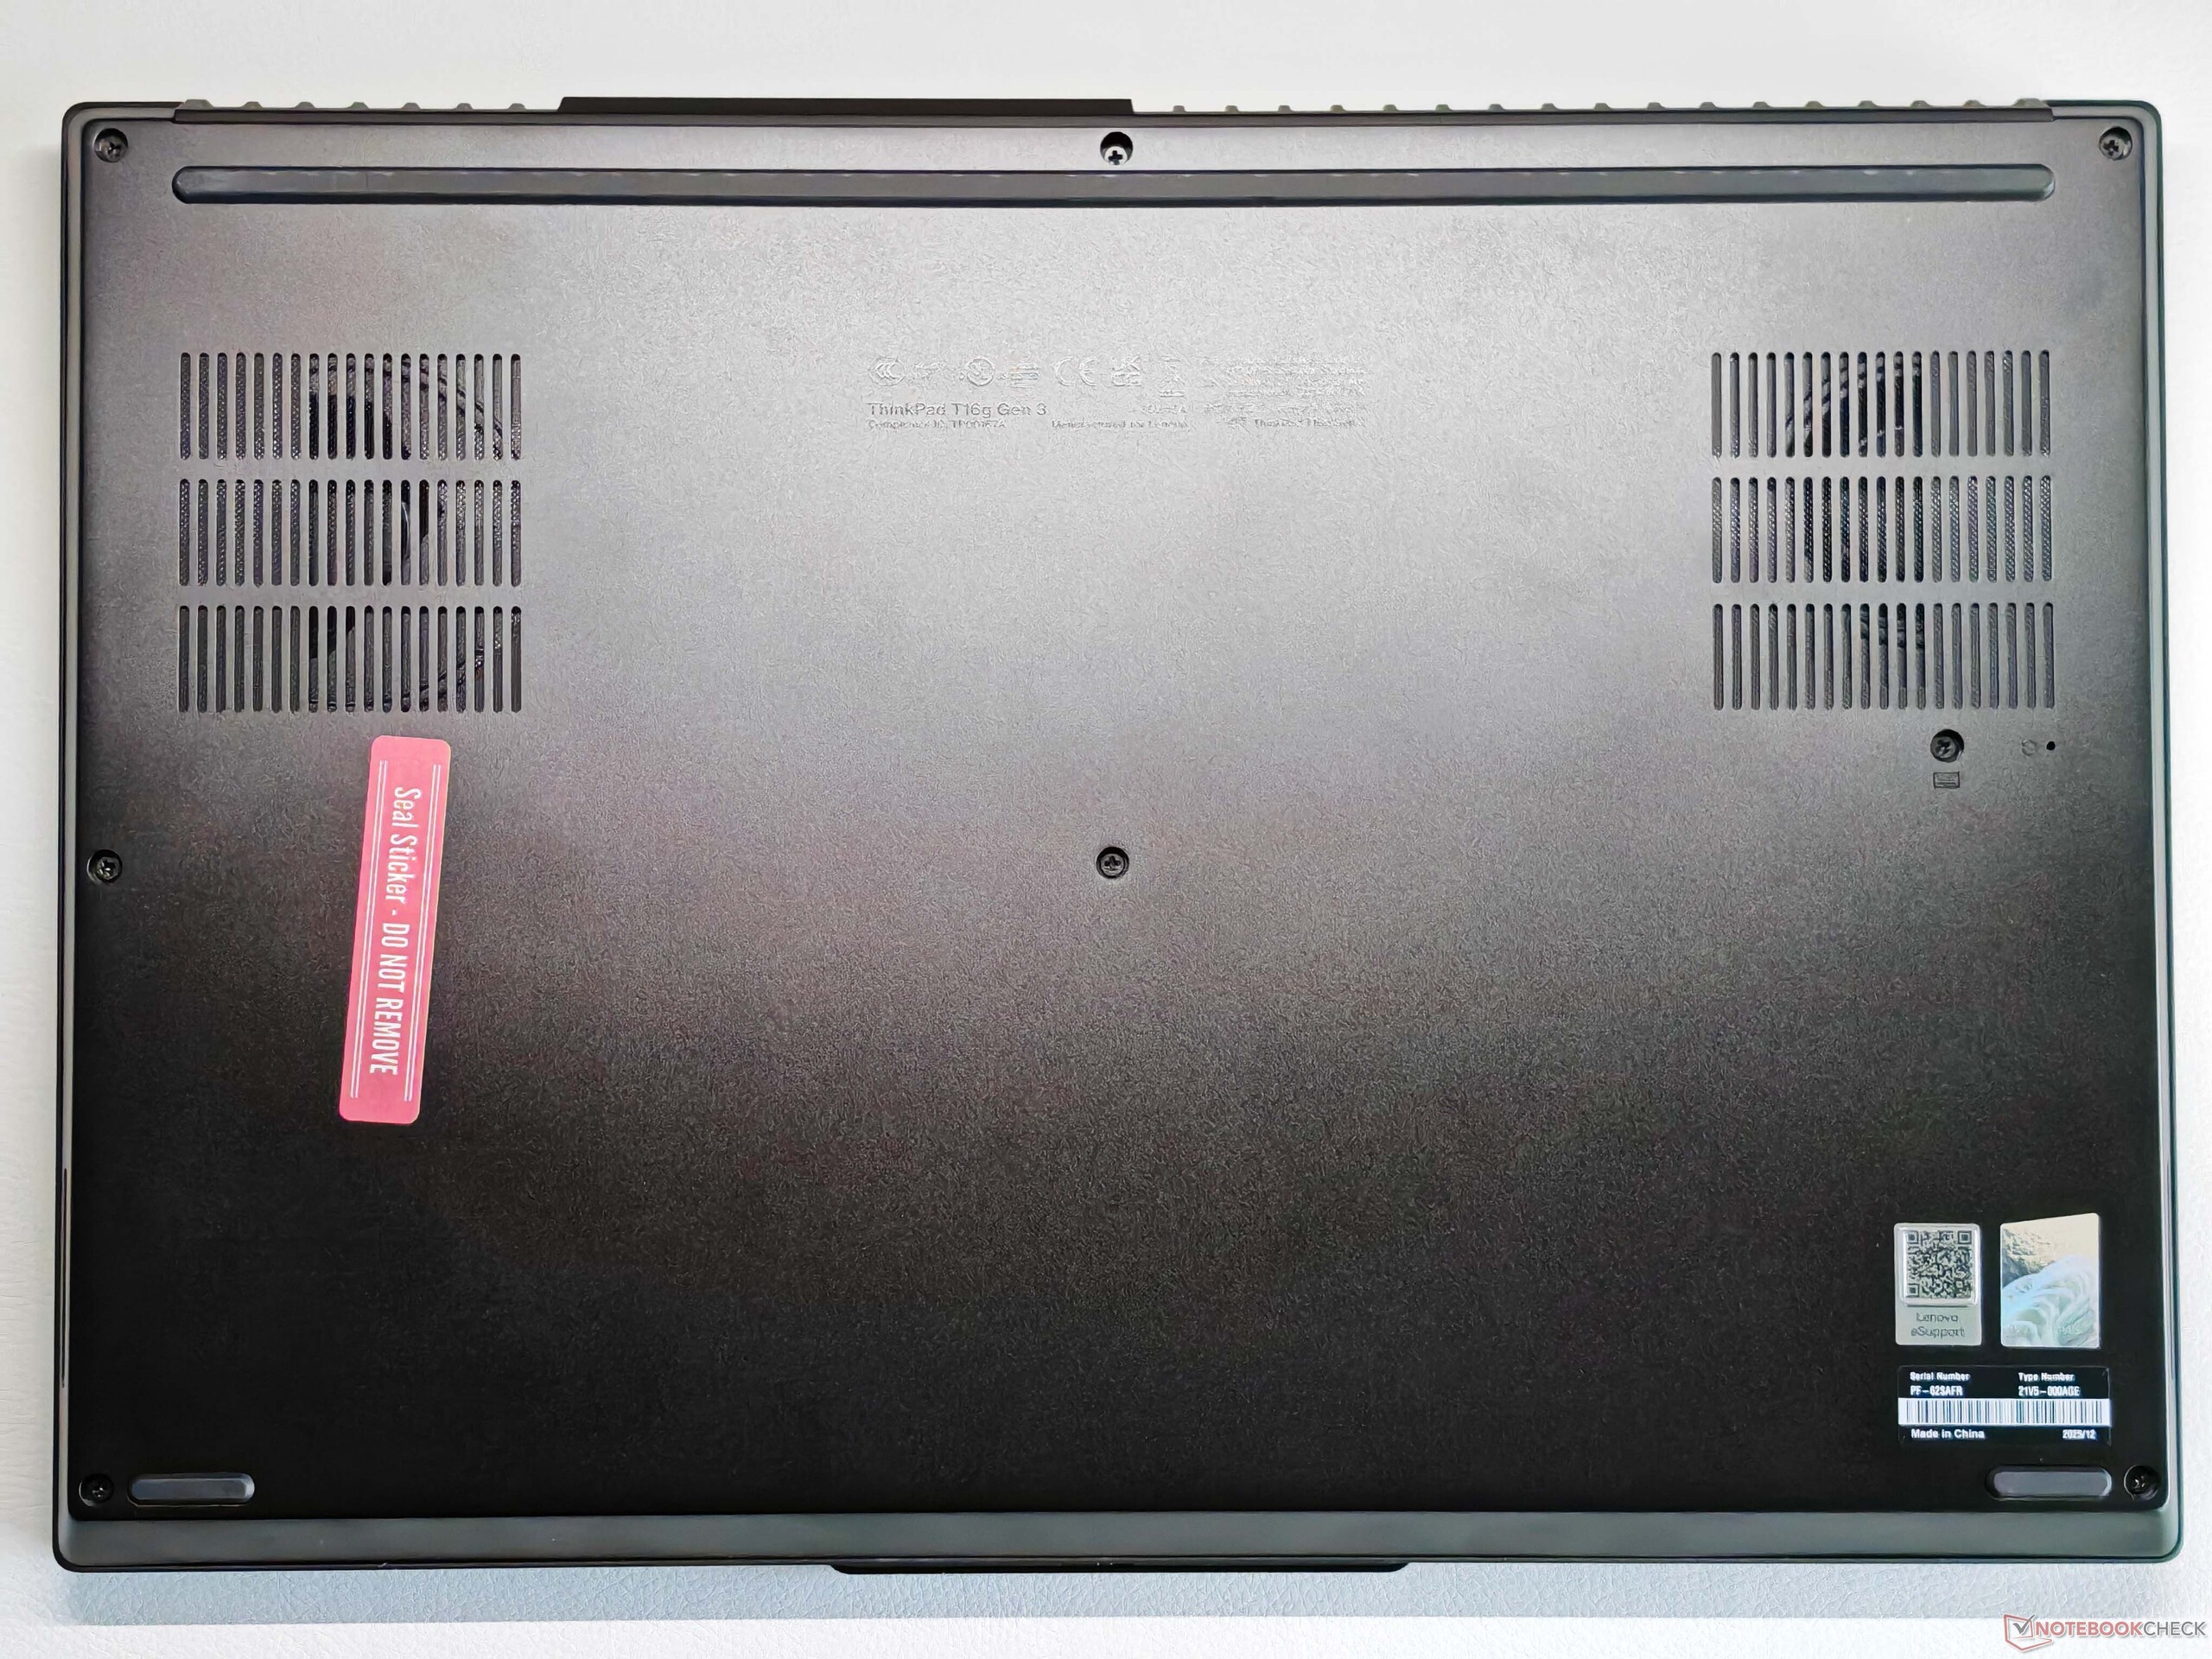
虽然 T16g Gen 3 缺少了前代机型上的小型维护舱口,但整体维护选项仍然非常出色。底盖可以轻松取下,露出 Wi-Fi 模块、主固态硬盘和四个内存插槽。拆卸键盘只需拧松底部的两颗螺丝。这样就可以进入另外两个固态硬盘插槽。


可持续性


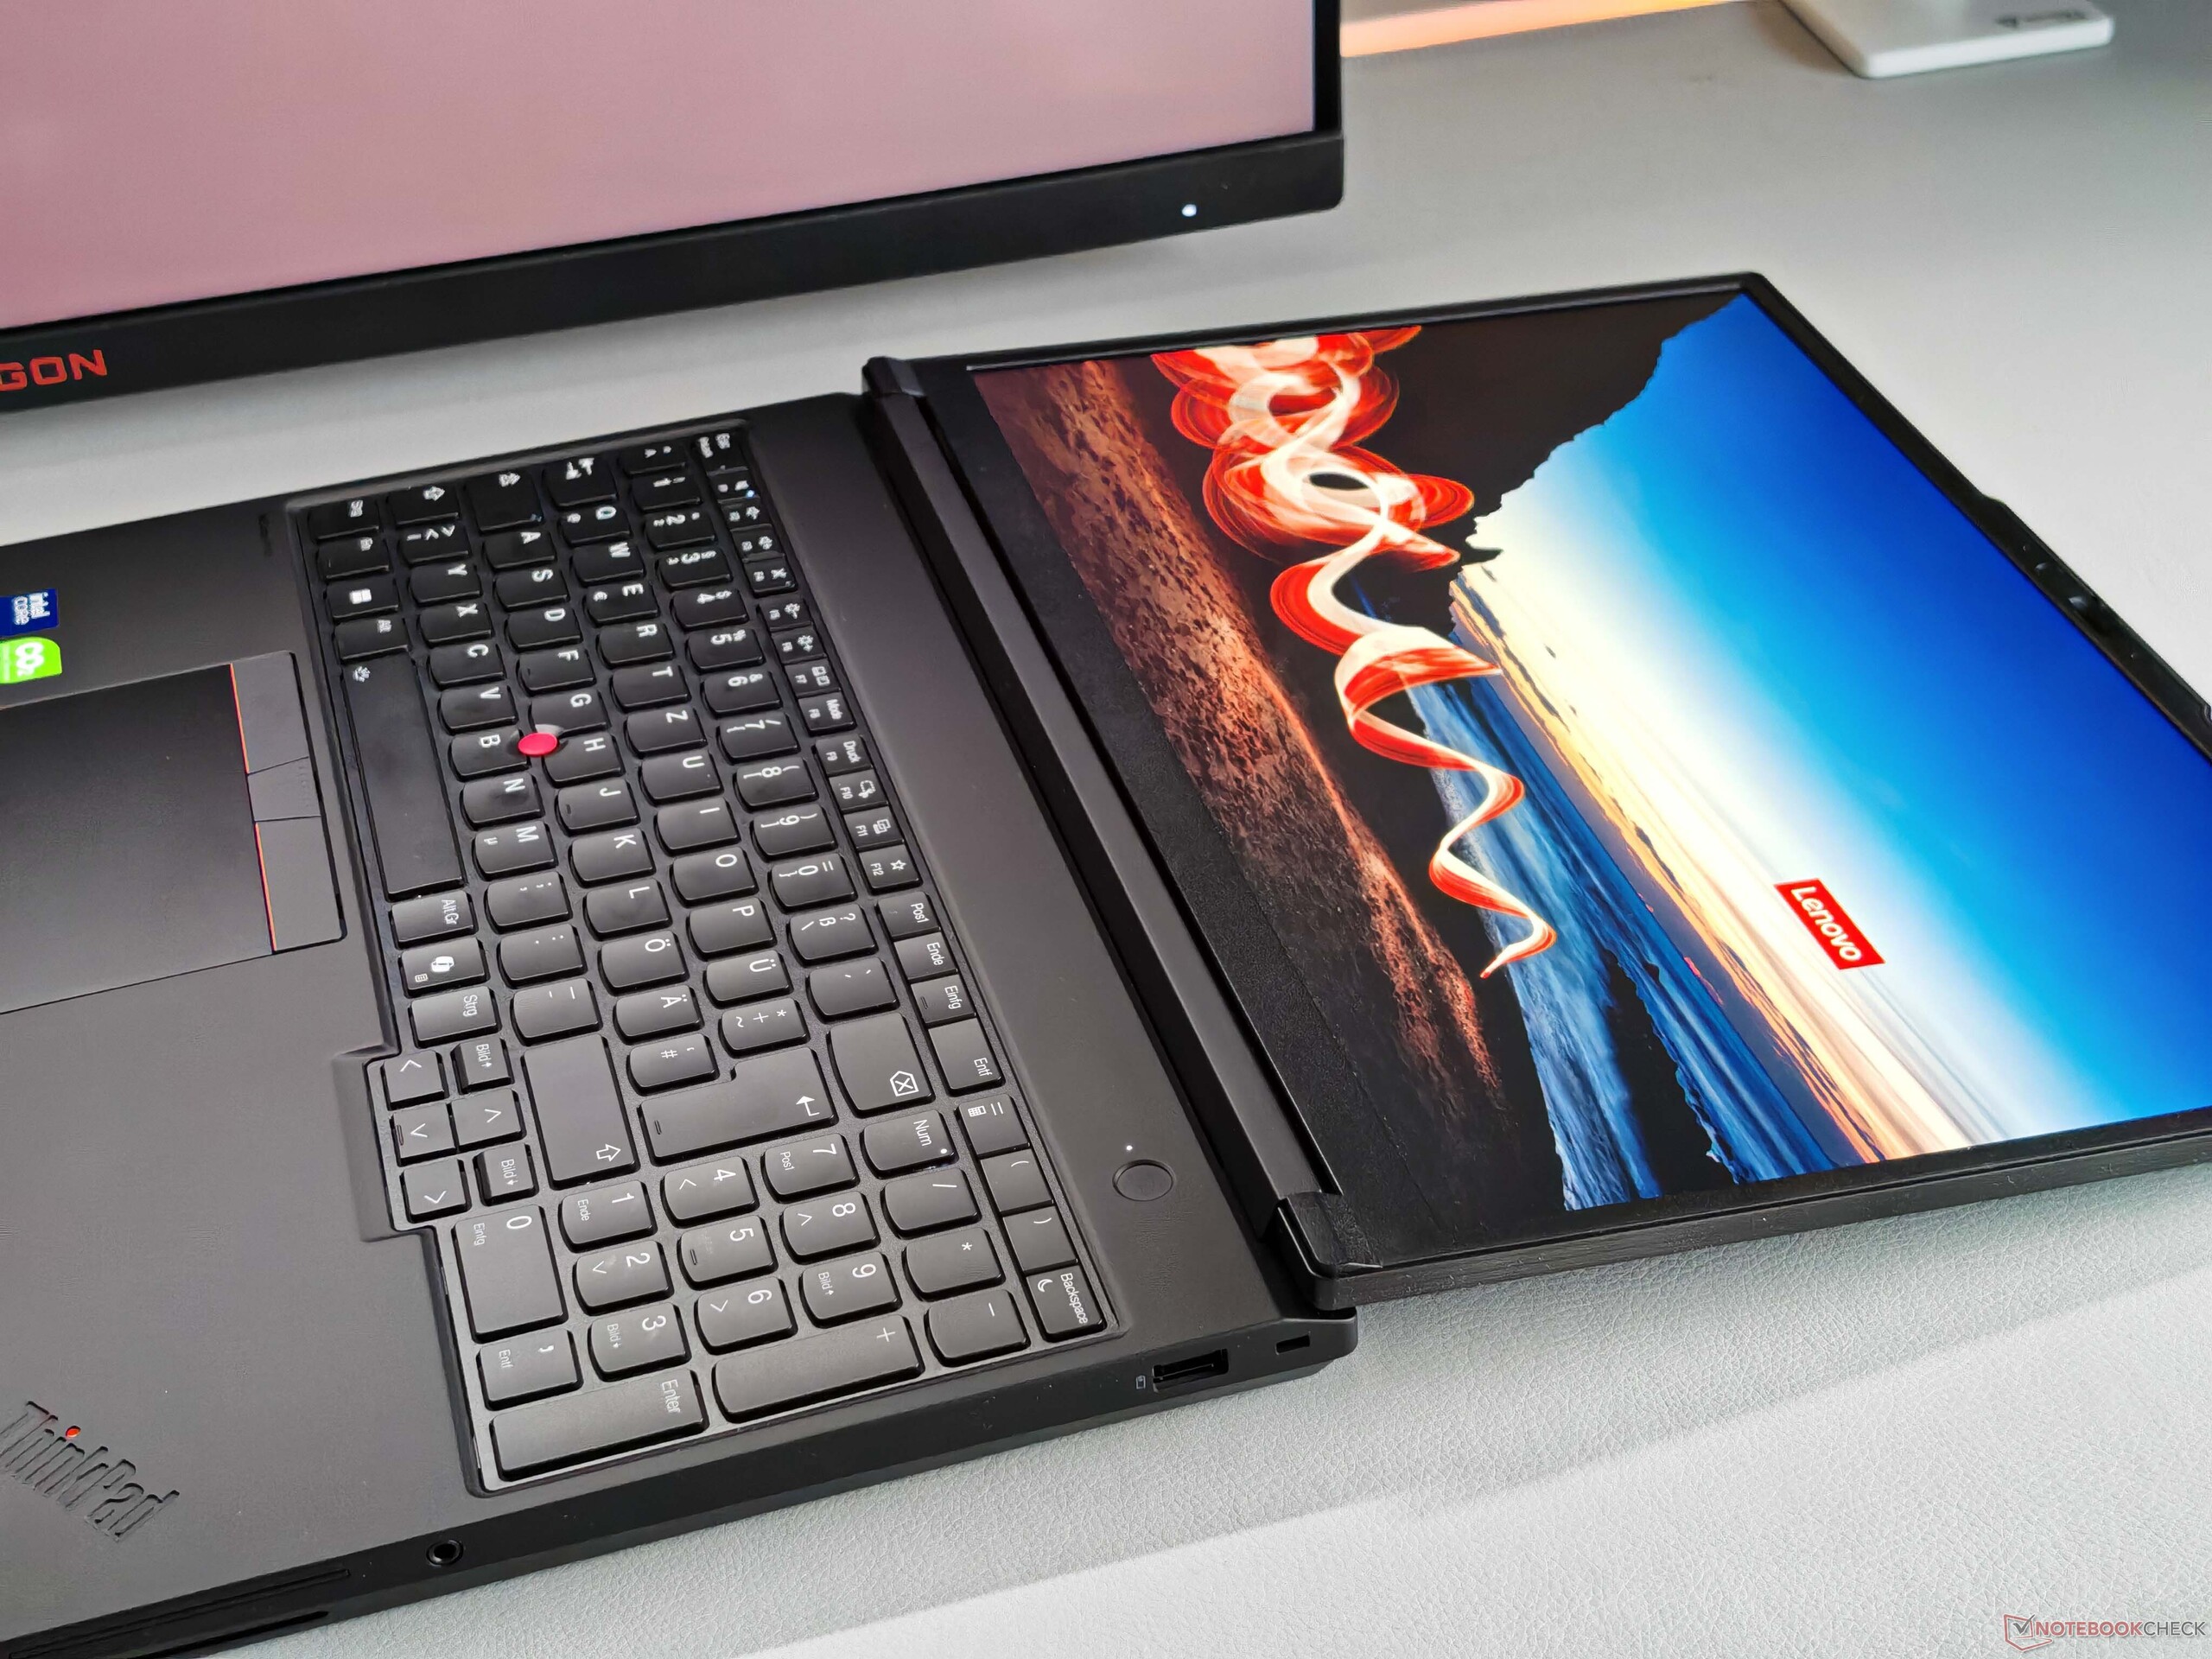
输入设备 - 标准键盘
键盘采用背光设计,并配有专用数字键盘。舒适的打字触感(1.5 毫米键程)与出色的 ThinkPad T1g 第 8 代与 ThinkPad P16v 的直接对比几乎完全相同。由于联想使用不同的键盘供应商,因此根据具体设备的不同可能会有细微差别。
ClickPad 和 TrackPoint(包括专用按键)都能完美地工作,按键机构给人既厚实又高质量的感觉。点击声音也非常安静,触摸屏(包括手写笔支持)的功能也没有任何问题。


显示屏 - 串联式 OLED
显示屏选项与最近评测的 ThinkPad t1g Gen 8 相同。这意味着可以选择刷新率为 60 Hz 的两块 IPS 面板(刷新率为 500 cd/m² 的 1080p 或 800 cd/m² 的 4K),也可以选择刷新率为 120 Hz 的雾面串联 OLED 触摸屏,我们的评测机也配备了这种屏幕。图像质量总体上非常好,亮度尤其令人印象深刻。尽管如此,图像的颗粒感还是比光面面板要强一些。虽然有 PWM,但频率仅为 1.2 kHz。振幅也很低,所以应该不会有什么大问题。
在 SDR 模式下,面板亮度非常好,几乎达到 600 cd/m²,而在 HDR 模式下,亮度超过 1,500 cd/m²。我们使用专业的 CalMAN 软件进行了分析,发现有多种色彩配置文件可供选择,而出厂校准已经取得了很好的效果。我们使用自己的校准无法进一步改善显示效果。
| |||||||||||||||||||||||||
Brightness Distribution: 98 %
Center on Battery: 585 cd/m²
Contrast: ∞:1 (Black: 0 cd/m²)
ΔE ColorChecker Calman: 0.9 | ∀{0.5-29.43 Ø4.73}
ΔE Greyscale Calman: 1.4 | ∀{0.09-98 Ø4.97}
88.9% AdobeRGB 1998 (Argyll 3D)
100% sRGB (Argyll 3D)
98.8% Display P3 (Argyll 3D)
Gamma: 2.18
CCT: 6442 K
| Lenovo ThinkPad T16g Gen 3 RTX 5080 ATNA60KA02-0, OLED, 3200x2000, 16", 120 Hz | HP ZBook Studio 16 G11 AUO87A8, IPS, 3840x2400, 16", 120 Hz | Dell Pro Max 16 Plus Samsung 160HC01, OLED, 3840x2400, 16", 120 Hz | Lenovo ThinkPad P16 Gen 2 NE160QDM-NY1, IPS, 2560x1600, 16", 165 Hz | HP ZBook Fury 16 G11 AUO87A8, IPS, 3840x2400, 16", 120 Hz | Schenker XMG Pro 16 (E25) NE160QDM-NZL, IPS, 2560x1600, 16", 300 Hz | |
|---|---|---|---|---|---|---|
| Display | -2% | -1% | -18% | -1% | -13% | |
| Display P3 Coverage (%) | 98.8 | 97.7 -1% | 97.3 -2% | 68.4 -31% | 98.4 0% | 74.7 -24% |
| sRGB Coverage (%) | 100 | 99.9 0% | 100 0% | 96.9 -3% | 99.9 0% | 99.8 0% |
| AdobeRGB 1998 Coverage (%) | 88.9 | 85.7 -4% | 88.8 0% | 70.6 -21% | 86 -3% | 75.4 -15% |
| Response Times | -1575% | -24% | -1492% | -1232% | -861% | |
| Response Time Grey 50% / Grey 80% * (ms) | 1.51 ? | 14.2 ? -840% | 0.63 ? 58% | 14.1 ? -834% | 11.4 ? -655% | 10.5 ? -595% |
| Response Time Black / White * (ms) | 0.44 ? | 10.6 ? -2309% | 0.89 ? -102% | 9.9 ? -2150% | 8.4 ? -1809% | 5.4 ? -1127% |
| PWM Frequency (Hz) | 1200 ? | 479.9 ? | ||||
| PWM Amplitude * (%) | 22 | 28 -27% | ||||
| Screen | -63% | -43% | -29% | -69% | -47% | |
| Brightness middle (cd/m²) | 585 | 404.3 -31% | 530.9 -9% | 531.5 -9% | 457.6 -22% | 538 -8% |
| Brightness (cd/m²) | 590 | 405 -31% | 540 -8% | 499 -15% | 466 -21% | 508 -14% |
| Brightness Distribution (%) | 98 | 92 -6% | 95 -3% | 89 -9% | 83 -15% | 88 -10% |
| Black Level * (cd/m²) | 0.28 | 0.38 | 0.43 | 0.47 | ||
| Colorchecker dE 2000 * | 0.9 | 2.63 -192% | 2.42 -169% | 1.82 -102% | 2.78 -209% | 1.9 -111% |
| Colorchecker dE 2000 max. * | 2.7 | 4.48 -66% | 5.76 -113% | 4.1 -52% | 5.53 -105% | 4 -48% |
| Greyscale dE 2000 * | 1.4 | 2.1 -50% | 0.8 43% | 1.2 14% | 2 -43% | 2.7 -93% |
| Gamma | 2.18 101% | 2.3 96% | 2.23 99% | 2.15 102% | 2.28 96% | 2.24 98% |
| CCT | 6442 101% | 6810 95% | 6488 100% | 6484 100% | 6806 96% | 7027 93% |
| Contrast (:1) | 1444 | 1399 | 1064 | 1145 | ||
| Colorchecker dE 2000 calibrated * | 1.46 | 0.7 | 0.63 | 1.37 | ||
| Total Average (Program / Settings) | -547% /
-321% | -23% /
-28% | -513% /
-292% | -434% /
-262% | -307% /
-186% |
* ... smaller is better


Display Response Times
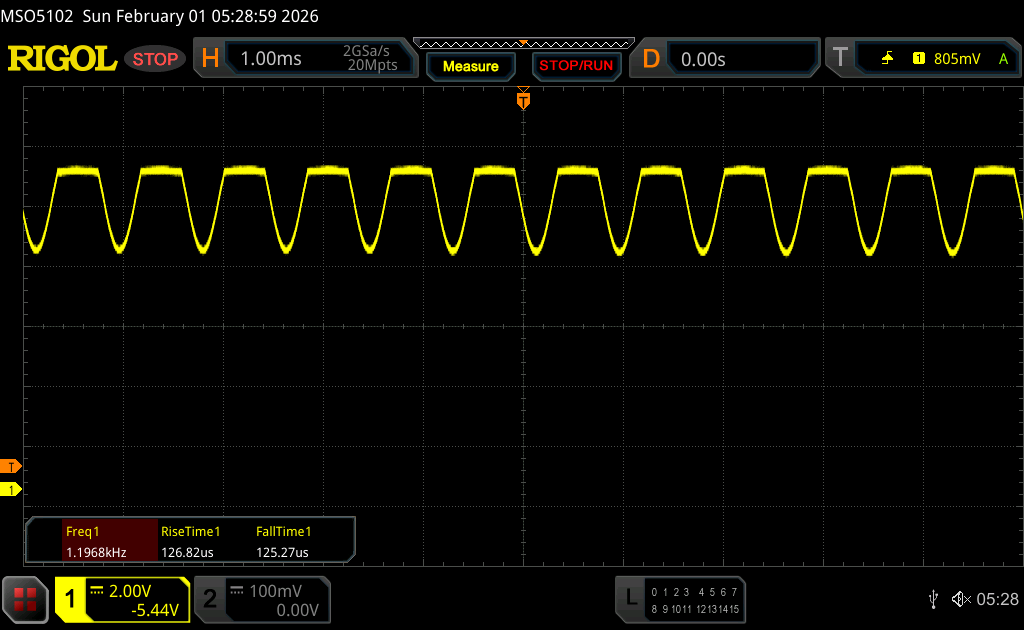
| ↔ Response Time Black to White | ||
|---|---|---|
| 0.44 ms ... rise ↗ and fall ↘ combined | ↗ 0.24 ms rise | 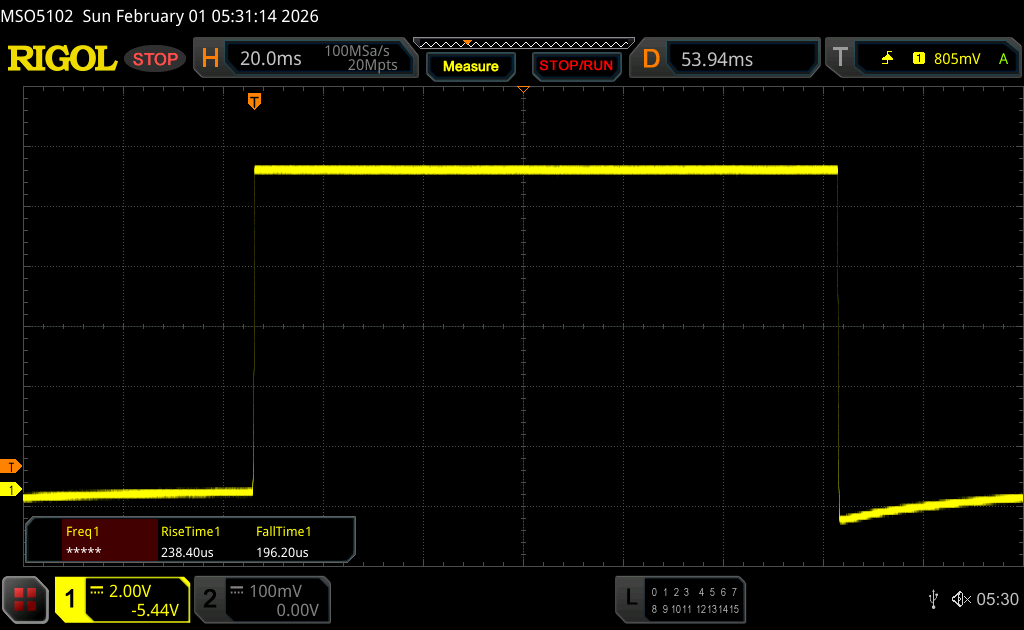 |
| ↘ 0.2 ms fall | ||
| The screen shows very fast response rates in our tests and should be very well suited for fast-paced gaming. In comparison, all tested devices range from 0.1 (minimum) to 240 (maximum) ms. » 1 % of all devices are better. This means that the measured response time is better than the average of all tested devices (19.9 ms). | ||
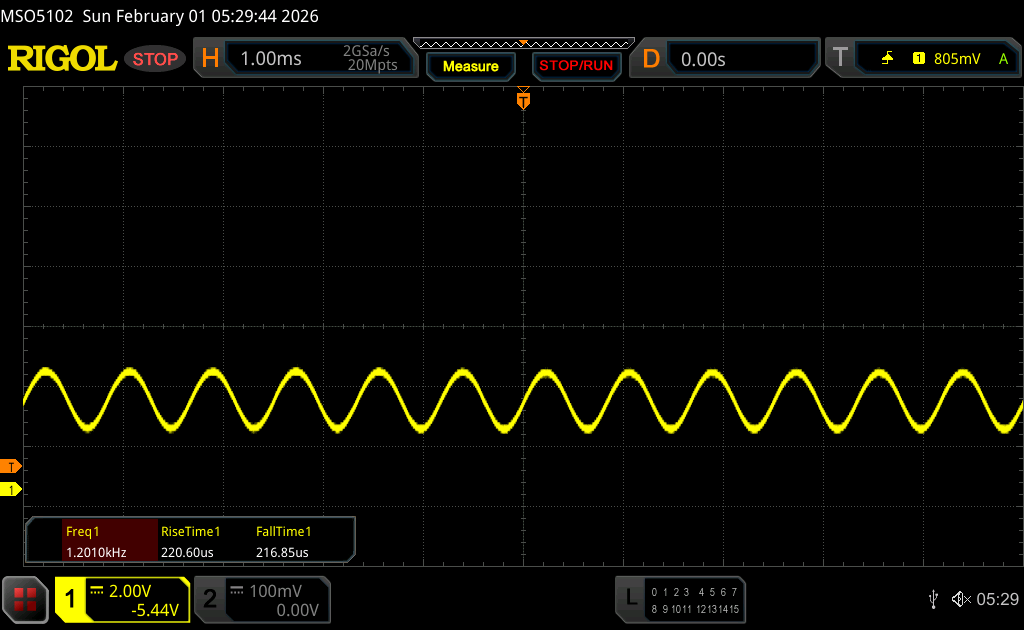
| ↔ Response Time 50% Grey to 80% Grey | ||
| 1.51 ms ... rise ↗ and fall ↘ combined | ↗ 0.73 ms rise | 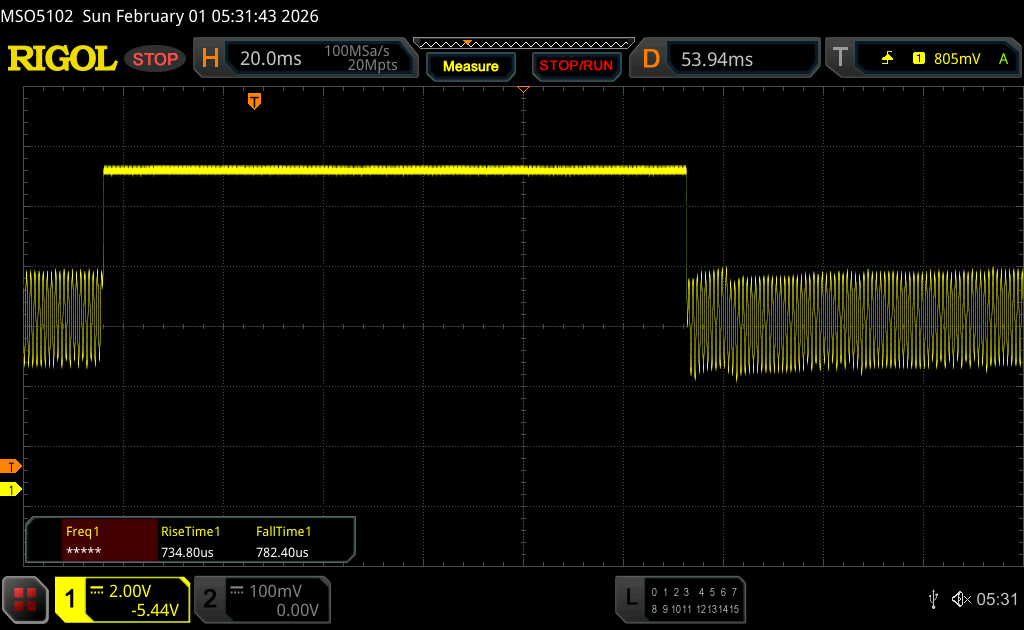 |
| ↘ 0.78 ms fall | ||
| The screen shows very fast response rates in our tests and should be very well suited for fast-paced gaming. In comparison, all tested devices range from 0.165 (minimum) to 636 (maximum) ms. » 7 % of all devices are better. This means that the measured response time is better than the average of all tested devices (31.1 ms). | ||
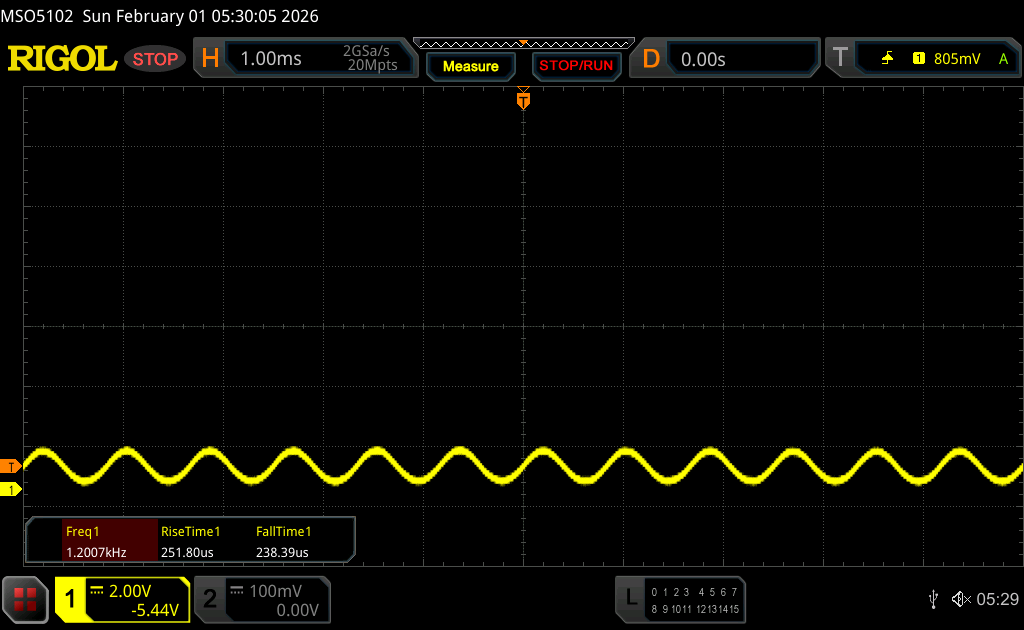
Screen Flickering / PWM (Pulse-Width Modulation)
| Screen flickering / PWM detected | 1200 Hz Amplitude: 22 % | ≤ 70 % brightness setting |  |
The display backlight flickers at 1200 Hz (worst case, e.g., utilizing PWM) Flickering detected at a brightness setting of 70 % and below. There should be no flickering or PWM above this brightness setting. The frequency of 1200 Hz is quite high, so most users sensitive to PWM should not notice any flickering. In comparison: 52 % of all tested devices do not use PWM to dim the display. If PWM was detected, an average of 7798 (minimum: 5 - maximum: 343500) Hz was measured. | |||


性能 - Arrow Lake HX 和 Blackwell 小火烹饪
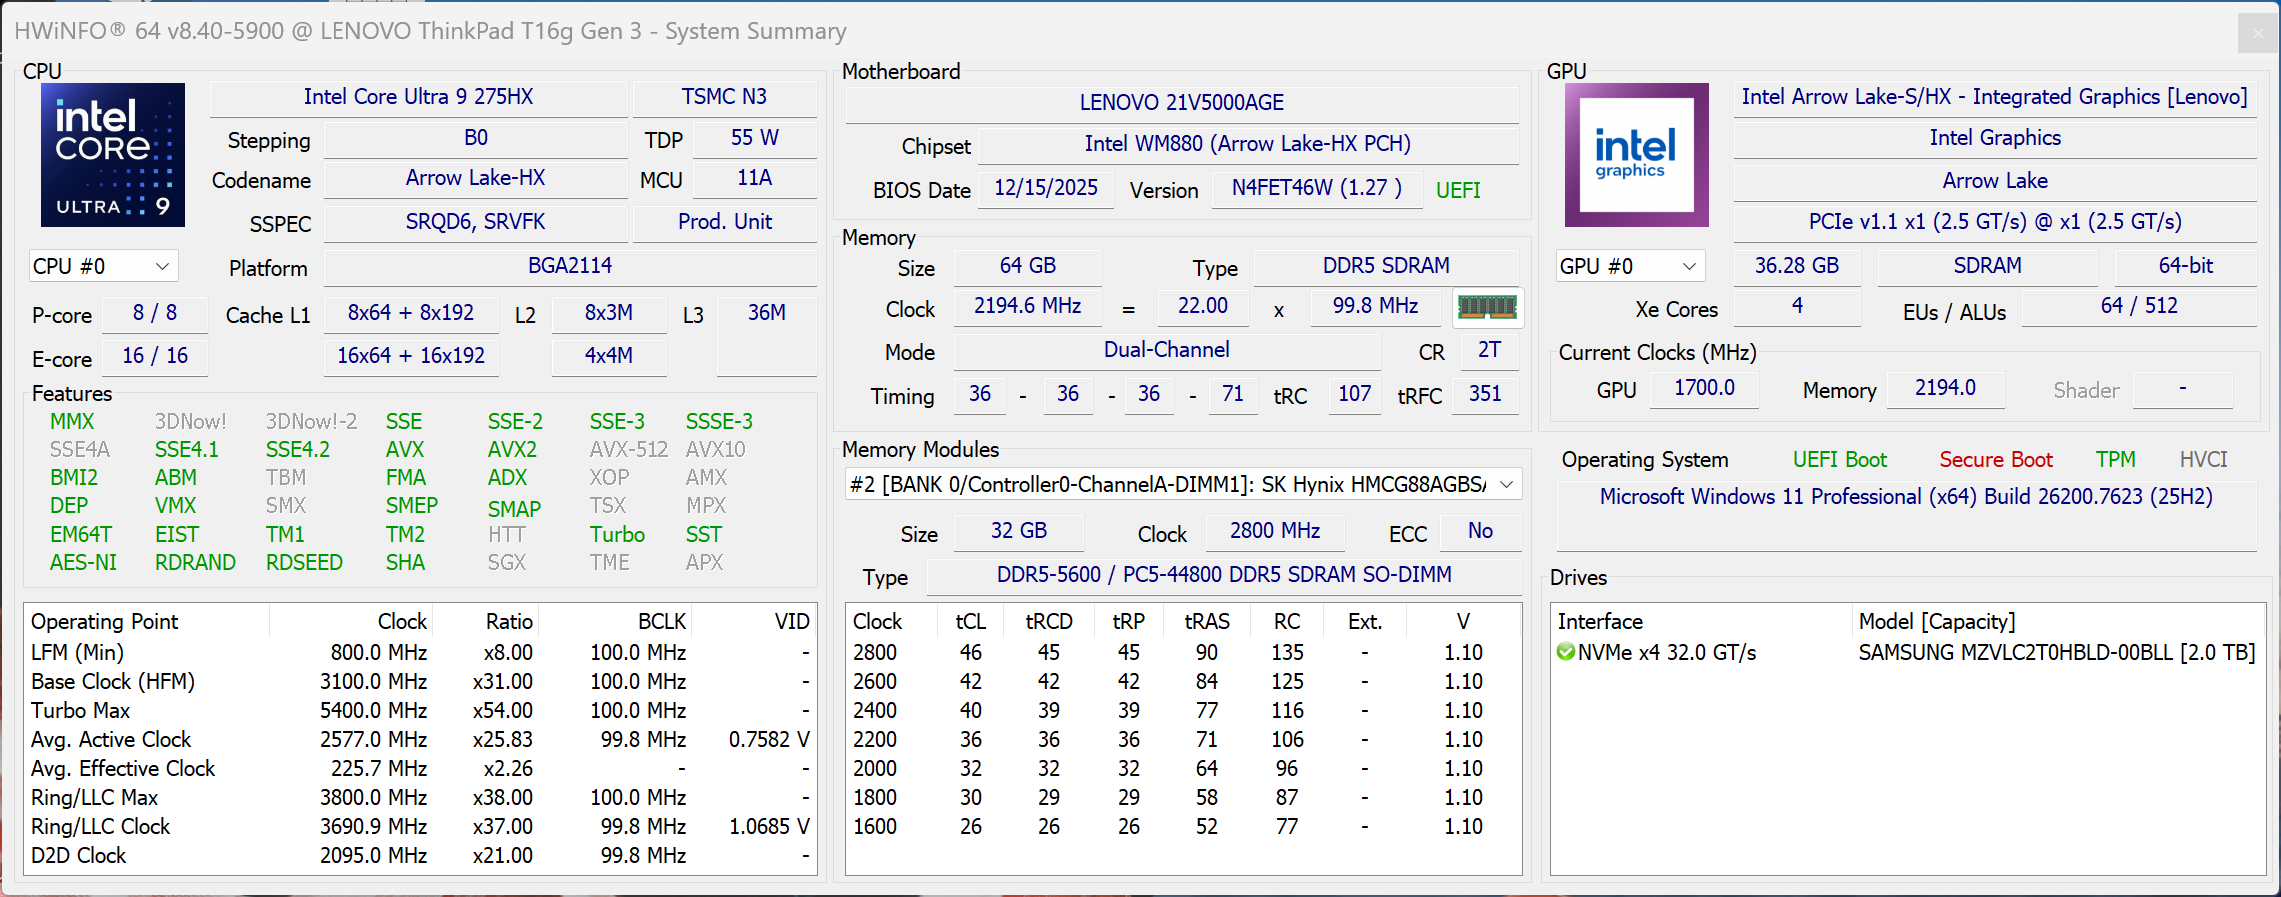
测试条件
联想的能源配置文件与 Windows 设置相关联。我们使用最佳性能模式进行了基准测试。
处理器

我们的评测设备配备了快速 英特尔酷睿至尊 9 275HX(Arrow Lake HX),但其性能还有待提高。处理器允许短暂消耗 160 瓦,然后是 110 瓦左右,但大约一分钟后,该值降至仅 65 瓦,随后在 65 瓦和最大 90 瓦之间波动。这意味着短期性能(因此在许多基准测试中的性能)不错,但性能并不稳定。总体而言,结果令人失望,尤其是考虑到机箱较大。使用电池供电时,CPU 的最大功耗为 62 瓦(多核功耗-14%)。
Cinebench R15 多重持续测试
Cinebench 2024: CPU Multi Core | CPU Single Core
Cinebench R23: Multi Core | Single Core
Cinebench R20: CPU (Multi Core) | CPU (Single Core)
Cinebench R15: CPU Multi 64Bit | CPU Single 64Bit
Blender: v2.79 BMW27 CPU
7-Zip 18.03: 7z b 4 | 7z b 4 -mmt1
Geekbench 6.7: Multi-Core | Single-Core
Geekbench 5.5: Multi-Core | Single-Core
HWBOT x265 Benchmark v2.2: 4k Preset
LibreOffice : 20 Documents To PDF
R Benchmark 2.5: Overall mean
| CPU Performance rating | |
| Schenker XMG Pro 16 (E25) | |
| Average Intel Core Ultra 9 275HX | |
| Lenovo ThinkPad T16g Gen 3 RTX 5080 | |
| Dell Pro Max 16 Plus | |
| HP ZBook Fury 16 G11 | |
| Lenovo ThinkPad P16 Gen 2 | |
| Average of class Workstation | |
| HP ZBook Studio 16 G11 | |
| Cinebench 2024 / CPU Multi Core | |
| Schenker XMG Pro 16 (E25) | |
| Average Intel Core Ultra 9 275HX (1547 - 2288, n=27) | |
| Dell Pro Max 16 Plus | |
| Lenovo ThinkPad T16g Gen 3 RTX 5080 | |
| Average of class Workstation (616 - 2049, n=18, last 2 years) | |
| Lenovo ThinkPad P16 Gen 2 | |
| HP ZBook Fury 16 G11 | |
| HP ZBook Studio 16 G11 | |
| Cinebench 2024 / CPU Single Core | |
| Schenker XMG Pro 16 (E25) | |
| Average Intel Core Ultra 9 275HX (123.1 - 138.2, n=27) | |
| Lenovo ThinkPad T16g Gen 3 RTX 5080 | |
| Dell Pro Max 16 Plus | |
| HP ZBook Fury 16 G11 | |
| Lenovo ThinkPad P16 Gen 2 | |
| Average of class Workstation (101.6 - 132.2, n=17, last 2 years) | |
| HP ZBook Studio 16 G11 | |
| Cinebench R23 / Multi Core | |
| Lenovo ThinkPad T16g Gen 3 RTX 5080 | |
| Schenker XMG Pro 16 (E25) | |
| Average Intel Core Ultra 9 275HX (30712 - 40970, n=31) | |
| Dell Pro Max 16 Plus | |
| HP ZBook Fury 16 G11 | |
| Lenovo ThinkPad P16 Gen 2 | |
| Average of class Workstation (14055 - 38520, n=25, last 2 years) | |
| HP ZBook Studio 16 G11 | |
| Cinebench R23 / Single Core | |
| Schenker XMG Pro 16 (E25) | |
| Lenovo ThinkPad T16g Gen 3 RTX 5080 | |
| Average Intel Core Ultra 9 275HX (2009 - 2267, n=31) | |
| HP ZBook Fury 16 G11 | |
| Lenovo ThinkPad P16 Gen 2 | |
| Dell Pro Max 16 Plus | |
| Average of class Workstation (1712 - 2228, n=25, last 2 years) | |
| HP ZBook Studio 16 G11 | |
| Cinebench R20 / CPU (Multi Core) | |
| Lenovo ThinkPad T16g Gen 3 RTX 5080 | |
| Schenker XMG Pro 16 (E25) | |
| Average Intel Core Ultra 9 275HX (12026 - 16108, n=30) | |
| Dell Pro Max 16 Plus | |
| HP ZBook Fury 16 G11 | |
| Lenovo ThinkPad P16 Gen 2 | |
| Average of class Workstation (5471 - 15043, n=25, last 2 years) | |
| HP ZBook Studio 16 G11 | |
| Cinebench R20 / CPU (Single Core) | |
| Schenker XMG Pro 16 (E25) | |
| Lenovo ThinkPad T16g Gen 3 RTX 5080 | |
| Average Intel Core Ultra 9 275HX (774 - 870, n=30) | |
| HP ZBook Fury 16 G11 | |
| Dell Pro Max 16 Plus | |
| Lenovo ThinkPad P16 Gen 2 | |
| Average of class Workstation (671 - 857, n=25, last 2 years) | |
| HP ZBook Studio 16 G11 | |
| Cinebench R15 / CPU Multi 64Bit | |
| Lenovo ThinkPad T16g Gen 3 RTX 5080 | |
| Schenker XMG Pro 16 (E25) | |
| Average Intel Core Ultra 9 275HX (4737 - 6271, n=30) | |
| Dell Pro Max 16 Plus | |
| HP ZBook Fury 16 G11 | |
| Lenovo ThinkPad P16 Gen 2 | |
| Average of class Workstation (2489 - 5810, n=25, last 2 years) | |
| HP ZBook Studio 16 G11 | |
| Cinebench R15 / CPU Single 64Bit | |
| Schenker XMG Pro 16 (E25) | |
| Average Intel Core Ultra 9 275HX (306 - 343, n=31) | |
| Lenovo ThinkPad T16g Gen 3 RTX 5080 | |
| Dell Pro Max 16 Plus | |
| HP ZBook Fury 16 G11 | |
| Average of class Workstation (191.4 - 328, n=25, last 2 years) | |
| Lenovo ThinkPad P16 Gen 2 | |
| HP ZBook Studio 16 G11 | |
| Blender / v2.79 BMW27 CPU | |
| HP ZBook Studio 16 G11 | |
| Average of class Workstation (91 - 261, n=25, last 2 years) | |
| Lenovo ThinkPad P16 Gen 2 | |
| HP ZBook Fury 16 G11 | |
| Dell Pro Max 16 Plus | |
| Average Intel Core Ultra 9 275HX (82 - 116, n=29) | |
| Lenovo ThinkPad T16g Gen 3 RTX 5080 | |
| Schenker XMG Pro 16 (E25) | |
| 7-Zip 18.03 / 7z b 4 | |
| Schenker XMG Pro 16 (E25) | |
| Average Intel Core Ultra 9 275HX (98236 - 124155, n=30) | |
| Dell Pro Max 16 Plus | |
| Lenovo ThinkPad T16g Gen 3 RTX 5080 | |
| HP ZBook Fury 16 G11 | |
| Lenovo ThinkPad P16 Gen 2 | |
| Average of class Workstation (54741 - 116969, n=25, last 2 years) | |
| HP ZBook Studio 16 G11 | |
| 7-Zip 18.03 / 7z b 4 -mmt1 | |
| Schenker XMG Pro 16 (E25) | |
| HP ZBook Fury 16 G11 | |
| Lenovo ThinkPad P16 Gen 2 | |
| Lenovo ThinkPad T16g Gen 3 RTX 5080 | |
| Average Intel Core Ultra 9 275HX (6026 - 7149, n=30) | |
| Dell Pro Max 16 Plus | |
| Average of class Workstation (5126 - 6960, n=25, last 2 years) | |
| HP ZBook Studio 16 G11 | |
| Geekbench 6.7 / Multi-Core | |
| Dell Pro Max 16 Plus | |
| Schenker XMG Pro 16 (E25) | |
| Average Intel Core Ultra 9 275HX (16033 - 21668, n=33) | |
| Lenovo ThinkPad T16g Gen 3 RTX 5080 | |
| Lenovo ThinkPad P16 Gen 2 | |
| Average of class Workstation (12196 - 20887, n=25, last 2 years) | |
| HP ZBook Fury 16 G11 | |
| HP ZBook Studio 16 G11 | |
| Geekbench 6.7 / Single-Core | |
| Schenker XMG Pro 16 (E25) | |
| Lenovo ThinkPad T16g Gen 3 RTX 5080 | |
| Average Intel Core Ultra 9 275HX (2843 - 3160, n=33) | |
| HP ZBook Fury 16 G11 | |
| Dell Pro Max 16 Plus | |
| Lenovo ThinkPad P16 Gen 2 | |
| Average of class Workstation (2389 - 3065, n=25, last 2 years) | |
| HP ZBook Studio 16 G11 | |
| Geekbench 5.5 / Multi-Core | |
| Dell Pro Max 16 Plus | |
| Schenker XMG Pro 16 (E25) | |
| Average Intel Core Ultra 9 275HX (19105 - 25855, n=31) | |
| Lenovo ThinkPad T16g Gen 3 RTX 5080 | |
| HP ZBook Fury 16 G11 | |
| Lenovo ThinkPad P16 Gen 2 | |
| Average of class Workstation (11542 - 25554, n=25, last 2 years) | |
| HP ZBook Studio 16 G11 | |
| Geekbench 5.5 / Single-Core | |
| Schenker XMG Pro 16 (E25) | |
| Average Intel Core Ultra 9 275HX (2033 - 2292, n=31) | |
| Lenovo ThinkPad T16g Gen 3 RTX 5080 | |
| Dell Pro Max 16 Plus | |
| HP ZBook Fury 16 G11 | |
| Average of class Workstation (1781 - 2183, n=25, last 2 years) | |
| Lenovo ThinkPad P16 Gen 2 | |
| HP ZBook Studio 16 G11 | |
| HWBOT x265 Benchmark v2.2 / 4k Preset | |
| Schenker XMG Pro 16 (E25) | |
| Average Intel Core Ultra 9 275HX (30.7 - 43.8, n=30) | |
| Lenovo ThinkPad T16g Gen 3 RTX 5080 | |
| Dell Pro Max 16 Plus | |
| HP ZBook Fury 16 G11 | |
| Average of class Workstation (14.4 - 40.5, n=25, last 2 years) | |
| Lenovo ThinkPad P16 Gen 2 | |
| HP ZBook Studio 16 G11 | |
| LibreOffice / 20 Documents To PDF | |
| Schenker XMG Pro 16 (E25) | |
| HP ZBook Fury 16 G11 | |
| Average of class Workstation (37.1 - 74.7, n=25, last 2 years) | |
| Lenovo ThinkPad P16 Gen 2 | |
| Lenovo ThinkPad T16g Gen 3 RTX 5080 | |
| HP ZBook Studio 16 G11 | |
| Dell Pro Max 16 Plus | |
| Average Intel Core Ultra 9 275HX (33.2 - 62.1, n=30) | |
| R Benchmark 2.5 / Overall mean | |
| HP ZBook Studio 16 G11 | |
| Average of class Workstation (0.3825 - 0.603, n=25, last 2 years) | |
| Dell Pro Max 16 Plus | |
| Lenovo ThinkPad T16g Gen 3 RTX 5080 | |
| Average Intel Core Ultra 9 275HX (0.3943 - 0.4568, n=30) | |
| Schenker XMG Pro 16 (E25) | |
| Lenovo ThinkPad P16 Gen 2 | |
| HP ZBook Fury 16 G11 | |
* ... smaller is better
AIDA64: FP32 Ray-Trace | FPU Julia | CPU SHA3 | CPU Queen | FPU SinJulia | FPU Mandel | CPU AES | CPU ZLib | FP64 Ray-Trace | CPU PhotoWorxx
| Performance rating | |
| Average Intel Core Ultra 9 275HX | |
| Schenker XMG Pro 16 (E25) | |
| Lenovo ThinkPad T16g Gen 3 RTX 5080 | |
| Dell Pro Max 16 Plus | |
| Average of class Workstation | |
| Lenovo ThinkPad P16 Gen 2 | |
| HP ZBook Fury 16 G11 | |
| HP ZBook Studio 16 G11 | |
| AIDA64 / FP32 Ray-Trace | |
| Average Intel Core Ultra 9 275HX (28039 - 39895, n=30) | |
| Lenovo ThinkPad T16g Gen 3 RTX 5080 | |
| Schenker XMG Pro 16 (E25) | |
| Dell Pro Max 16 Plus | |
| Average of class Workstation (10658 - 61611, n=25, last 2 years) | |
| Lenovo ThinkPad P16 Gen 2 | |
| HP ZBook Fury 16 G11 | |
| HP ZBook Studio 16 G11 | |
| AIDA64 / FPU Julia | |
| Average Intel Core Ultra 9 275HX (140254 - 200744, n=30) | |
| Lenovo ThinkPad T16g Gen 3 RTX 5080 | |
| Schenker XMG Pro 16 (E25) | |
| Dell Pro Max 16 Plus | |
| Average of class Workstation (56664 - 186971, n=25, last 2 years) | |
| Lenovo ThinkPad P16 Gen 2 | |
| HP ZBook Fury 16 G11 | |
| HP ZBook Studio 16 G11 | |
| AIDA64 / CPU SHA3 | |
| Average Intel Core Ultra 9 275HX (6710 - 9817, n=30) | |
| Lenovo ThinkPad T16g Gen 3 RTX 5080 | |
| Schenker XMG Pro 16 (E25) | |
| Dell Pro Max 16 Plus | |
| Average of class Workstation (2608 - 8975, n=25, last 2 years) | |
| Lenovo ThinkPad P16 Gen 2 | |
| HP ZBook Fury 16 G11 | |
| HP ZBook Studio 16 G11 | |
| AIDA64 / CPU Queen | |
| Lenovo ThinkPad P16 Gen 2 | |
| Lenovo ThinkPad T16g Gen 3 RTX 5080 | |
| HP ZBook Fury 16 G11 | |
| Dell Pro Max 16 Plus | |
| Average Intel Core Ultra 9 275HX (113887 - 140937, n=30) | |
| Schenker XMG Pro 16 (E25) | |
| Average of class Workstation (60778 - 144411, n=25, last 2 years) | |
| HP ZBook Studio 16 G11 | |
| AIDA64 / FPU SinJulia | |
| Schenker XMG Pro 16 (E25) | |
| Average Intel Core Ultra 9 275HX (11172 - 14425, n=30) | |
| Lenovo ThinkPad T16g Gen 3 RTX 5080 | |
| Lenovo ThinkPad P16 Gen 2 | |
| HP ZBook Fury 16 G11 | |
| Average of class Workstation (8165 - 29343, n=25, last 2 years) | |
| Dell Pro Max 16 Plus | |
| HP ZBook Studio 16 G11 | |
| AIDA64 / FPU Mandel | |
| Average Intel Core Ultra 9 275HX (72596 - 104508, n=30) | |
| Lenovo ThinkPad T16g Gen 3 RTX 5080 | |
| Schenker XMG Pro 16 (E25) | |
| Dell Pro Max 16 Plus | |
| Average of class Workstation (27301 - 98153, n=25, last 2 years) | |
| Lenovo ThinkPad P16 Gen 2 | |
| HP ZBook Fury 16 G11 | |
| HP ZBook Studio 16 G11 | |
| AIDA64 / CPU AES | |
| Lenovo ThinkPad T16g Gen 3 RTX 5080 | |
| Average Intel Core Ultra 9 275HX (105608 - 247074, n=30) | |
| Schenker XMG Pro 16 (E25) | |
| Dell Pro Max 16 Plus | |
| Average of class Workstation (56077 - 187841, n=25, last 2 years) | |
| Lenovo ThinkPad P16 Gen 2 | |
| HP ZBook Fury 16 G11 | |
| HP ZBook Studio 16 G11 | |
| AIDA64 / CPU ZLib | |
| Lenovo ThinkPad T16g Gen 3 RTX 5080 | |
| Average Intel Core Ultra 9 275HX (1582 - 2263, n=30) | |
| Schenker XMG Pro 16 (E25) | |
| Dell Pro Max 16 Plus | |
| Lenovo ThinkPad P16 Gen 2 | |
| Average of class Workstation (742 - 2148, n=25, last 2 years) | |
| HP ZBook Fury 16 G11 | |
| HP ZBook Studio 16 G11 | |
| AIDA64 / FP64 Ray-Trace | |
| Lenovo ThinkPad T16g Gen 3 RTX 5080 | |
| Average Intel Core Ultra 9 275HX (14847 - 21854, n=30) | |
| Schenker XMG Pro 16 (E25) | |
| Dell Pro Max 16 Plus | |
| Average of class Workstation (5580 - 32891, n=25, last 2 years) | |
| Lenovo ThinkPad P16 Gen 2 | |
| HP ZBook Fury 16 G11 | |
| HP ZBook Studio 16 G11 | |
| AIDA64 / CPU PhotoWorxx | |
| Dell Pro Max 16 Plus | |
| Schenker XMG Pro 16 (E25) | |
| HP ZBook Studio 16 G11 | |
| Average of class Workstation (37151 - 93684, n=25, last 2 years) | |
| Average Intel Core Ultra 9 275HX (37482 - 62916, n=30) | |
| Lenovo ThinkPad P16 Gen 2 | |
| Lenovo ThinkPad T16g Gen 3 RTX 5080 | |
| HP ZBook Fury 16 G11 | |
系统性能
系统性能和主观性能印象都非常出色,基准测试结果也可以说非常好。
PCMark 10: Score | Essentials | Productivity | Digital Content Creation
CrossMark: Overall | Productivity | Creativity | Responsiveness
WebXPRT 3: Overall
WebXPRT 4: Overall
Mozilla Kraken 1.1: Total
| Performance rating | |
| Lenovo ThinkPad T16g Gen 3 RTX 5080 | |
| Schenker XMG Pro 16 (E25) | |
| Dell Pro Max 16 Plus -4! | |
| Average Intel Core Ultra 9 275HX, NVIDIA GeForce RTX 5080 Laptop | |
| Lenovo ThinkPad P16 Gen 2 | |
| HP ZBook Fury 16 G11 | |
| Average of class Workstation | |
| HP ZBook Studio 16 G11 | |
| PCMark 10 / Score | |
| Lenovo ThinkPad T16g Gen 3 RTX 5080 | |
| Average Intel Core Ultra 9 275HX, NVIDIA GeForce RTX 5080 Laptop (7805 - 10409, n=9) | |
| Schenker XMG Pro 16 (E25) | |
| Lenovo ThinkPad P16 Gen 2 | |
| Average of class Workstation (6436 - 10409, n=21, last 2 years) | |
| HP ZBook Fury 16 G11 | |
| HP ZBook Studio 16 G11 | |
| PCMark 10 / Essentials | |
| Schenker XMG Pro 16 (E25) | |
| Lenovo ThinkPad P16 Gen 2 | |
| Average Intel Core Ultra 9 275HX, NVIDIA GeForce RTX 5080 Laptop (10206 - 11472, n=9) | |
| HP ZBook Studio 16 G11 | |
| Average of class Workstation (9622 - 11157, n=21, last 2 years) | |
| Lenovo ThinkPad T16g Gen 3 RTX 5080 | |
| HP ZBook Fury 16 G11 | |
| PCMark 10 / Productivity | |
| Lenovo ThinkPad T16g Gen 3 RTX 5080 | |
| Average of class Workstation (8789 - 20616, n=21, last 2 years) | |
| Average Intel Core Ultra 9 275HX, NVIDIA GeForce RTX 5080 Laptop (8319 - 20616, n=9) | |
| Lenovo ThinkPad P16 Gen 2 | |
| Schenker XMG Pro 16 (E25) | |
| HP ZBook Fury 16 G11 | |
| HP ZBook Studio 16 G11 | |
| PCMark 10 / Digital Content Creation | |
| Average Intel Core Ultra 9 275HX, NVIDIA GeForce RTX 5080 Laptop (10505 - 19351, n=9) | |
| Schenker XMG Pro 16 (E25) | |
| Lenovo ThinkPad P16 Gen 2 | |
| Lenovo ThinkPad T16g Gen 3 RTX 5080 | |
| HP ZBook Fury 16 G11 | |
| Average of class Workstation (7744 - 15631, n=21, last 2 years) | |
| HP ZBook Studio 16 G11 | |
| CrossMark / Overall | |
| Lenovo ThinkPad T16g Gen 3 RTX 5080 | |
| Dell Pro Max 16 Plus | |
| Schenker XMG Pro 16 (E25) | |
| Average Intel Core Ultra 9 275HX, NVIDIA GeForce RTX 5080 Laptop (1857 - 2244, n=9) | |
| HP ZBook Fury 16 G11 | |
| Lenovo ThinkPad P16 Gen 2 | |
| Average of class Workstation (1307 - 2267, n=24, last 2 years) | |
| HP ZBook Studio 16 G11 | |
| CrossMark / Productivity | |
| Lenovo ThinkPad T16g Gen 3 RTX 5080 | |
| Schenker XMG Pro 16 (E25) | |
| Dell Pro Max 16 Plus | |
| Average Intel Core Ultra 9 275HX, NVIDIA GeForce RTX 5080 Laptop (1764 - 2122, n=9) | |
| HP ZBook Fury 16 G11 | |
| Lenovo ThinkPad P16 Gen 2 | |
| Average of class Workstation (1130 - 2122, n=24, last 2 years) | |
| HP ZBook Studio 16 G11 | |
| CrossMark / Creativity | |
| Dell Pro Max 16 Plus | |
| Schenker XMG Pro 16 (E25) | |
| Lenovo ThinkPad T16g Gen 3 RTX 5080 | |
| Average Intel Core Ultra 9 275HX, NVIDIA GeForce RTX 5080 Laptop (2115 - 2498, n=9) | |
| Lenovo ThinkPad P16 Gen 2 | |
| HP ZBook Fury 16 G11 | |
| Average of class Workstation (1657 - 2725, n=24, last 2 years) | |
| HP ZBook Studio 16 G11 | |
| CrossMark / Responsiveness | |
| Lenovo ThinkPad T16g Gen 3 RTX 5080 | |
| Average Intel Core Ultra 9 275HX, NVIDIA GeForce RTX 5080 Laptop (1466 - 2096, n=9) | |
| Dell Pro Max 16 Plus | |
| Schenker XMG Pro 16 (E25) | |
| HP ZBook Fury 16 G11 | |
| Lenovo ThinkPad P16 Gen 2 | |
| Average of class Workstation (993 - 2096, n=24, last 2 years) | |
| HP ZBook Studio 16 G11 | |
| WebXPRT 3 / Overall | |
| Schenker XMG Pro 16 (E25) | |
| Average Intel Core Ultra 9 275HX, NVIDIA GeForce RTX 5080 Laptop (306 - 378, n=9) | |
| Lenovo ThinkPad P16 Gen 2 | |
| Lenovo ThinkPad T16g Gen 3 RTX 5080 | |
| Dell Pro Max 16 Plus | |
| HP ZBook Fury 16 G11 | |
| Average of class Workstation (260 - 360, n=25, last 2 years) | |
| HP ZBook Studio 16 G11 | |
| WebXPRT 4 / Overall | |
| Schenker XMG Pro 16 (E25) | |
| Average Intel Core Ultra 9 275HX, NVIDIA GeForce RTX 5080 Laptop (285 - 336, n=9) | |
| Lenovo ThinkPad T16g Gen 3 RTX 5080 | |
| Dell Pro Max 16 Plus | |
| HP ZBook Fury 16 G11 | |
| Lenovo ThinkPad P16 Gen 2 | |
| Average of class Workstation (189.2 - 326, n=25, last 2 years) | |
| HP ZBook Studio 16 G11 | |
| Mozilla Kraken 1.1 / Total | |
| HP ZBook Studio 16 G11 | |
| Average of class Workstation (411 - 538, n=25, last 2 years) | |
| Lenovo ThinkPad P16 Gen 2 | |
| HP ZBook Fury 16 G11 | |
| Dell Pro Max 16 Plus | |
| Lenovo ThinkPad T16g Gen 3 RTX 5080 | |
| Average Intel Core Ultra 9 275HX, NVIDIA GeForce RTX 5080 Laptop (405 - 432, n=9) | |
| Schenker XMG Pro 16 (E25) | |
* ... smaller is better
| PCMark 10 Score | 10409 points | |
Help | ||
| AIDA64 / Memory Copy | |
| Dell Pro Max 16 Plus | |
| Schenker XMG Pro 16 (E25) | |
| Average of class Workstation (56003 - 164795, n=25, last 2 years) | |
| Average Intel Core Ultra 9 275HX (56003 - 94460, n=30) | |
| HP ZBook Studio 16 G11 | |
| Lenovo ThinkPad T16g Gen 3 RTX 5080 | |
| Lenovo ThinkPad P16 Gen 2 | |
| HP ZBook Fury 16 G11 | |
| AIDA64 / Memory Read | |
| Dell Pro Max 16 Plus | |
| Schenker XMG Pro 16 (E25) | |
| Average Intel Core Ultra 9 275HX (55795 - 97151, n=30) | |
| HP ZBook Studio 16 G11 | |
| Average of class Workstation (55795 - 121563, n=25, last 2 years) | |
| Lenovo ThinkPad P16 Gen 2 | |
| Lenovo ThinkPad T16g Gen 3 RTX 5080 | |
| HP ZBook Fury 16 G11 | |
| AIDA64 / Memory Write | |
| Dell Pro Max 16 Plus | |
| Schenker XMG Pro 16 (E25) | |
| Average of class Workstation (55663 - 214520, n=25, last 2 years) | |
| Average Intel Core Ultra 9 275HX (55663 - 116129, n=30) | |
| HP ZBook Studio 16 G11 | |
| Lenovo ThinkPad T16g Gen 3 RTX 5080 | |
| Lenovo ThinkPad P16 Gen 2 | |
| HP ZBook Fury 16 G11 | |
| AIDA64 / Memory Latency | |
| Lenovo ThinkPad T16g Gen 3 RTX 5080 | |
| HP ZBook Studio 16 G11 | |
| Average of class Workstation (84.5 - 165.2, n=25, last 2 years) | |
| Average Intel Core Ultra 9 275HX (105.8 - 161.6, n=30) | |
| Dell Pro Max 16 Plus | |
| Schenker XMG Pro 16 (E25) | |
| HP ZBook Fury 16 G11 | |
| Lenovo ThinkPad P16 Gen 2 | |
* ... smaller is better
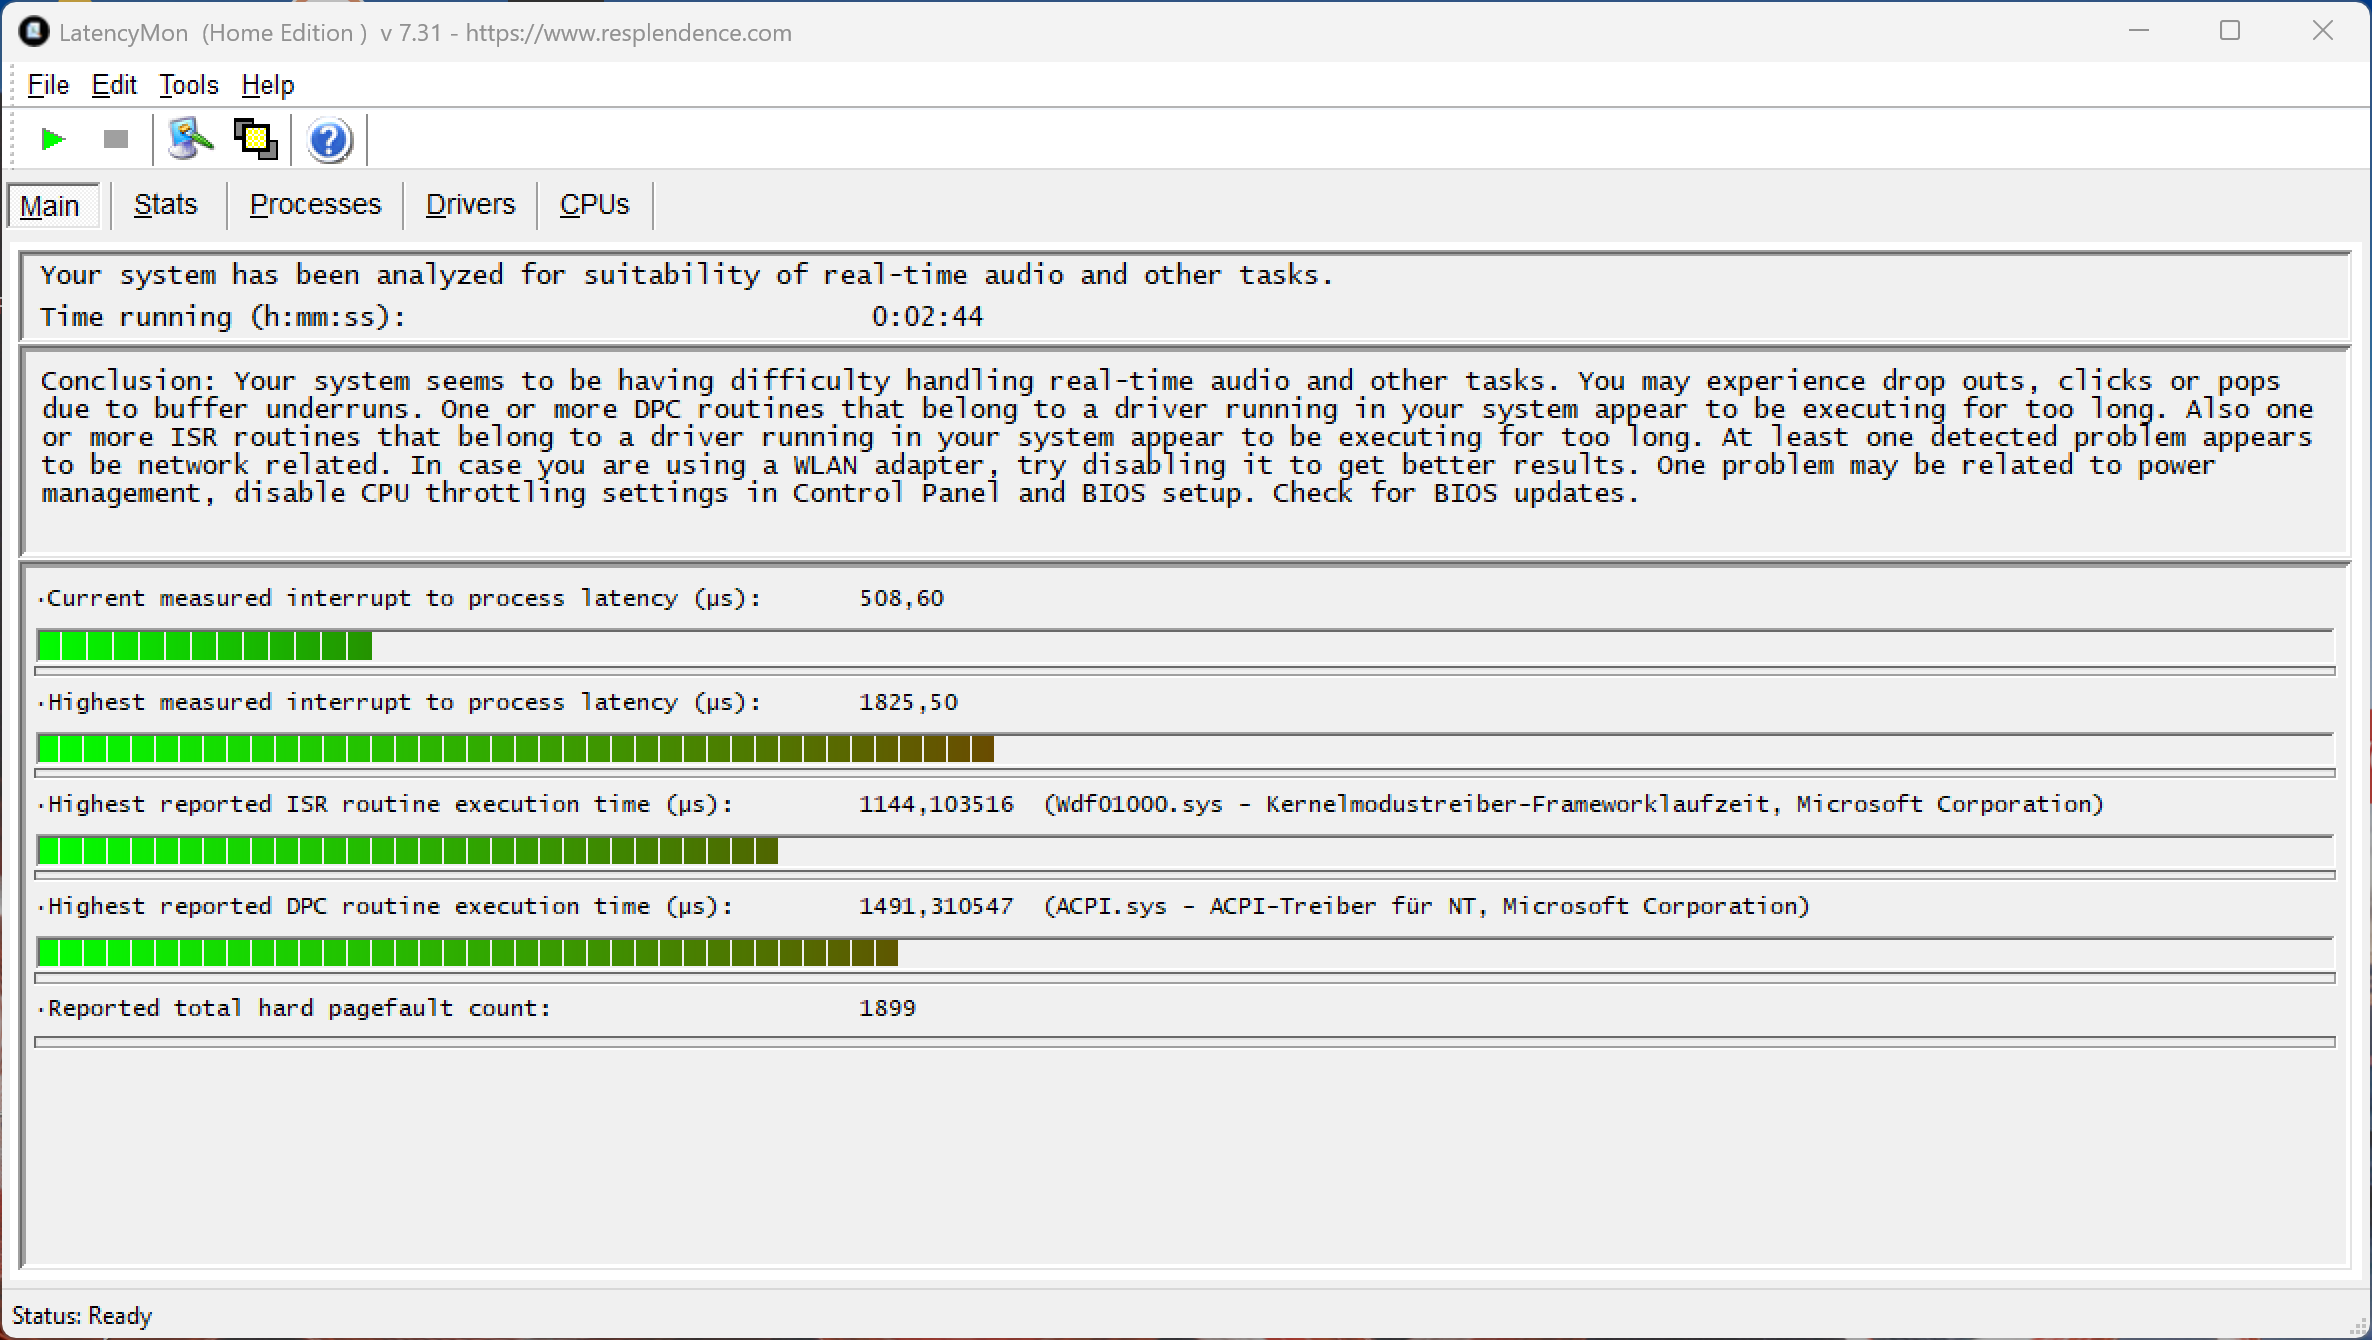
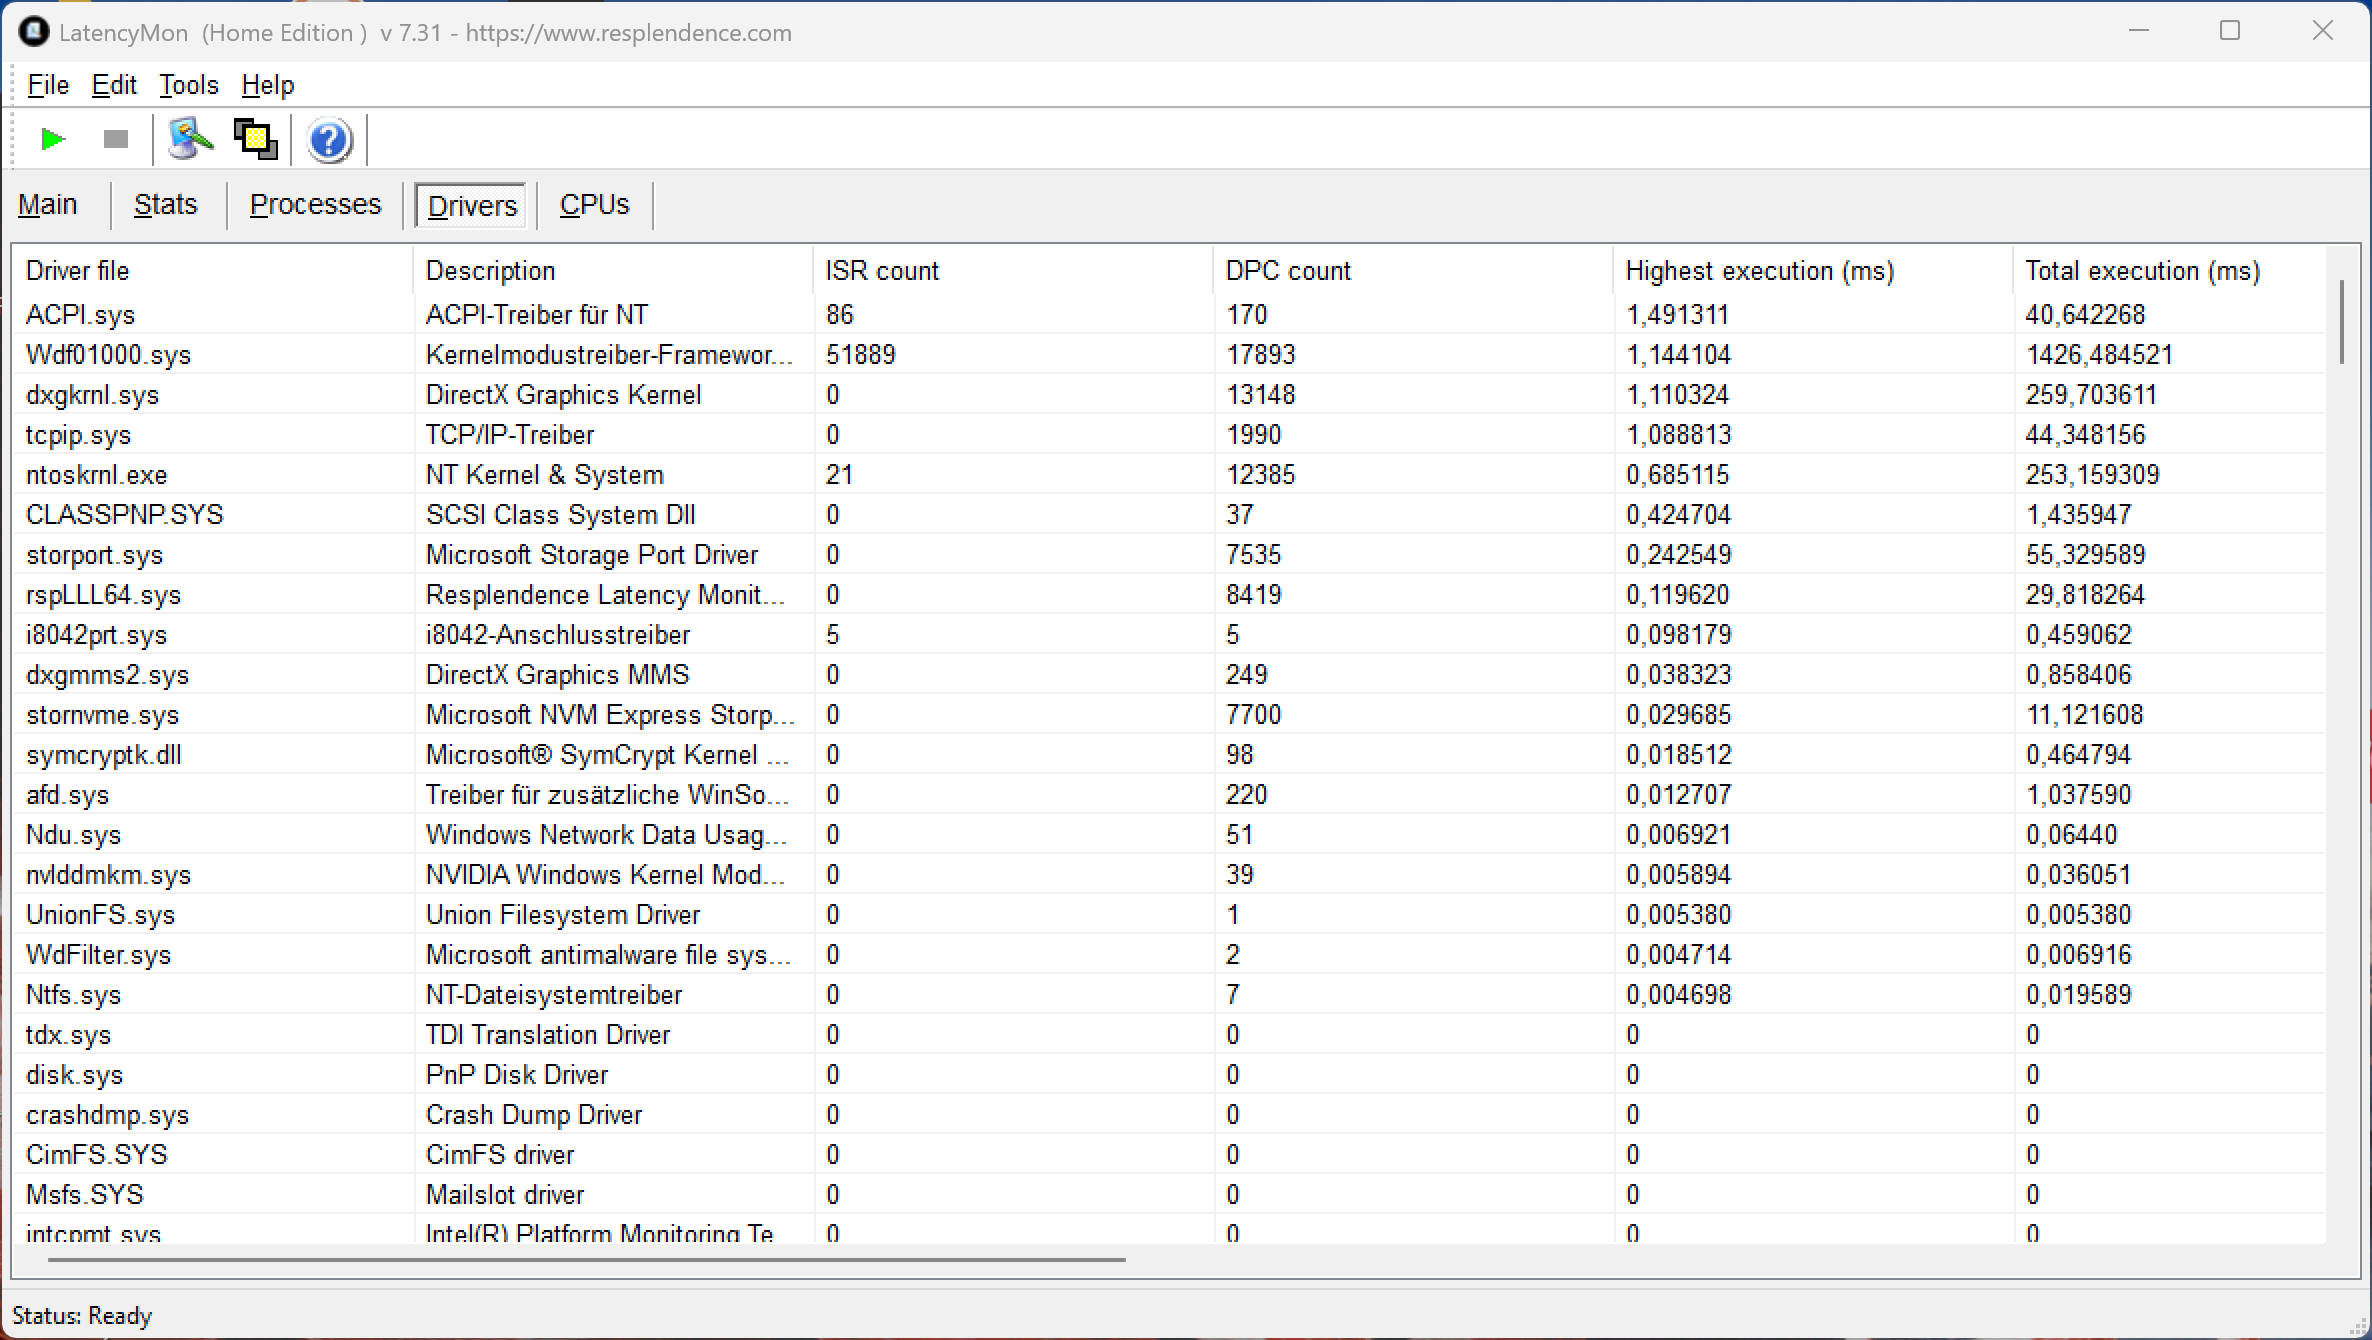
DPC 延迟
在我们的标准化延迟测试中,使用当前 BIOS 版本的 T16g 在使用实时音频应用程序时显示出轻微的限制。
| DPC Latencies / LatencyMon - interrupt to process latency (max), Web, Youtube, Prime95 | |
| HP ZBook Fury 16 G11 | |
| Dell Pro Max 16 Plus | |
| Lenovo ThinkPad T16g Gen 3 RTX 5080 | |
| Schenker XMG Pro 16 (E25) | |
| HP ZBook Studio 16 G11 | |
| Lenovo ThinkPad P16 Gen 2 | |
* ... smaller is better
大容量存储器
ThinkPad T16g 配备了一个快速 PCIe 5.0 插槽,我们的评测机使用了一个相应的 2 TB 三星固态硬盘(可用容量为 1.75 TB)。该固态硬盘的传输速度高达 13GB/s,性能普遍较高,但在持续负载的情况下无法保持这一水平,性能会下降约 50%。另外还有两个固态硬盘插槽(PCIe 4.0),可提供额外的存储空间。

* ... smaller is better
持续读取性能:DiskSpd 循环读取,队列深度 8
图形处理器性能
联想为移动 GeForce RTX 5080的TGP仅为105瓦,使其成为我们迄今测试过的最慢的实现之一(作为比较,即使是紧凑型的 华硕 ROG Zephyrus G14也能让 5080 的功耗达到 110 瓦),即使是 RTX 5070 Ti 在 XMG Pro 16也更快。此外,在这方面,5080 甚至比老款 ThinkPad P16 Gen 2 中的 RTX 4000 还要慢,而后者本身就是基于 RTX 4080 的。
不过,图形性能保持稳定,16 GB 的 VRAM 可以根据不同的应用提供不同的优势。即使在专业的 SPECviewperf 测试中,5080 在某些子测试中的表现也非常出色,因此这些应用也是可行的。游戏性能比配备 RTX 5080 的其他系统要低得多。使用电池供电时,GPU 的最大功耗限制为 60 瓦,这导致性能降低约 35%。
| 3DMark 11 Performance | 42195 points | |
| 3DMark Fire Strike Score | 33297 points | |
| 3DMark Time Spy Score | 15900 points | |
| 3DMark Steel Nomad Score | 4022 points | |
| 3DMark Steel Nomad Light Score | 17002 points | |
Help | ||
SPECviewperf 2020: 3840x2160 Solidworks (solidworks-07) 4k | 1920x1080 Solidworks (solidworks-07) | 1920x1080 Solidworks (solidworks-05) | 1920x1080 Siemens NX (snx-04) | 1920x1080 Medical (medical-03) | 1920x1080 Maya (maya-06) | 1920x1080 Energy (energy-03) | 1920x1080 Creo (creo-03) | 1920x1080 CATIA (catia-06) | 1920x1080 3ds Max (3dsmax-07) | 3840x2160 Solidworks (solidworks-05) | 3840x2160 Siemens NX (snx-04) | 3840x2160 Medical (medical-03) | 3840x2160 Maya (maya-06) | 3840x2160 Energy (energy-03) | 3840x2160 Creo (creo-03) | 3840x2160 CATIA (catia-06) | 3840x2160 3ds Max (3dsmax-07)
| SPECviewperf 15 / Siemens NX 2406 (snx-05) | |
| Lenovo ThinkPad P16v G3 21RS000DGE | |
| Razer Blade 16 Early 2023 | |
| Lenovo ThinkPad T16g Gen 3 RTX 5080 | |
| SPECviewperf 15 / Unreal Engine 5.4.2 (unreal_engine-01) | |
| Razer Blade 16 Early 2023 | |
| Lenovo ThinkPad T16g Gen 3 RTX 5080 | |
| Lenovo ThinkPad P1 Gen 8 | |
| Lenovo ThinkPad P16v G3 21RS000DGE | |
| SPECviewperf 15 / Solidworks 2024 (solidworks-08) | |
| Lenovo ThinkPad P1 Gen 8 | |
| Lenovo ThinkPad P16v G3 21RS000DGE | |
| Razer Blade 16 Early 2023 | |
| Lenovo ThinkPad T16g Gen 3 RTX 5080 | |
| SPECviewperf 15 / Tuvok (medical-04) | |
| Lenovo ThinkPad P1 Gen 8 | |
| Lenovo ThinkPad P16v G3 21RS000DGE | |
| Razer Blade 16 Early 2023 | |
| Lenovo ThinkPad T16g Gen 3 RTX 5080 | |
| SPECviewperf 15 / Maya 2025 (maya-07) | |
| Lenovo ThinkPad T16g Gen 3 RTX 5080 | |
| Razer Blade 16 Early 2023 | |
| Lenovo ThinkPad P1 Gen 8 | |
| Lenovo ThinkPad P16v G3 21RS000DGE | |
| SPECviewperf 15 / Enscape 4.0 (enscape-01) | |
| Lenovo ThinkPad T16g Gen 3 RTX 5080 | |
| Razer Blade 16 Early 2023 | |
| Lenovo ThinkPad P1 Gen 8 | |
| Lenovo ThinkPad P16v G3 21RS000DGE | |
| SPECviewperf 15 / OpendTect (energy-04) | |
| Razer Blade 16 Early 2023 | |
| Lenovo ThinkPad T16g Gen 3 RTX 5080 | |
| Lenovo ThinkPad P1 Gen 8 | |
| Lenovo ThinkPad P16v G3 21RS000DGE | |
| SPECviewperf 15 / Creo 9 (creo-04) | |
| Razer Blade 16 Early 2023 | |
| Lenovo ThinkPad P1 Gen 8 | |
| Lenovo ThinkPad T16g Gen 3 RTX 5080 | |
| Lenovo ThinkPad P16v G3 21RS000DGE | |
| SPECviewperf 15 / Catia V5 (catia-07) | |
| Lenovo ThinkPad T16g Gen 3 RTX 5080 | |
| Razer Blade 16 Early 2023 | |
| SPECviewperf 15 / Blender 3.6 (blender-01) | |
| Lenovo ThinkPad T16g Gen 3 RTX 5080 | |
| Razer Blade 16 Early 2023 | |
| Lenovo ThinkPad P1 Gen 8 | |
| Lenovo ThinkPad P16v G3 21RS000DGE | |
| SPECviewperf 15 / 3ds Max 2023 (3dsmax-08) | |
| Lenovo ThinkPad T16g Gen 3 RTX 5080 | |
| Razer Blade 16 Early 2023 | |
| Lenovo ThinkPad P1 Gen 8 | |
| Lenovo ThinkPad P16v G3 21RS000DGE | |
| SPECviewperf 2020 / Solidworks (solidworks-07) 4k | |
| Dell Pro Max 16 Plus | |
| Lenovo ThinkPad T16g Gen 3 RTX 5080 | |
| Lenovo ThinkPad P16 Gen 2 | |
| Lenovo ThinkPad P1 Gen 8 | |
| HP ZBook Fury 16 G11 | |
| Lenovo ThinkPad P16v G3 21RS000DGE | |
| HP ZBook Studio 16 G11 | |
| SPECviewperf 2020 / Solidworks (solidworks-05) | |
| Razer Blade 16 Early 2023 | |
| SPECviewperf 2020 / Solidworks (solidworks-05) | |
| Razer Blade 16 Early 2023 | |
| Blender / v3.3 Classroom OPTIX/RTX | |
| Average of class Workstation (10 - 95, n=19, last 2 years) | |
| HP ZBook Studio 16 G11 | |
| HP ZBook Fury 16 G11 | |
| Lenovo ThinkPad T16g Gen 3 RTX 5080 | |
| Lenovo ThinkPad P16 Gen 2 | |
| Schenker XMG Pro 16 (E25) | |
| Average NVIDIA GeForce RTX 5080 Laptop (11 - 17, n=14) | |
| Dell Pro Max 16 Plus | |
| Blender / v3.3 Classroom CUDA | |
| Average of class Workstation (16 - 142, n=19, last 2 years) | |
| HP ZBook Studio 16 G11 | |
| HP ZBook Fury 16 G11 | |
| Schenker XMG Pro 16 (E25) | |
| Lenovo ThinkPad T16g Gen 3 RTX 5080 | |
| Average NVIDIA GeForce RTX 5080 Laptop (18 - 49, n=16) | |
| Lenovo ThinkPad P16 Gen 2 | |
| Dell Pro Max 16 Plus | |
| Blender / v3.3 Classroom CPU | |
| HP ZBook Studio 16 G11 | |
| Average of class Workstation (148 - 464, n=25, last 2 years) | |
| HP ZBook Fury 16 G11 | |
| Lenovo ThinkPad P16 Gen 2 | |
| Lenovo ThinkPad T16g Gen 3 RTX 5080 | |
| Dell Pro Max 16 Plus | |
| Average NVIDIA GeForce RTX 5080 Laptop (123 - 243, n=15) | |
| Schenker XMG Pro 16 (E25) | |
* ... smaller is better
| Cyberpunk 2077 - 1920x1080 Ultra Preset (FSR off) | |
| Schenker XMG Pro 16 (E25) | |
| Dell Pro Max 16 Plus | |
| Lenovo ThinkPad T16g Gen 3 RTX 5080 | |
| Lenovo ThinkPad P16 Gen 2 | |
| HP ZBook Fury 16 G11 | |
| Average of class Workstation (19.6 - 152.4, n=25, last 2 years) | |
| HP ZBook Studio 16 G11 | |
| Final Fantasy XV Benchmark - 1920x1080 High Quality | |
| Dell Pro Max 16 Plus | |
| Lenovo ThinkPad T16g Gen 3 RTX 5080 | |
| Lenovo ThinkPad P16 Gen 2 | |
| Schenker XMG Pro 16 (E25) | |
| HP ZBook Fury 16 G11 | |
| Average of class Workstation (26.4 - 197.6, n=25, last 2 years) | |
| HP ZBook Studio 16 G11 | |
| Strange Brigade - 1920x1080 ultra AA:ultra AF:16 | |
| Lenovo ThinkPad T16g Gen 3 RTX 5080 | |
| Lenovo ThinkPad P16 Gen 2 | |
| Dell Pro Max 16 Plus | |
| Average of class Workstation (54.5 - 418, n=19, last 2 years) | |
| HP ZBook Fury 16 G11 | |
| HP ZBook Studio 16 G11 | |
| Schenker XMG Pro 16 (E25) | |
| Dota 2 Reborn - 1920x1080 ultra (3/3) best looking | |
| Schenker XMG Pro 16 (E25) | |
| Dell Pro Max 16 Plus | |
| Lenovo ThinkPad T16g Gen 3 RTX 5080 | |
| Lenovo ThinkPad P16 Gen 2 | |
| HP ZBook Fury 16 G11 | |
| HP ZBook Studio 16 G11 | |
| Average of class Workstation (50.7 - 178.4, n=25, last 2 years) | |
| F1 24 - 2560x1440 Ultra High Preset AA:T AF:16x | |
| Dell Pro Max 16 Plus | |
| Average NVIDIA GeForce RTX 5080 Laptop (60.6 - 92.6, n=12) | |
| Schenker XMG Pro 16 (E25) | |
| Average of class Workstation (22 - 101.8, n=9, last 2 years) | |
| Lenovo ThinkPad T16g Gen 3 RTX 5080 | |
赛博朋克 2077》超 FPS 图表
| low | med. | high | ultra | QHD DLSS | QHD | 4K DLSS | 4K | |
|---|---|---|---|---|---|---|---|---|
| GTA V (2015) | 141.3 | 128.1 | ||||||
| Dota 2 Reborn (2015) | 210 | 184.4 | 176.6 | 164.8 | 148.3 | |||
| Final Fantasy XV Benchmark (2018) | 220 | 196.9 | 152.1 | 121.1 | 71.3 | |||
| X-Plane 11.11 (2018) | 154.1 | 117.8 | 110.4 | 88 | ||||
| Strange Brigade (2018) | 505 | 350 | 343 | 311 | 181.6 | 125.7 | ||
| Baldur's Gate 3 (2023) | 189.7 | 163 | 148.2 | 145.9 | 107 | 57.3 | ||
| Cyberpunk 2077 (2023) | 135.8 | 131.2 | 119 | 107.6 | 84.5 | 74.4 | 41.9 | 34.6 |
| F1 24 (2024) | 274 | 239 | 96.5 | 97.7 | 60.6 | 52.2 | 31 | |
| F1 25 (2025) | 213 | 198.3 | 179.2 | 38.6 | 42.6 | 23.6 | 21.2 | 11.2 |
排放与能源
噪音排放

风扇既有积极的一面,也有消极的一面。在平衡和最佳性能两种功率模式下,风扇持续低速运转,这意味着即使在短时间负载或日常使用时,它们也很少会发出很大的声音。然而,当需要全功率时,两个风扇的噪音就会达到令人不安的 57 dB(A)(平衡模式:50.3 dB(A),最佳能效模式:42.7 dB(A),电池模式:最大 7 dB(A))。 57.7 dB(A))。考虑到其性能,这个音量实在是太大了,也比同类产品要大。没有检测到其他电子噪音。
Noise level
| Idle |
| 24.7 / 28.9 / 28.9 dB(A) |
| Load |
| 30.4 / 57.7 dB(A) |
 | ||
30 dB silent 40 dB(A) audible 50 dB(A) loud |
||
min: | ||
| Lenovo ThinkPad T16g Gen 3 RTX 5080 Ultra 9 275HX, GeForce RTX 5080 Laptop | HP ZBook Studio 16 G11 Ultra 9 185H, RTX 3000 Ada Generation Laptop | Dell Pro Max 16 Plus Ultra 9 285HX, RTX PRO 5000 Blackwell Generation Laptop | Lenovo ThinkPad P16 Gen 2 i7-14700HX, RTX 4000 Ada Generation Laptop | HP ZBook Fury 16 G11 i9-14900HX, RTX 3500 Ada Generation Laptop | Schenker XMG Pro 16 (E25) Ultra 9 275HX, GeForce RTX 5070 Ti Laptop | |
|---|---|---|---|---|---|---|
| Noise | 6% | -6% | -5% | 3% | -0% | |
| off / environment * (dB) | 24.7 | 23.8 4% | 23.2 6% | 23.9 3% | 23.2 6% | 23.3 6% |
| Idle Minimum * (dB) | 24.7 | 23.8 4% | 26.7 -8% | 29.1 -18% | 23.2 6% | 25 -1% |
| Idle Average * (dB) | 28.9 | 26.4 9% | 30.5 -6% | 29.1 -1% | 23.2 20% | 25 13% |
| Idle Maximum * (dB) | 28.9 | 26.4 9% | 34 -18% | 29.1 -1% | 29.5 -2% | 25 13% |
| Load Average * (dB) | 30.4 | 33.7 -11% | 39.8 -31% | 41 -35% | 43 -41% | 45.5 -50% |
| Cyberpunk 2077 ultra * (dB) | 57.7 | 46.1 20% | 54.3 6% | 52.8 8% | 48.2 16% | 53.3 8% |
| Load Maximum * (dB) | 57.7 | 53.2 8% | 54.3 6% | 52.9 8% | 48.2 16% | 53.3 8% |
* ... smaller is better
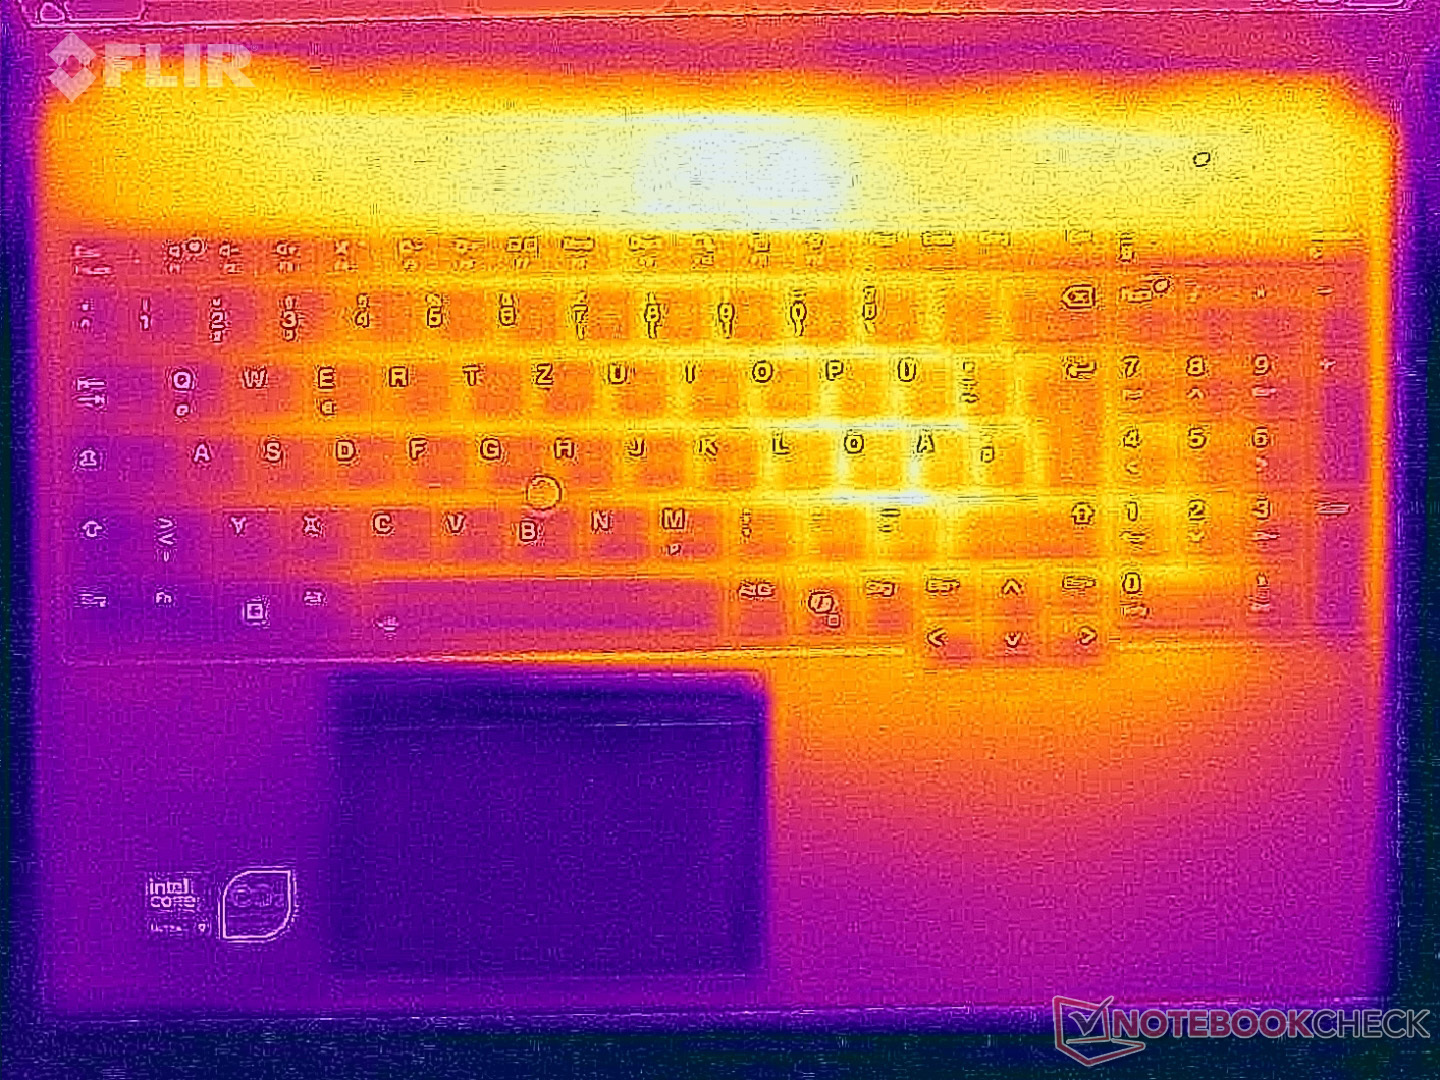
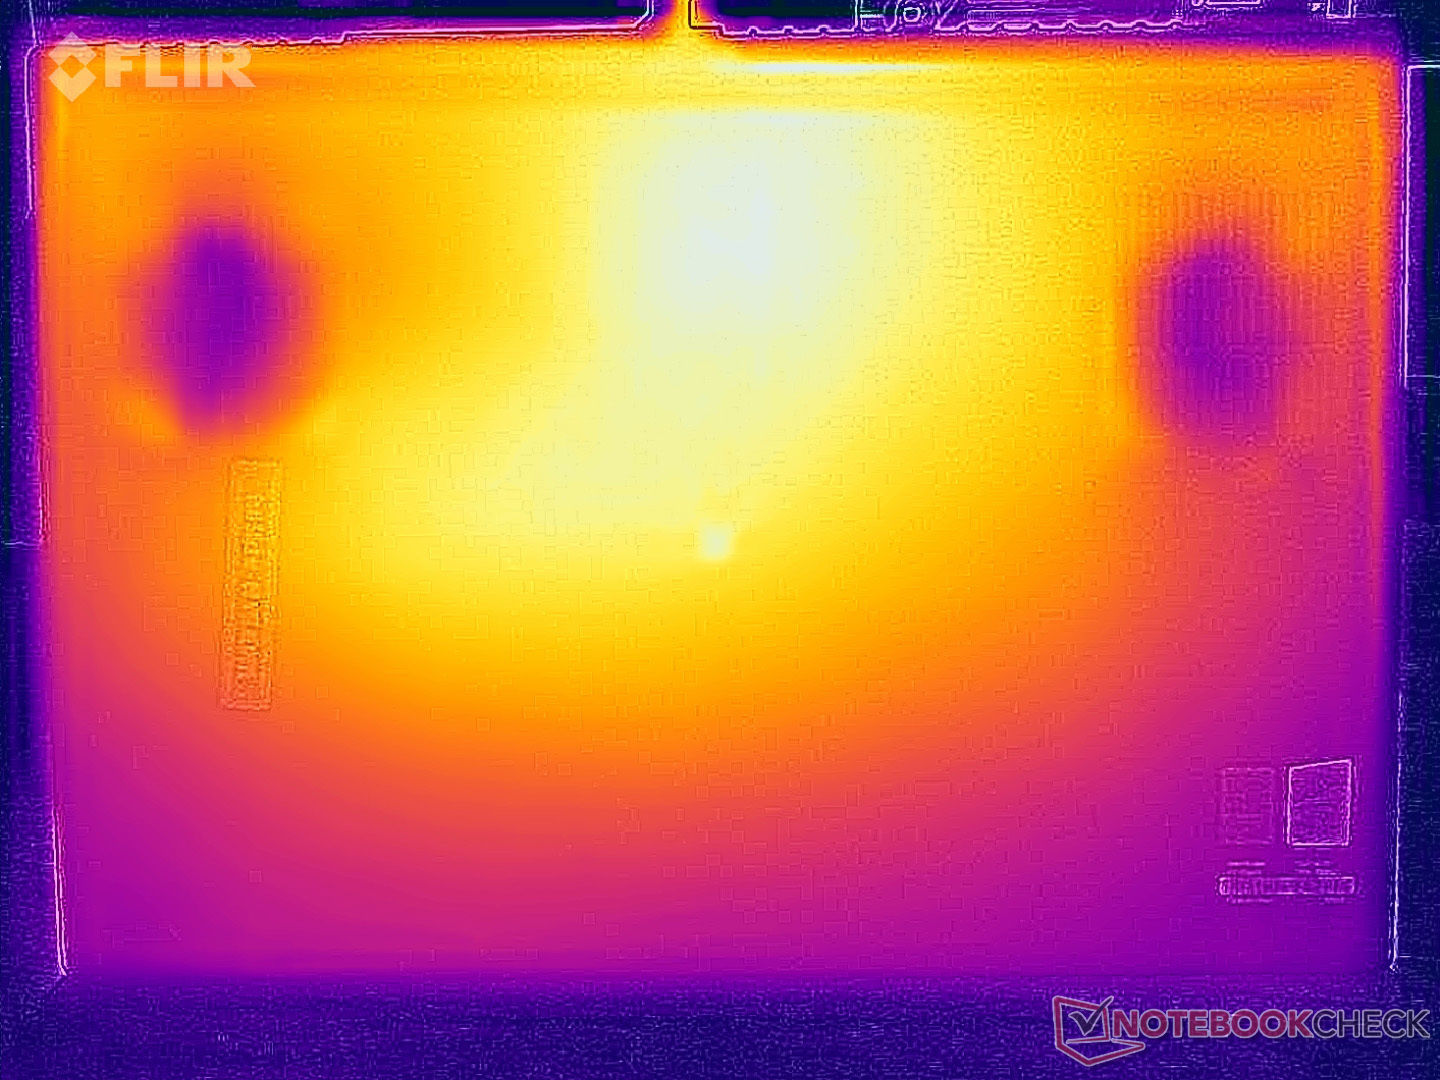
温度
风扇活动频繁的一个好处是表面温度较低,尽管在如此厚重的机箱内总功耗高达 130 瓦,但这并不让人感到意外。在压力测试中,显卡的功耗保持在 105 瓦(78 °C),而处理器的功耗仅为 25 瓦(73 °C)。

(±) The maximum temperature on the upper side is 43.9 °C / 111 F, compared to the average of 38.2 °C / 101 F, ranging from 22.2 to 69.8 °C for the class Workstation.
(-) The bottom heats up to a maximum of 45.4 °C / 114 F, compared to the average of 41.1 °C / 106 F
(+) In idle usage, the average temperature for the upper side is 27.1 °C / 81 F, compared to the device average of 32 °C / 90 F.
(-) 3: The average temperature for the upper side is 39.4 °C / 103 F, compared to the average of 32 °C / 90 F for the class Workstation.
(±) The palmrests and touchpad can get very hot to the touch with a maximum of 38 °C / 100.4 F.
(-) The average temperature of the palmrest area of similar devices was 27.8 °C / 82 F (-10.2 °C / -18.4 F).
| Lenovo ThinkPad T16g Gen 3 RTX 5080 Ultra 9 275HX, GeForce RTX 5080 Laptop | HP ZBook Studio 16 G11 Ultra 9 185H, RTX 3000 Ada Generation Laptop | Dell Pro Max 16 Plus Ultra 9 285HX, RTX PRO 5000 Blackwell Generation Laptop | Lenovo ThinkPad P16 Gen 2 i7-14700HX, RTX 4000 Ada Generation Laptop | HP ZBook Fury 16 G11 i9-14900HX, RTX 3500 Ada Generation Laptop | Schenker XMG Pro 16 (E25) Ultra 9 275HX, GeForce RTX 5070 Ti Laptop | |
|---|---|---|---|---|---|---|
| Heat | -6% | -6% | 1% | -16% | -206% | |
| Maximum Upper Side * (°C) | 43.9 | 36.6 17% | 40.4 8% | 46.6 -6% | 42.2 4% | 43.2 2% |
| Maximum Bottom * (°C) | 45.4 | 47.8 -5% | 45.6 -0% | 51 -12% | 48 -6% | 46 -1% |
| Idle Upper Side * (°C) | 27.7 | 31.4 -13% | 32.8 -18% | 24.8 10% | 37 -34% | 27.7 -0% |
| Idle Bottom * (°C) | 28.6 | 35.6 -24% | 33 -15% | 25.6 10% | 36.8 -29% | 264 -823% |
* ... smaller is better
发言人
总之,扬声器的音质非常好,明显优于同类产品。
Lenovo ThinkPad T16g Gen 3 RTX 5080 audio analysis
(+) | speakers can play relatively loud (84.2 dB)
Bass 100 - 315 Hz
(±) | reduced bass - on average 11.5% lower than median
(±) | linearity of bass is average (13.2% delta to prev. frequency)
Mids 400 - 2000 Hz
(+) | balanced mids - only 2.9% away from median
(+) | mids are linear (3% delta to prev. frequency)
Highs 2 - 16 kHz
(+) | balanced highs - only 1.4% away from median
(+) | highs are linear (3.6% delta to prev. frequency)
Overall 100 - 16.000 Hz
(+) | overall sound is linear (10.2% difference to median)
Compared to same class
» 6% of all tested devices in this class were better, 5% similar, 89% worse
» The best had a delta of 7%, average was 17%, worst was 35%
Compared to all devices tested
» 5% of all tested devices were better, 1% similar, 94% worse
» The best had a delta of 4%, average was 24%, worst was 134%
HP ZBook Studio 16 G11 audio analysis
(+) | speakers can play relatively loud (82.7 dB)
Bass 100 - 315 Hz
(-) | nearly no bass - on average 17.4% lower than median
(±) | linearity of bass is average (11.8% delta to prev. frequency)
Mids 400 - 2000 Hz
(+) | balanced mids - only 3.4% away from median
(±) | linearity of mids is average (7% delta to prev. frequency)
Highs 2 - 16 kHz
(+) | balanced highs - only 2.4% away from median
(+) | highs are linear (2.6% delta to prev. frequency)
Overall 100 - 16.000 Hz
(±) | linearity of overall sound is average (15.2% difference to median)
Compared to same class
» 33% of all tested devices in this class were better, 10% similar, 57% worse
» The best had a delta of 7%, average was 17%, worst was 35%
Compared to all devices tested
» 21% of all tested devices were better, 4% similar, 74% worse
» The best had a delta of 4%, average was 24%, worst was 134%
Dell Pro Max 16 Plus audio analysis
(+) | speakers can play relatively loud (91.6 dB)
Bass 100 - 315 Hz
(-) | nearly no bass - on average 20.9% lower than median
(+) | bass is linear (5.9% delta to prev. frequency)
Mids 400 - 2000 Hz
(+) | balanced mids - only 4.5% away from median
(+) | mids are linear (4% delta to prev. frequency)
Highs 2 - 16 kHz
(+) | balanced highs - only 3.7% away from median
(+) | highs are linear (2.9% delta to prev. frequency)
Overall 100 - 16.000 Hz
(+) | overall sound is linear (14.3% difference to median)
Compared to same class
» 30% of all tested devices in this class were better, 4% similar, 67% worse
» The best had a delta of 7%, average was 17%, worst was 35%
Compared to all devices tested
» 17% of all tested devices were better, 4% similar, 79% worse
» The best had a delta of 4%, average was 24%, worst was 134%
Lenovo ThinkPad P16 Gen 2 audio analysis
(±) | speaker loudness is average but good (80.7 dB)
Bass 100 - 315 Hz
(±) | reduced bass - on average 10.8% lower than median
(±) | linearity of bass is average (8% delta to prev. frequency)
Mids 400 - 2000 Hz
(±) | higher mids - on average 5.4% higher than median
(+) | mids are linear (6.2% delta to prev. frequency)
Highs 2 - 16 kHz
(+) | balanced highs - only 3.3% away from median
(+) | highs are linear (5.5% delta to prev. frequency)
Overall 100 - 16.000 Hz
(±) | linearity of overall sound is average (15.6% difference to median)
Compared to same class
» 35% of all tested devices in this class were better, 11% similar, 54% worse
» The best had a delta of 7%, average was 17%, worst was 35%
Compared to all devices tested
» 23% of all tested devices were better, 5% similar, 72% worse
» The best had a delta of 4%, average was 24%, worst was 134%
HP ZBook Fury 16 G11 audio analysis
(+) | speakers can play relatively loud (88.9 dB)
Bass 100 - 315 Hz
(±) | reduced bass - on average 13.3% lower than median
(±) | linearity of bass is average (11.2% delta to prev. frequency)
Mids 400 - 2000 Hz
(+) | balanced mids - only 2.2% away from median
(+) | mids are linear (3.2% delta to prev. frequency)
Highs 2 - 16 kHz
(+) | balanced highs - only 3.7% away from median
(+) | highs are linear (4.6% delta to prev. frequency)
Overall 100 - 16.000 Hz
(+) | overall sound is linear (12.9% difference to median)
Compared to same class
» 21% of all tested devices in this class were better, 6% similar, 72% worse
» The best had a delta of 7%, average was 17%, worst was 35%
Compared to all devices tested
» 12% of all tested devices were better, 3% similar, 85% worse
» The best had a delta of 4%, average was 24%, worst was 134%
Schenker XMG Pro 16 (E25) audio analysis
(±) | speaker loudness is average but good (79.2 dB)
Bass 100 - 315 Hz
(±) | reduced bass - on average 14.2% lower than median
(±) | linearity of bass is average (10.6% delta to prev. frequency)
Mids 400 - 2000 Hz
(±) | higher mids - on average 8.2% higher than median
(±) | linearity of mids is average (9.9% delta to prev. frequency)
Highs 2 - 16 kHz
(+) | balanced highs - only 3.8% away from median
(+) | highs are linear (5.9% delta to prev. frequency)
Overall 100 - 16.000 Hz
(±) | linearity of overall sound is average (18.5% difference to median)
Compared to same class
» 60% of all tested devices in this class were better, 8% similar, 32% worse
» The best had a delta of 6%, average was 18%, worst was 132%
Compared to all devices tested
» 41% of all tested devices were better, 8% similar, 51% worse
» The best had a delta of 4%, average was 24%, worst was 134%
耗电量

如开头所述,T16g Gen 3 完全通过 USB-C 接口充电,该接口最大可承受 180 瓦的功率,这也是随附一个相当小巧的 180 瓦电源适配器的原因。当组件处于负载状态时(不仅仅是在我们的压力测试中),电池会在短时间内有规律地消耗能量,这对电池的健康绝对不利。在高峰期,HWiNFO 显示综合负载开始时的总功耗超过 280 瓦。
| Off / Standby | |
| Idle | |
| Load |
|
Key:
min: | |
| Lenovo ThinkPad T16g Gen 3 RTX 5080 Ultra 9 275HX, GeForce RTX 5080 Laptop, Samsung PM9E1 MZVLC2T0HBLD, OLED, 3200x2000, 16" | HP ZBook Studio 16 G11 Ultra 9 185H, RTX 3000 Ada Generation Laptop, Kioxia XG8 KXG80ZNV1T02, IPS, 3840x2400, 16" | Dell Pro Max 16 Plus Ultra 9 285HX, RTX PRO 5000 Blackwell Generation Laptop, SK hynix PCB01 HFS001TFM9X186N, OLED, 3840x2400, 16" | Lenovo ThinkPad P16 Gen 2 i7-14700HX, RTX 4000 Ada Generation Laptop, SK hynix PC801 HFS001TEJ9X162N, IPS, 2560x1600, 16" | HP ZBook Fury 16 G11 i9-14900HX, RTX 3500 Ada Generation Laptop, SK hynix PC801 HFS001TEJ9X101N, IPS, 3840x2400, 16" | Schenker XMG Pro 16 (E25) Ultra 9 275HX, GeForce RTX 5070 Ti Laptop, Samsung 9100 Pro 1 TB, IPS, 2560x1600, 16" | Average NVIDIA GeForce RTX 5080 Laptop | Average of class Workstation | |
|---|---|---|---|---|---|---|---|---|
| Power Consumption | -2% | -104% | -15% | -5% | -24% | -57% | 12% | |
| Idle Minimum * (Watt) | 9.9 | 14 -41% | 35.1 -255% | 7.9 20% | 8.6 13% | 11.7 -18% | 19.1 ? -93% | 8.94 ? 10% |
| Idle Average * (Watt) | 17.1 | 22.4 -31% | 39.2 -129% | 13.1 23% | 14.8 13% | 16.6 3% | 25.3 ? -48% | 13.8 ? 19% |
| Idle Maximum * (Watt) | 17.7 | 25.7 -45% | 56 -216% | 24.2 -37% | 15.7 11% | 17.1 3% | 30.4 ? -72% | 17.5 ? 1% |
| Load Average * (Watt) | 125.6 | 90.2 28% | 130.2 -4% | 127.4 -1% | 129.4 -3% | 122.4 3% | 128.5 ? -2% | 95 ? 24% |
| Cyberpunk 2077 ultra external monitor * (Watt) | 166.8 | 120.3 28% | 213 -28% | 219 -31% | 192.6 -15% | 241 -44% | ||
| Cyberpunk 2077 ultra * (Watt) | 160.5 | 125.4 22% | 229 -43% | 225 -40% | 199.4 -24% | 245 -53% | ||
| Load Maximum * (Watt) | 182.8 | 142 22% | 285.2 -56% | 248.5 -36% | 236.1 -29% | 291.5 -59% | 314 ? -72% | 175.2 ? 4% |
* ... smaller is better
功耗 赛博朋克/压力测试
外接显示器的功耗
电池运行时间
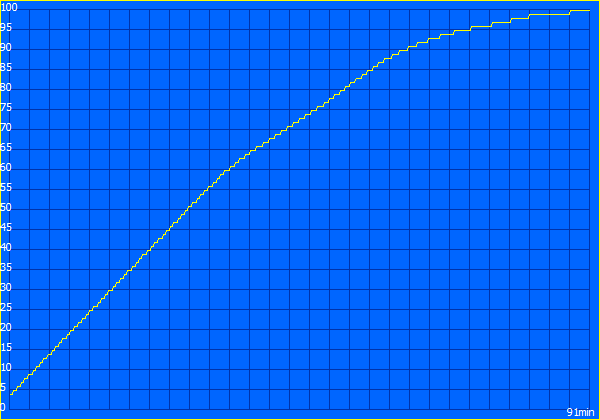
联想安装了一块 99.9 Wh 的电池,测得的电池续航时间对于此类设备来说非常不错。在我们以 150 cd/m² 和 60 Hz 进行的 Wi-Fi 测试中,它的续航时间约为 9.5 小时,即使在全亮度条件下,它也能坚持 6 小时。
Notebookcheck 总体评分
Lenovo ThinkPad T16g Gen 3 RTX 5080
- 02/04/2026 v8
Andreas Osthoff
 Total Sustainability Score:
 可能的替代品比较
Image | Model / Review | Price | Weight | Height | Display |
|---|---|---|---|---|---|
1. 87.3%  | Lenovo ThinkPad T16g Gen 3 RTX 5080 Intel Core Ultra 9 275HX ⎘ NVIDIA GeForce RTX 5080 Laptop ⎘ 64 GB Memory, 2048 GB SSD | Amazon: 1. $1,999.00 Lenovo ThinkPad E16 Gen 3 La... 2. $1,349.99 Lenovo ThinkPad E16 Gen 3 Bu... 3. $909.99 Lenovo ThinkPad E16 Gen 3 Bu... List Price: 4800€ | 2.6 kg | 29.8 mm | 16.00" 3200x2000 236 PPI OLED |
2. 84.2%  | HP ZBook Studio 16 G11 Intel Core Ultra 9 185H ⎘ NVIDIA RTX 3000 Ada Generation Laptop ⎘ 64 GB Memory, 1024 GB SSD | Amazon: List Price: 4300 USD | 1.8 kg | 19 mm | 16.00" 3840x2400 283 PPI IPS |
3. 88.4%  | Dell Pro Max 16 Plus Intel Core Ultra 9 285HX ⎘ NVIDIA RTX PRO 5000 Blackwell Generation Laptop ⎘ 128 GB Memory, SSD | Amazon: List Price: 5000 USD | 2.8 kg | 30.9 mm | 16.00" 3840x2400 283 PPI OLED |
4. 85.9%  | Lenovo ThinkPad P16 Gen 2 Intel Core i7-14700HX ⎘ NVIDIA RTX 4000 Ada Generation Laptop ⎘ 32 GB Memory, 1024 GB SSD | Amazon: List Price: 3500 USD | 3.1 kg | 30.23 mm | 16.00" 2560x1600 189 PPI IPS |
5. 85.9%  | HP ZBook Fury 16 G11 Intel Core i9-14900HX ⎘ NVIDIA RTX 3500 Ada Generation Laptop ⎘ 64 GB Memory, 1024 GB SSD | Amazon: List Price: 3300 USD | 2.6 kg | 28.5 mm | 16.00" 3840x2400 283 PPI IPS |
6. 87.4%  | Schenker XMG Pro 16 (E25) Intel Core Ultra 9 275HX ⎘ NVIDIA GeForce RTX 5070 Ti Laptop ⎘ 32 GB Memory, 1024 GB SSD | Amazon: 1. $22.78 Very Best of Michael Schenke... List Price: 2480€ | 2.5 kg | 26.5 mm | 16.00" 2560x1600 189 PPI IPS |
Transparency
The selection of devices to be reviewed is made by our editorial team. The test sample was provided to the author as a loan by the manufacturer or retailer for the purpose of this review. The lender had no influence on this review, nor did the manufacturer receive a copy of this review before publication. There was no obligation to publish this review. As an independent media company, Notebookcheck is not subjected to the authority of manufacturers, retailers or publishers.
This is how Notebookcheck is testing
Every year, Notebookcheck independently reviews hundreds of laptops and smartphones using standardized procedures to ensure that all results are comparable. We have continuously developed our test methods for around 20 years and set industry standards in the process. In our test labs, high-quality measuring equipment is utilized by experienced technicians and editors. These tests involve a multi-stage validation process. Our complex rating system is based on hundreds of well-founded measurements and benchmarks, which maintains objectivity. Further information on our test methods can be found here.

