结论 - 性能越强,重量越重
Area-51 看起来新颖别致,但它加倍遵循了上一代 Alienware 笔记本电脑的原则:以更重的重量和更大的尺寸为代价,实现最高性能。这是为数不多的几款 16 英寸游戏笔记本电脑之一,其 GPU 可以在不影响或节流的情况下完全运行 175 W,性能略快于大多数其他具有相同 GPU 选项的笔记本电脑。我们还很欣赏新的后部 RGB LED,它不像老式设计那样刺眼。希望尽可能提高性能并喜欢机械按键的玩家会发现 Area-51 有很多可取之处。
与轻薄型替代品(如 Razer Blade 16)相比,其明显的缺点包括重量重、体积大、电池寿命短。 雷蛇刀锋 16或 华硕 Zephyrus G16.最值得注意的是,如果设置为 Turbo 模式(即最大风扇噪音模式),GPU 只能以 175 W 的功率运行;如果 "仅 "在性能模式下运行,则只能以 150 W 的功率运行。因此,尽管 Alienware 采用了更密集的冷却解决方案,但风扇噪音仍比上述替代产品略大。
Pros
Cons
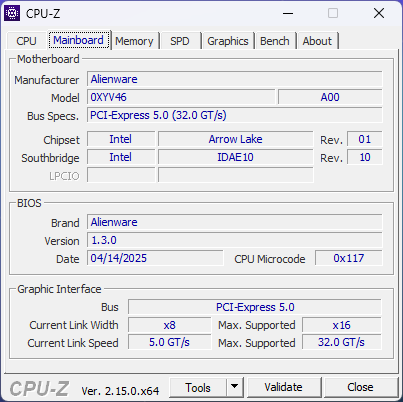
戴尔今年在整个产品组合中进行的品牌重塑不仅包括其 消费和商用系列还包括 Alienware 系列游戏笔记本电脑。Area-51 的名称将重新代表 Alienware 的旗舰笔记本电脑型号,其方式与上一款 上一款 Area-51 型号的方式回归。
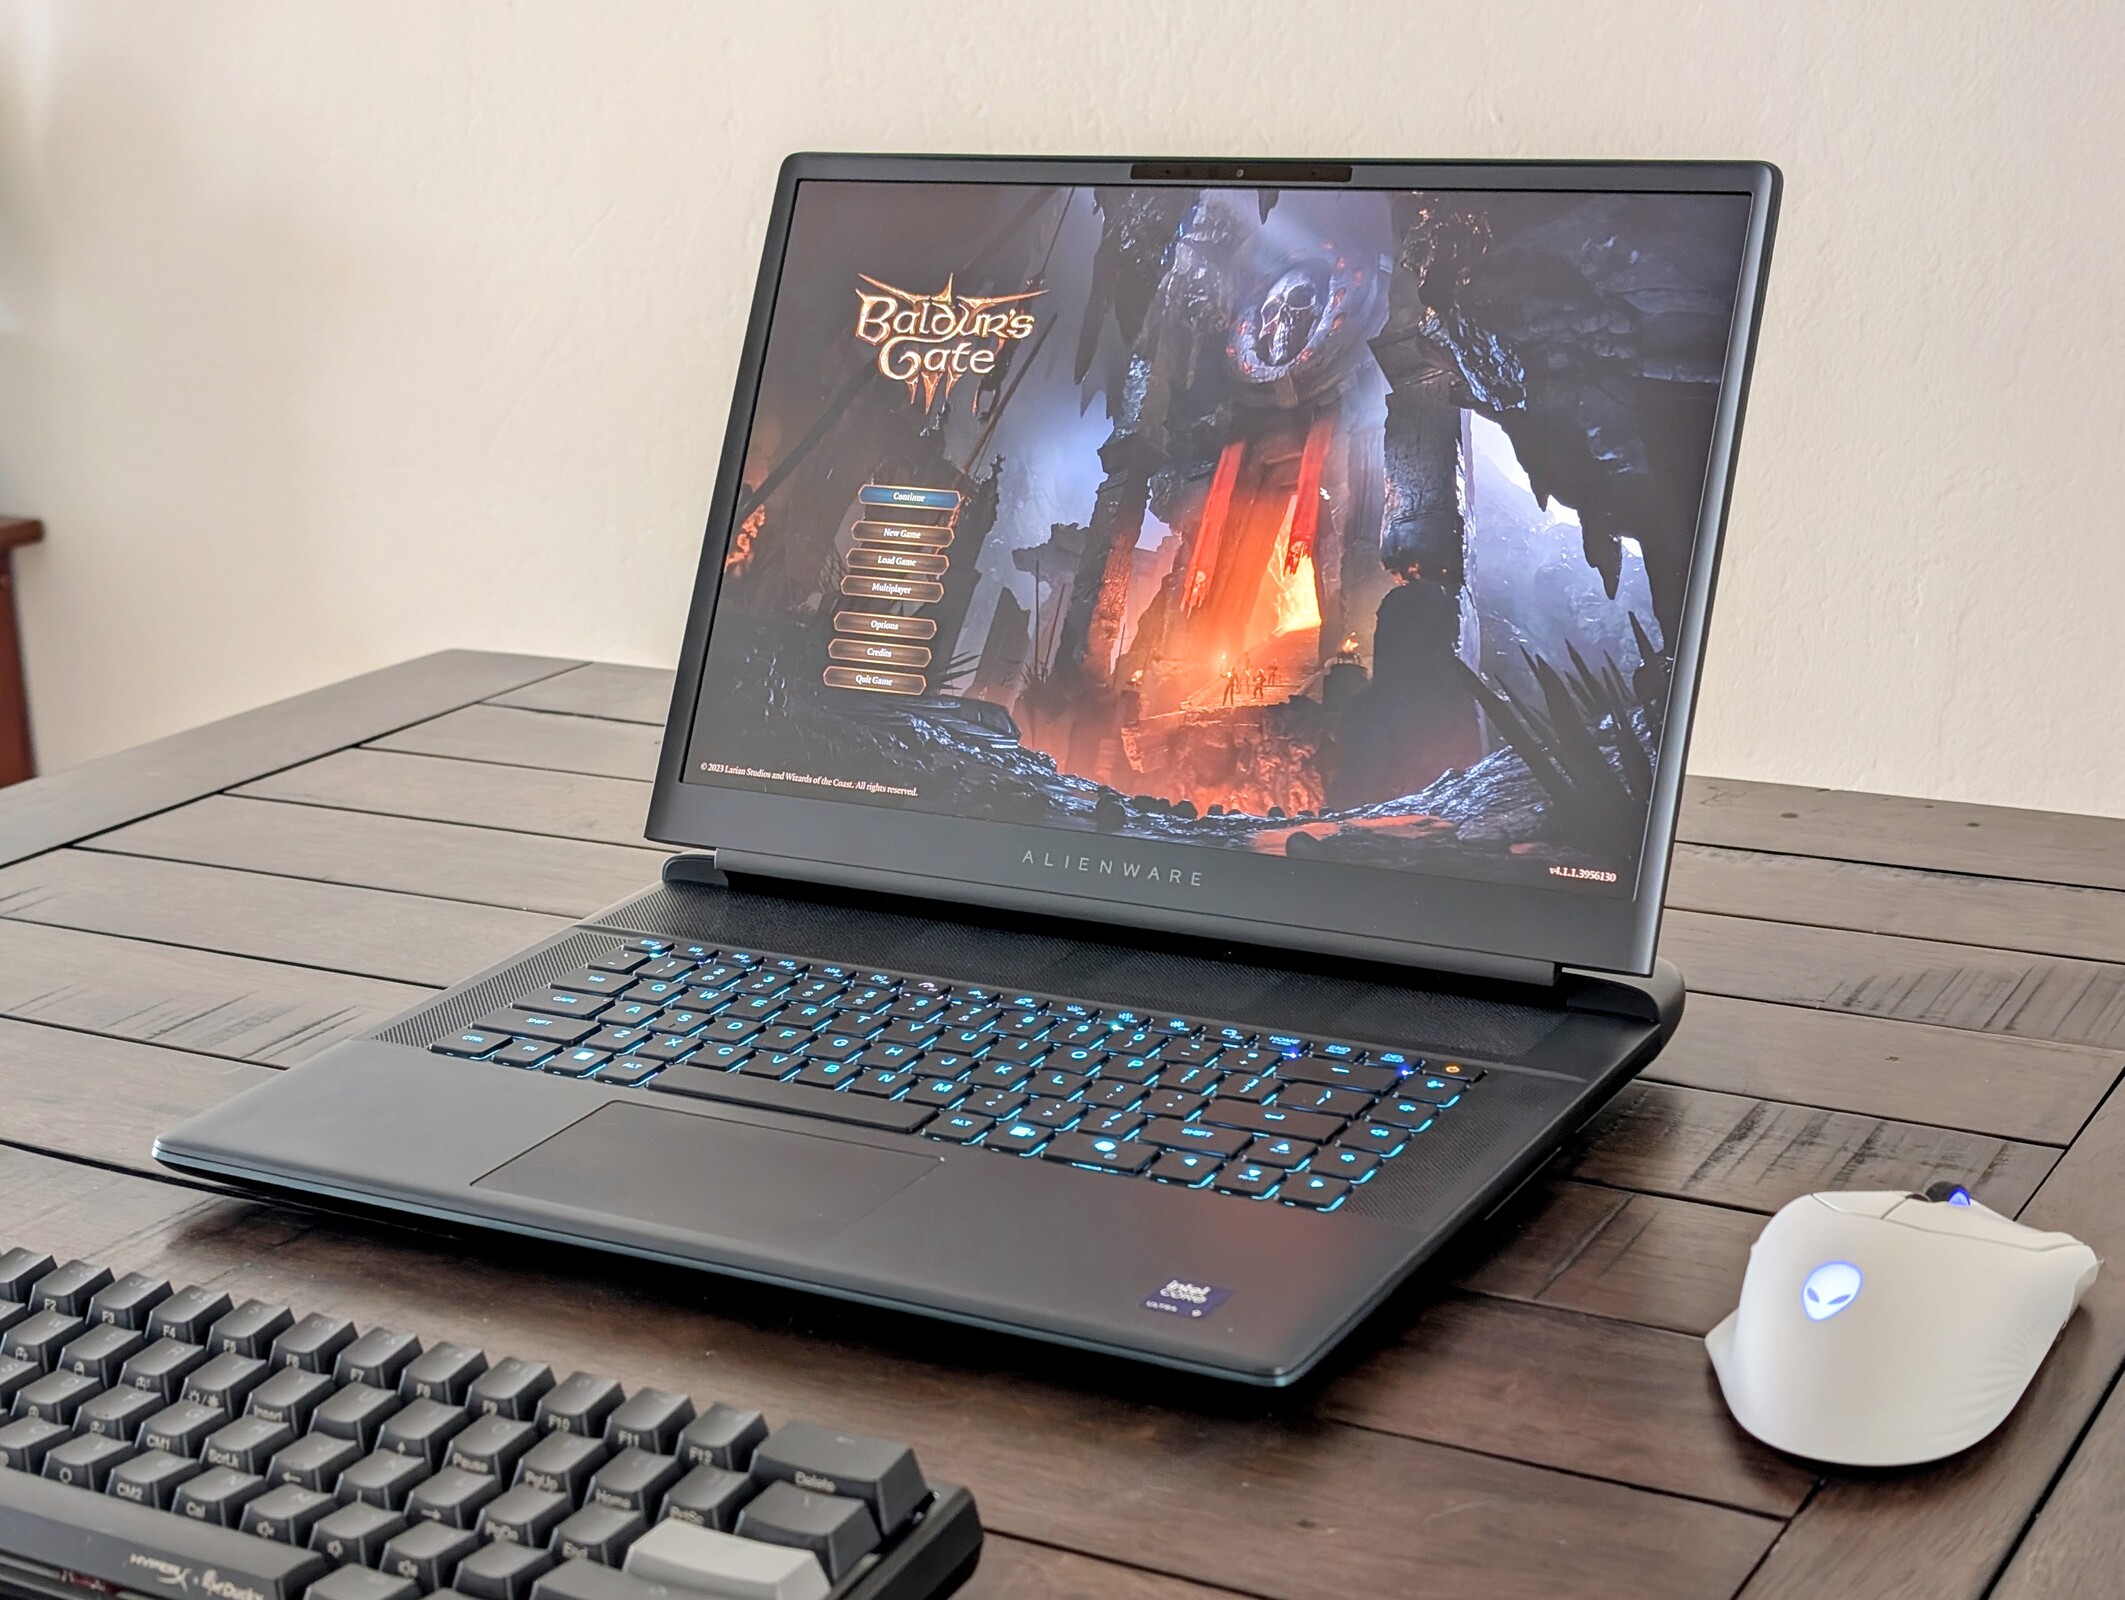
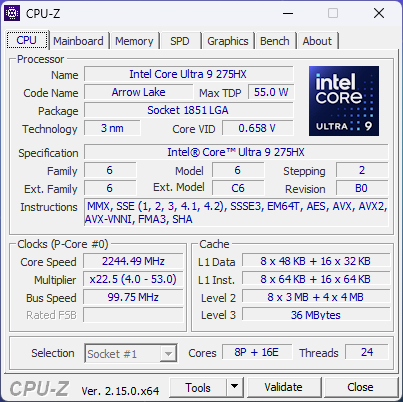
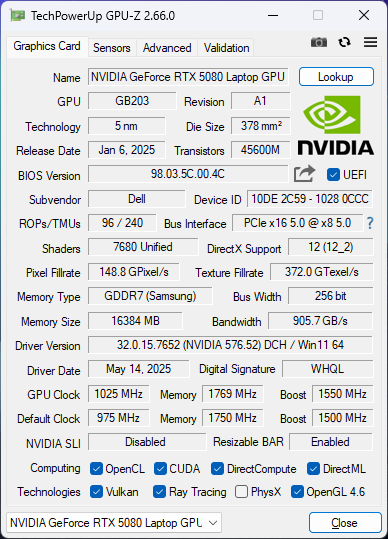
目前有两种尺寸可供选择:Alienware 16 Area-51 和 Alienware 18 Area-51。我们的测试机是前者,配备酷睿 Ultra 9 275HX Arrow Lake CPU、175 WGeForce RTX 5080 GPU、Cherry 机械键盘和 1600p240 IPS 显示屏,售价约 3250 美元。目前所有 16 英寸 SKU 的 CPU 和显示器都是固定的,而 Nvidia Blackwell GPU 可能会有所不同。
Alienware 16 Area-51 的替代产品包括其他大型旗舰 16 英寸游戏笔记本电脑,如 联想Legion Pro 7i 16 10 代, 宏碁掠夺者 Helios 16或 华硕 ROG Strix Scar 16 系列.
更多戴尔评论:
规格
机箱 - 全新 Alienware 30 "AW30 "设计
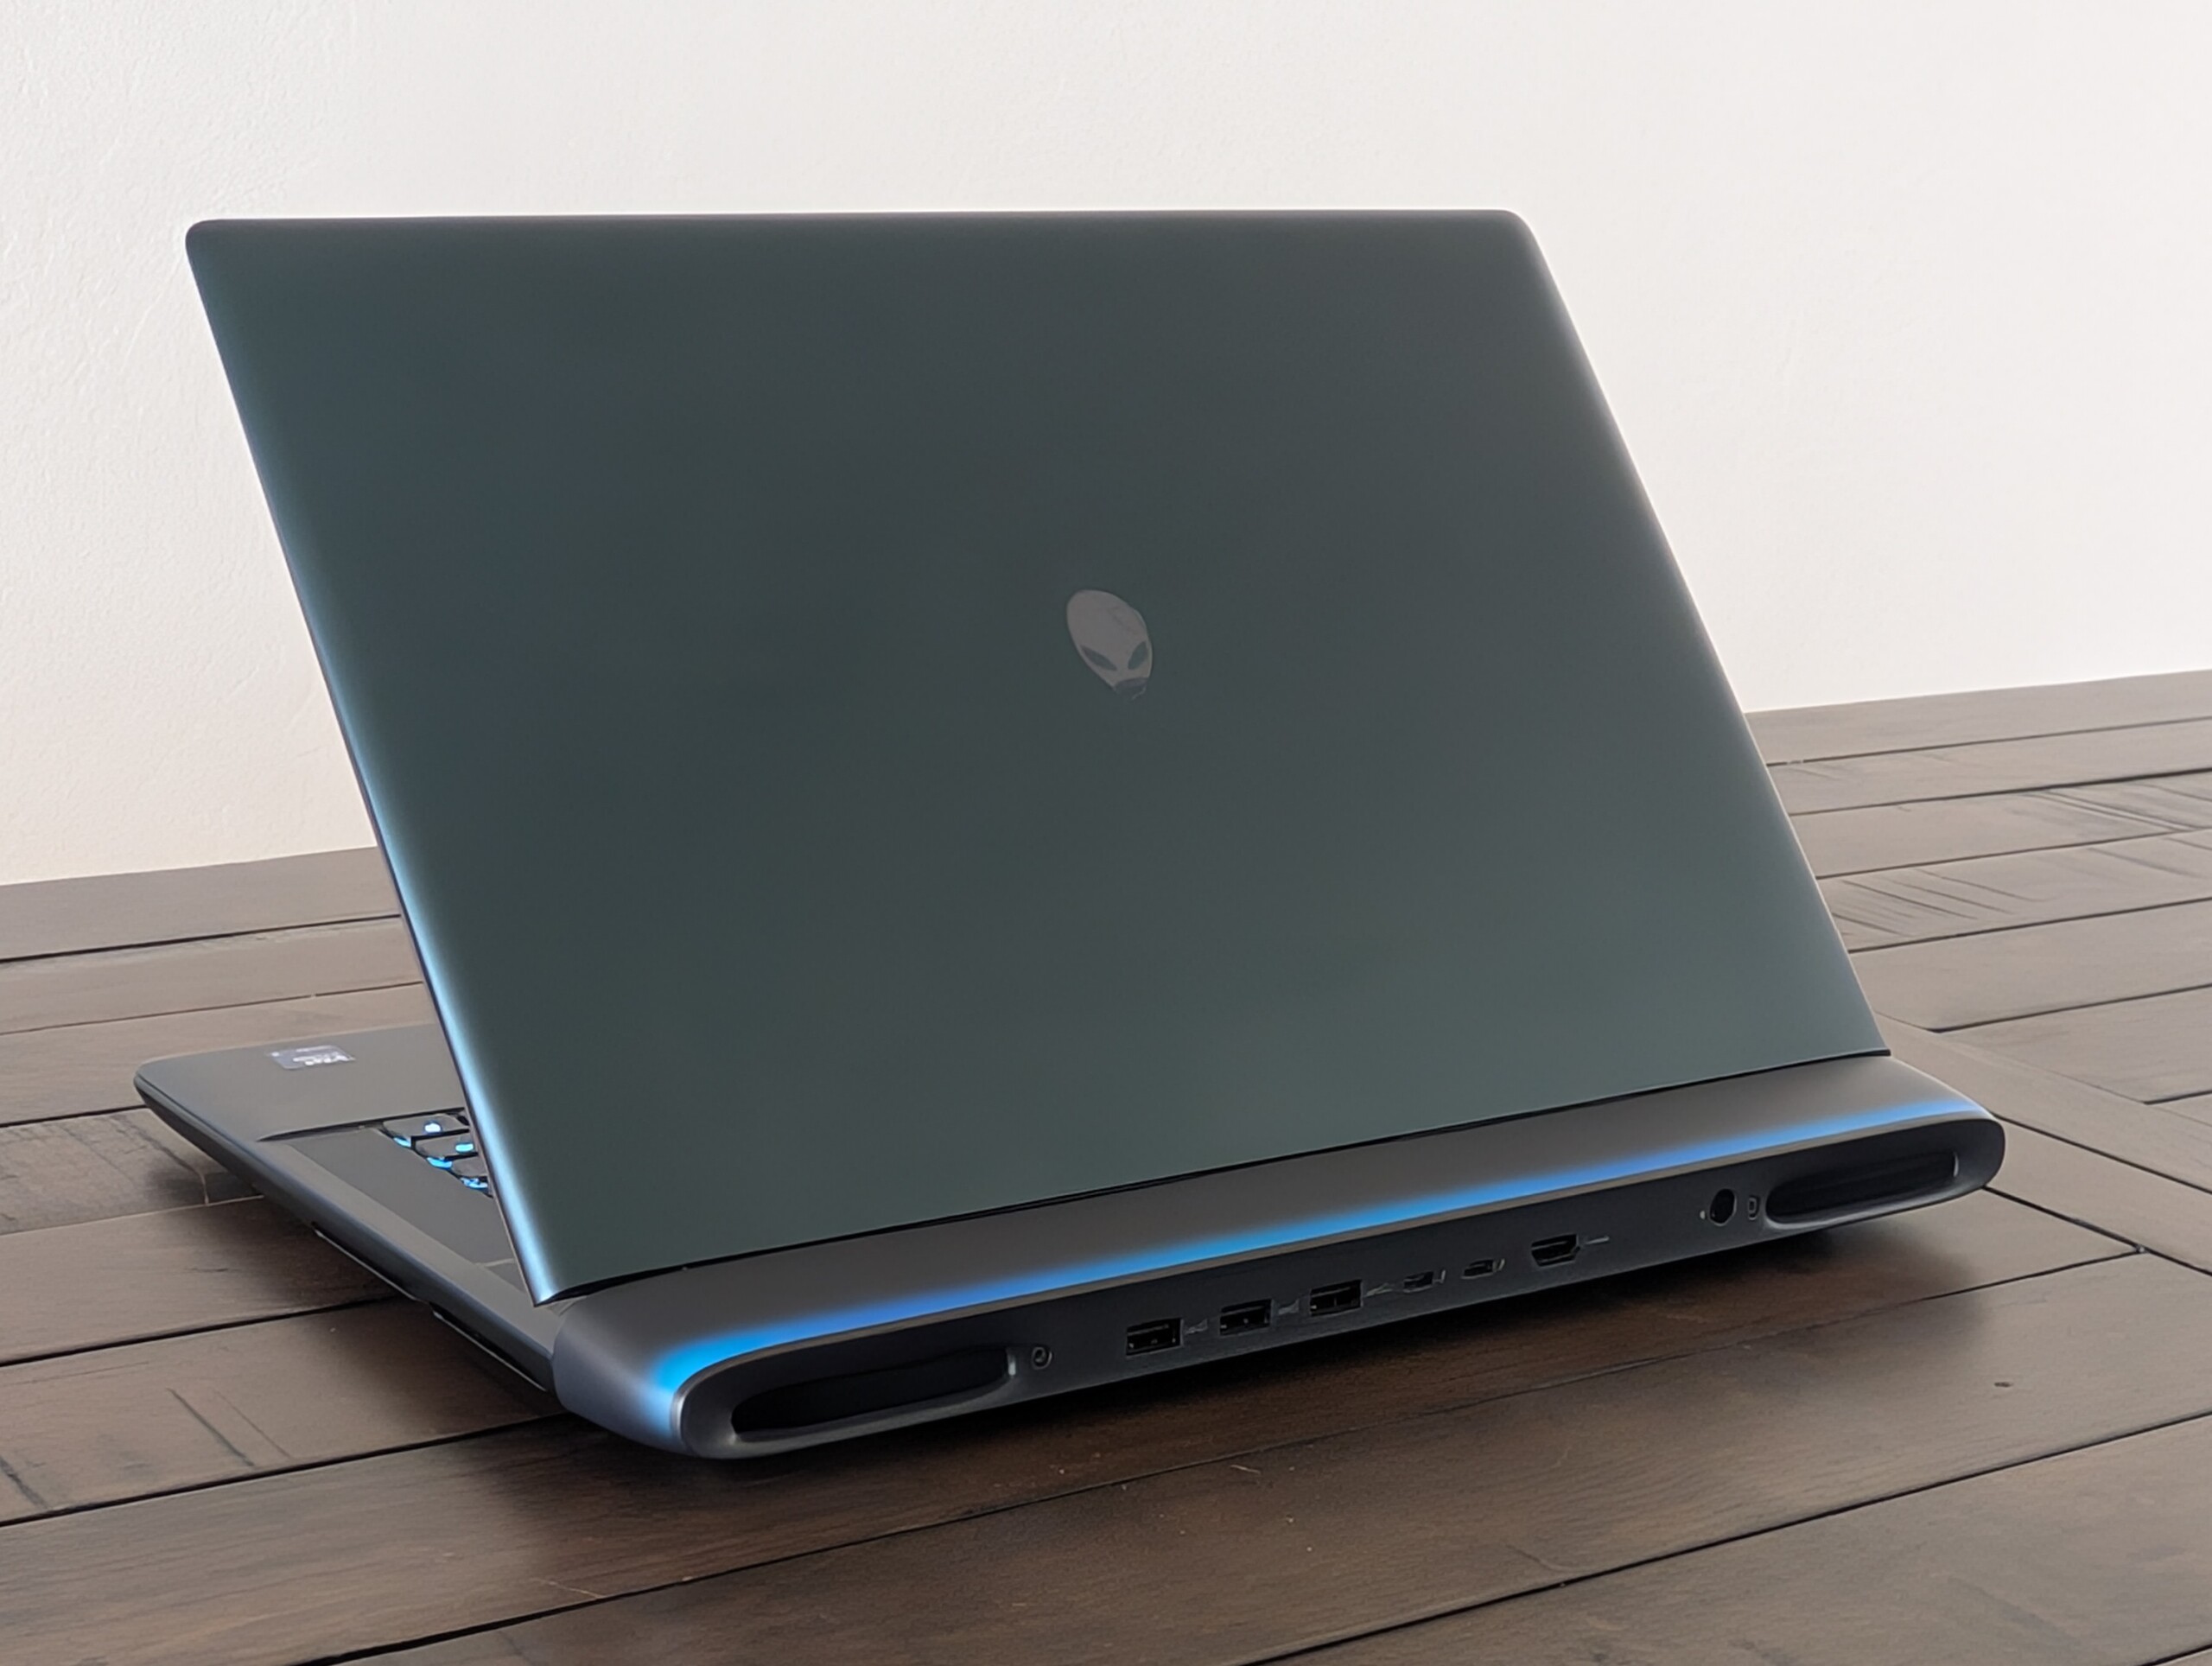
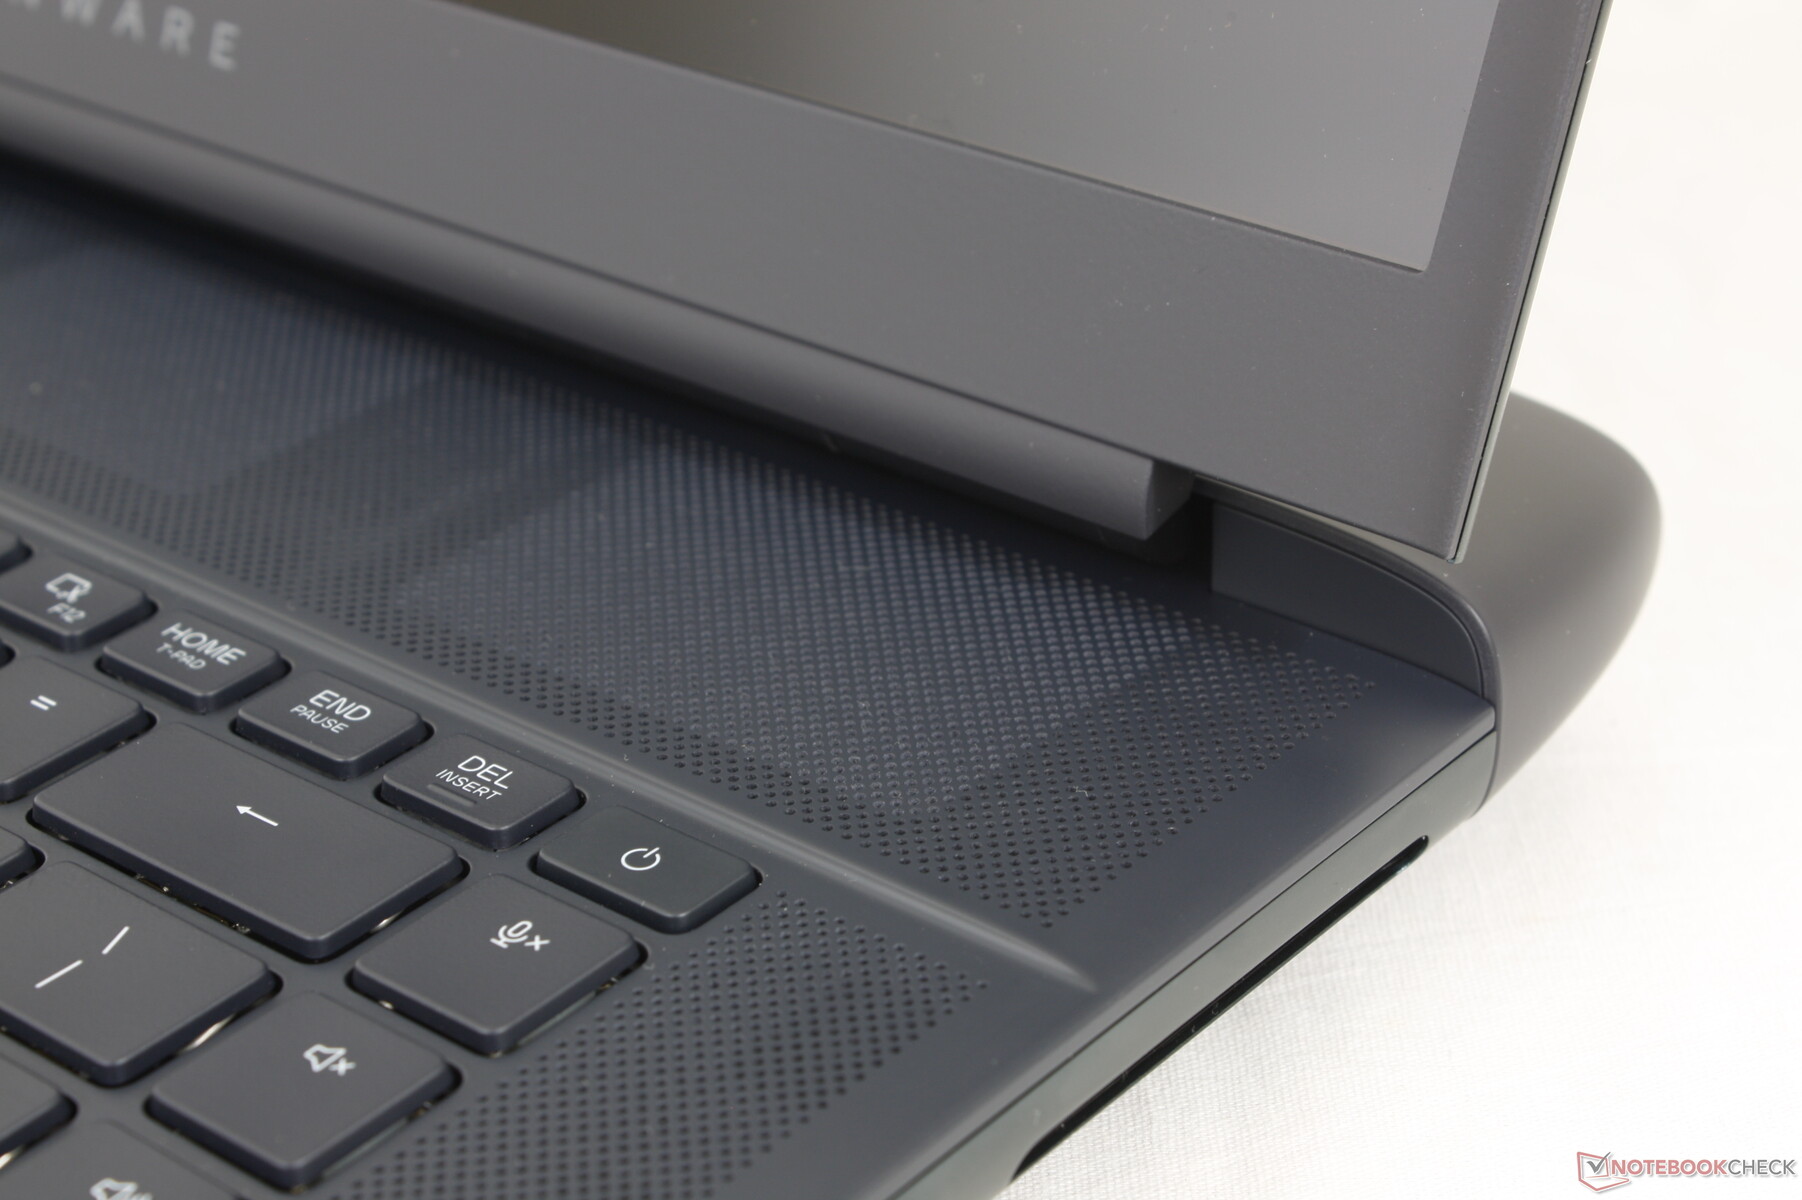
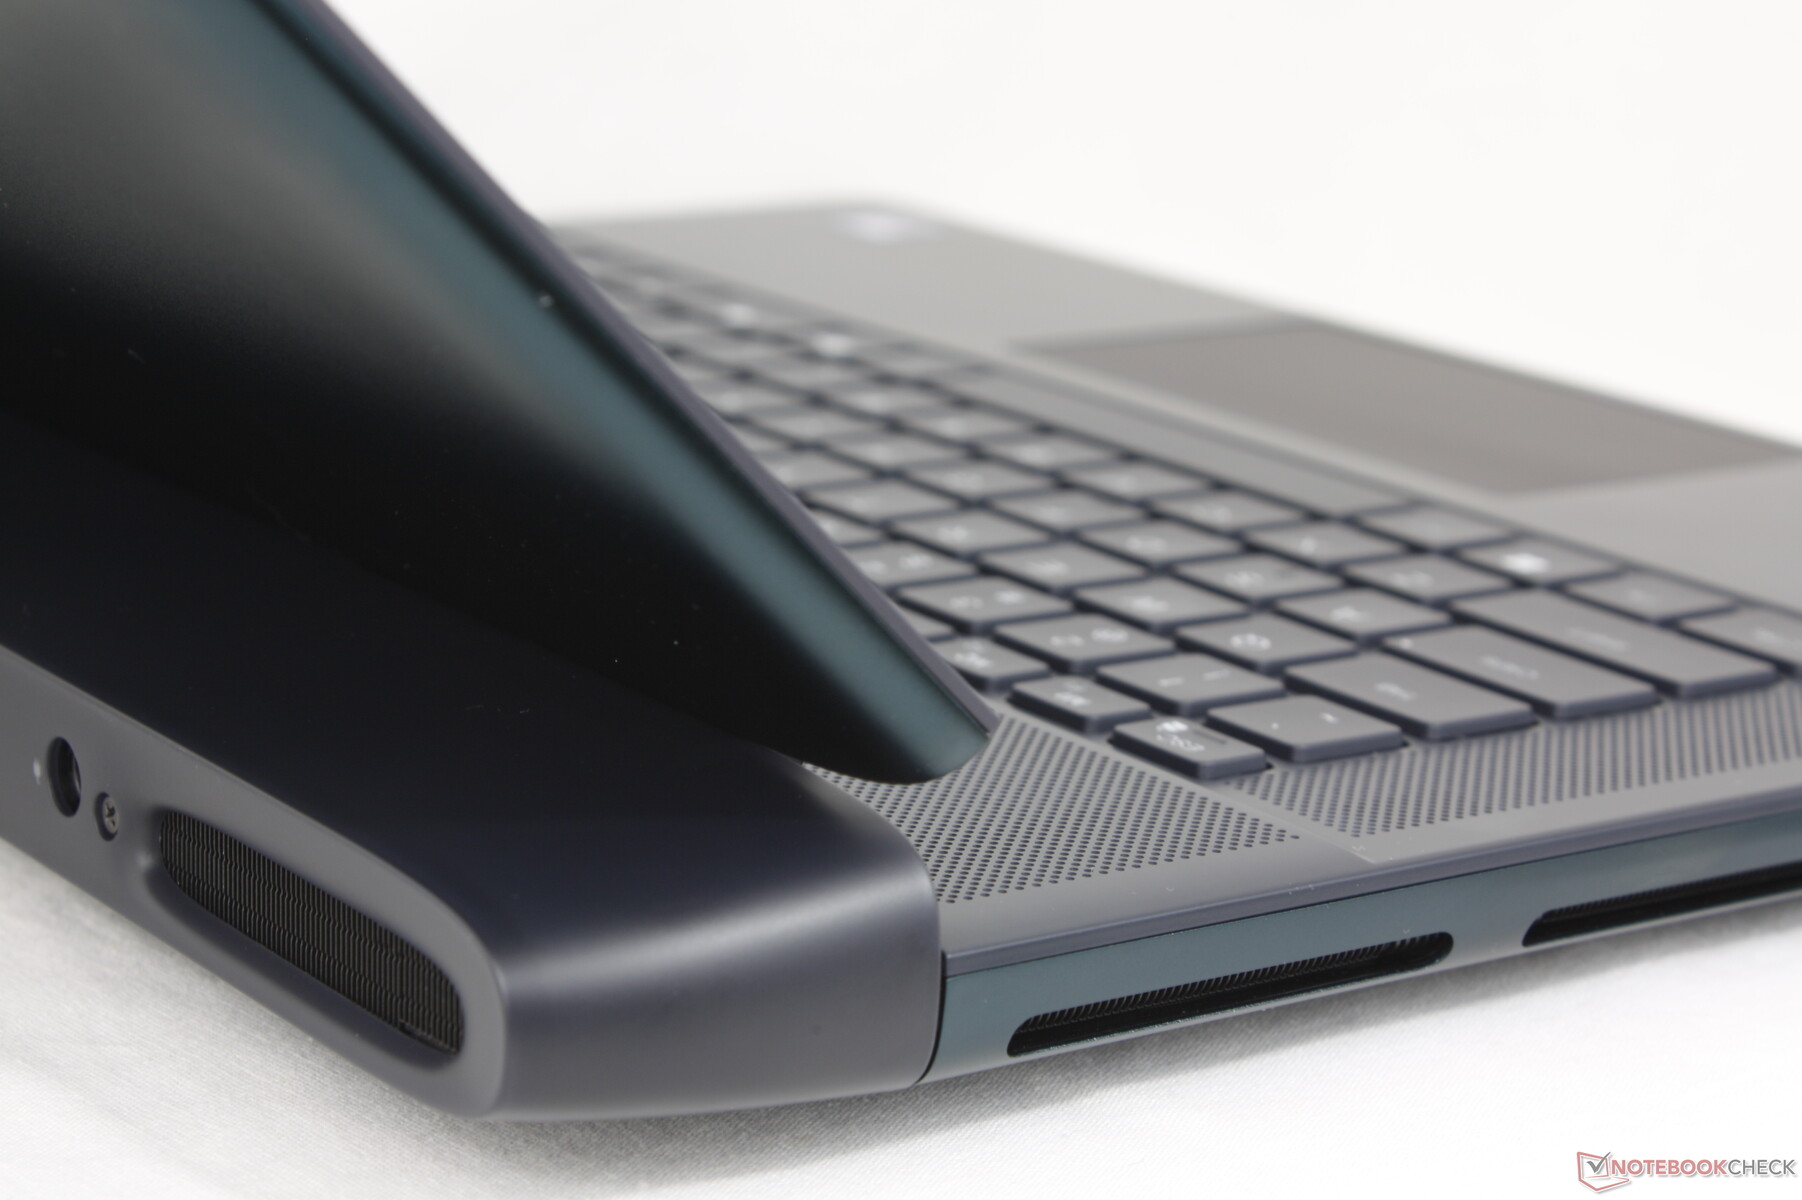
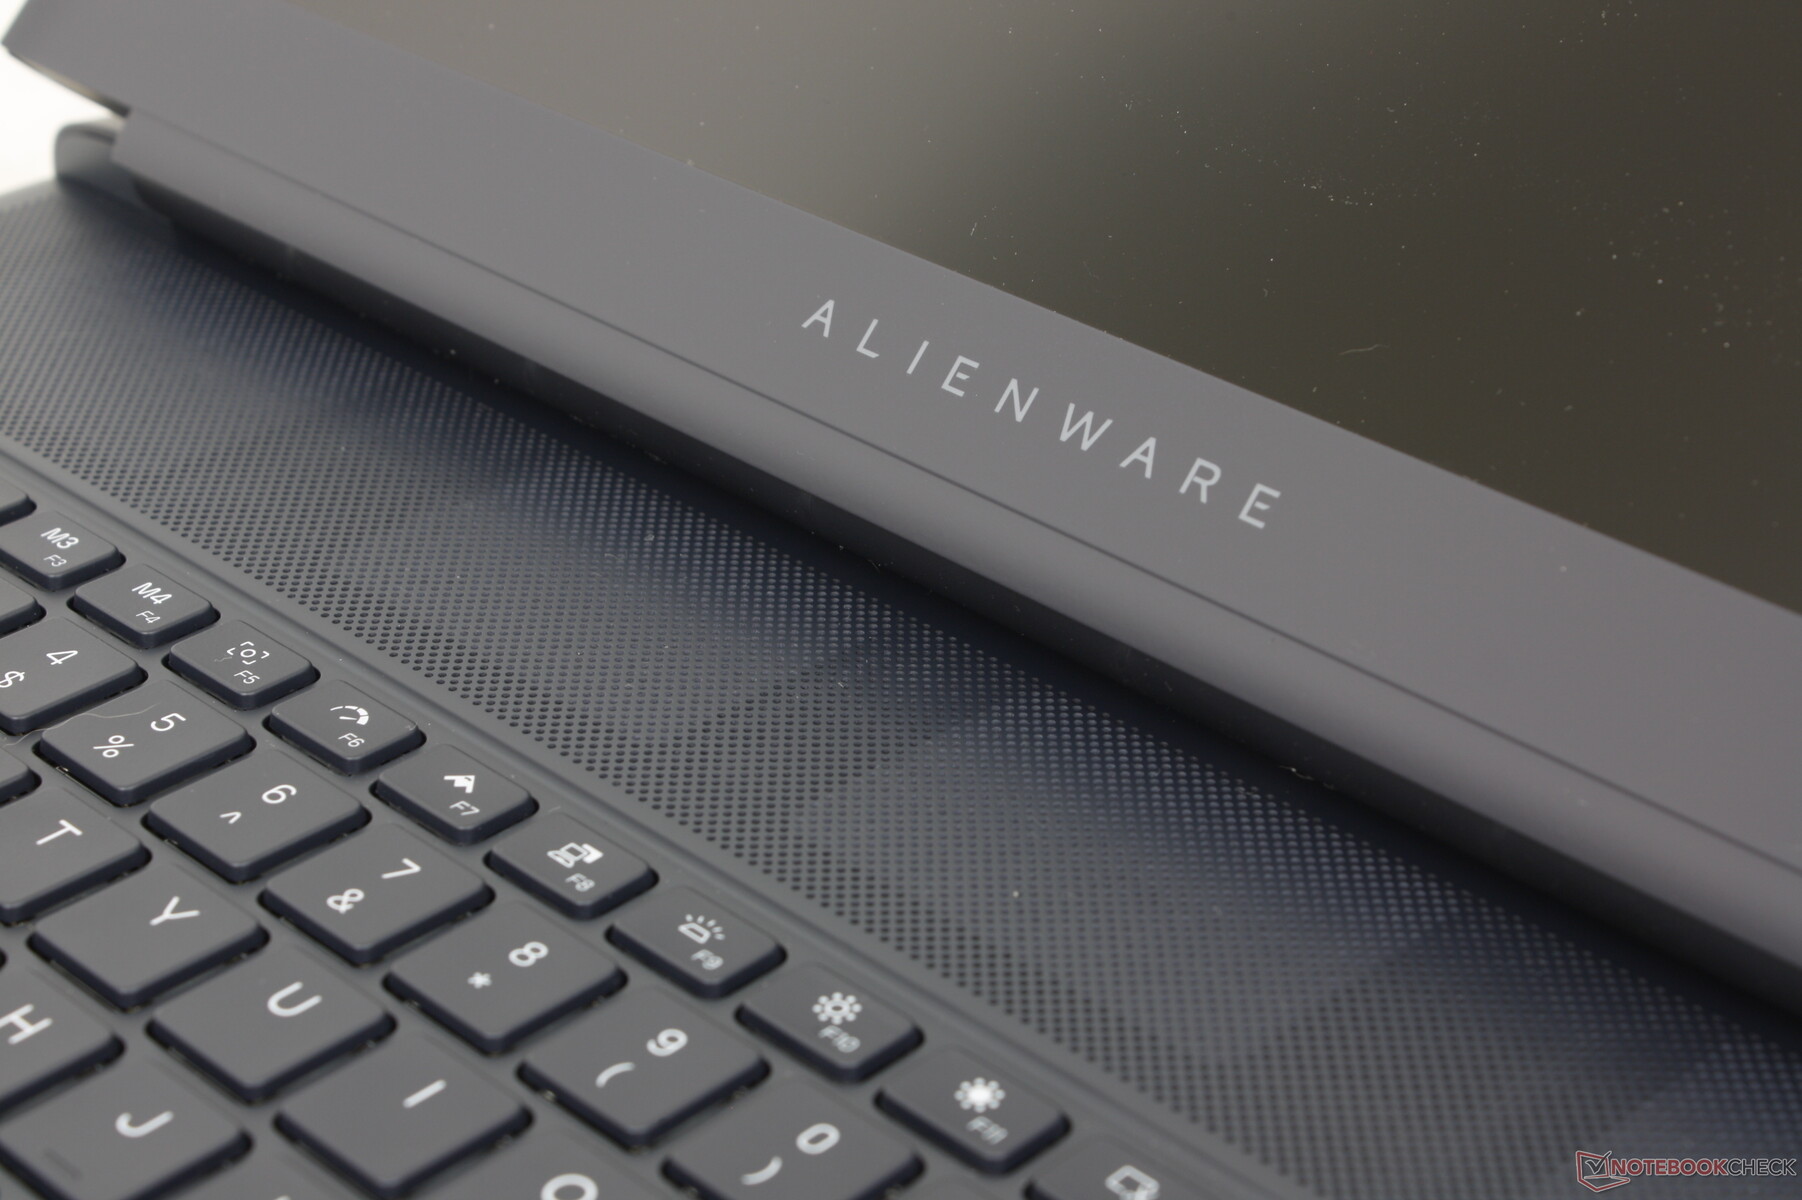
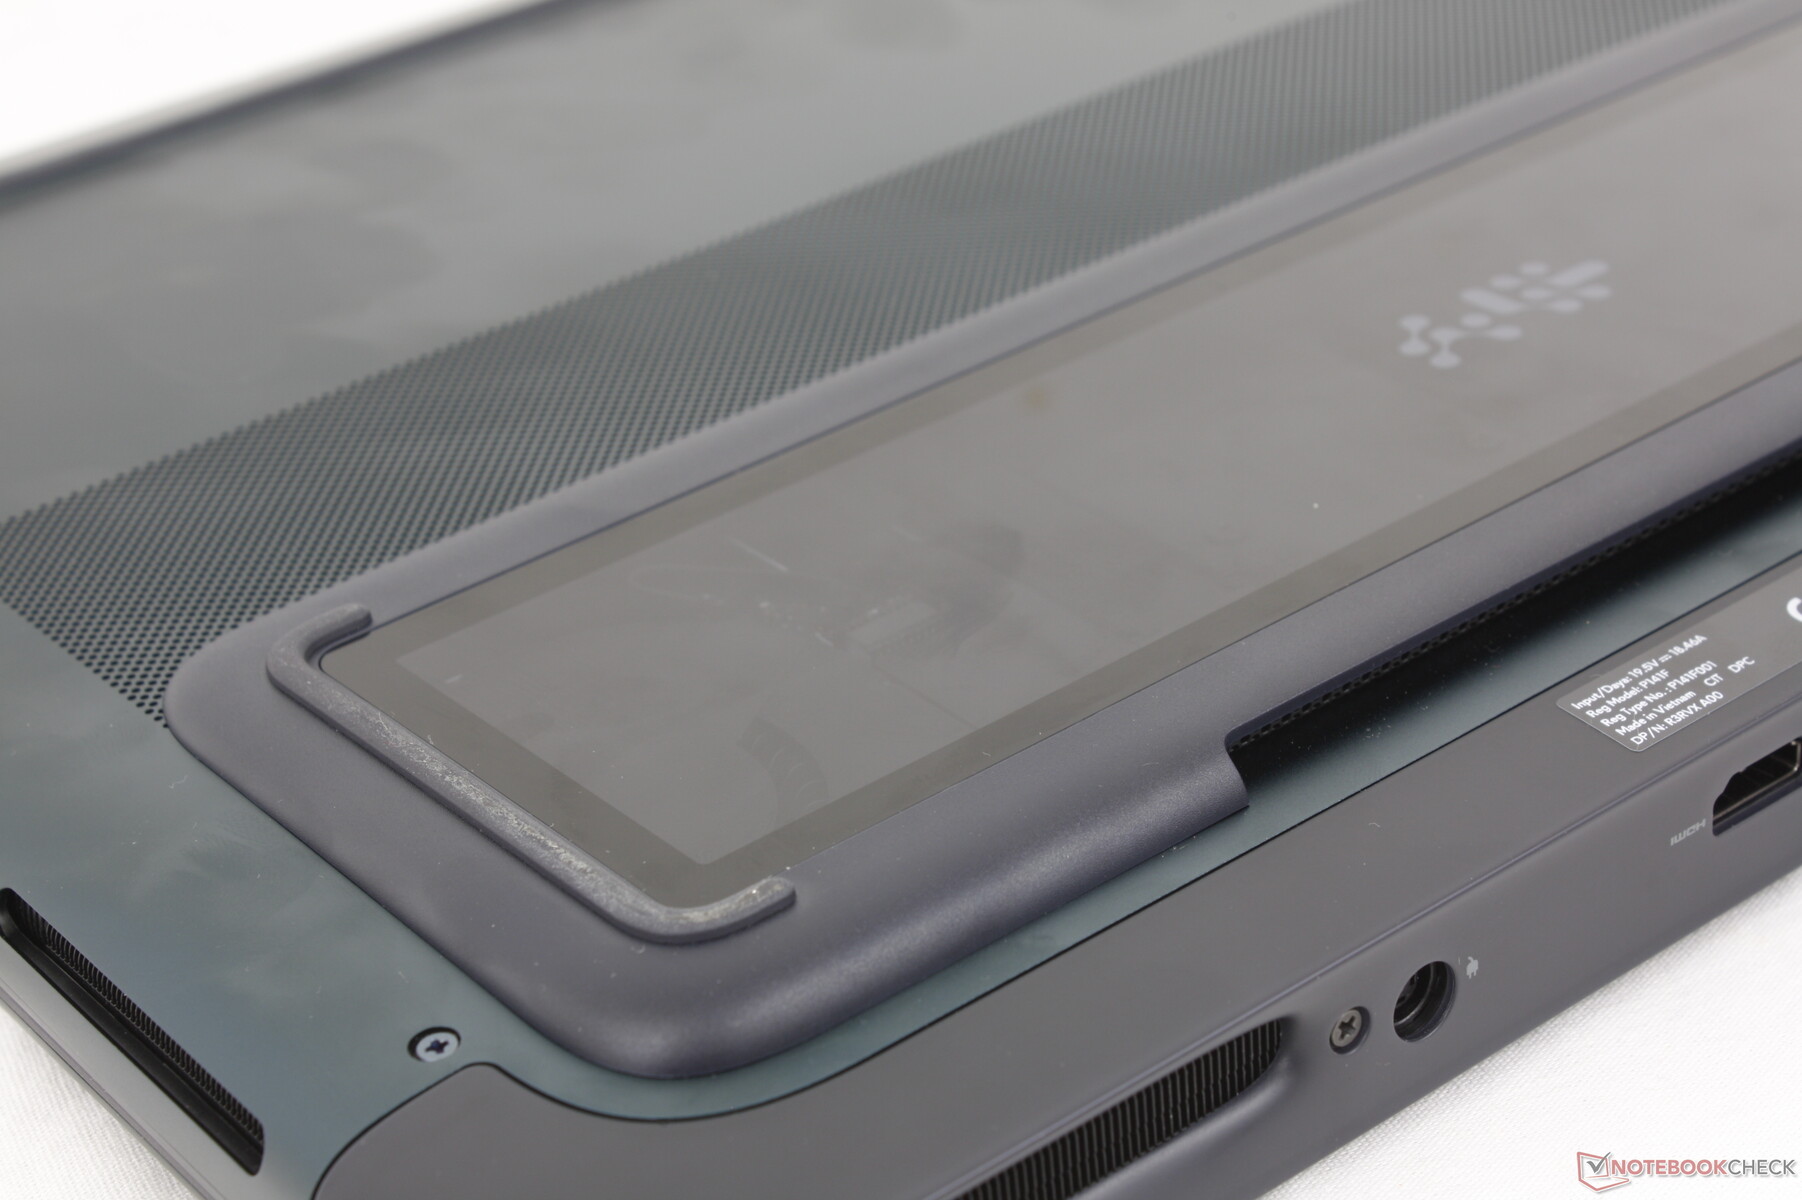
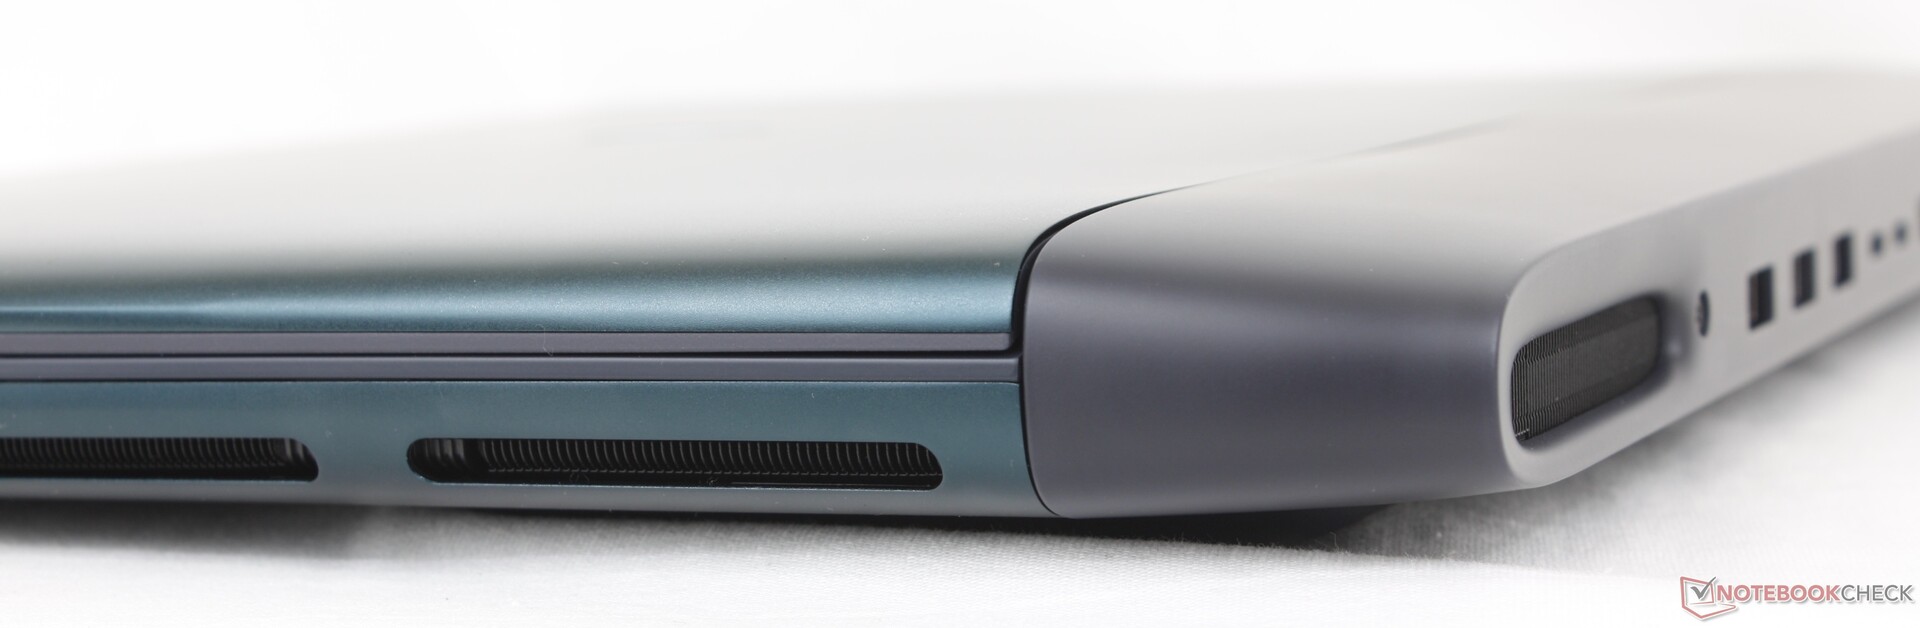
Alienware 放弃了上一代机型的 "Legend 3 "设计语言,转而采用 "Alienware 30 "设计,以庆祝即将到来的 30 周年庆典。新设计在美学和质量上都有所改进,表面更光滑、更 "流畅",锐利的边缘也更少。蜂窝状栅格和后 LED 灯环不见了,取而代之的是更巧妙的隐藏式通风装置和更柔和的 RGB LED 灯条。底部的大猩猩玻璃窗也是一个很好的点缀,在不影响气流的情况下展示了 "冷冻室 "散热解决方案。整个系统给人的感觉就像微星泰坦 18 甚至有过之而无不及。
我们对新设计最大的不满可能是它太容易沾染指纹了。如果能选择更浅或更亮的颜色,可能会更容易掩盖油脂的堆积。
Area-51 重 3.3 千克,比已经很重的 Alienware x16 R2重约 600 克,是市场上最重的 16 英寸游戏笔记本电脑之一。如果你希望外出旅行,那么几乎所有其他 16 英寸笔记本电脑都会比新款 Alienware 更轻薄。
连接性
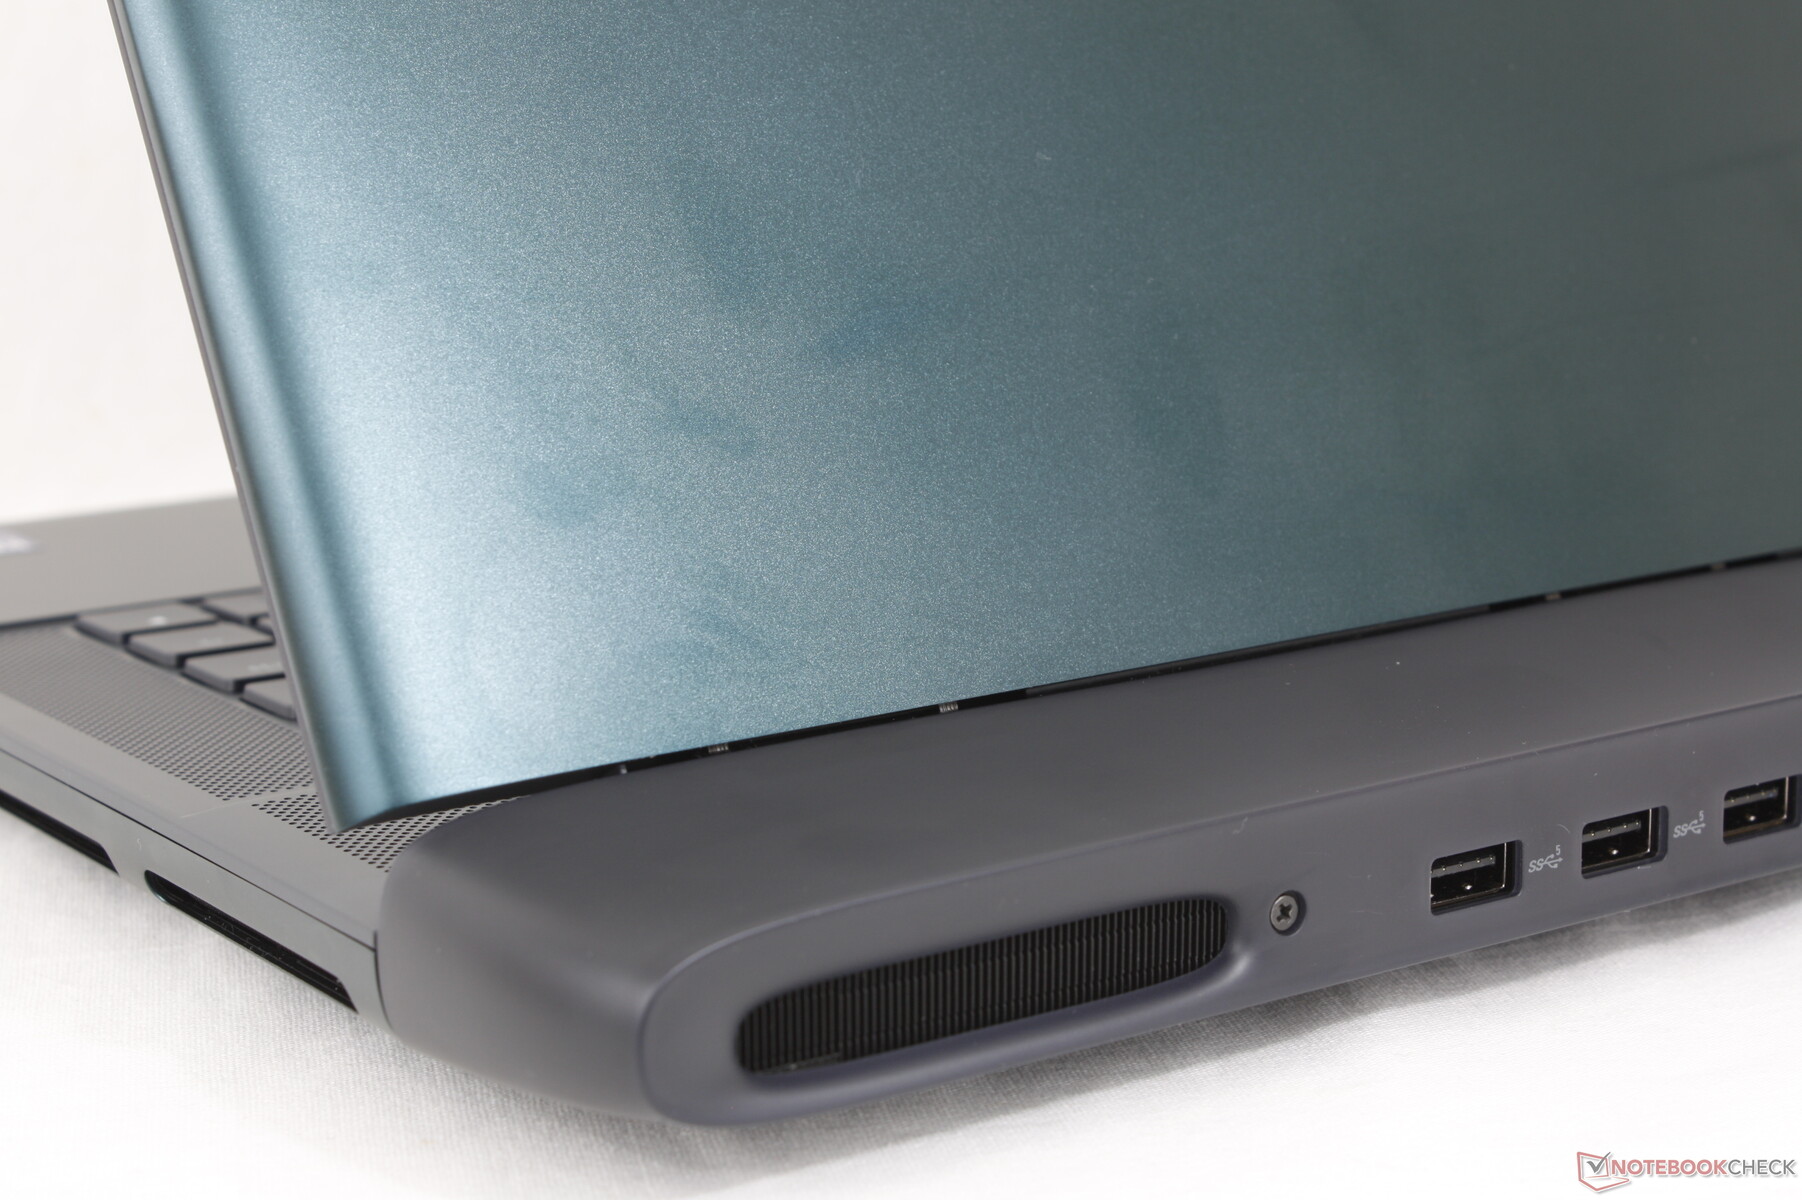
该机型缺少 RJ-45 接口,也放弃了去年 x16 R2 上的迷你 DisplayPort 选项。作为补偿,两个 Thunderbolt 4 端口已升级到 Thunderbolt 5,以支持双 8K60 外接显示器。
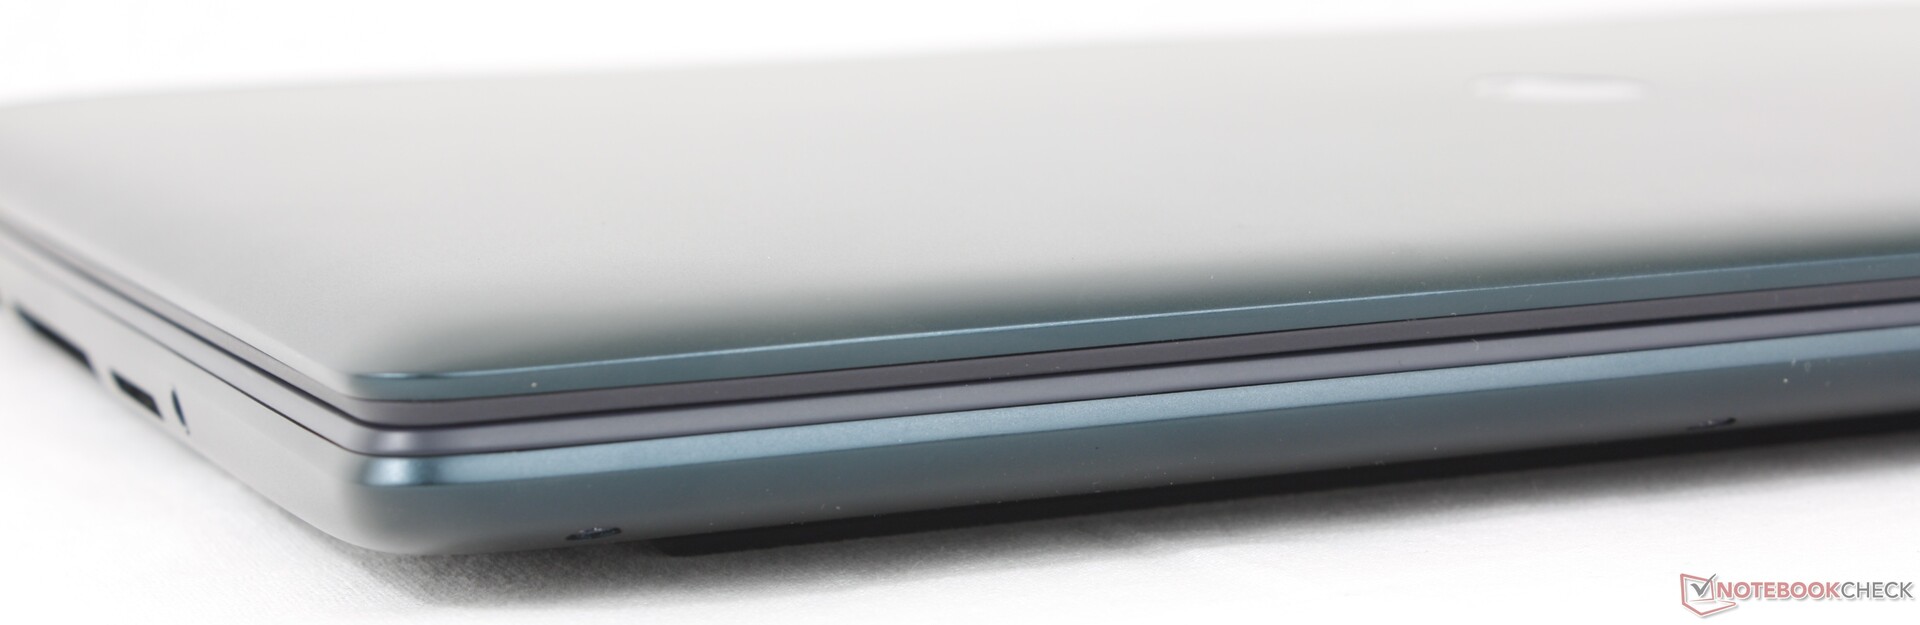
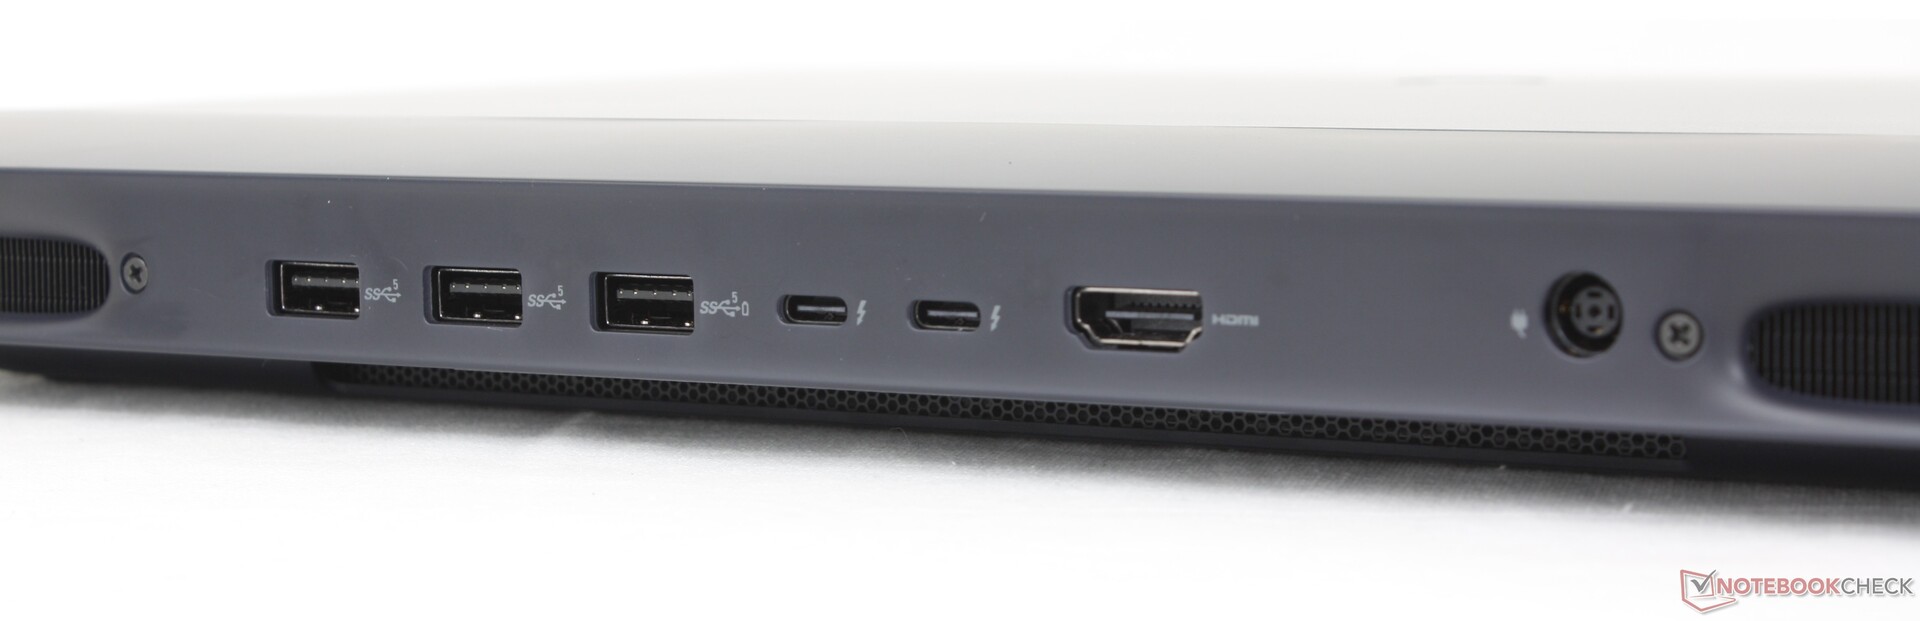
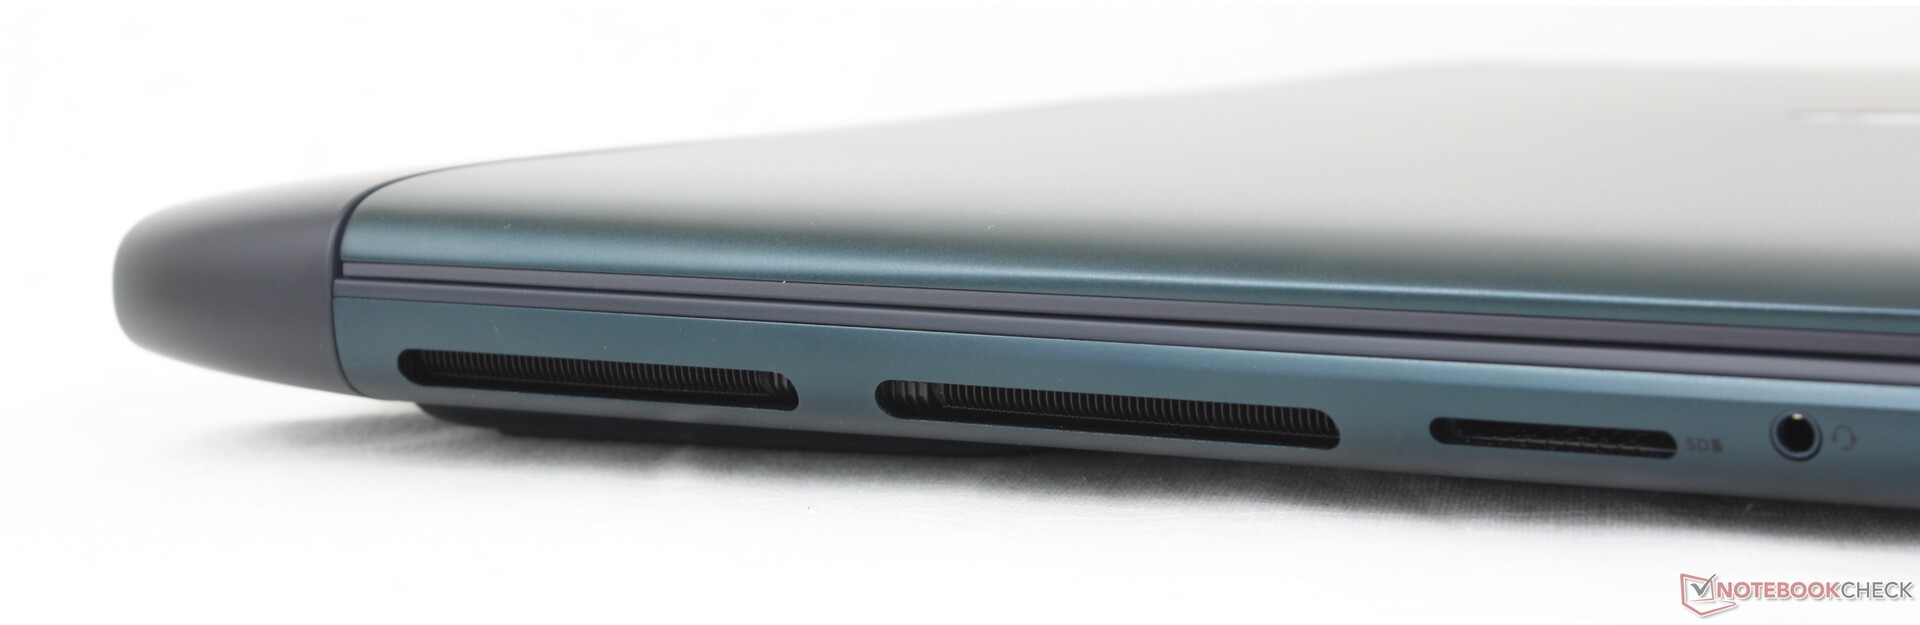
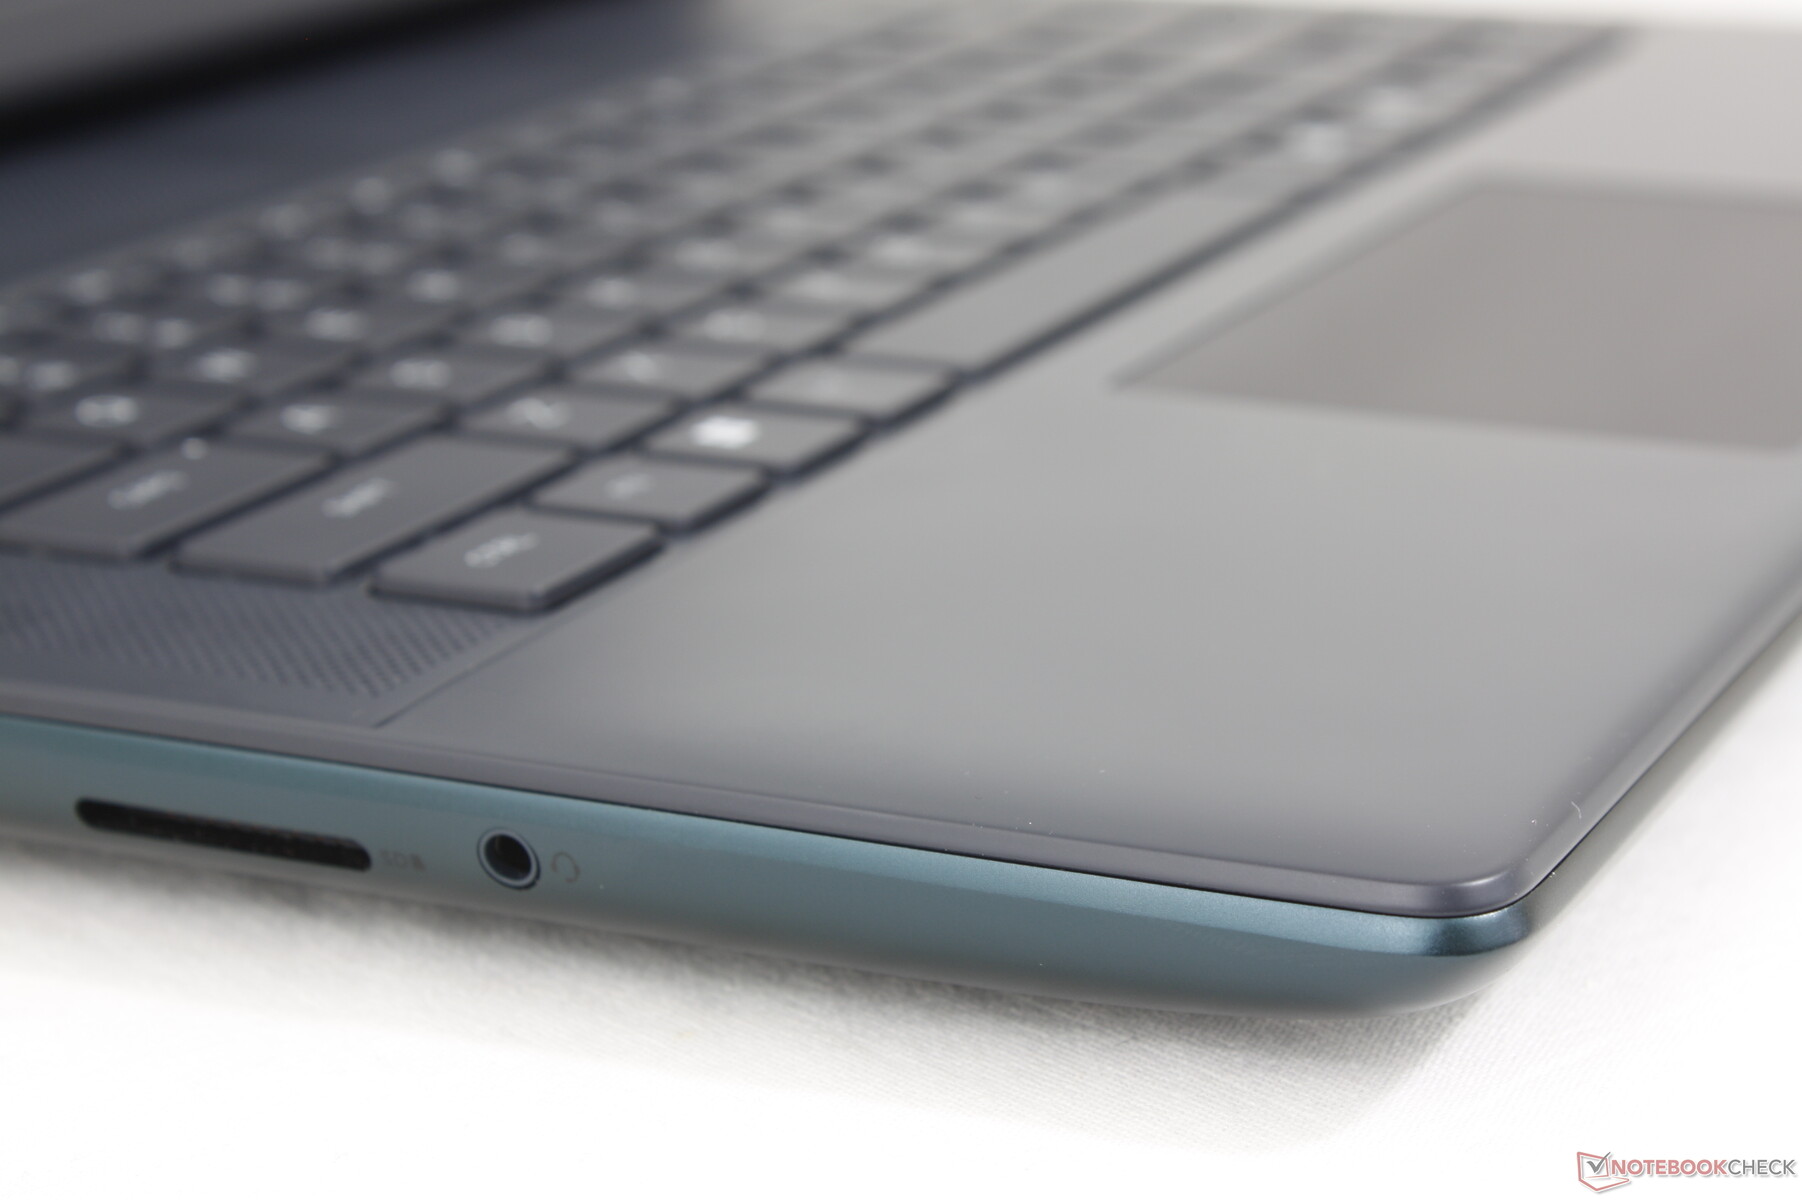
SD 读卡器
值得庆幸的是,戴尔在今年重新设计的 Area-51 上将 x16 R2 上的 MicroSD 读卡器升级为全尺寸读卡器。
| SD Card Reader | |
| average JPG Copy Test (av. of 3 runs) | |
| MSI Vector A18 HX A9W (Toshiba Exceria Pro SDXC 64 GB UHS-II) | |
| Razer Blade 16 RTX 5080 (Toshiba Exceria Pro SDXC 64 GB UHS-II) | |
| Alienware 16 Area-51 (Toshiba Exceria Pro SDXC 64 GB UHS-II) | |
| Alienware x16 R2 P120F (AV PRO microSD 128 GB V60) | |
| maximum AS SSD Seq Read Test (1GB) | |
| Alienware x16 R2 P120F (AV PRO microSD 128 GB V60) | |
| MSI Vector A18 HX A9W (Toshiba Exceria Pro SDXC 64 GB UHS-II) | |
| Alienware 16 Area-51 (Toshiba Exceria Pro SDXC 64 GB UHS-II) | |
| Razer Blade 16 RTX 5080 (Toshiba Exceria Pro SDXC 64 GB UHS-II) | |
交流
英特尔杀手 BE1750W 标配 Wi-Fi 7 和蓝牙 5.4 连接功能。
网络摄像头
用户可以配置 200 万像素或 800 万像素网络摄像头。标配红外摄像头,但没有任何隐私快门。


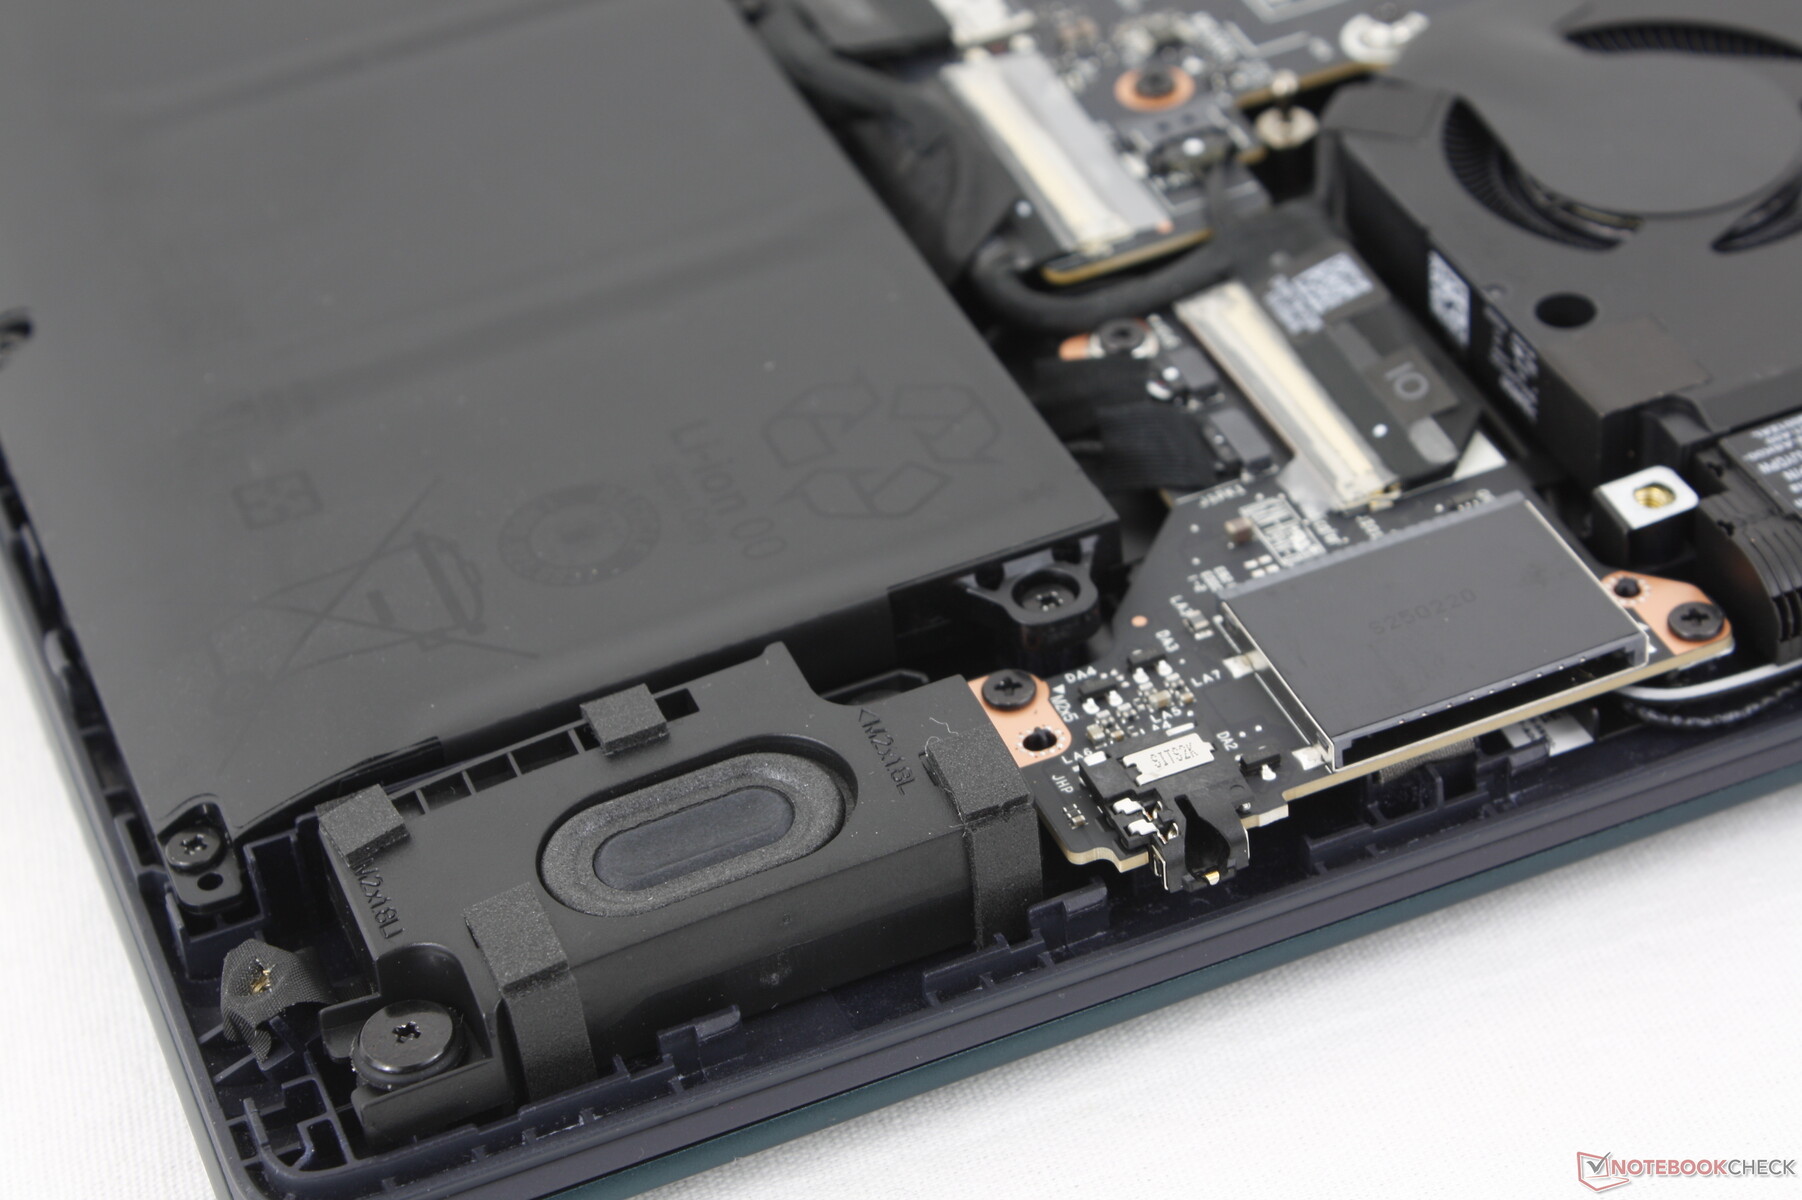
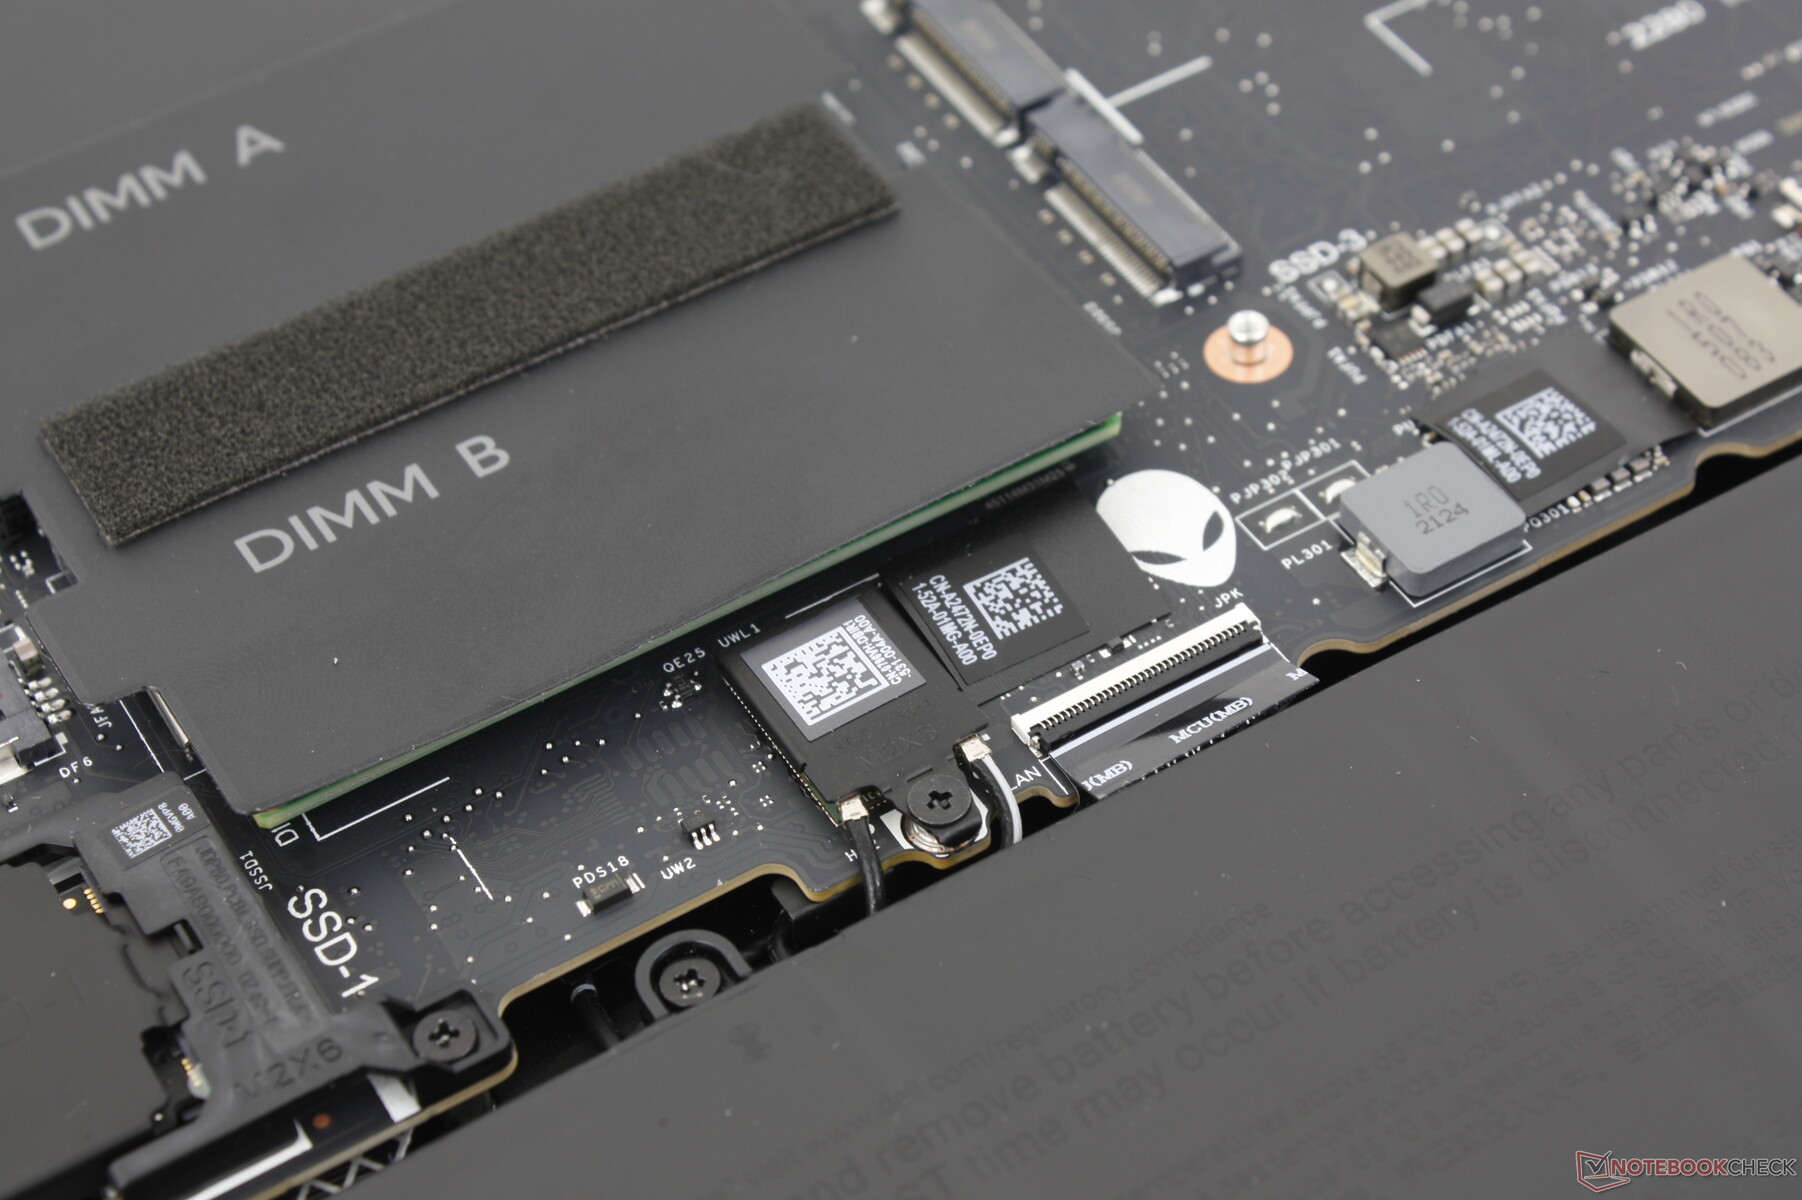
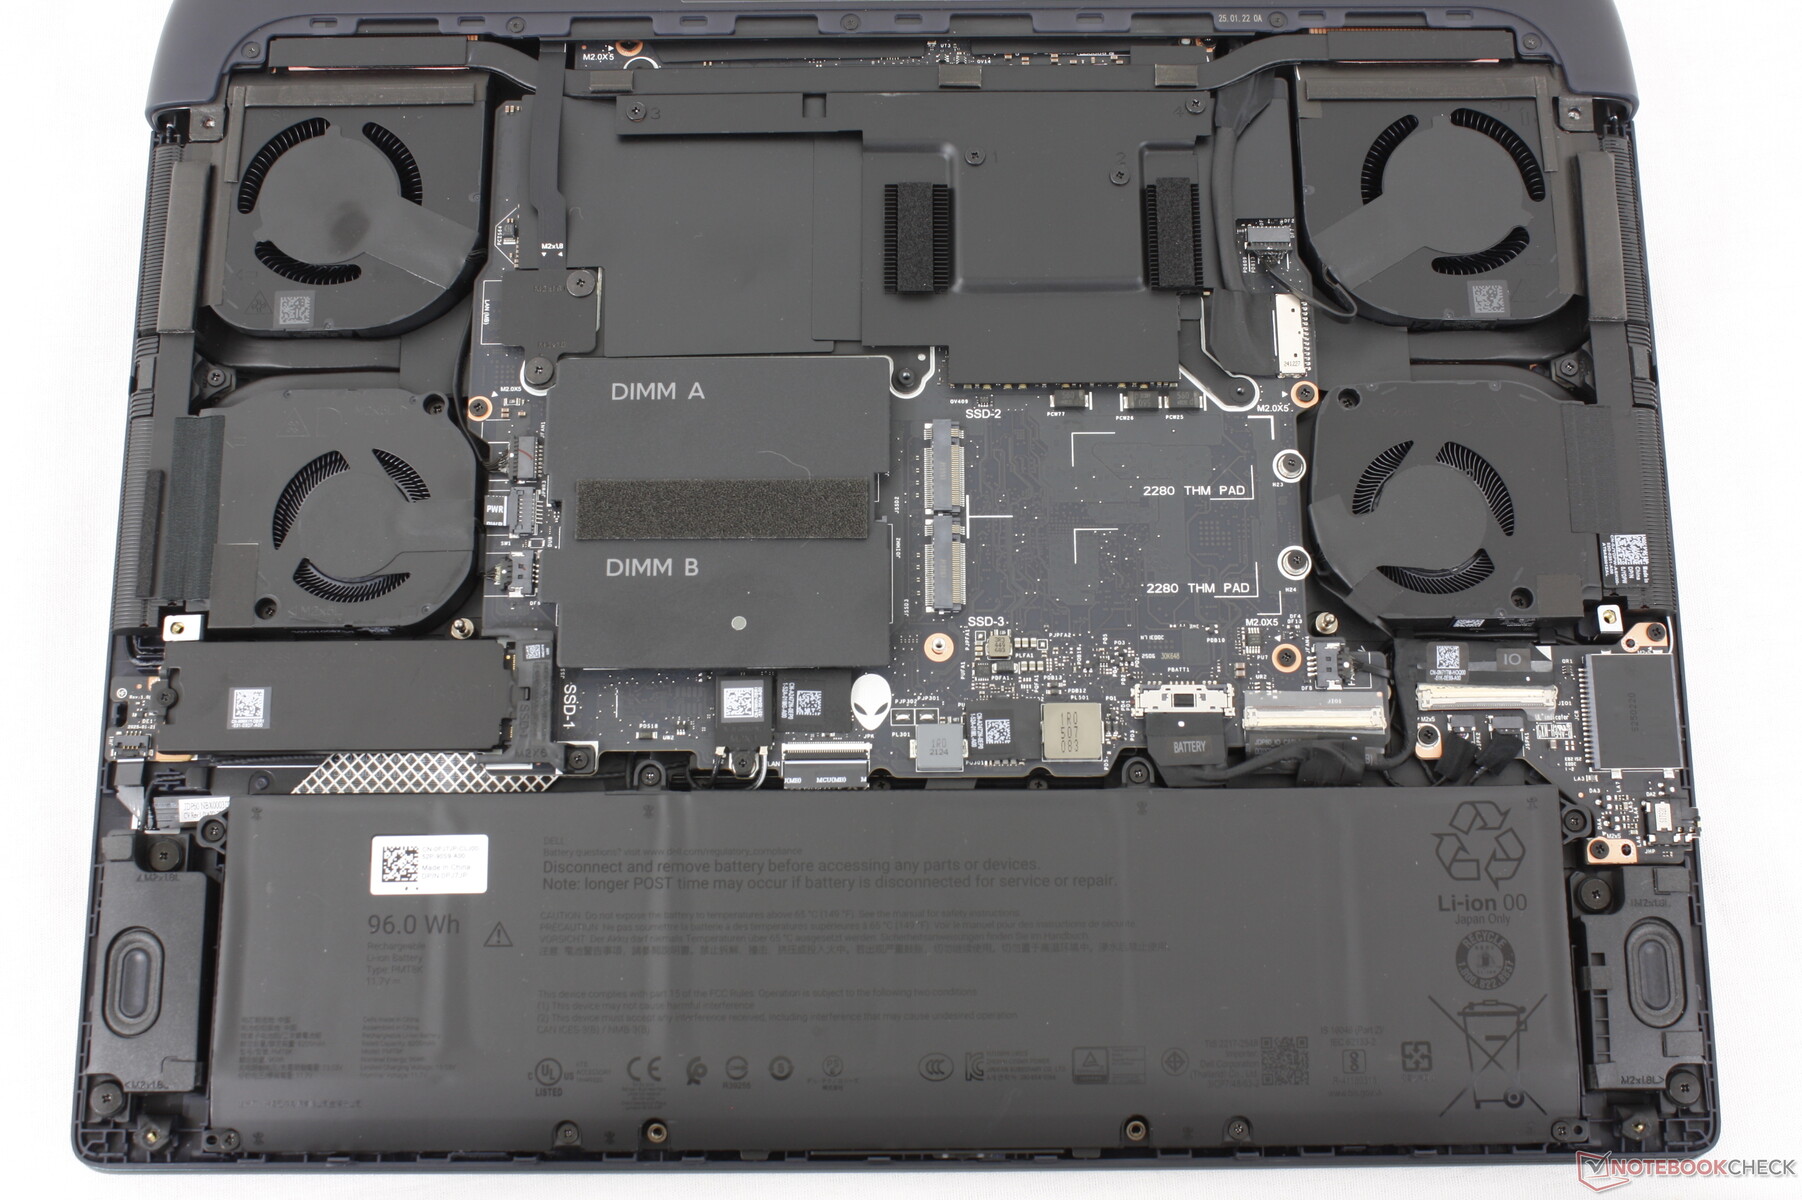
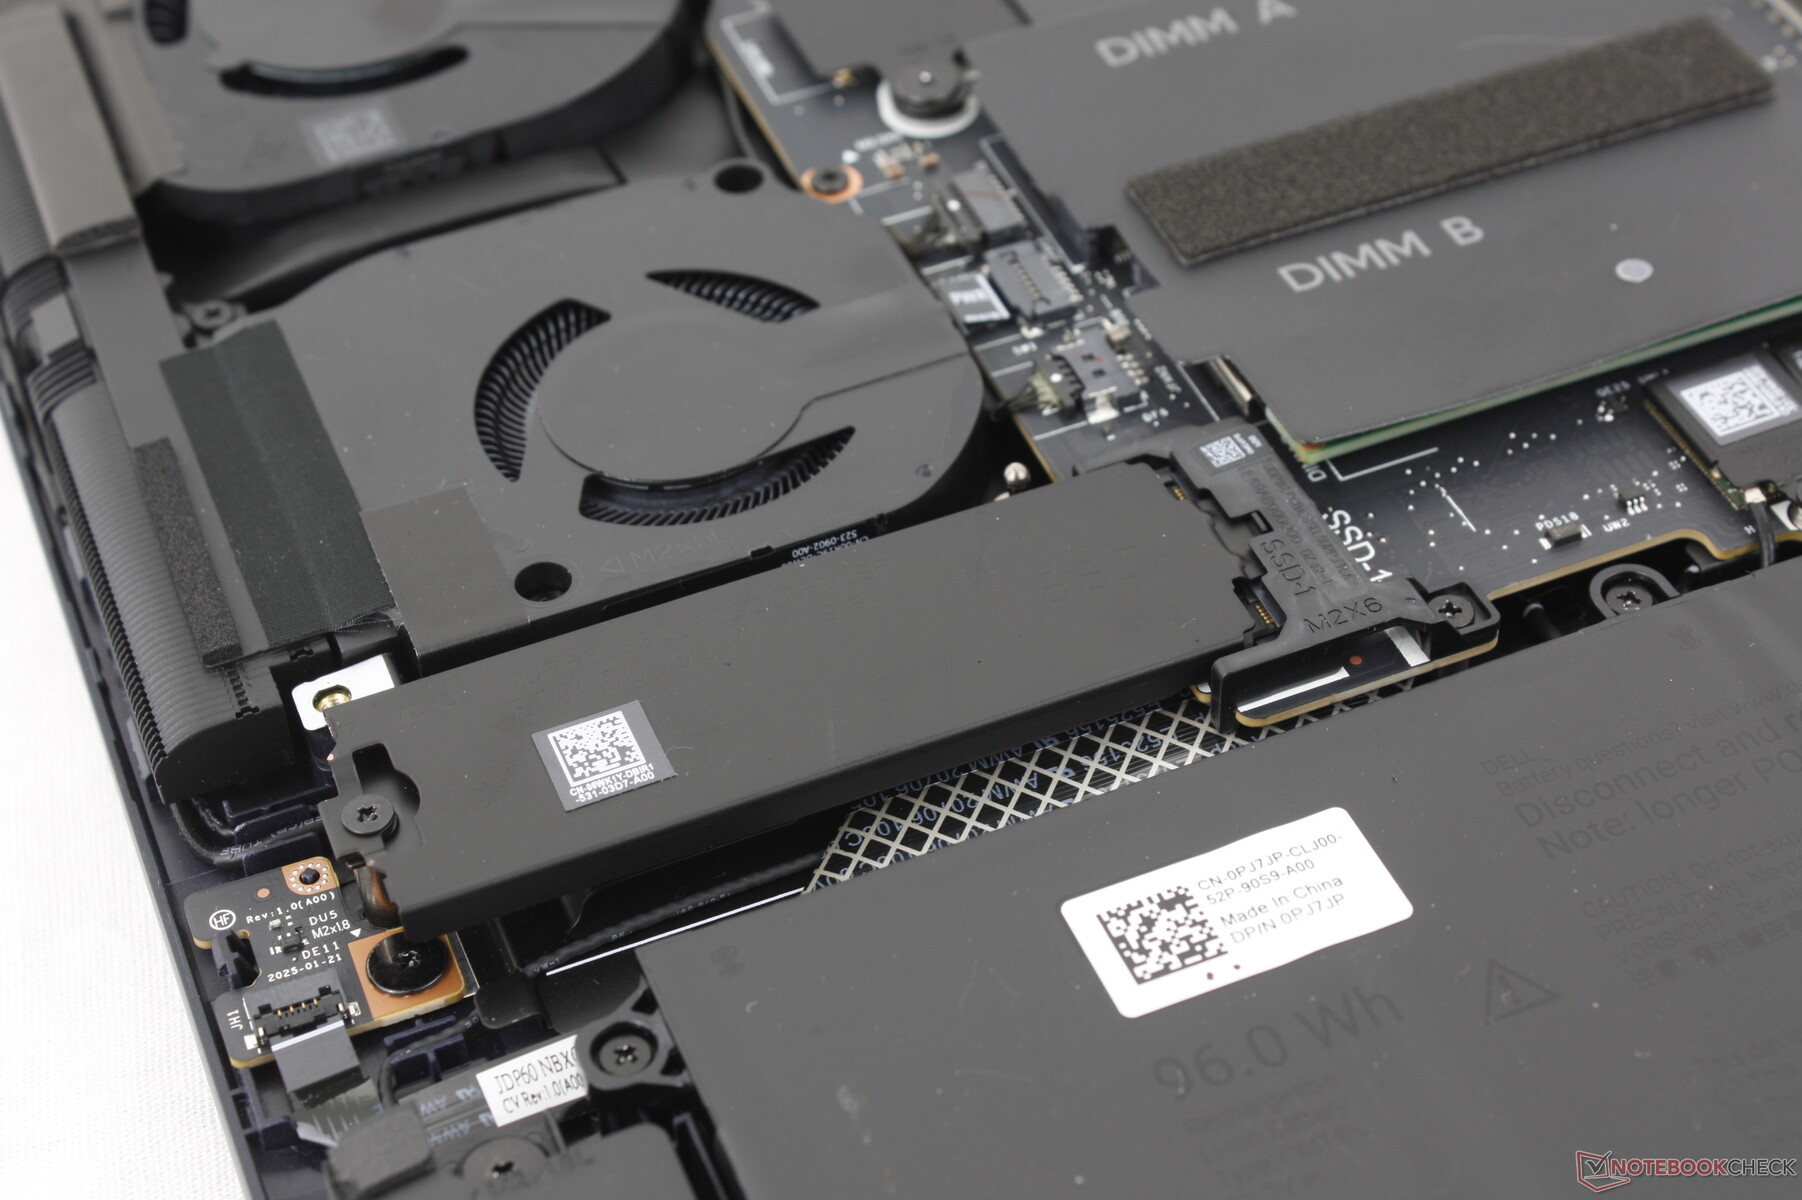
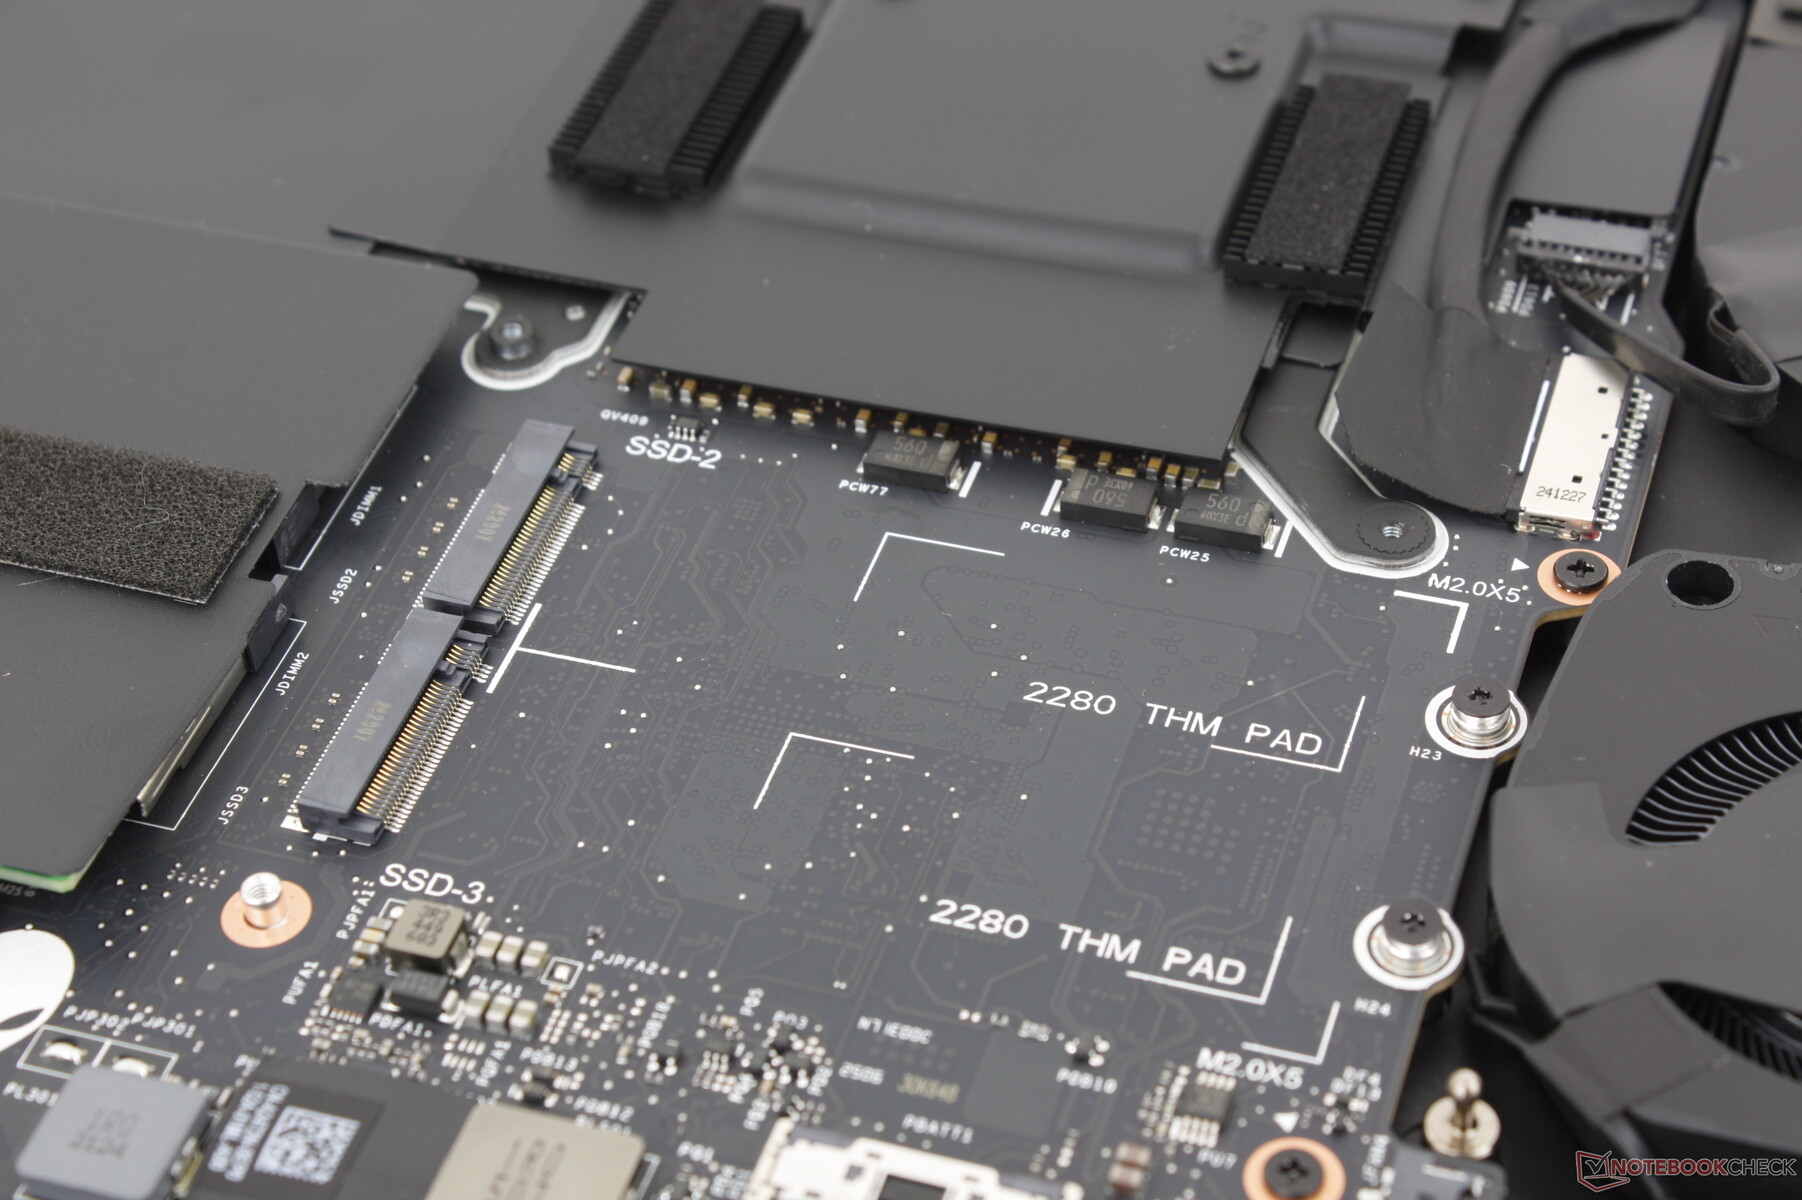
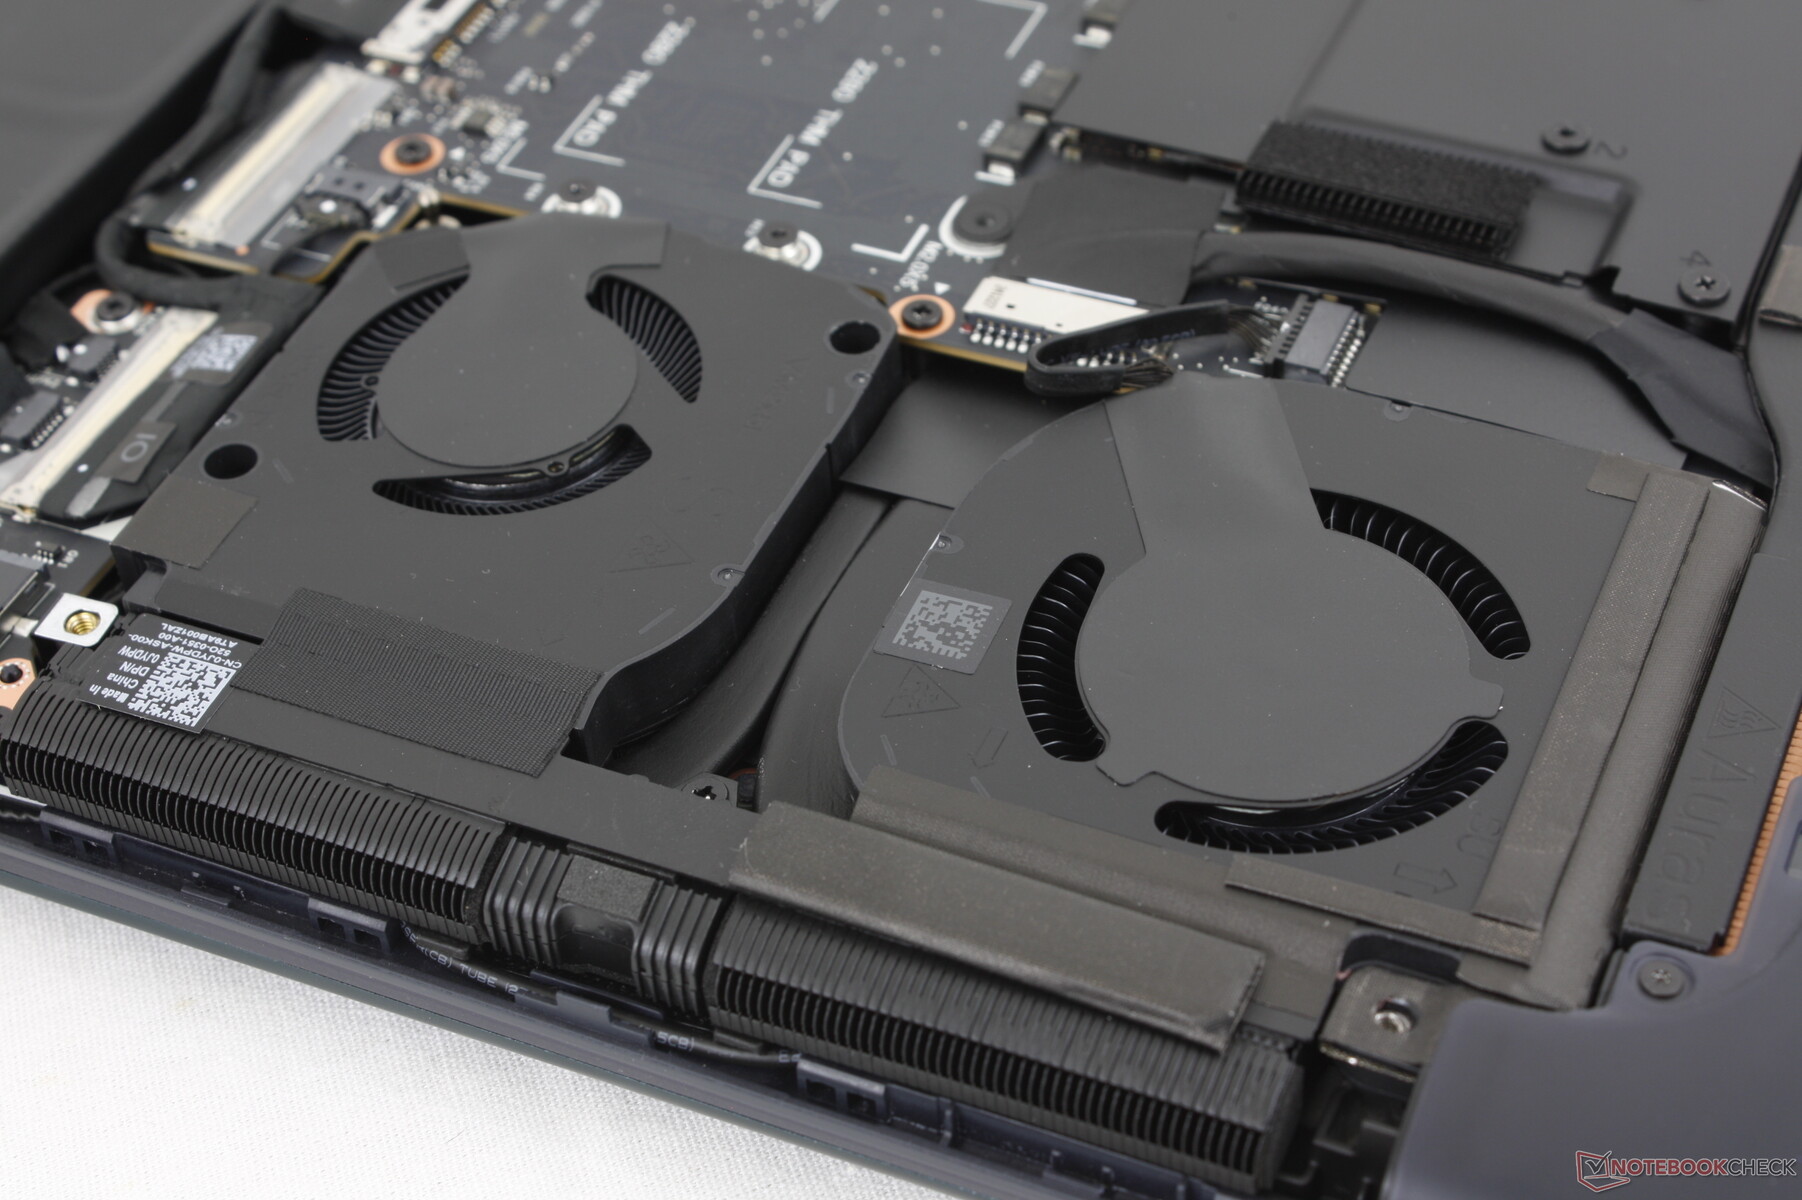
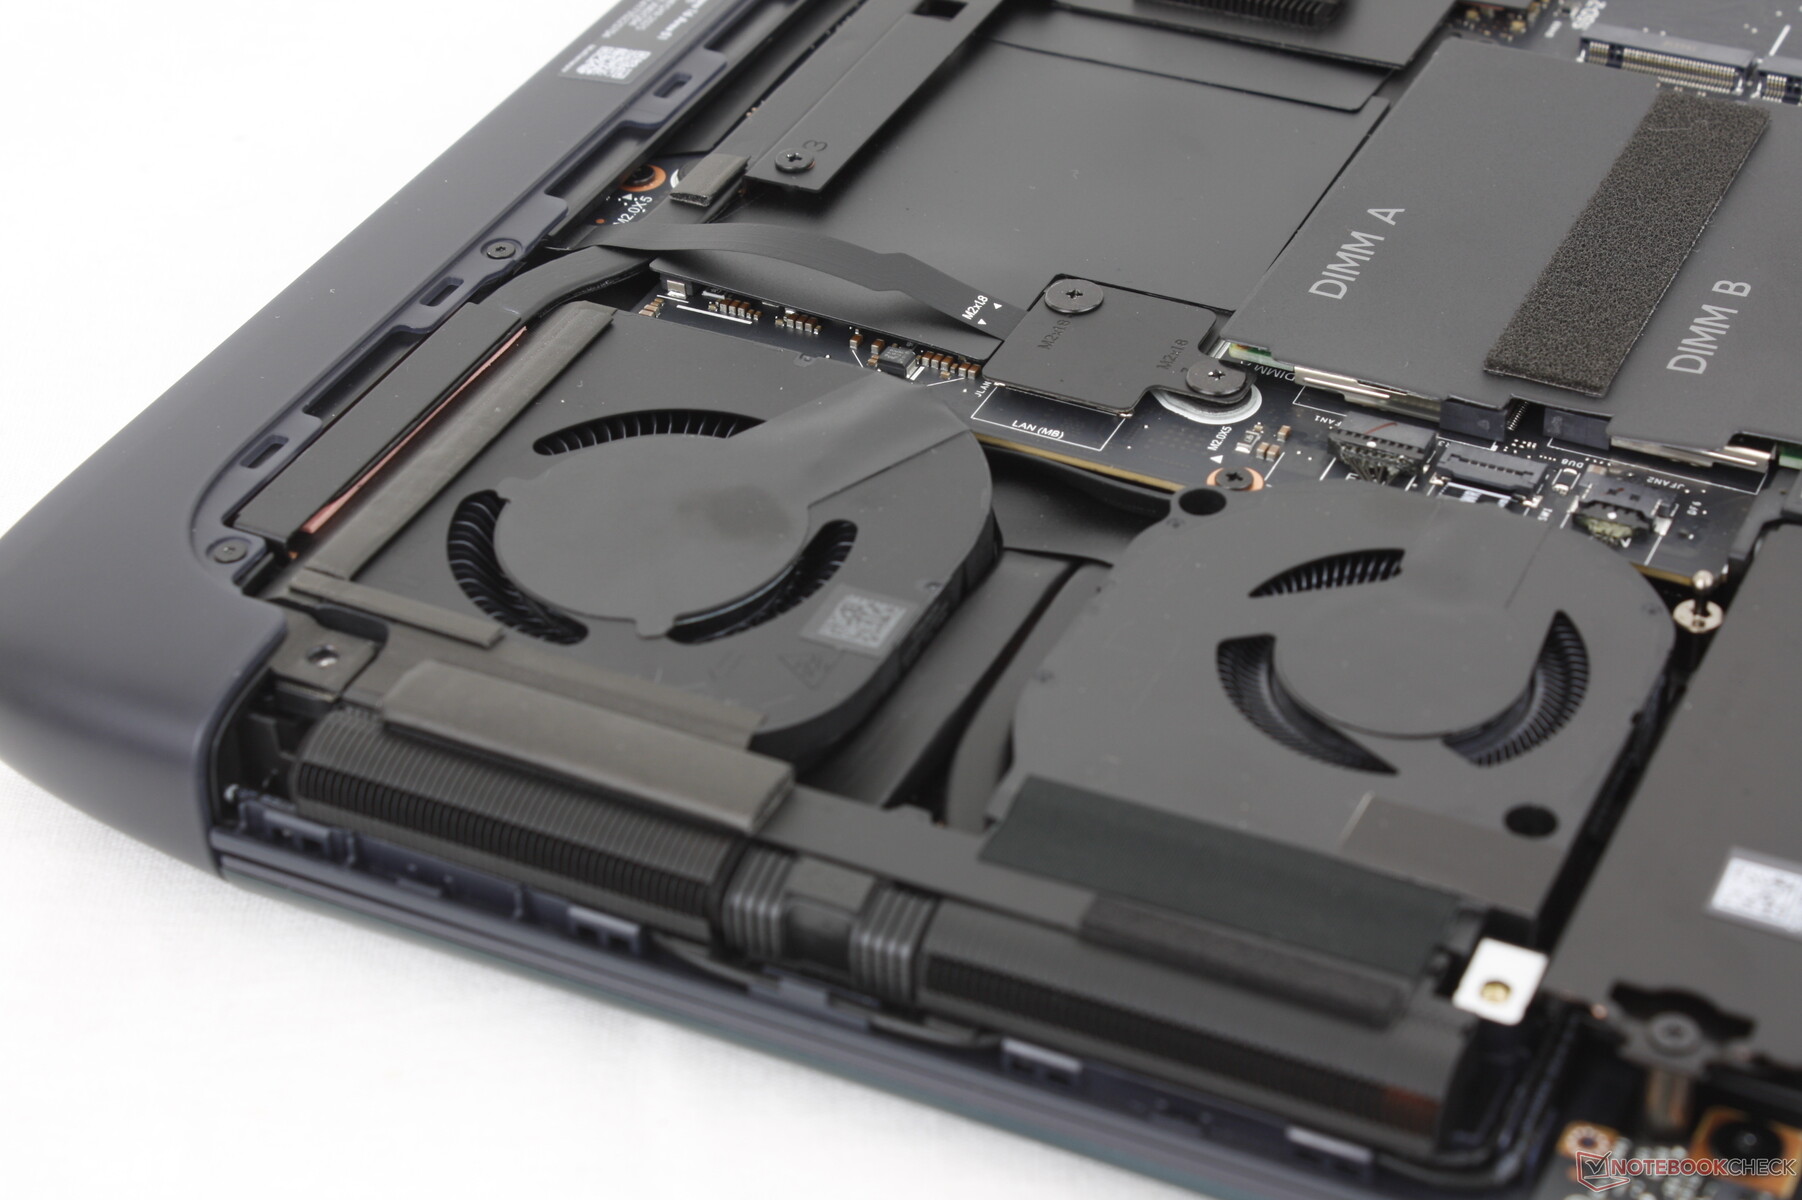
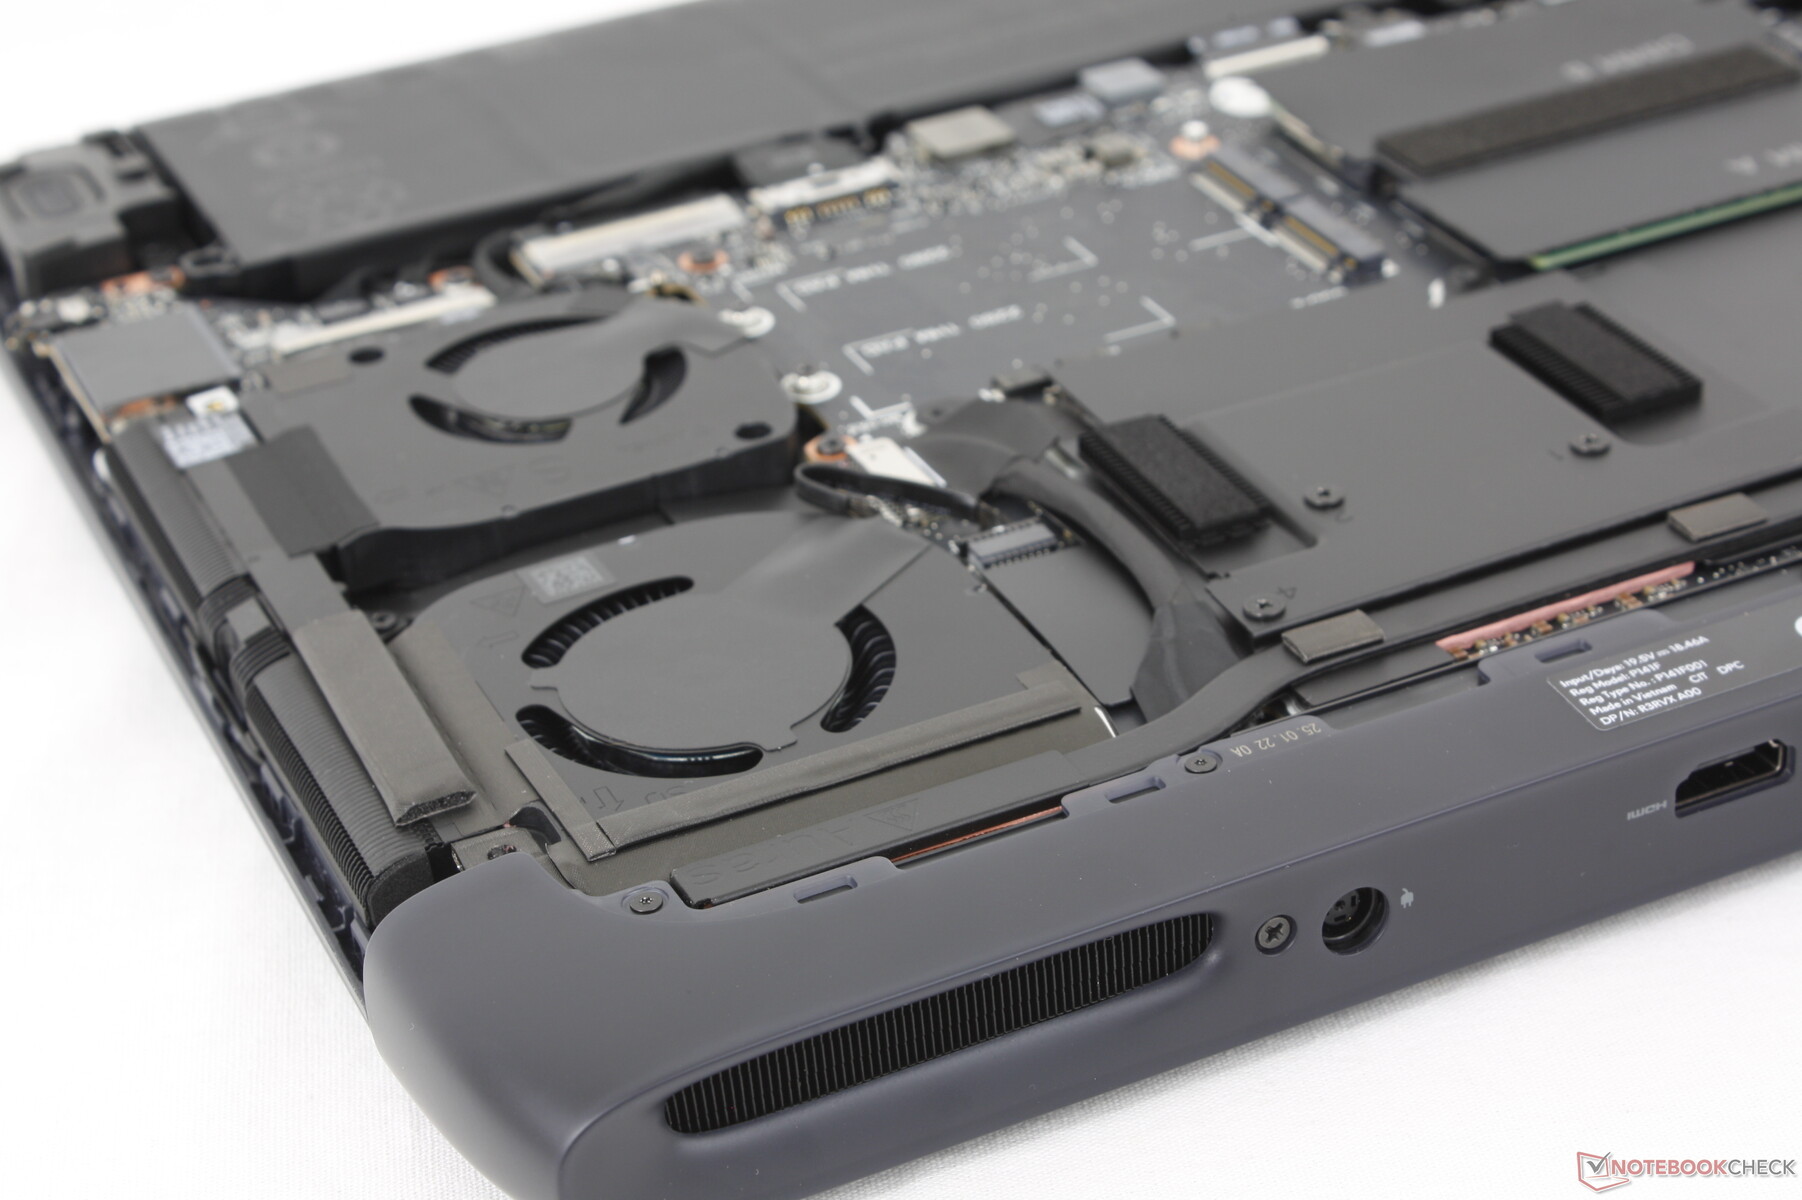
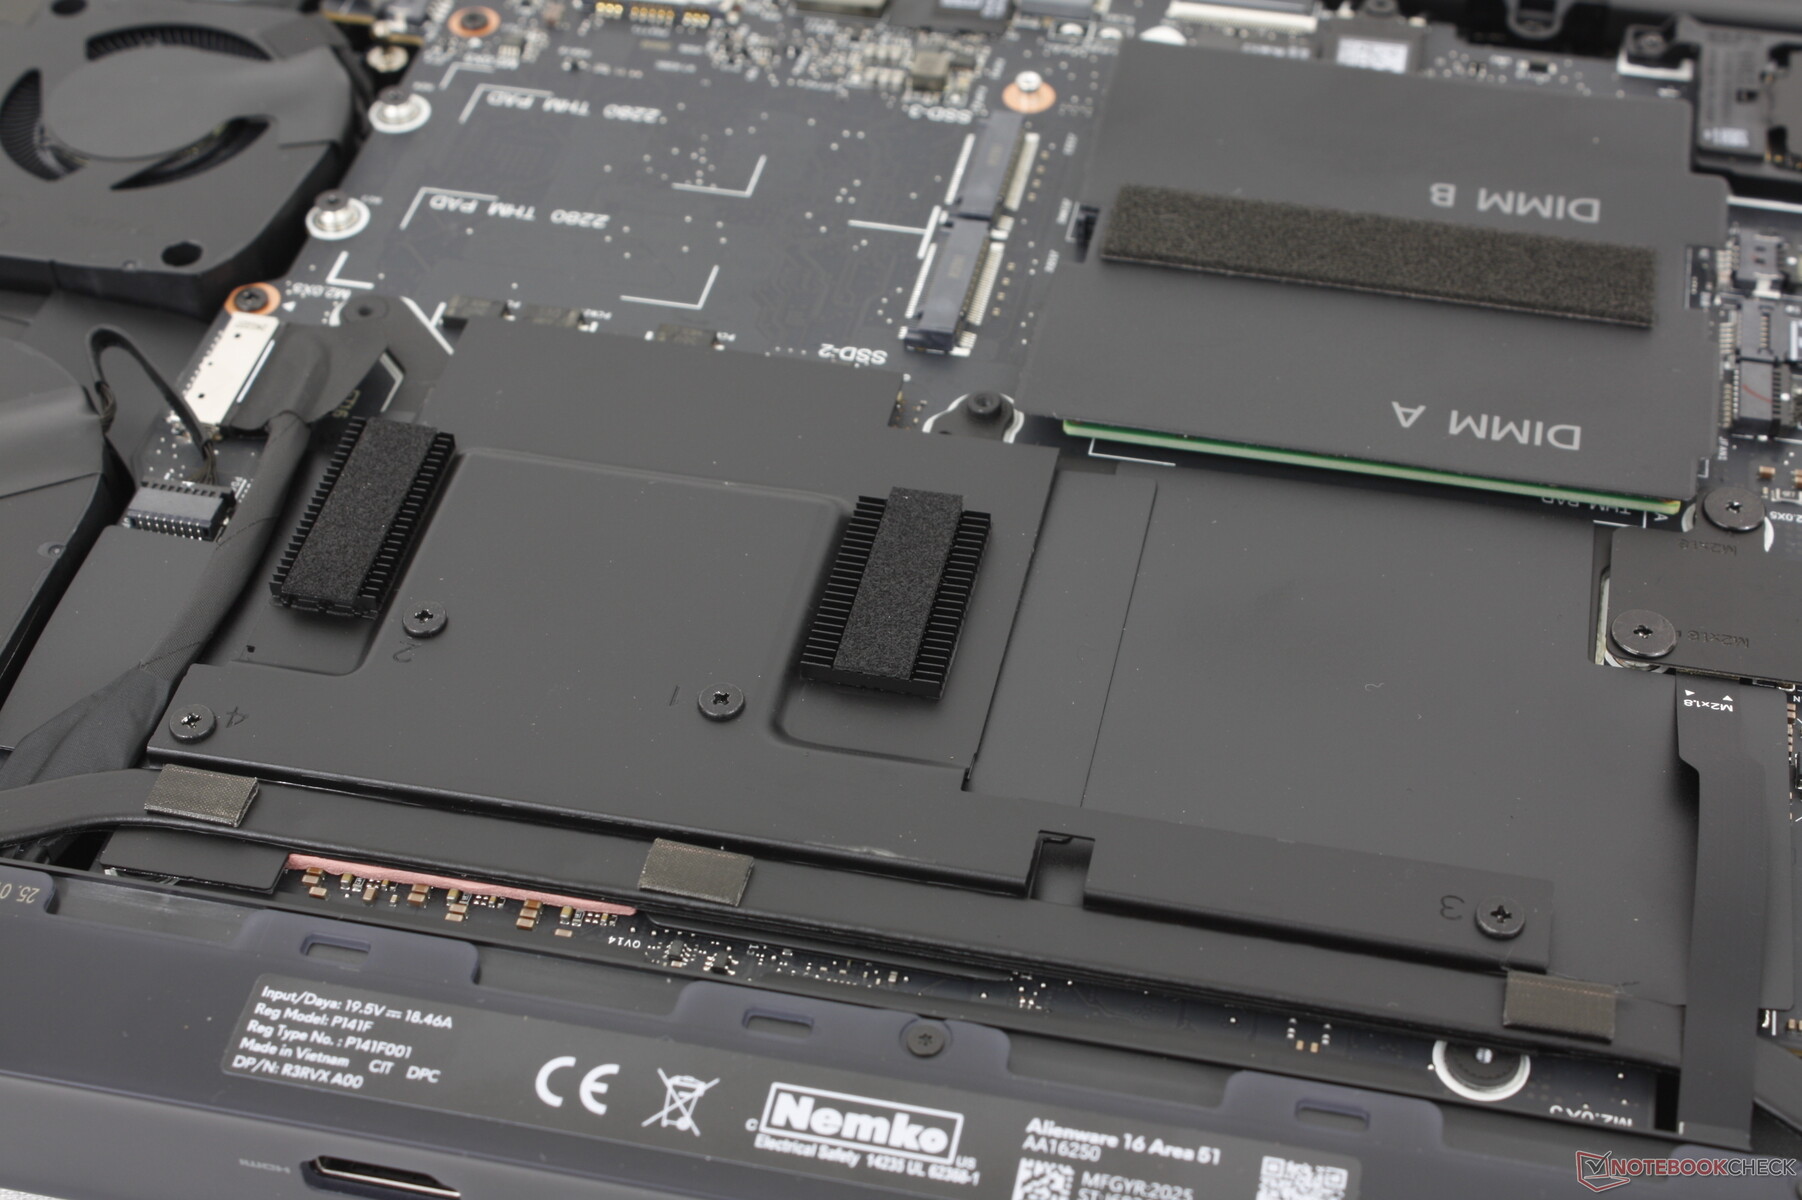
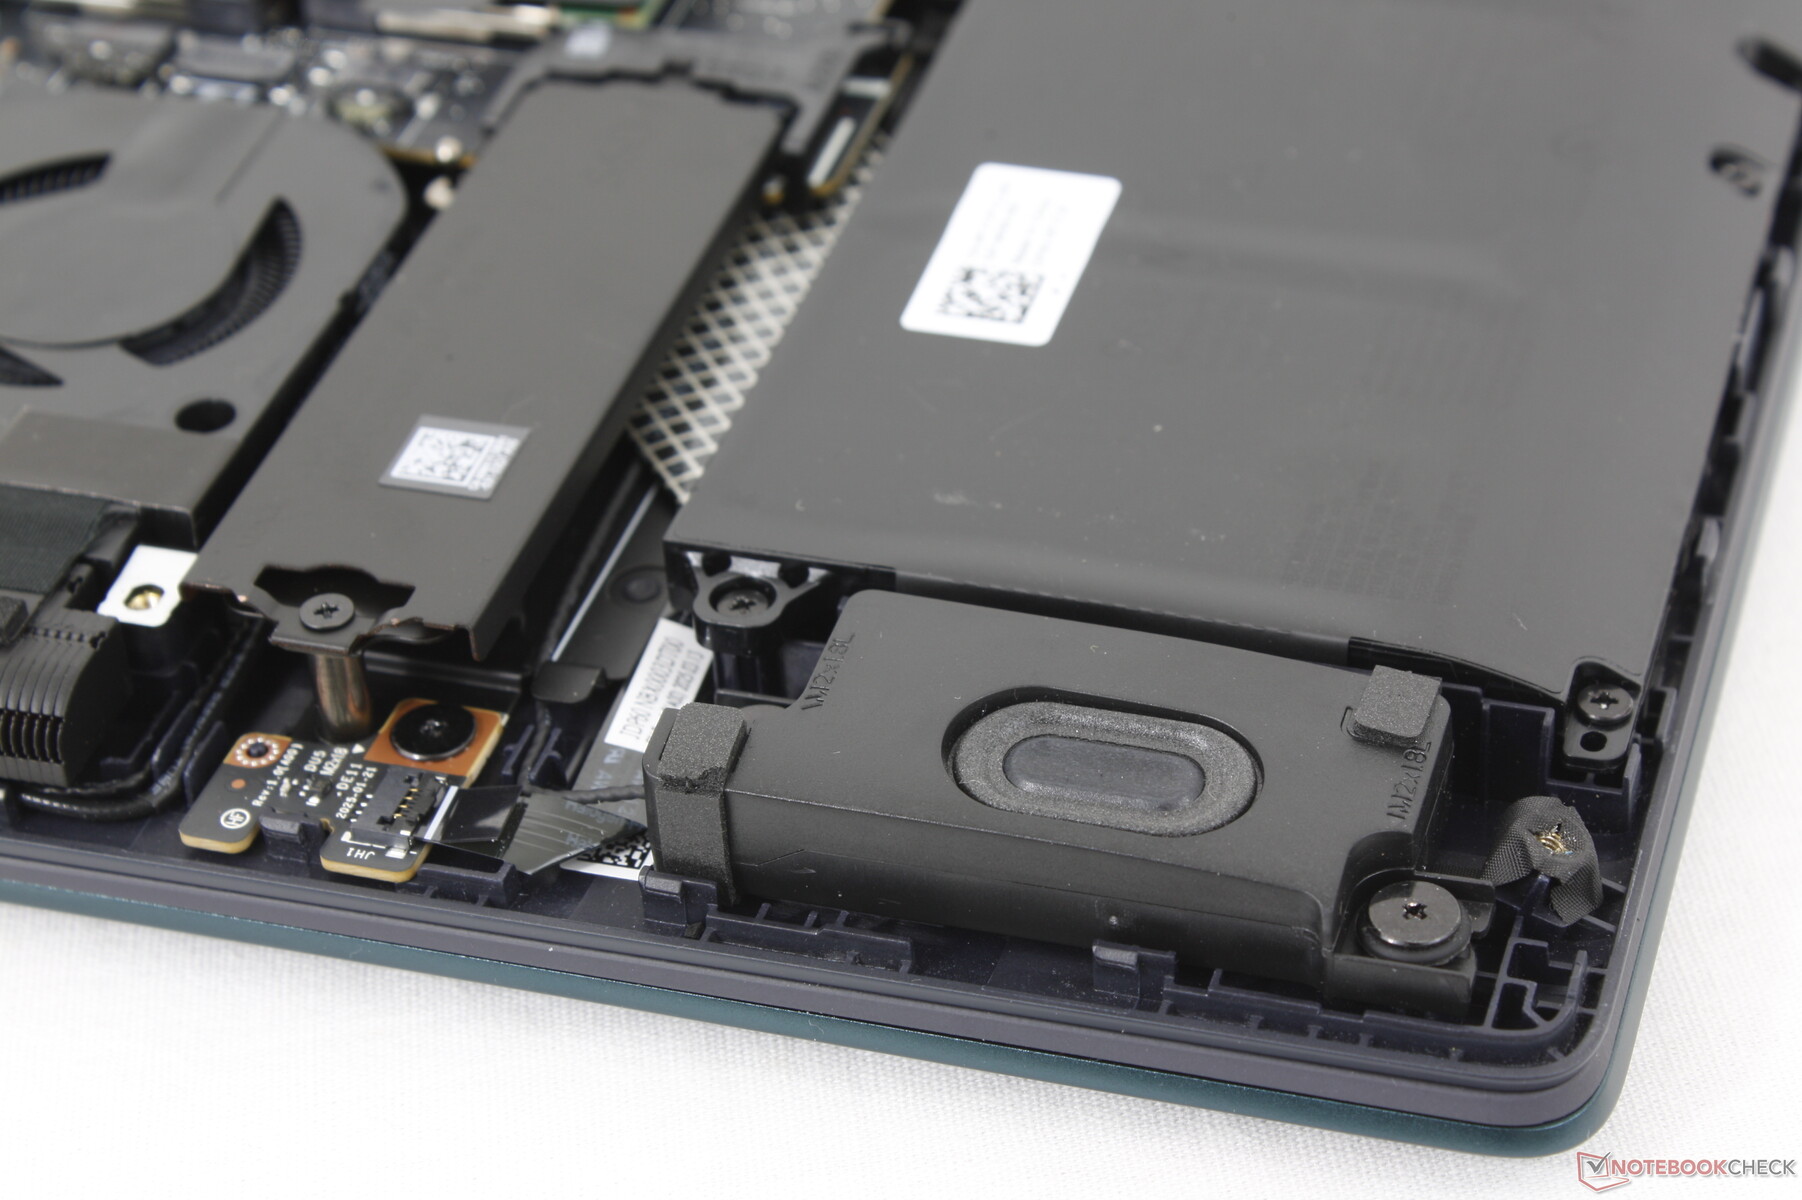
维护
底部面板由 8 颗十字螺丝固定,便于维修。进入机箱后,用户可以使用两个 SODIMM 插槽和三个 M.2 2280 SSD 插槽。请注意,三个固态硬盘插槽中只有一个支持 PCIe5 固态硬盘。
可持续性
戴尔没有明确说明 Alienware 16 在制造过程中使用了任何可回收矿物质。同时,包装是由 100% 可回收或再生材料制成的。
配件和保修
包装盒内除了交流适配器和文件外,没有其他附件。如果在美国购买,制造商通常提供一年有限保修。
输入设备
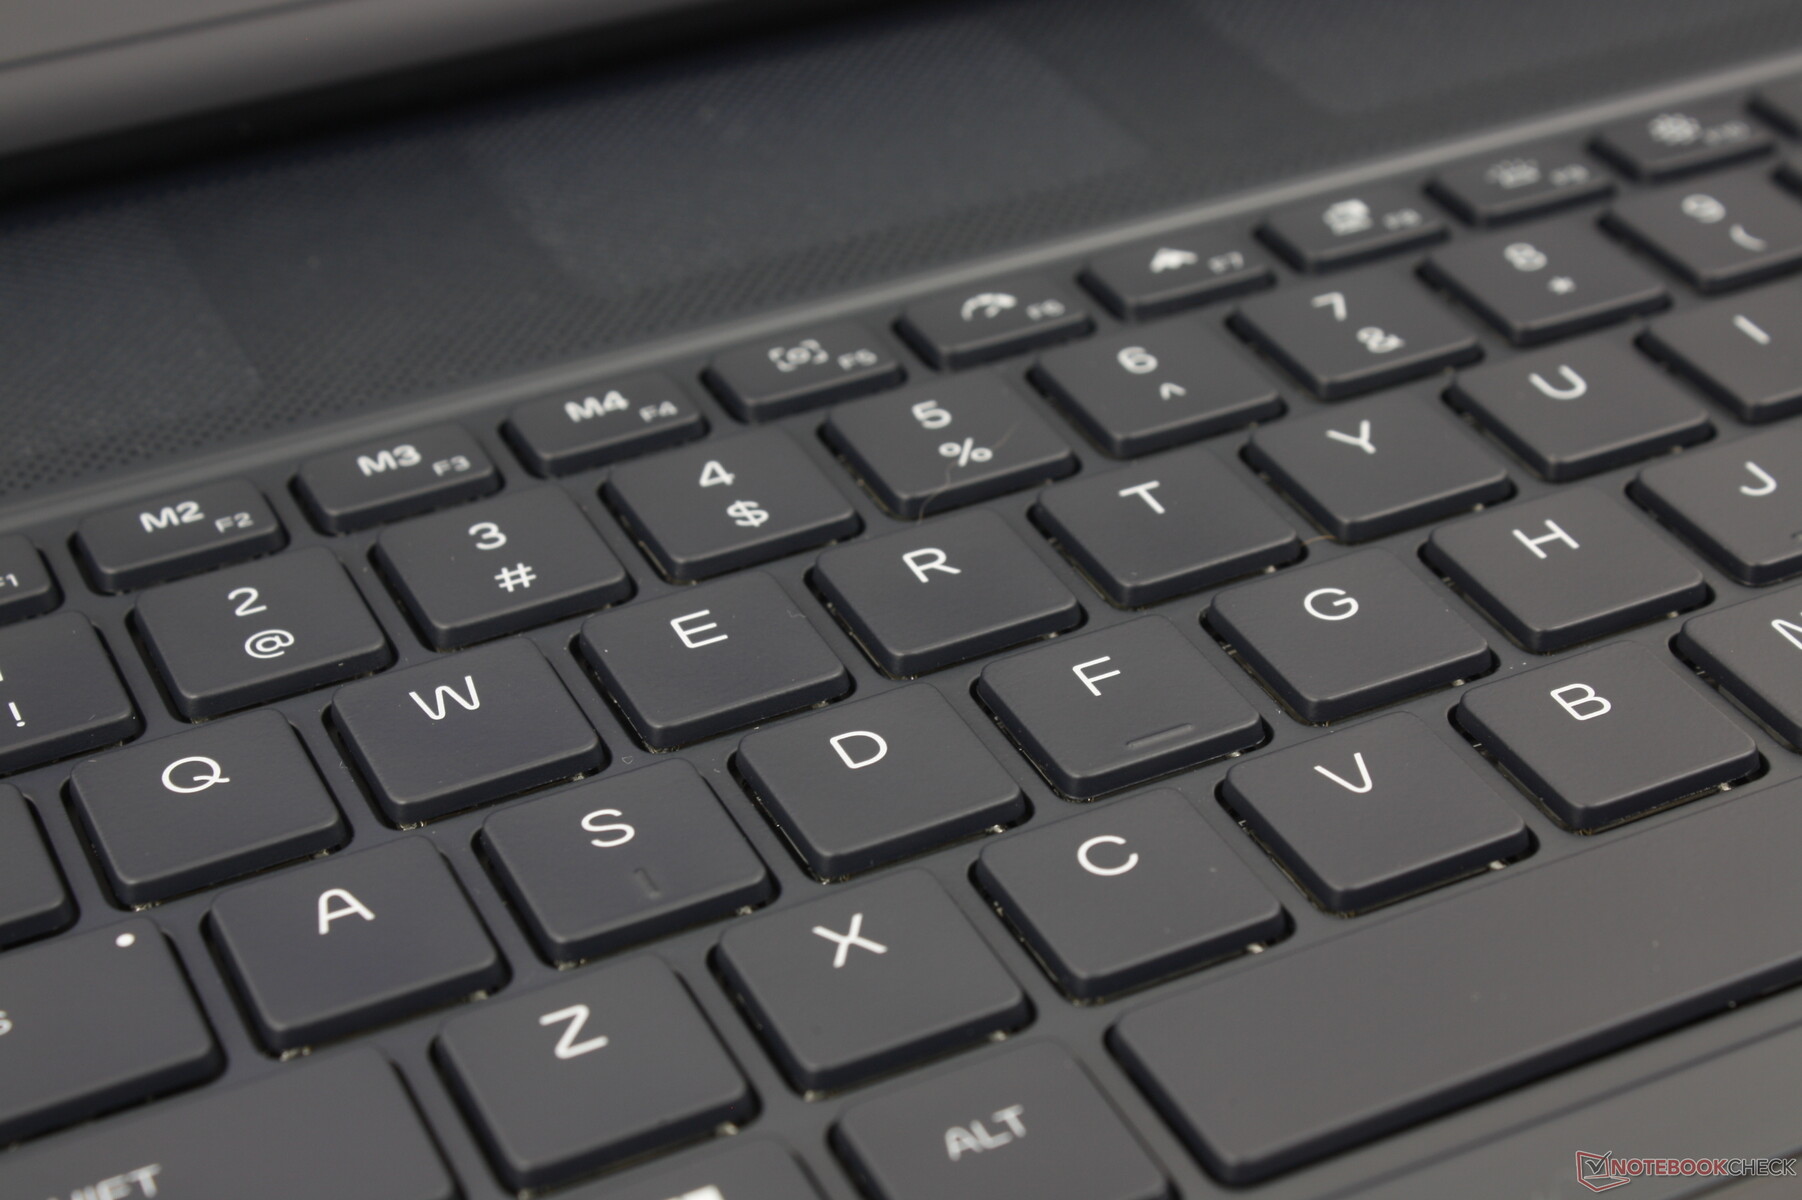
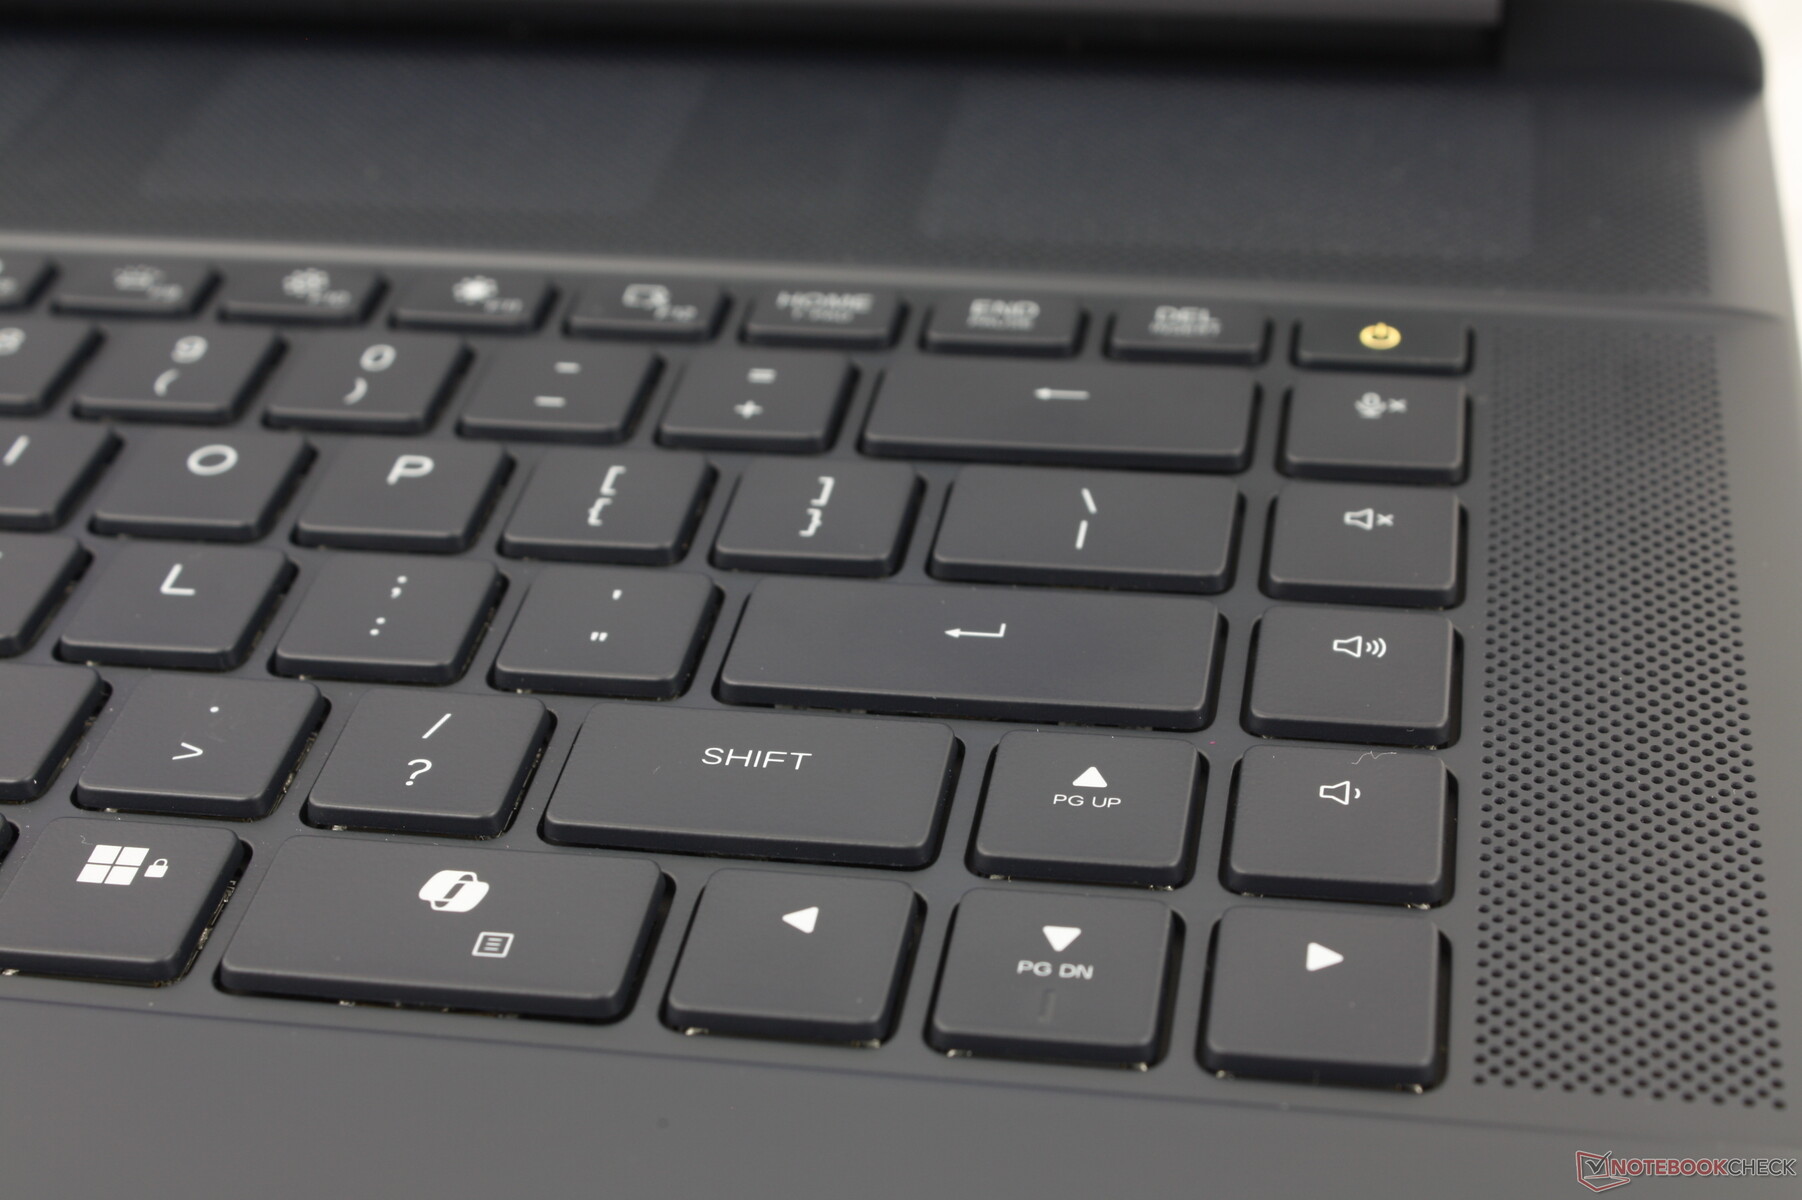
键盘
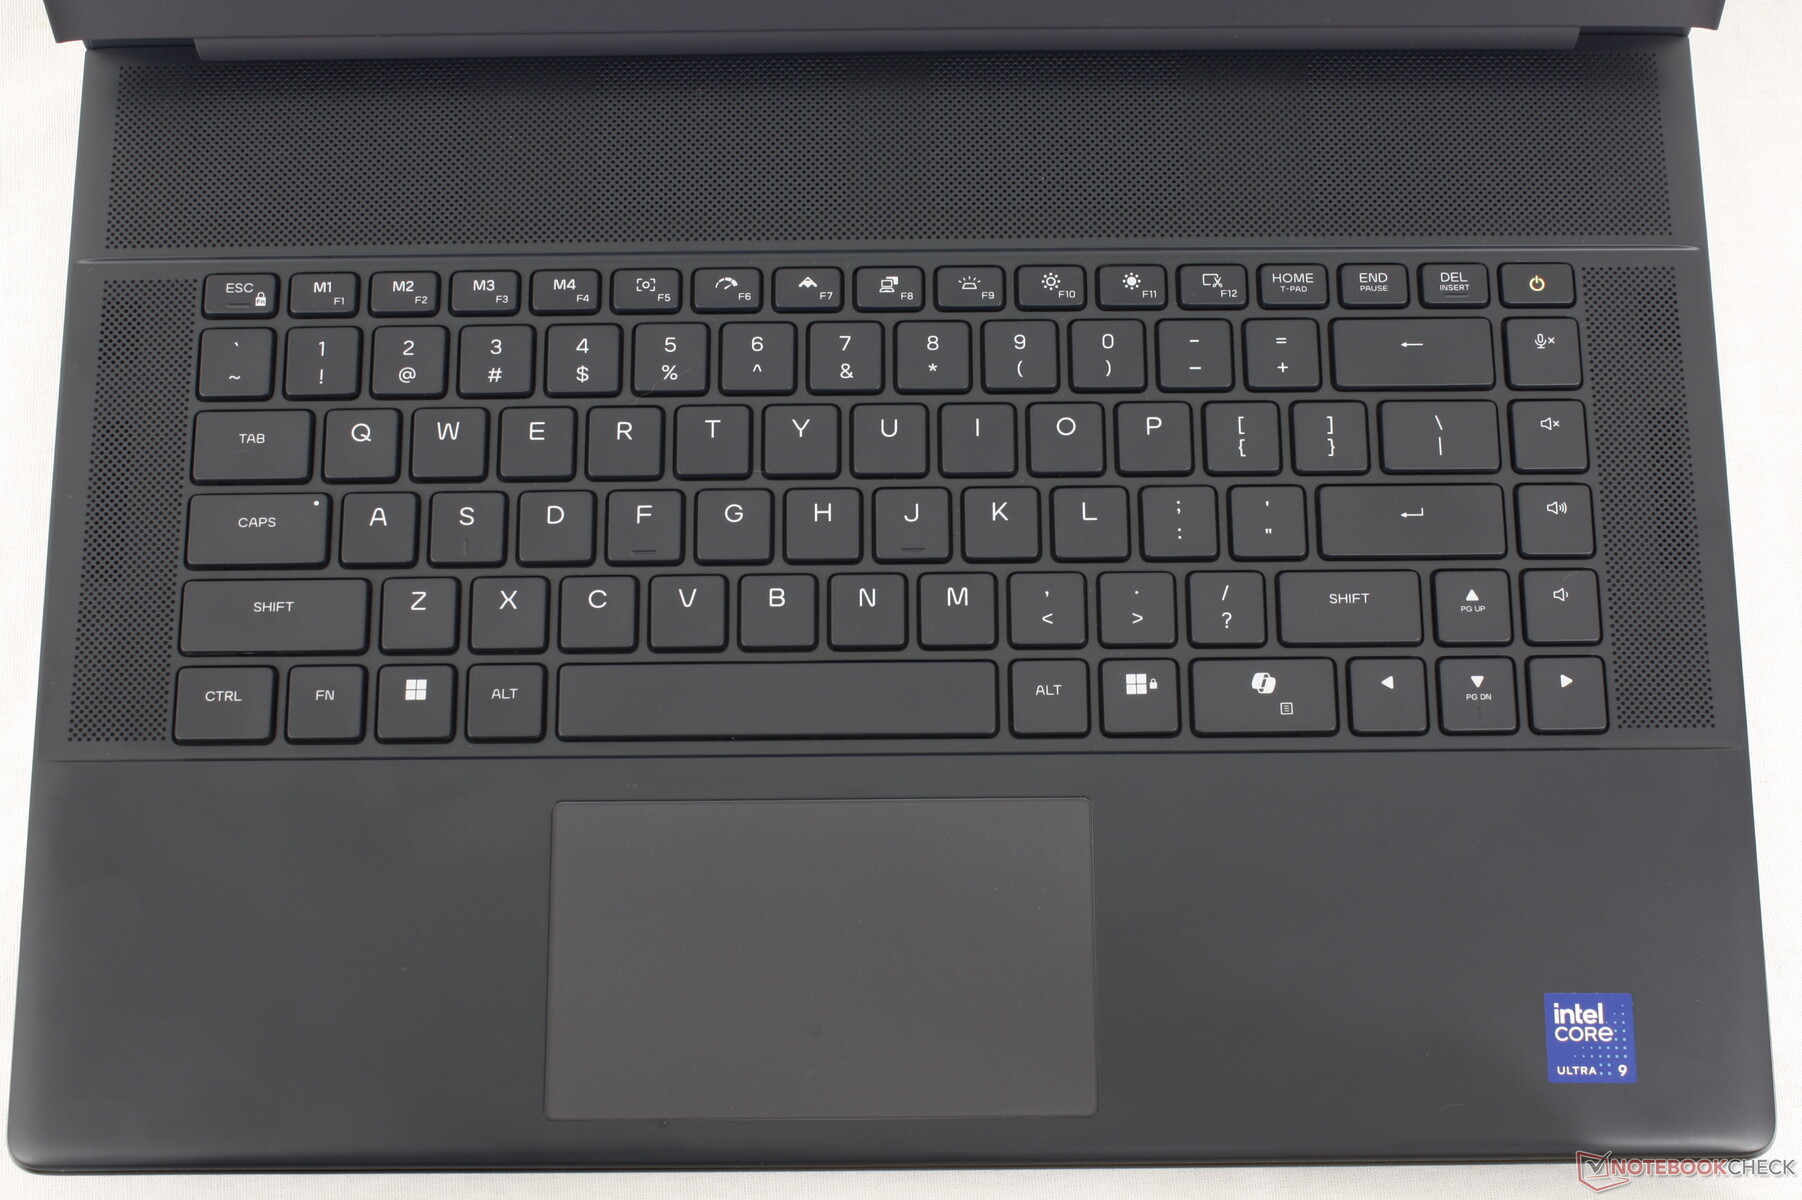
虽然机箱设计是全新的,但按键式 RGB 超低剖面 Cherry 机械键盘却并非如此,因为至少从 2021 年起,Alienware 就开始在部分机型上提供该选项。这款键盘仍然是我们最喜欢的打字或游戏键盘之一,因为它具有尖锐、响亮和令人满意的 "咔哒 "声,尤其是与常见的薄膜键盘相比。想要更安静打字体验的玩家仍可配置标准的非樱桃键盘。
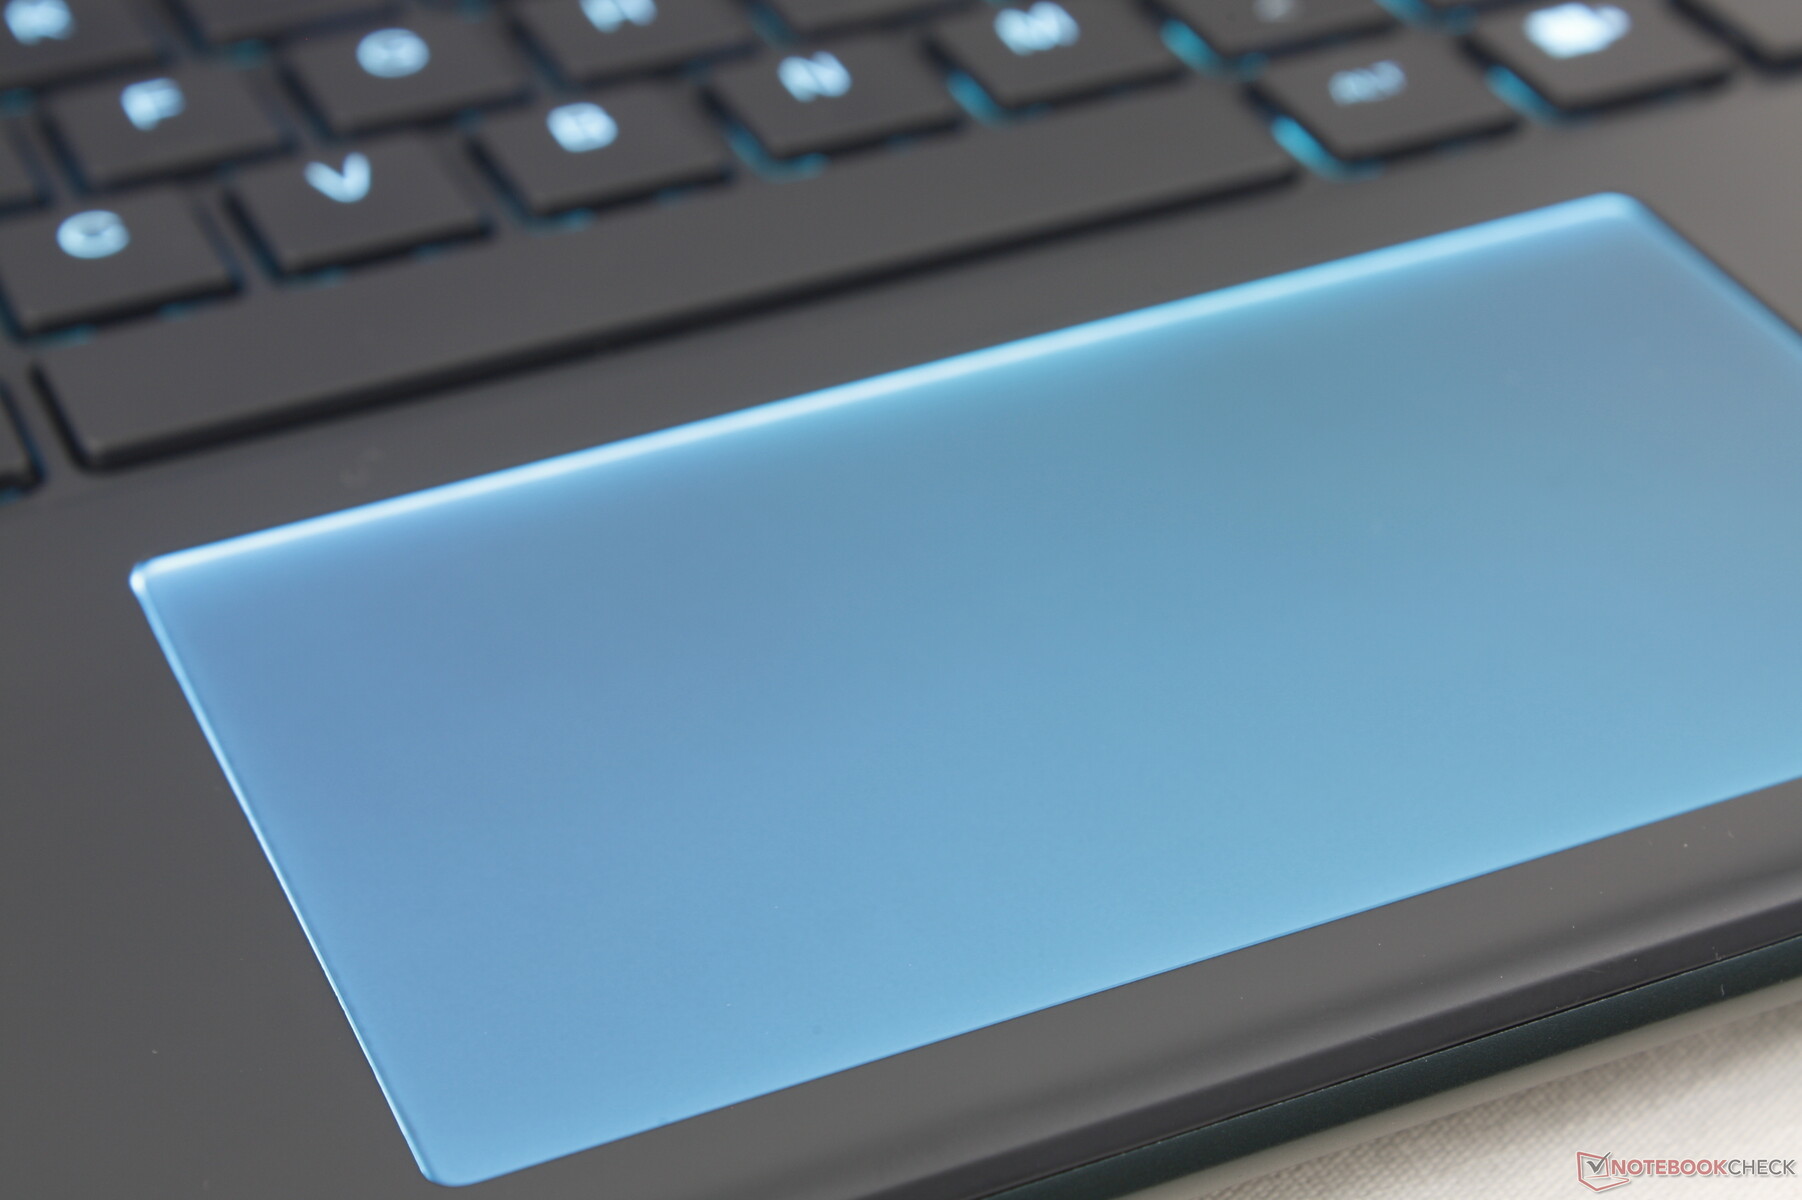
触摸板
Alienware 笔记本电脑的点击板一直都不是特别大,即使是新的 Area-51 设计也延续了这一传统。事实上,它的尺寸与 Alienware x16 R1/R2 上的点击板相同,仅为 11.2 x 6.5 厘米,而 Alienware x16 R1/R2 上的点击板为 13.3 x 9 厘米。 技嘉 Aero X16.光标控制和点击分别反应灵敏、触感良好,但多点触控输入感觉很拥挤。
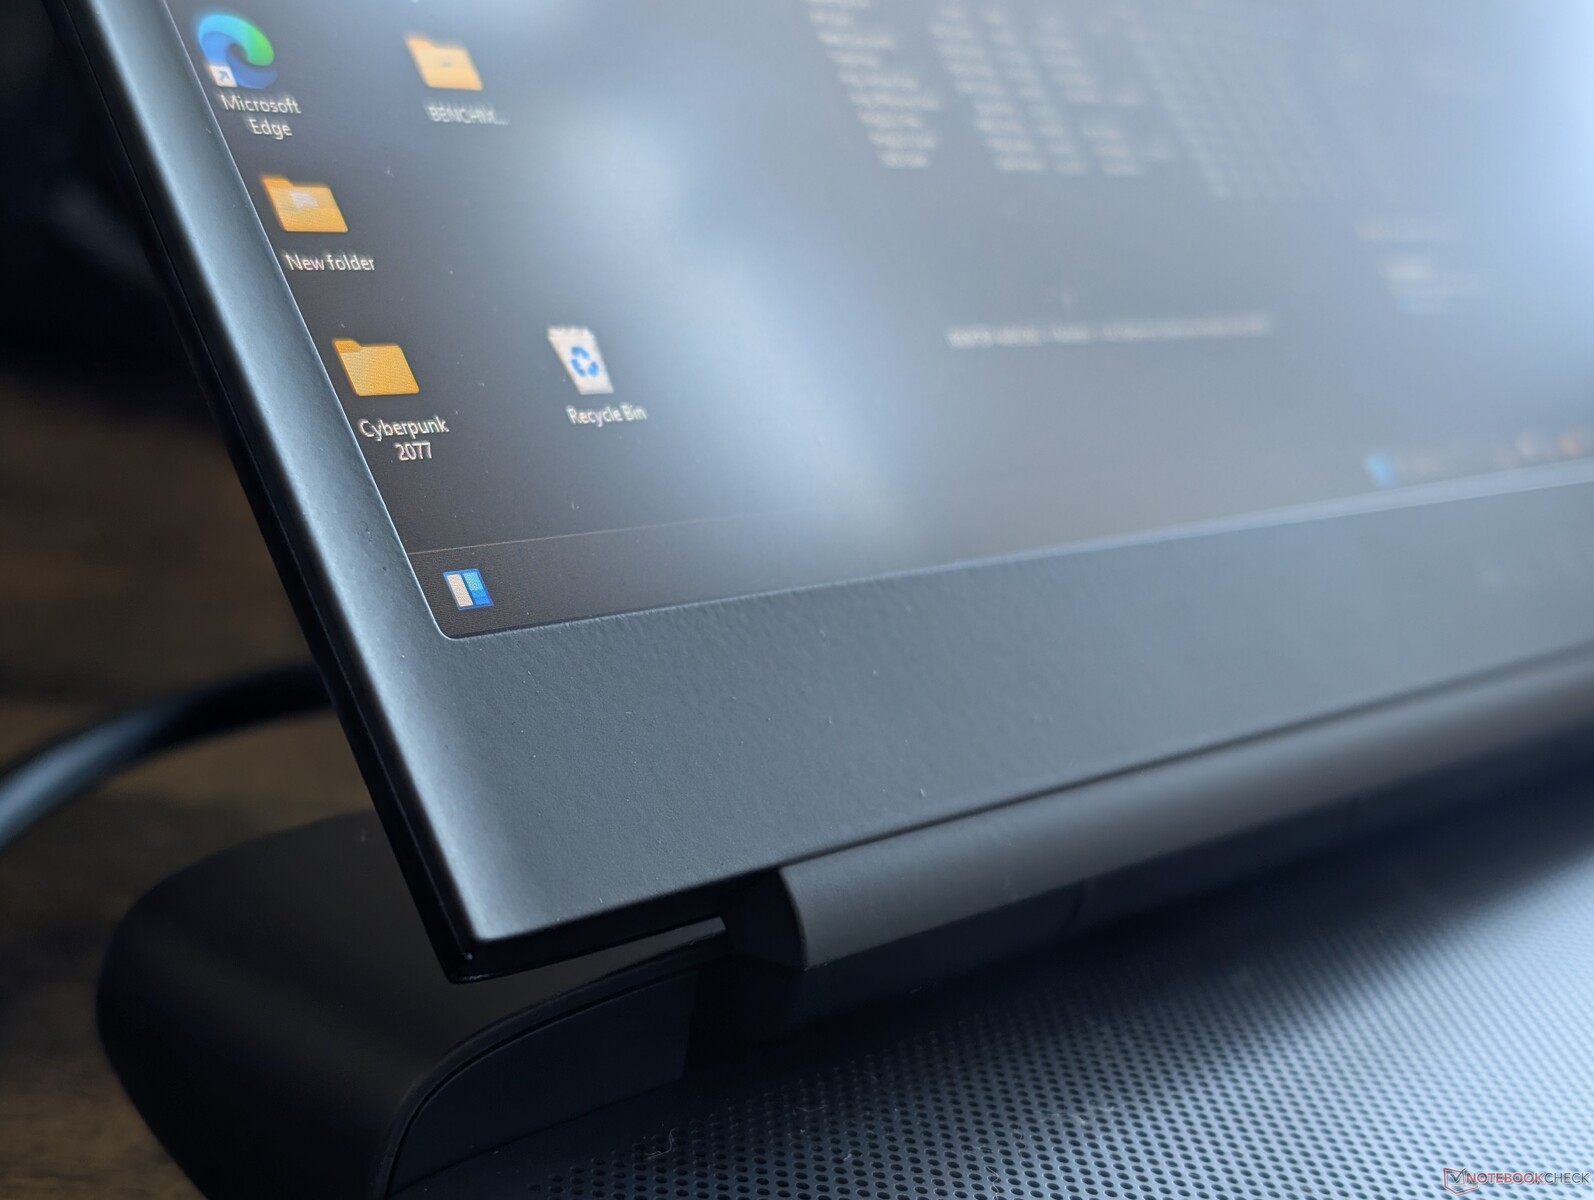
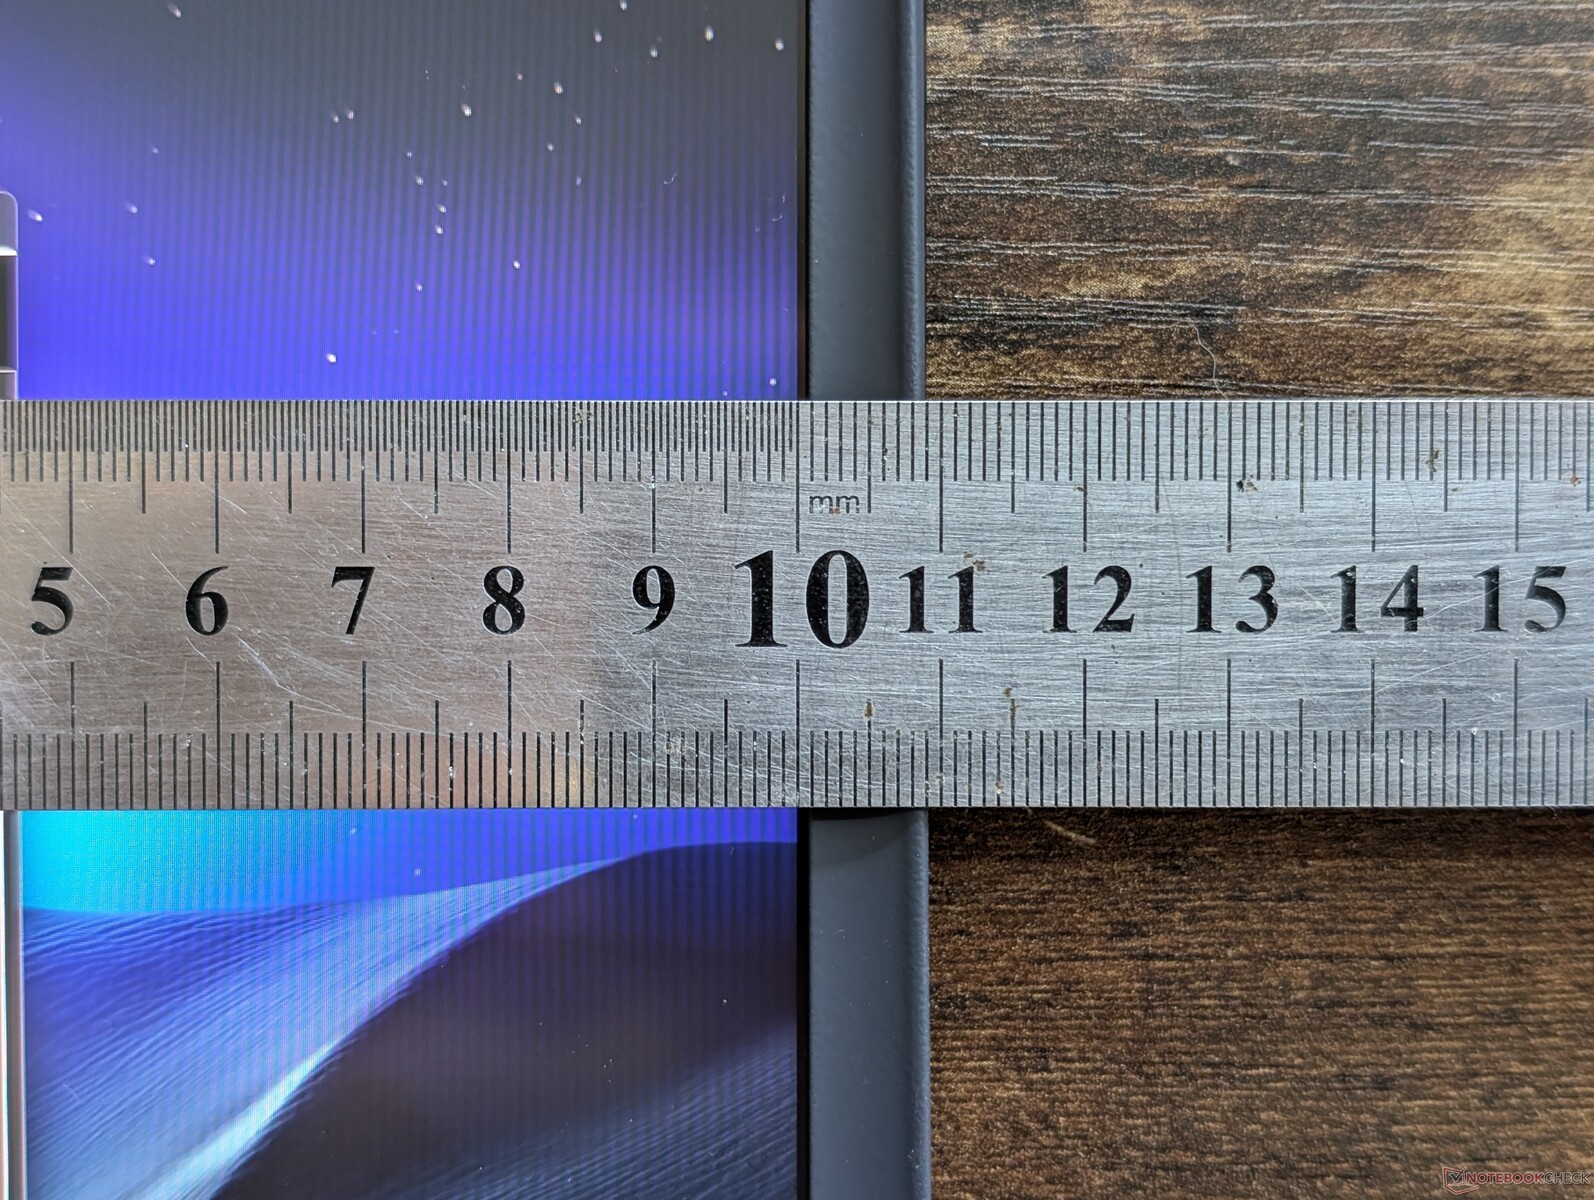
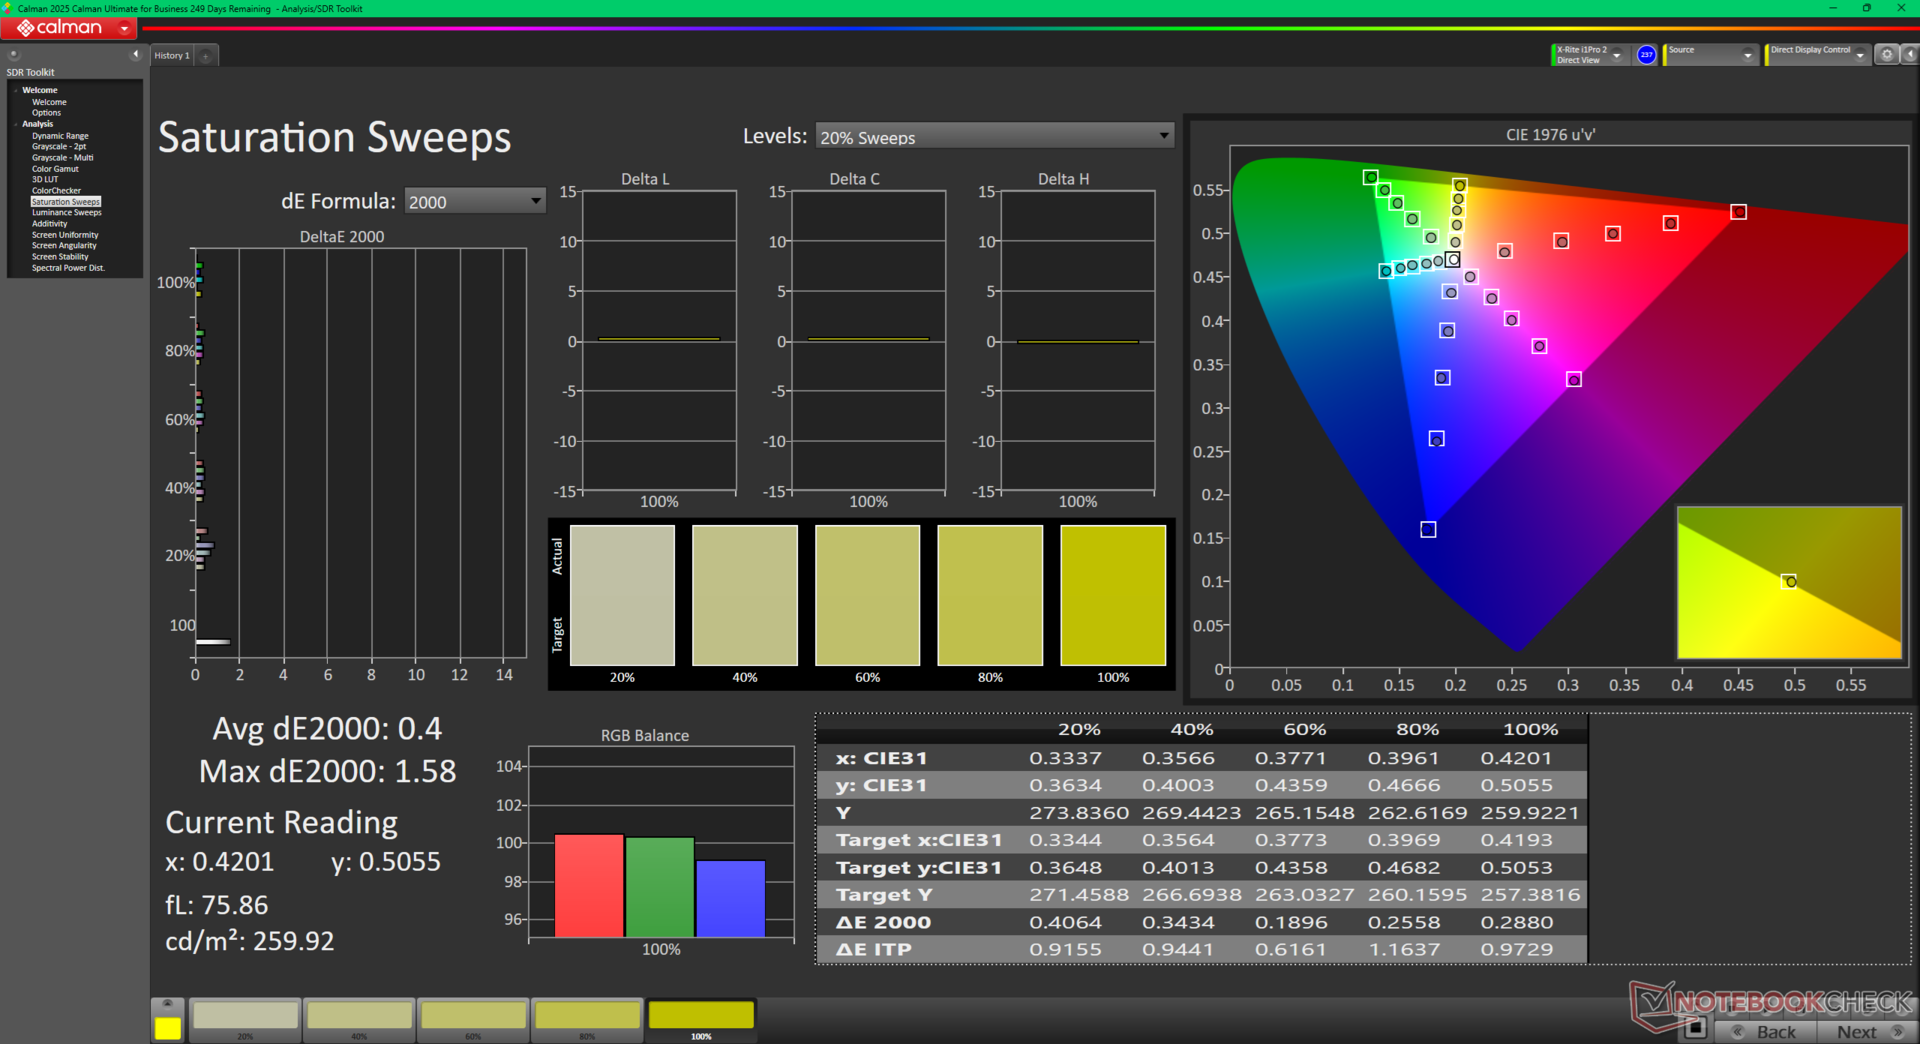
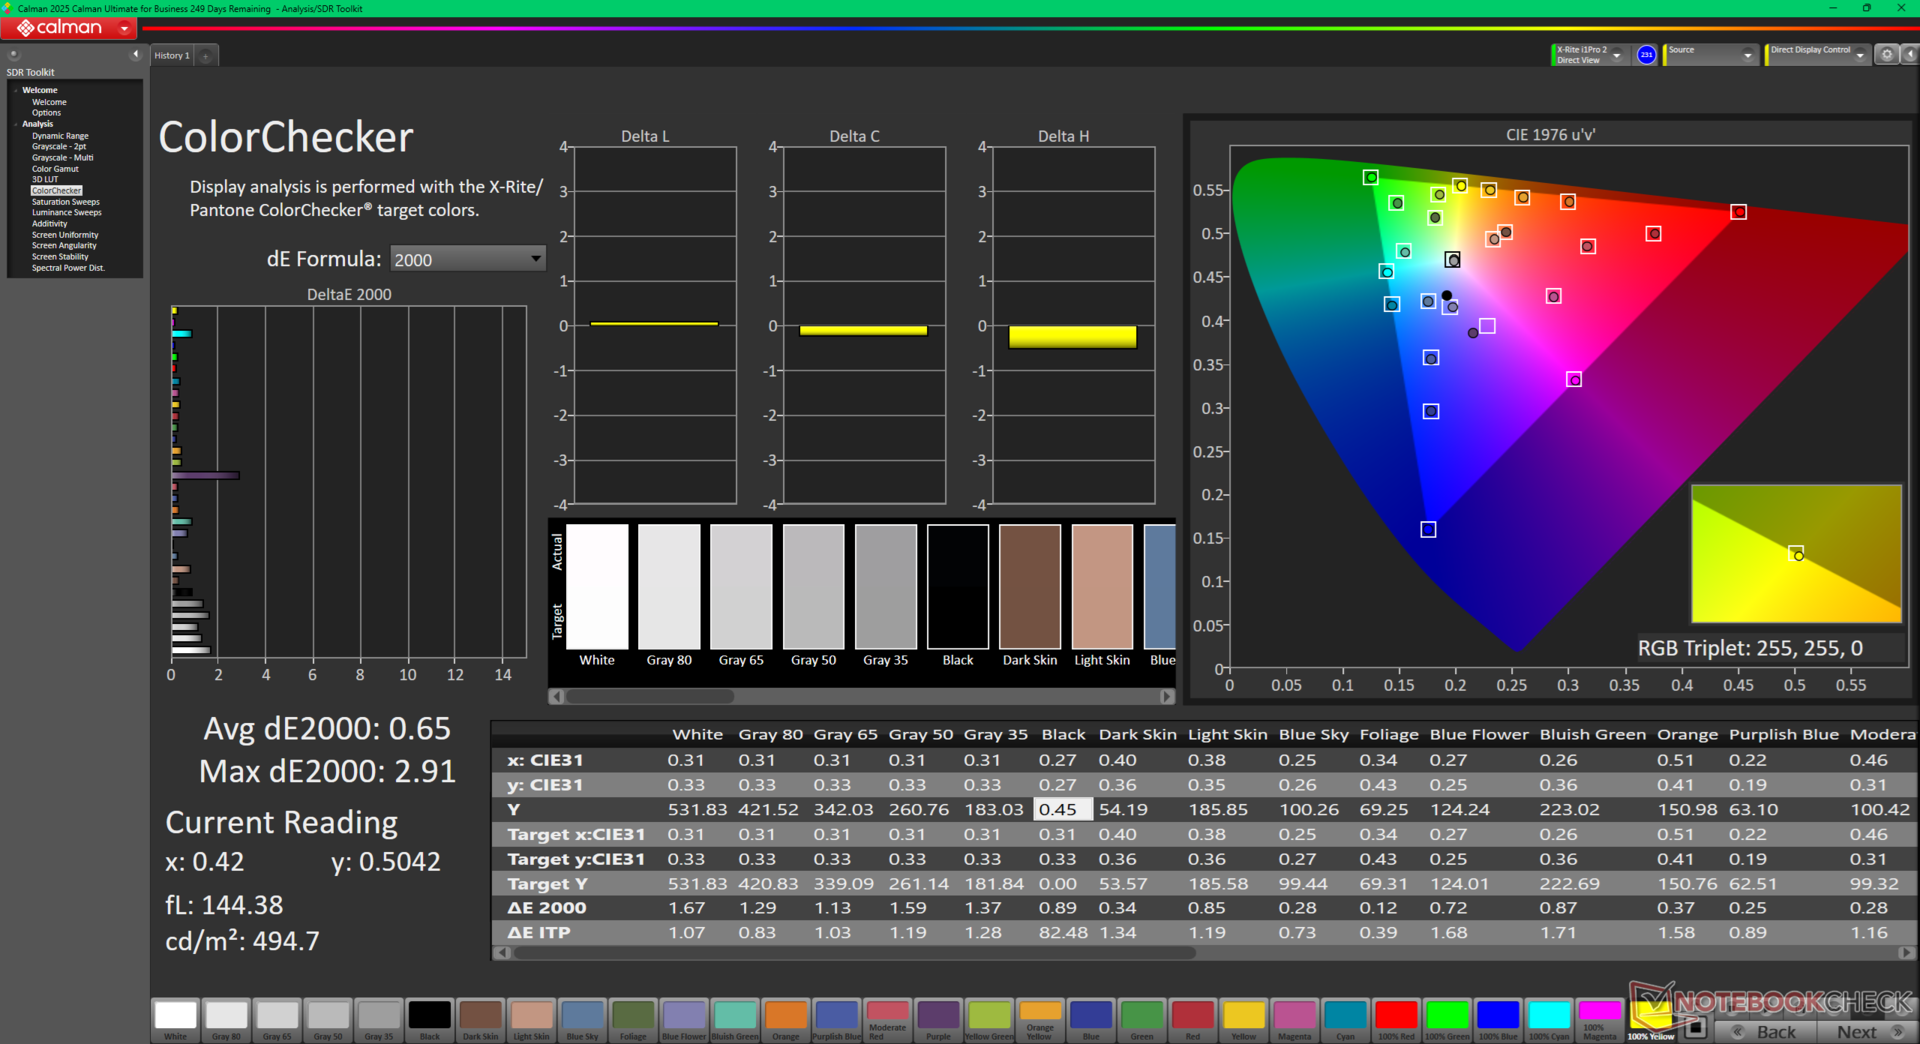
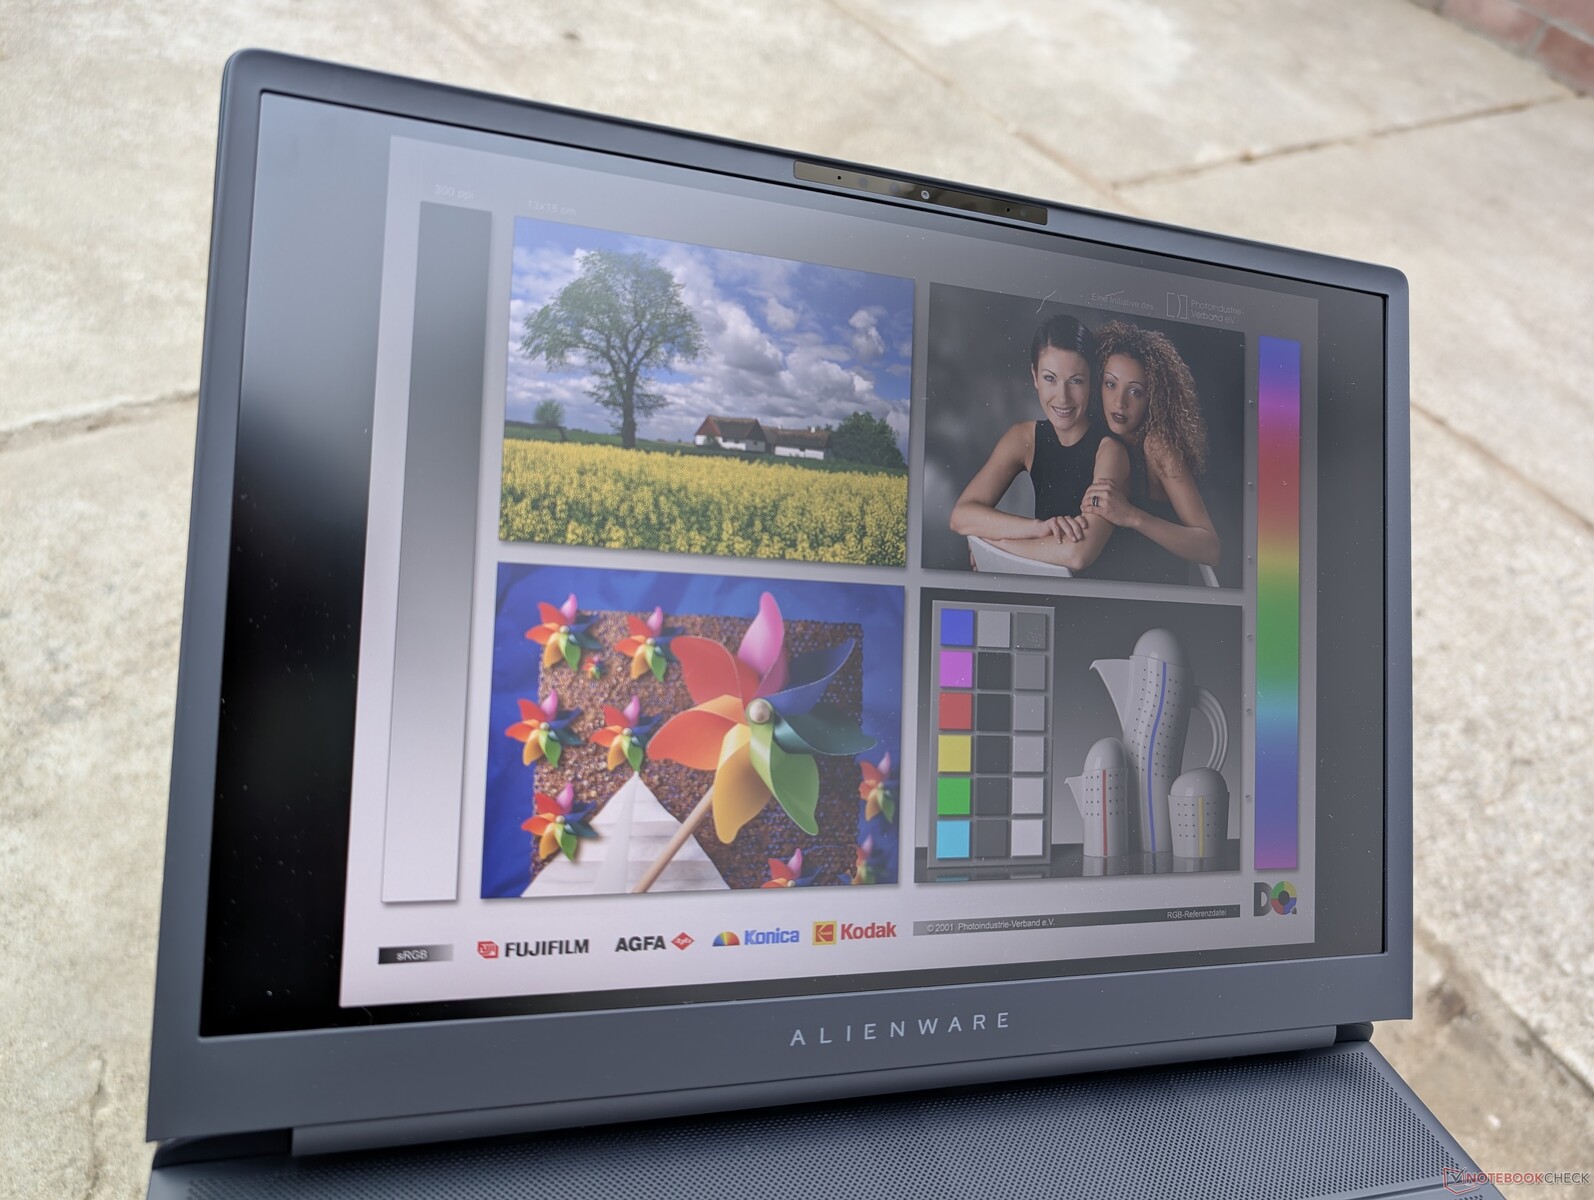
显示屏 - 1600p、240 Hz、高级 G-Sync、IPS
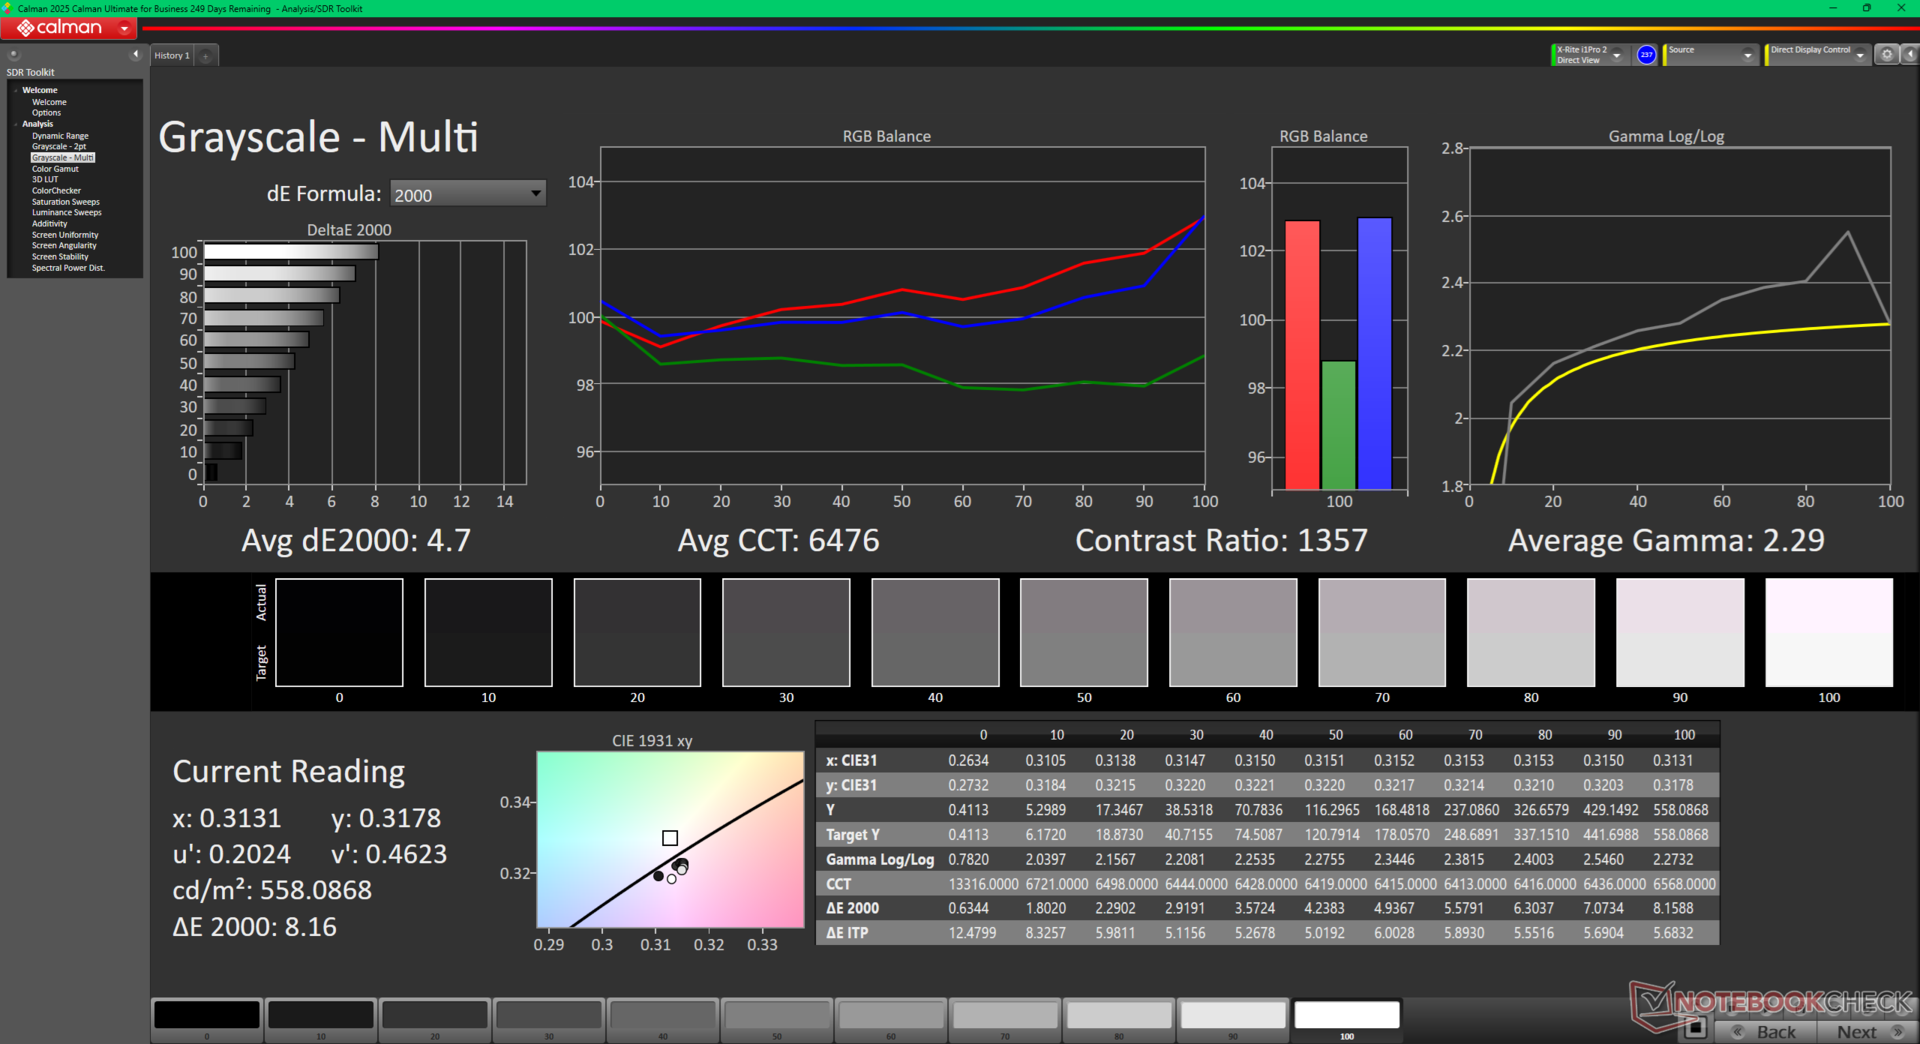
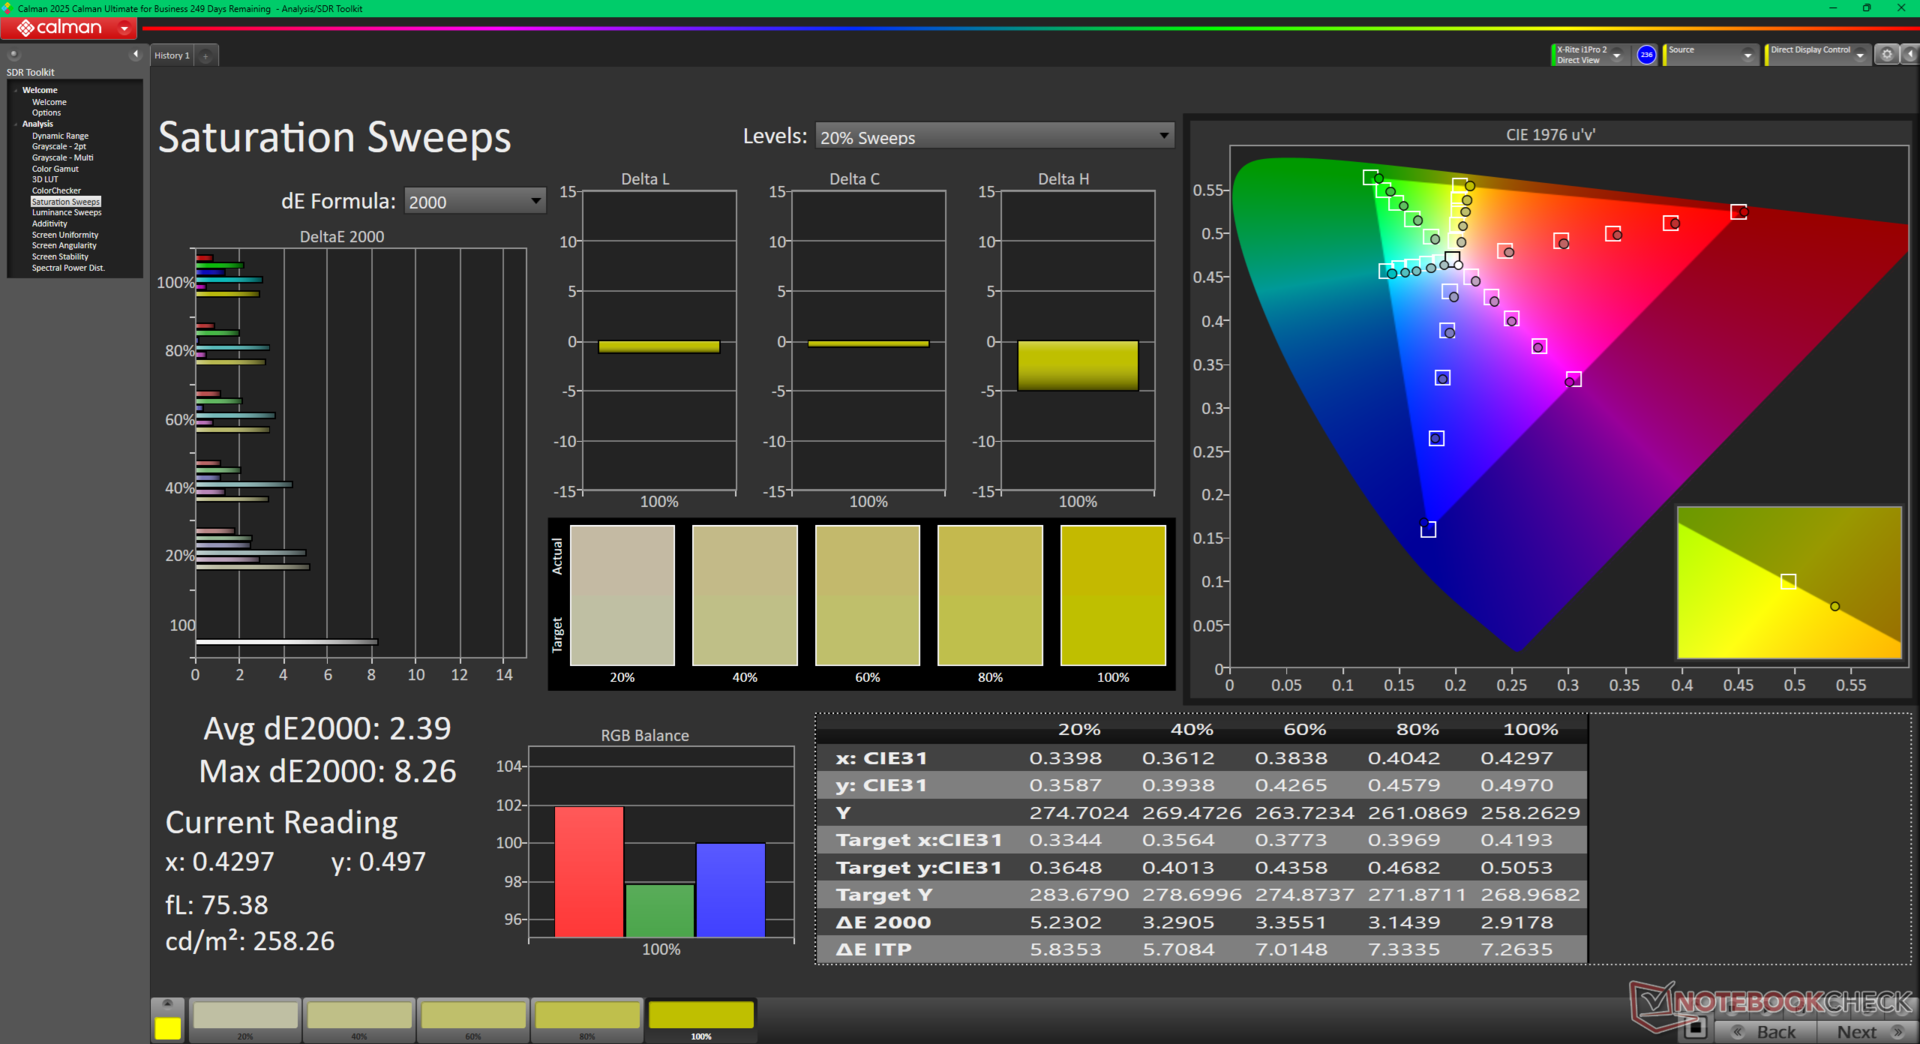
该机型采用了与去年的 Alienware x16 R2 相同的 QHD+ 京东方 B160QAN 面板,可提供类似的观看体验。不过,与 x16 R2 上仅约 350 尼特的亮度相比,这次的显示屏亮度明显更高,约为 550 尼特。另一方面,HDR 和 Windows DRR 仍然不支持。

| |||||||||||||||||||||||||
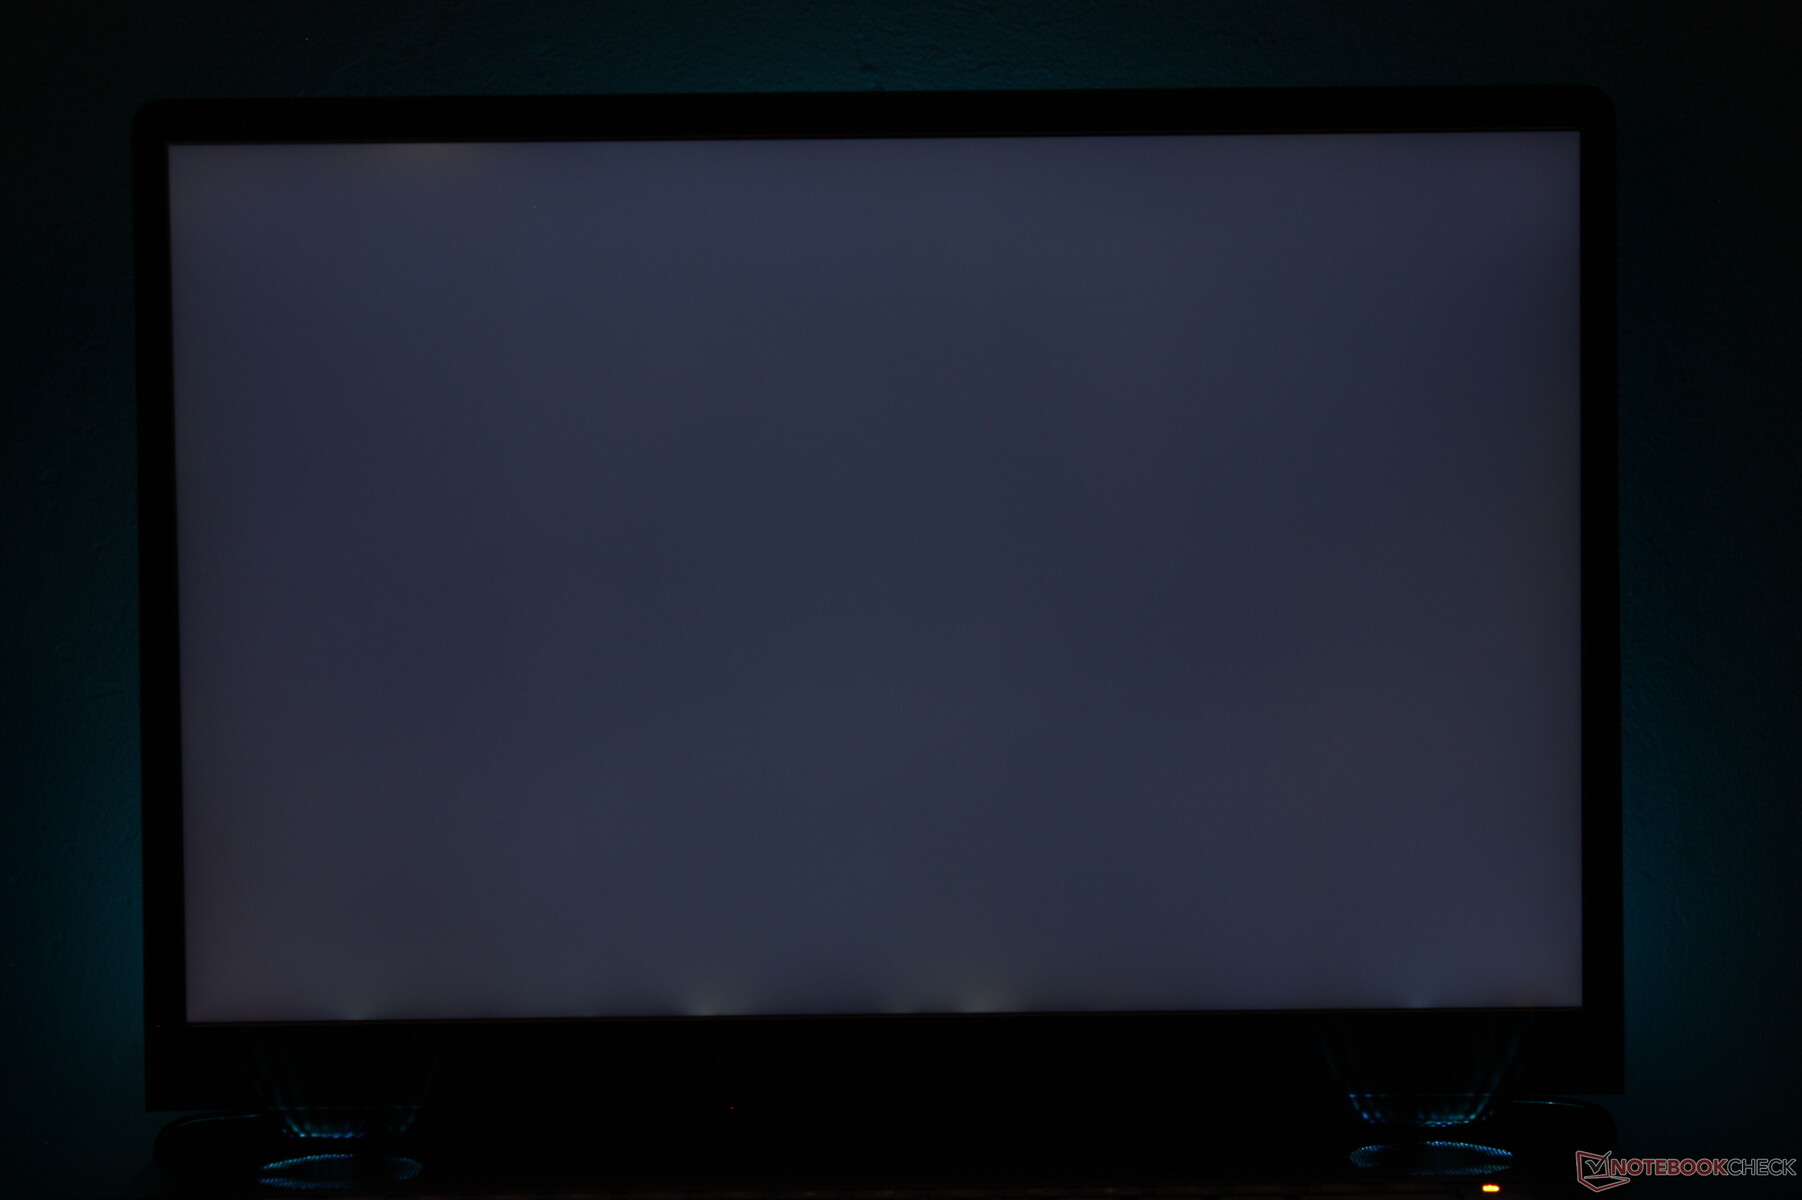
Brightness Distribution: 88 %
Center on Battery: 554 cd/m²
Contrast: 1065:1 (Black: 0.52 cd/m²)
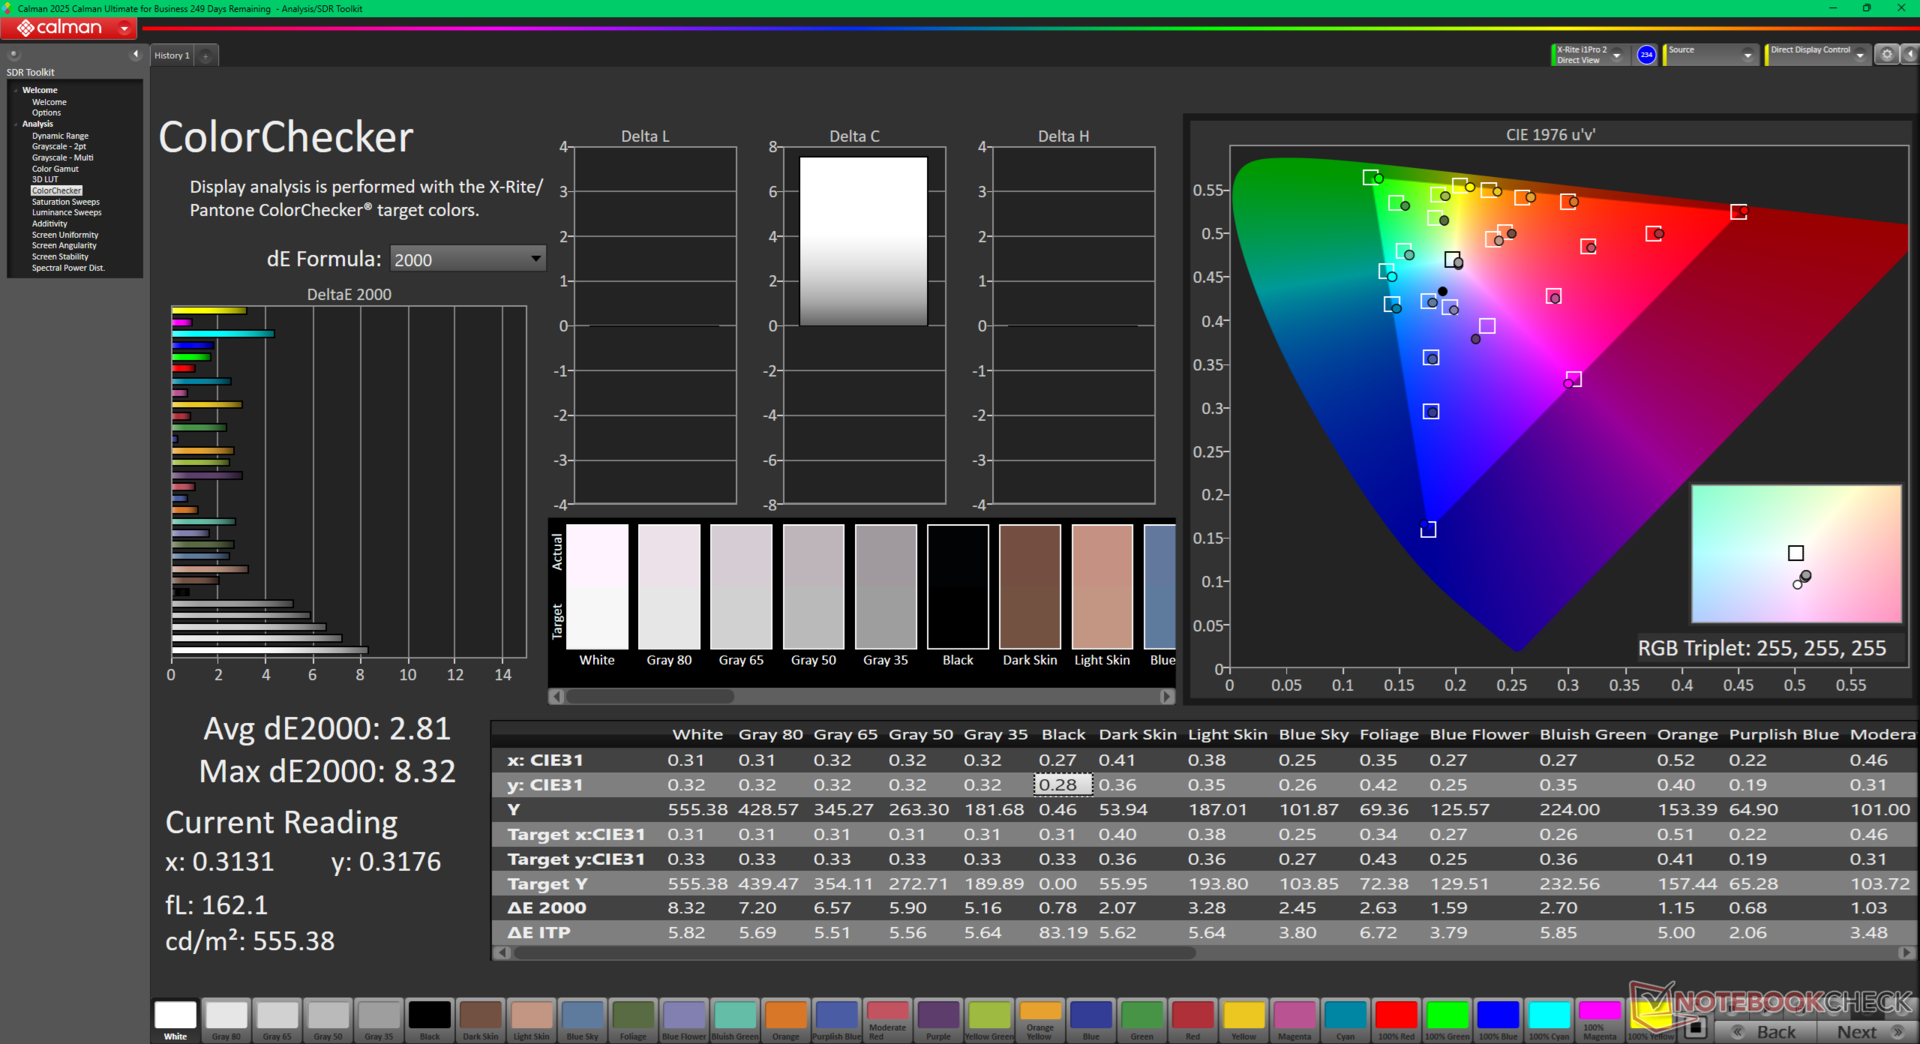
ΔE ColorChecker Calman: 2.81 | ∀{0.5-29.43 Ø4.71}
calibrated: 0.65
ΔE Greyscale Calman: 4.7 | ∀{0.09-98 Ø4.96}
89.2% AdobeRGB 1998 (Argyll 3D)
100% sRGB (Argyll 3D)
96% Display P3 (Argyll 3D)
Gamma: 2.3
CCT: 6476 K
| Alienware 16 Area-51 AU Optronics B160QAN, IPS, 2560x1600, 16", 240 Hz | Alienware x16 R2 P120F BOE B160QAN, IPS, 2560x1600, 16", 240 Hz | Razer Blade 16 RTX 5080 ATNA60DL04-0, OLED, 2560x1600, 16", 240 Hz | Gigabyte Aero X16 1WH MNG007DA5-1, IPS, 2560x1600, 16", 165 Hz | MSI Vector A18 HX A9W AU Optronics B180QAN01.0, IPS, 2560x1600, 18", 240 Hz | Lenovo Legion Pro 7i 16 Gen 10 Samsung ATNA60HU01-0, OLED, 2560x1600, 16", 240 Hz | |
|---|---|---|---|---|---|---|
| Display | 1% | 4% | -17% | -0% | 3% | |
| Display P3 Coverage (%) | 96 | 98.3 2% | 99.3 3% | 68.7 -28% | 98.1 2% | 99.5 4% |
| sRGB Coverage (%) | 100 | 100 0% | 100 0% | 96.1 -4% | 99.9 0% | 100 0% |
| AdobeRGB 1998 Coverage (%) | 89.2 | 88.8 0% | 97.8 10% | 71.2 -20% | 86.3 -3% | 94.4 6% |
| Response Times | 6% | 94% | -64% | -2% | 94% | |
| Response Time Grey 50% / Grey 80% * (ms) | 4.8 ? | 3.9 ? 19% | 0.29 ? 94% | 12 ? -150% | 4.3 ? 10% | 0.28 ? 94% |
| Response Time Black / White * (ms) | 7.2 ? | 7.8 ? -8% | 0.4 ? 94% | 5.6 ? 22% | 8.1 ? -13% | 0.43 ? 94% |
| PWM Frequency (Hz) | 960 ? | 1438 ? | ||||
| PWM Amplitude * (%) | 44 | 29 | ||||
| Screen | 9% | 28% | 9% | 0% | 8% | |
| Brightness middle (cd/m²) | 554 | 348.4 -37% | 394.4 -29% | 395 -29% | 543 -2% | 490.4 -11% |
| Brightness (cd/m²) | 532 | 340 -36% | 401 -25% | 398 -25% | 502 -6% | 498 -6% |
| Brightness Distribution (%) | 88 | 90 2% | 97 10% | 97 10% | 86 -2% | 97 10% |
| Black Level * (cd/m²) | 0.52 | 0.33 37% | 0.32 38% | 0.56 -8% | ||
| Contrast (:1) | 1065 | 1056 -1% | 1234 16% | 970 -9% | ||
| Colorchecker dE 2000 * | 2.81 | 2.68 5% | 0.82 71% | 1.3 54% | 3.41 -21% | 3.2 -14% |
| Colorchecker dE 2000 max. * | 8.32 | 4.14 50% | 2.82 66% | 2.8 66% | 6.4 23% | 6.04 27% |
| Colorchecker dE 2000 calibrated * | 0.65 | 0.42 35% | 1.4 -115% | 0.66 -2% | 0.84 -29% | |
| Greyscale dE 2000 * | 4.7 | 3.4 28% | 1.1 77% | 1.8 62% | 3.4 28% | 1 79% |
| Gamma | 2.3 96% | 2.41 91% | 2.2 100% | 2.2 100% | 2.3 96% | 2.24 98% |
| CCT | 6476 100% | 6083 107% | 6424 101% | 6842 95% | 6070 107% | 6373 102% |
| Total Average (Program / Settings) | 5% /
7% | 42% /
34% | -24% /
-7% | -1% /
-0% | 35% /
21% |
* ... smaller is better
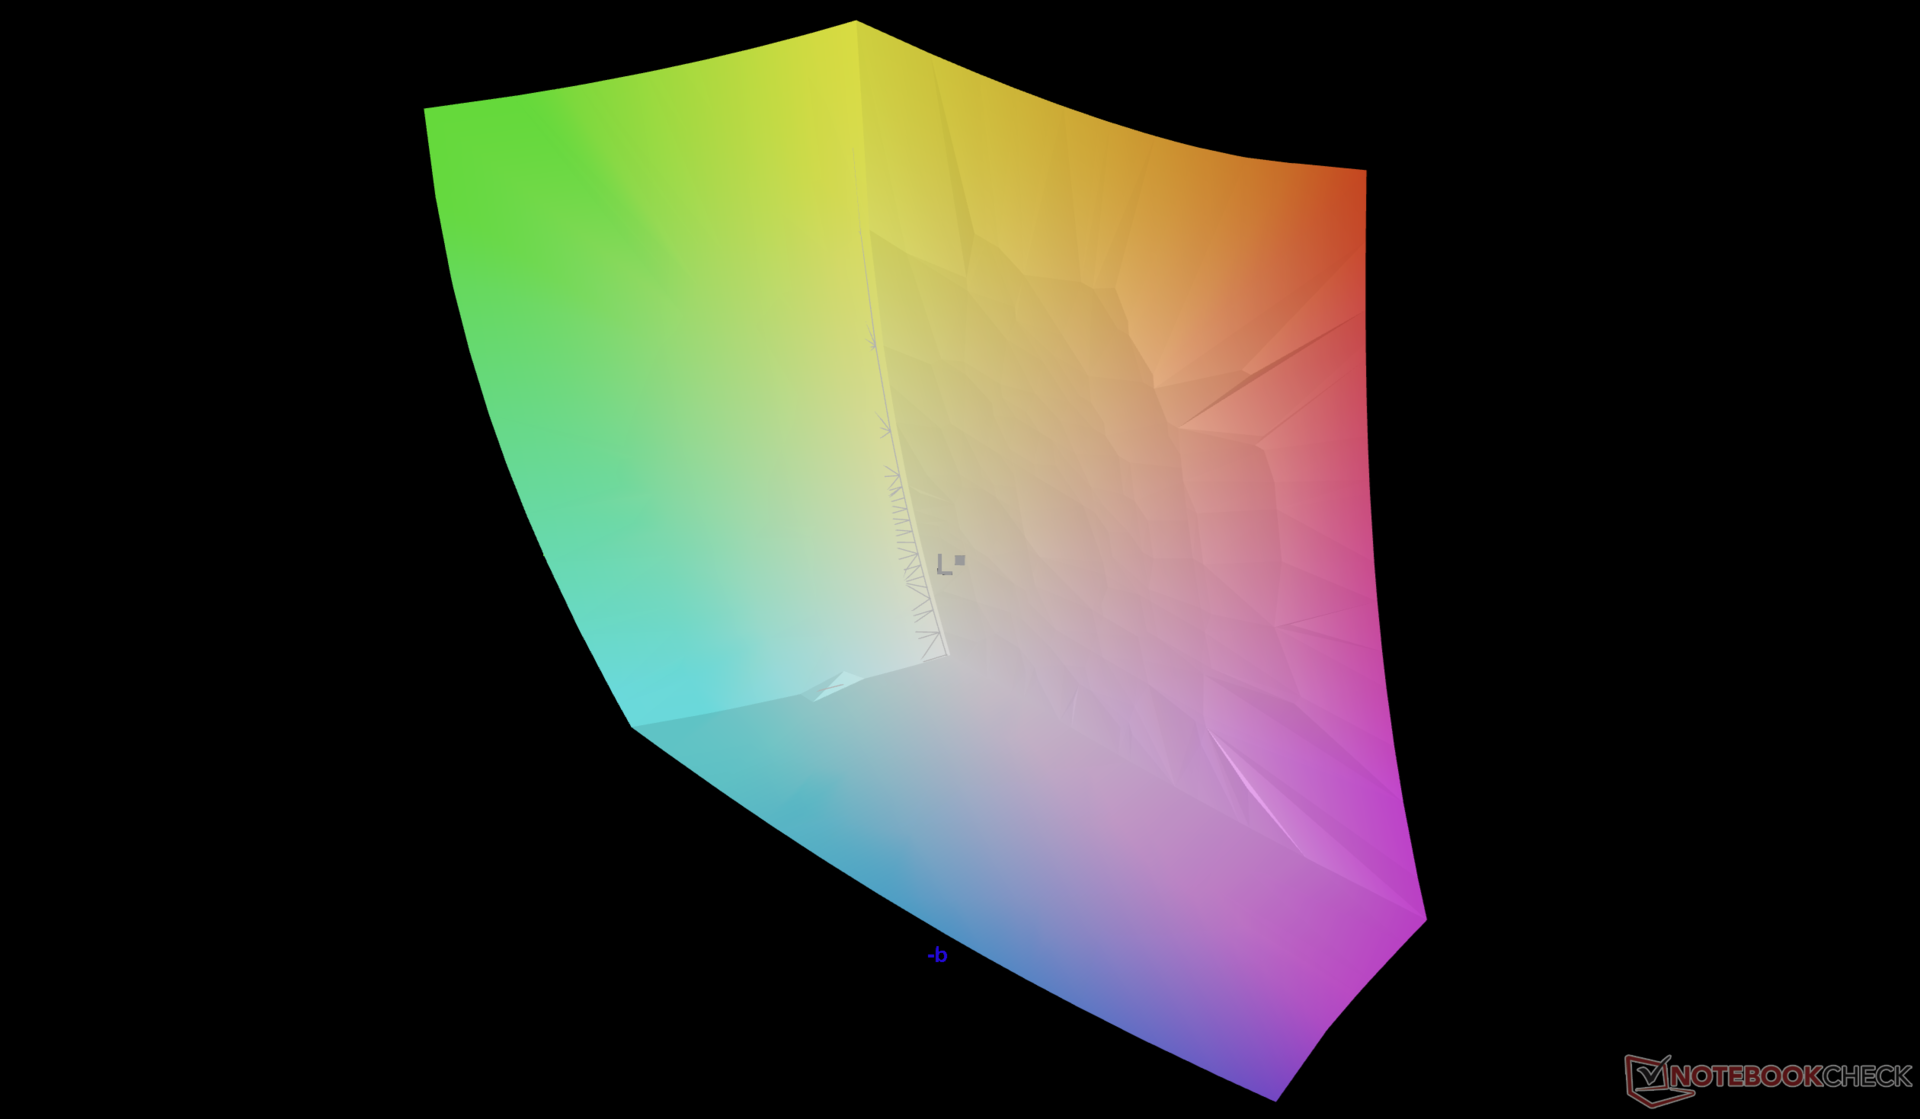
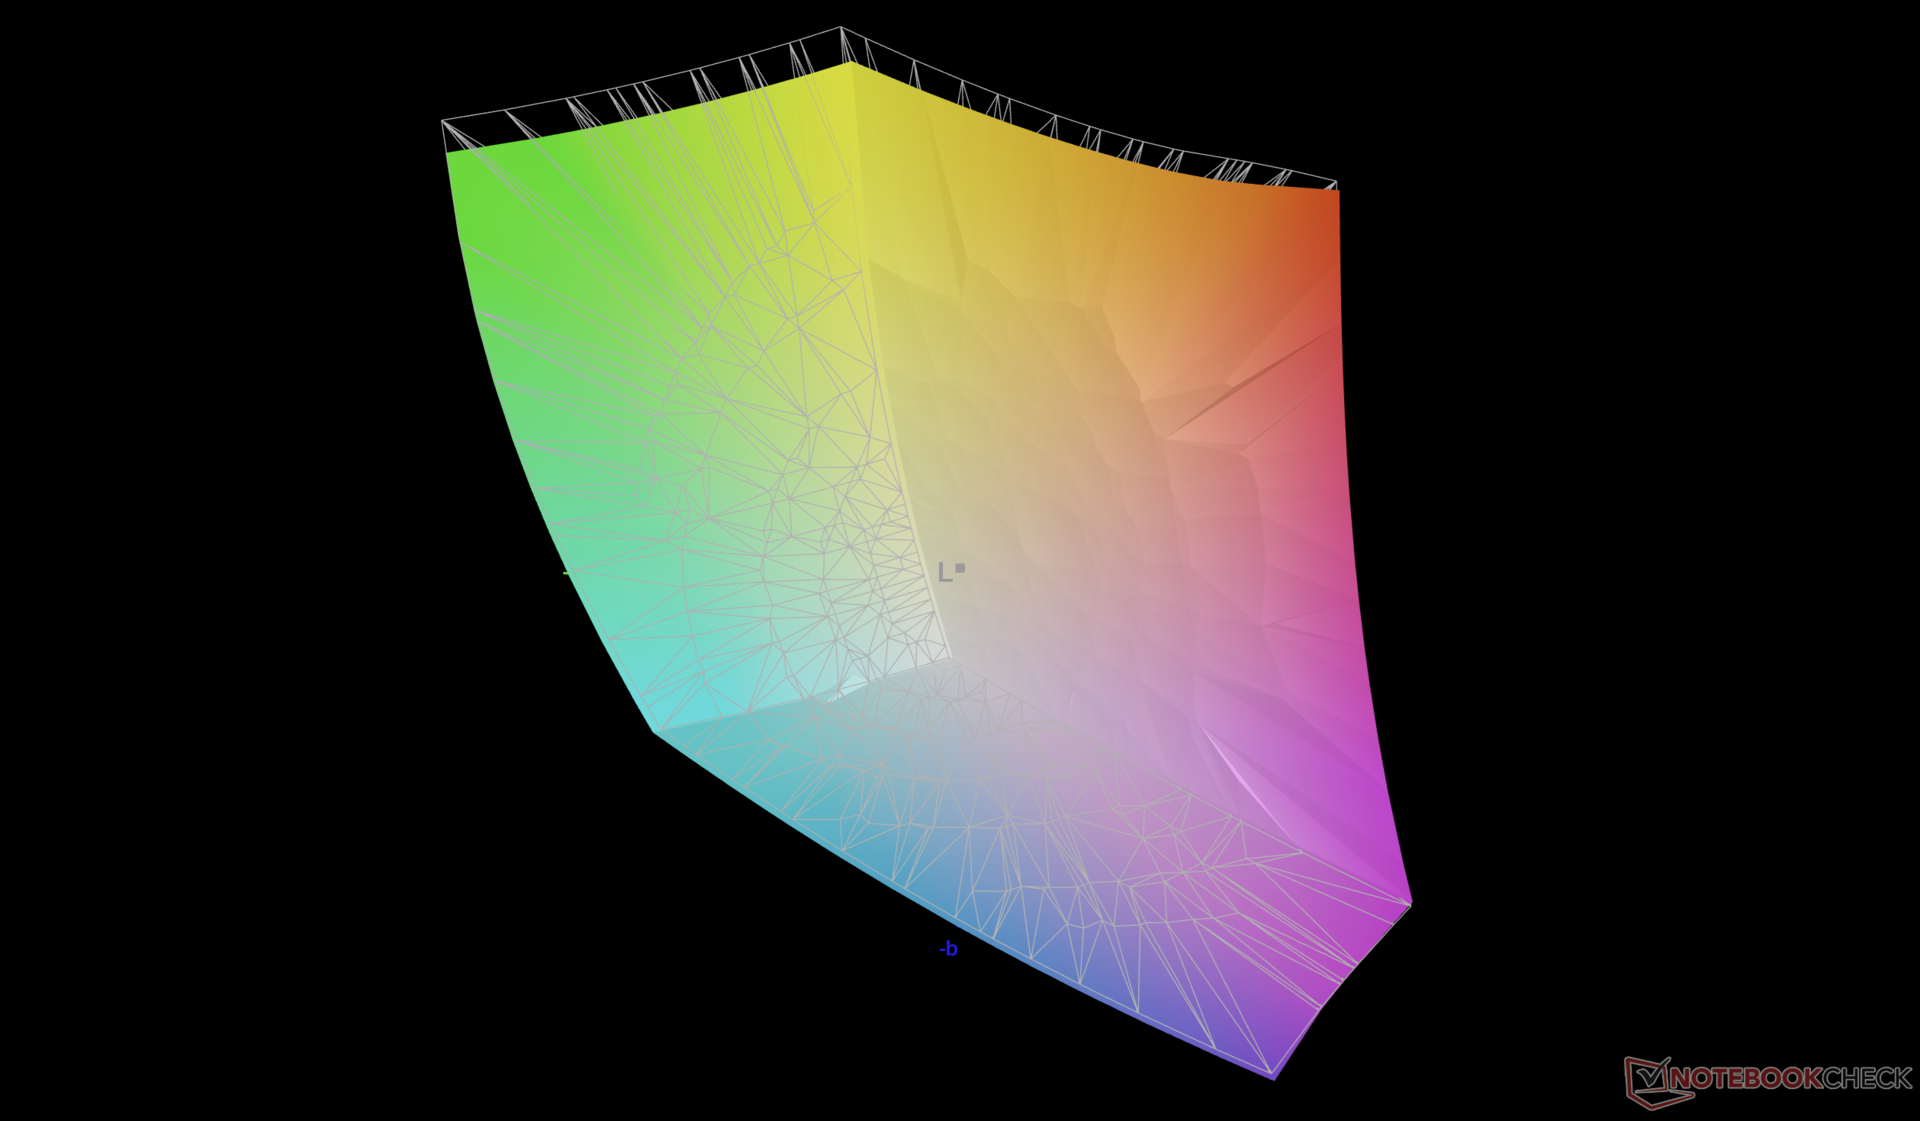
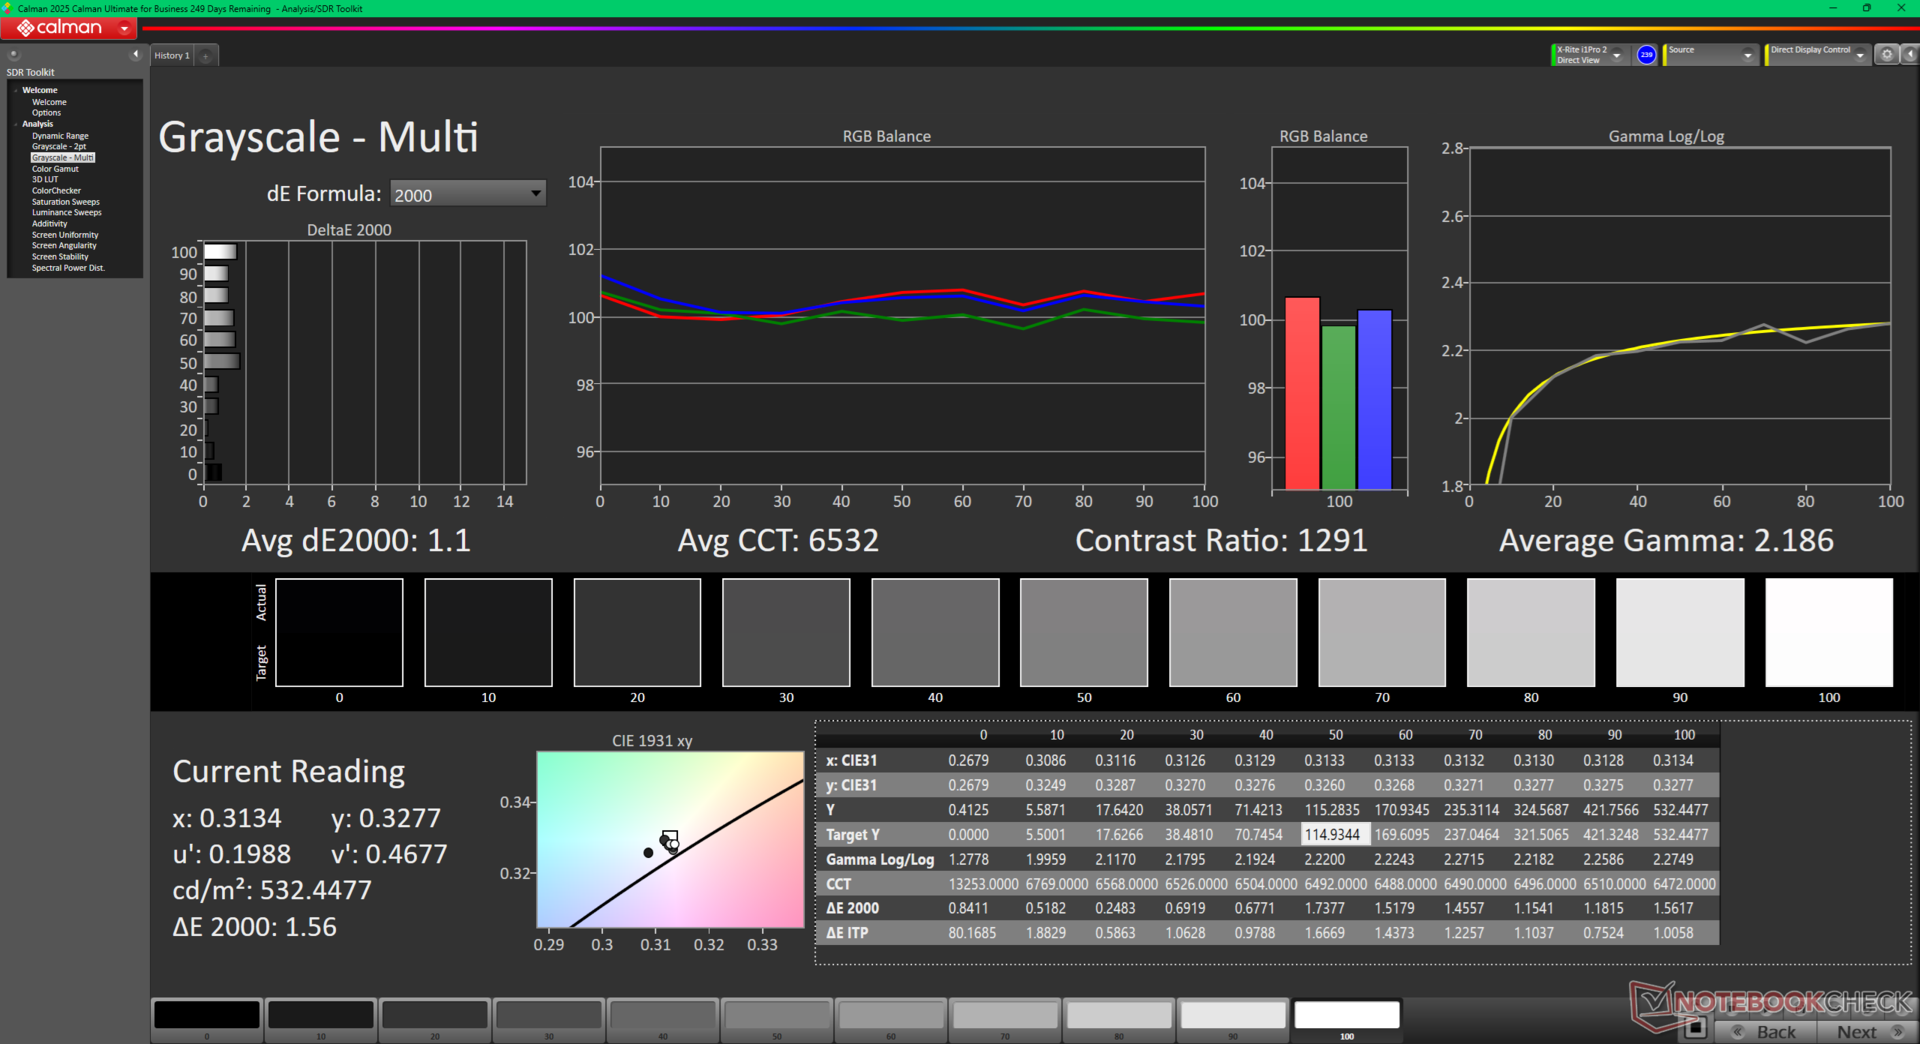
显示器开箱即按照 sRGB 标准校准,平均灰度值和 deltaE 值分别为 4.7 和 2.81。我们使用 X-Rite 色差计进行校准后,平均值将分别降至小于 1.0,从而更好地发挥全 P3 面板的性能。我们的校准 ICM 配置文件可在上面免费下载。
Display Response Times
| ↔ Response Time Black to White | ||
|---|---|---|
| 7.2 ms ... rise ↗ and fall ↘ combined | ↗ 3.8 ms rise | 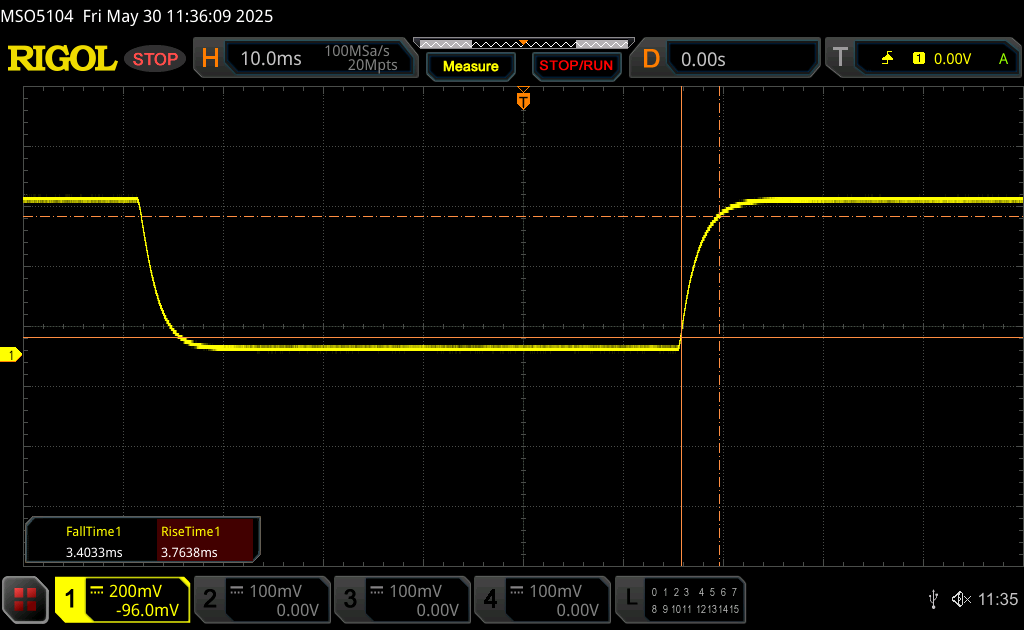 |
| ↘ 3.4 ms fall | ||
| The screen shows very fast response rates in our tests and should be very well suited for fast-paced gaming. In comparison, all tested devices range from 0.1 (minimum) to 240 (maximum) ms. » 21 % of all devices are better. This means that the measured response time is better than the average of all tested devices (19.8 ms). | ||
| ↔ Response Time 50% Grey to 80% Grey | ||
| 4.8 ms ... rise ↗ and fall ↘ combined | ↗ 2 ms rise | 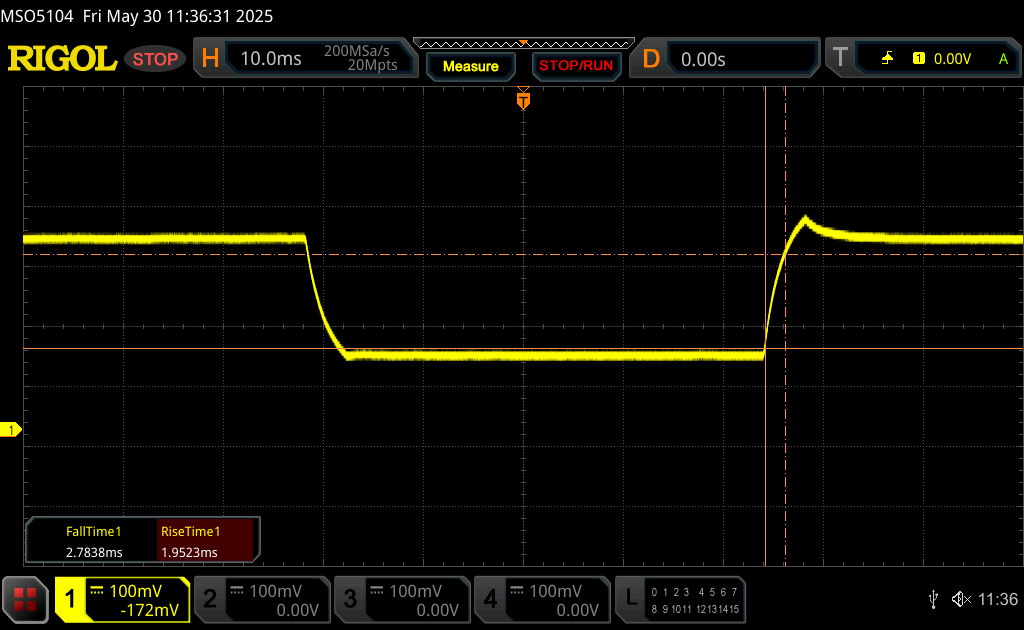 |
| ↘ 2.8 ms fall | ||
| The screen shows very fast response rates in our tests and should be very well suited for fast-paced gaming. In comparison, all tested devices range from 0.165 (minimum) to 636 (maximum) ms. » 17 % of all devices are better. This means that the measured response time is better than the average of all tested devices (31 ms). | ||
Screen Flickering / PWM (Pulse-Width Modulation)
| Screen flickering / PWM not detected | 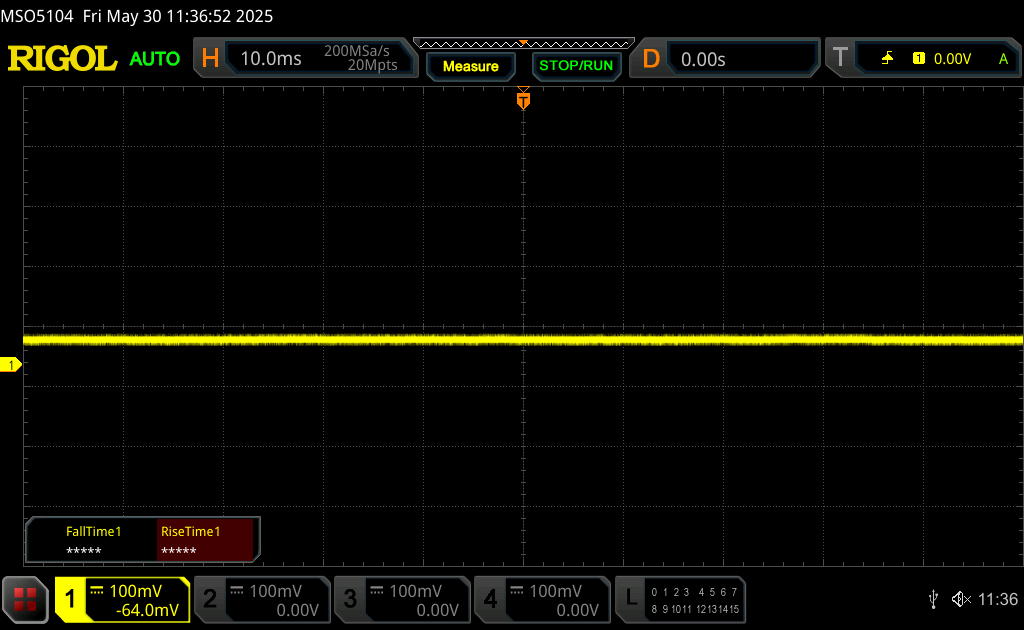 | ||
In comparison: 52 % of all tested devices do not use PWM to dim the display. If PWM was detected, an average of 7757 (minimum: 5 - maximum: 343500) Hz was measured. | |||
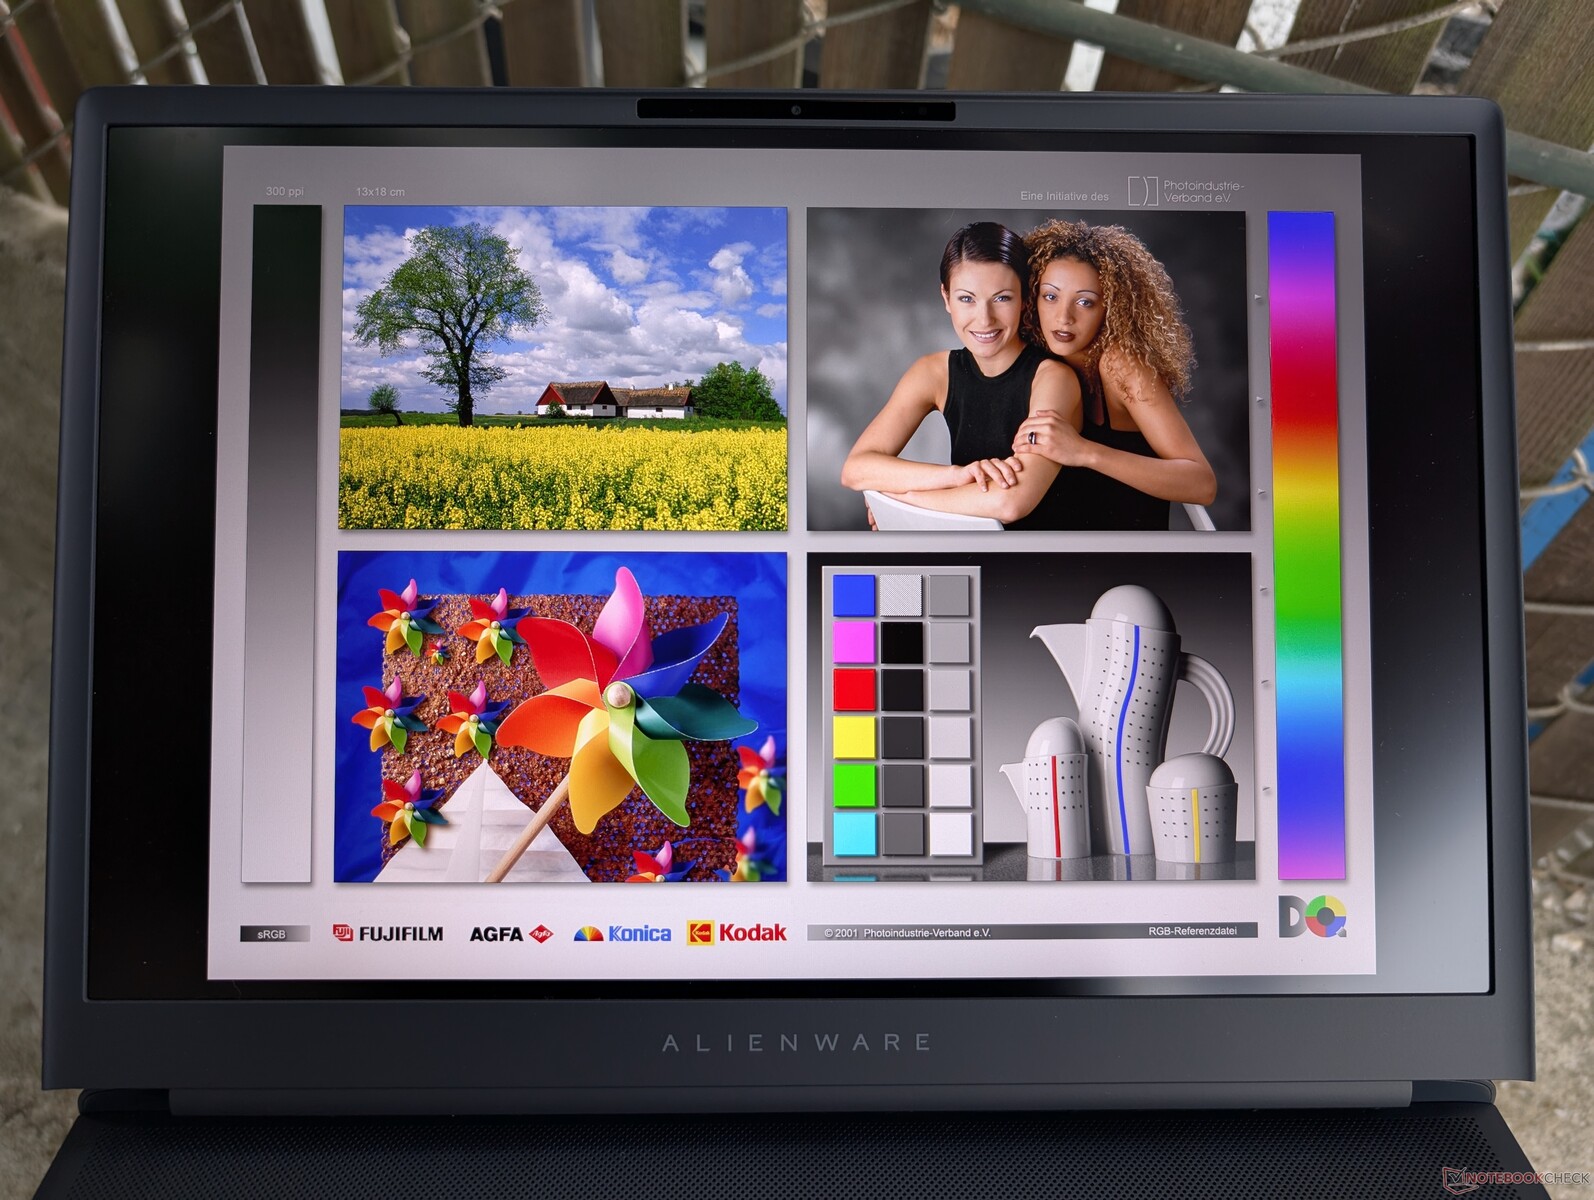
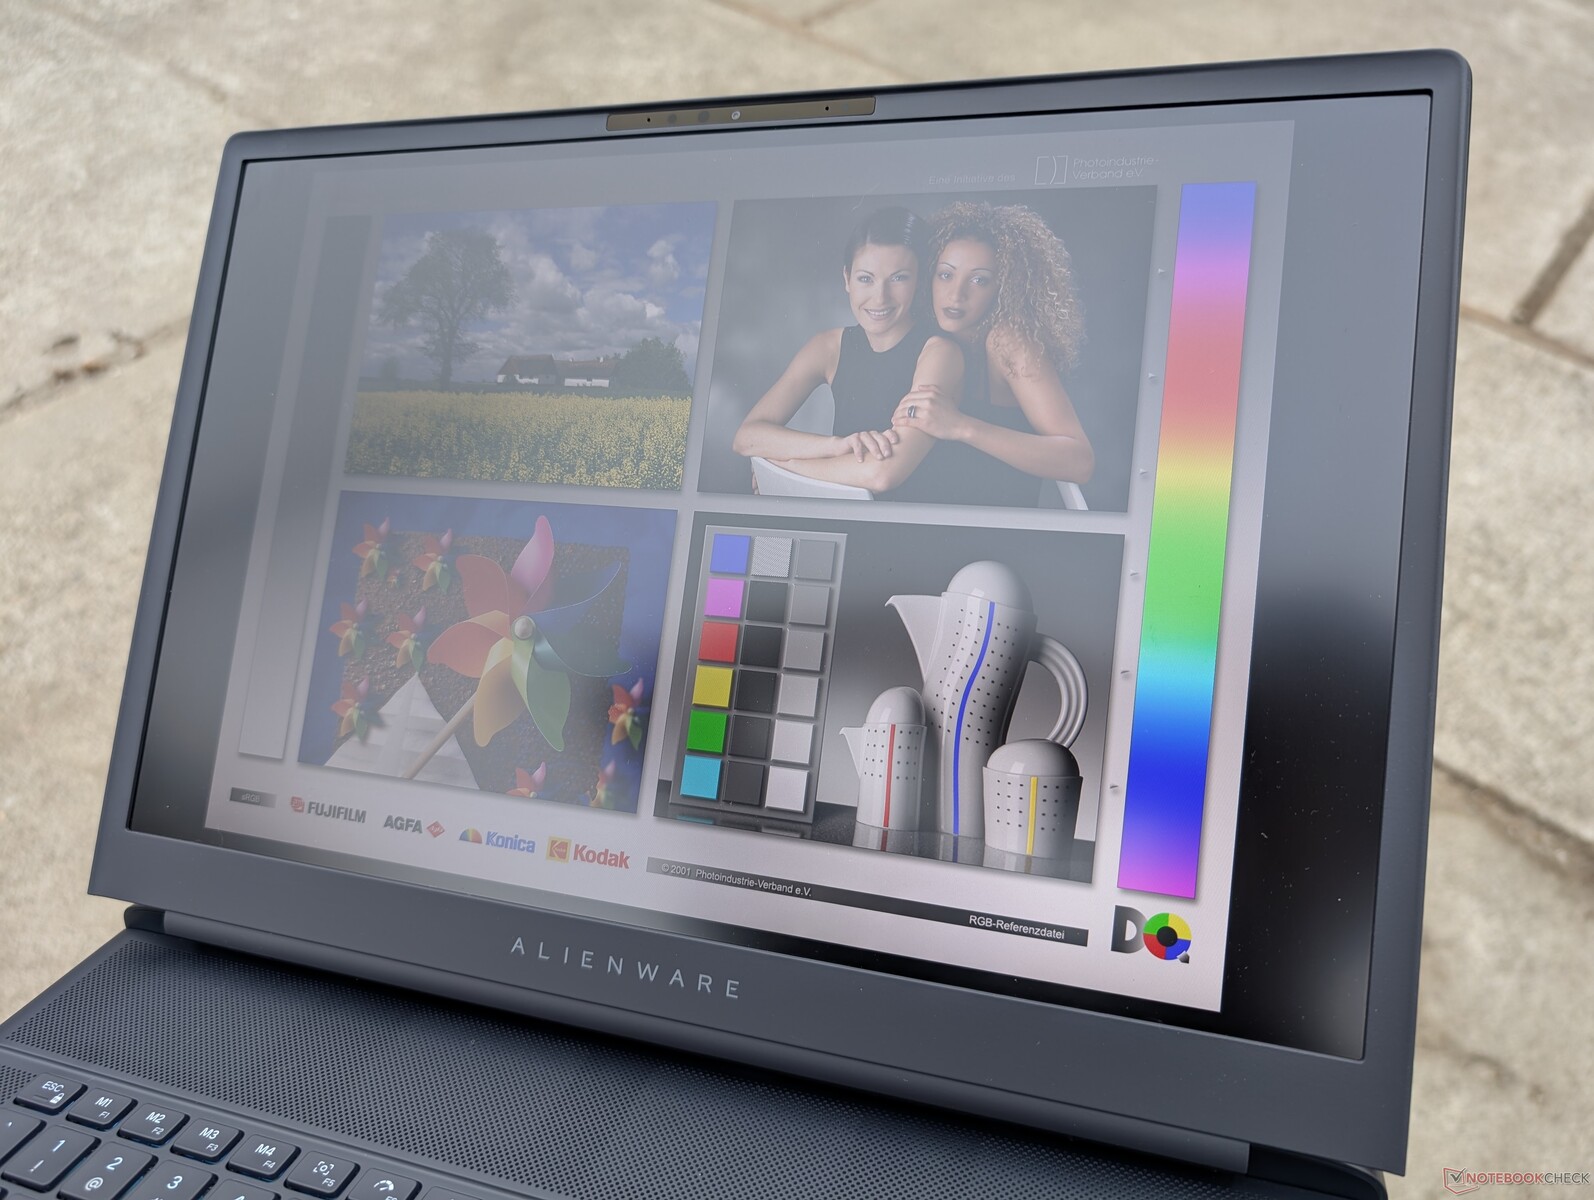
如果在阴凉处,室外能见度还不错。否则,在较亮的环境条件下,颜色会变得暗淡,更加难以辨认。

性能
测试条件
在运行以下基准测试之前,我们将 Alienware Command Center 设为性能模式。如果需要,还可以使用声音更大的 Turbo 模式来提升整体性能。
处理器
设置为性能模式时 酷睿至尊 9 275HX的运行速度比我们数据库中配备相同处理器的普通笔记本电脑慢 10%。因此,用户必须在更大音量的 Turbo 模式设置下运行系统,才能缩小这一差距。例如,在 Turbo 模式下重新运行 CineBench R15 xT 循环测试,平均得分将提高到 5557 分,这与我们在联想Legion Pro 7i 16 Gen 10 上观察到的结果更为接近。不过,多线程性能比 酷睿 i9-14900HX即使不在 Turbo 模式下运行。
Cinebench R15 Multi Loop
Cinebench R23: Multi Core | Single Core
Cinebench R20: CPU (Multi Core) | CPU (Single Core)
Cinebench R15: CPU Multi 64Bit | CPU Single 64Bit
Blender: v2.79 BMW27 CPU
7-Zip 18.03: 7z b 4 | 7z b 4 -mmt1
Geekbench 6.7: Multi-Core | Single-Core
Geekbench 5.5: Multi-Core | Single-Core
HWBOT x265 Benchmark v2.2: 4k Preset
LibreOffice : 20 Documents To PDF
R Benchmark 2.5: Overall mean
* ... smaller is better
AIDA64: FP32 Ray-Trace | FPU Julia | CPU SHA3 | CPU Queen | FPU SinJulia | FPU Mandel | CPU AES | CPU ZLib | FP64 Ray-Trace | CPU PhotoWorxx
| Performance rating | |
| MSI Vector A18 HX A9W | |
| Lenovo Legion Pro 7i 16 Gen 10 | |
| Average Intel Core Ultra 9 275HX | |
| Alienware 16 Area-51 | |
| Razer Blade 16 RTX 5080 | |
| Gigabyte Aero X16 1WH | |
| Alienware x16 R2 P120F | |
| AIDA64 / FP32 Ray-Trace | |
| MSI Vector A18 HX A9W | |
| Lenovo Legion Pro 7i 16 Gen 10 | |
| Average Intel Core Ultra 9 275HX (28039 - 39895, n=30) | |
| Alienware 16 Area-51 | |
| Razer Blade 16 RTX 5080 | |
| Gigabyte Aero X16 1WH | |
| Alienware x16 R2 P120F | |
| AIDA64 / FPU Julia | |
| MSI Vector A18 HX A9W | |
| Lenovo Legion Pro 7i 16 Gen 10 | |
| Average Intel Core Ultra 9 275HX (140254 - 200744, n=30) | |
| Alienware 16 Area-51 | |
| Razer Blade 16 RTX 5080 | |
| Gigabyte Aero X16 1WH | |
| Alienware x16 R2 P120F | |
| AIDA64 / CPU SHA3 | |
| MSI Vector A18 HX A9W | |
| Lenovo Legion Pro 7i 16 Gen 10 | |
| Average Intel Core Ultra 9 275HX (6710 - 9817, n=30) | |
| Alienware 16 Area-51 | |
| Razer Blade 16 RTX 5080 | |
| Alienware x16 R2 P120F | |
| Gigabyte Aero X16 1WH | |
| AIDA64 / CPU Queen | |
| MSI Vector A18 HX A9W | |
| Lenovo Legion Pro 7i 16 Gen 10 | |
| Average Intel Core Ultra 9 275HX (113887 - 140937, n=30) | |
| Alienware 16 Area-51 | |
| Alienware x16 R2 P120F | |
| Razer Blade 16 RTX 5080 | |
| Gigabyte Aero X16 1WH | |
| AIDA64 / FPU SinJulia | |
| MSI Vector A18 HX A9W | |
| Razer Blade 16 RTX 5080 | |
| Lenovo Legion Pro 7i 16 Gen 10 | |
| Gigabyte Aero X16 1WH | |
| Alienware 16 Area-51 | |
| Average Intel Core Ultra 9 275HX (11172 - 14425, n=30) | |
| Alienware x16 R2 P120F | |
| AIDA64 / FPU Mandel | |
| MSI Vector A18 HX A9W | |
| Lenovo Legion Pro 7i 16 Gen 10 | |
| Average Intel Core Ultra 9 275HX (72596 - 104508, n=30) | |
| Alienware 16 Area-51 | |
| Razer Blade 16 RTX 5080 | |
| Gigabyte Aero X16 1WH | |
| Alienware x16 R2 P120F | |
| AIDA64 / CPU AES | |
| MSI Vector A18 HX A9W | |
| Lenovo Legion Pro 7i 16 Gen 10 | |
| Average Intel Core Ultra 9 275HX (105608 - 247074, n=30) | |
| Alienware 16 Area-51 | |
| Alienware x16 R2 P120F | |
| Gigabyte Aero X16 1WH | |
| Razer Blade 16 RTX 5080 | |
| AIDA64 / CPU ZLib | |
| MSI Vector A18 HX A9W | |
| Lenovo Legion Pro 7i 16 Gen 10 | |
| Average Intel Core Ultra 9 275HX (1582 - 2263, n=30) | |
| Alienware 16 Area-51 | |
| Razer Blade 16 RTX 5080 | |
| Alienware x16 R2 P120F | |
| Gigabyte Aero X16 1WH | |
| AIDA64 / FP64 Ray-Trace | |
| MSI Vector A18 HX A9W | |
| Lenovo Legion Pro 7i 16 Gen 10 | |
| Average Intel Core Ultra 9 275HX (14847 - 21854, n=30) | |
| Alienware 16 Area-51 | |
| Razer Blade 16 RTX 5080 | |
| Gigabyte Aero X16 1WH | |
| Alienware x16 R2 P120F | |
| AIDA64 / CPU PhotoWorxx | |
| Lenovo Legion Pro 7i 16 Gen 10 | |
| Alienware 16 Area-51 | |
| Alienware x16 R2 P120F | |
| Razer Blade 16 RTX 5080 | |
| Average Intel Core Ultra 9 275HX (37482 - 62916, n=30) | |
| Gigabyte Aero X16 1WH | |
| MSI Vector A18 HX A9W | |
压力测试
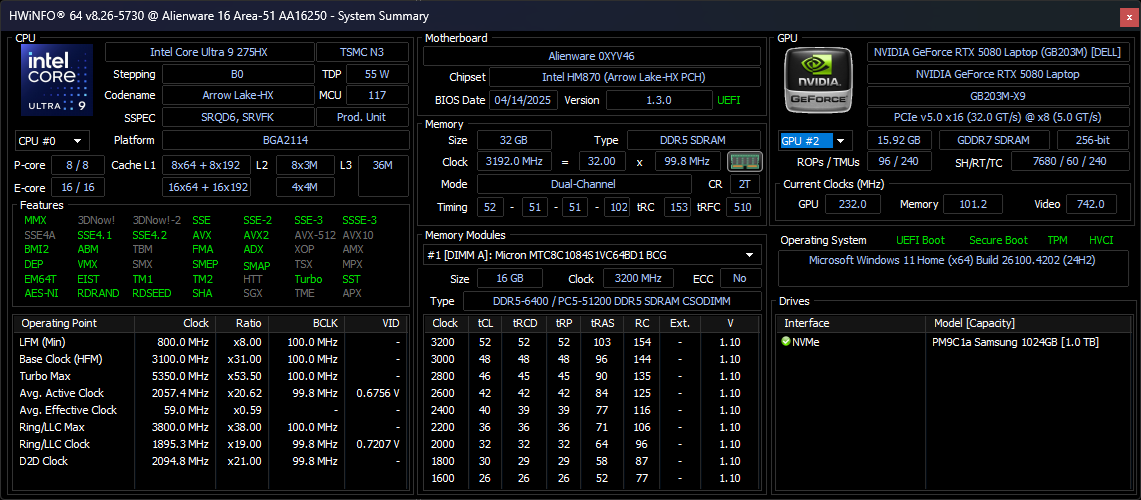
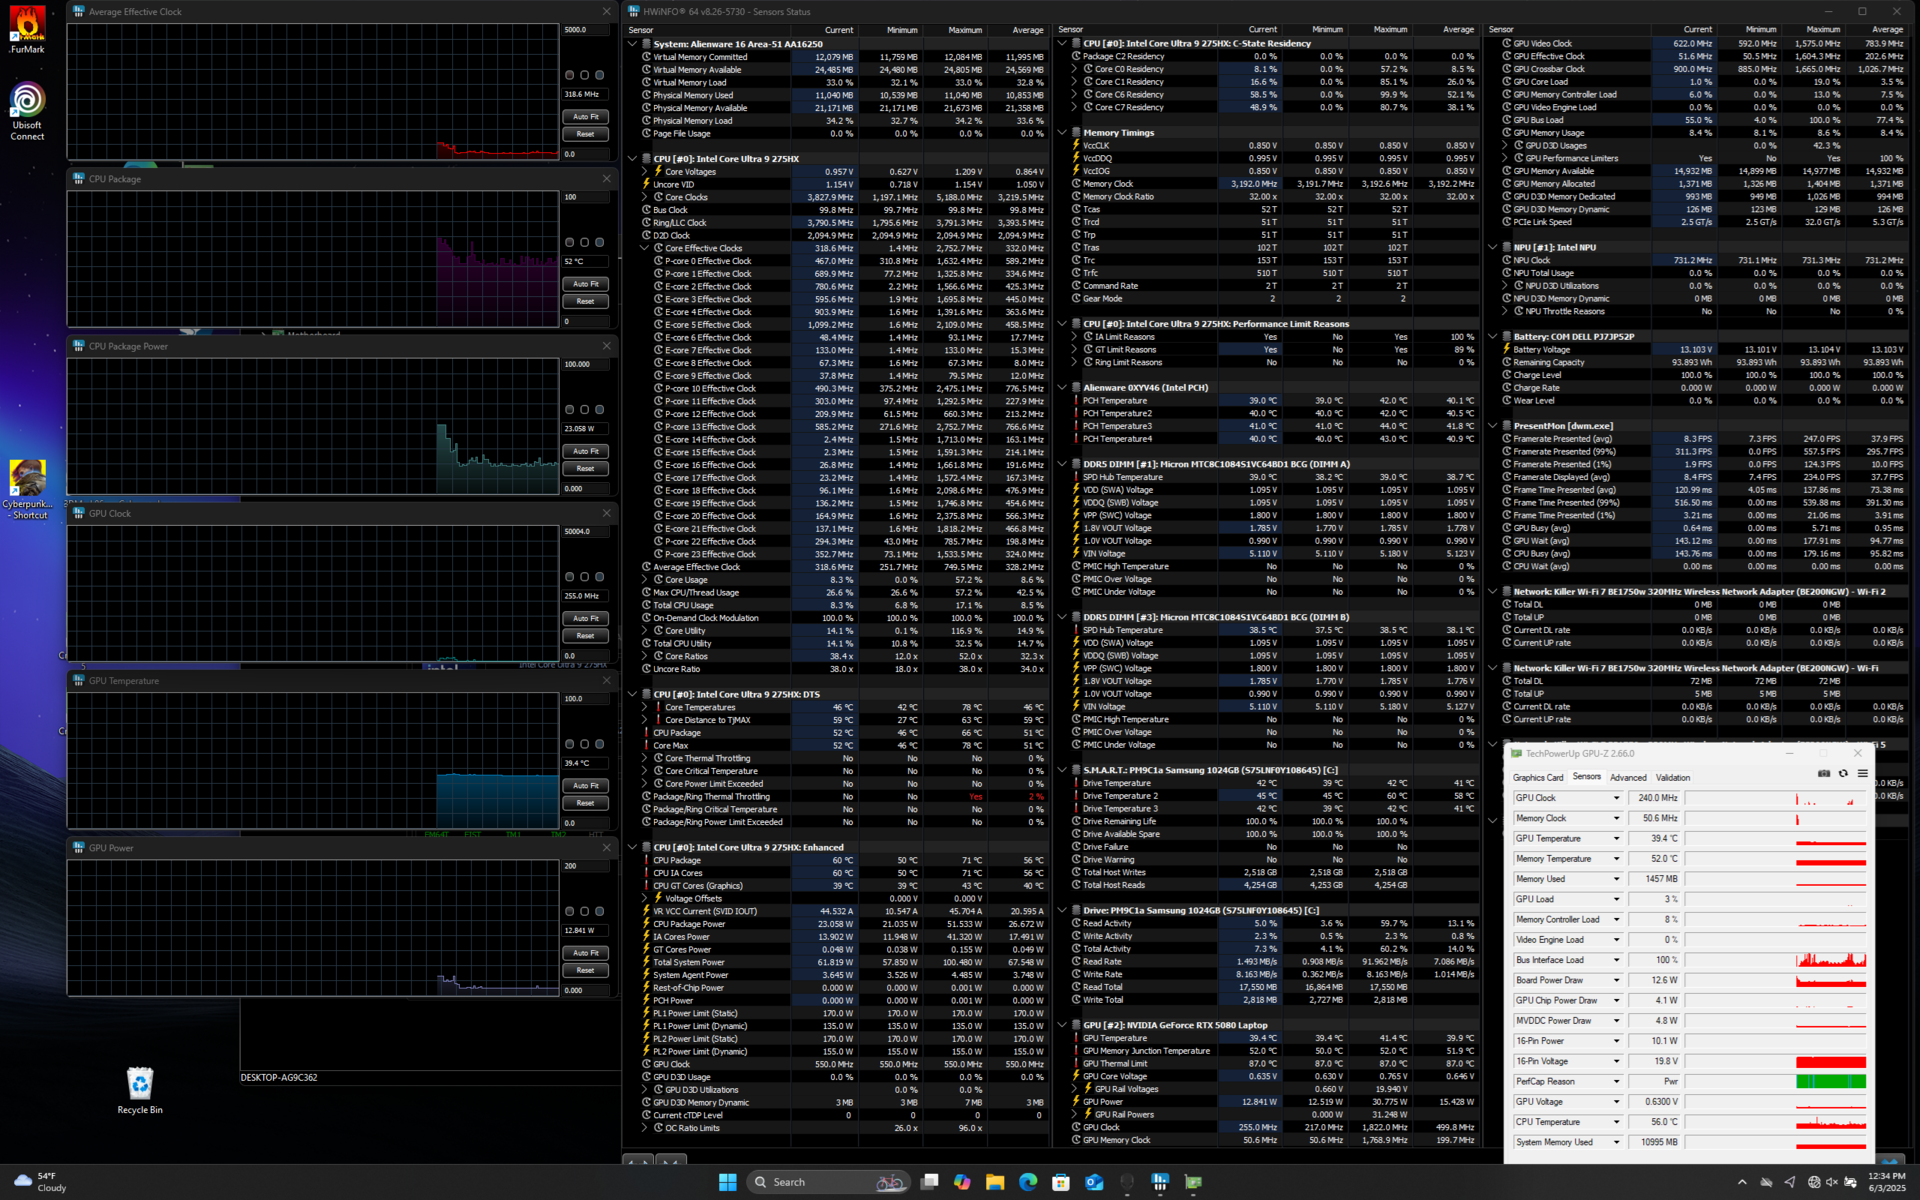
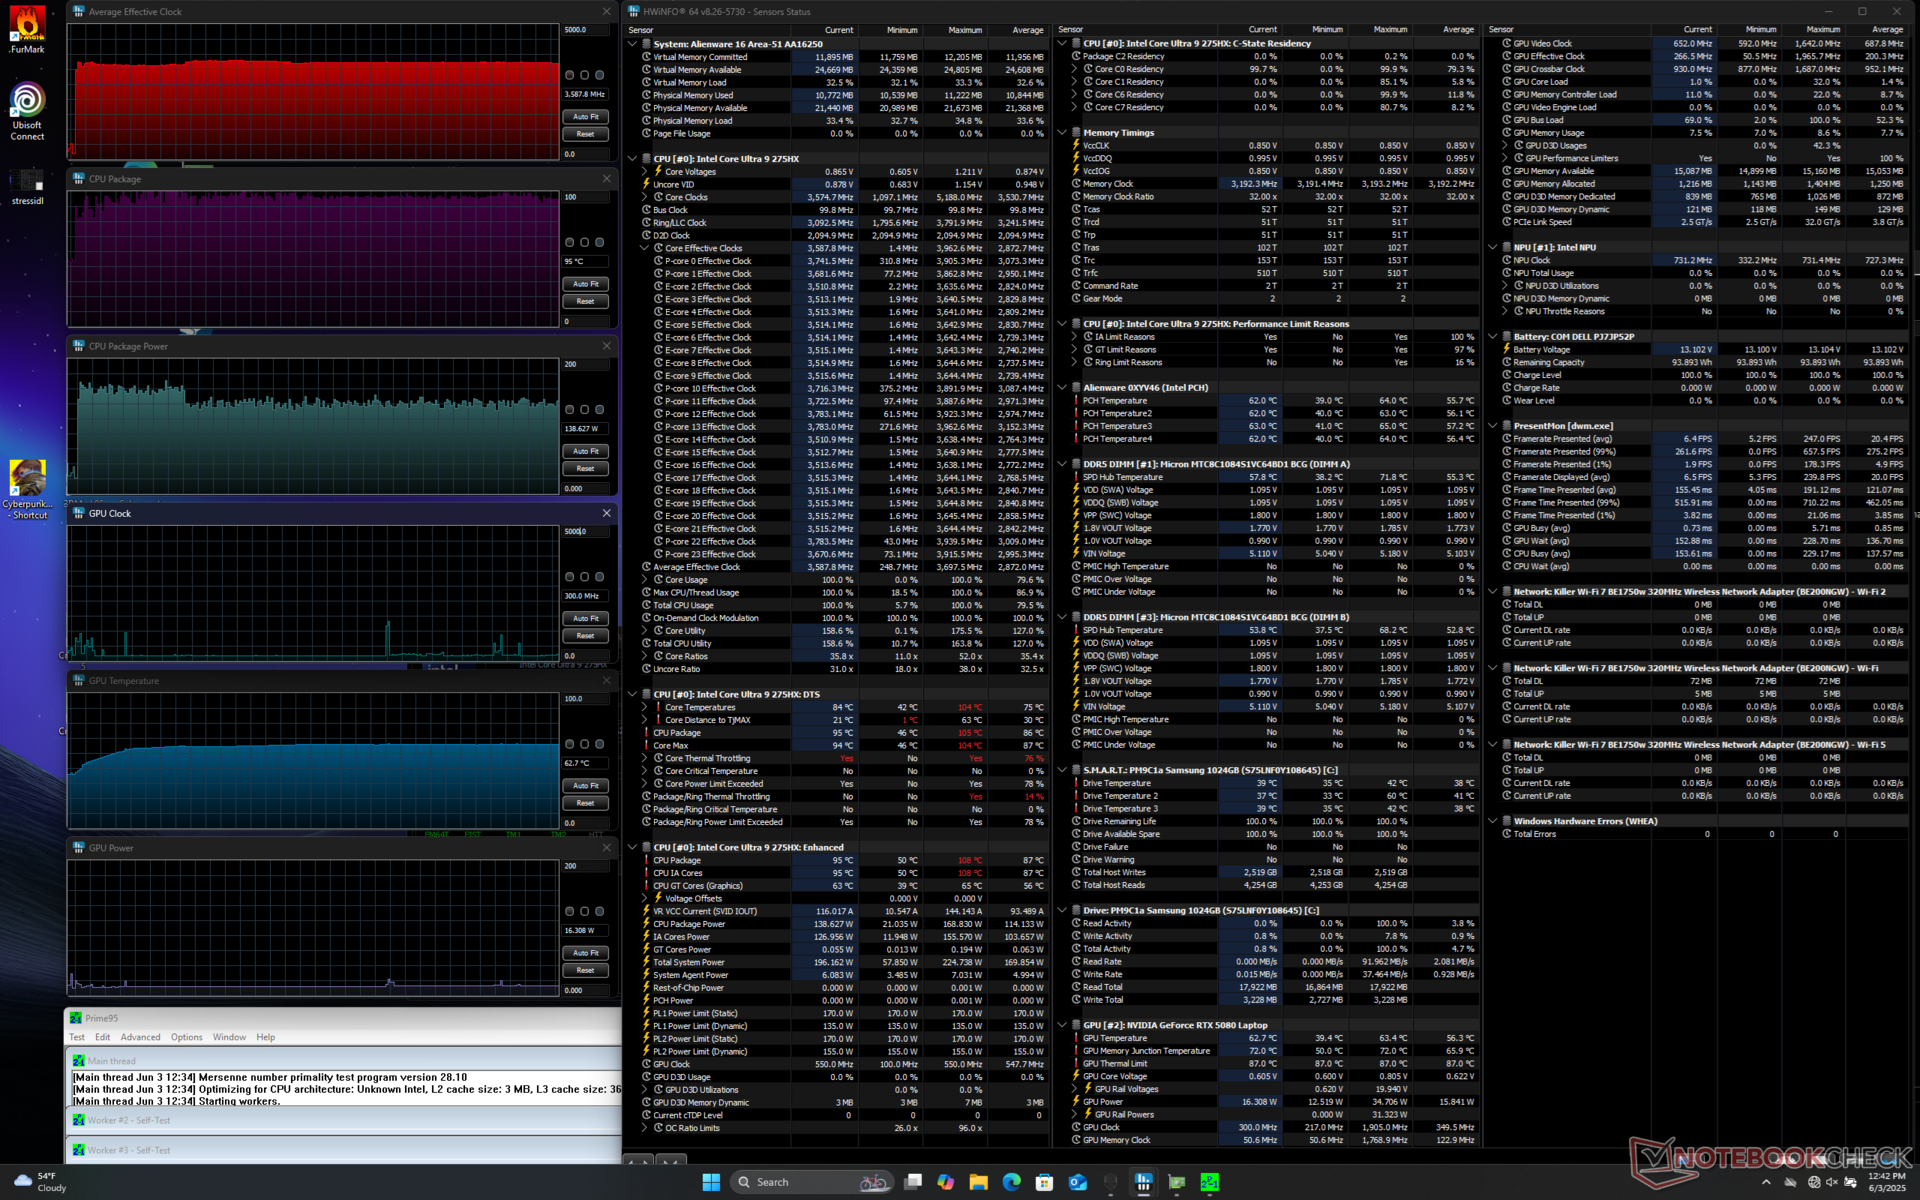
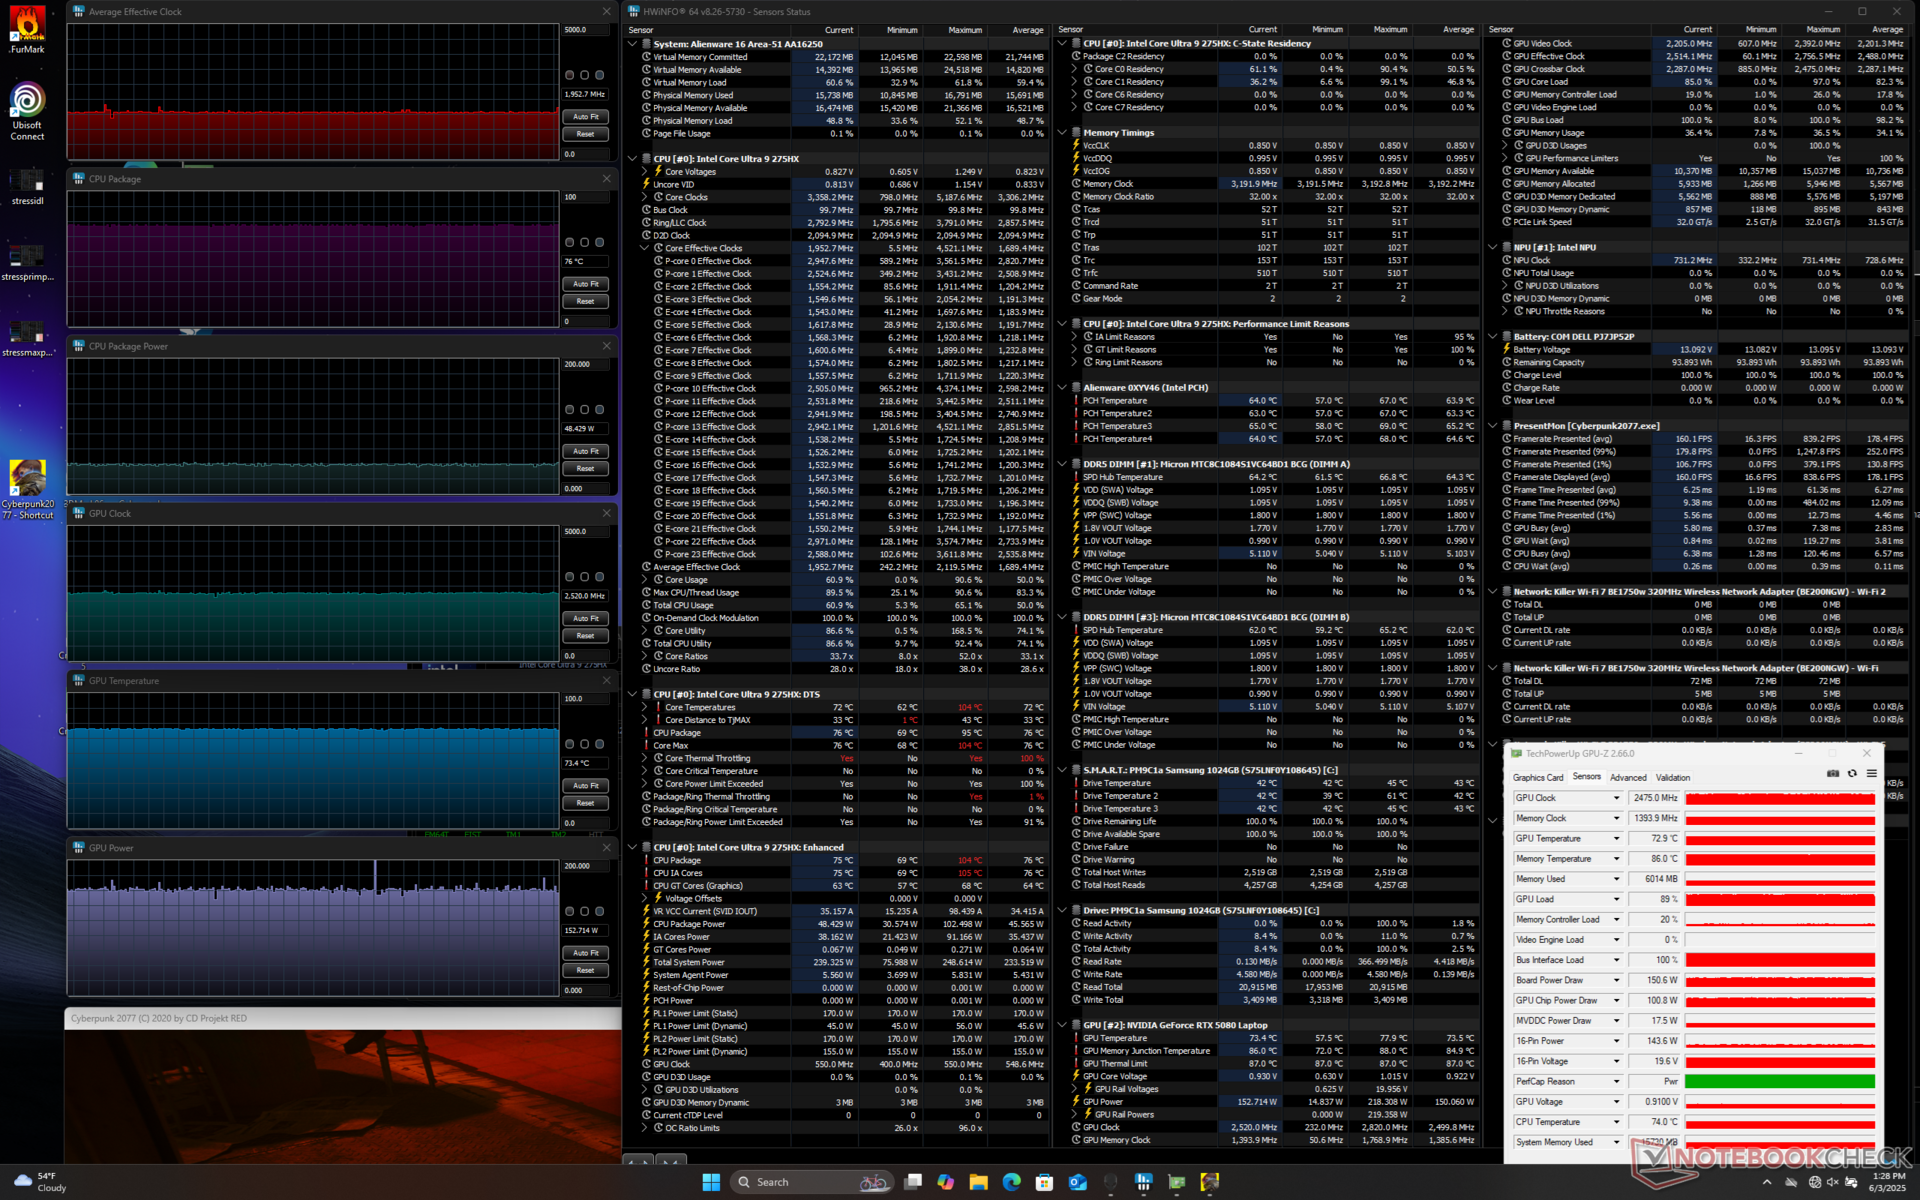
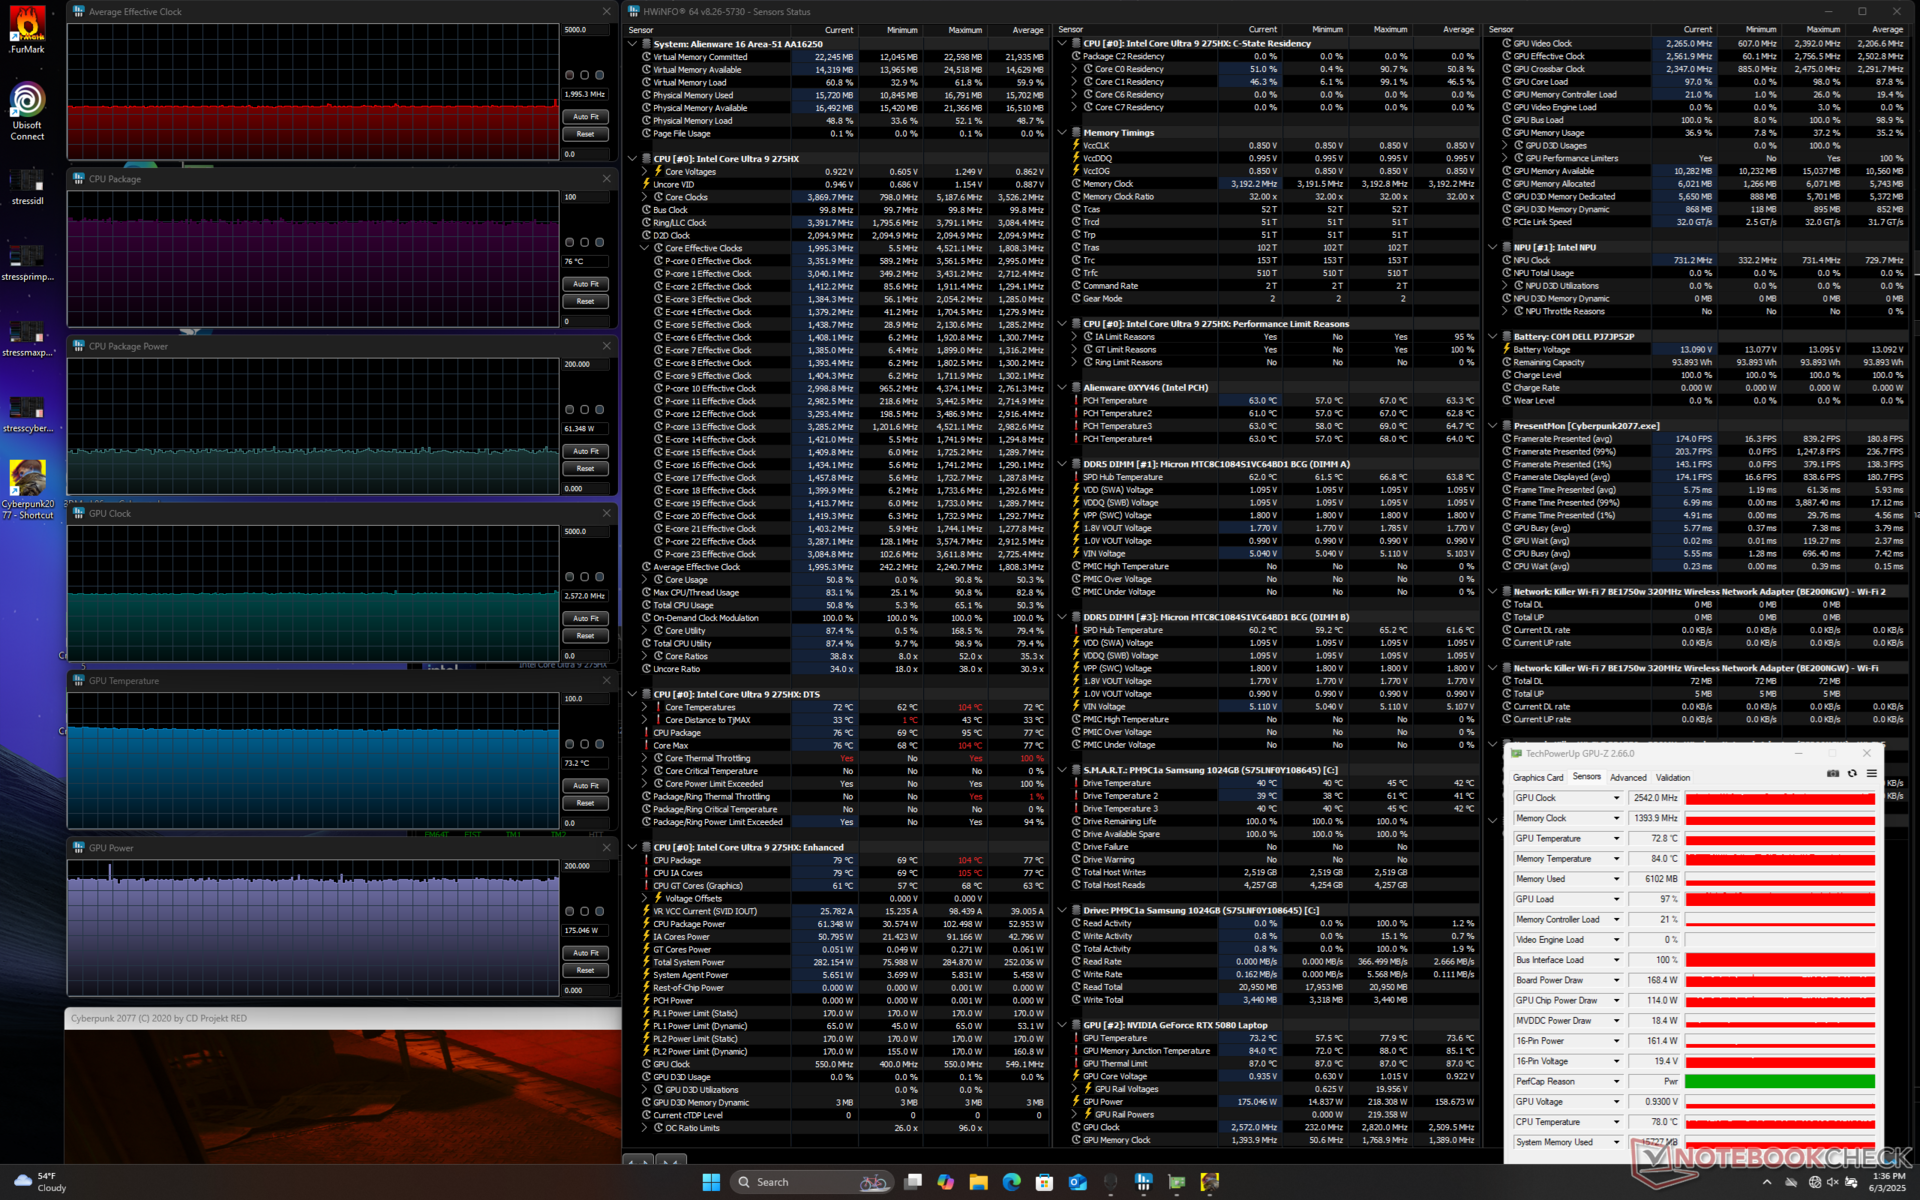
在性能模式下运行 Prime95 时,CPU 稳定在 3.6 GHz、约 140 W 和 95 C。在 Turbo 模式下,时钟频率和封装功率略有提高,分别为 3.8 GHz 和 ~150 W。同样,GPU 在性能模式下的功率上限为 150 瓦,而在 Turbo 模式下只能达到 175 瓦。由于 Turbo 模式下更快的性能被更大的风扇噪音所抵消,因此模式间的温度差异很小。

| CPU 时钟 (GHz) | GPU 时钟 (MHz) | CPU 平均温度 (°C) | GPU 平均温度 (°C) | |
| 系统闲置 | -- | -- | 52 | 39 |
| Prime95 压力(性能模式) | 3.6 | -- | 95 | 63 |
| Prime95 压力(Turbo 模式) | 3.8 | -- | 92 | 50 |
| Prime95 + FurMark Stress | 1.7 | 2032 | 76 | 74 |
| 赛博朋克 2077》压力(性能模式) | 2.0 | 2475 | 76 | 73 |
| 赛博朋克 2077 压力(涡轮增压模式) | 2.0 | 2542 | 76 | 73 |
系统性能
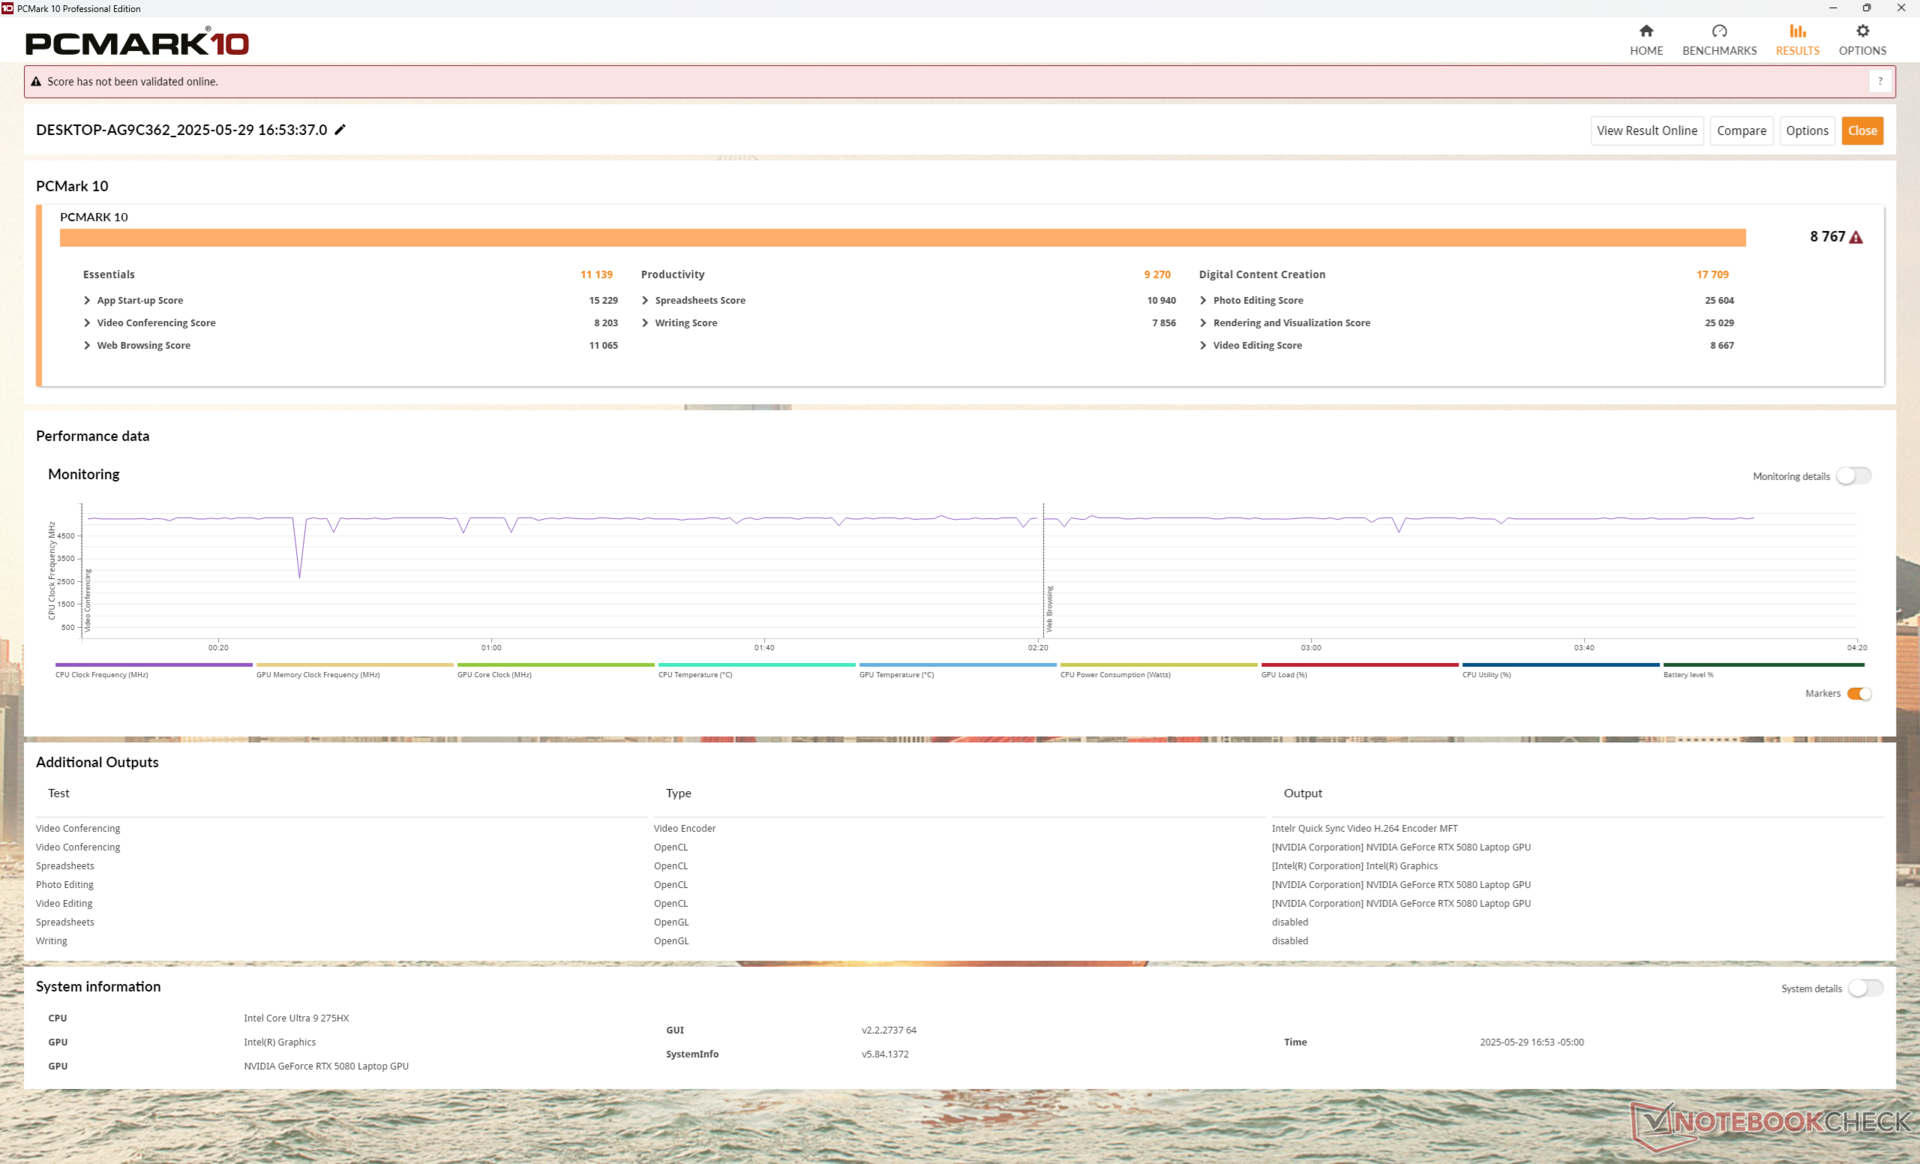
PCMark 分数始终高于即将停产的 Alienware x16 R2,与目前的竞争对手(如联想Legion Pro 7i 16 Gen 10)不相上下。
PCMark 10: Score | Essentials | Productivity | Digital Content Creation
CrossMark: Overall | Productivity | Creativity | Responsiveness
WebXPRT 3: Overall
WebXPRT 4: Overall
Mozilla Kraken 1.1: Total
| Performance rating | |
| MSI Vector A18 HX A9W | |
| Alienware 16 Area-51 | |
| Lenovo Legion Pro 7i 16 Gen 10 | |
| Average Intel Core Ultra 9 275HX, NVIDIA GeForce RTX 5080 Laptop | |
| Razer Blade 16 RTX 5080 -4! | |
| Gigabyte Aero X16 1WH | |
| Alienware x16 R2 P120F | |
| PCMark 10 / Score | |
| MSI Vector A18 HX A9W | |
| Lenovo Legion Pro 7i 16 Gen 10 | |
| Alienware 16 Area-51 | |
| Average Intel Core Ultra 9 275HX, NVIDIA GeForce RTX 5080 Laptop (7805 - 10409, n=9) | |
| Razer Blade 16 RTX 5080 | |
| Gigabyte Aero X16 1WH | |
| Alienware x16 R2 P120F | |
| PCMark 10 / Essentials | |
| MSI Vector A18 HX A9W | |
| Lenovo Legion Pro 7i 16 Gen 10 | |
| Alienware 16 Area-51 | |
| Average Intel Core Ultra 9 275HX, NVIDIA GeForce RTX 5080 Laptop (10206 - 11472, n=9) | |
| Razer Blade 16 RTX 5080 | |
| Gigabyte Aero X16 1WH | |
| Alienware x16 R2 P120F | |
| PCMark 10 / Productivity | |
| MSI Vector A18 HX A9W | |
| Average Intel Core Ultra 9 275HX, NVIDIA GeForce RTX 5080 Laptop (8319 - 20616, n=9) | |
| Gigabyte Aero X16 1WH | |
| Razer Blade 16 RTX 5080 | |
| Lenovo Legion Pro 7i 16 Gen 10 | |
| Alienware 16 Area-51 | |
| Alienware x16 R2 P120F | |
| PCMark 10 / Digital Content Creation | |
| Lenovo Legion Pro 7i 16 Gen 10 | |
| MSI Vector A18 HX A9W | |
| Alienware 16 Area-51 | |
| Average Intel Core Ultra 9 275HX, NVIDIA GeForce RTX 5080 Laptop (10505 - 19351, n=9) | |
| Razer Blade 16 RTX 5080 | |
| Alienware x16 R2 P120F | |
| Gigabyte Aero X16 1WH | |
| CrossMark / Overall | |
| MSI Vector A18 HX A9W | |
| Alienware 16 Area-51 | |
| Average Intel Core Ultra 9 275HX, NVIDIA GeForce RTX 5080 Laptop (1857 - 2244, n=9) | |
| Lenovo Legion Pro 7i 16 Gen 10 | |
| Gigabyte Aero X16 1WH | |
| Alienware x16 R2 P120F | |
| CrossMark / Productivity | |
| Alienware 16 Area-51 | |
| Average Intel Core Ultra 9 275HX, NVIDIA GeForce RTX 5080 Laptop (1764 - 2122, n=9) | |
| MSI Vector A18 HX A9W | |
| Lenovo Legion Pro 7i 16 Gen 10 | |
| Gigabyte Aero X16 1WH | |
| Alienware x16 R2 P120F | |
| CrossMark / Creativity | |
| MSI Vector A18 HX A9W | |
| Alienware 16 Area-51 | |
| Average Intel Core Ultra 9 275HX, NVIDIA GeForce RTX 5080 Laptop (2115 - 2498, n=9) | |
| Lenovo Legion Pro 7i 16 Gen 10 | |
| Gigabyte Aero X16 1WH | |
| Alienware x16 R2 P120F | |
| CrossMark / Responsiveness | |
| Alienware 16 Area-51 | |
| Average Intel Core Ultra 9 275HX, NVIDIA GeForce RTX 5080 Laptop (1466 - 2096, n=9) | |
| MSI Vector A18 HX A9W | |
| Alienware x16 R2 P120F | |
| Lenovo Legion Pro 7i 16 Gen 10 | |
| Gigabyte Aero X16 1WH | |
| WebXPRT 3 / Overall | |
| MSI Vector A18 HX A9W | |
| Lenovo Legion Pro 7i 16 Gen 10 | |
| Alienware 16 Area-51 | |
| Average Intel Core Ultra 9 275HX, NVIDIA GeForce RTX 5080 Laptop (306 - 378, n=9) | |
| Gigabyte Aero X16 1WH | |
| Razer Blade 16 RTX 5080 | |
| Alienware x16 R2 P120F | |
| WebXPRT 4 / Overall | |
| Lenovo Legion Pro 7i 16 Gen 10 | |
| Alienware 16 Area-51 | |
| Average Intel Core Ultra 9 275HX, NVIDIA GeForce RTX 5080 Laptop (285 - 336, n=9) | |
| MSI Vector A18 HX A9W | |
| Gigabyte Aero X16 1WH | |
| Razer Blade 16 RTX 5080 | |
| Alienware x16 R2 P120F | |
| Mozilla Kraken 1.1 / Total | |
| Alienware x16 R2 P120F | |
| Gigabyte Aero X16 1WH | |
| Razer Blade 16 RTX 5080 | |
| Average Intel Core Ultra 9 275HX, NVIDIA GeForce RTX 5080 Laptop (405 - 432, n=9) | |
| Alienware 16 Area-51 | |
| Lenovo Legion Pro 7i 16 Gen 10 | |
| MSI Vector A18 HX A9W | |
* ... smaller is better
| PCMark 10 Score | 8767 points | |
Help | ||
| AIDA64 / Memory Copy | |
| Razer Blade 16 RTX 5080 | |
| Alienware x16 R2 P120F | |
| Alienware 16 Area-51 | |
| Lenovo Legion Pro 7i 16 Gen 10 | |
| Average Intel Core Ultra 9 275HX (56003 - 94460, n=30) | |
| Gigabyte Aero X16 1WH | |
| MSI Vector A18 HX A9W | |
| AIDA64 / Memory Read | |
| Razer Blade 16 RTX 5080 | |
| Lenovo Legion Pro 7i 16 Gen 10 | |
| Alienware 16 Area-51 | |
| Alienware x16 R2 P120F | |
| Average Intel Core Ultra 9 275HX (55795 - 97151, n=30) | |
| MSI Vector A18 HX A9W | |
| Gigabyte Aero X16 1WH | |
| AIDA64 / Memory Write | |
| Razer Blade 16 RTX 5080 | |
| Gigabyte Aero X16 1WH | |
| Lenovo Legion Pro 7i 16 Gen 10 | |
| Alienware 16 Area-51 | |
| Average Intel Core Ultra 9 275HX (55663 - 116129, n=30) | |
| Alienware x16 R2 P120F | |
| MSI Vector A18 HX A9W | |
| AIDA64 / Memory Latency | |
| Alienware x16 R2 P120F | |
| Alienware 16 Area-51 | |
| Average Intel Core Ultra 9 275HX (105.8 - 161.6, n=30) | |
| Lenovo Legion Pro 7i 16 Gen 10 | |
| Razer Blade 16 RTX 5080 | |
| MSI Vector A18 HX A9W | |
| Gigabyte Aero X16 1WH | |
* ... smaller is better
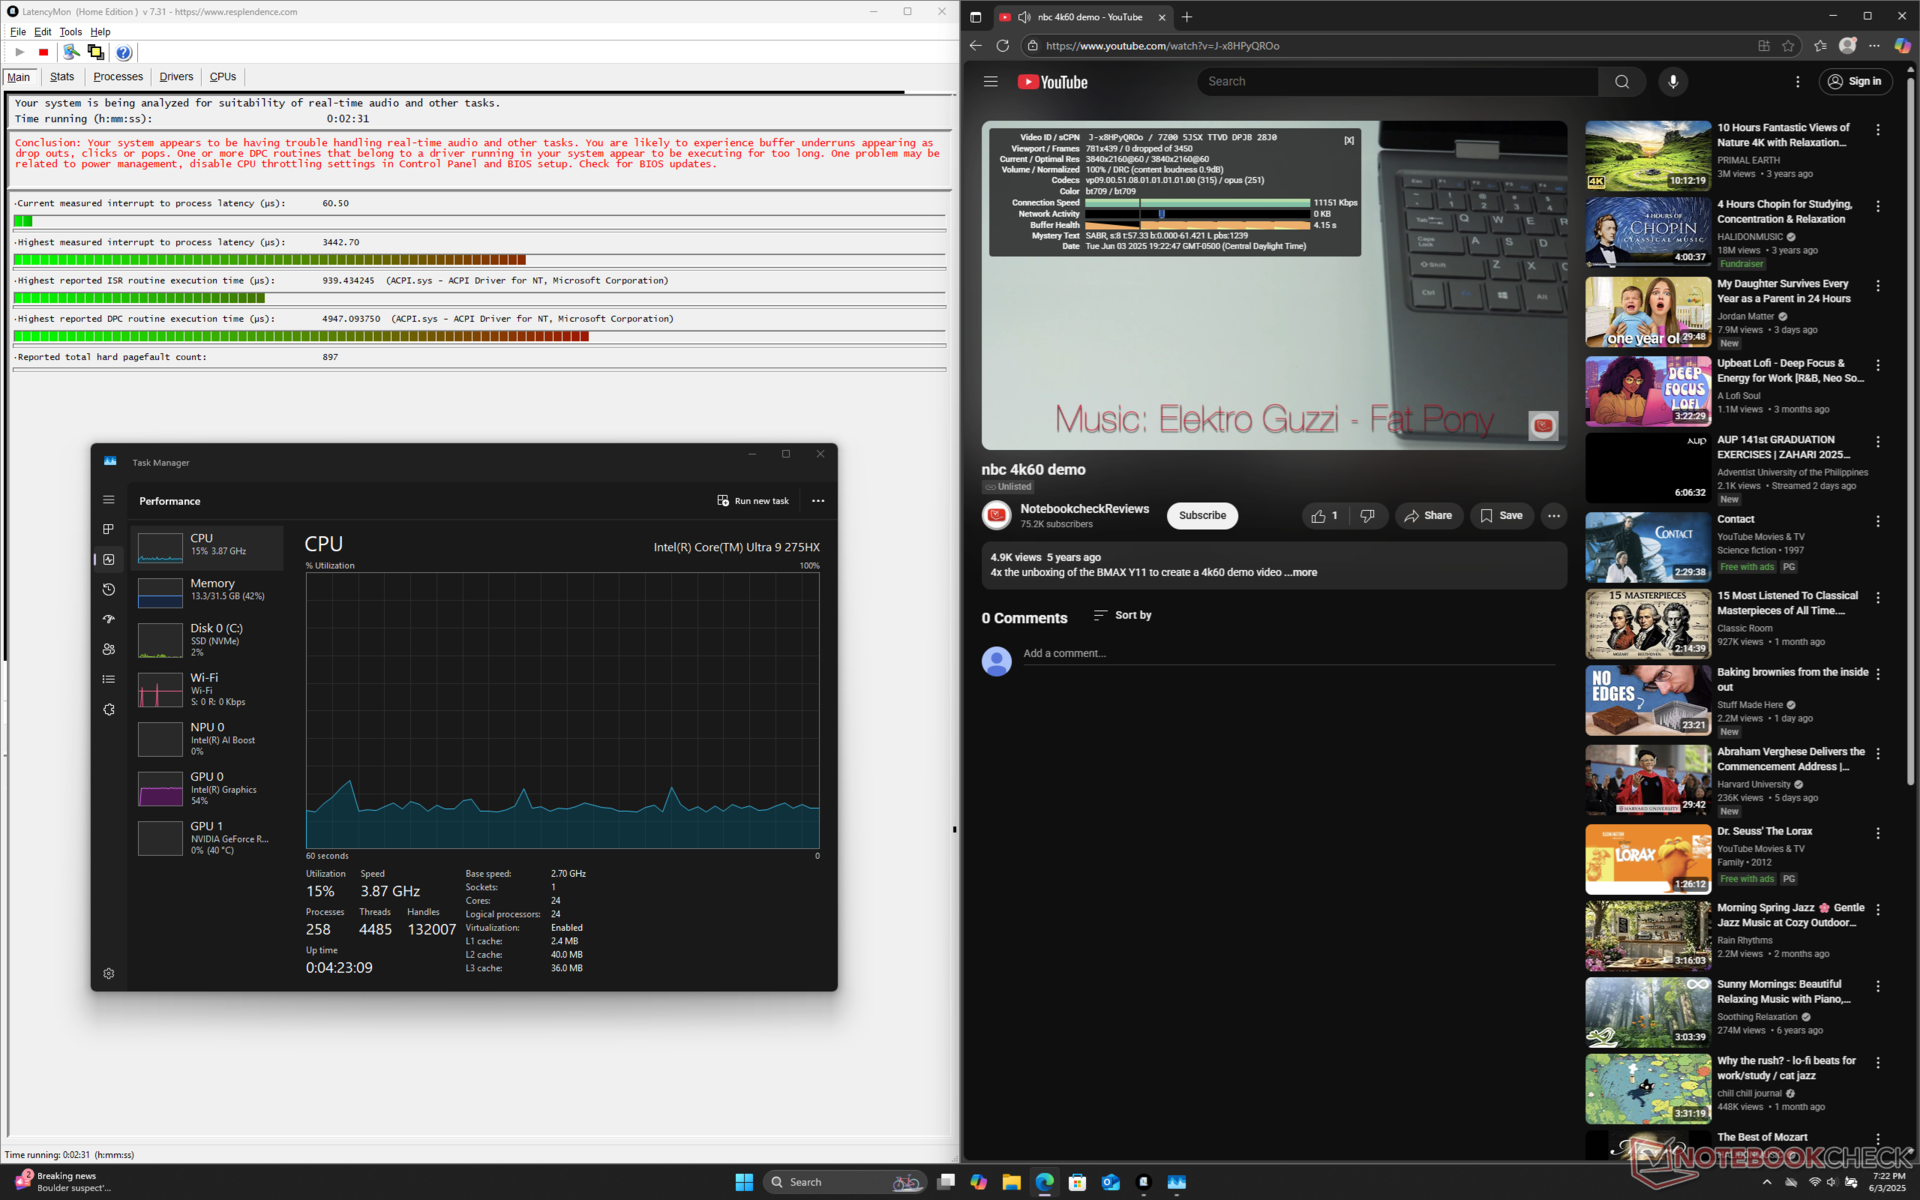
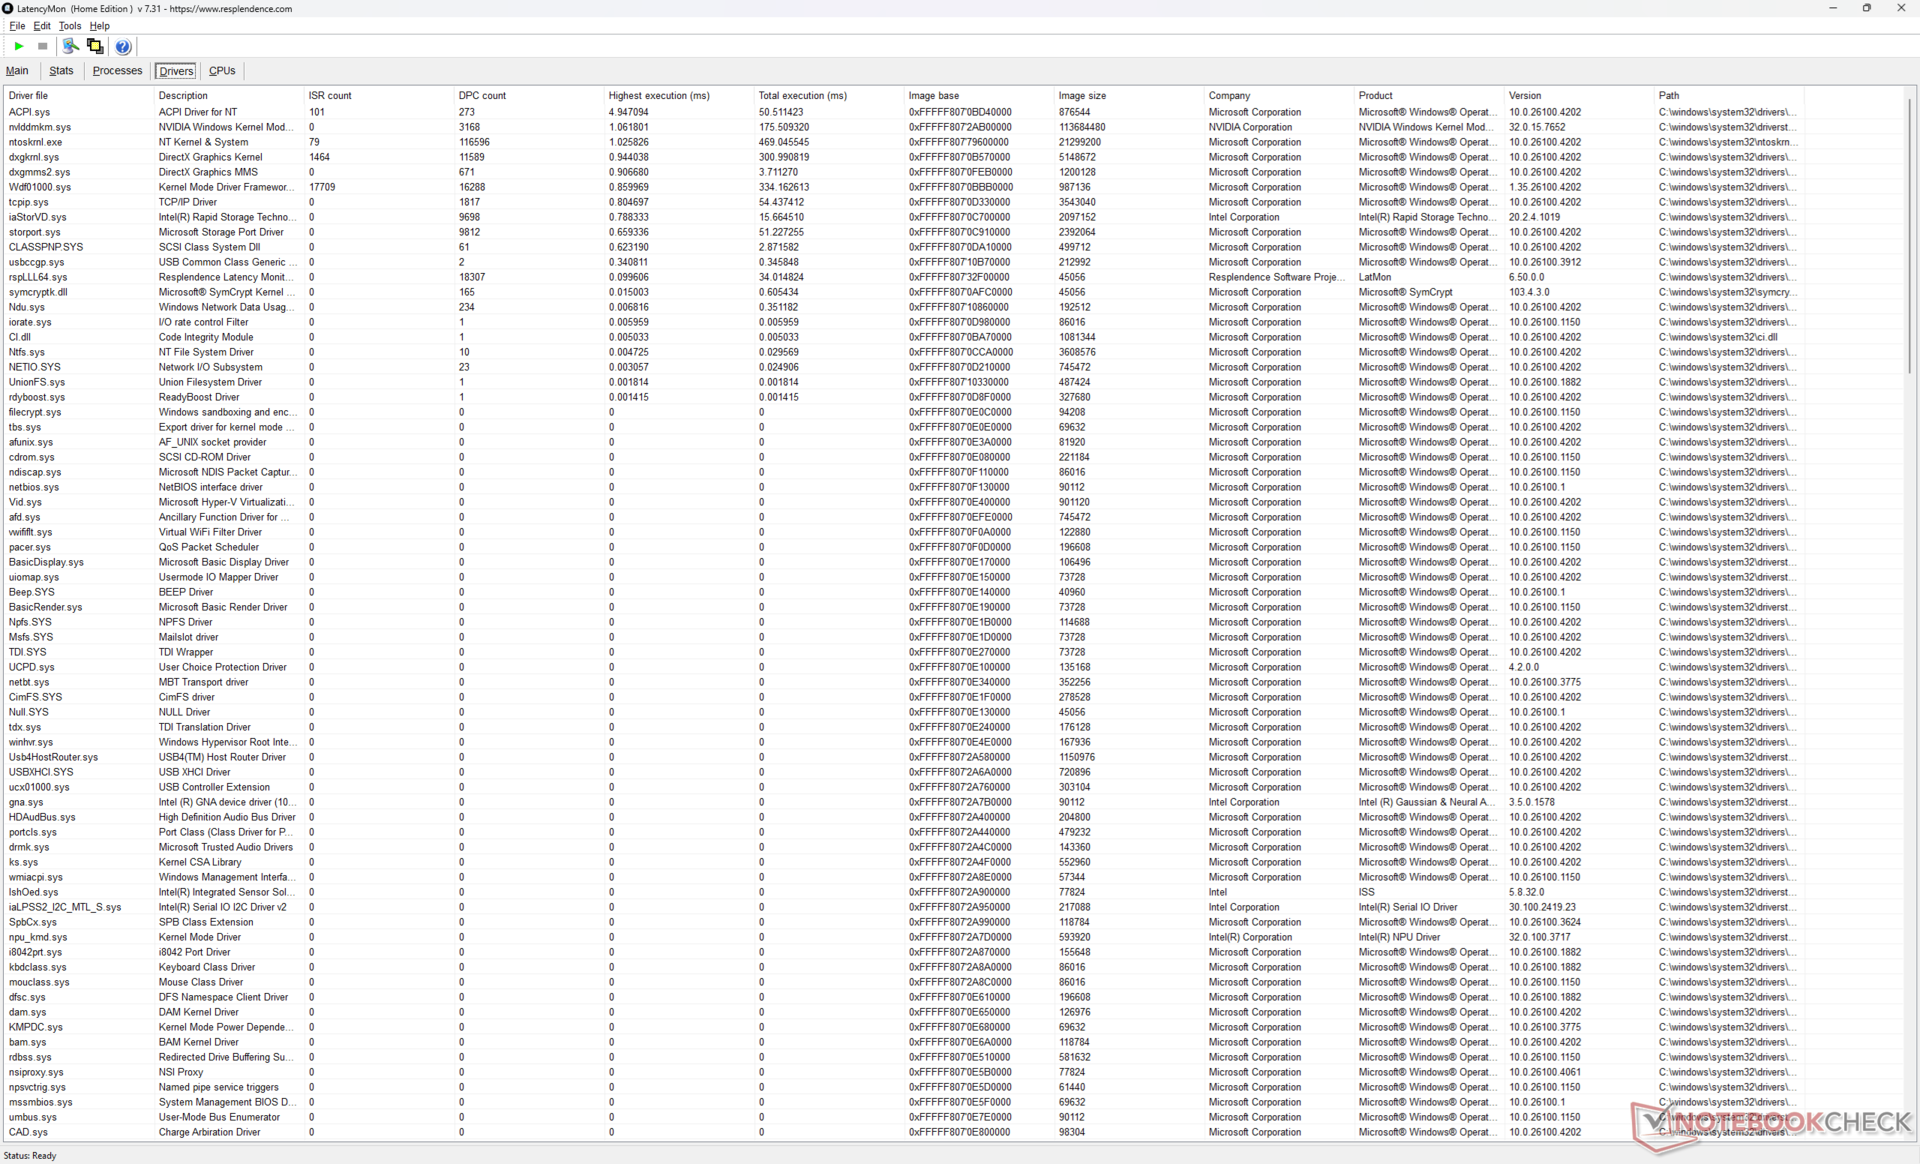
DPC 延迟
LatencyMon 显示,在打开主页的多个浏览器标签页时会出现 DPC 问题,但在播放 4K60 视频内容时没有掉帧记录。
| DPC Latencies / LatencyMon - interrupt to process latency (max), Web, Youtube, Prime95 | |
| Alienware x16 R2 P120F | |
| Alienware 16 Area-51 | |
| Gigabyte Aero X16 1WH | |
| Razer Blade 16 RTX 5080 | |
| Lenovo Legion Pro 7i 16 Gen 10 | |
| MSI Vector A18 HX A9W | |
* ... smaller is better
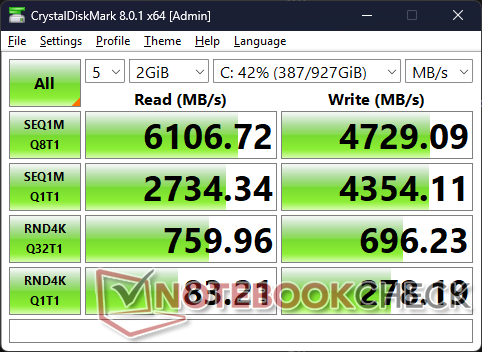
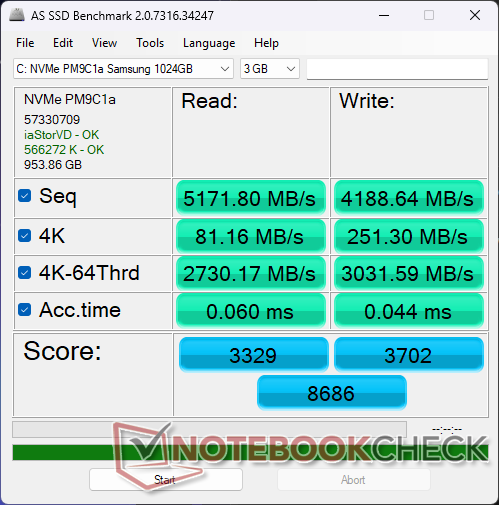
存储设备
三星 三星 PM9C1a没有节流或性能问题,速度始终如一,最高可达 6200 MB/s。

| Drive Performance rating - Percent | |
| Alienware 16 Area-51 | |
| Alienware x16 R2 P120F | |
| Razer Blade 16 RTX 5080 | |
| Gigabyte Aero X16 1WH | |
| Lenovo Legion Pro 7i 16 Gen 10 | |
| MSI Vector A18 HX A9W | |
* ... smaller is better
Disk Throttling: DiskSpd Read Loop, Queue Depth 8
图形处理器性能
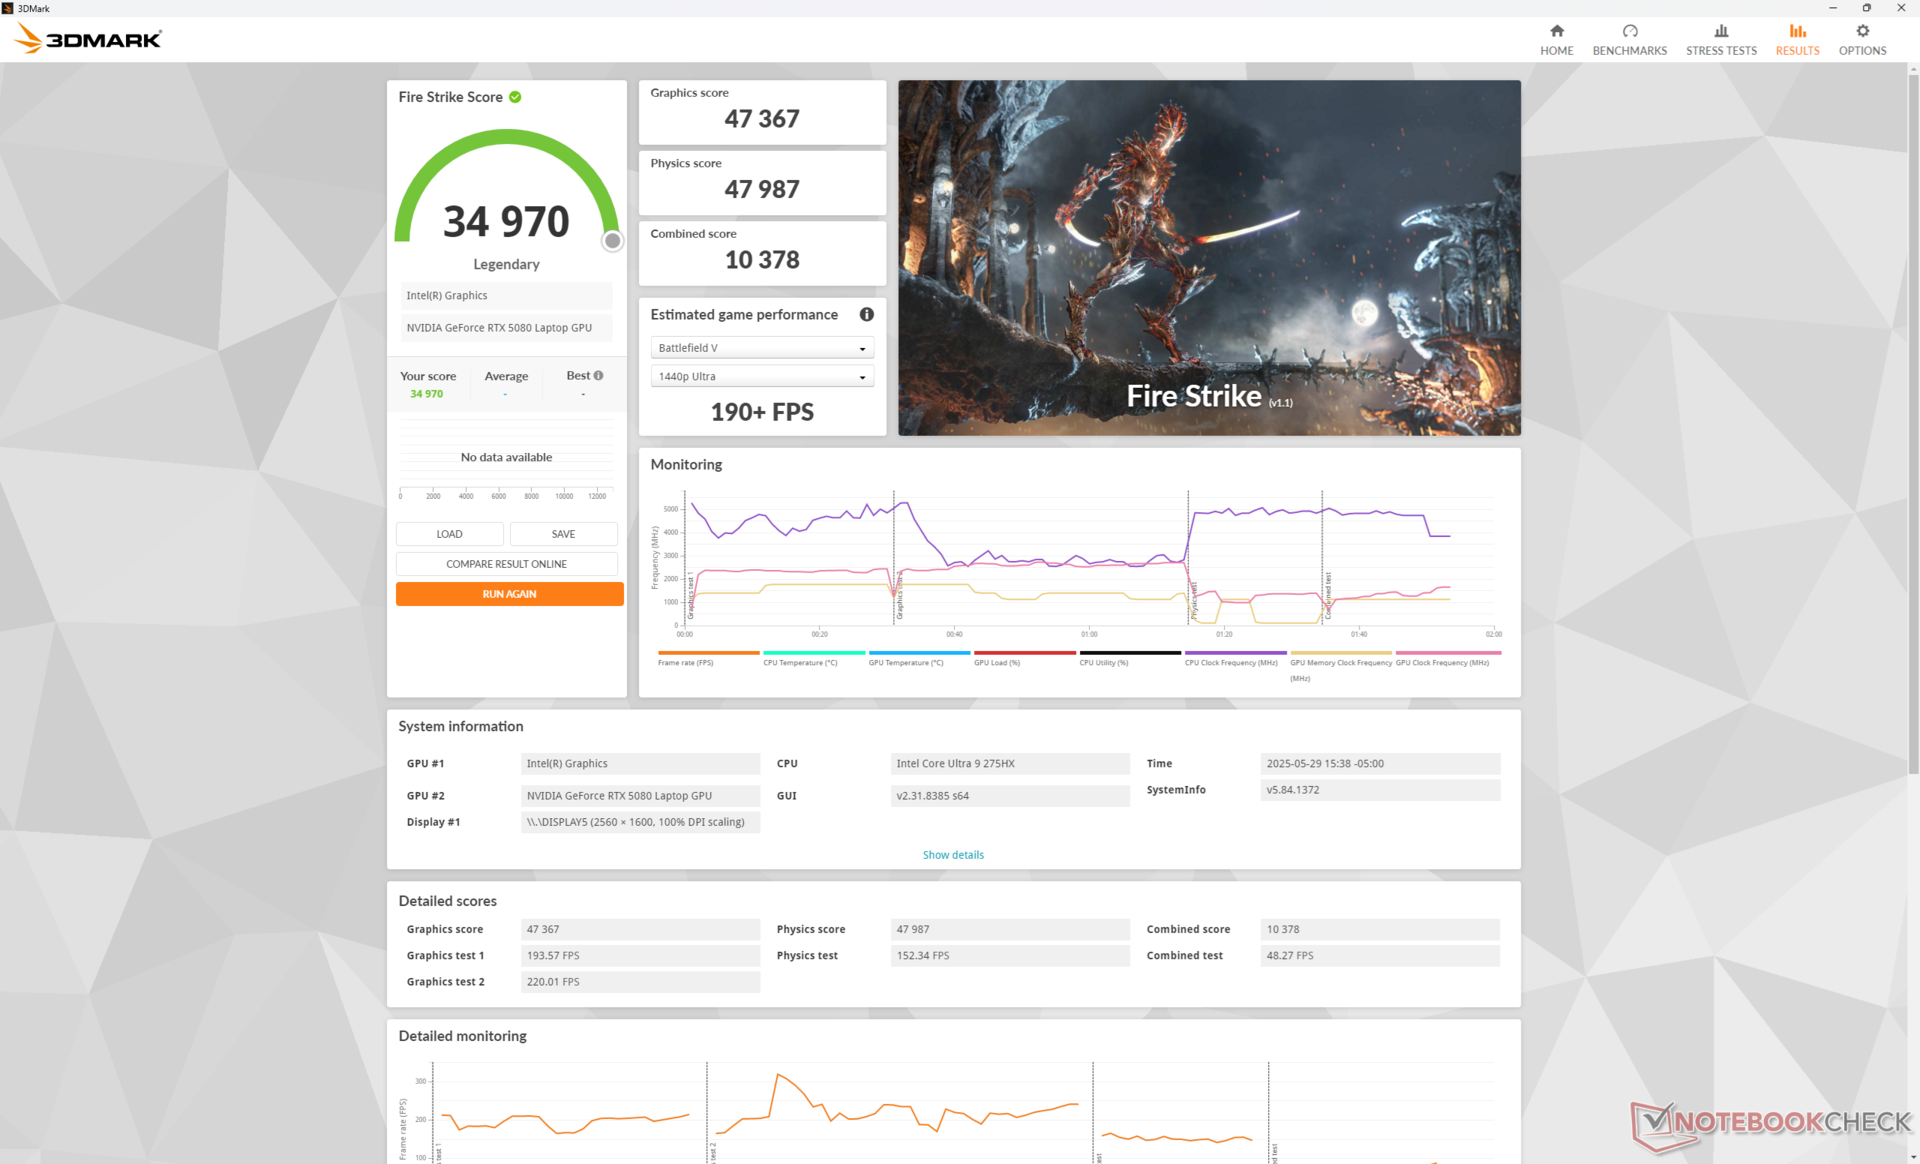
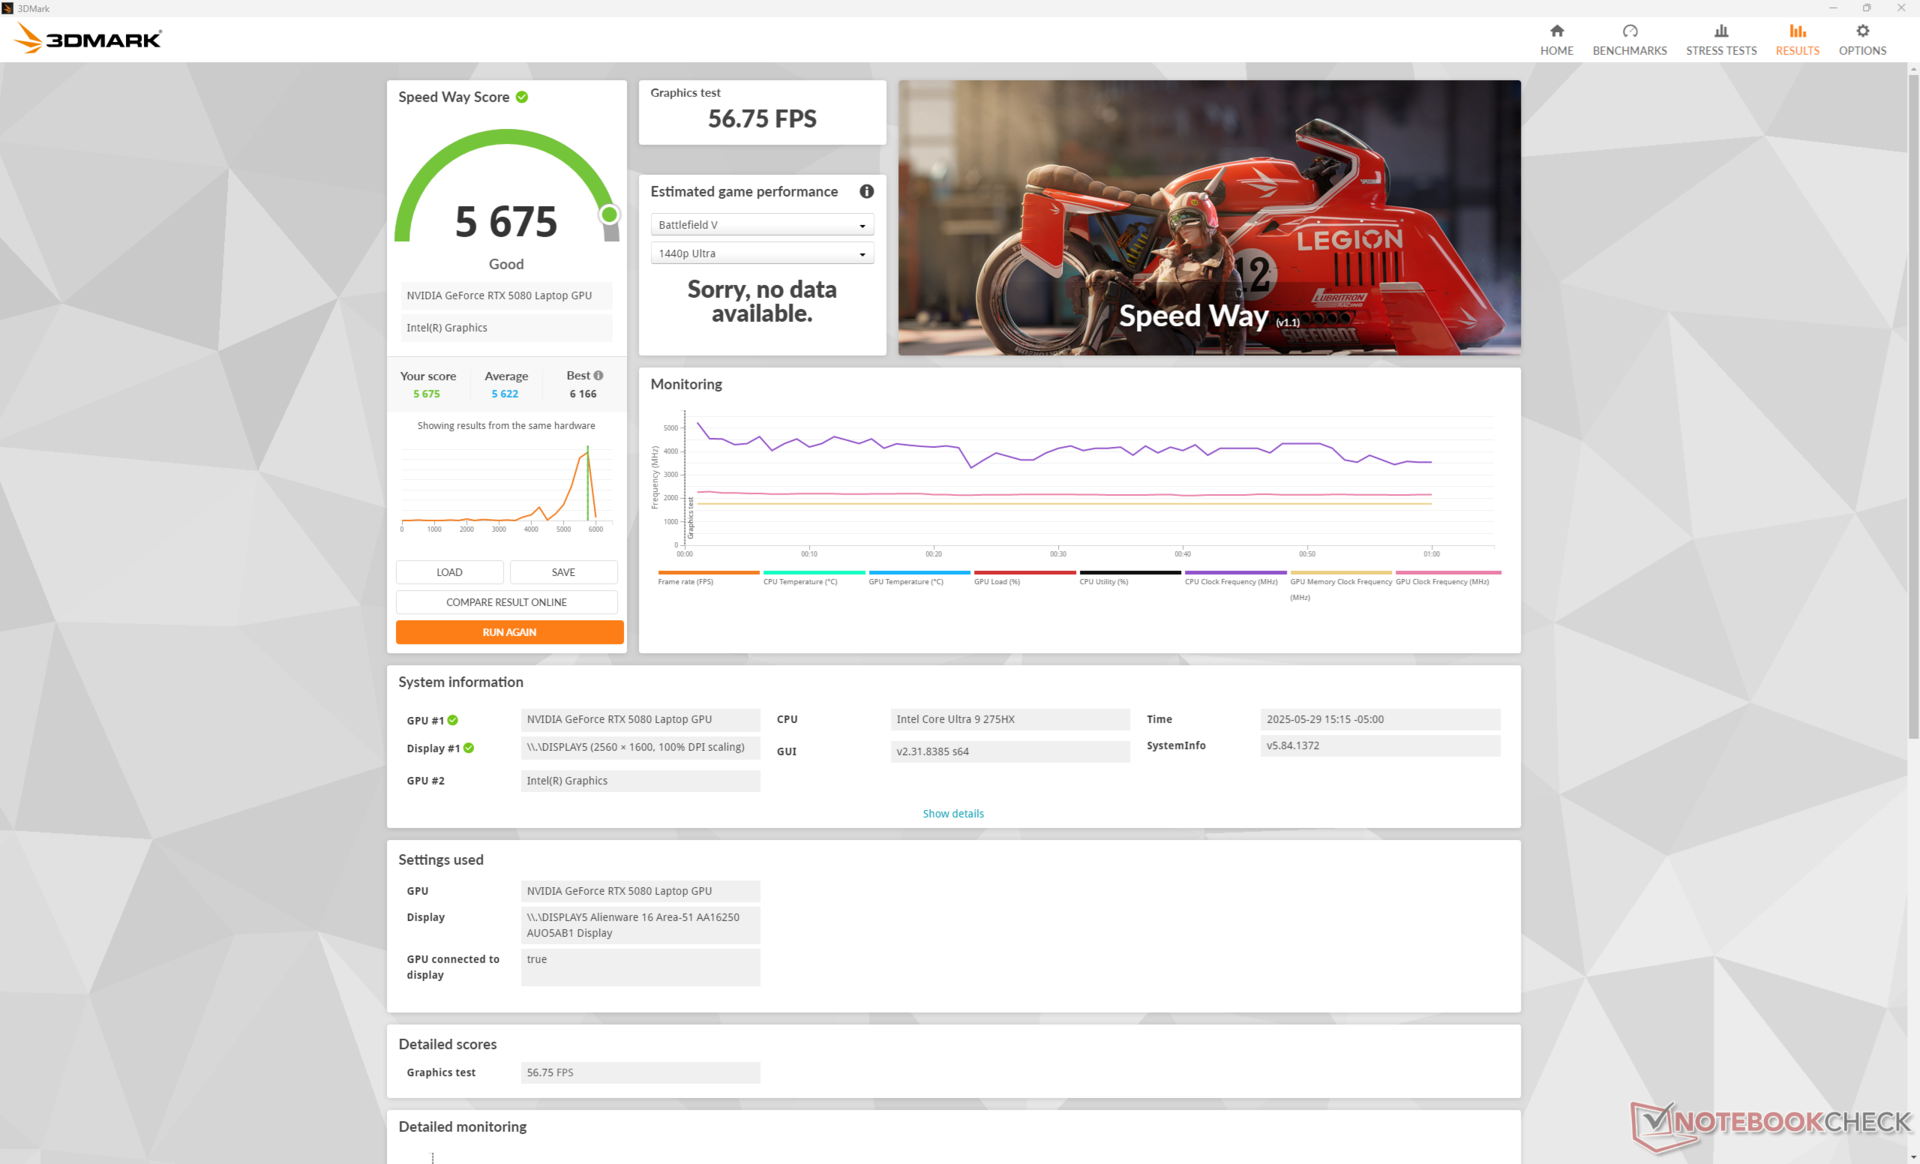
......(英文GeForce RTX 5080的性能与我们数据库中采用相同 GPU 的笔记本电脑的平均性能相差无几,即使在性能模式而非 Turbo 模式下运行也是如此。运行 Turbo 模式可将图形性能提高约 8%,如下表Fire Strike 所示。
升级到 RTX 5090SKU 的性能预计将比我们的 RTX 5080 配置提高 10%(如果在 Turbo 模式下运行),而降级到 RTX 5070 Ti将降低 15% 至 25%。
| 电源配置文件 | 图形分数 | 物理得分 | 综合得分 |
| 涡轮模式 | 51295 | 48830 | 13650 |
| 性能模式 | 47367 (-8%) | 47987 (-2%) | 10378 (-24%) |
| 平衡模式 | 48596 (-5%) | 48115 (-1%) | 13674 (-0%) |
| 电池电量 | 30205 (-41%) | 27507 (-44%) | 8130 (-40%) |
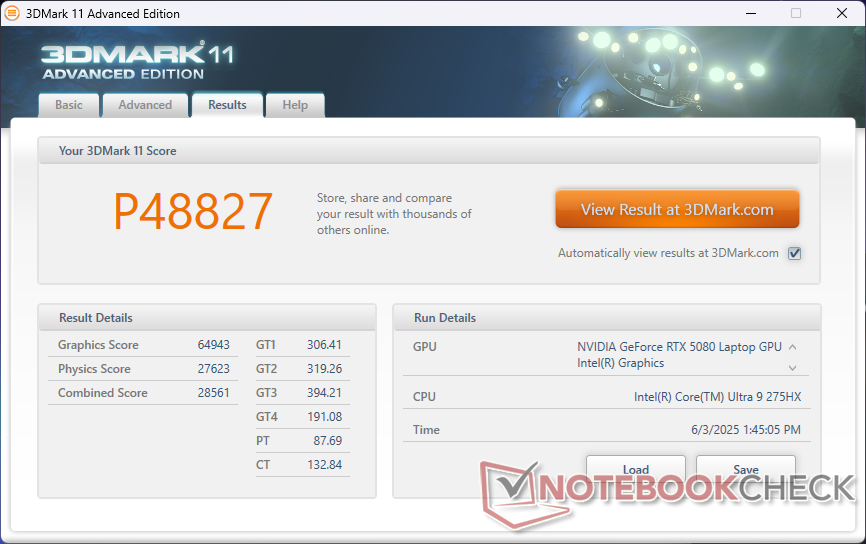
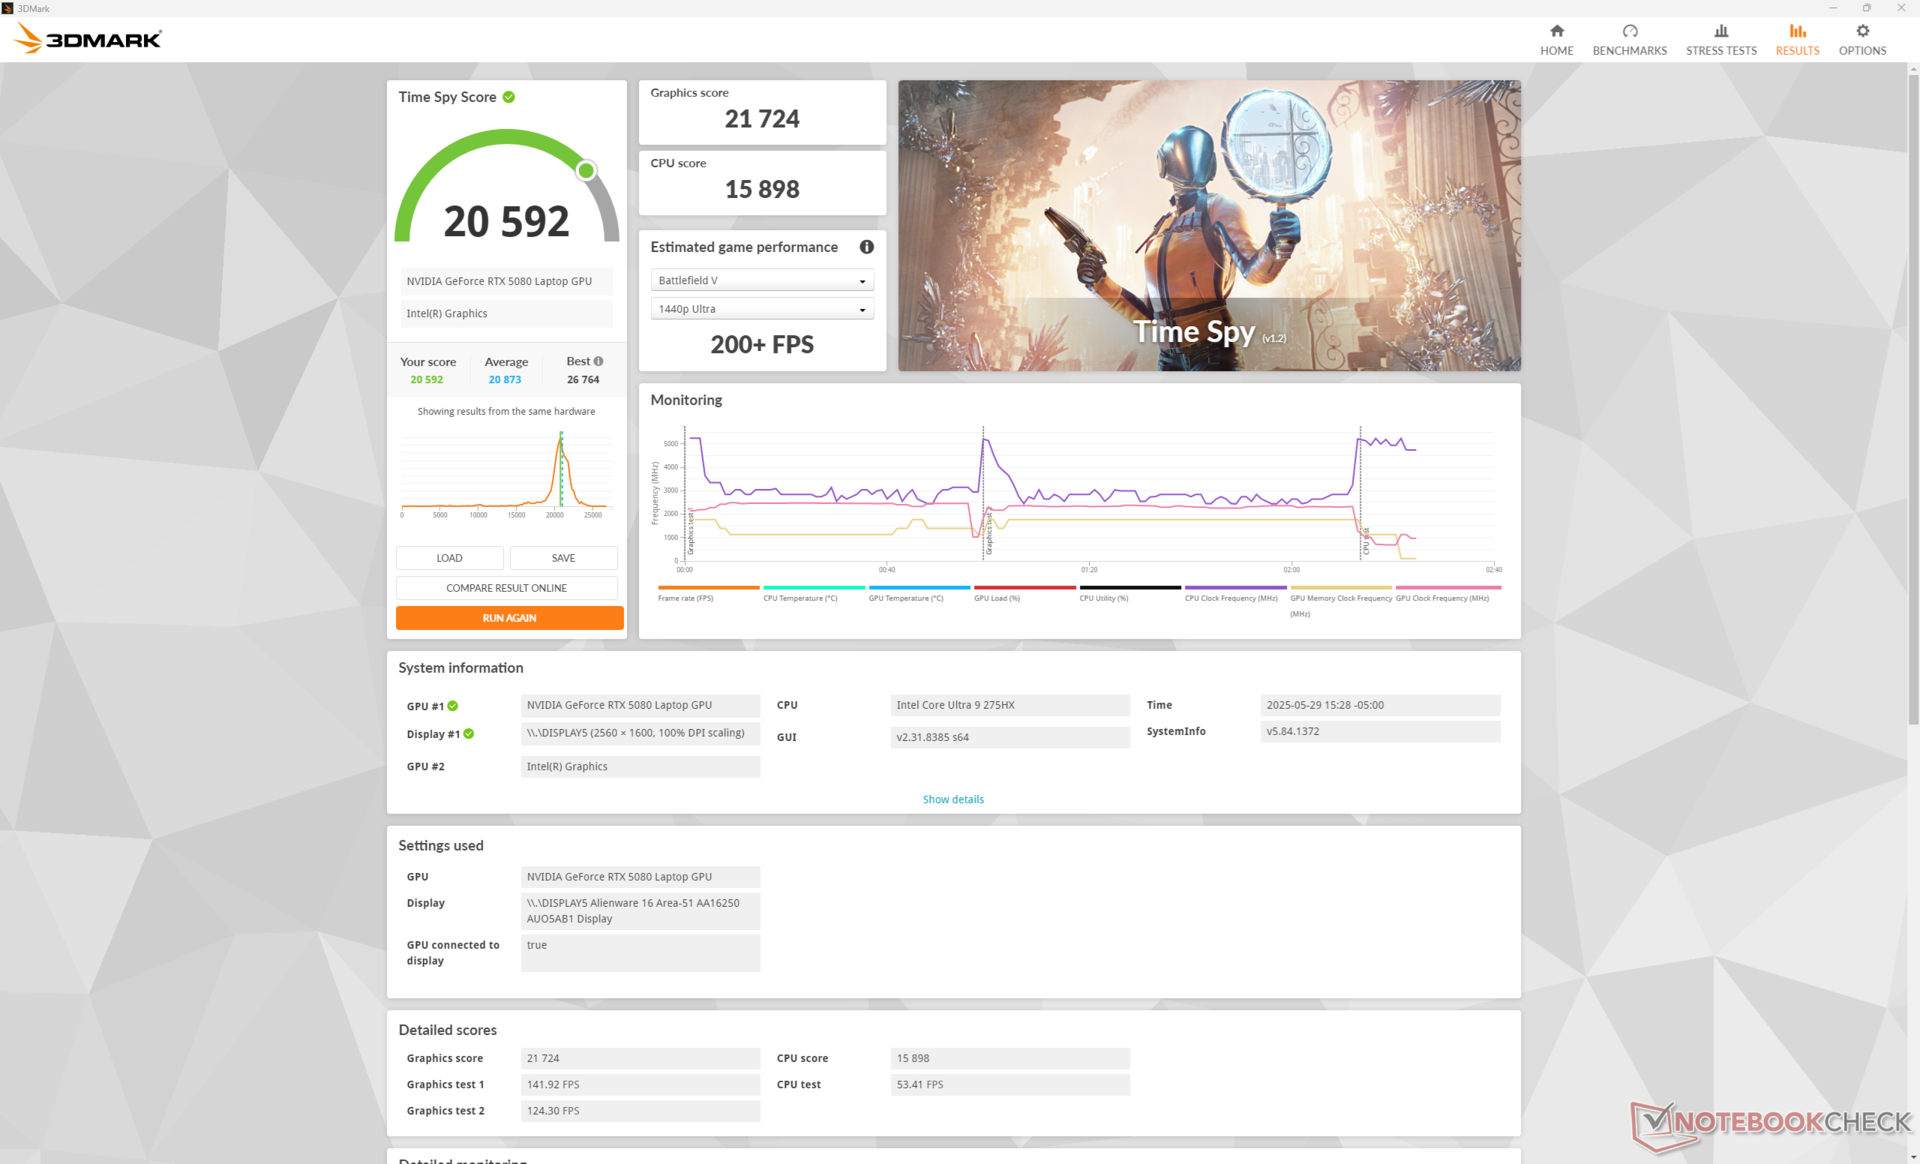
| 3DMark 11 Performance | 48827 points | |
| 3DMark Fire Strike Score | 34970 points | |
| 3DMark Time Spy Score | 20592 points | |
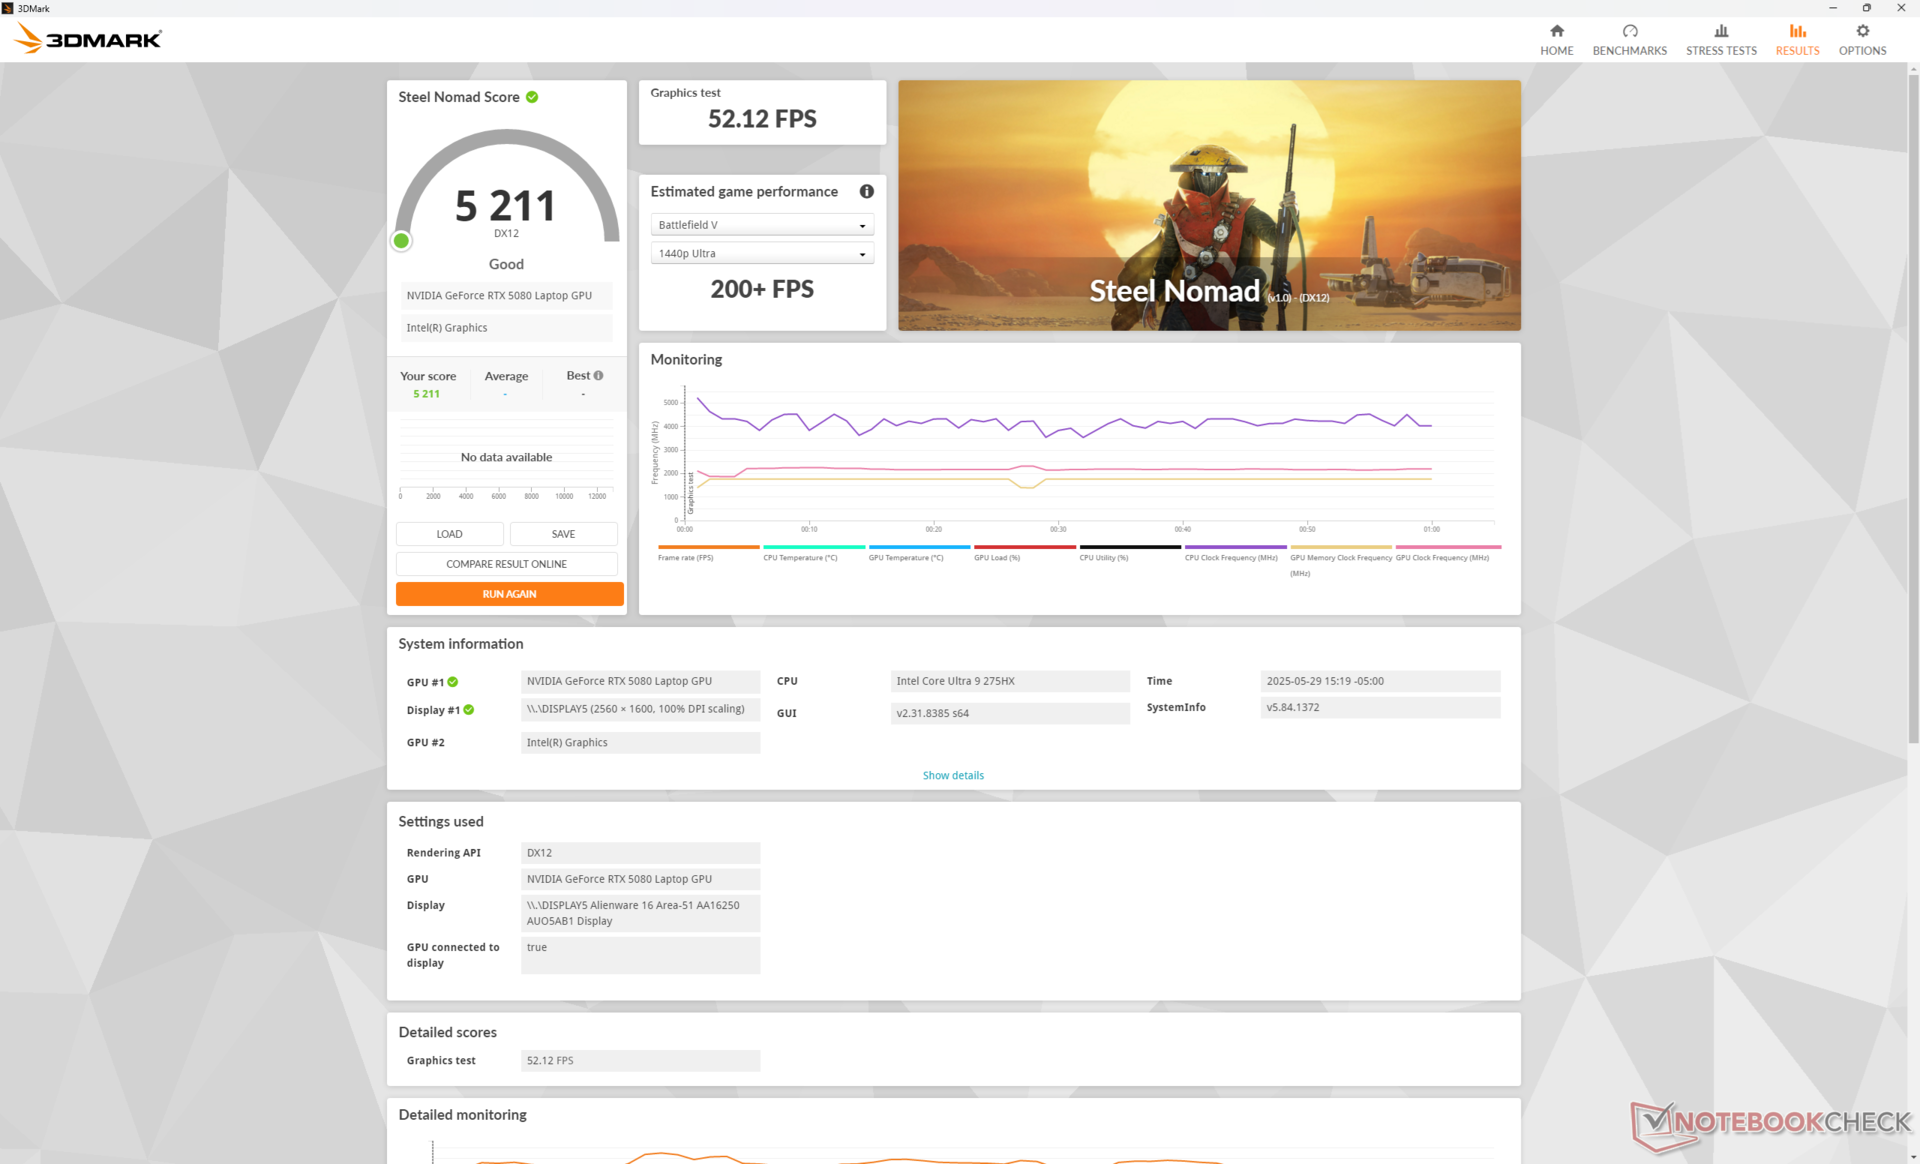
| 3DMark Steel Nomad Score | 5211 points | |
Help | ||
* ... smaller is better
游戏性能
移动 RTX 5080 的速度远远不及 台式机 RTX 5080的速度相差甚远,但它与 1600p 显示屏的搭配仍然非常出色。在应用 DLSS 或 FG 之前,《艾伦-唤醒 2》或《怪物猎人荒野》 等高要求游戏在 QHD 和最高设置下的运行速度均大于 60 FPS。不过,如果支持 DLSS 和 FG,我们还是强烈推荐使用,因为它们是GeForce 40 和 50 系列的最大区别。
值得注意的是,当尝试以 4K 最高设置进行基准测试时,《夺宝奇兵与大本营》会持续崩溃。
请参阅我们的 RTX 5080 专页更多基准测试和比较。
| Monster Hunter Wilds | |
| 1920x1080 ultra, RT: high, no upscaling | |
| Alienware 16 Area-51 | |
| Average NVIDIA GeForce RTX 5080 Laptop (65.7 - 90, n=8) | |
| MSI Vector A18 HX A9W | |
| Razer Blade 16 RTX 5080 | |
| 2560x1440 ultra, RT: high, no upscaling | |
| Alienware 16 Area-51 | |
| Average NVIDIA GeForce RTX 5080 Laptop (58.9 - 73.2, n=8) | |
| Razer Blade 16 RTX 5080 | |
| MSI Vector A18 HX A9W | |
| 2560x1440 ultra, RT: high, DLSS3 quality | |
| Alienware 16 Area-51 | |
| Average NVIDIA GeForce RTX 5080 Laptop (64.9 - 87.7, n=7) | |
| MSI Vector A18 HX A9W | |
| Razer Blade 16 RTX 5080 | |
| 3840x2160 ultra, RT: high, no upscaling | |
| Alienware 16 Area-51 | |
| Average NVIDIA GeForce RTX 5080 Laptop (37.9 - 47.6, n=8) | |
| Razer Blade 16 RTX 5080 | |
| MSI Vector A18 HX A9W | |
| 3840x2160 ultra, RT: high, DLSS3 quality | |
| Alienware 16 Area-51 | |
| Average NVIDIA GeForce RTX 5080 Laptop (50.9 - 61.8, n=8) | |
| Razer Blade 16 RTX 5080 | |
Cyberpunk 2077 ultra FPS Chart
| low | med. | high | ultra | QHD DLSS | QHD | 4K DLSS | 4K | |
|---|---|---|---|---|---|---|---|---|
| Dota 2 Reborn (2015) | 224 | 188.9 | 180.4 | 160.4 | 152.9 | |||
| Final Fantasy XV Benchmark (2018) | 189.6 | 158.8 | 96.5 | |||||
| X-Plane 11.11 (2018) | 158.5 | 135.5 | 111.9 | 86.6 | ||||
| Strange Brigade (2018) | 397 | 303 | 159 | |||||
| Baldur's Gate 3 (2023) | 202.6 | 207.5 | 154.4 | 129.6 | 79.8 | |||
| Cyberpunk 2077 (2023) | 160.2 | 143.9 | 135.1 | 117.9 | 102.4 | 47.5 | ||
| Alan Wake 2 (2023) | 113.5 | 74.3 | 59.9 | 39.7 | ||||
| F1 24 (2024) | 132.5 | 134.2 | 84.7 | 71.8 | 41.9 | |||
| Black Myth: Wukong (2024) | 57 | 64 | 43 | 45 | 26 | |||
| Indiana Jones and the Great Circle (2024) | 124.2 | 118.1 | 99.3 | 55.2 | ||||
| Monster Hunter Wilds (2025) | 83.1 | 80.8 | 69.8 | 60 | 47.6 | |||
| Assassin's Creed Shadows (2025) | 65 | 66 | 55 | 54 | 39 |
排放量
系统噪音
在 23.6 dB(A) 的静音背景下,即使设置为静音模式,风扇的转速也始终保持在 28.1 dB(A) 左右。不过,当引入 3DMark 06 等较高负载时,四风扇能很好地保持低转速,因此对于游戏笔记本电脑来说,转速上升时间相当缓慢和稳定。
运行《赛博朋克 2077》时,如果设置为平衡、性能和涡轮模式,风扇噪音将分别稳定在 47.3 dB(A)、50.4 dB(A) 和 56.4 dB(A) 左右。如上所述,由于最大 175 W TGP 被锁定在 Turbo 模式下,如果用户想让 GPU 以最大功率运行,就必须忍受最大风扇噪音设置。如果风扇噪音达到 55 分贝(A)或更高,强烈建议佩戴耳机。
Noise level
| Idle |
| 25.4 / 27.8 / 28.1 dB(A) |
| Load |
| 28.8 / 56.4 dB(A) |
 | ||
30 dB silent 40 dB(A) audible 50 dB(A) loud |
||
min: | ||
| Alienware 16 Area-51 GeForce RTX 5080 Laptop, Ultra 9 275HX, Samsung PM9C1a MZ9L81T0HDLB | Alienware x16 R2 P120F GeForce RTX 4080 Laptop GPU, Ultra 9 185H, WDC PC SN810 1TB | Razer Blade 16 RTX 5080 GeForce RTX 5080 Laptop, Ryzen AI 9 365, Samsung PM9A1 MZVL21T0HCLR | Gigabyte Aero X16 1WH GeForce RTX 5070 Laptop, Ryzen AI 7 350, Kingston OM8PGP41024Q-A0 | MSI Vector A18 HX A9W GeForce RTX 5070 Ti Laptop, R9 9955HX | Lenovo Legion Pro 7i 16 Gen 10 GeForce RTX 5080 Laptop, Ultra 9 275HX, SK Hynix HFS001TEJ9X115N | |
|---|---|---|---|---|---|---|
| Noise | 1% | -2% | 4% | -10% | 5% | |
| off / environment * (dB) | 23.6 | 23.4 1% | 23 3% | 23.9 -1% | 22.5 5% | 22.9 3% |
| Idle Minimum * (dB) | 25.4 | 23.8 6% | 23.1 9% | 23.9 6% | 26 -2% | 22.9 10% |
| Idle Average * (dB) | 27.8 | 28.5 -3% | 23.1 17% | 23.9 14% | 26 6% | 22.9 18% |
| Idle Maximum * (dB) | 28.1 | 28.5 -1% | 29.2 -4% | 23.9 15% | 32 -14% | 26.3 6% |
| Load Average * (dB) | 28.8 | 28.8 -0% | 43 -49% | 33.2 -15% | 44.4 -54% | 27.8 3% |
| Cyberpunk 2077 ultra * (dB) | 50.4 | 50.1 1% | 50.2 -0% | 49.8 1% | 54.2 -8% | |
| Load Maximum * (dB) | 56.4 | 54.2 4% | 52.4 7% | 50.2 11% | 61.6 -9% | 53.9 4% |
| Witcher 3 ultra * (dB) | 49.5 |
* ... smaller is better
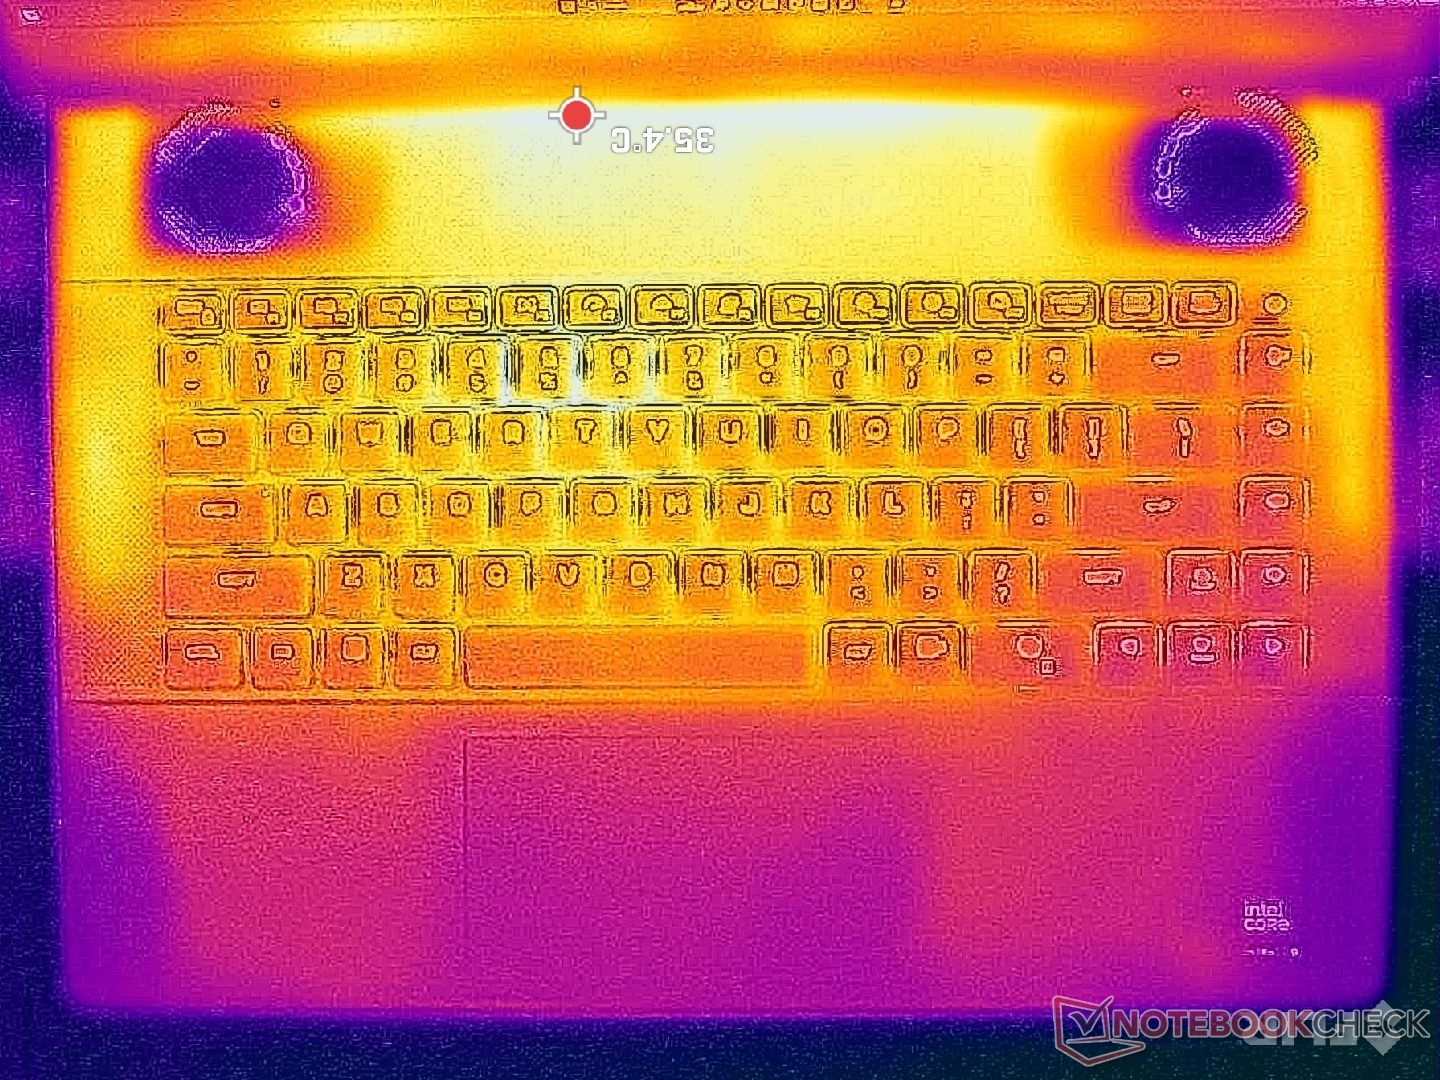
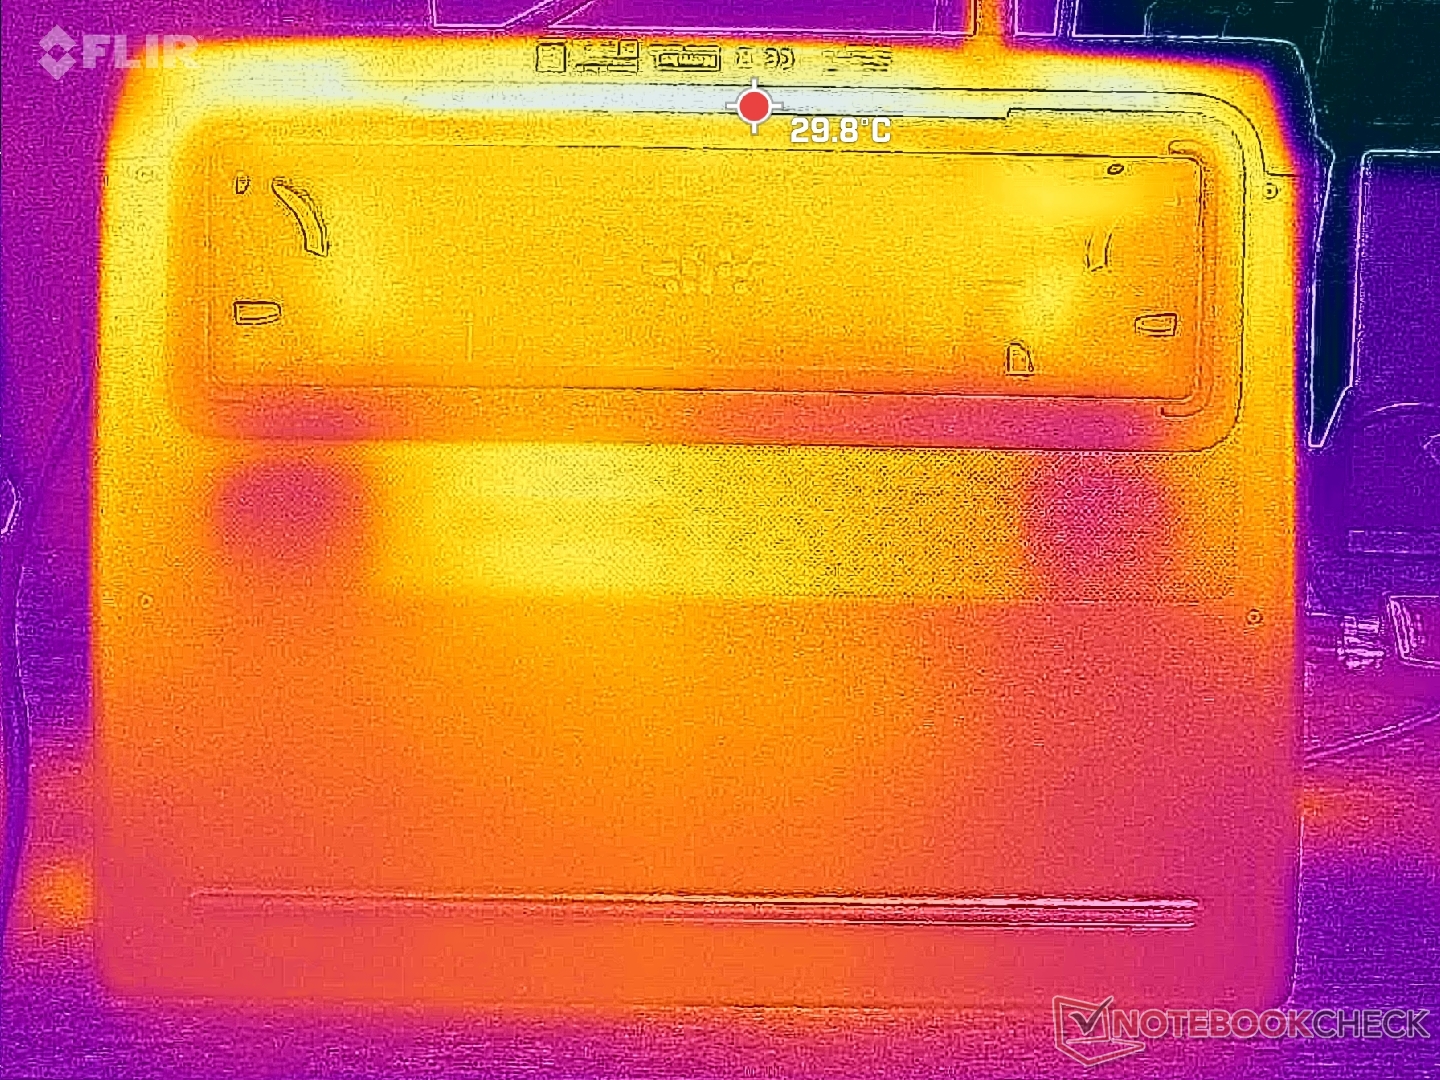
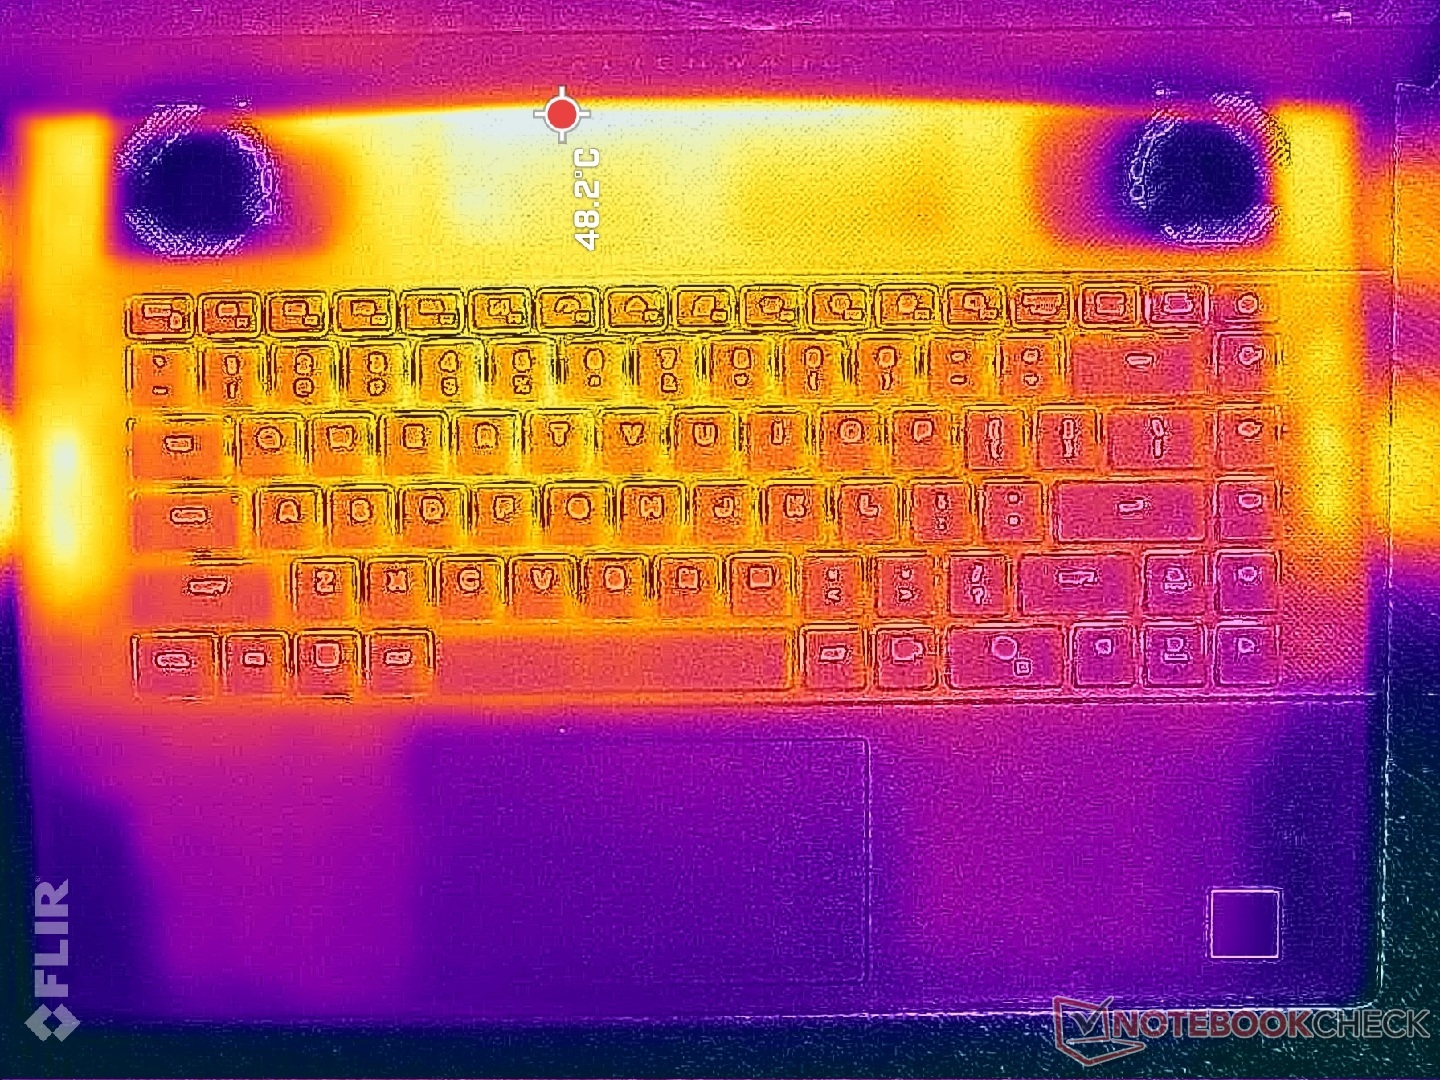
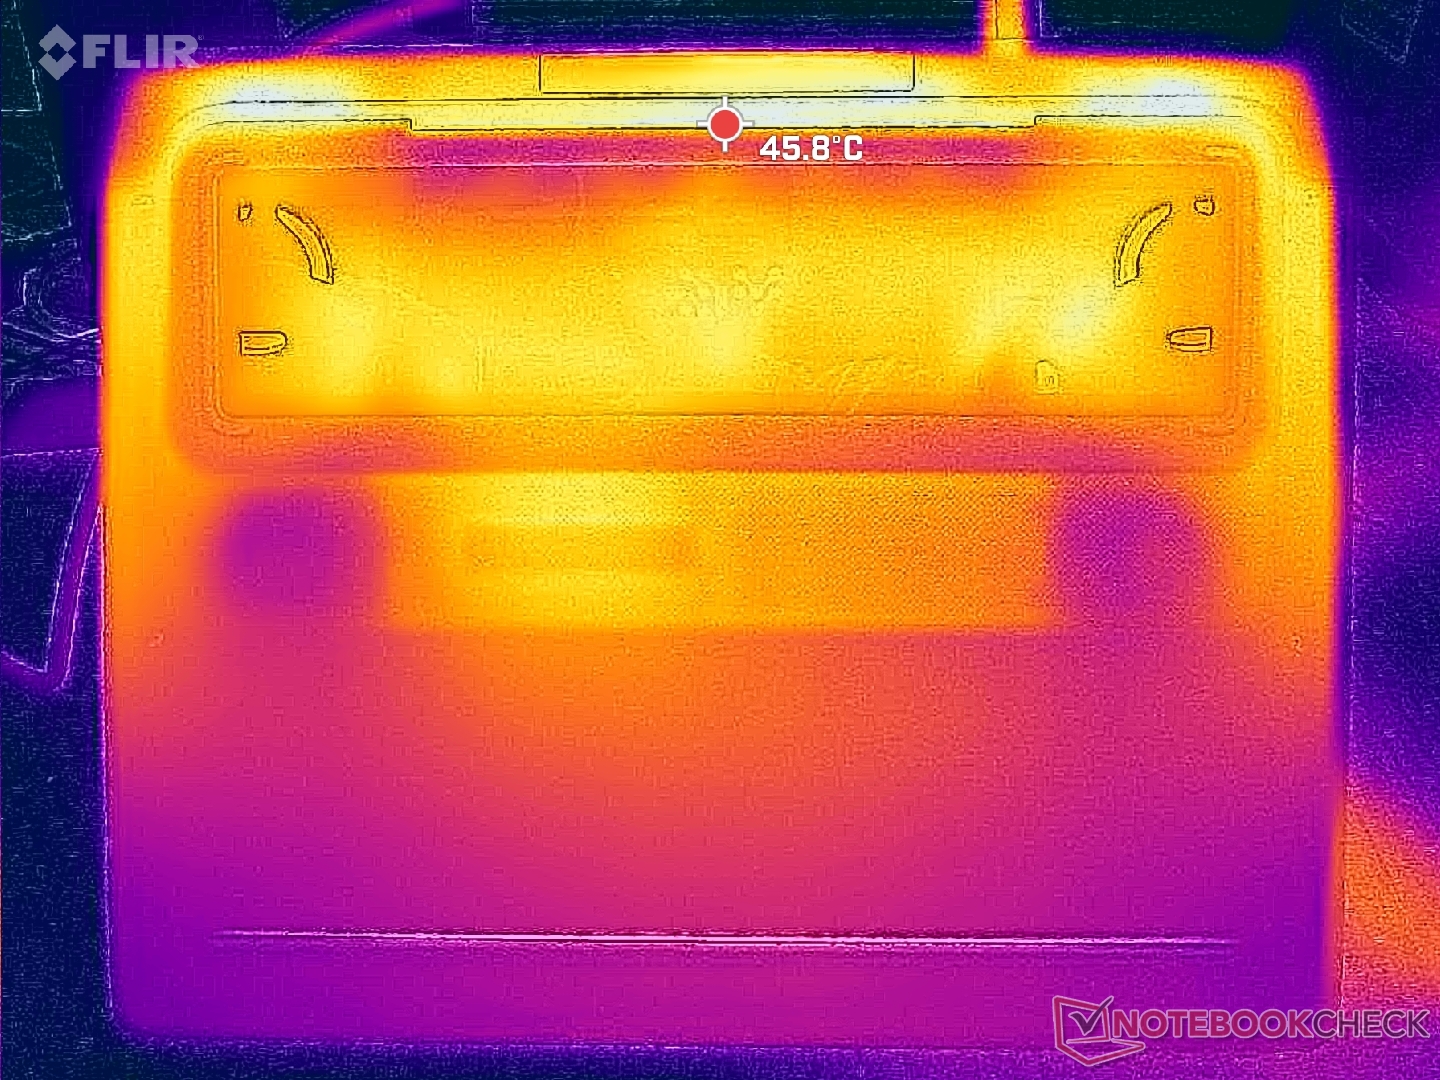
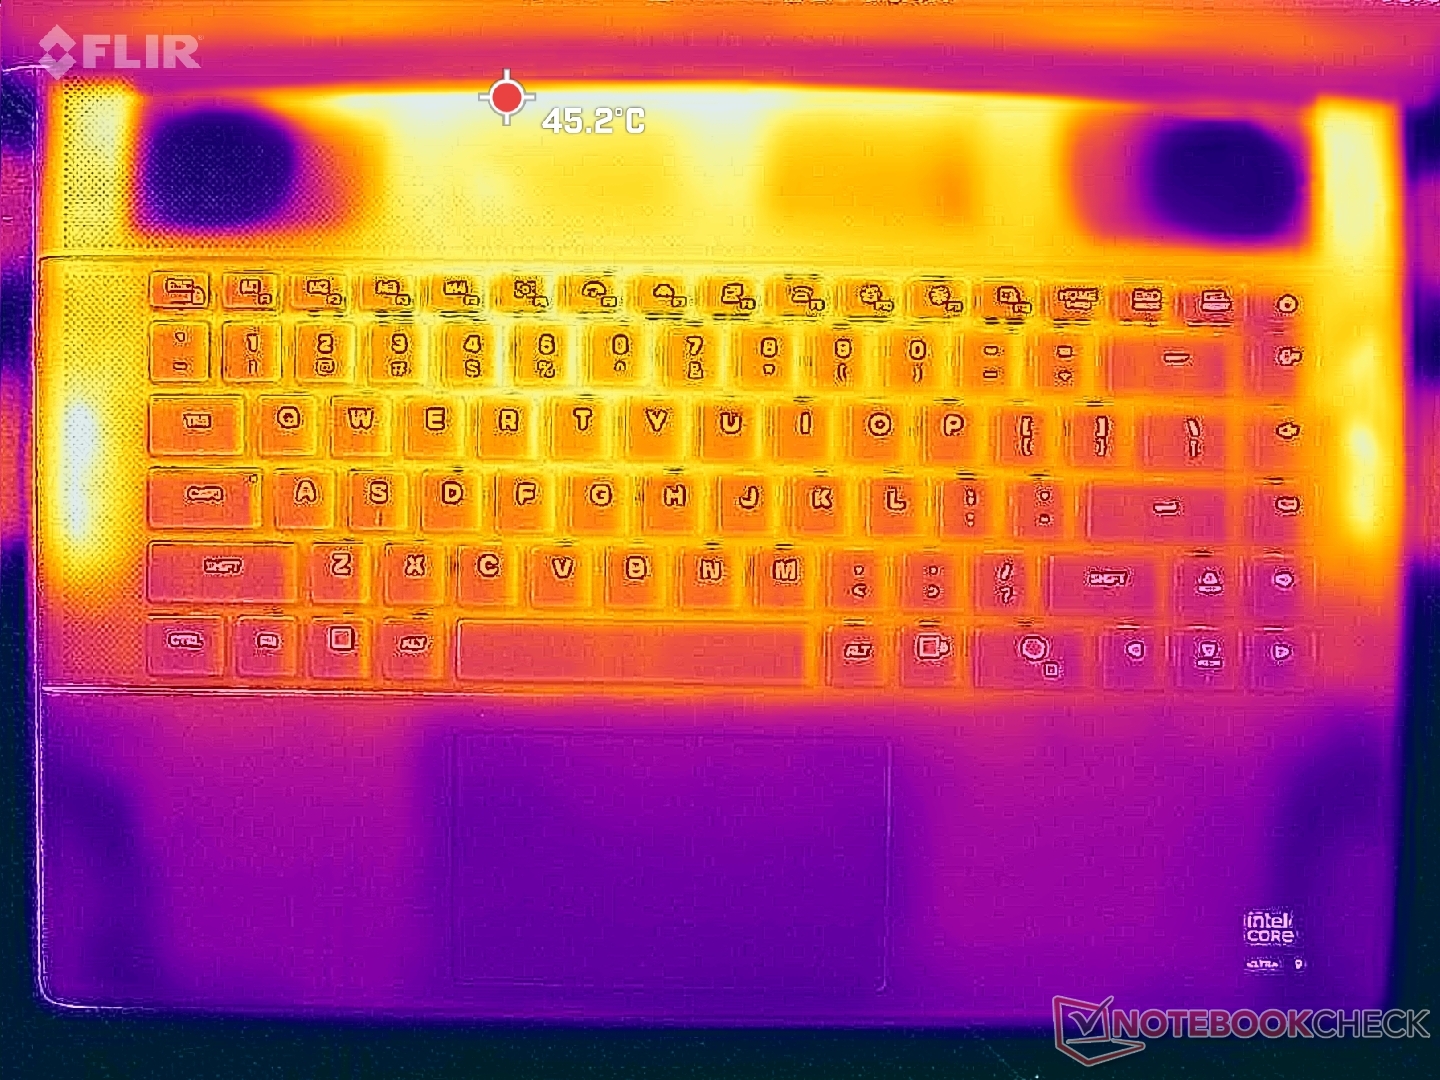
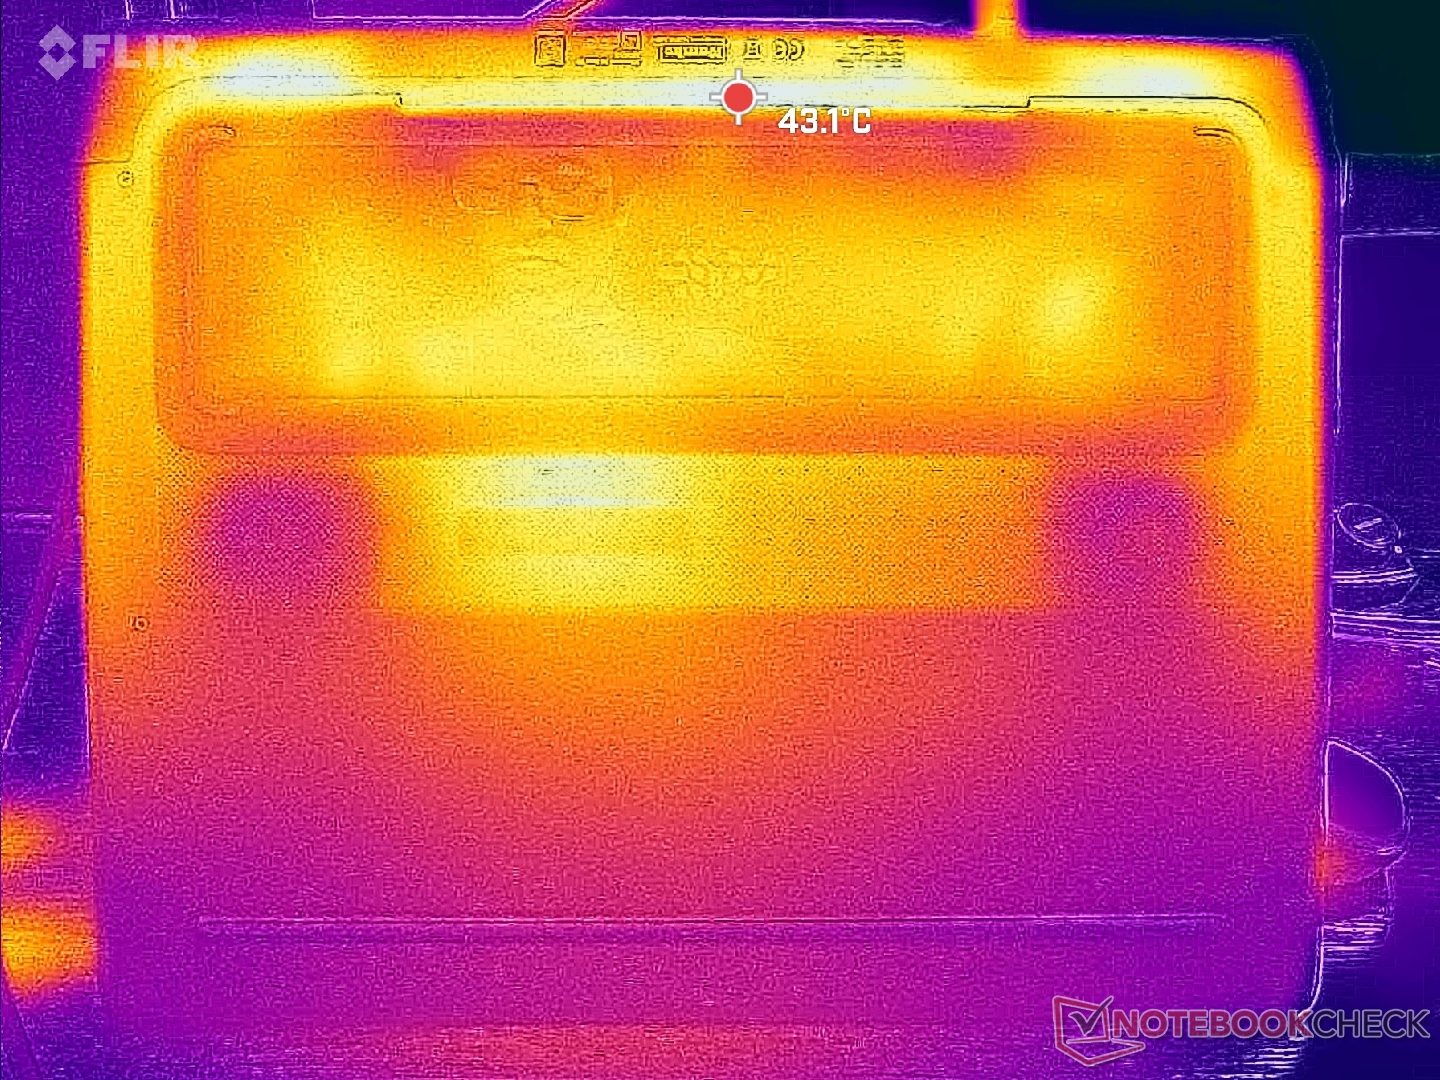
温度
游戏时,机箱后部皮肤或手掌较少接触的表面温度可达 44 摄氏度或 48 摄氏度以上。尽管 Area-51 设计的通风栅较少,但热点温度仍明显低于我们在旧款 x16 R2 上记录到的温度。
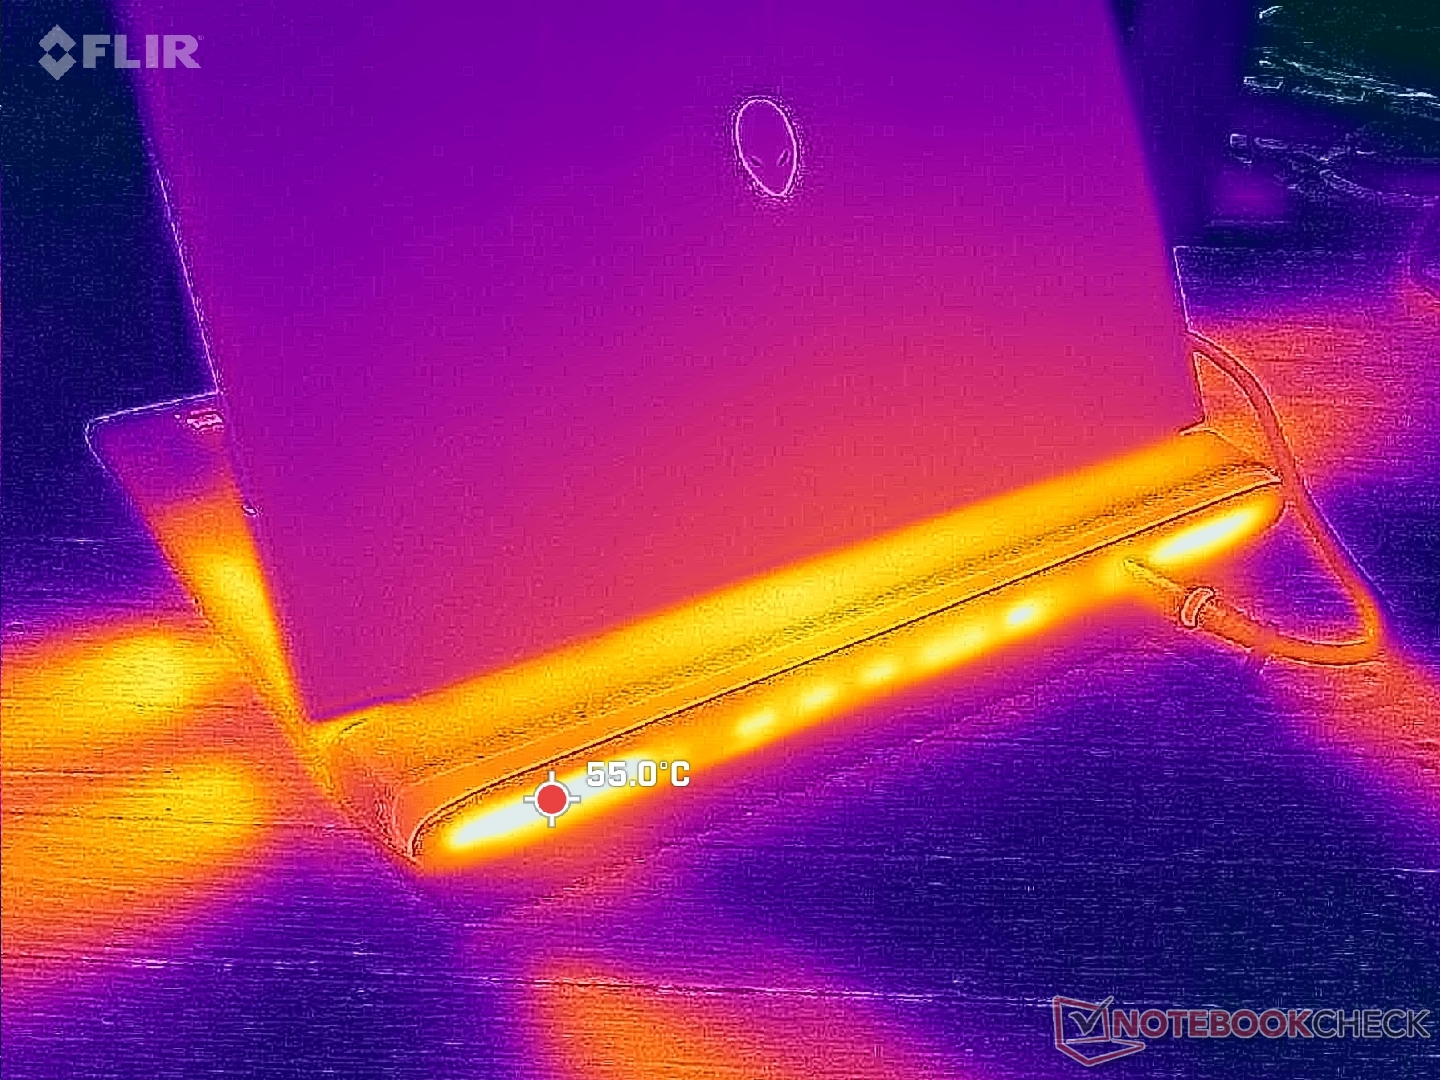
(±) The maximum temperature on the upper side is 43.8 °C / 111 F, compared to the average of 40.4 °C / 105 F, ranging from 21.2 to 68.8 °C for the class Gaming.
(±) The bottom heats up to a maximum of 40 °C / 104 F, compared to the average of 43.2 °C / 110 F
(±) In idle usage, the average temperature for the upper side is 32.6 °C / 91 F, compared to the device average of 33.9 °C / 93 F.
(-) 3: The average temperature for the upper side is 38.7 °C / 102 F, compared to the average of 33.9 °C / 93 F for the class Gaming.
(+) The palmrests and touchpad are cooler than skin temperature with a maximum of 30.8 °C / 87.4 F and are therefore cool to the touch.
(±) The average temperature of the palmrest area of similar devices was 28.8 °C / 83.8 F (-2 °C / -3.6 F).
| Alienware 16 Area-51 Intel Core Ultra 9 275HX, NVIDIA GeForce RTX 5080 Laptop | Alienware x16 R2 P120F Intel Core Ultra 9 185H, NVIDIA GeForce RTX 4080 Laptop GPU | Razer Blade 16 RTX 5080 AMD Ryzen AI 9 365, NVIDIA GeForce RTX 5080 Laptop | Gigabyte Aero X16 1WH AMD Ryzen AI 7 350, NVIDIA GeForce RTX 5070 Laptop | MSI Vector A18 HX A9W AMD Ryzen 9 9955HX, NVIDIA GeForce RTX 5070 Ti Laptop | Lenovo Legion Pro 7i 16 Gen 10 Intel Core Ultra 9 275HX, NVIDIA GeForce RTX 5080 Laptop | |
|---|---|---|---|---|---|---|
| Heat | -11% | -10% | 5% | 3% | 4% | |
| Maximum Upper Side * (°C) | 43.8 | 51 -16% | 50.6 -16% | 43.3 1% | 46.6 -6% | 42.6 3% |
| Maximum Bottom * (°C) | 40 | 50.8 -27% | 48.6 -22% | 50.3 -26% | 45.6 -14% | 41.2 -3% |
| Idle Upper Side * (°C) | 35.8 | 36.6 -2% | 35.2 2% | 27 25% | 31.2 13% | 32.6 9% |
| Idle Bottom * (°C) | 35.2 | 35.2 -0% | 37 -5% | 28.3 20% | 28.6 19% | 32.4 8% |
* ... smaller is better
发言人
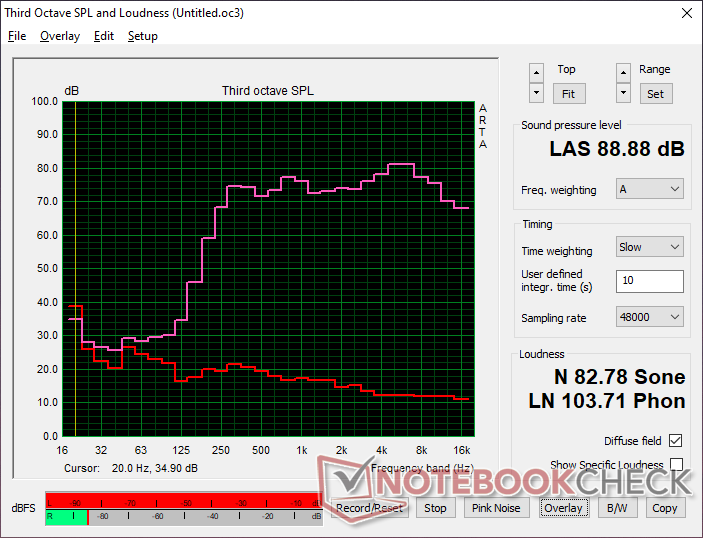
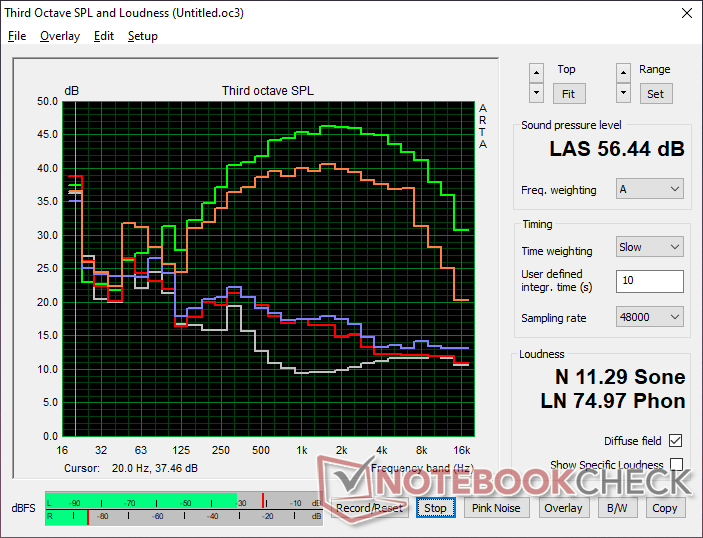
Alienware 16 Area-51 audio analysis
(+) | speakers can play relatively loud (88.9 dB)
Bass 100 - 315 Hz
(-) | nearly no bass - on average 22.1% lower than median
(±) | linearity of bass is average (13.1% delta to prev. frequency)
Mids 400 - 2000 Hz
(+) | balanced mids - only 1.4% away from median
(+) | mids are linear (3.2% delta to prev. frequency)
Highs 2 - 16 kHz
(+) | balanced highs - only 3.7% away from median
(+) | highs are linear (3.4% delta to prev. frequency)
Overall 100 - 16.000 Hz
(+) | overall sound is linear (14.1% difference to median)
Compared to same class
» 24% of all tested devices in this class were better, 8% similar, 68% worse
» The best had a delta of 6%, average was 18%, worst was 132%
Compared to all devices tested
» 17% of all tested devices were better, 4% similar, 79% worse
» The best had a delta of 4%, average was 23%, worst was 134%
Apple MacBook Pro 16 2021 M1 Pro audio analysis
(+) | speakers can play relatively loud (84.7 dB)
Bass 100 - 315 Hz
(+) | good bass - only 3.8% away from median
(+) | bass is linear (5.2% delta to prev. frequency)
Mids 400 - 2000 Hz
(+) | balanced mids - only 1.3% away from median
(+) | mids are linear (2.1% delta to prev. frequency)
Highs 2 - 16 kHz
(+) | balanced highs - only 1.9% away from median
(+) | highs are linear (2.7% delta to prev. frequency)
Overall 100 - 16.000 Hz
(+) | overall sound is linear (4.6% difference to median)
Compared to same class
» 0% of all tested devices in this class were better, 0% similar, 100% worse
» The best had a delta of 5%, average was 17%, worst was 45%
Compared to all devices tested
» 0% of all tested devices were better, 0% similar, 100% worse
» The best had a delta of 4%, average was 23%, worst was 134%
能源管理
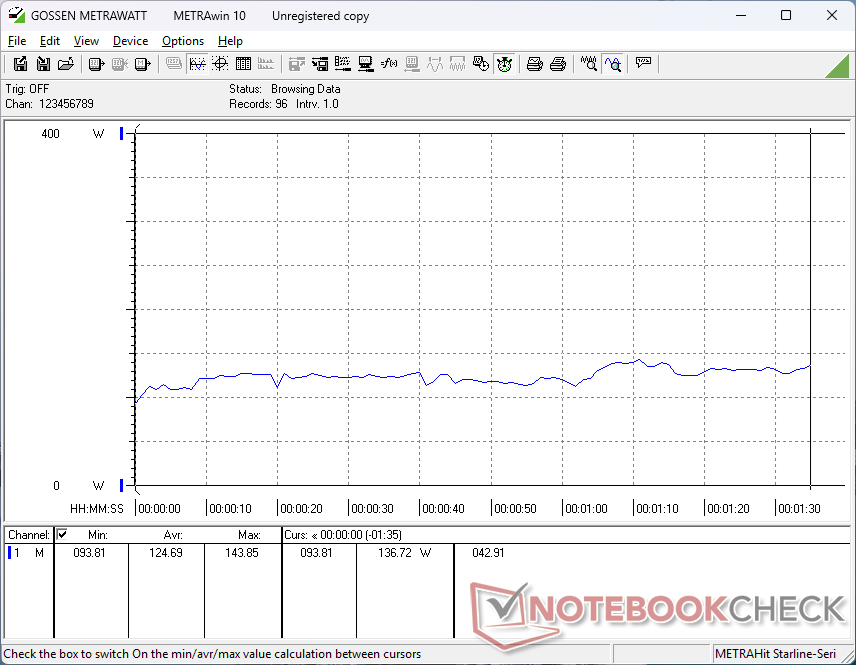
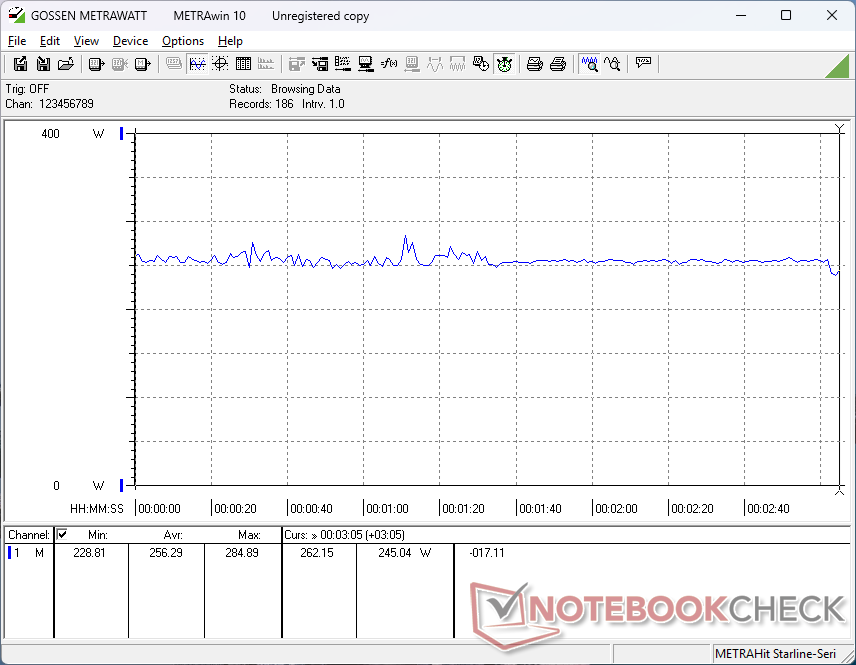
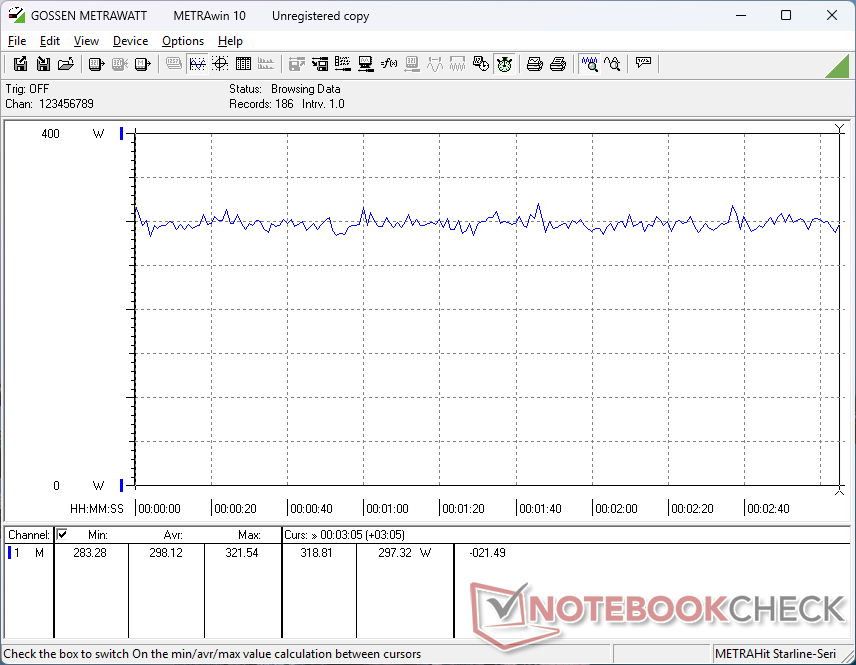
耗电量
即使在最低设置下,在台式机上空转时的功耗也非常高,达到 27 W 至 42 W,而 Blade 16 的功耗几乎只有它的三分之一。 刀锋 16.电池续航时间也因此受到影响,如下文所示。
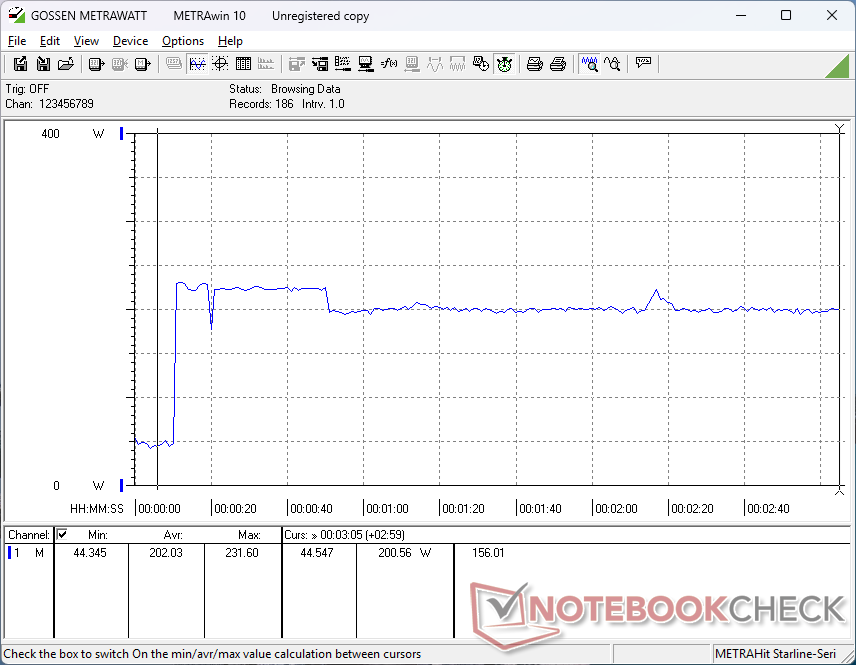
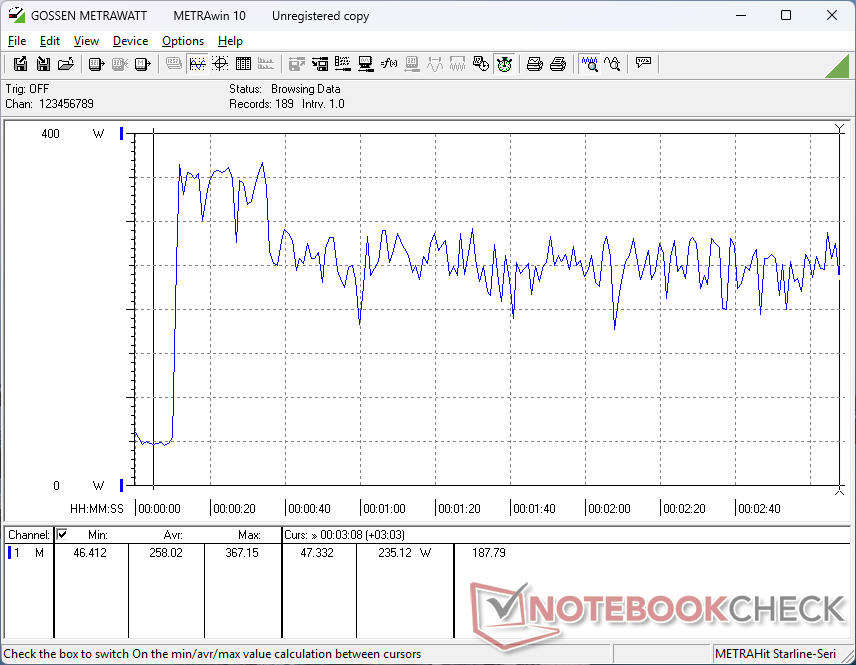
游戏模式下的功耗约为 256 瓦,而在 Turbo 模式下则接近 300 瓦,是仅次于 Blade 16 的对功耗要求较高的游戏笔记本电脑之一。 联想Legion Pro 7i 16 10 代.
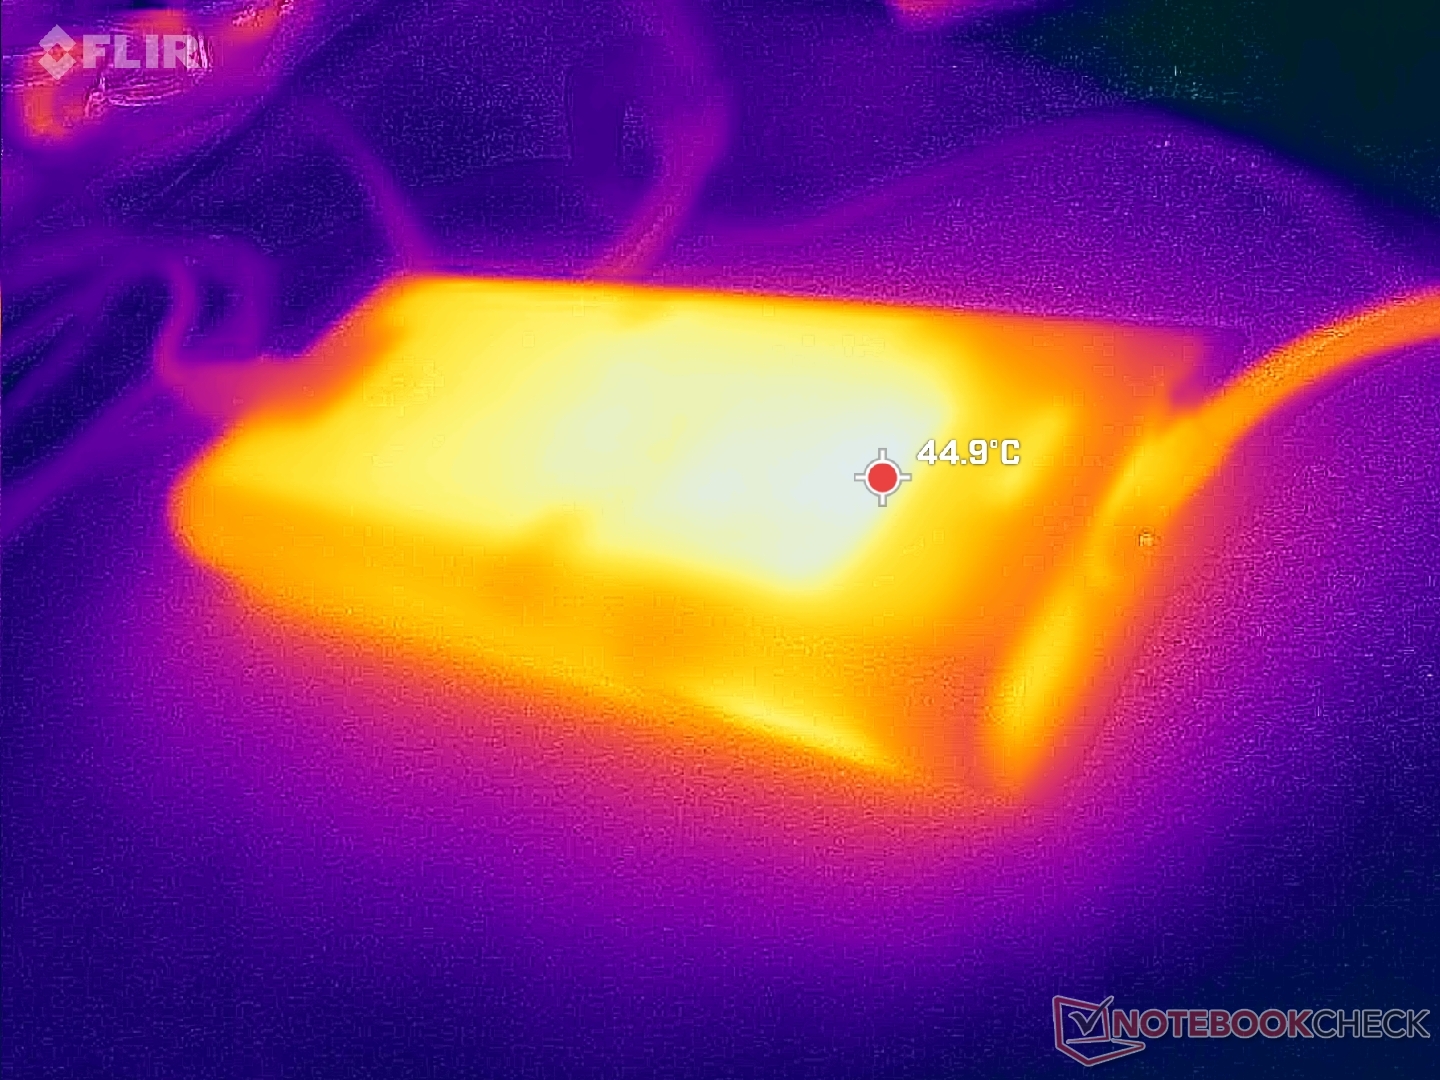
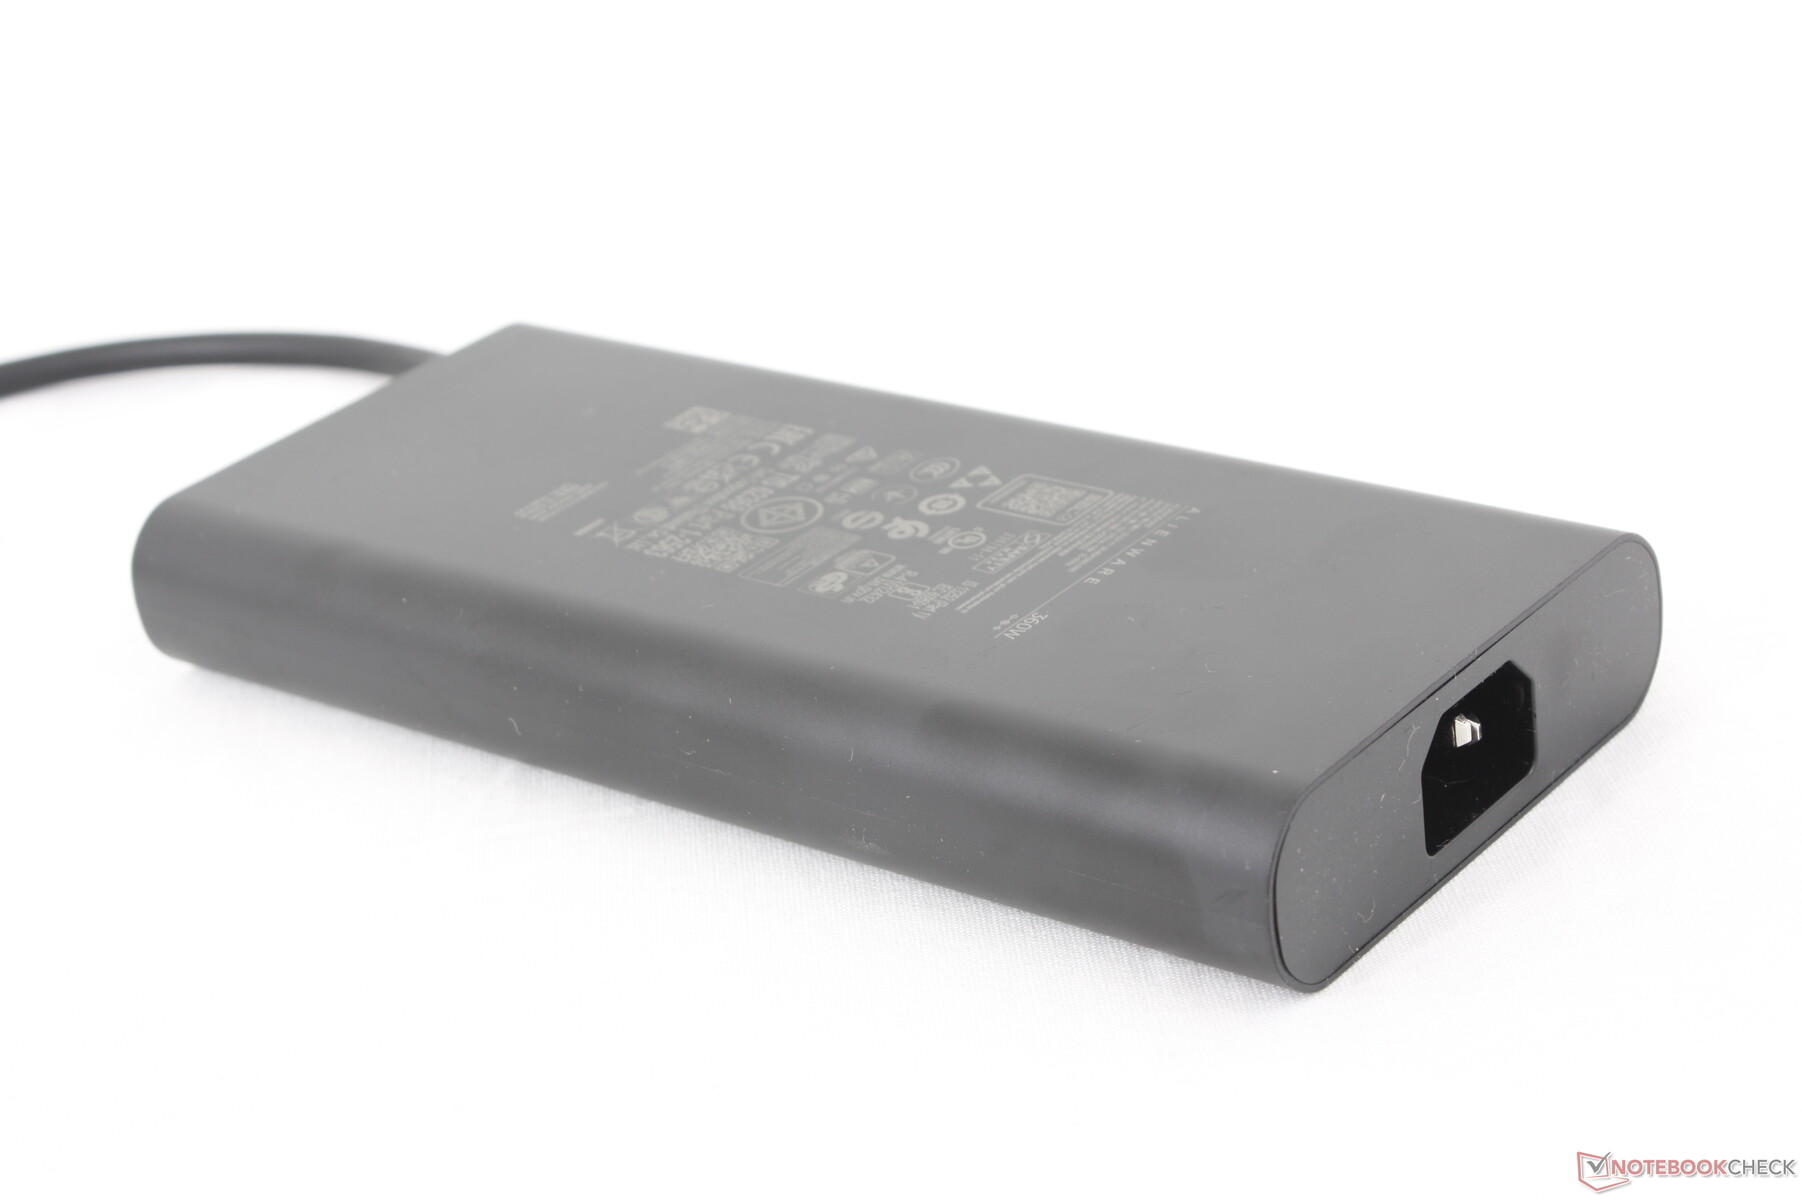
360 W GaN 交流适配器的尺寸(约 189 x 8.5 x 2.6 厘米)与上述联想笔记本电脑随附的 400 W 巨大适配器相比还算合理。
| Off / Standby | |
| Idle | |
| Load |
|
Key:
min: | |
| Alienware 16 Area-51 Ultra 9 275HX, GeForce RTX 5080 Laptop, Samsung PM9C1a MZ9L81T0HDLB, IPS, 2560x1600, 16" | Alienware x16 R2 P120F Ultra 9 185H, GeForce RTX 4080 Laptop GPU, WDC PC SN810 1TB, IPS, 2560x1600, 16" | Razer Blade 16 RTX 5080 Ryzen AI 9 365, GeForce RTX 5080 Laptop, Samsung PM9A1 MZVL21T0HCLR, OLED, 2560x1600, 16" | Gigabyte Aero X16 1WH Ryzen AI 7 350, GeForce RTX 5070 Laptop, Kingston OM8PGP41024Q-A0, IPS, 2560x1600, 16" | MSI Vector A18 HX A9W R9 9955HX, GeForce RTX 5070 Ti Laptop, , IPS, 2560x1600, 18" | Lenovo Legion Pro 7i 16 Gen 10 Ultra 9 275HX, GeForce RTX 5080 Laptop, SK Hynix HFS001TEJ9X115N, OLED, 2560x1600, 16" | |
|---|---|---|---|---|---|---|
| Power Consumption | 35% | 40% | 58% | -13% | -14% | |
| Idle Minimum * (Watt) | 27 | 9.9 63% | 7 74% | 5.8 79% | 20.8 23% | 28.5 -6% |
| Idle Average * (Watt) | 33.5 | 14.5 57% | 15 55% | 10.9 67% | 52.8 -58% | 38.8 -16% |
| Idle Maximum * (Watt) | 41.4 | 33.5 19% | 15.4 63% | 11.2 73% | 54.5 -32% | 45.6 -10% |
| Load Average * (Watt) | 124.7 | 97.5 22% | 108.5 13% | 91.3 27% | 146.6 -18% | 132.2 -6% |
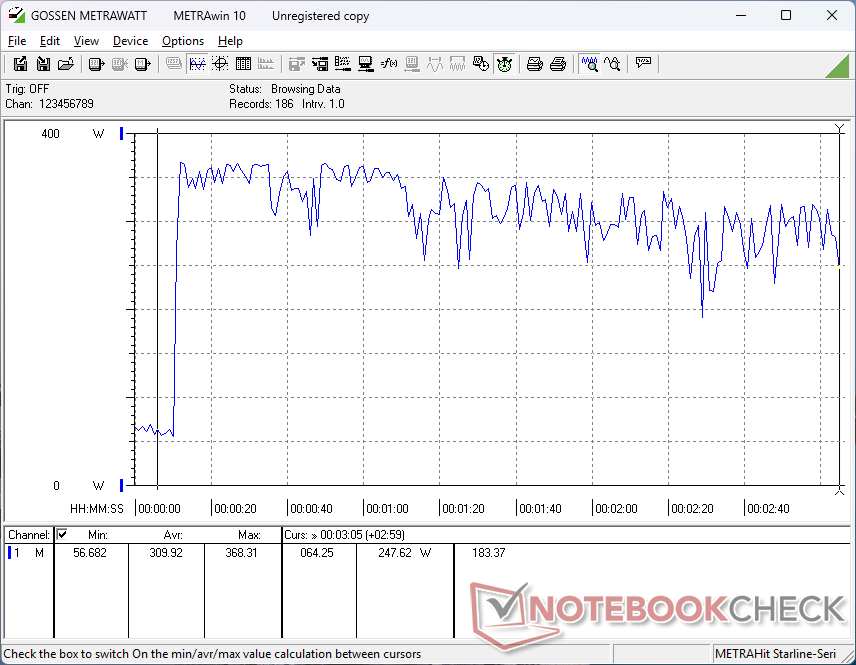
| Cyberpunk 2077 ultra external monitor * (Watt) | 249 | 194.8 22% | 117.9 53% | 278 -12% | 319 -28% | |
| Cyberpunk 2077 ultra * (Watt) | 256 | 195.2 24% | 123.8 52% | 285 -11% | 318 -24% | |
| Load Maximum * (Watt) | 367.2 | 315.2 14% | 254.1 31% | 155.3 58% | 297.3 19% | 384 -5% |
| Witcher 3 ultra * (Watt) | 230 |
* ... smaller is better
Power Consumption Cyberpunk / Stress Test
Power Consumption external Monitor
电池寿命
即使在 iGPU 模式、电池模式下运行,禁用 LED 并将刷新率从 240 Hz 降至 60 Hz,由于上述高空闲功耗,运行时间与去年的 Alienware x16 R2 一样糟糕。Razer Blade 16 或 技嘉 Aero X16等同类产品的续航时间都要长几个小时。
| Alienware 16 Area-51 Ultra 9 275HX, GeForce RTX 5080 Laptop, 96 Wh | Alienware x16 R2 P120F Ultra 9 185H, GeForce RTX 4080 Laptop GPU, 90 Wh | Razer Blade 16 RTX 5080 Ryzen AI 9 365, GeForce RTX 5080 Laptop, 90 Wh | Gigabyte Aero X16 1WH Ryzen AI 7 350, GeForce RTX 5070 Laptop, 76 Wh | MSI Vector A18 HX A9W R9 9955HX, GeForce RTX 5070 Ti Laptop, 99 Wh | Lenovo Legion Pro 7i 16 Gen 10 Ultra 9 275HX, GeForce RTX 5080 Laptop, 99 Wh | |
|---|---|---|---|---|---|---|
| Battery runtime | 14% | 186% | 207% | 81% | 93% | |
| Reader / Idle (h) | 3.1 | 7 126% | ||||
| WiFi v1.3 (h) | 2.8 | 3.2 14% | 8 186% | 8.6 207% | 3.8 36% | 5.4 93% |
| Load (h) | 0.8 |
笔记本检查评级
Alienware 16 Area-51
- 06/09/2025 v8
Allen Ngo
 Total Sustainability Score:
 Potential Competitors in Comparison
Image | Model / Review | Price | Weight | Height | Display |
|---|---|---|---|---|---|
1. 85.7%  | Alienware 16 Area-51 Intel Core Ultra 9 275HX ⎘ NVIDIA GeForce RTX 5080 Laptop ⎘ 32 GB Memory, 1024 GB SSD | Amazon: 1. $3,099.00 Alienware 16 Area-51 Gaming ... 2. $3,799.99 Alienware 16 Area-51 Gaming ... 3. $3,799.99 Alienware 16 Area-51 Gaming ... List Price: 3500 USD | 3.3 kg | 28.5 mm | 16.00" 2560x1600 189 PPI IPS |
2. 88.4% v7 (old) 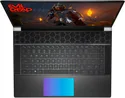 | Alienware x16 R2 P120F Intel Core Ultra 9 185H ⎘ NVIDIA GeForce RTX 4080 Laptop GPU ⎘ 32 GB Memory, 1024 GB SSD | Amazon: List Price: 3200 USD | 2.7 kg | 18.57 mm | 16.00" 2560x1600 189 PPI IPS |
3. 87.2% 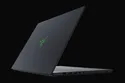 | Razer Blade 16 RTX 5080 AMD Ryzen AI 9 365 ⎘ NVIDIA GeForce RTX 5080 Laptop ⎘ 32 GB Memory, 1024 GB SSD | Amazon: List Price: 3500 USD | 2.1 kg | 17.4 mm | 16.00" 2560x1600 189 PPI OLED |
4. 83.7%  | Gigabyte Aero X16 1WH AMD Ryzen AI 7 350 ⎘ NVIDIA GeForce RTX 5070 Laptop ⎘ 32 GB Memory, 1024 GB SSD | Amazon: List Price: 1799€ | 2 kg | 19.9 mm | 16.00" 2560x1600 189 PPI IPS |
5. 84.8%  | MSI Vector A18 HX A9W AMD Ryzen 9 9955HX ⎘ NVIDIA GeForce RTX 5070 Ti Laptop ⎘ 32 GB Memory | Amazon: List Price: 3200 USD | 3.5 kg | 32.05 mm | 18.00" 2560x1600 189 PPI IPS |
6. 87.5% 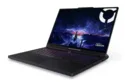 | Lenovo Legion Pro 7i 16 Gen 10 Intel Core Ultra 9 275HX ⎘ NVIDIA GeForce RTX 5080 Laptop ⎘ 32 GB Memory, 1024 GB SSD | Amazon: List Price: 4200 USD | 2.6 kg | 26.65 mm | 16.00" 2560x1600 189 PPI OLED |
Transparency
The selection of devices to be reviewed is made by our editorial team. The test sample was provided to the author as a loan by the manufacturer or retailer for the purpose of this review. The lender had no influence on this review, nor did the manufacturer receive a copy of this review before publication. There was no obligation to publish this review. As an independent media company, Notebookcheck is not subjected to the authority of manufacturers, retailers or publishers.
This is how Notebookcheck is testing
Every year, Notebookcheck independently reviews hundreds of laptops and smartphones using standardized procedures to ensure that all results are comparable. We have continuously developed our test methods for around 20 years and set industry standards in the process. In our test labs, high-quality measuring equipment is utilized by experienced technicians and editors. These tests involve a multi-stage validation process. Our complex rating system is based on hundreds of well-founded measurements and benchmarks, which maintains objectivity. Further information on our test methods can be found here.

