评价:CPU 性能较弱,游戏性能不突出
令人讨厌的是,Vector 17 的 CPU 性能在耐久性测试中急剧下降,尤其是因为 矢量 16在 CPU 性能较弱的情况下也能保持稳定。纯游戏性能充其量只能算一般,但相当稳定。遗憾的是,Vector 17 的噪音相当大。
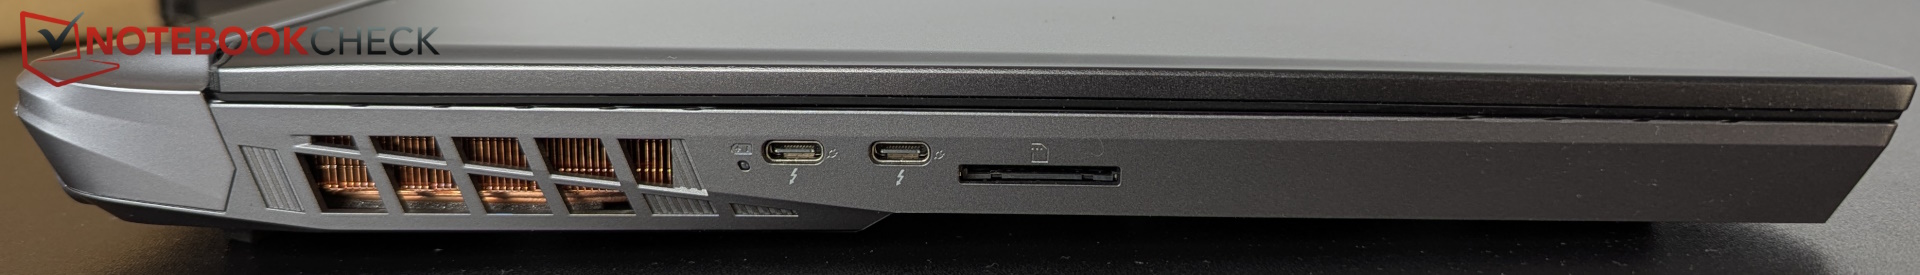
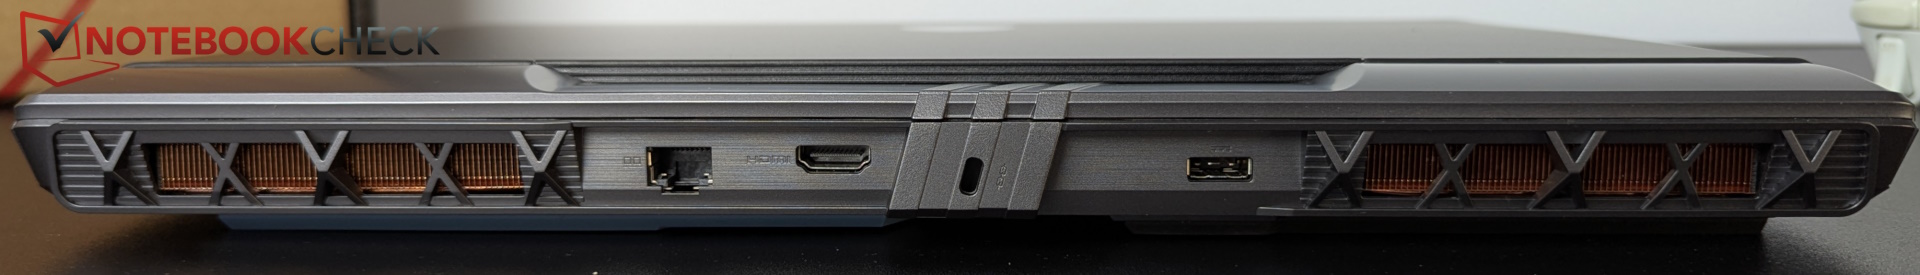
显示屏给人留下了矛盾的印象:它的亮度和 P3 色彩空间都不错,但由于黑色值过高而失去了一些同情。另一方面,配备双 Thunderbolt 5、全 SD 读卡器和 Wi-Fi 7 的设备给人留下了积极的印象。
它仍然是一款普通到不错的游戏笔记本电脑,除了功能之外,并无突出之处。你也可以用大致相同的价格买到 Legion Pro 7i Gen 10它在测试中给我们留下了更深刻的印象。
Pros
Cons
- $2,689.00MSI Vector 16 HX AI A2XW Vector 16 HX AI A2XWIG-420US 16" Gaming Notebook - QHD+ - 240 Hz - Intel Core Ultra 9 275HX - 32 GB - 1 TB SSD - Cosmos Gray
- $99.99400W 20V 20A AC Adapter for MSI Raider Titan 18 HX AI A2XWJG A2XWIG Vector A18 HX A9WIG A9WHG Laptop Charger A23-400P1A A400A001P ADP-400CB B Power Supply
- $1,899.99msi Vector 16 HX AI A2XWHG-285US WQXGA 240Hz Gaming Laptop, Intel Core Ultra 7 255HX 2.4GHz, 32GB RAM, 1TB SSD, NVIDIA GeForce RTX 5070 Ti 12GB, Window 11 Home, Cosmo Gray
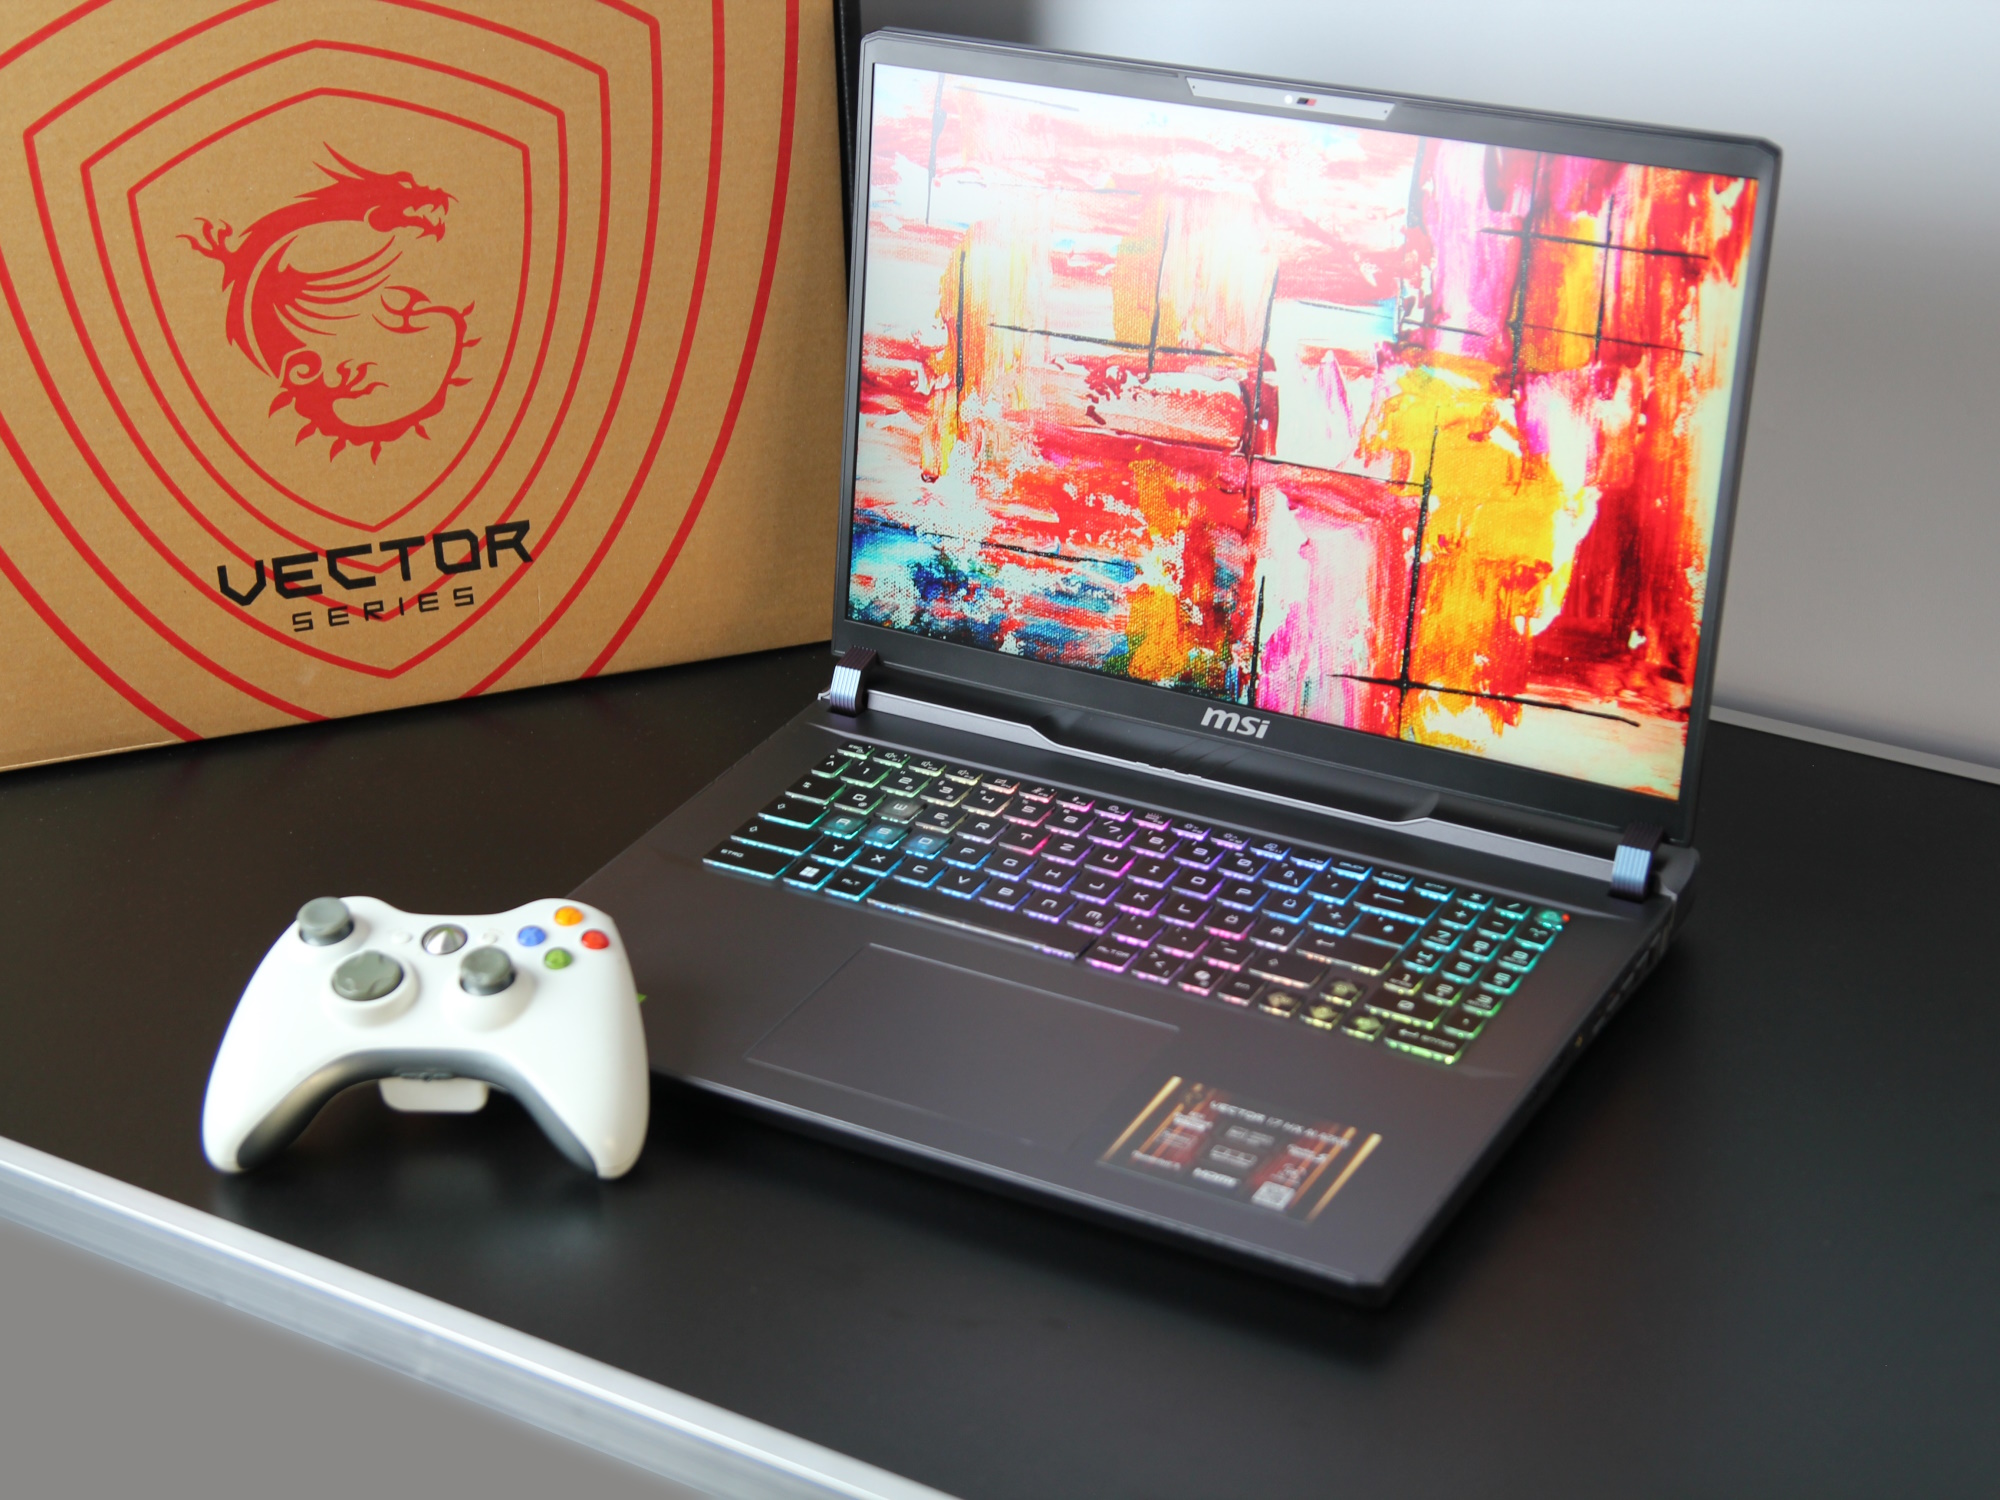
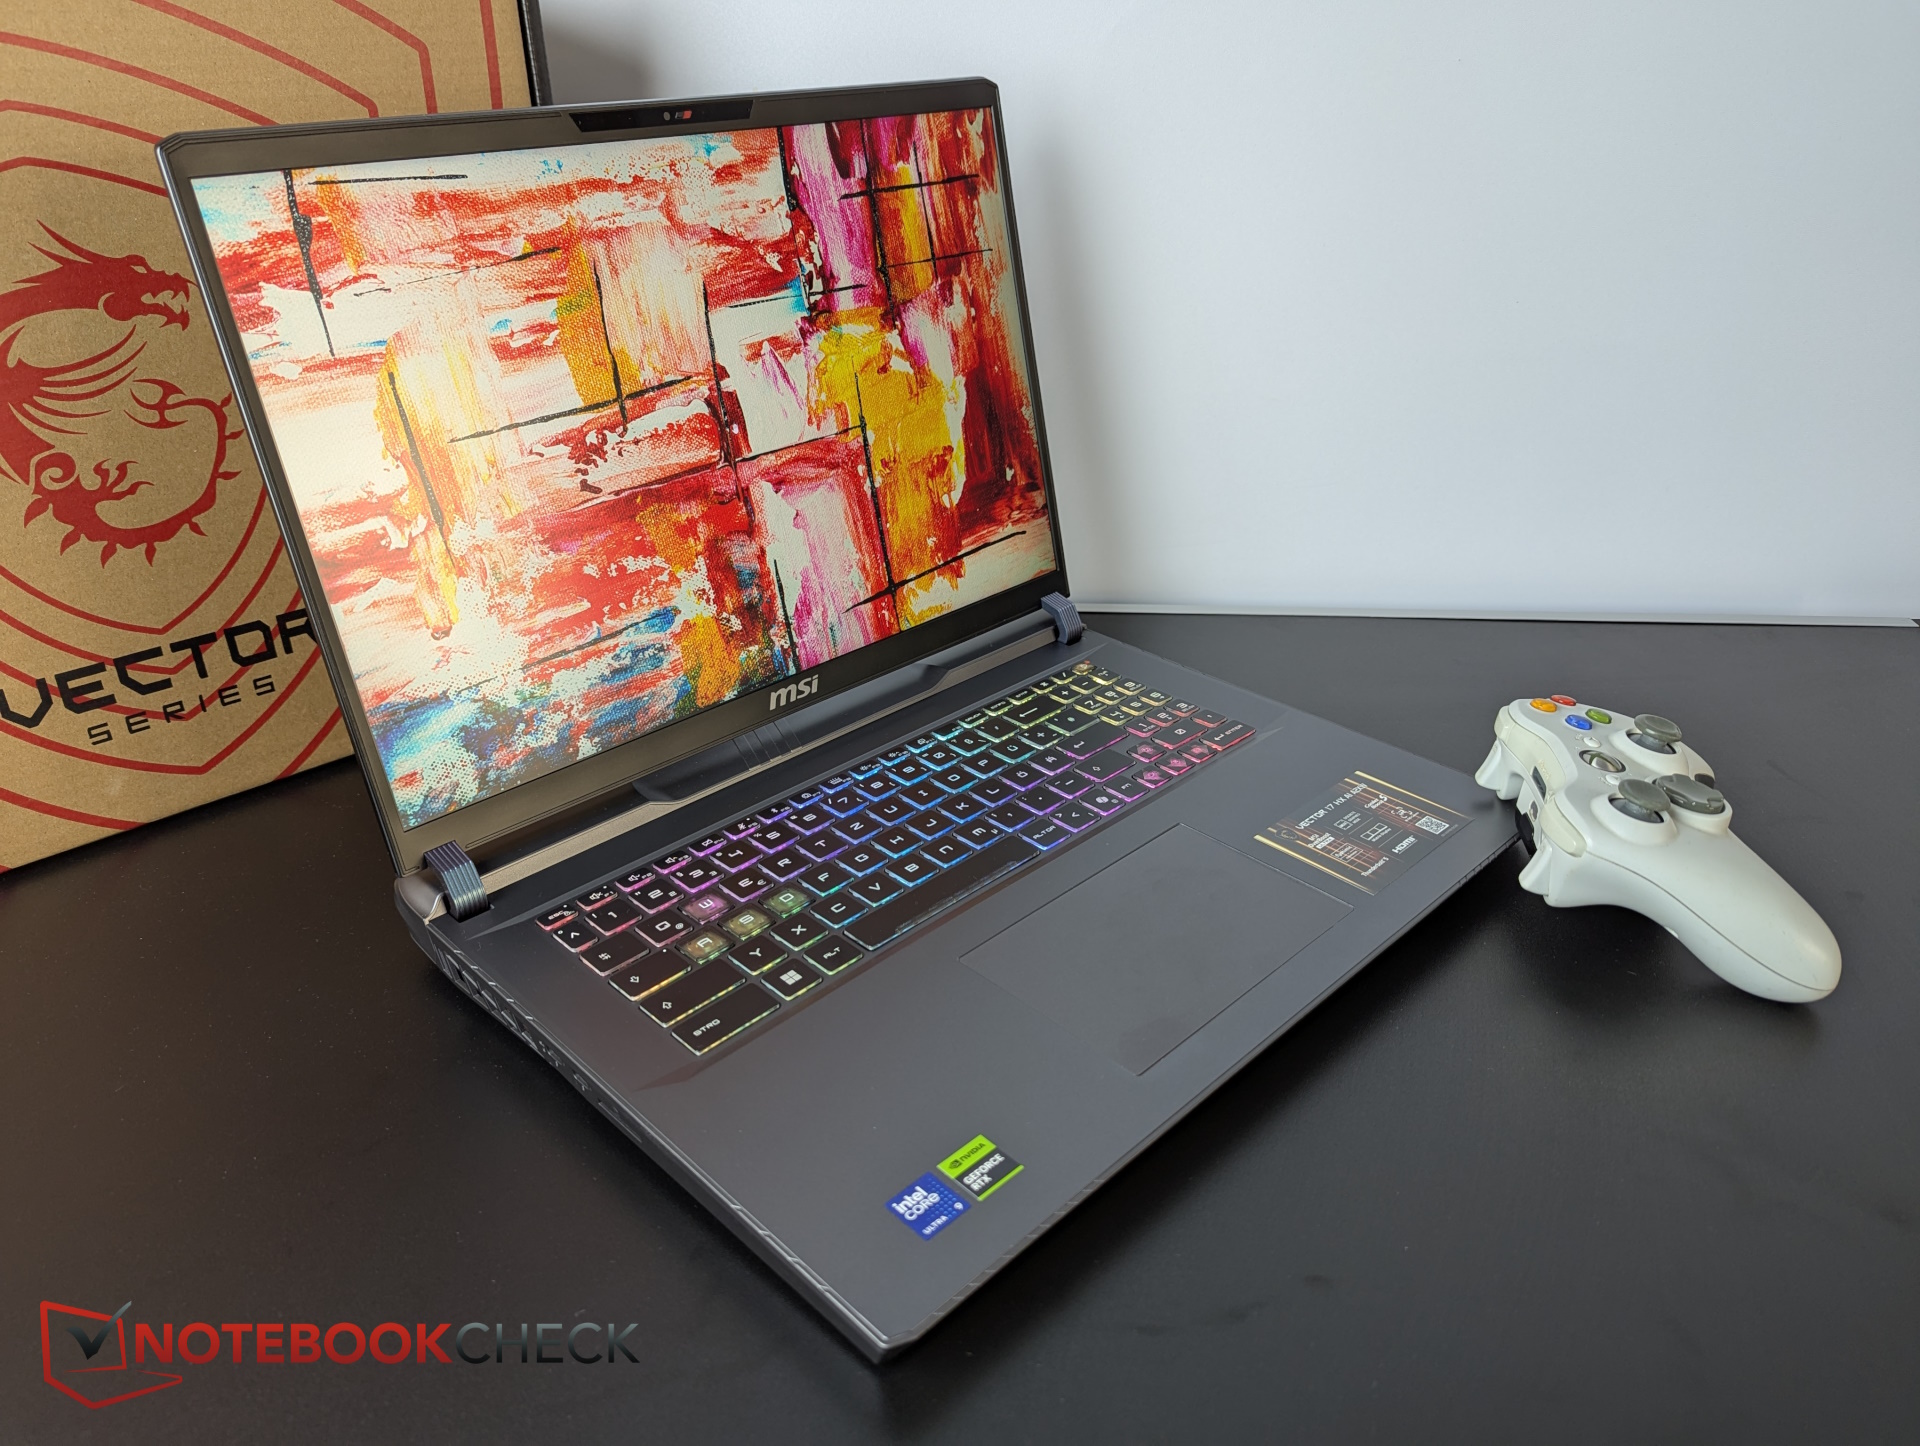
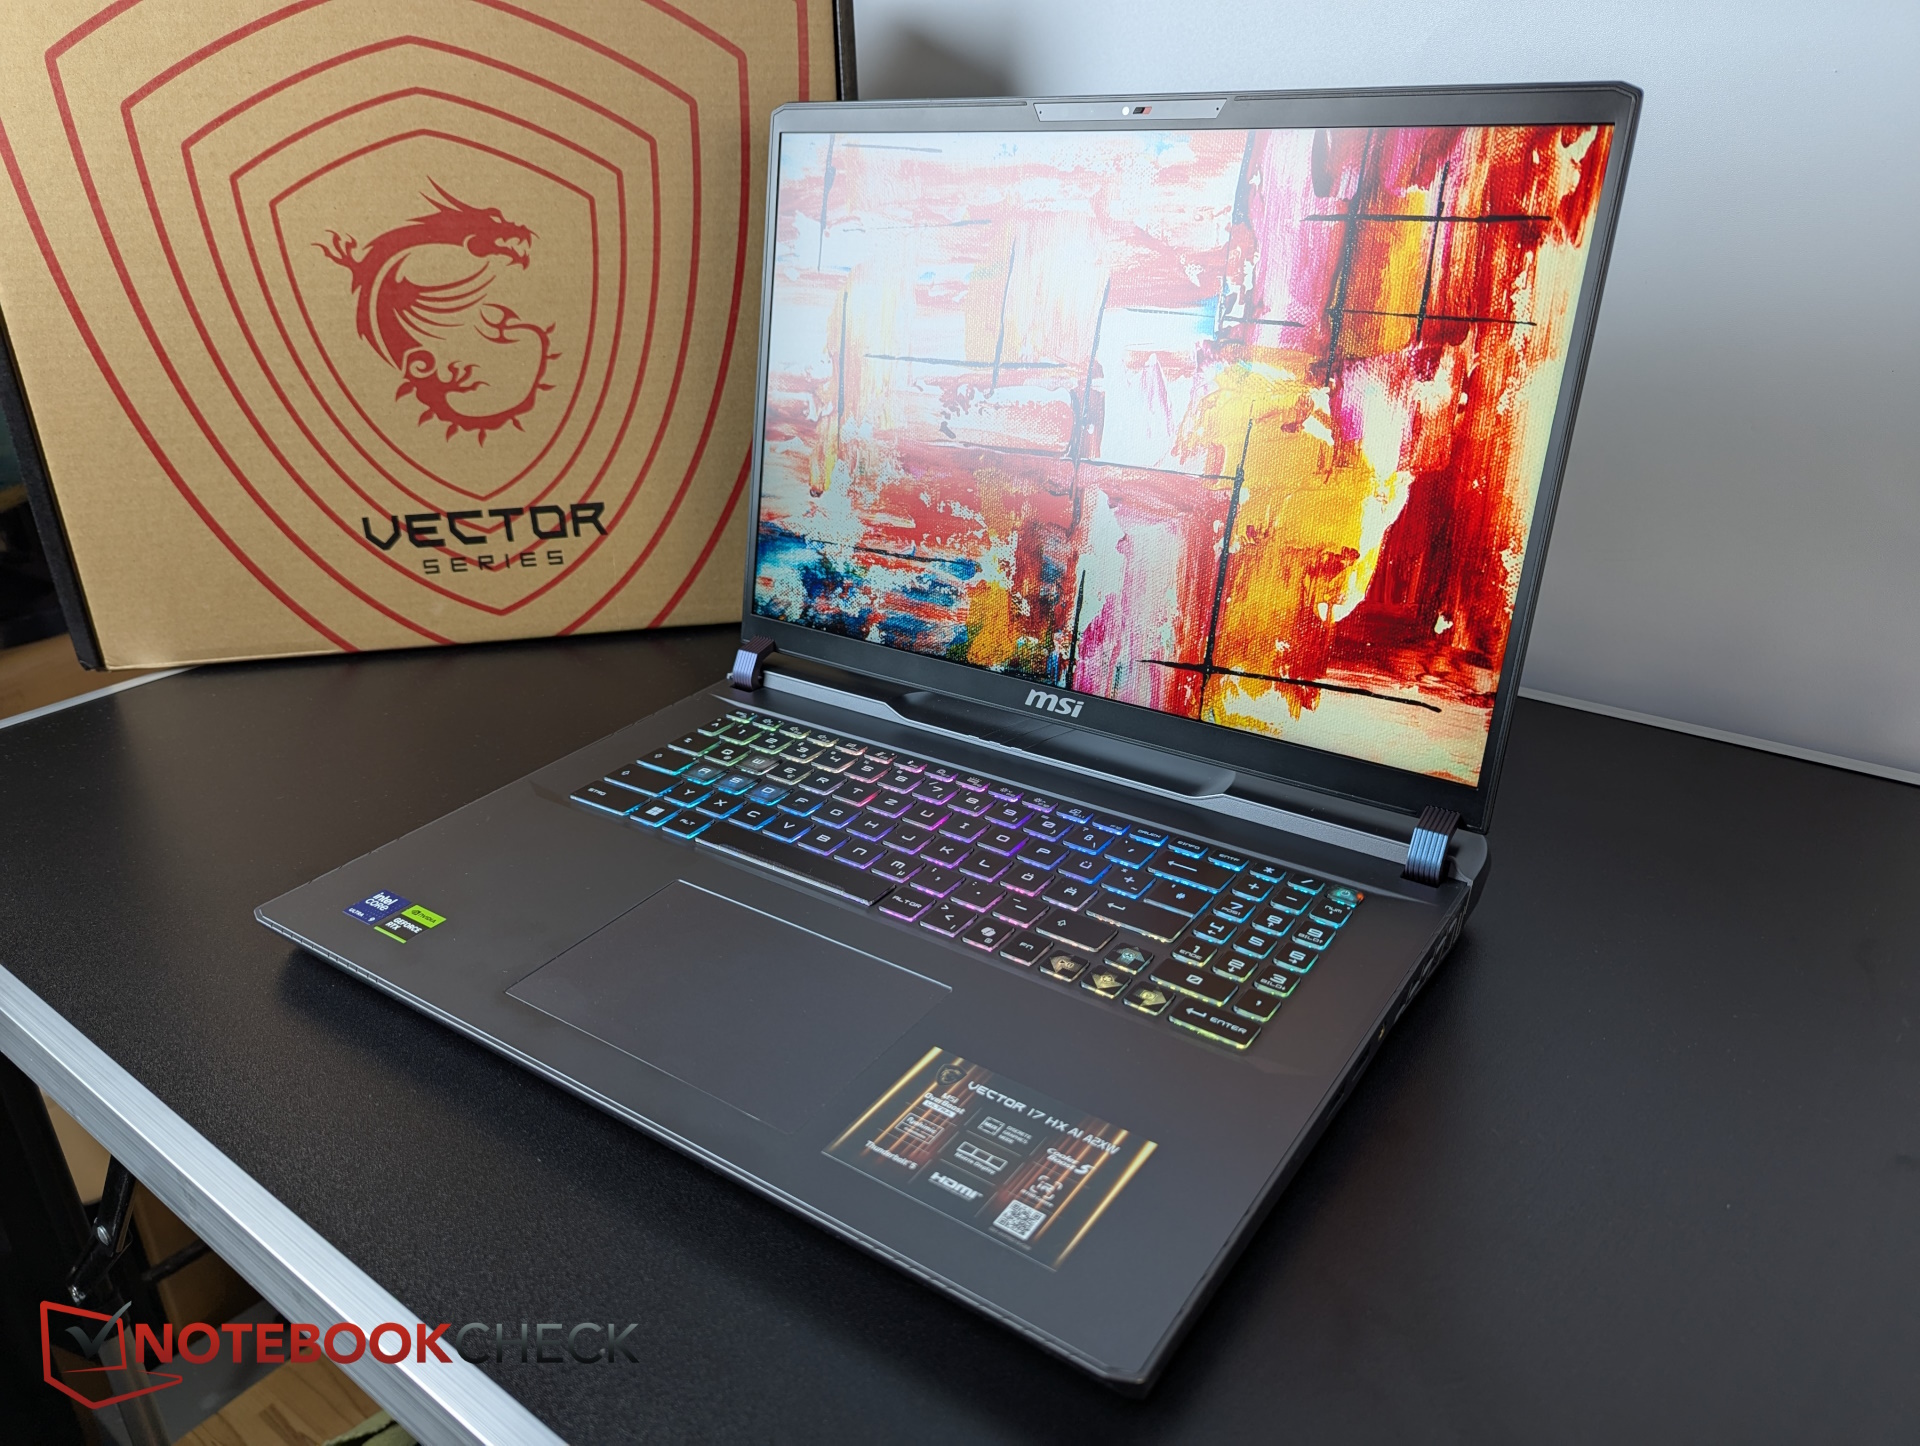
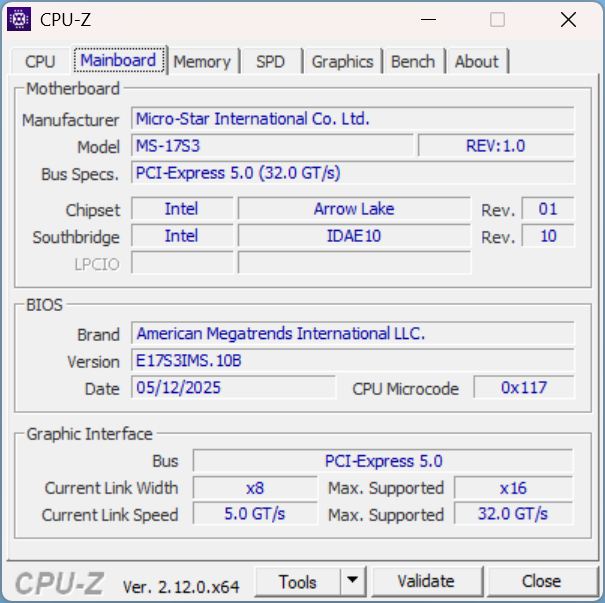
配备 Blackwell 显卡的 17 英寸游戏机极为罕见,因此游戏机正好处于众多 16 英寸和 18 英寸设备之间。我们的 Vector 17 HX AI 可配备 RTX 5090、5080 或 5070 Ti,我们测试的是中间配置。
规格
| SD Card Reader | |
| average JPG Copy Test (av. of 3 runs) | |
| Alienware 16 Area-51 (Toshiba Exceria Pro SDXC 64 GB UHS-II) | |
| Average of class Gaming (20.9 - 210, n=54, last 2 years) | |
| Schenker XMG Neo 16 A25 5090 (Angelbird AV Pro V60) | |
| Aorus MASTER 16 AM6H | |
| MSI Vector 17 HX AI A2XWIG | |
| MSI Titan 18 HX AI A2XWJG (AV PRO microSD 128 GB V60) | |
| MSI Raider A18 HX A9WIG-080 | |
| maximum AS SSD Seq Read Test (1GB) | |
| Schenker XMG Neo 16 A25 5090 (Angelbird AV Pro V60) | |
| Alienware 16 Area-51 (Toshiba Exceria Pro SDXC 64 GB UHS-II) | |
| MSI Vector 17 HX AI A2XWIG | |
| Aorus MASTER 16 AM6H | |
| MSI Raider A18 HX A9WIG-080 | |
| Average of class Gaming (25.5 - 261, n=51, last 2 years) | |
| MSI Titan 18 HX AI A2XWJG (AV PRO microSD 128 GB V60) | |
网络摄像头
安装了一个全高清网络摄像头,具有手动快门、良好的色彩保真度和中等清晰度。


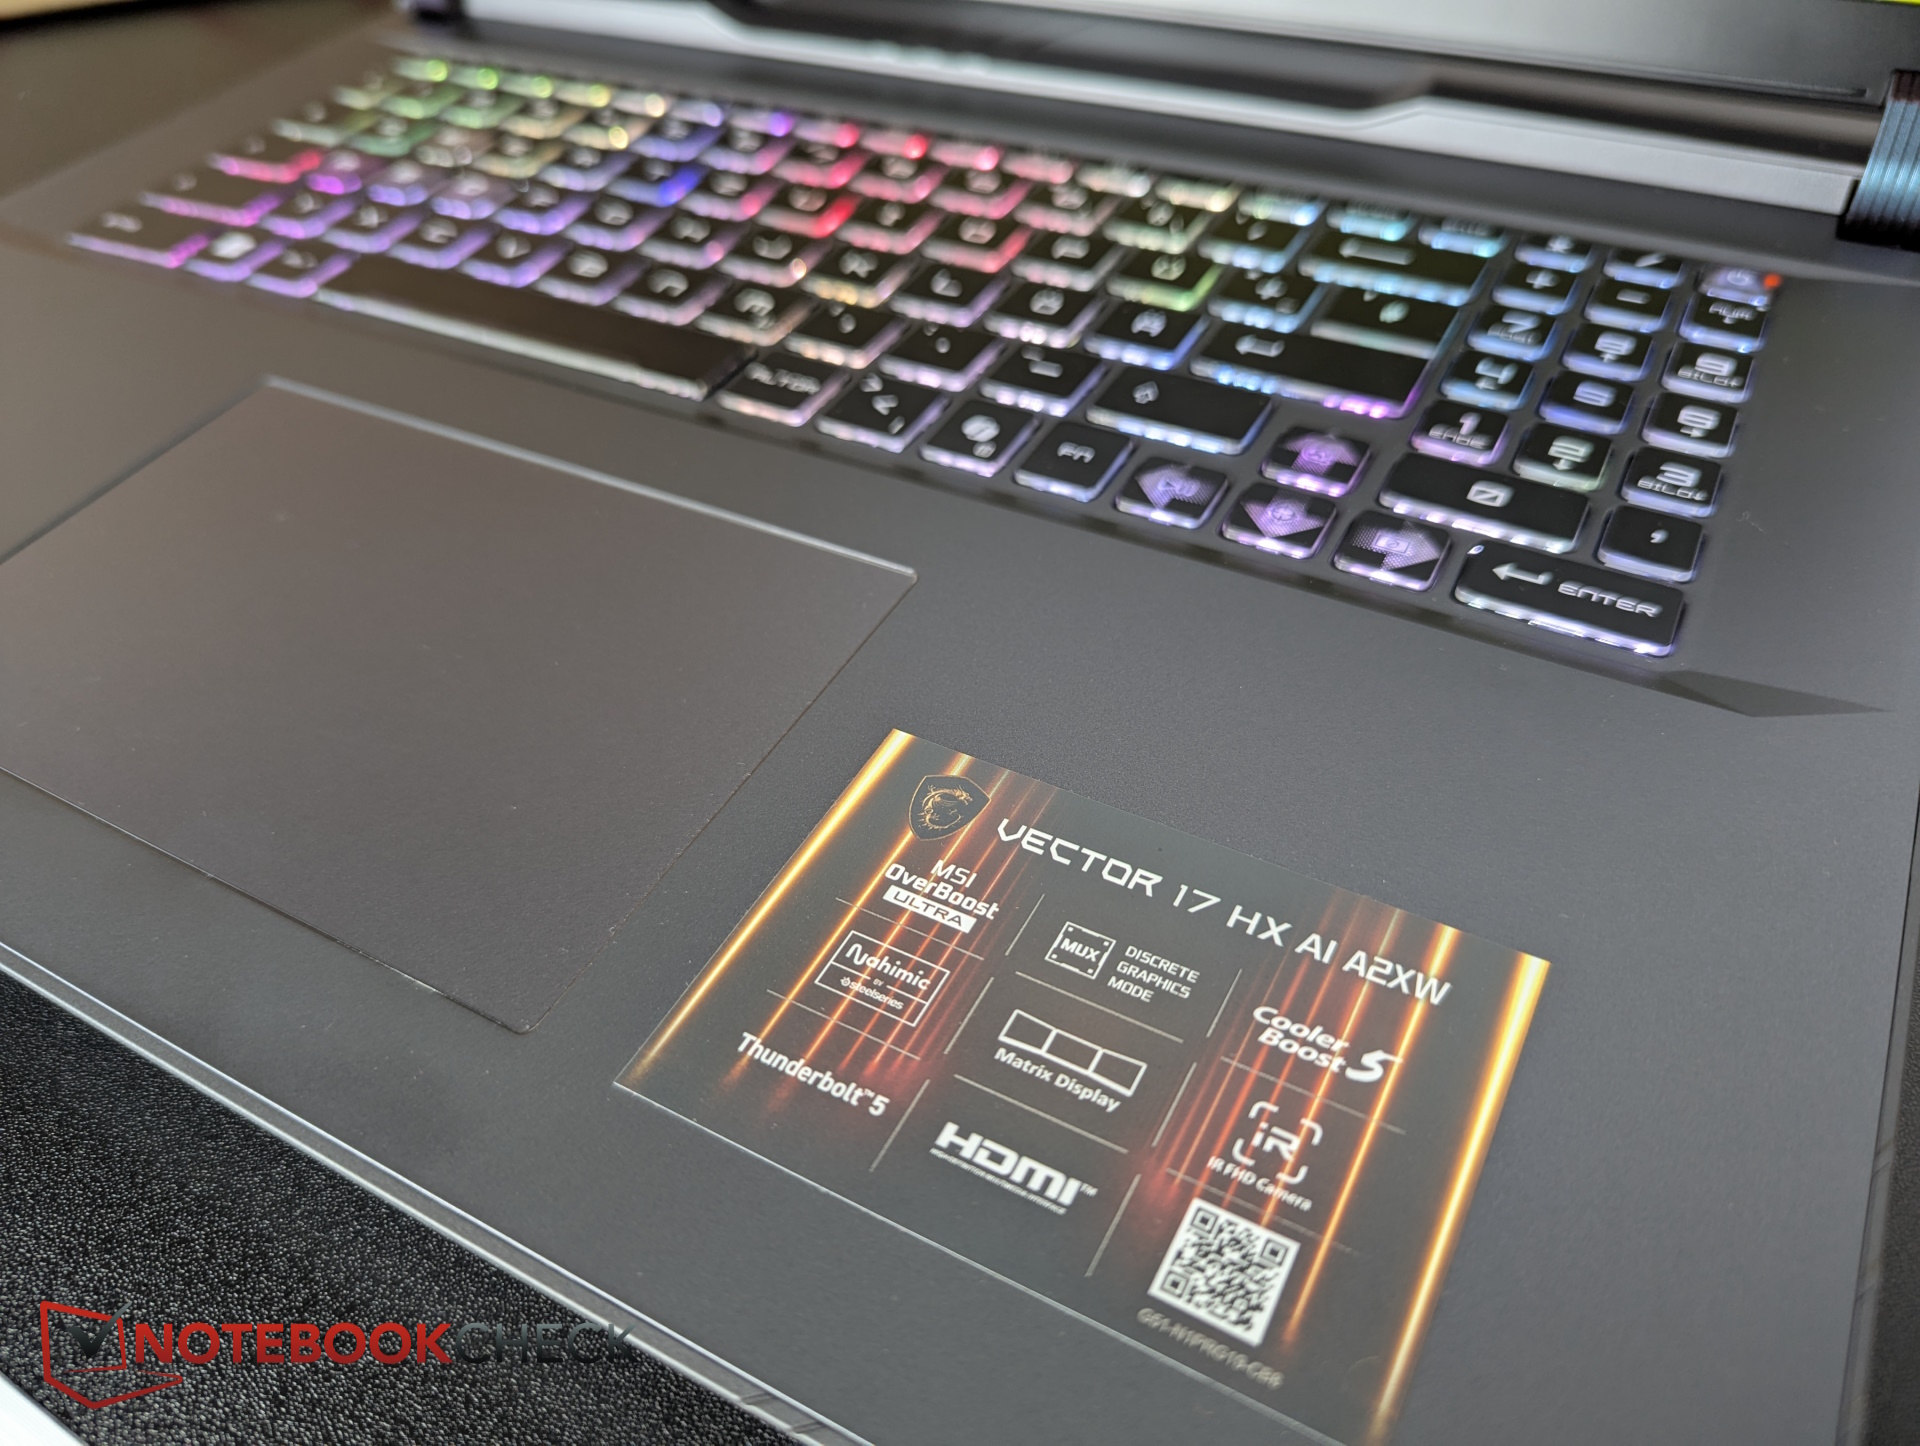
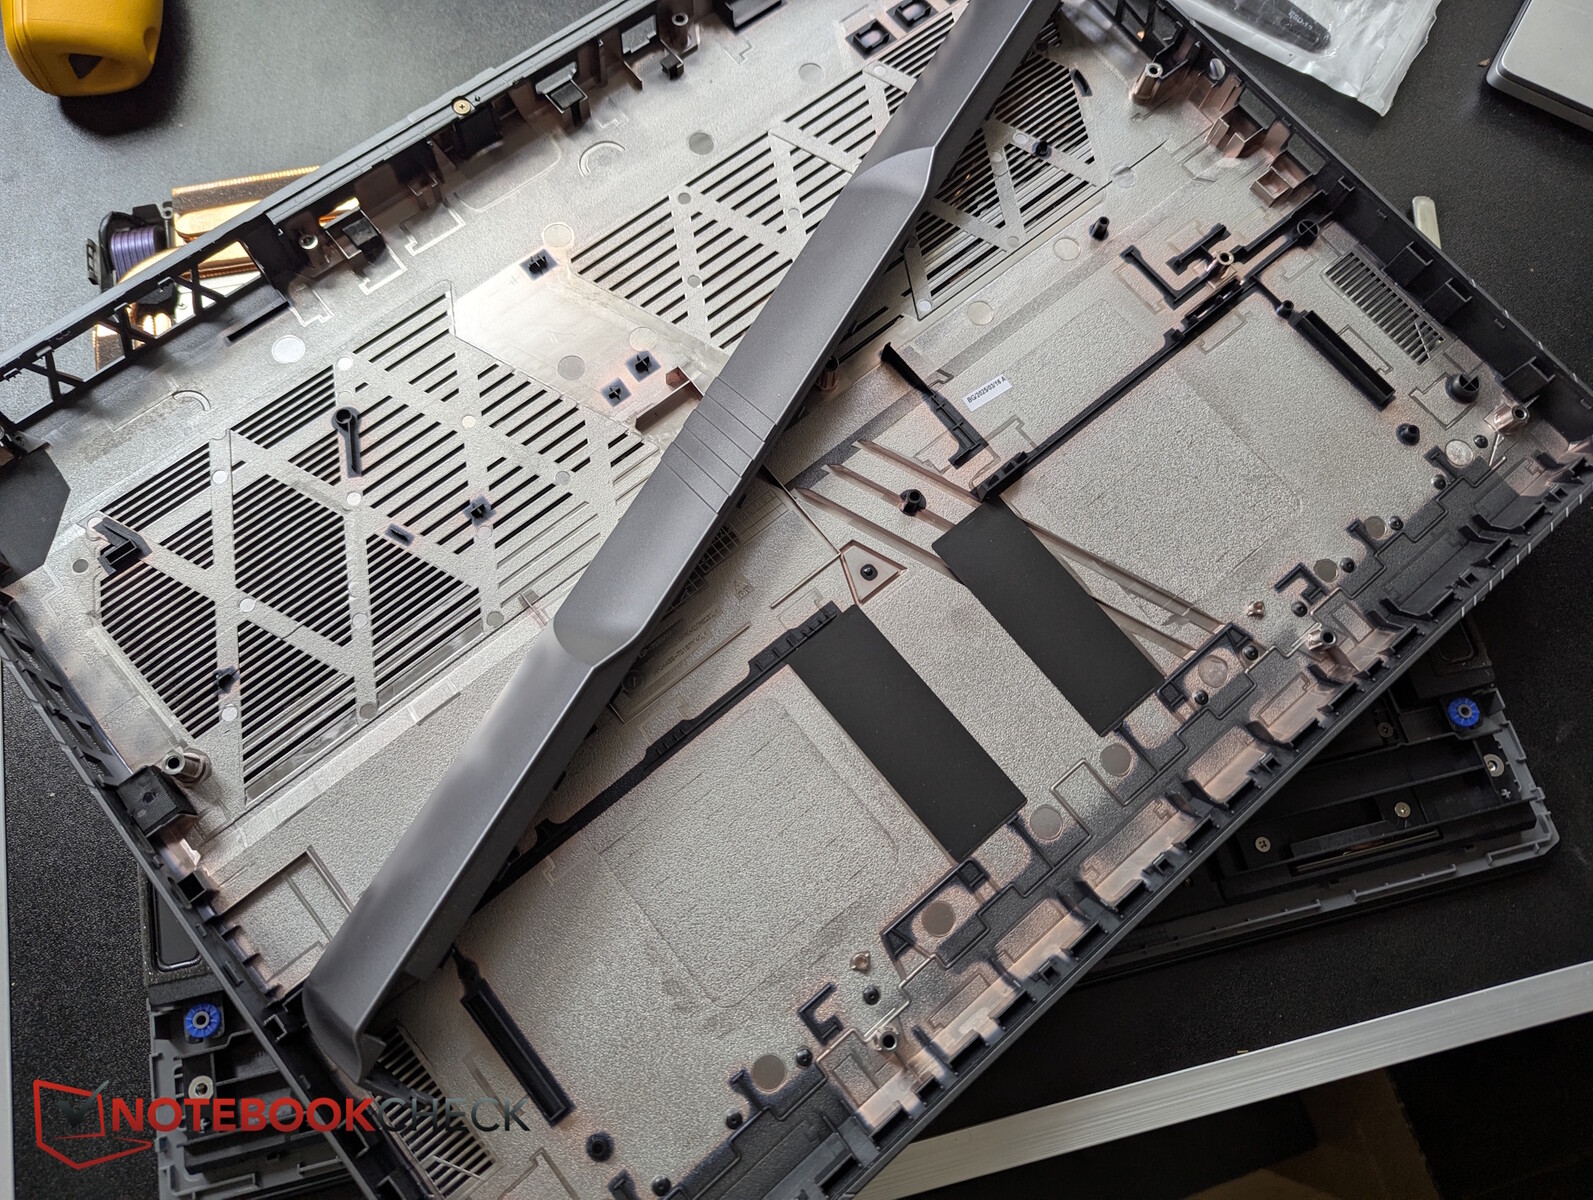
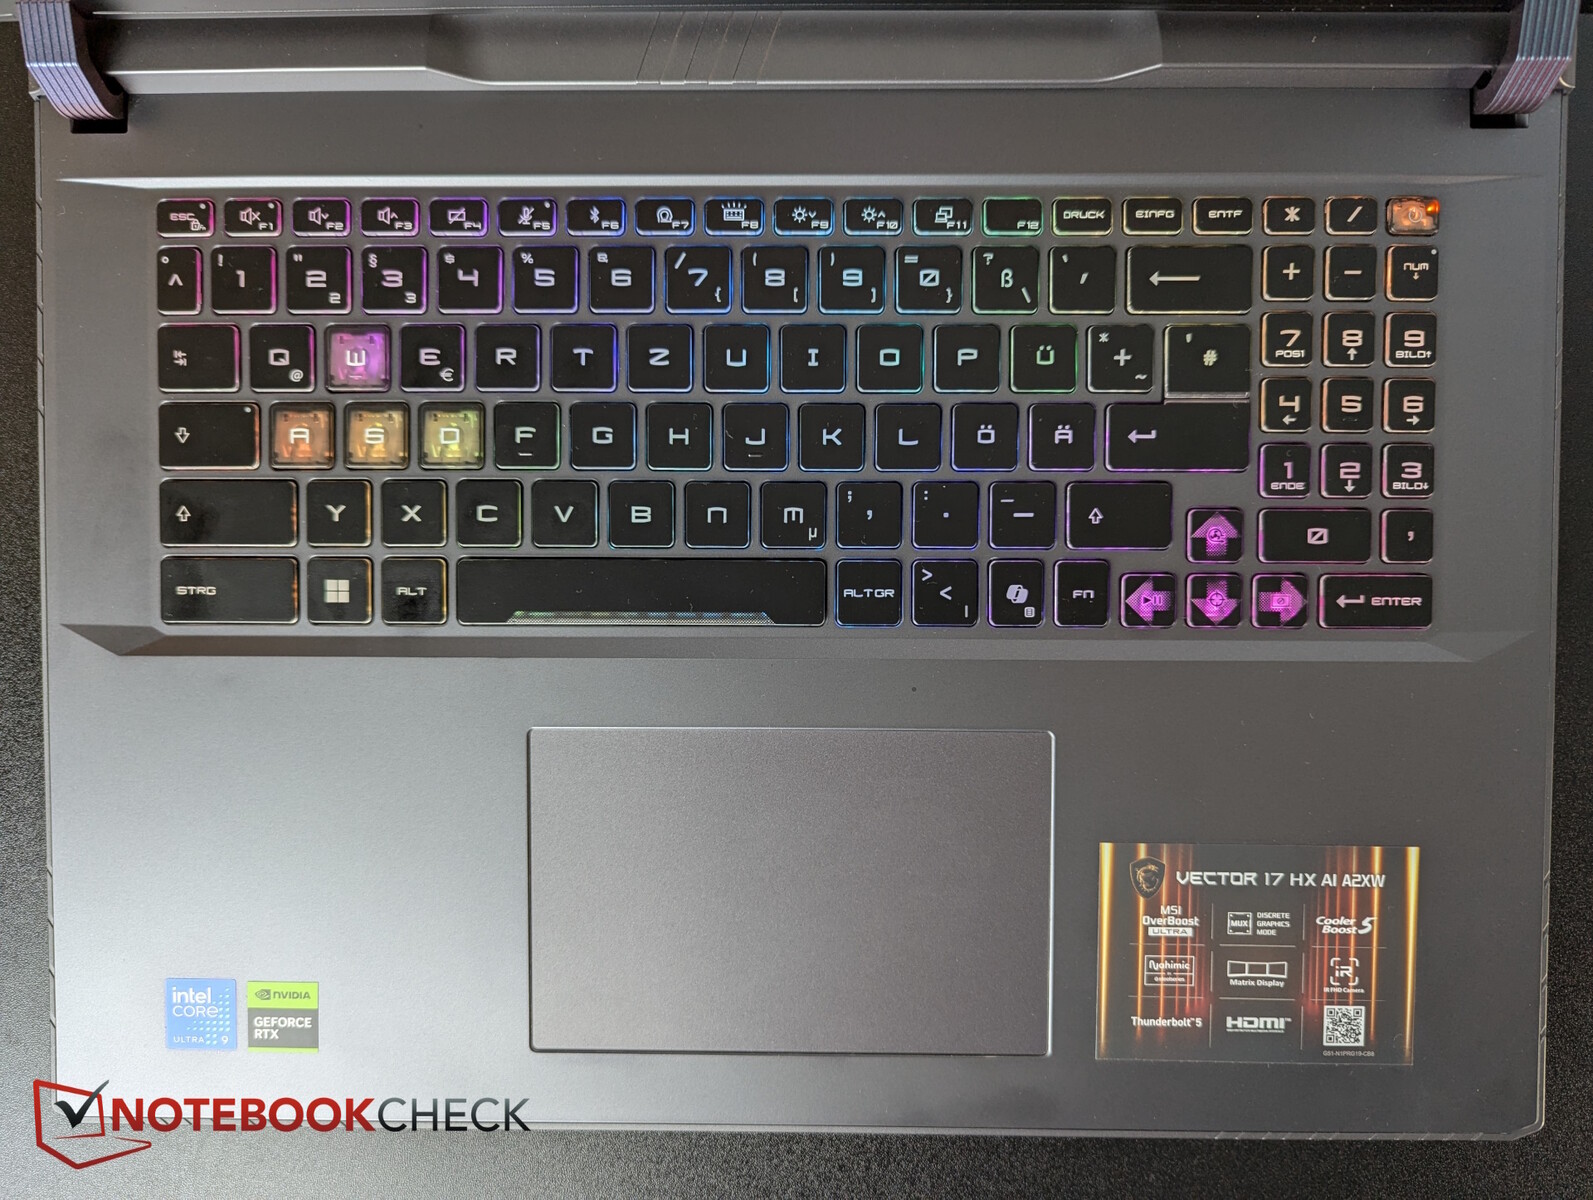
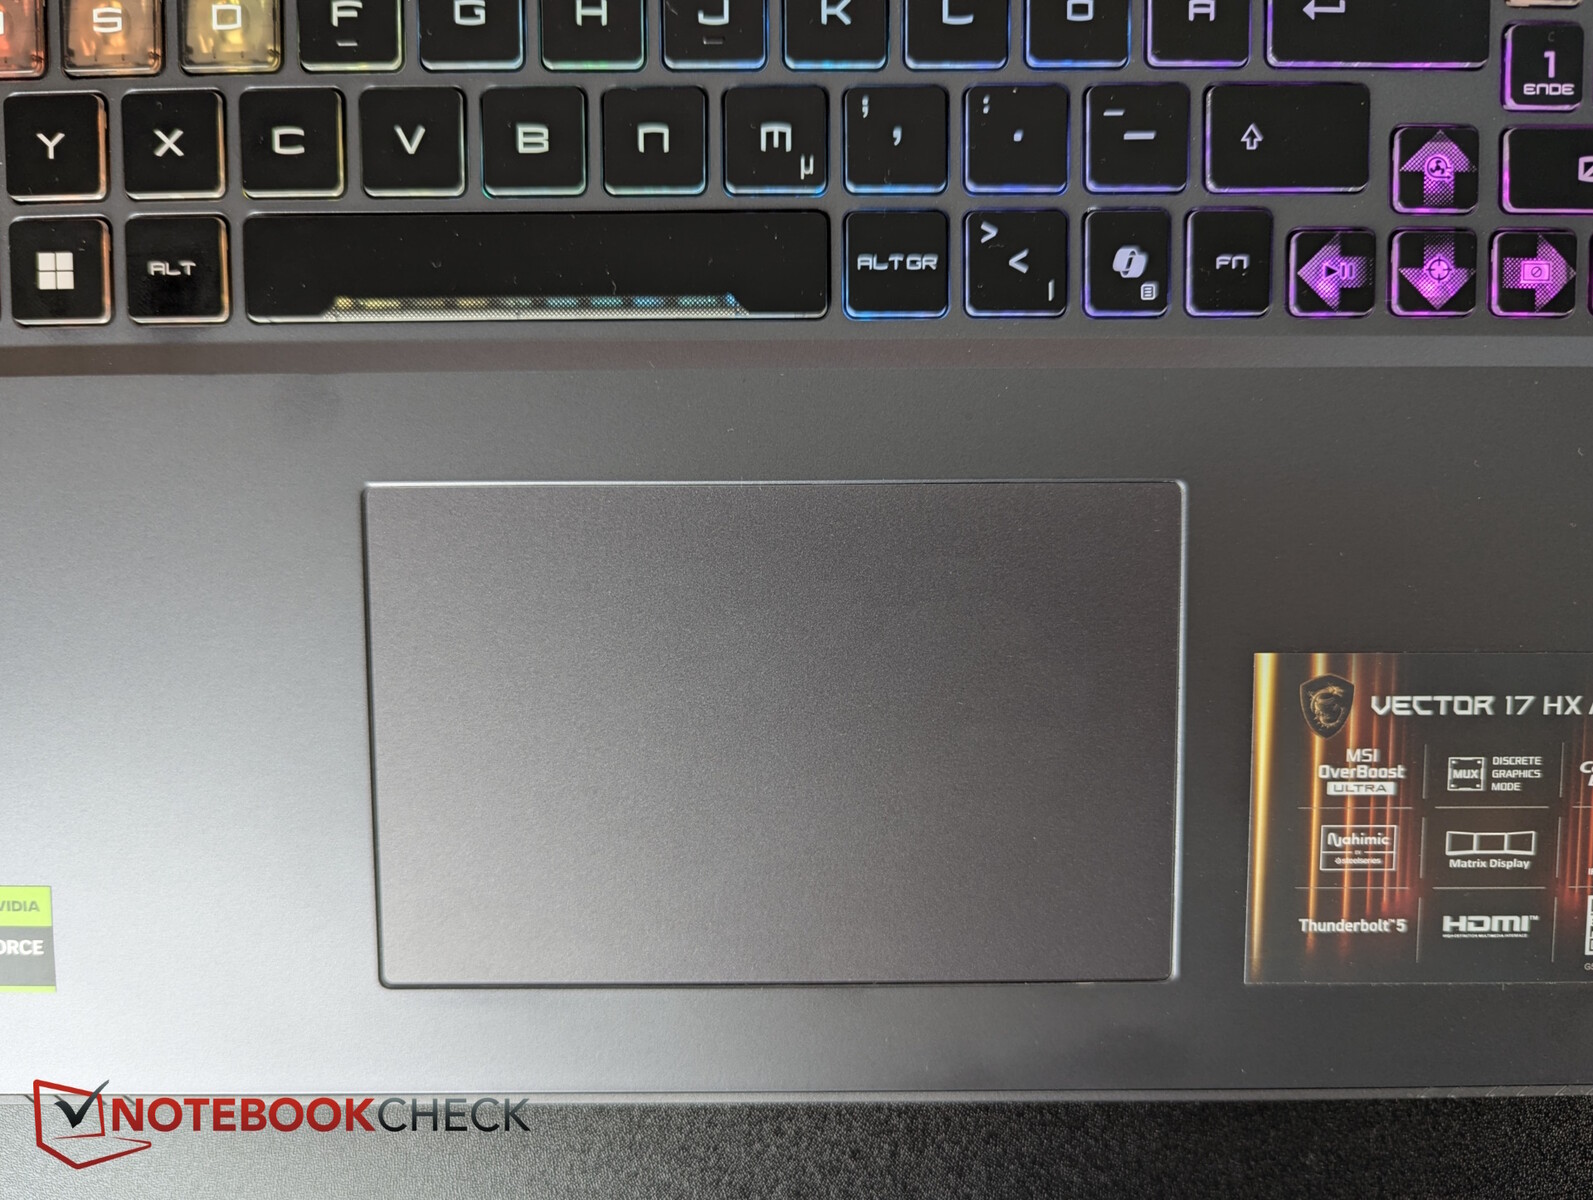
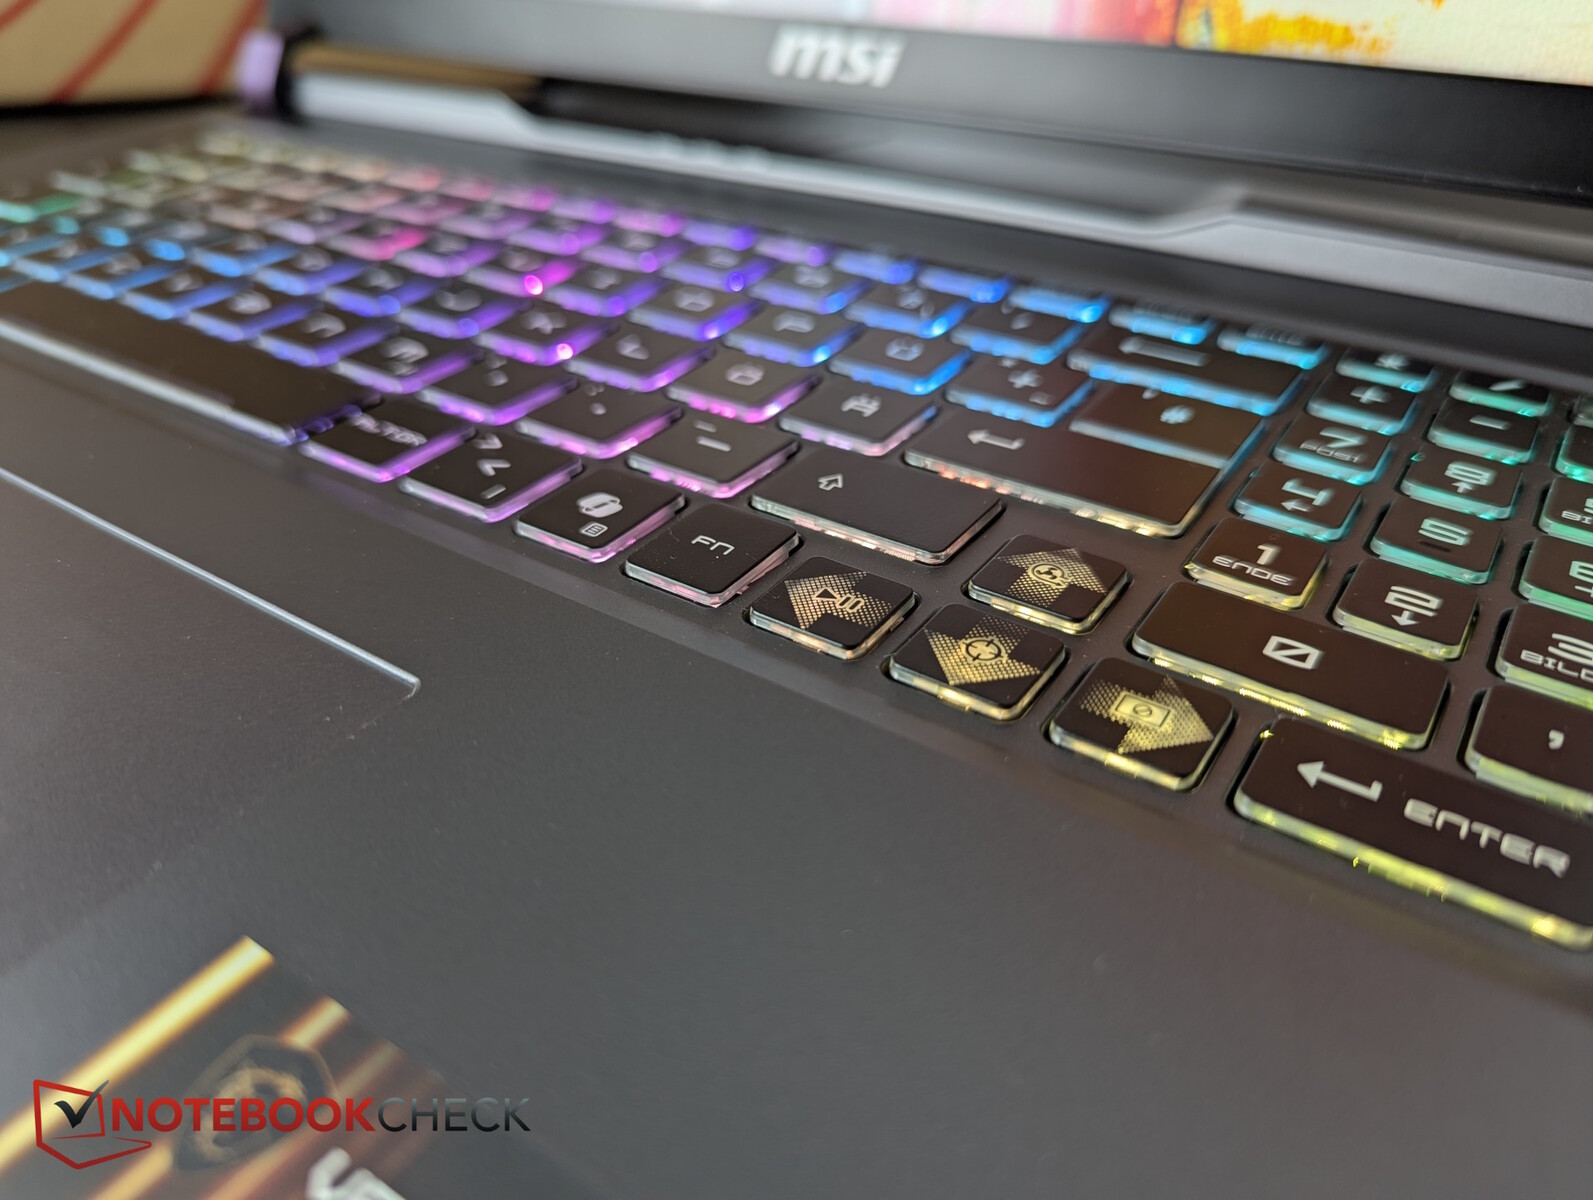
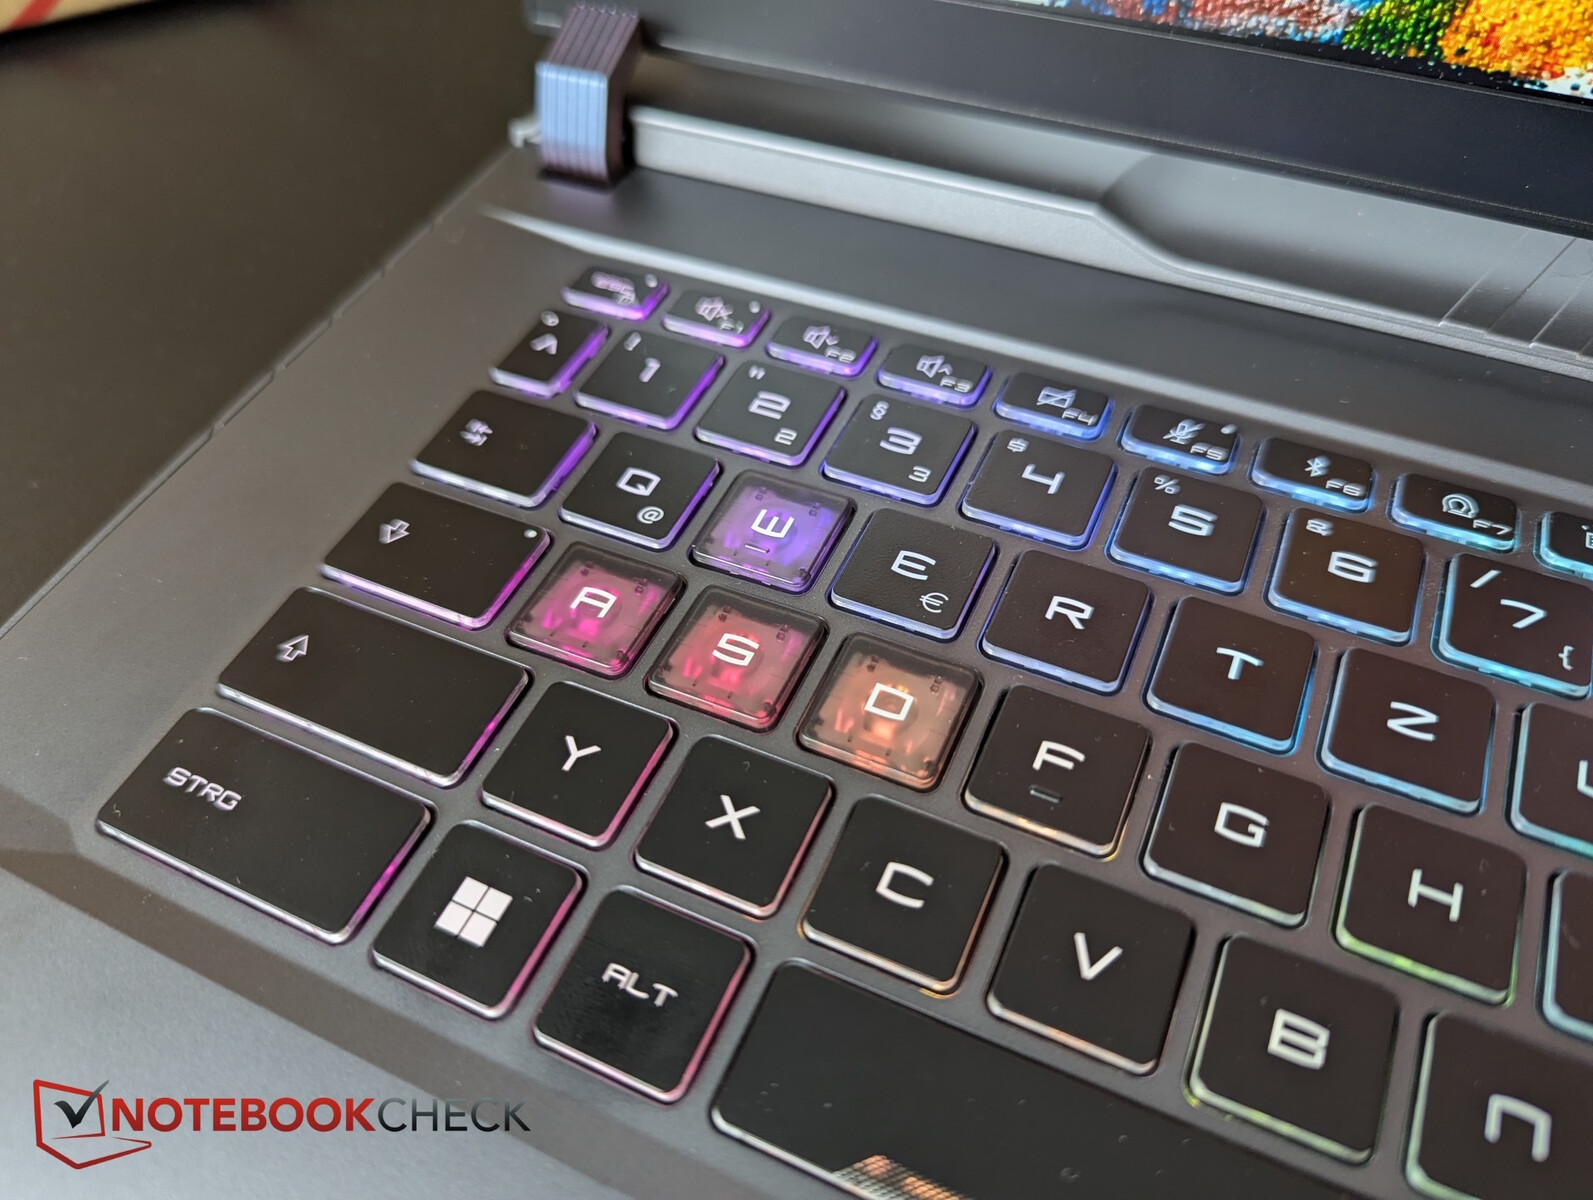
输入设备 - 此 MSI 布局!
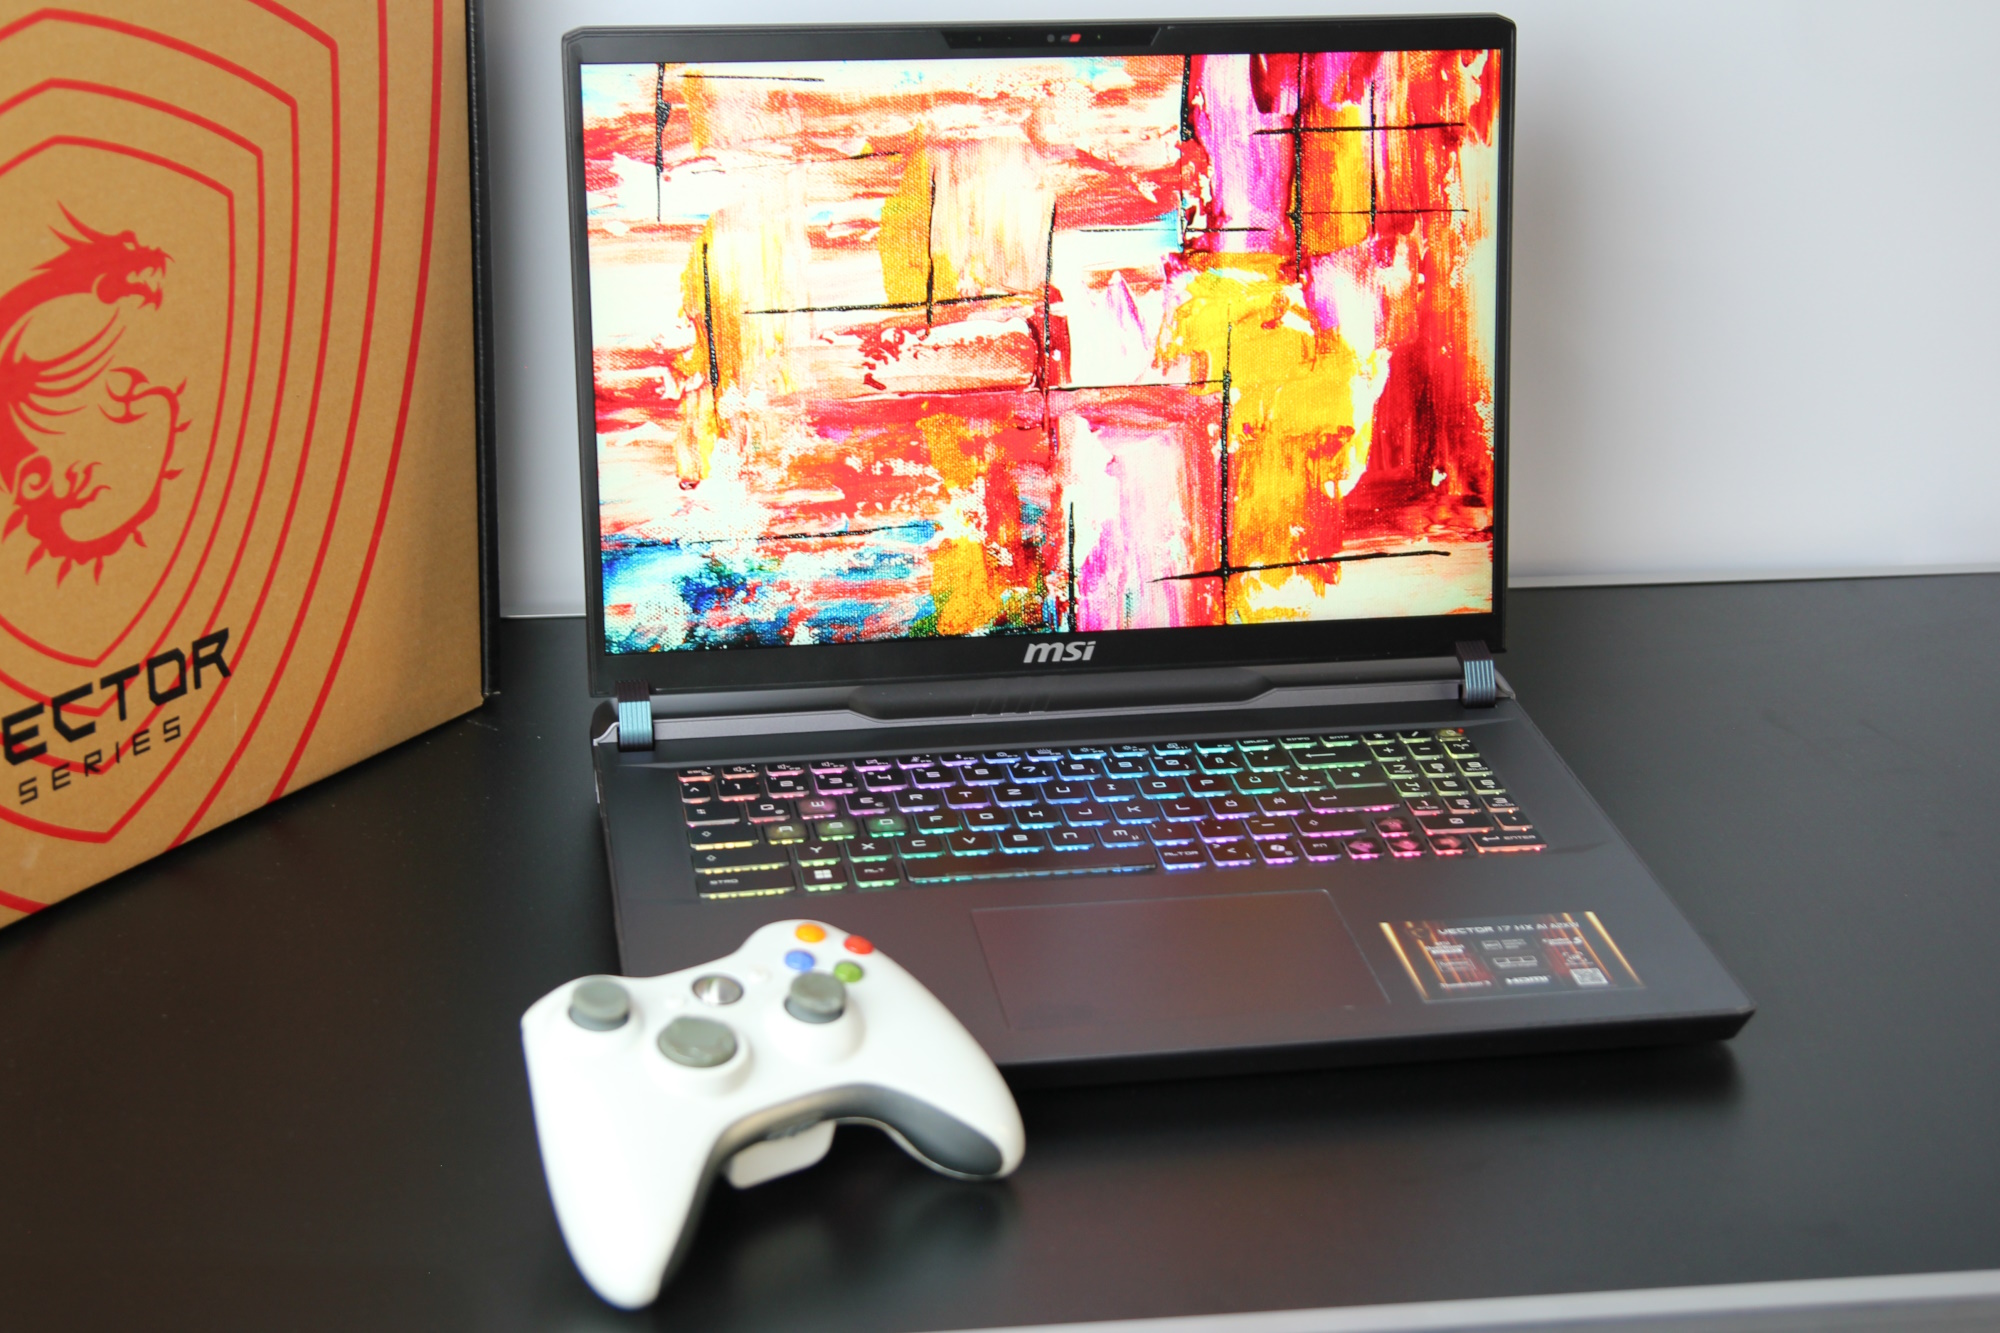
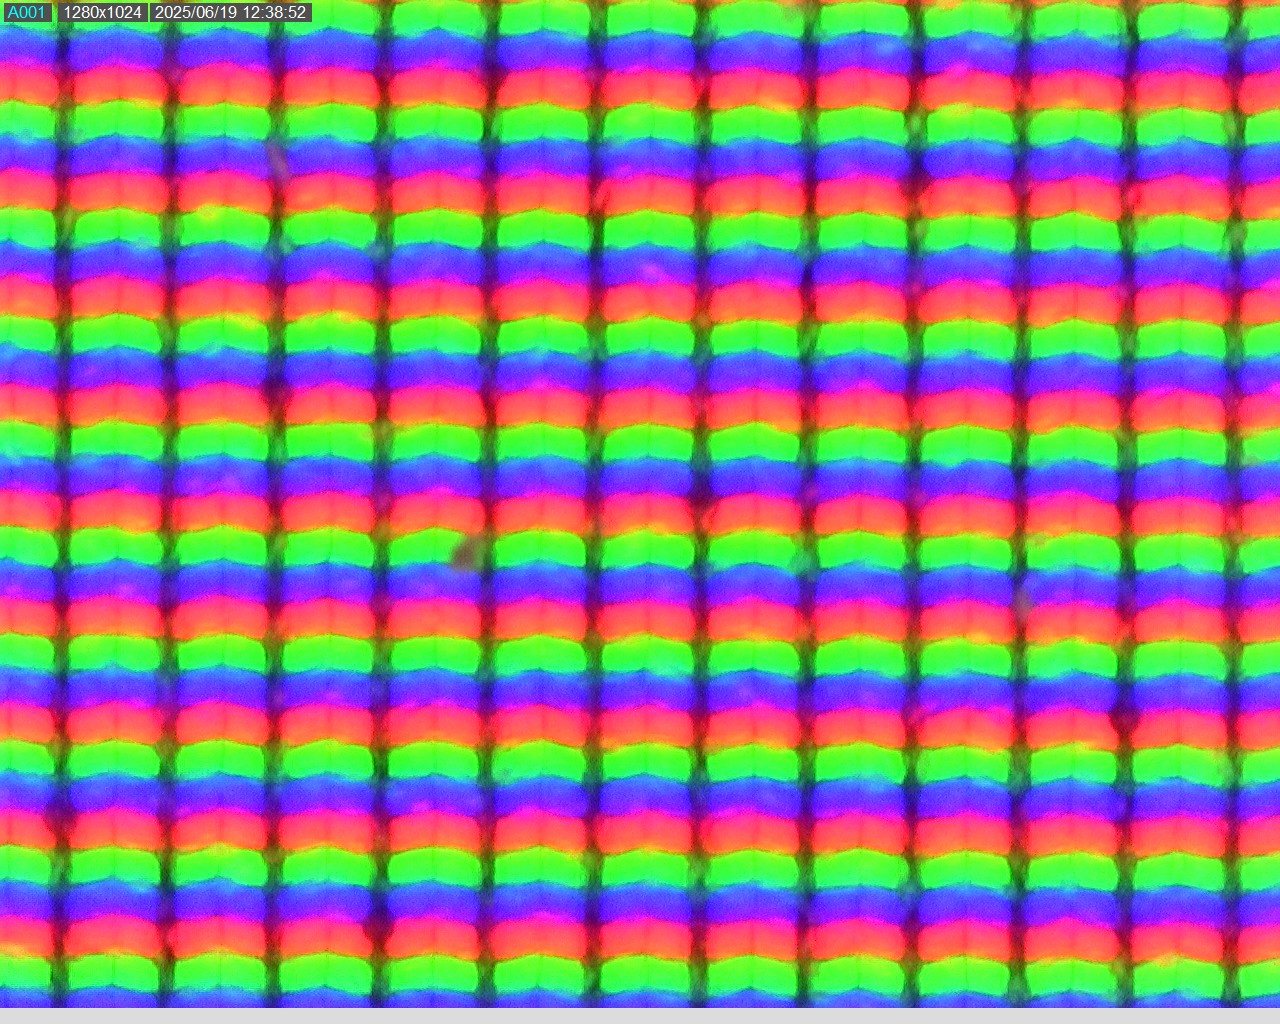
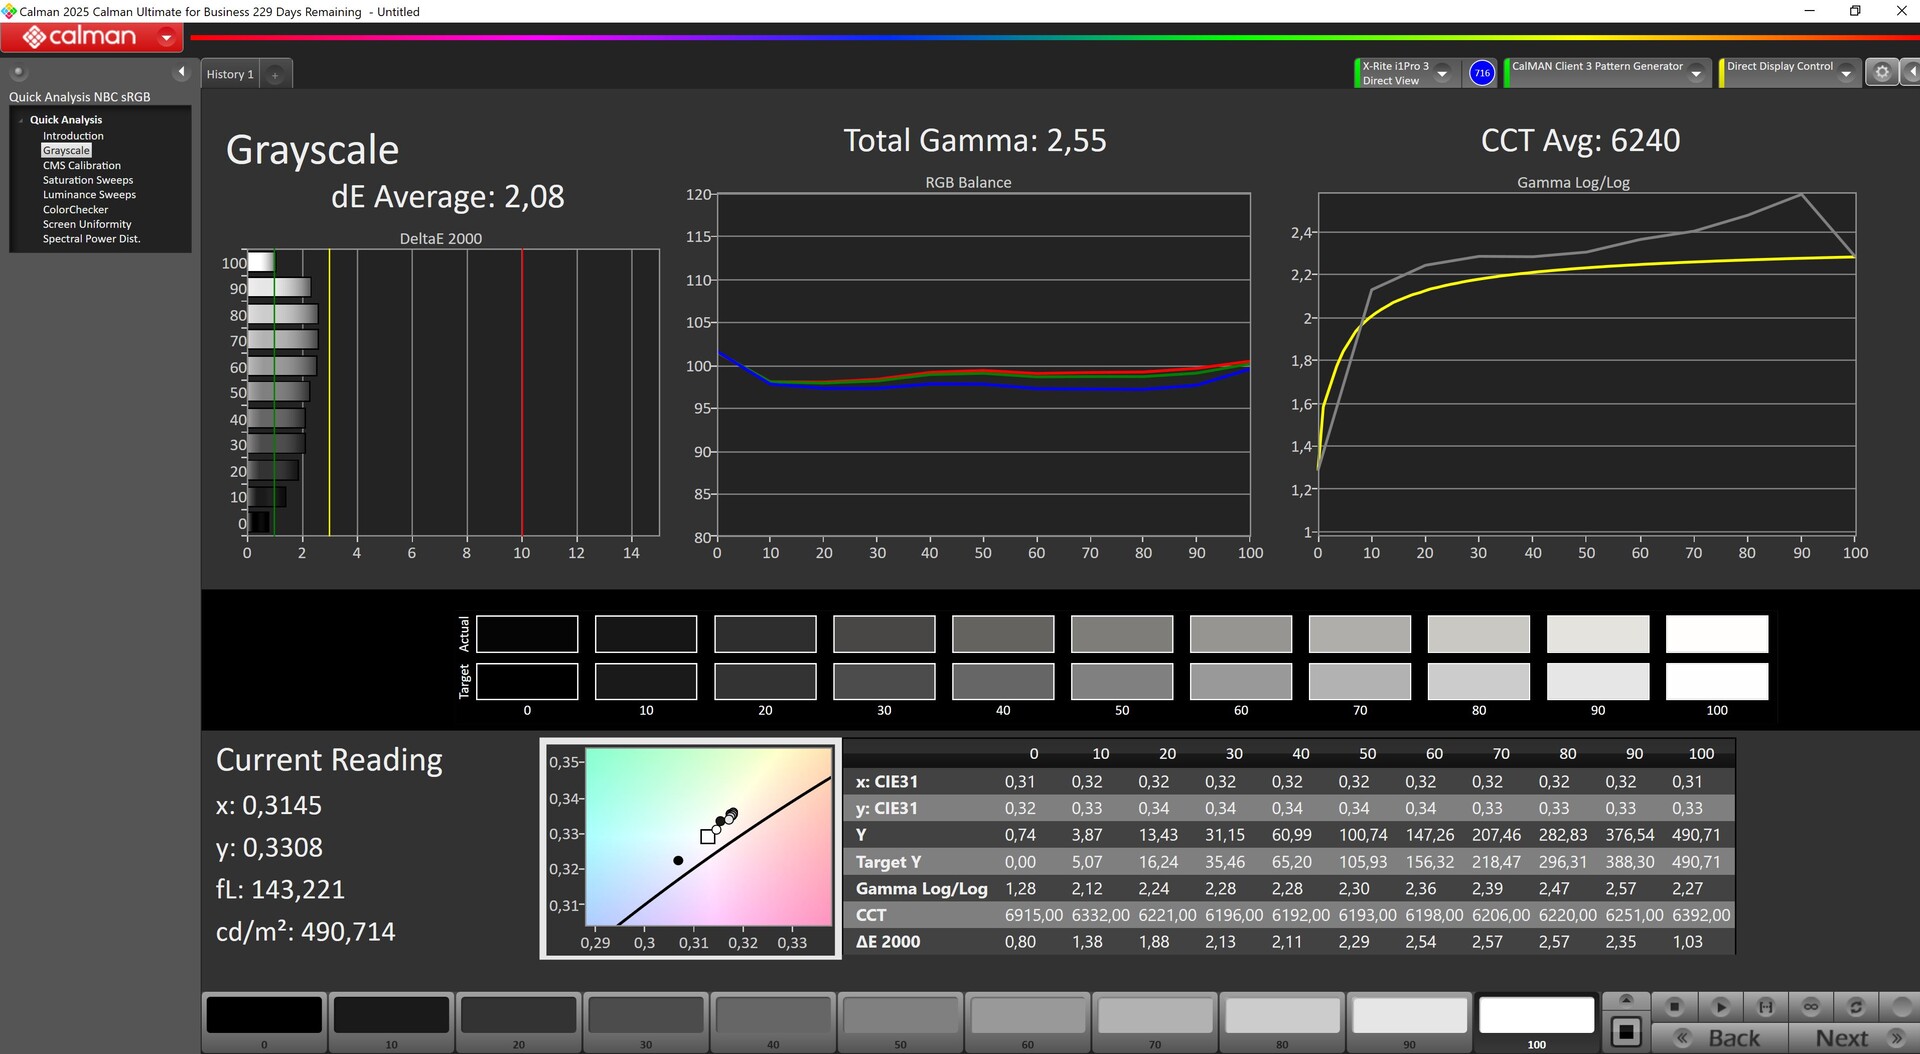
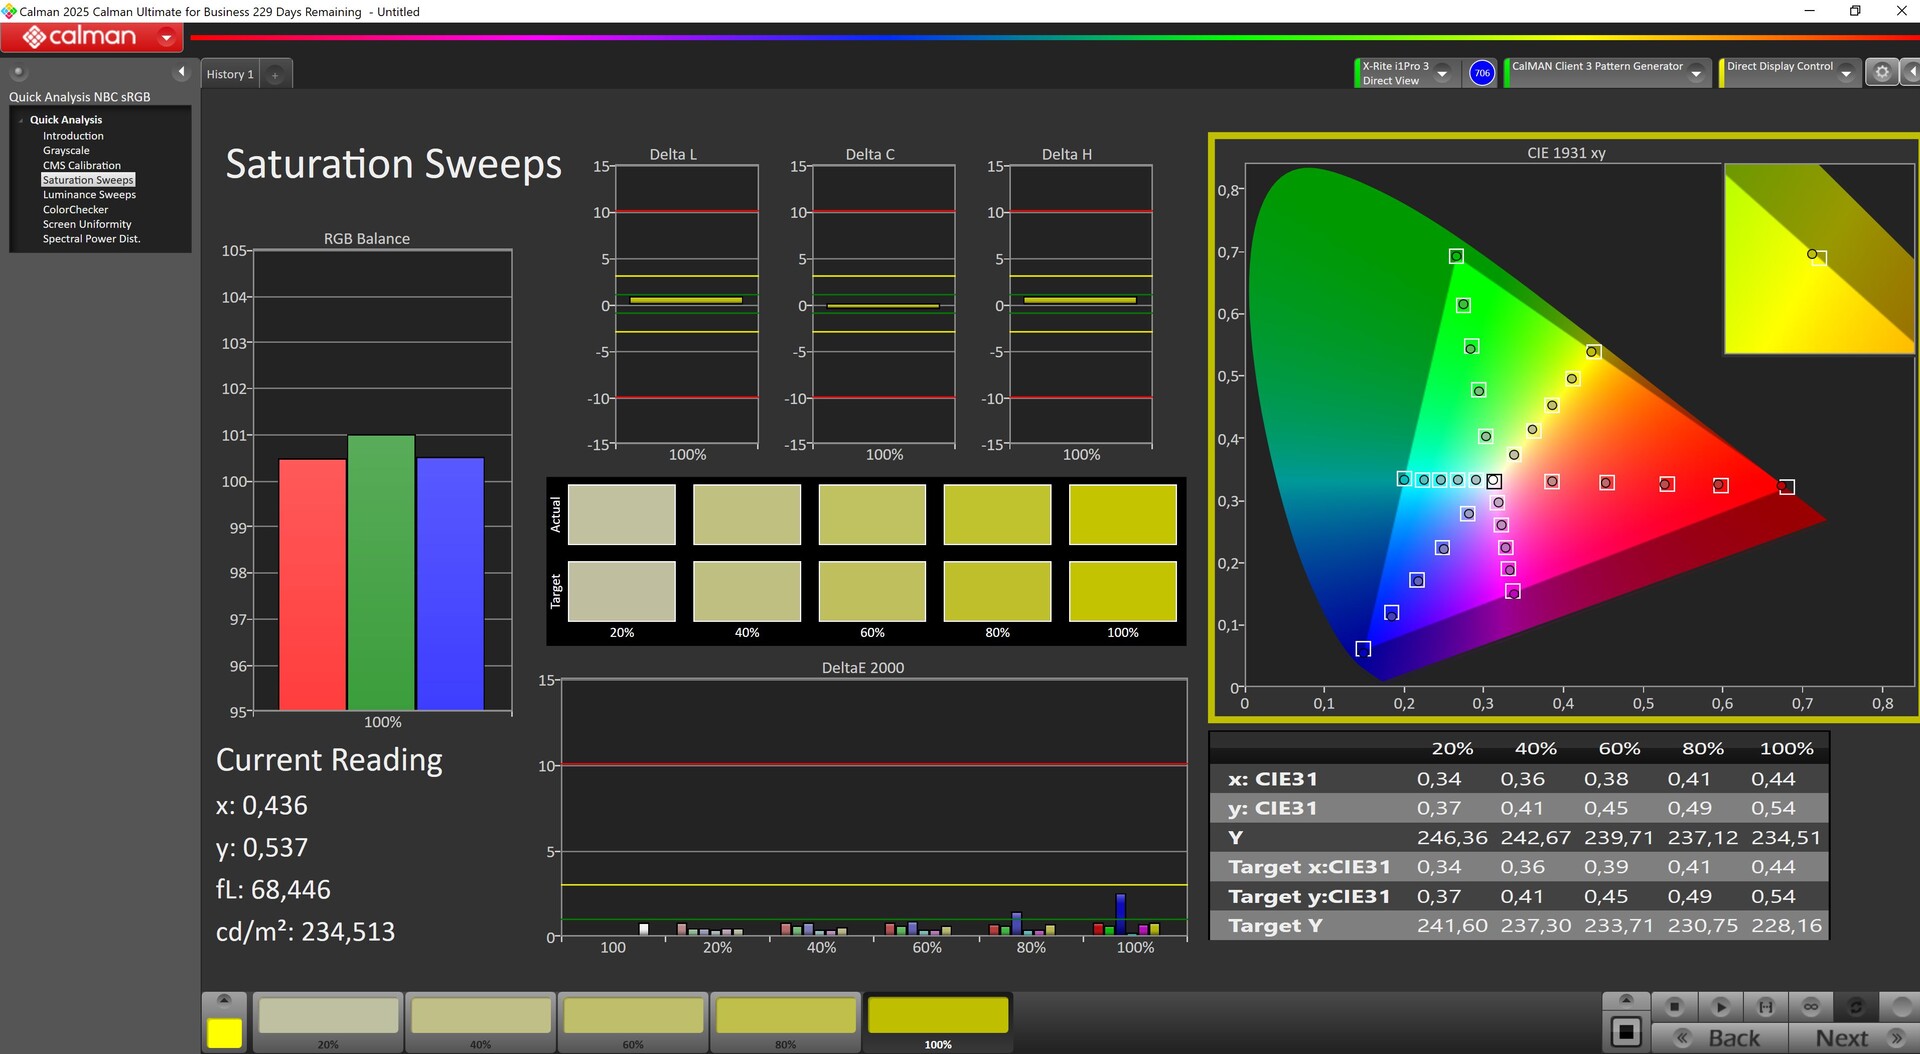
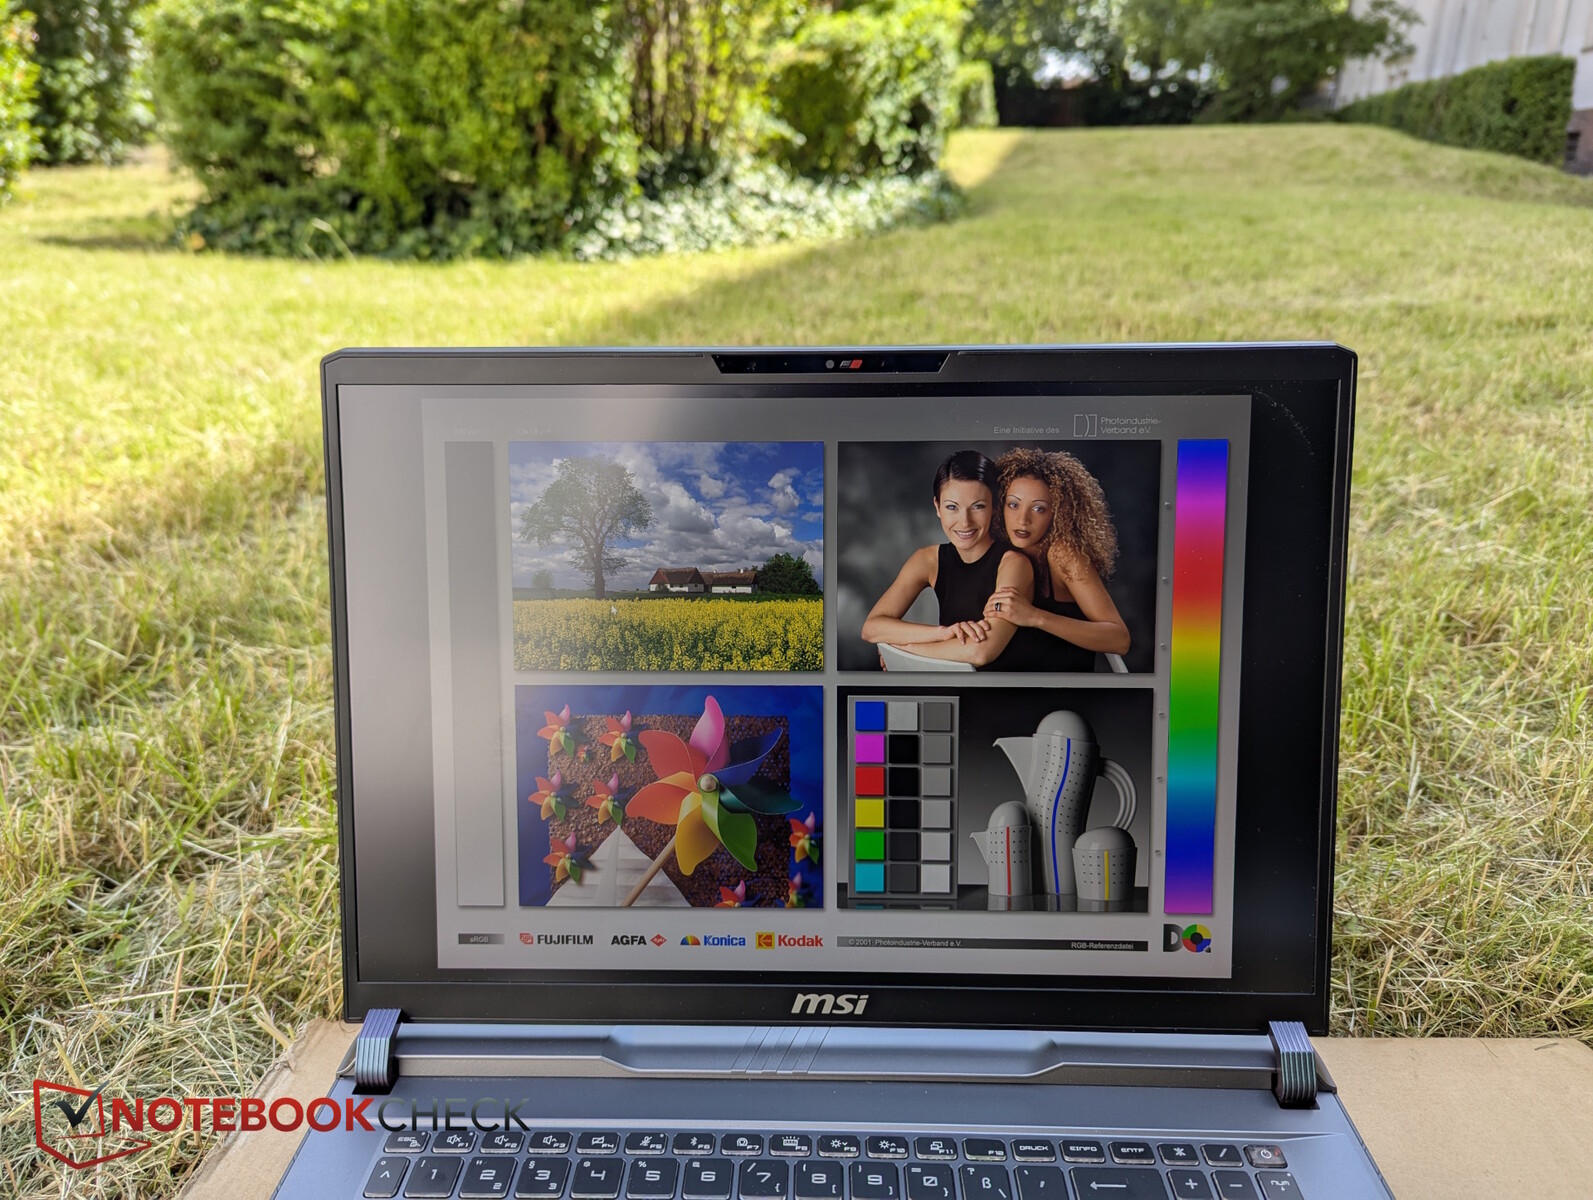
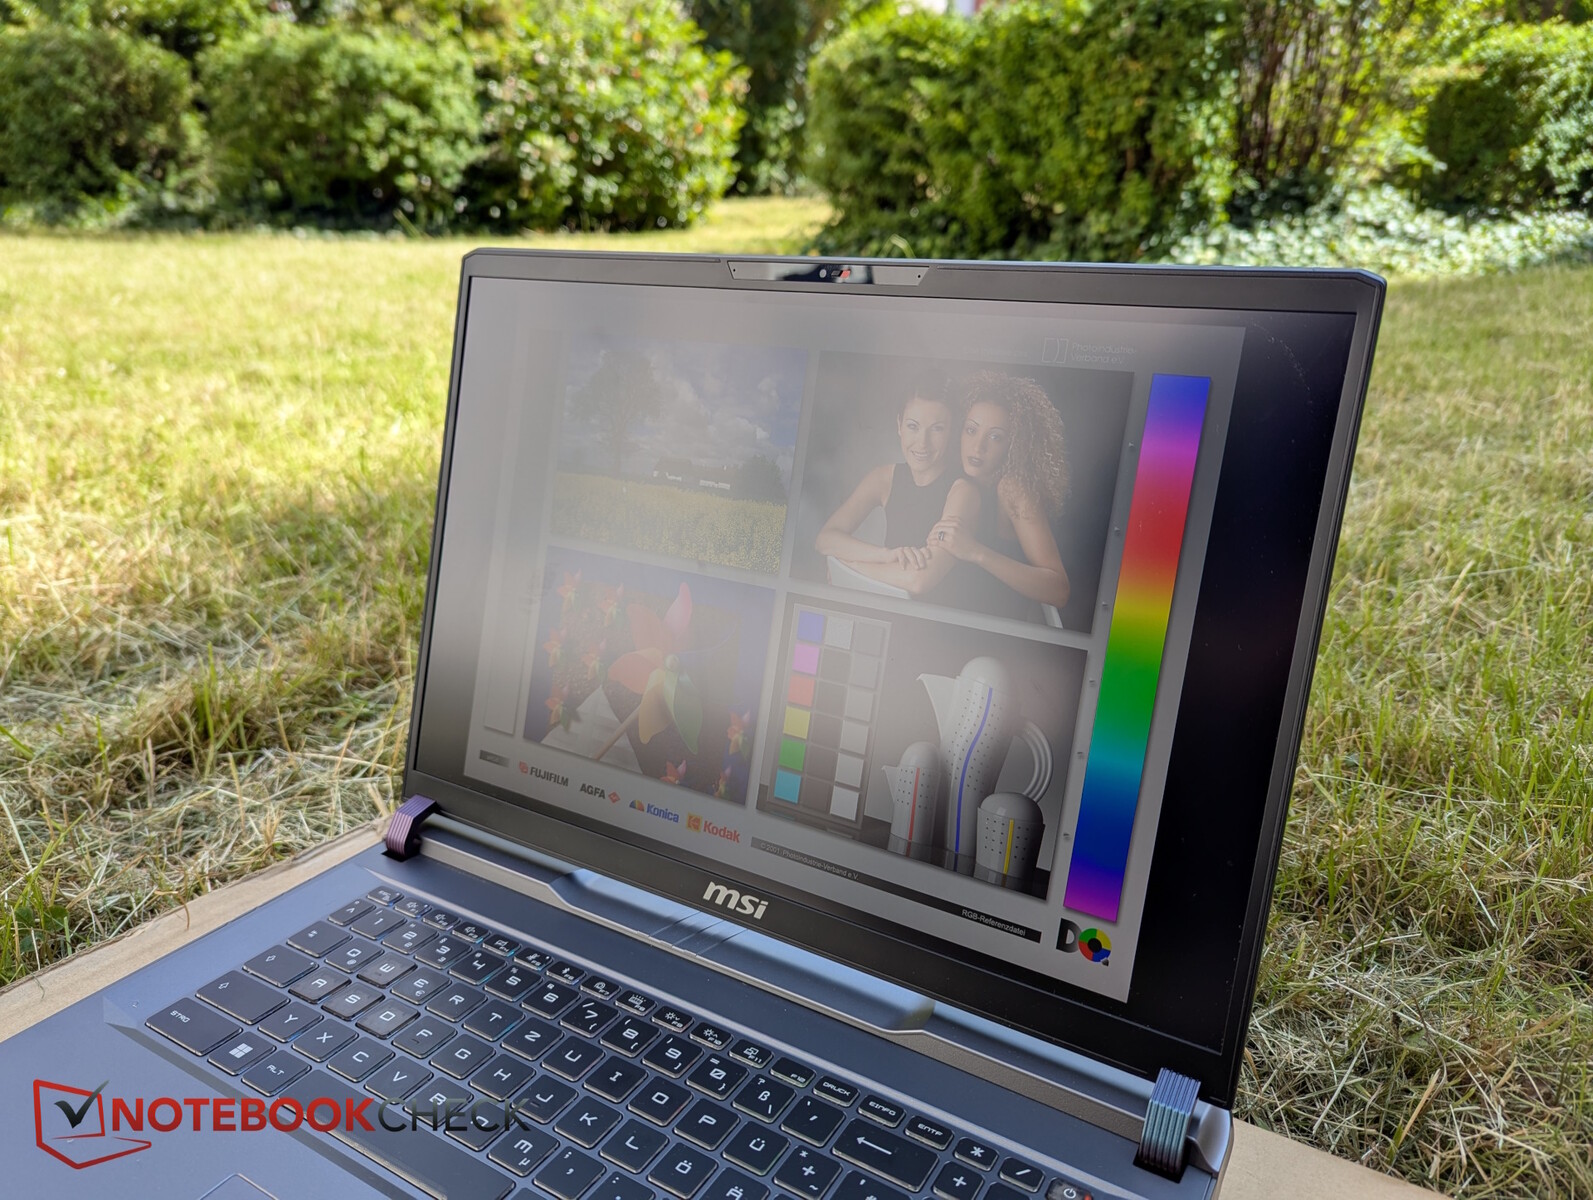
显示屏 - QHD+ IPS,470 尼特
它采用了亚光、快速(约 4 毫秒)QHD+ IPS 显示屏(2,560 x 1,600 像素),频率为 240 赫兹。平均亮度约为 470 尼特,照明相当均匀。不过,黑色值明显过高,影响了对比度。
注:微星还提供 165 Hz 的全高清 IPS 显示屏作为替代。

| |||||||||||||||||||||||||
Brightness Distribution: 91 %
Center on Battery: 486 cd/m²
Contrast: 659:1 (Black: 0.74 cd/m²)
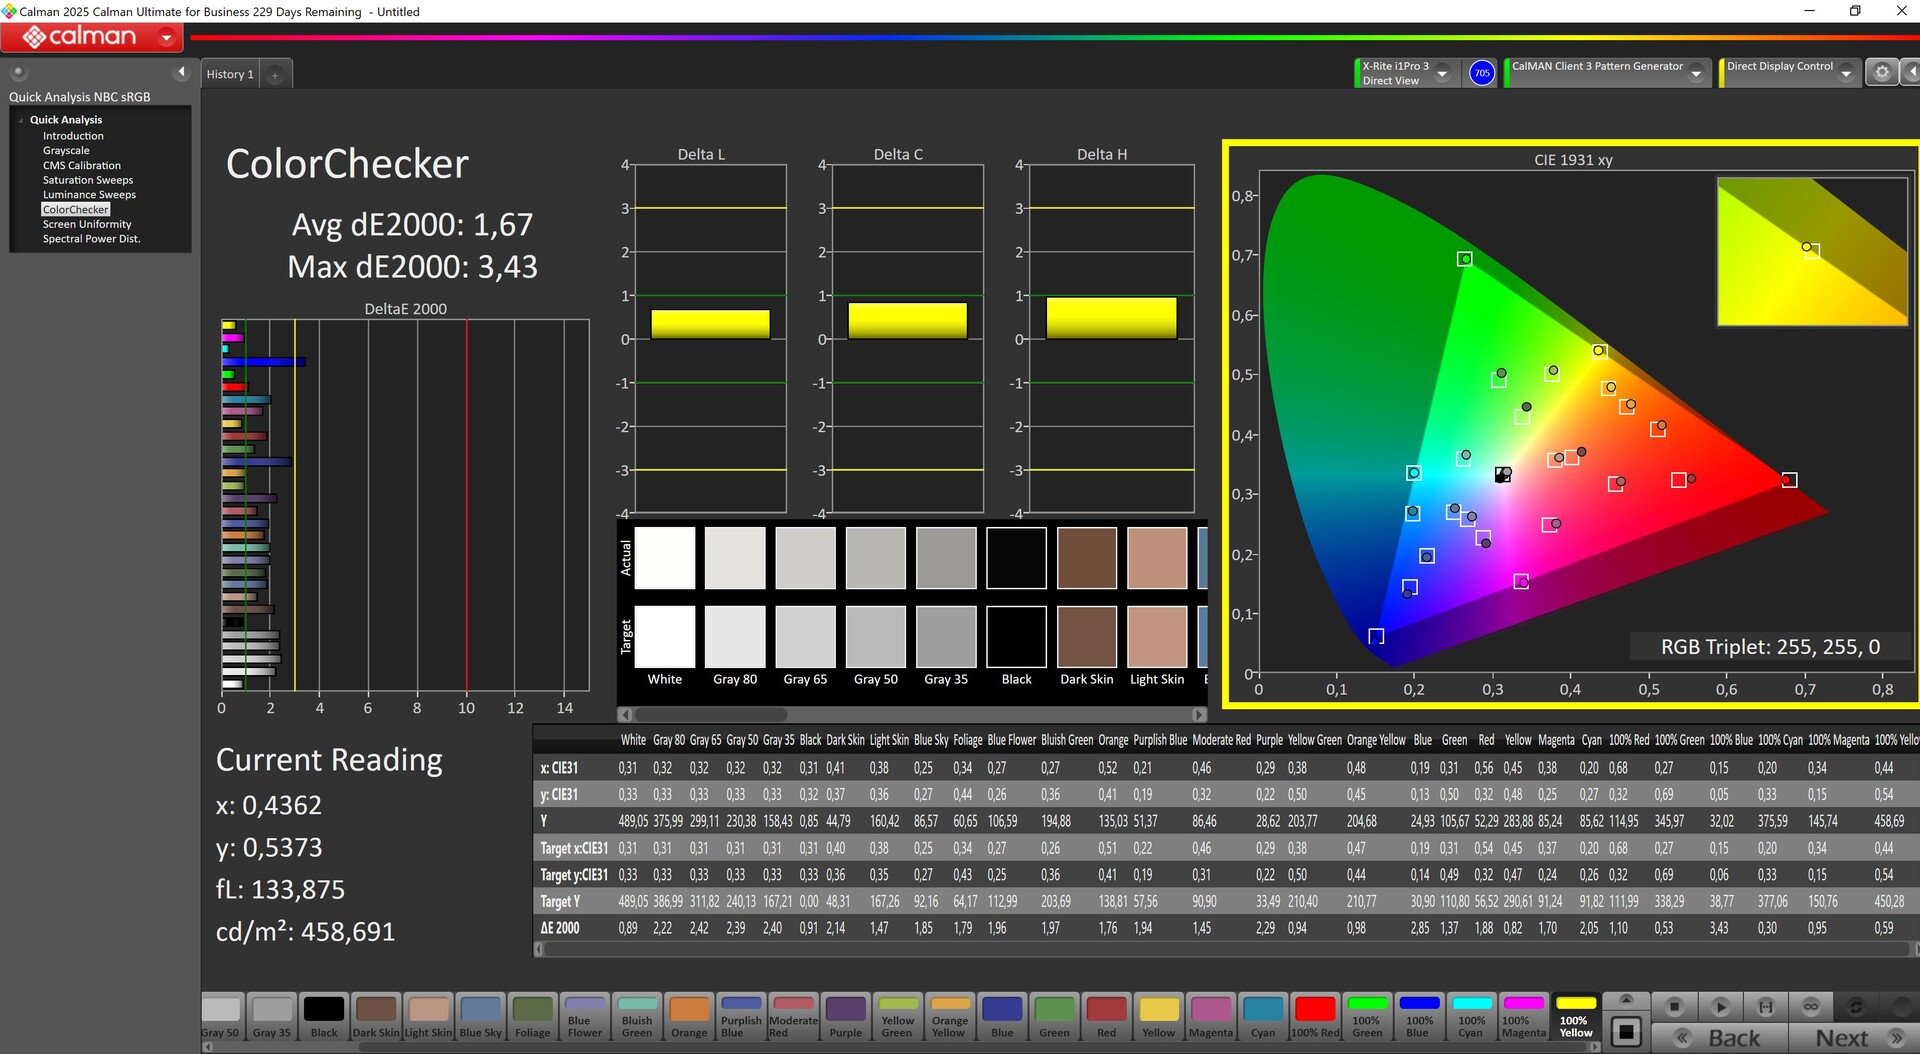
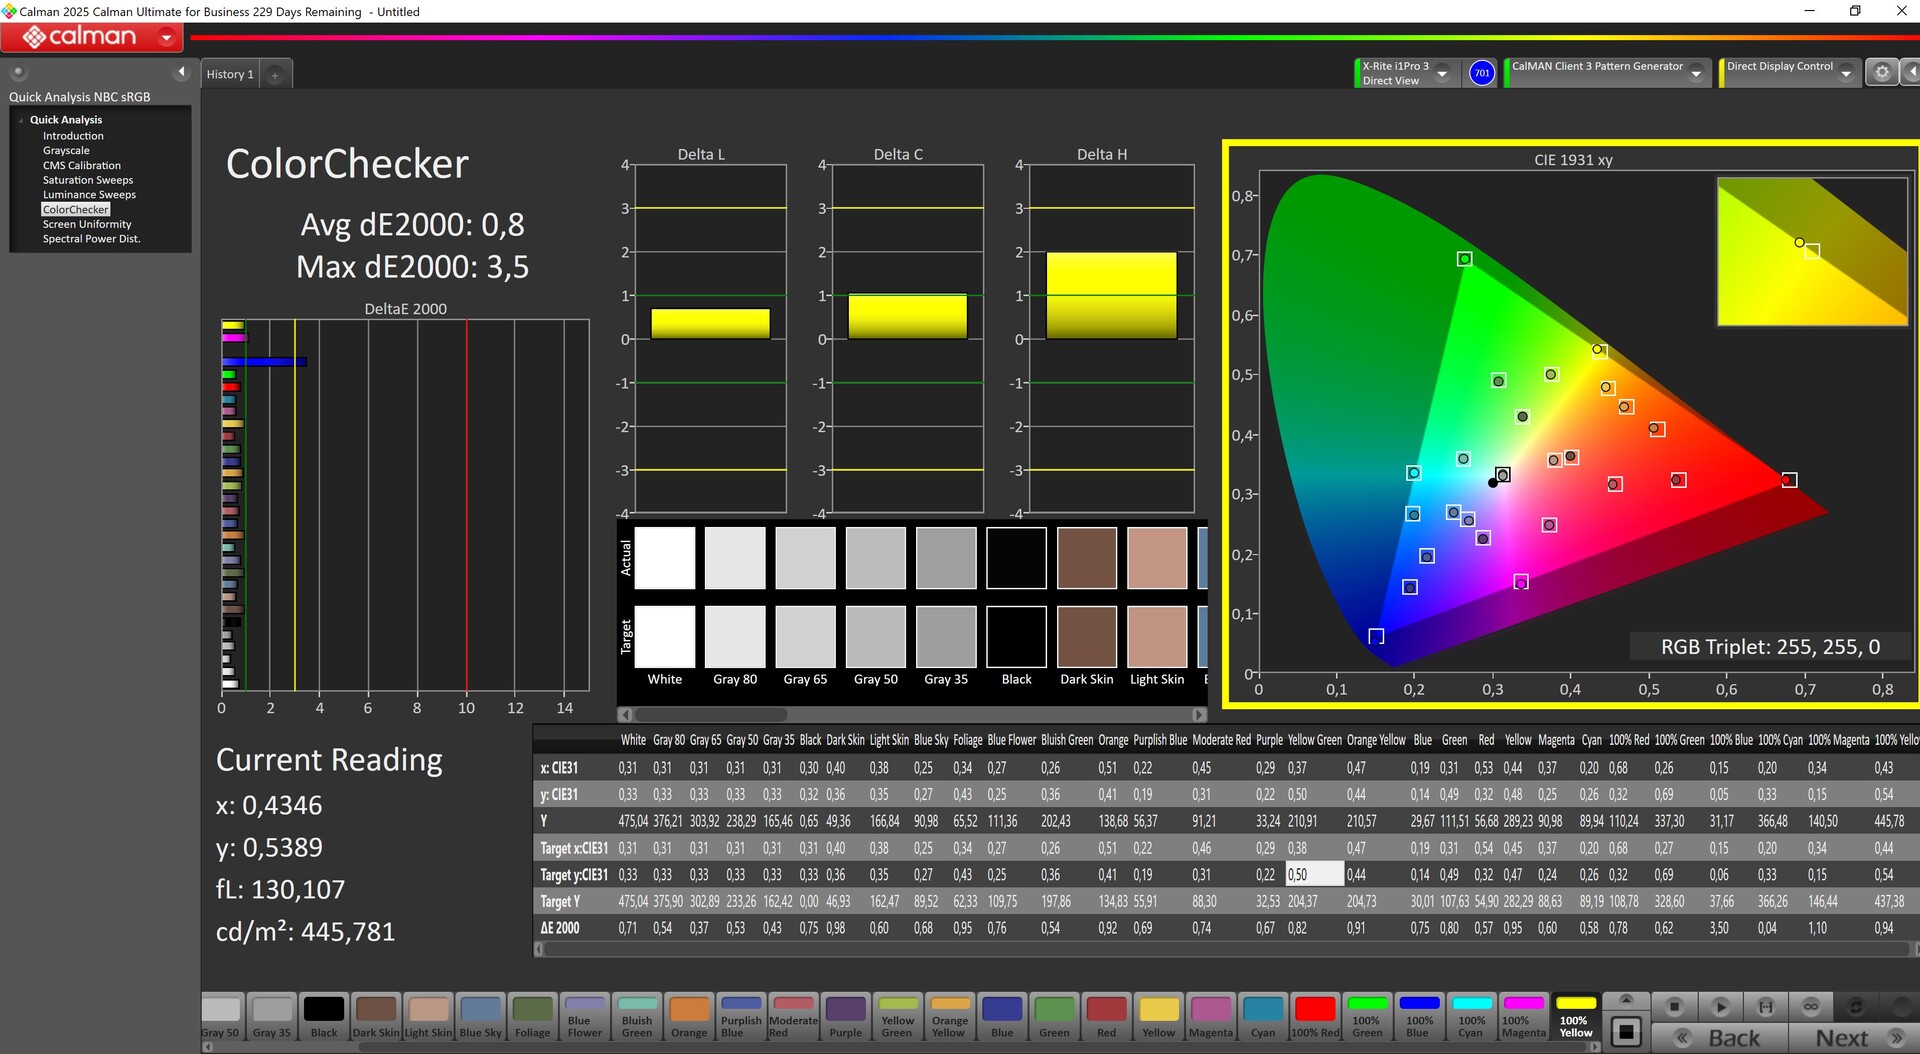
ΔE ColorChecker Calman: 1.67 | ∀{0.5-29.43 Ø4.72}
calibrated: 0.8
ΔE Greyscale Calman: 2.08 | ∀{0.09-98 Ø4.97}
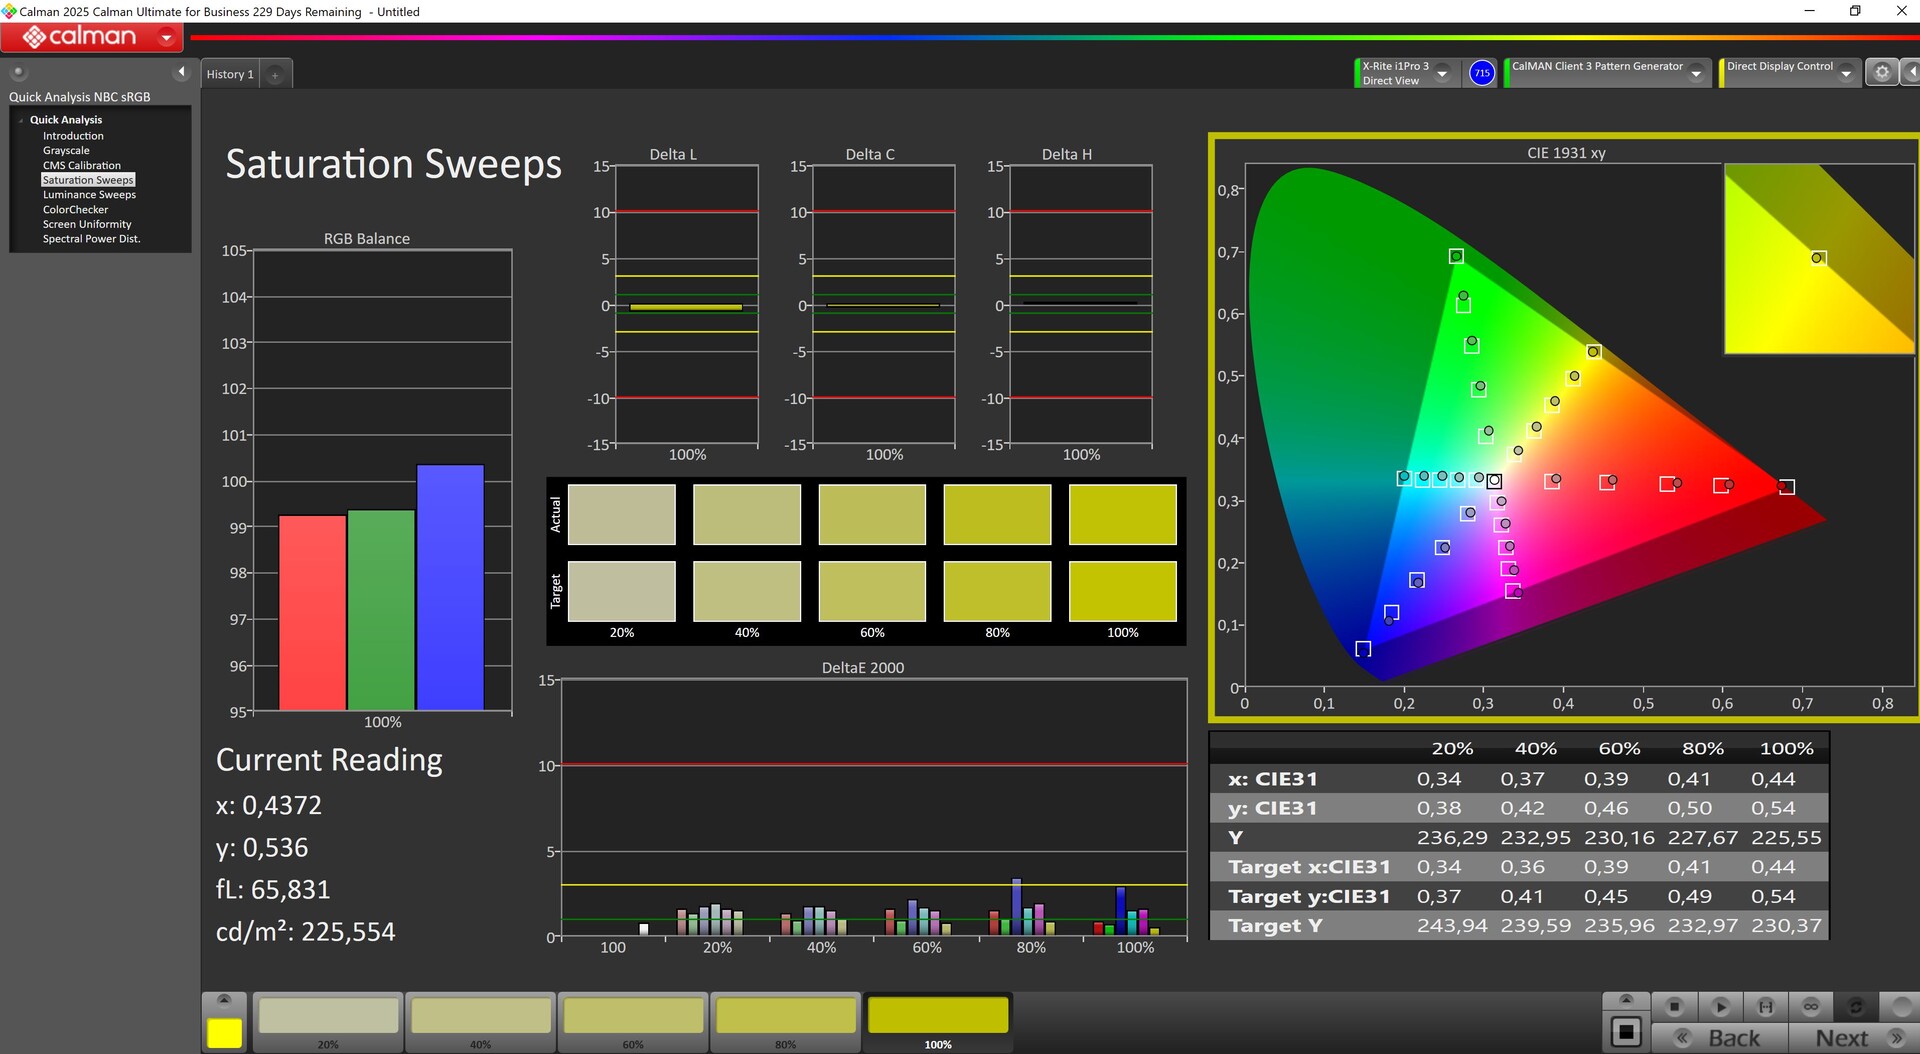
87.4% AdobeRGB 1998 (Argyll 3D)
100% sRGB (Argyll 3D)
99.6% Display P3 (Argyll 3D)
Gamma: 2.55
CCT: 6240 K
| MSI Vector 17 HX AI A2XWIG B170QAN01.2 (AUO84A6), IPS, 2560x1600, 17", 240 Hz | Alienware 16 Area-51 AU Optronics B160QAN, IPS, 2560x1600, 16", 240 Hz | MSI Raider A18 HX A9WIG-080 B180ZAN01.0, MiniLED IPS, 3840x2400, 18", 120 Hz | Aorus MASTER 16 AM6H ATNA60DL03-0 (SDC41AB), OLED, 2560x1600, 16", 240 Hz | MSI Titan 18 HX AI A2XWJG AU Optronics B180ZAN01.0, Mini-LED, 3840x2160, 18", 120 Hz | Schenker XMG Neo 16 A25 5090 NE160QDM-NM9, Mini-LED, 2560x1600, 16", 300 Hz | |
|---|---|---|---|---|---|---|
| Display | -1% | 2% | 1% | 1% | 0% | |
| HDR Peak Brightness (cd/m²) | 1153 | |||||
| Display P3 Coverage (%) | 99.6 | 96 -4% | 99.9 0% | 95.3 -4% | 99.7 0% | 99.9 0% |
| sRGB Coverage (%) | 100 | 100 0% | 100 0% | 98.8 -1% | 99.9 0% | 100 0% |
| AdobeRGB 1998 Coverage (%) | 87.4 | 89.2 2% | 93.9 7% | 94.1 8% | 90.4 3% | 88.5 1% |
| Response Times | -42% | -377% | 92% | -179% | -277% | |
| Response Time Grey 50% / Grey 80% * (ms) | 3.6 ? | 4.8 ? -33% | 23 ? -539% | 0.24 ? 93% | 8.8 ? -144% | 17.4 ? -383% |
| Response Time Black / White * (ms) | 4.8 ? | 7.2 ? -50% | 15.1 ? -215% | 0.43 ? 91% | 15 ? -213% | 13 ? -171% |
| PWM Frequency (Hz) | 15203 | 960 | 15430 ? | 20253 | ||
| PWM Amplitude * (%) | 100 | 47 | 50 | 75 | ||
| Screen | -23% | 759% | 57% | -71% | -23% | |
| Brightness middle (cd/m²) | 488 | 554 14% | 510 5% | 435 -11% | 704 44% | 888 82% |
| Brightness (cd/m²) | 473 | 532 12% | 470 -1% | 437 -8% | 680 44% | 859 82% |
| Brightness Distribution (%) | 91 | 88 -3% | 85 -7% | 96 5% | 88 -3% | 94 3% |
| Black Level * (cd/m²) | 0.74 | 0.52 30% | 0.01 99% | 0.08 89% | ||
| Contrast (:1) | 659 | 1065 62% | 51000 7639% | 5438 725% | ||
| Colorchecker dE 2000 * | 1.67 | 2.81 -68% | 4.5 -169% | 2.42 -45% | 4.11 -146% | 3.3 -98% |
| Colorchecker dE 2000 max. * | 3.43 | 8.32 -143% | 7.3 -113% | 4.81 -40% | 6.43 -87% | 5.5 -60% |
| Colorchecker dE 2000 calibrated * | 0.8 | 0.65 19% | 5.7 -613% | 2.03 -154% | 2.5 -213% | 1.5 -88% |
| Greyscale dE 2000 * | 2.08 | 4.7 -126% | 2.3 -11% | 3.11 -50% | 4.9 -136% | 3.8 -83% |
| Gamma | 2.55 86% | 2.3 96% | 2.08 106% | 2.48 89% | 2.03 108% | 2.46 89% |
| CCT | 6240 104% | 6476 100% | 6648 98% | 6270 104% | 6331 103% | 6267 104% |
| Total Average (Program / Settings) | -22% /
-21% | 128% /
434% | 50% /
50% | -83% /
-71% | -100% /
-60% |
* ... smaller is better
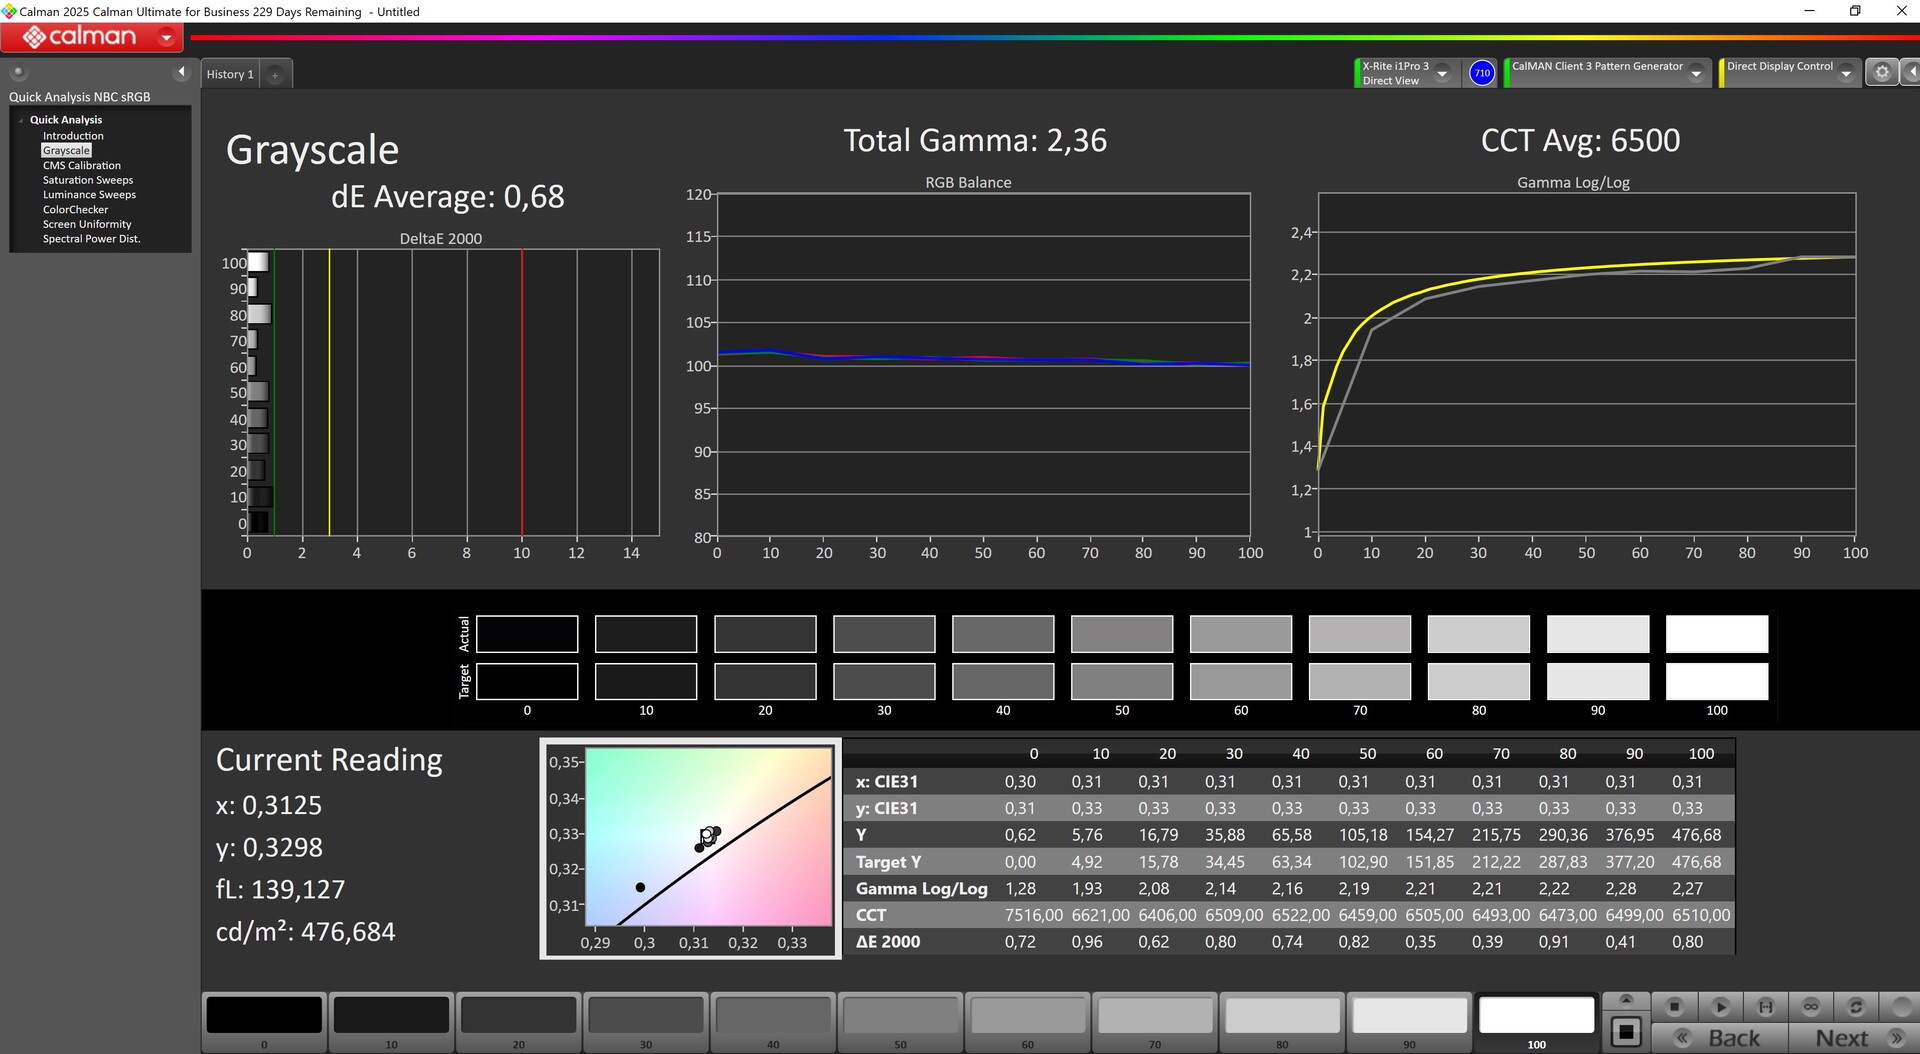
我们已经测量了经过校准的数值。经过我们自己的校准,我们甚至将偏差降至 1 以下。
Display Response Times
| ↔ Response Time Black to White | ||
|---|---|---|
| 4.8 ms ... rise ↗ and fall ↘ combined | ↗ 1.8 ms rise | 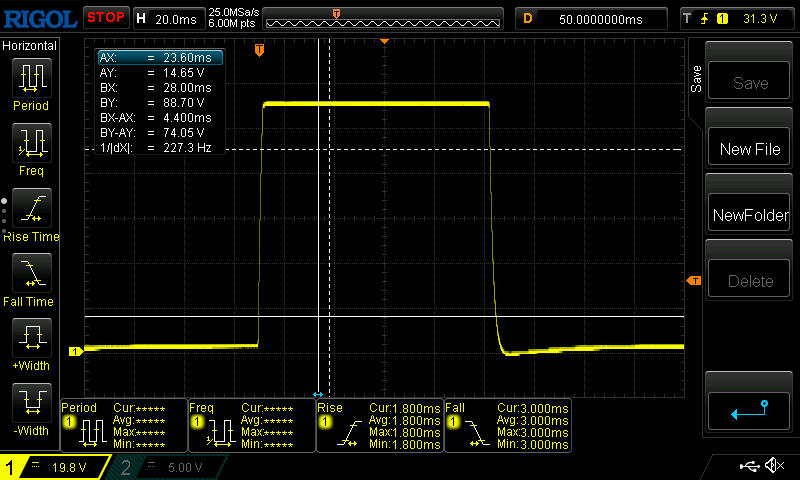 |
| ↘ 3 ms fall | ||
| The screen shows very fast response rates in our tests and should be very well suited for fast-paced gaming. In comparison, all tested devices range from 0.1 (minimum) to 240 (maximum) ms. » 17 % of all devices are better. This means that the measured response time is better than the average of all tested devices (19.8 ms). | ||
| ↔ Response Time 50% Grey to 80% Grey | ||
| 3.6 ms ... rise ↗ and fall ↘ combined | ↗ 1.8 ms rise | 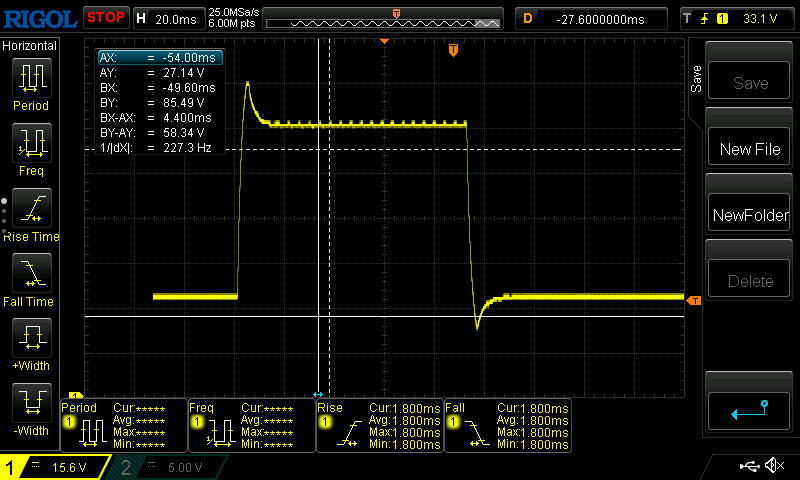 |
| ↘ 1.8 ms fall | ||
| The screen shows very fast response rates in our tests and should be very well suited for fast-paced gaming. In comparison, all tested devices range from 0.165 (minimum) to 636 (maximum) ms. » 14 % of all devices are better. This means that the measured response time is better than the average of all tested devices (31 ms). | ||
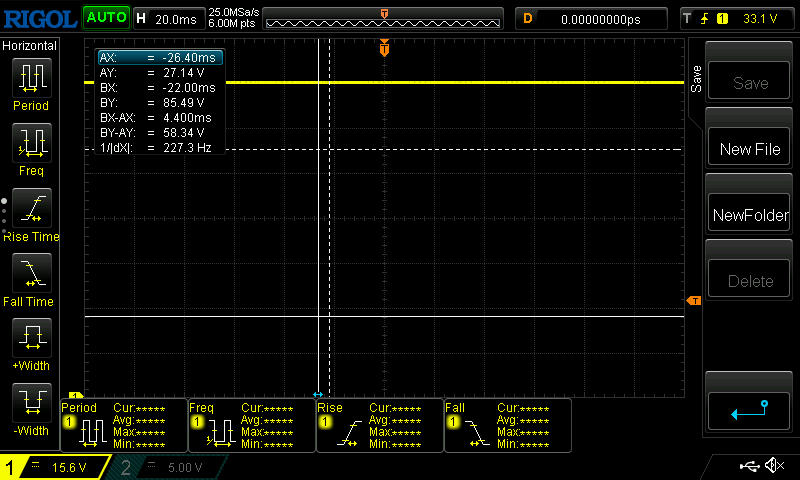
Screen Flickering / PWM (Pulse-Width Modulation)
| Screen flickering / PWM not detected |  | ||
In comparison: 52 % of all tested devices do not use PWM to dim the display. If PWM was detected, an average of 7750 (minimum: 5 - maximum: 343500) Hz was measured. | |||


性能 - CPU 在持续负载下崩溃
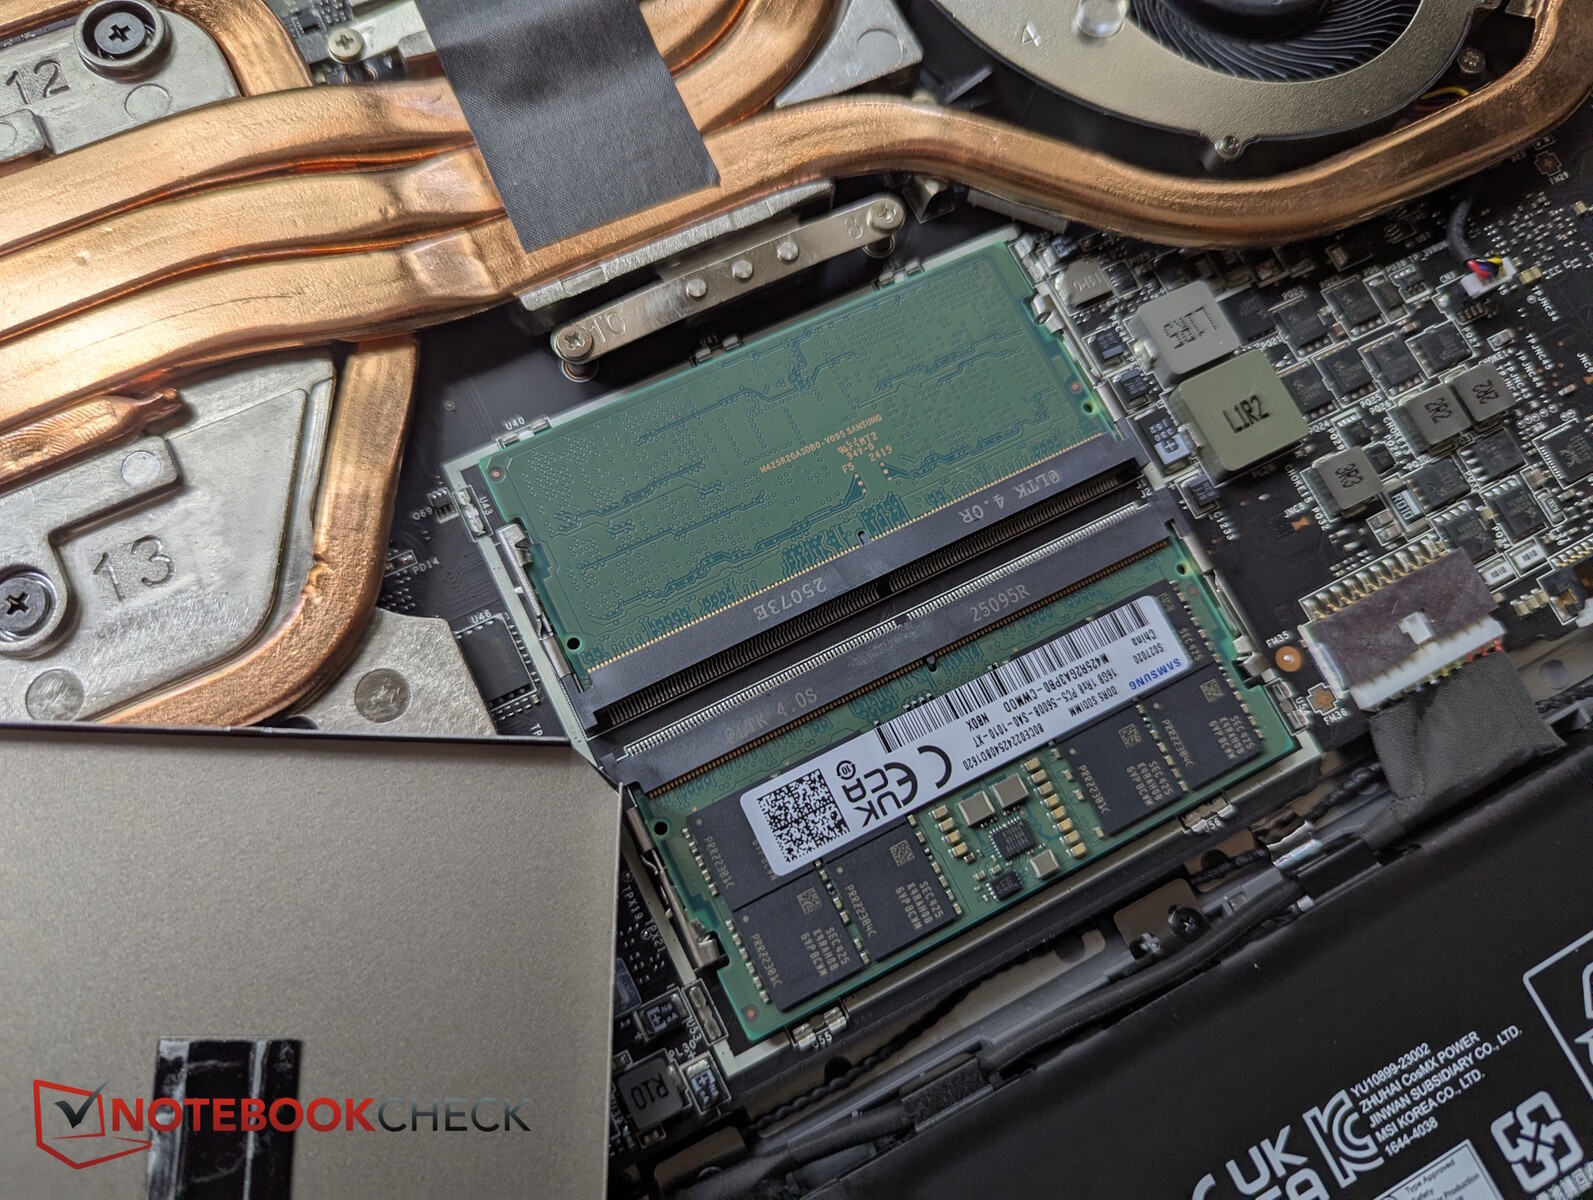
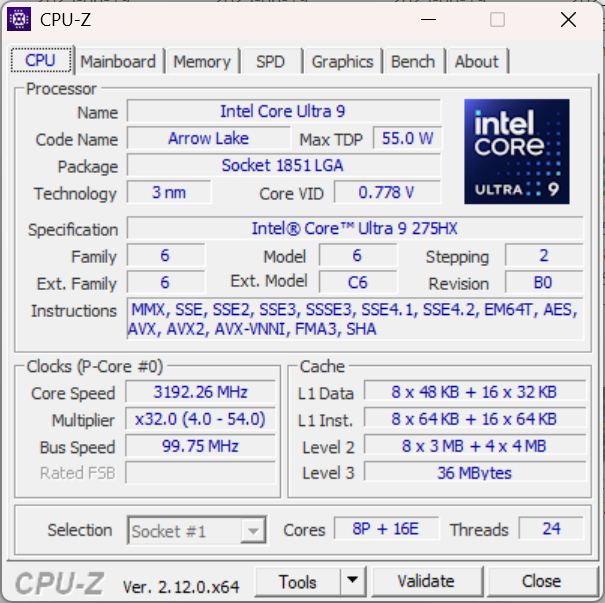
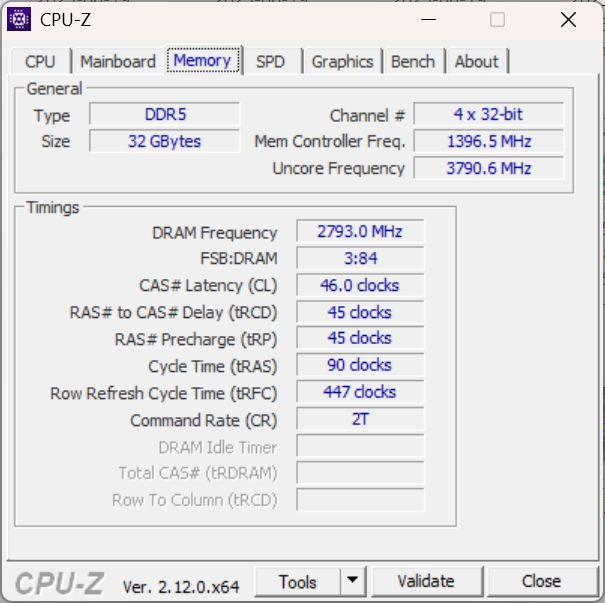
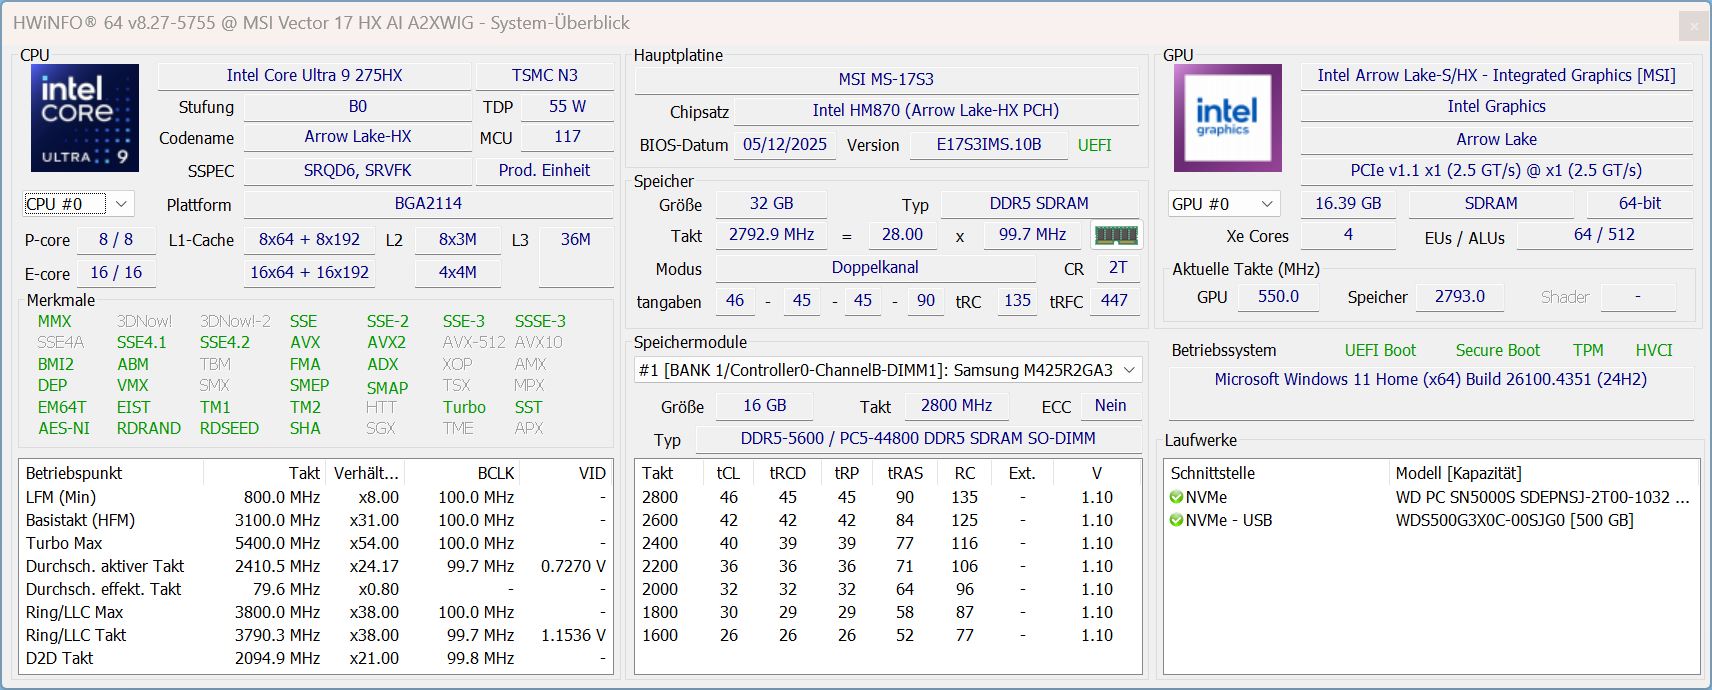
Intel Core Ultra 9 275HX, RTX 5080 笔记本电脑2 TB 固态硬盘和 32 GB 内存,Vector 17 HX 堪称高端游戏玩家,可满足当前所有游戏的需求。
测试条件
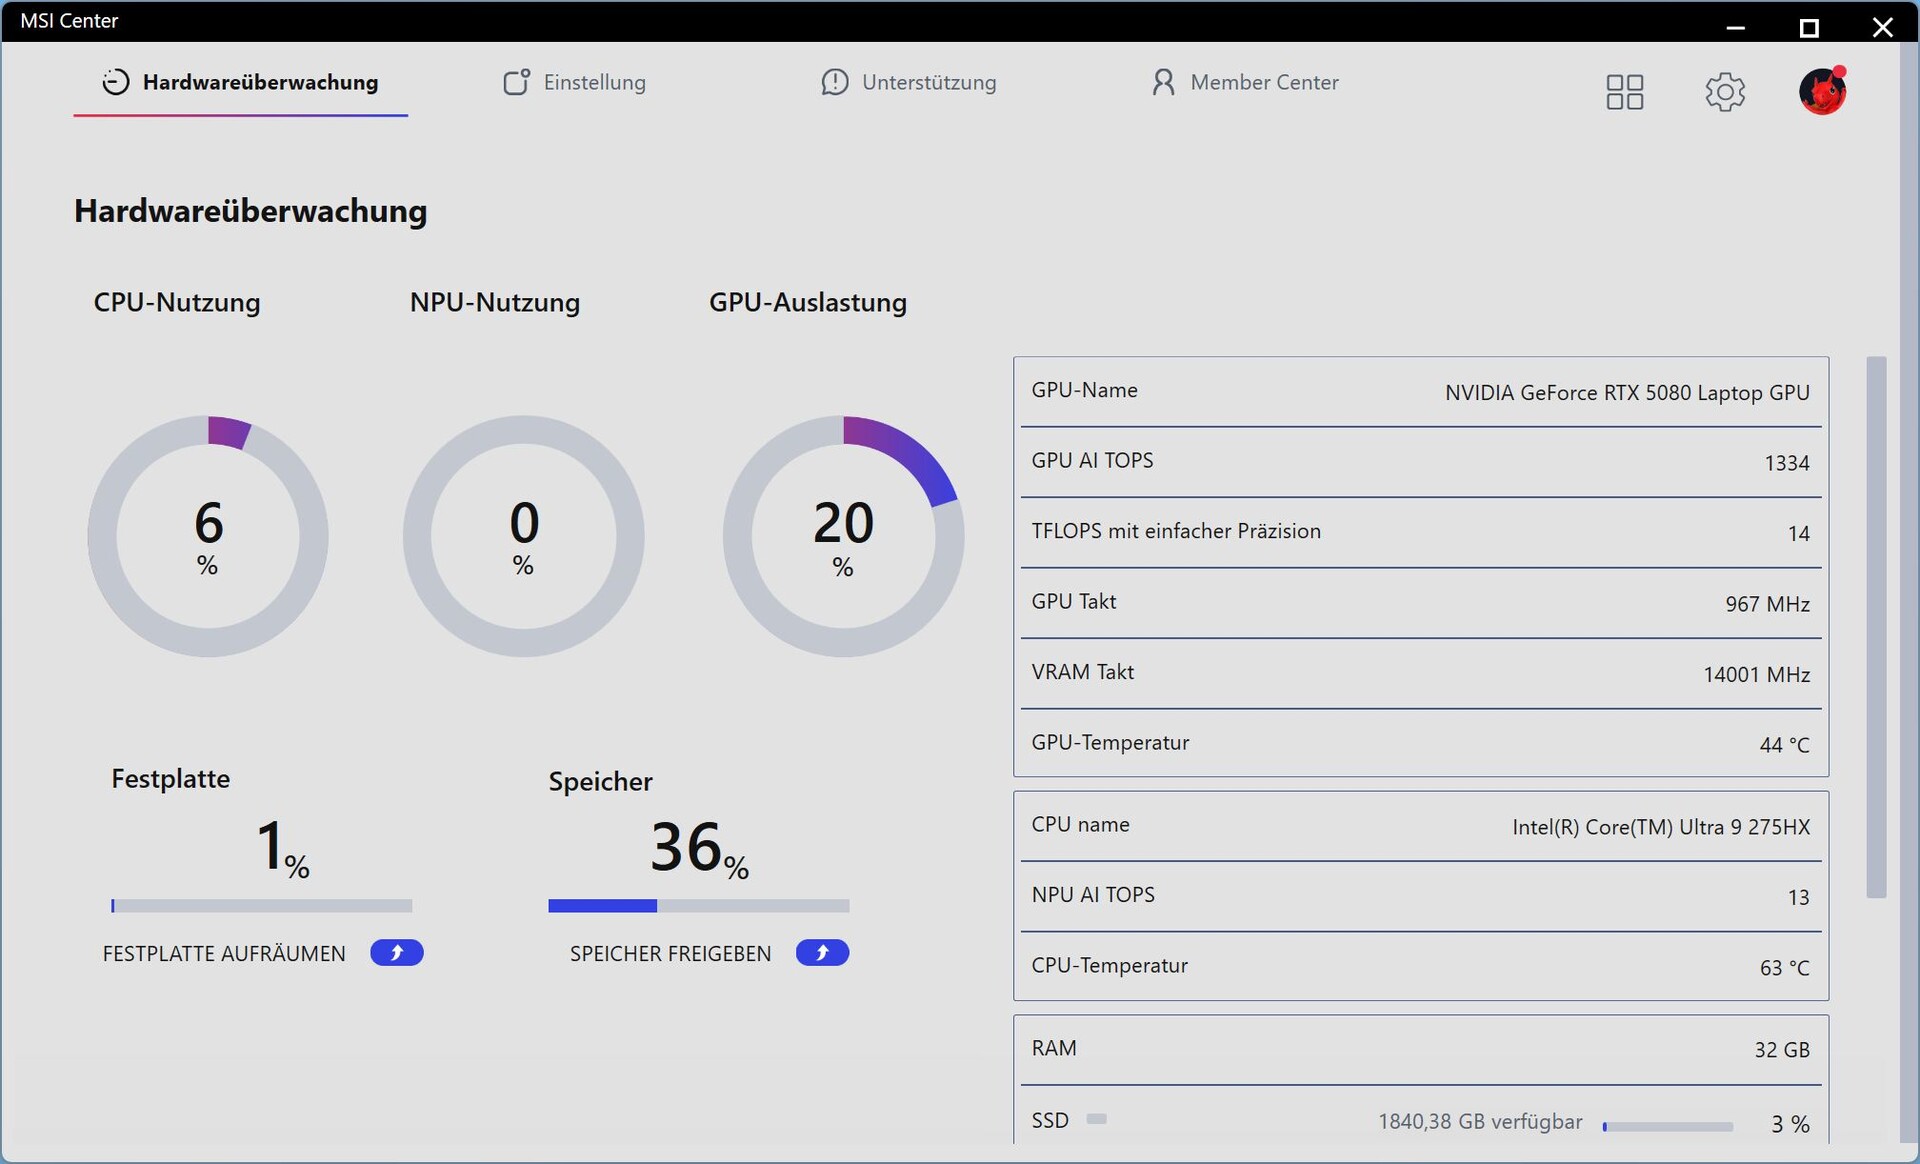
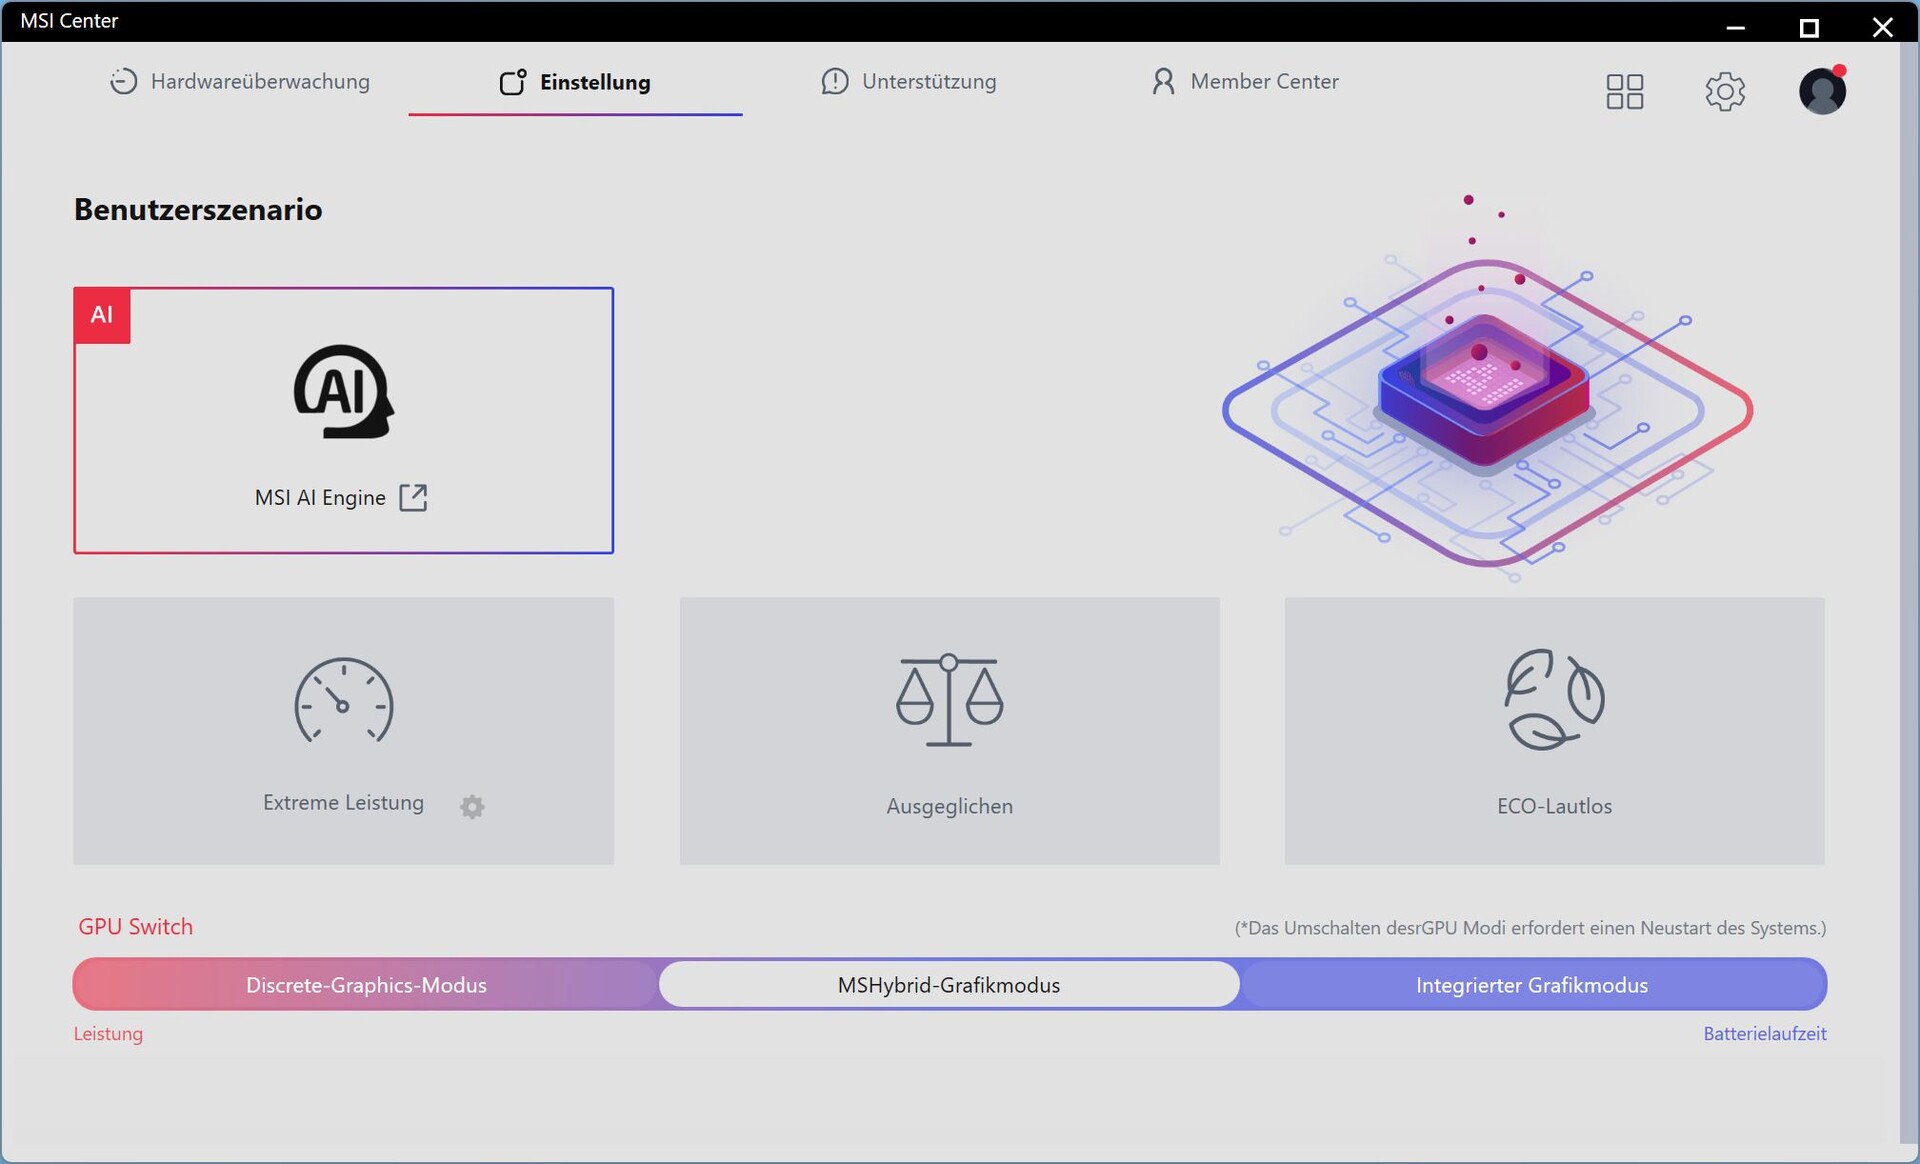
在四个性能配置文件中,我们选择了人工智能引擎;微星中心还集成了一个 MUX。
在测试中,我们最初不得不面对高达 60 W 的极高闲置功耗和过高的噪音水平。BIOS 和微星中心的更新最初并没有带来任何改善。只有在重新安装了 Windows 之后,问题才得以解决。我们不得不再次进行各种测量。

| 微星中心模式 | 微星人工智能引擎 | 极致性能 | 平衡 | 环保静音 |
| 赛博朋克 2077 噪音 dB(A) | 60.35 | 60.35 | 47.4 | 36.21 |
| 功耗 赛博朋克 | 313 W | 313 W | 253 W | 134 W |
| GPU 功耗 | 160 W | 160 W | 130 W | 80 W |
| 赛博朋克 2077》性能(FHD/超高清) | 134.6 fps | 134.5 fps | 123 fps | 78.4 fps |
| Cinebench R15 Multi Score | 5112 分 | 5430 分 | 4813 分 | 2019 分 |
| CPU PL1 | 110 瓦 | 150 瓦 | 65 瓦 | 20 瓦 |
| CPU PL2 | 150 瓦 | 150 瓦 | 110 瓦 | 25 瓦 |
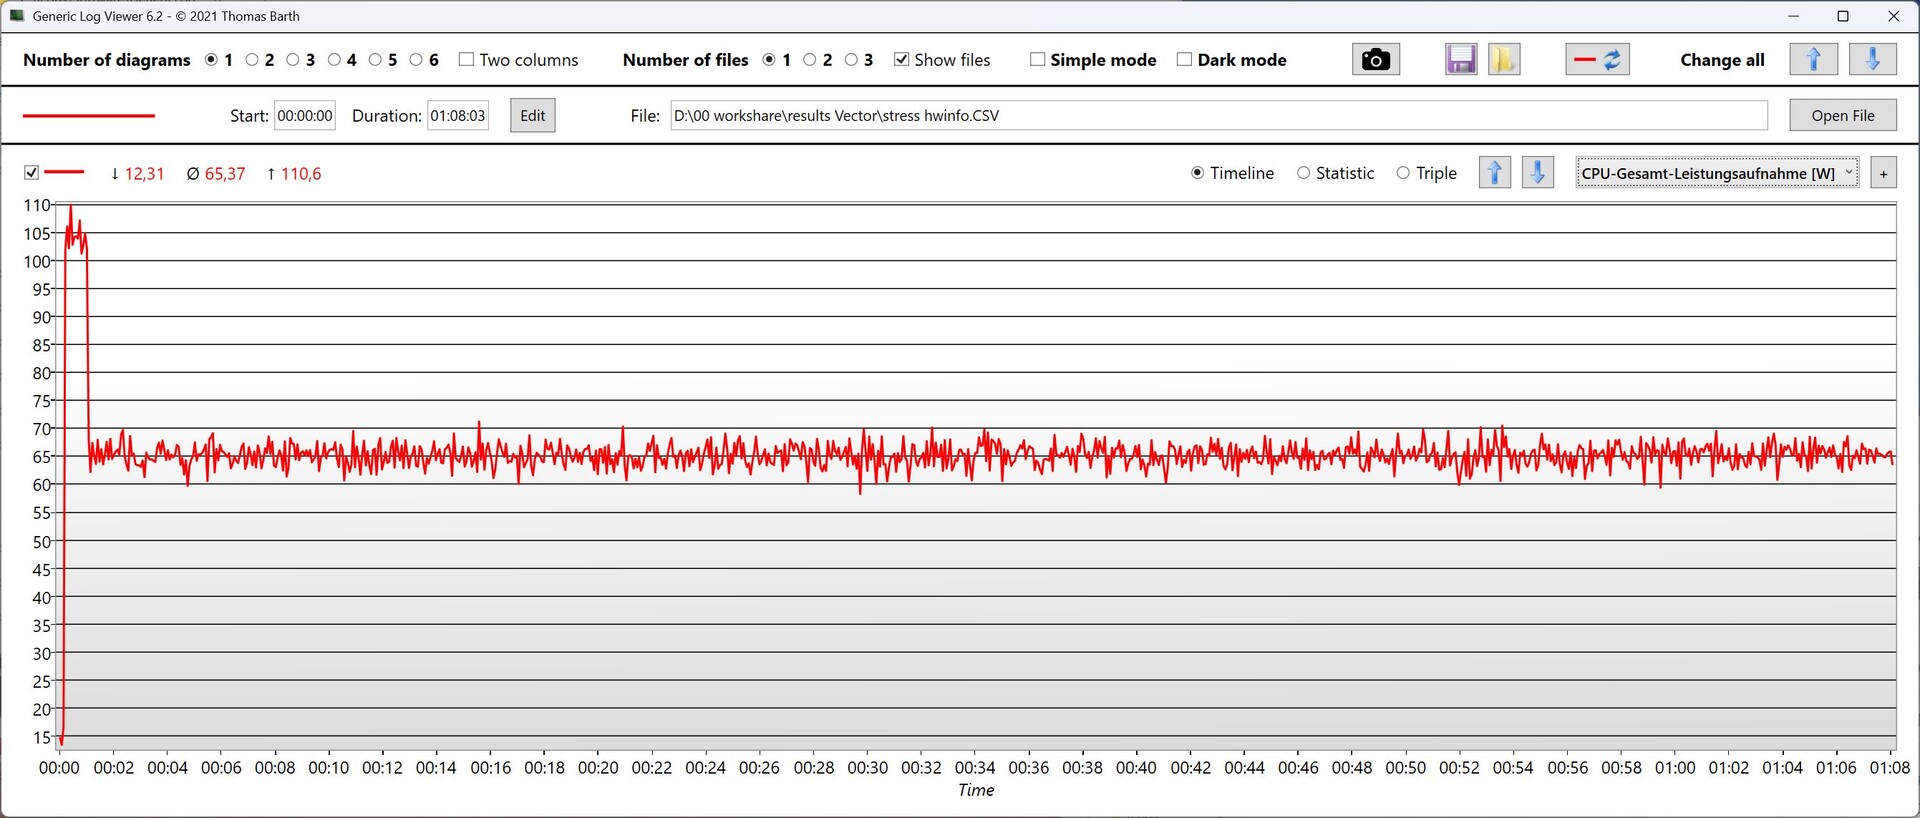
处理器
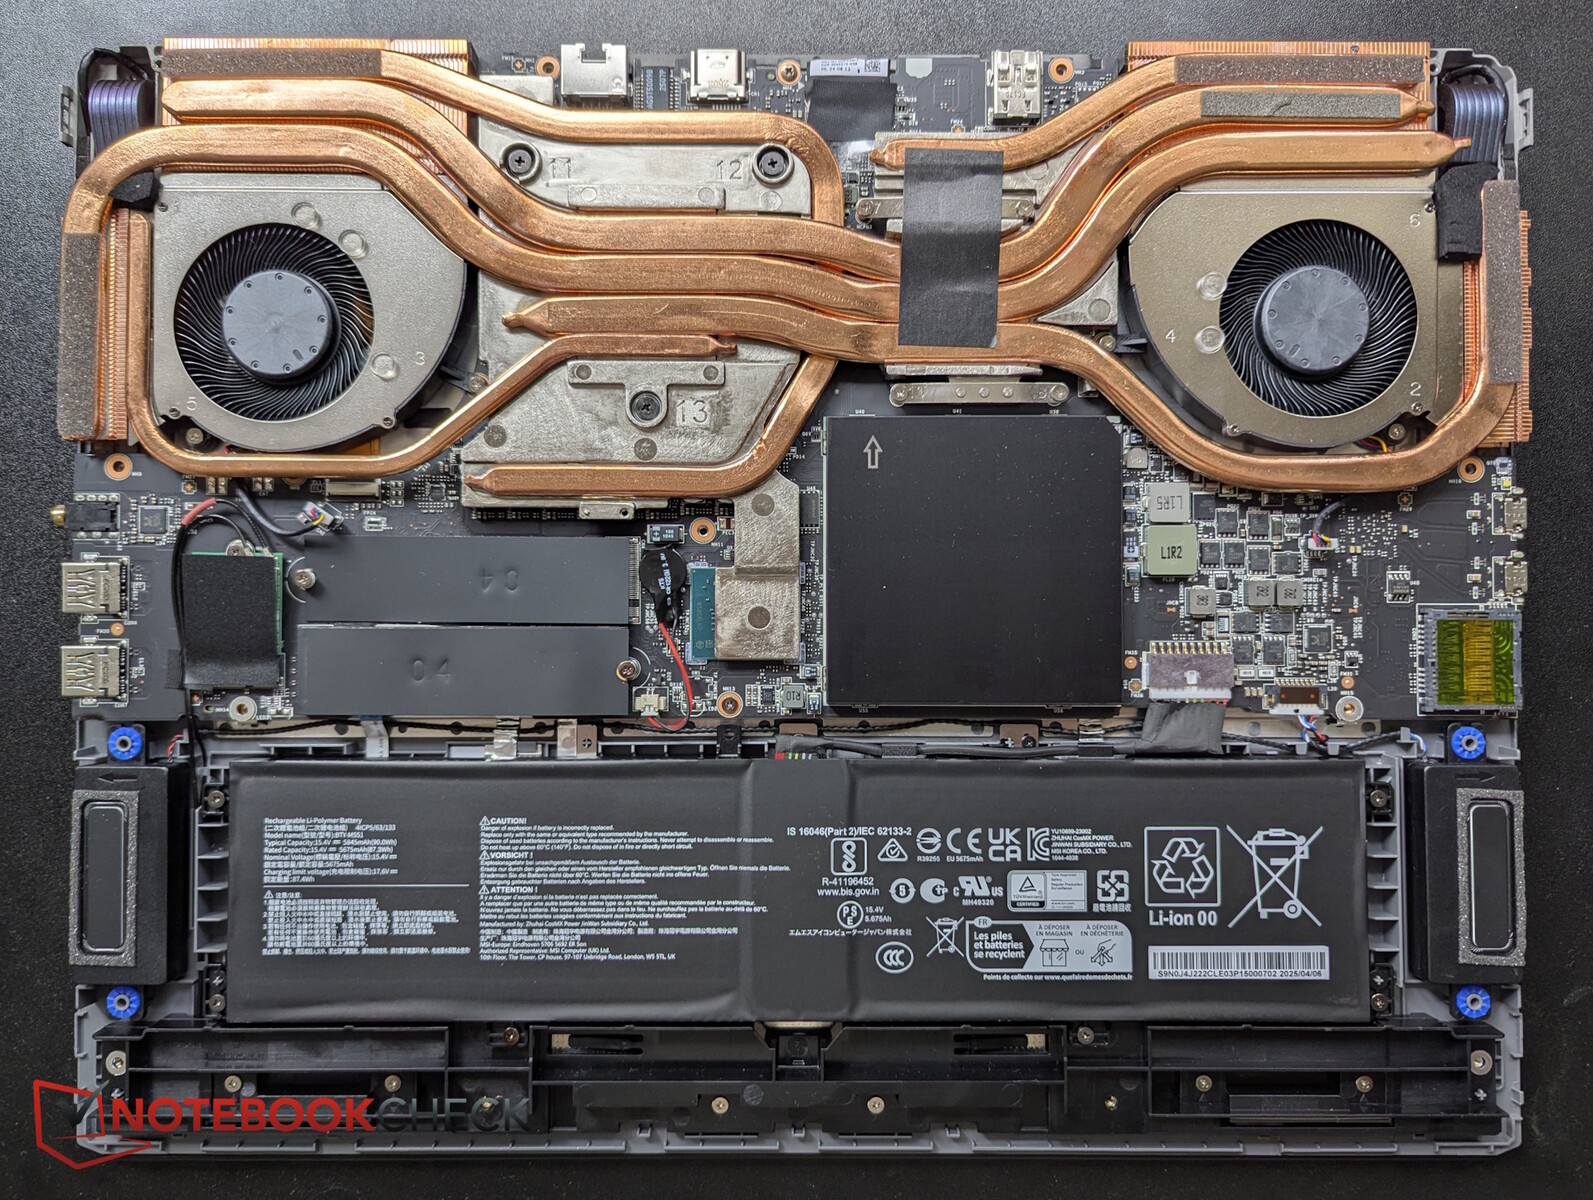
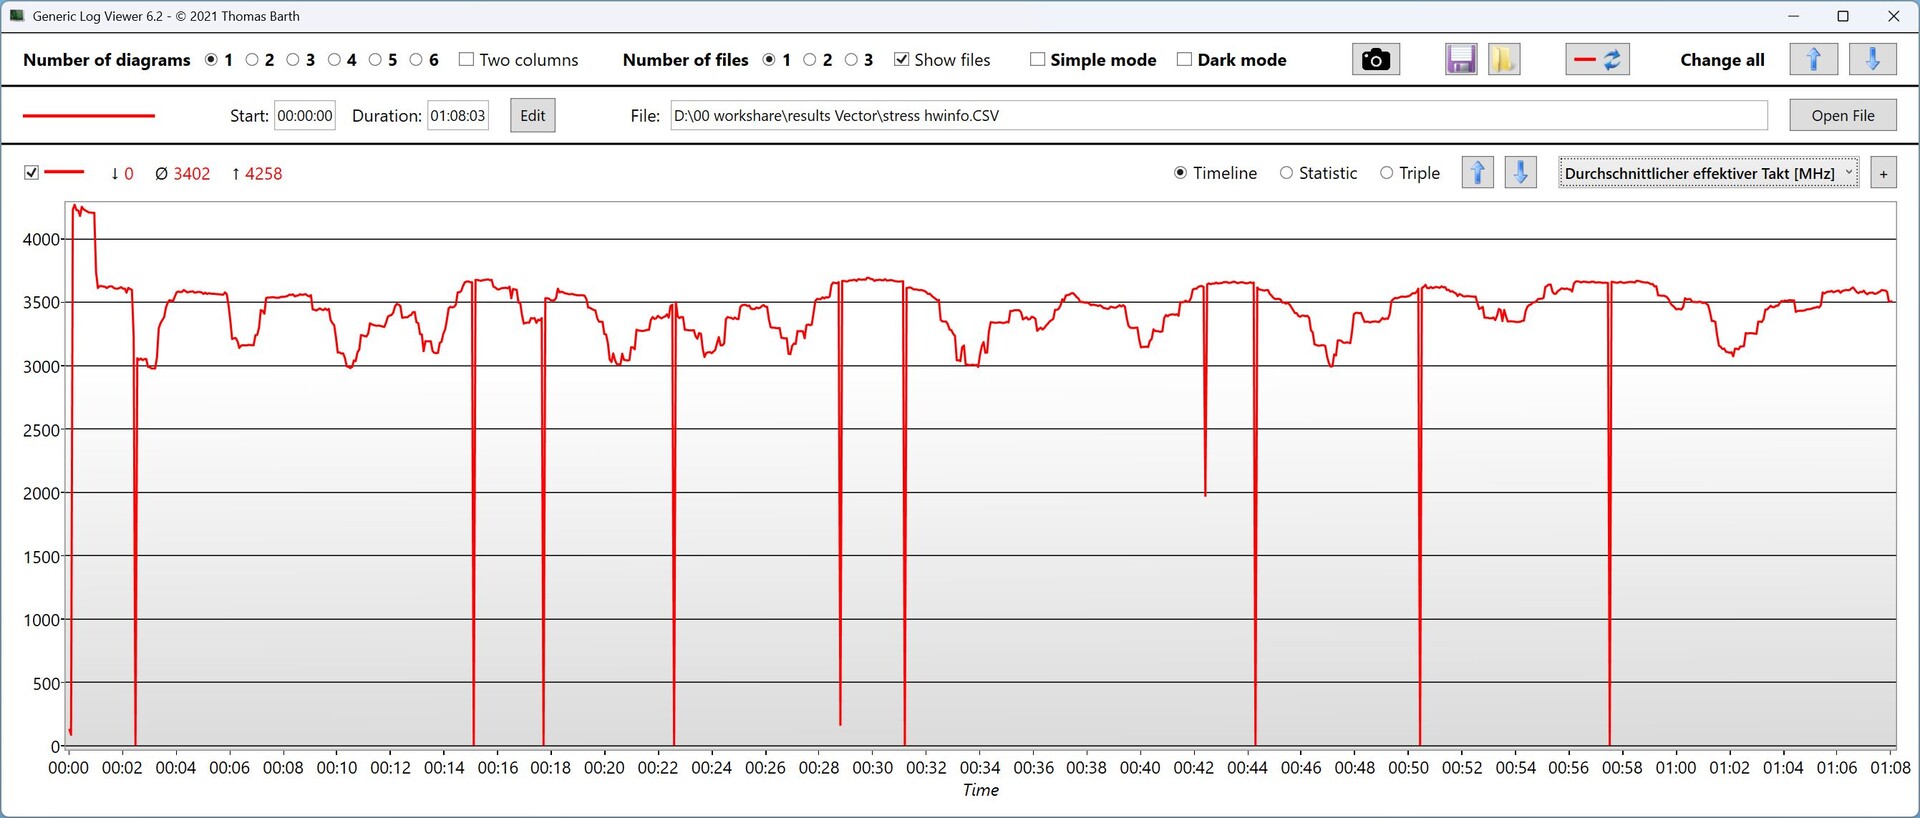
Core Ultra 9 275HX配备 24 个内核(8 个 P 内核和 16 个 E 内核,主频高达 5.4 GHz),在连续负载情况下会出现节流现象:在两个周期内保持中等性能,之后性能会下降 1000 多点。因此,其长期性能比 酷睿至尊 7 255HX.不过,在极限性能模式下,性能表现稳定。
在所有 CPU 测试中,Vector 17 HX 比相同 CPU 的平均水平落后约 6%。在电池模式下,CPU 性能损失约 59%。
Cinebench R15 Multi Endurance test
Cinebench R23: Multi Core | Single Core
Cinebench R20: CPU (Multi Core) | CPU (Single Core)
Cinebench R15: CPU Multi 64Bit | CPU Single 64Bit
Blender: v2.79 BMW27 CPU
7-Zip 18.03: 7z b 4 | 7z b 4 -mmt1
Geekbench 6.7: Multi-Core | Single-Core
Geekbench 5.5: Multi-Core | Single-Core
HWBOT x265 Benchmark v2.2: 4k Preset
LibreOffice : 20 Documents To PDF
R Benchmark 2.5: Overall mean
| CPU Performance rating | |
| Schenker XMG Neo 16 A25 5090 | |
| MSI Raider A18 HX A9WIG-080 | |
| MSI Titan 18 HX AI A2XWJG | |
| Aorus MASTER 16 AM6H | |
| Average Intel Core Ultra 9 275HX | |
| MSI Vector 17 HX AI A2XWIG | |
| Alienware 16 Area-51 | |
| Average of class Gaming | |
| Cinebench R23 / Multi Core | |
| MSI Titan 18 HX AI A2XWJG | |
| Schenker XMG Neo 16 A25 5090 | |
| MSI Raider A18 HX A9WIG-080 | |
| Aorus MASTER 16 AM6H | |
| Average Intel Core Ultra 9 275HX (30712 - 40970, n=31) | |
| MSI Vector 17 HX AI A2XWIG | |
| Alienware 16 Area-51 | |
| Average of class Gaming (10488 - 40970, n=106, last 2 years) | |
| Cinebench R23 / Single Core | |
| Aorus MASTER 16 AM6H | |
| Average Intel Core Ultra 9 275HX (2009 - 2267, n=31) | |
| MSI Titan 18 HX AI A2XWJG | |
| MSI Vector 17 HX AI A2XWIG | |
| Schenker XMG Neo 16 A25 5090 | |
| MSI Raider A18 HX A9WIG-080 | |
| Average of class Gaming (1166 - 2387, n=106, last 2 years) | |
| Alienware 16 Area-51 | |
| Cinebench R20 / CPU (Multi Core) | |
| MSI Titan 18 HX AI A2XWJG | |
| Schenker XMG Neo 16 A25 5090 | |
| MSI Raider A18 HX A9WIG-080 | |
| Aorus MASTER 16 AM6H | |
| Average Intel Core Ultra 9 275HX (12026 - 16108, n=30) | |
| Alienware 16 Area-51 | |
| MSI Vector 17 HX AI A2XWIG | |
| Average of class Gaming (4029 - 16108, n=105, last 2 years) | |
| Cinebench R20 / CPU (Single Core) | |
| Aorus MASTER 16 AM6H | |
| MSI Raider A18 HX A9WIG-080 | |
| Schenker XMG Neo 16 A25 5090 | |
| Average Intel Core Ultra 9 275HX (774 - 870, n=30) | |
| MSI Titan 18 HX AI A2XWJG | |
| MSI Vector 17 HX AI A2XWIG | |
| Average of class Gaming (442 - 904, n=105, last 2 years) | |
| Alienware 16 Area-51 | |
| Cinebench R15 / CPU Multi 64Bit | |
| MSI Titan 18 HX AI A2XWJG | |
| Schenker XMG Neo 16 A25 5090 | |
| MSI Raider A18 HX A9WIG-080 | |
| Aorus MASTER 16 AM6H | |
| Average Intel Core Ultra 9 275HX (4737 - 6271, n=30) | |
| MSI Vector 17 HX AI A2XWIG | |
| Alienware 16 Area-51 | |
| Average of class Gaming (1578 - 6271, n=104, last 2 years) | |
| Cinebench R15 / CPU Single 64Bit | |
| MSI Vector 17 HX AI A2XWIG | |
| MSI Vector 17 HX AI A2XWIG | |
| Schenker XMG Neo 16 A25 5090 | |
| Aorus MASTER 16 AM6H | |
| Average Intel Core Ultra 9 275HX (306 - 343, n=31) | |
| MSI Titan 18 HX AI A2XWJG | |
| MSI Raider A18 HX A9WIG-080 | |
| Alienware 16 Area-51 | |
| Average of class Gaming (188.8 - 344, n=105, last 2 years) | |
| Blender / v2.79 BMW27 CPU | |
| Average of class Gaming (80 - 330, n=103, last 2 years) | |
| MSI Vector 17 HX AI A2XWIG | |
| Alienware 16 Area-51 | |
| Average Intel Core Ultra 9 275HX (82 - 116, n=29) | |
| Aorus MASTER 16 AM6H | |
| MSI Titan 18 HX AI A2XWJG | |
| MSI Raider A18 HX A9WIG-080 | |
| Schenker XMG Neo 16 A25 5090 | |
| 7-Zip 18.03 / 7z b 4 | |
| Schenker XMG Neo 16 A25 5090 | |
| MSI Raider A18 HX A9WIG-080 | |
| MSI Titan 18 HX AI A2XWJG | |
| Average Intel Core Ultra 9 275HX (98236 - 124155, n=30) | |
| Aorus MASTER 16 AM6H | |
| Alienware 16 Area-51 | |
| MSI Vector 17 HX AI A2XWIG | |
| Average of class Gaming (33491 - 148086, n=104, last 2 years) | |
| 7-Zip 18.03 / 7z b 4 -mmt1 | |
| Schenker XMG Neo 16 A25 5090 | |
| MSI Raider A18 HX A9WIG-080 | |
| MSI Titan 18 HX AI A2XWJG | |
| Average Intel Core Ultra 9 275HX (6026 - 7149, n=30) | |
| Aorus MASTER 16 AM6H | |
| MSI Vector 17 HX AI A2XWIG | |
| Average of class Gaming (4199 - 7436, n=104, last 2 years) | |
| Alienware 16 Area-51 | |
| Geekbench 6.7 / Multi-Core | |
| MSI Titan 18 HX AI A2XWJG | |
| Schenker XMG Neo 16 A25 5090 | |
| MSI Raider A18 HX A9WIG-080 | |
| Average Intel Core Ultra 9 275HX (16033 - 21668, n=33) | |
| Aorus MASTER 16 AM6H | |
| MSI Vector 17 HX AI A2XWIG | |
| Alienware 16 Area-51 | |
| Average of class Gaming (6625 - 22104, n=105, last 2 years) | |
| Geekbench 6.7 / Single-Core | |
| Schenker XMG Neo 16 A25 5090 | |
| MSI Raider A18 HX A9WIG-080 | |
| MSI Vector 17 HX AI A2XWIG | |
| MSI Titan 18 HX AI A2XWJG | |
| Aorus MASTER 16 AM6H | |
| Average Intel Core Ultra 9 275HX (2843 - 3160, n=33) | |
| Alienware 16 Area-51 | |
| Average of class Gaming (1490 - 3259, n=105, last 2 years) | |
| Geekbench 5.5 / Multi-Core | |
| MSI Titan 18 HX AI A2XWJG | |
| Schenker XMG Neo 16 A25 5090 | |
| MSI Raider A18 HX A9WIG-080 | |
| Average Intel Core Ultra 9 275HX (19105 - 25855, n=31) | |
| Aorus MASTER 16 AM6H | |
| Alienware 16 Area-51 | |
| MSI Vector 17 HX AI A2XWIG | |
| Average of class Gaming (6460 - 27010, n=104, last 2 years) | |
| Geekbench 5.5 / Single-Core | |
| MSI Raider A18 HX A9WIG-080 | |
| Schenker XMG Neo 16 A25 5090 | |
| MSI Titan 18 HX AI A2XWJG | |
| MSI Vector 17 HX AI A2XWIG | |
| Aorus MASTER 16 AM6H | |
| Average Intel Core Ultra 9 275HX (2033 - 2292, n=31) | |
| Alienware 16 Area-51 | |
| Average of class Gaming (986 - 2474, n=104, last 2 years) | |
| HWBOT x265 Benchmark v2.2 / 4k Preset | |
| MSI Titan 18 HX AI A2XWJG | |
| MSI Raider A18 HX A9WIG-080 | |
| Schenker XMG Neo 16 A25 5090 | |
| Average Intel Core Ultra 9 275HX (30.7 - 43.8, n=30) | |
| Aorus MASTER 16 AM6H | |
| MSI Vector 17 HX AI A2XWIG | |
| Alienware 16 Area-51 | |
| Average of class Gaming (11.5 - 44.3, n=104, last 2 years) | |
| LibreOffice / 20 Documents To PDF | |
| Average of class Gaming (33.2 - 88.8, n=104, last 2 years) | |
| MSI Titan 18 HX AI A2XWJG | |
| Schenker XMG Neo 16 A25 5090 | |
| MSI Raider A18 HX A9WIG-080 | |
| Average Intel Core Ultra 9 275HX (33.2 - 62.1, n=30) | |
| Aorus MASTER 16 AM6H | |
| MSI Vector 17 HX AI A2XWIG | |
| Alienware 16 Area-51 | |
| R Benchmark 2.5 / Overall mean | |
| Aorus MASTER 16 AM6H | |
| Alienware 16 Area-51 | |
| Average of class Gaming (0.3439 - 0.759, n=105, last 2 years) | |
| Average Intel Core Ultra 9 275HX (0.3943 - 0.4568, n=30) | |
| MSI Vector 17 HX AI A2XWIG | |
| MSI Titan 18 HX AI A2XWJG | |
| MSI Raider A18 HX A9WIG-080 | |
| Schenker XMG Neo 16 A25 5090 | |
* ... smaller is better
AIDA64: FP32 Ray-Trace | FPU Julia | CPU SHA3 | CPU Queen | FPU SinJulia | FPU Mandel | CPU AES | CPU ZLib | FP64 Ray-Trace | CPU PhotoWorxx
| Performance rating | |
| Schenker XMG Neo 16 E25 RTX 5090 Laptop | |
| Medion Erazer Beast 16 X1 Ultimate | |
| Aorus MASTER 16 AM6H | |
| Lenovo Legion 5 Pro 16IAX10H | |
| Average Intel Core Ultra 9 275HX | |
| Alienware 16 Area-51 | |
| Average of class Gaming | |
| MSI Vector 17 HX AI A2XWIG | |
| MSI Vector 16 HX AI A2XWHG | |
| AIDA64 / FP32 Ray-Trace | |
| Schenker XMG Neo 16 E25 RTX 5090 Laptop | |
| Medion Erazer Beast 16 X1 Ultimate | |
| Aorus MASTER 16 AM6H | |
| Average Intel Core Ultra 9 275HX (28039 - 39895, n=30) | |
| Lenovo Legion 5 Pro 16IAX10H | |
| Alienware 16 Area-51 | |
| Average of class Gaming (10227 - 85542, n=103, last 2 years) | |
| MSI Vector 17 HX AI A2XWIG | |
| MSI Vector 16 HX AI A2XWHG | |
| AIDA64 / FPU Julia | |
| Schenker XMG Neo 16 E25 RTX 5090 Laptop | |
| Medion Erazer Beast 16 X1 Ultimate | |
| Aorus MASTER 16 AM6H | |
| Lenovo Legion 5 Pro 16IAX10H | |
| Average Intel Core Ultra 9 275HX (140254 - 200744, n=30) | |
| Alienware 16 Area-51 | |
| MSI Vector 17 HX AI A2XWIG | |
| MSI Vector 16 HX AI A2XWHG | |
| Average of class Gaming (51376 - 238426, n=103, last 2 years) | |
| AIDA64 / CPU SHA3 | |
| Schenker XMG Neo 16 E25 RTX 5090 Laptop | |
| Medion Erazer Beast 16 X1 Ultimate | |
| Aorus MASTER 16 AM6H | |
| Average Intel Core Ultra 9 275HX (6710 - 9817, n=30) | |
| Lenovo Legion 5 Pro 16IAX10H | |
| Alienware 16 Area-51 | |
| MSI Vector 17 HX AI A2XWIG | |
| MSI Vector 16 HX AI A2XWHG | |
| Average of class Gaming (2180 - 9817, n=103, last 2 years) | |
| AIDA64 / CPU Queen | |
| Schenker XMG Neo 16 E25 RTX 5090 Laptop | |
| Medion Erazer Beast 16 X1 Ultimate | |
| Lenovo Legion 5 Pro 16IAX10H | |
| Aorus MASTER 16 AM6H | |
| Average Intel Core Ultra 9 275HX (113887 - 140937, n=30) | |
| Alienware 16 Area-51 | |
| MSI Vector 17 HX AI A2XWIG | |
| Average of class Gaming (49785 - 173351, n=89, last 2 years) | |
| MSI Vector 16 HX AI A2XWHG | |
| AIDA64 / FPU SinJulia | |
| Average of class Gaming (4424 - 33636, n=103, last 2 years) | |
| Medion Erazer Beast 16 X1 Ultimate | |
| Schenker XMG Neo 16 E25 RTX 5090 Laptop | |
| Lenovo Legion 5 Pro 16IAX10H | |
| Alienware 16 Area-51 | |
| Aorus MASTER 16 AM6H | |
| Average Intel Core Ultra 9 275HX (11172 - 14425, n=30) | |
| MSI Vector 17 HX AI A2XWIG | |
| MSI Vector 16 HX AI A2XWHG | |
| AIDA64 / FPU Mandel | |
| Schenker XMG Neo 16 E25 RTX 5090 Laptop | |
| Aorus MASTER 16 AM6H | |
| Medion Erazer Beast 16 X1 Ultimate | |
| Average Intel Core Ultra 9 275HX (72596 - 104508, n=30) | |
| Lenovo Legion 5 Pro 16IAX10H | |
| Alienware 16 Area-51 | |
| MSI Vector 17 HX AI A2XWIG | |
| MSI Vector 16 HX AI A2XWHG | |
| Average of class Gaming (25115 - 128721, n=103, last 2 years) | |
| AIDA64 / CPU AES | |
| Schenker XMG Neo 16 E25 RTX 5090 Laptop | |
| Medion Erazer Beast 16 X1 Ultimate | |
| Lenovo Legion 5 Pro 16IAX10H | |
| Average Intel Core Ultra 9 275HX (105608 - 247074, n=30) | |
| Alienware 16 Area-51 | |
| Aorus MASTER 16 AM6H | |
| Average of class Gaming (39258 - 247074, n=103, last 2 years) | |
| MSI Vector 17 HX AI A2XWIG | |
| MSI Vector 16 HX AI A2XWHG | |
| AIDA64 / CPU ZLib | |
| Schenker XMG Neo 16 E25 RTX 5090 Laptop | |
| Medion Erazer Beast 16 X1 Ultimate | |
| Lenovo Legion 5 Pro 16IAX10H | |
| Aorus MASTER 16 AM6H | |
| Average Intel Core Ultra 9 275HX (1582 - 2263, n=30) | |
| Alienware 16 Area-51 | |
| MSI Vector 17 HX AI A2XWIG | |
| Average of class Gaming (574 - 2531, n=103, last 2 years) | |
| MSI Vector 16 HX AI A2XWHG | |
| AIDA64 / FP64 Ray-Trace | |
| Schenker XMG Neo 16 E25 RTX 5090 Laptop | |
| Medion Erazer Beast 16 X1 Ultimate | |
| Aorus MASTER 16 AM6H | |
| Average Intel Core Ultra 9 275HX (14847 - 21854, n=30) | |
| Lenovo Legion 5 Pro 16IAX10H | |
| Alienware 16 Area-51 | |
| Average of class Gaming (5509 - 45446, n=103, last 2 years) | |
| MSI Vector 16 HX AI A2XWHG | |
| MSI Vector 17 HX AI A2XWIG | |
| AIDA64 / CPU PhotoWorxx | |
| Schenker XMG Neo 16 E25 RTX 5090 Laptop | |
| Alienware 16 Area-51 | |
| Average Intel Core Ultra 9 275HX (37482 - 62916, n=30) | |
| Lenovo Legion 5 Pro 16IAX10H | |
| Medion Erazer Beast 16 X1 Ultimate | |
| MSI Vector 17 HX AI A2XWIG | |
| Aorus MASTER 16 AM6H | |
| Average of class Gaming (12271 - 89891, n=103, last 2 years) | |
| MSI Vector 16 HX AI A2XWHG | |
系统性能
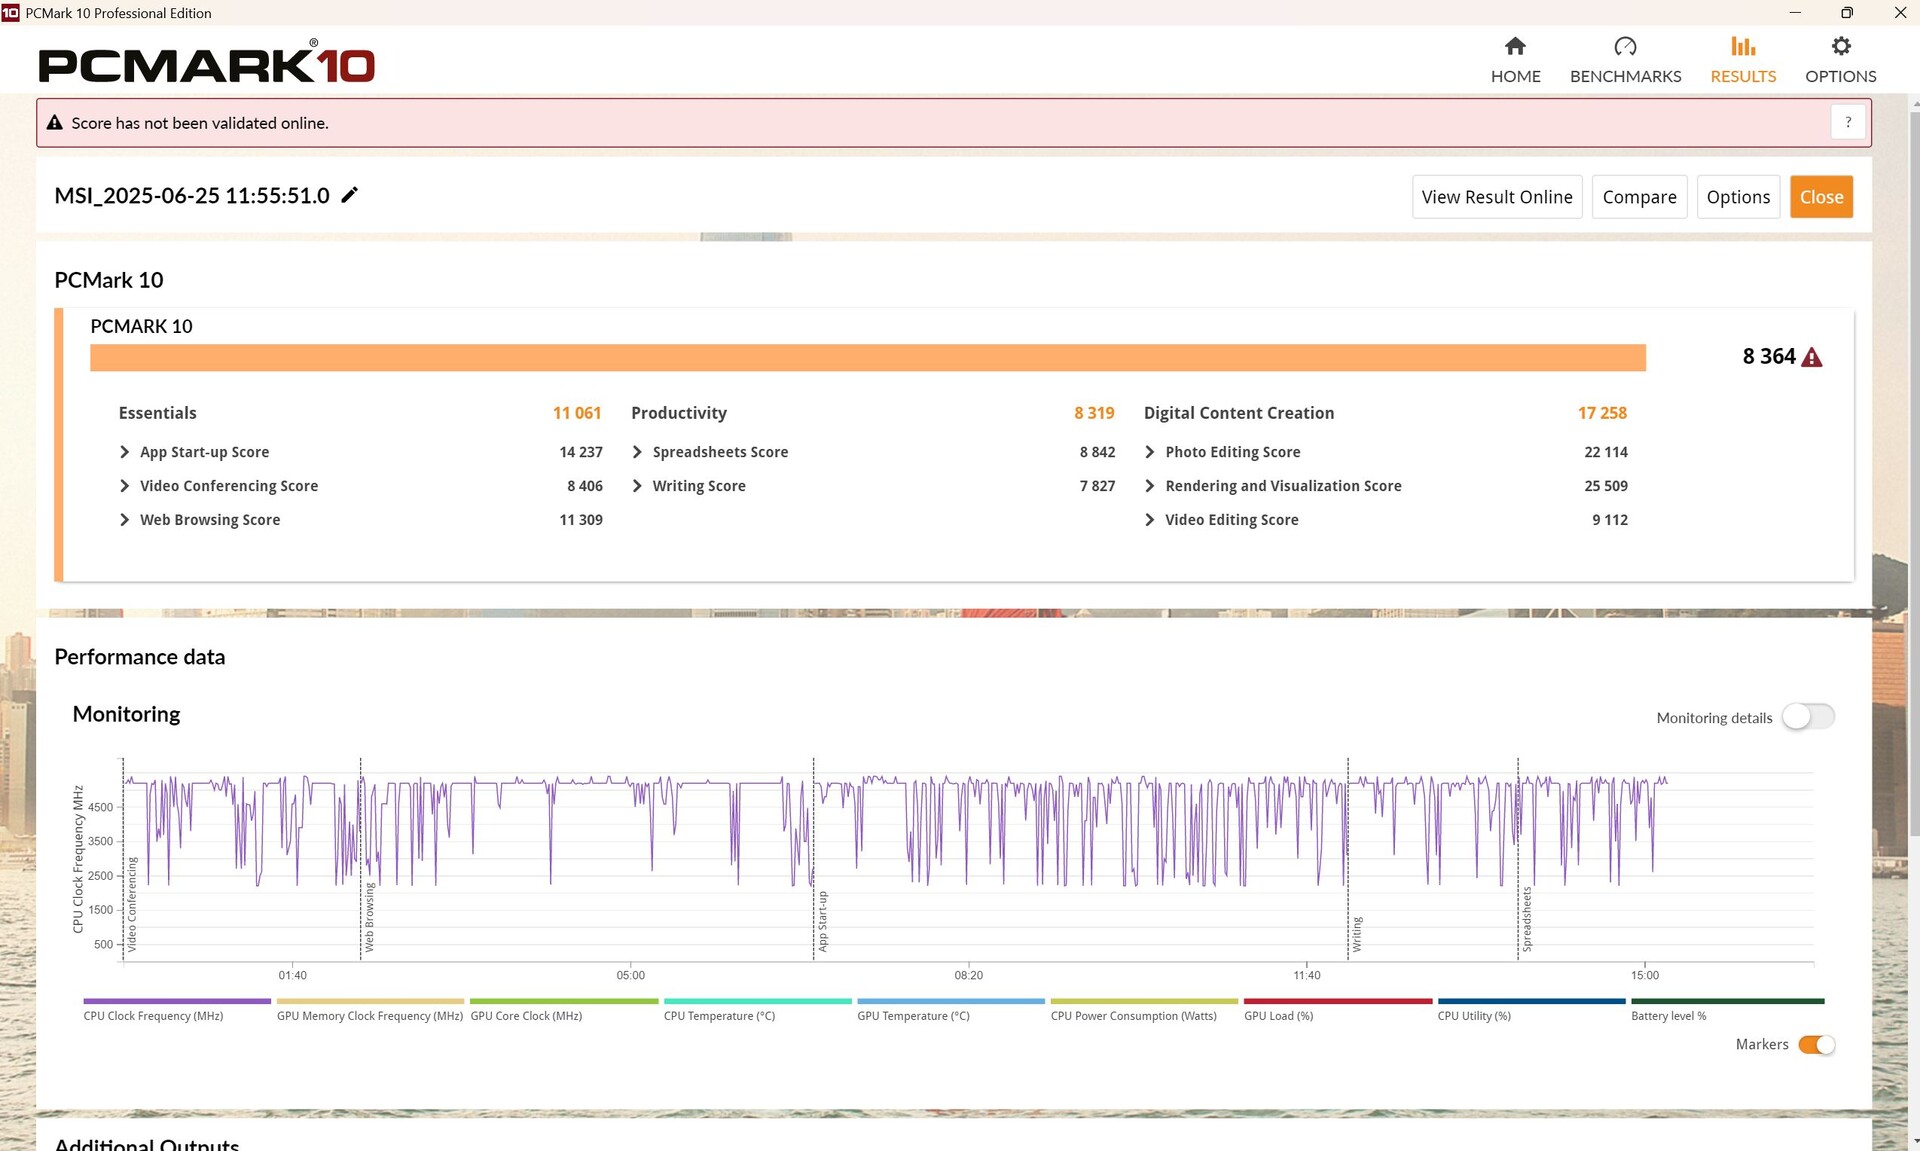
Vector 17 在 PCMark 10 中的表现略低于平均水平,但在 CrossMark 中略高于平均水平,因此我们看到其整体性能达到了预期水平。
PCMark 10: Score | Essentials | Productivity | Digital Content Creation
CrossMark: Overall | Productivity | Creativity | Responsiveness
WebXPRT 3: Overall
WebXPRT 4: Overall
Mozilla Kraken 1.1: Total
| Performance rating | |
| MSI Raider A18 HX A9WIG-080 | |
| Lenovo Legion 5 Pro 16IAX10H | |
| Alienware 16 Area-51 | |
| Average Intel Core Ultra 9 275HX, NVIDIA GeForce RTX 5080 Laptop | |
| Lenovo Legion Pro 7i 16 Gen 10 | |
| MSI Vector 17 HX AI A2XWIG | |
| Average of class Gaming | |
| Medion Erazer Beast 18 X1 MD62731 | |
| MSI Vector 16 HX AI A2XWHG | |
| PCMark 10 / Score | |
| Lenovo Legion Pro 7i 16 Gen 10 | |
| MSI Raider A18 HX A9WIG-080 | |
| Alienware 16 Area-51 | |
| Average Intel Core Ultra 9 275HX, NVIDIA GeForce RTX 5080 Laptop (7805 - 10409, n=9) | |
| Average of class Gaming (5828 - 11730, n=92, last 2 years) | |
| Medion Erazer Beast 18 X1 MD62731 | |
| MSI Vector 17 HX AI A2XWIG | |
| Lenovo Legion 5 Pro 16IAX10H | |
| MSI Vector 16 HX AI A2XWHG | |
| PCMark 10 / Essentials | |
| MSI Raider A18 HX A9WIG-080 | |
| Lenovo Legion Pro 7i 16 Gen 10 | |
| Alienware 16 Area-51 | |
| MSI Vector 17 HX AI A2XWIG | |
| Average Intel Core Ultra 9 275HX, NVIDIA GeForce RTX 5080 Laptop (10206 - 11472, n=9) | |
| Lenovo Legion 5 Pro 16IAX10H | |
| MSI Vector 16 HX AI A2XWHG | |
| Average of class Gaming (8810 - 11935, n=96, last 2 years) | |
| Medion Erazer Beast 18 X1 MD62731 | |
| PCMark 10 / Productivity | |
| Average of class Gaming (6845 - 21327, n=94, last 2 years) | |
| MSI Raider A18 HX A9WIG-080 | |
| Average Intel Core Ultra 9 275HX, NVIDIA GeForce RTX 5080 Laptop (8319 - 20616, n=9) | |
| Medion Erazer Beast 18 X1 MD62731 | |
| Lenovo Legion 5 Pro 16IAX10H | |
| Lenovo Legion Pro 7i 16 Gen 10 | |
| MSI Vector 16 HX AI A2XWHG | |
| Alienware 16 Area-51 | |
| MSI Vector 17 HX AI A2XWIG | |
| PCMark 10 / Digital Content Creation | |
| Lenovo Legion Pro 7i 16 Gen 10 | |
| Alienware 16 Area-51 | |
| MSI Vector 17 HX AI A2XWIG | |
| Average Intel Core Ultra 9 275HX, NVIDIA GeForce RTX 5080 Laptop (10505 - 19351, n=9) | |
| Medion Erazer Beast 18 X1 MD62731 | |
| Lenovo Legion 5 Pro 16IAX10H | |
| MSI Raider A18 HX A9WIG-080 | |
| Average of class Gaming (7602 - 19954, n=94, last 2 years) | |
| MSI Vector 16 HX AI A2XWHG | |
| CrossMark / Overall | |
| MSI Raider A18 HX A9WIG-080 | |
| MSI Vector 17 HX AI A2XWIG | |
| Lenovo Legion 5 Pro 16IAX10H | |
| Alienware 16 Area-51 | |
| Average Intel Core Ultra 9 275HX, NVIDIA GeForce RTX 5080 Laptop (1857 - 2244, n=9) | |
| Lenovo Legion Pro 7i 16 Gen 10 | |
| Average of class Gaming (1366 - 2409, n=93, last 2 years) | |
| MSI Vector 16 HX AI A2XWHG | |
| Medion Erazer Beast 18 X1 MD62731 | |
| CrossMark / Productivity | |
| MSI Vector 17 HX AI A2XWIG | |
| Lenovo Legion 5 Pro 16IAX10H | |
| Alienware 16 Area-51 | |
| MSI Raider A18 HX A9WIG-080 | |
| Average Intel Core Ultra 9 275HX, NVIDIA GeForce RTX 5080 Laptop (1764 - 2122, n=9) | |
| Lenovo Legion Pro 7i 16 Gen 10 | |
| Average of class Gaming (1386 - 2254, n=93, last 2 years) | |
| MSI Vector 16 HX AI A2XWHG | |
| Medion Erazer Beast 18 X1 MD62731 | |
| CrossMark / Creativity | |
| MSI Raider A18 HX A9WIG-080 | |
| Lenovo Legion 5 Pro 16IAX10H | |
| MSI Vector 17 HX AI A2XWIG | |
| Alienware 16 Area-51 | |
| Average Intel Core Ultra 9 275HX, NVIDIA GeForce RTX 5080 Laptop (2115 - 2498, n=9) | |
| Lenovo Legion Pro 7i 16 Gen 10 | |
| MSI Vector 16 HX AI A2XWHG | |
| Average of class Gaming (1343 - 2729, n=93, last 2 years) | |
| Medion Erazer Beast 18 X1 MD62731 | |
| CrossMark / Responsiveness | |
| Alienware 16 Area-51 | |
| MSI Vector 17 HX AI A2XWIG | |
| Lenovo Legion 5 Pro 16IAX10H | |
| Average Intel Core Ultra 9 275HX, NVIDIA GeForce RTX 5080 Laptop (1466 - 2096, n=9) | |
| MSI Raider A18 HX A9WIG-080 | |
| Average of class Gaming (1226 - 2334, n=93, last 2 years) | |
| Lenovo Legion Pro 7i 16 Gen 10 | |
| MSI Vector 16 HX AI A2XWHG | |
| Medion Erazer Beast 18 X1 MD62731 | |
| WebXPRT 3 / Overall | |
| Lenovo Legion 5 Pro 16IAX10H | |
| MSI Raider A18 HX A9WIG-080 | |
| Lenovo Legion Pro 7i 16 Gen 10 | |
| Alienware 16 Area-51 | |
| Average Intel Core Ultra 9 275HX, NVIDIA GeForce RTX 5080 Laptop (306 - 378, n=9) | |
| Medion Erazer Beast 18 X1 MD62731 | |
| MSI Vector 17 HX AI A2XWIG | |
| MSI Vector 16 HX AI A2XWHG | |
| Average of class Gaming (220 - 532, n=97, last 2 years) | |
| WebXPRT 4 / Overall | |
| MSI Vector 17 HX AI A2XWIG | |
| Lenovo Legion Pro 7i 16 Gen 10 | |
| MSI Raider A18 HX A9WIG-080 | |
| Alienware 16 Area-51 | |
| Lenovo Legion 5 Pro 16IAX10H | |
| Medion Erazer Beast 18 X1 MD62731 | |
| Average Intel Core Ultra 9 275HX, NVIDIA GeForce RTX 5080 Laptop (285 - 336, n=9) | |
| MSI Vector 16 HX AI A2XWHG | |
| Average of class Gaming (165 - 354, n=97, last 2 years) | |
| Mozilla Kraken 1.1 / Total | |
| Average of class Gaming (391 - 590, n=99, last 2 years) | |
| MSI Vector 16 HX AI A2XWHG | |
| MSI Vector 17 HX AI A2XWIG | |
| Medion Erazer Beast 18 X1 MD62731 | |
| Average Intel Core Ultra 9 275HX, NVIDIA GeForce RTX 5080 Laptop (405 - 432, n=9) | |
| Lenovo Legion 5 Pro 16IAX10H | |
| Alienware 16 Area-51 | |
| Lenovo Legion Pro 7i 16 Gen 10 | |
| MSI Raider A18 HX A9WIG-080 | |
* ... smaller is better
| PCMark 10 Score | 8364 points | |
Help | ||
| AIDA64 / Memory Copy | |
| Alienware 16 Area-51 | |
| Lenovo Legion Pro 7i 16 Gen 10 | |
| Average Intel Core Ultra 9 275HX (56003 - 94460, n=30) | |
| Lenovo Legion 5 Pro 16IAX10H | |
| MSI Vector 17 HX AI A2XWIG | |
| Medion Erazer Beast 18 X1 MD62731 | |
| Average of class Gaming (21750 - 129946, n=103, last 2 years) | |
| MSI Vector 16 HX AI A2XWHG | |
| MSI Raider A18 HX A9WIG-080 | |
| AIDA64 / Memory Read | |
| Lenovo Legion Pro 7i 16 Gen 10 | |
| Alienware 16 Area-51 | |
| Lenovo Legion 5 Pro 16IAX10H | |
| Medion Erazer Beast 18 X1 MD62731 | |
| MSI Vector 17 HX AI A2XWIG | |
| Average Intel Core Ultra 9 275HX (55795 - 97151, n=30) | |
| MSI Vector 16 HX AI A2XWHG | |
| Average of class Gaming (22956 - 118858, n=103, last 2 years) | |
| MSI Raider A18 HX A9WIG-080 | |
| AIDA64 / Memory Write | |
| Lenovo Legion Pro 7i 16 Gen 10 | |
| Alienware 16 Area-51 | |
| Average Intel Core Ultra 9 275HX (55663 - 116129, n=30) | |
| Lenovo Legion 5 Pro 16IAX10H | |
| Medion Erazer Beast 18 X1 MD62731 | |
| MSI Vector 17 HX AI A2XWIG | |
| Average of class Gaming (22297 - 135096, n=103, last 2 years) | |
| MSI Vector 16 HX AI A2XWHG | |
| MSI Raider A18 HX A9WIG-080 | |
| AIDA64 / Memory Latency | |
| Alienware 16 Area-51 | |
| Average Intel Core Ultra 9 275HX (105.8 - 161.6, n=30) | |
| MSI Vector 17 HX AI A2XWIG | |
| Lenovo Legion 5 Pro 16IAX10H | |
| Medion Erazer Beast 18 X1 MD62731 | |
| Lenovo Legion Pro 7i 16 Gen 10 | |
| Average of class Gaming (75.3 - 259, n=103, last 2 years) | |
| MSI Vector 16 HX AI A2XWHG | |
| MSI Raider A18 HX A9WIG-080 | |
* ... smaller is better
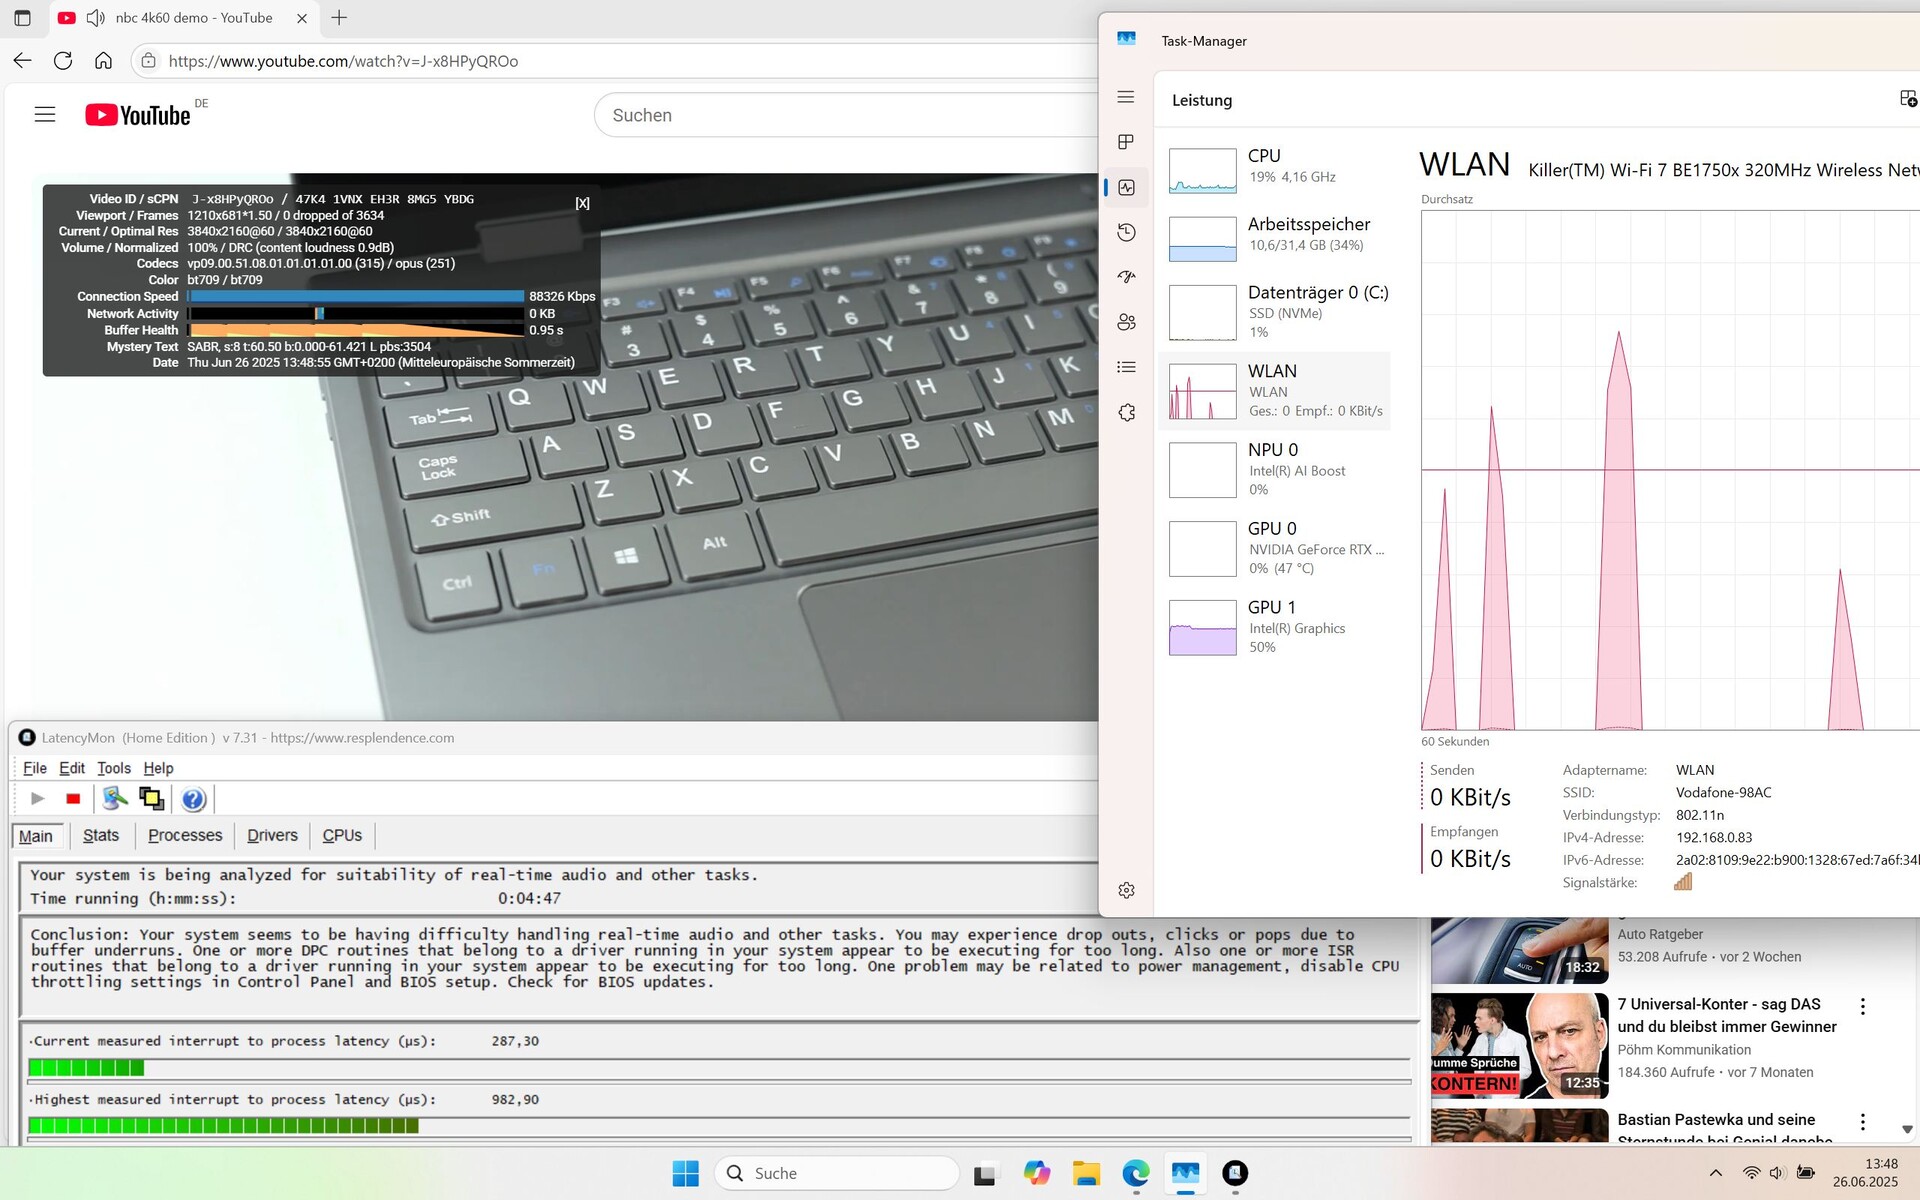
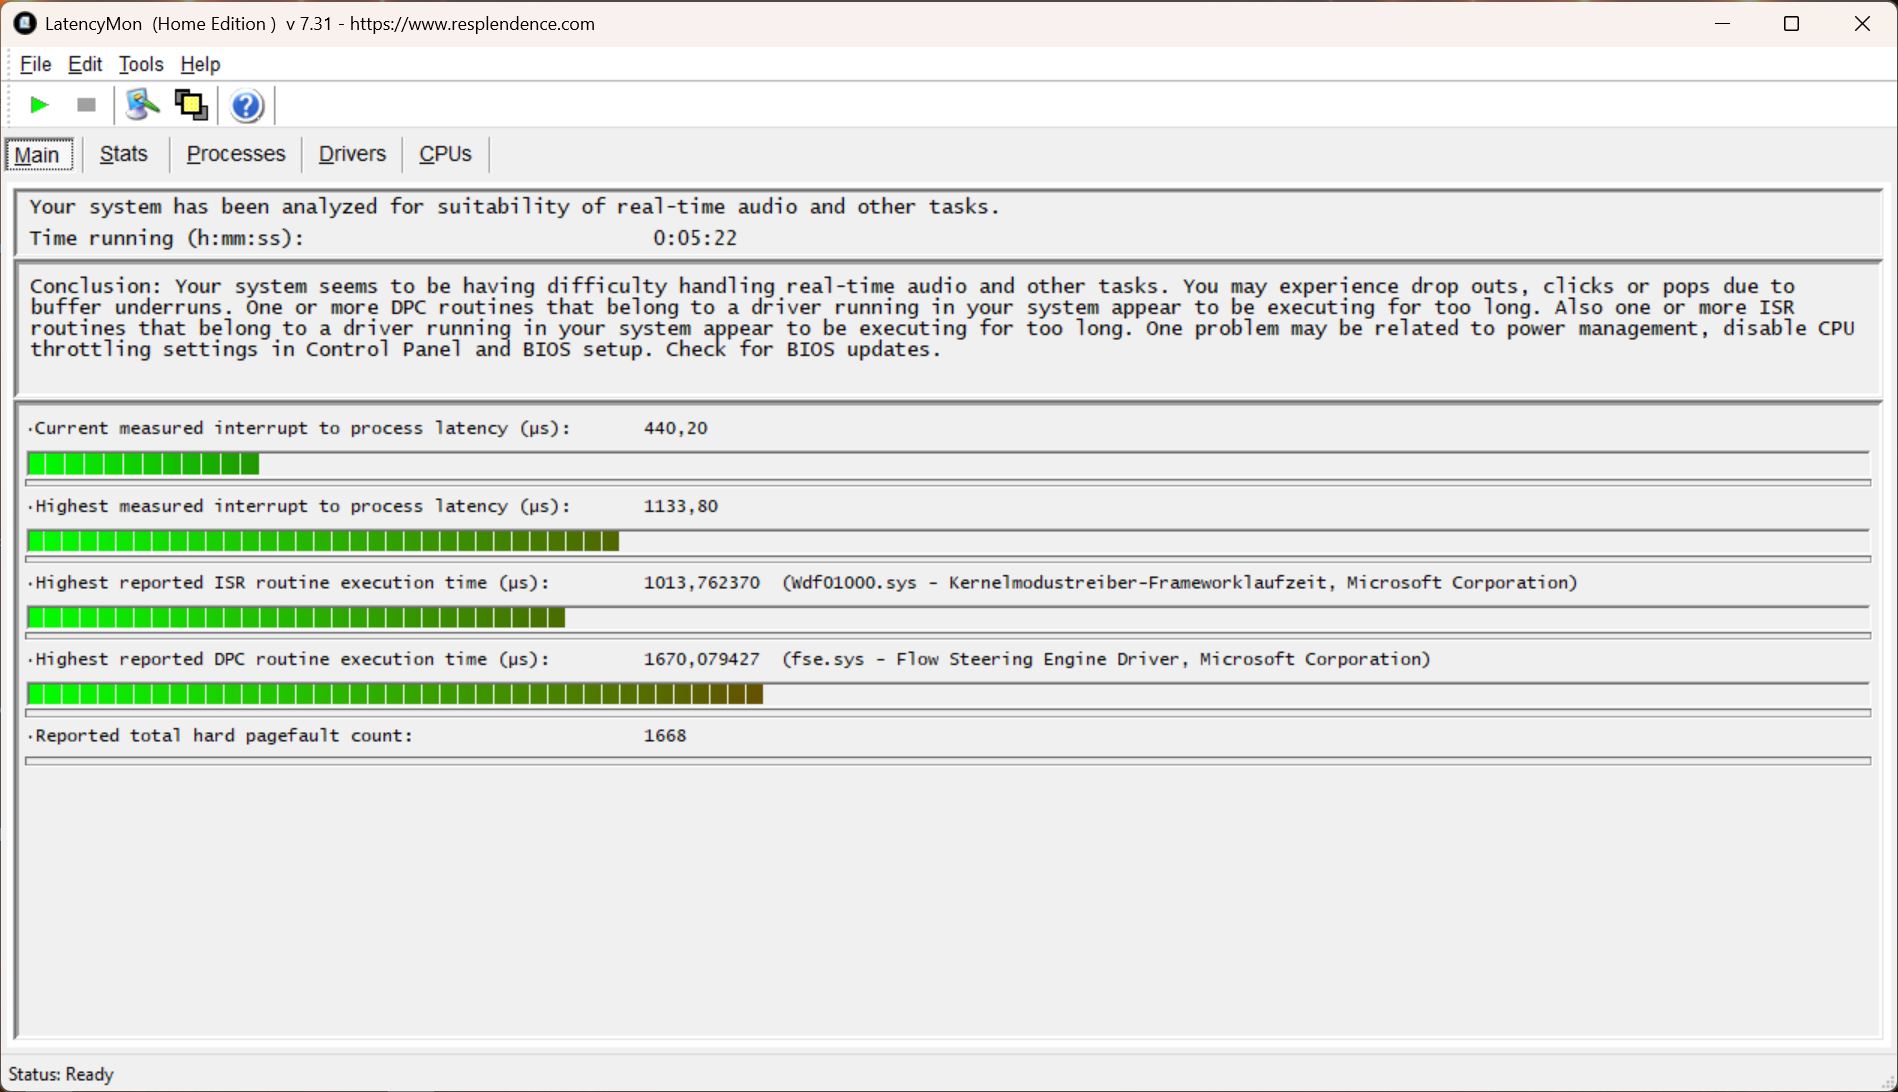
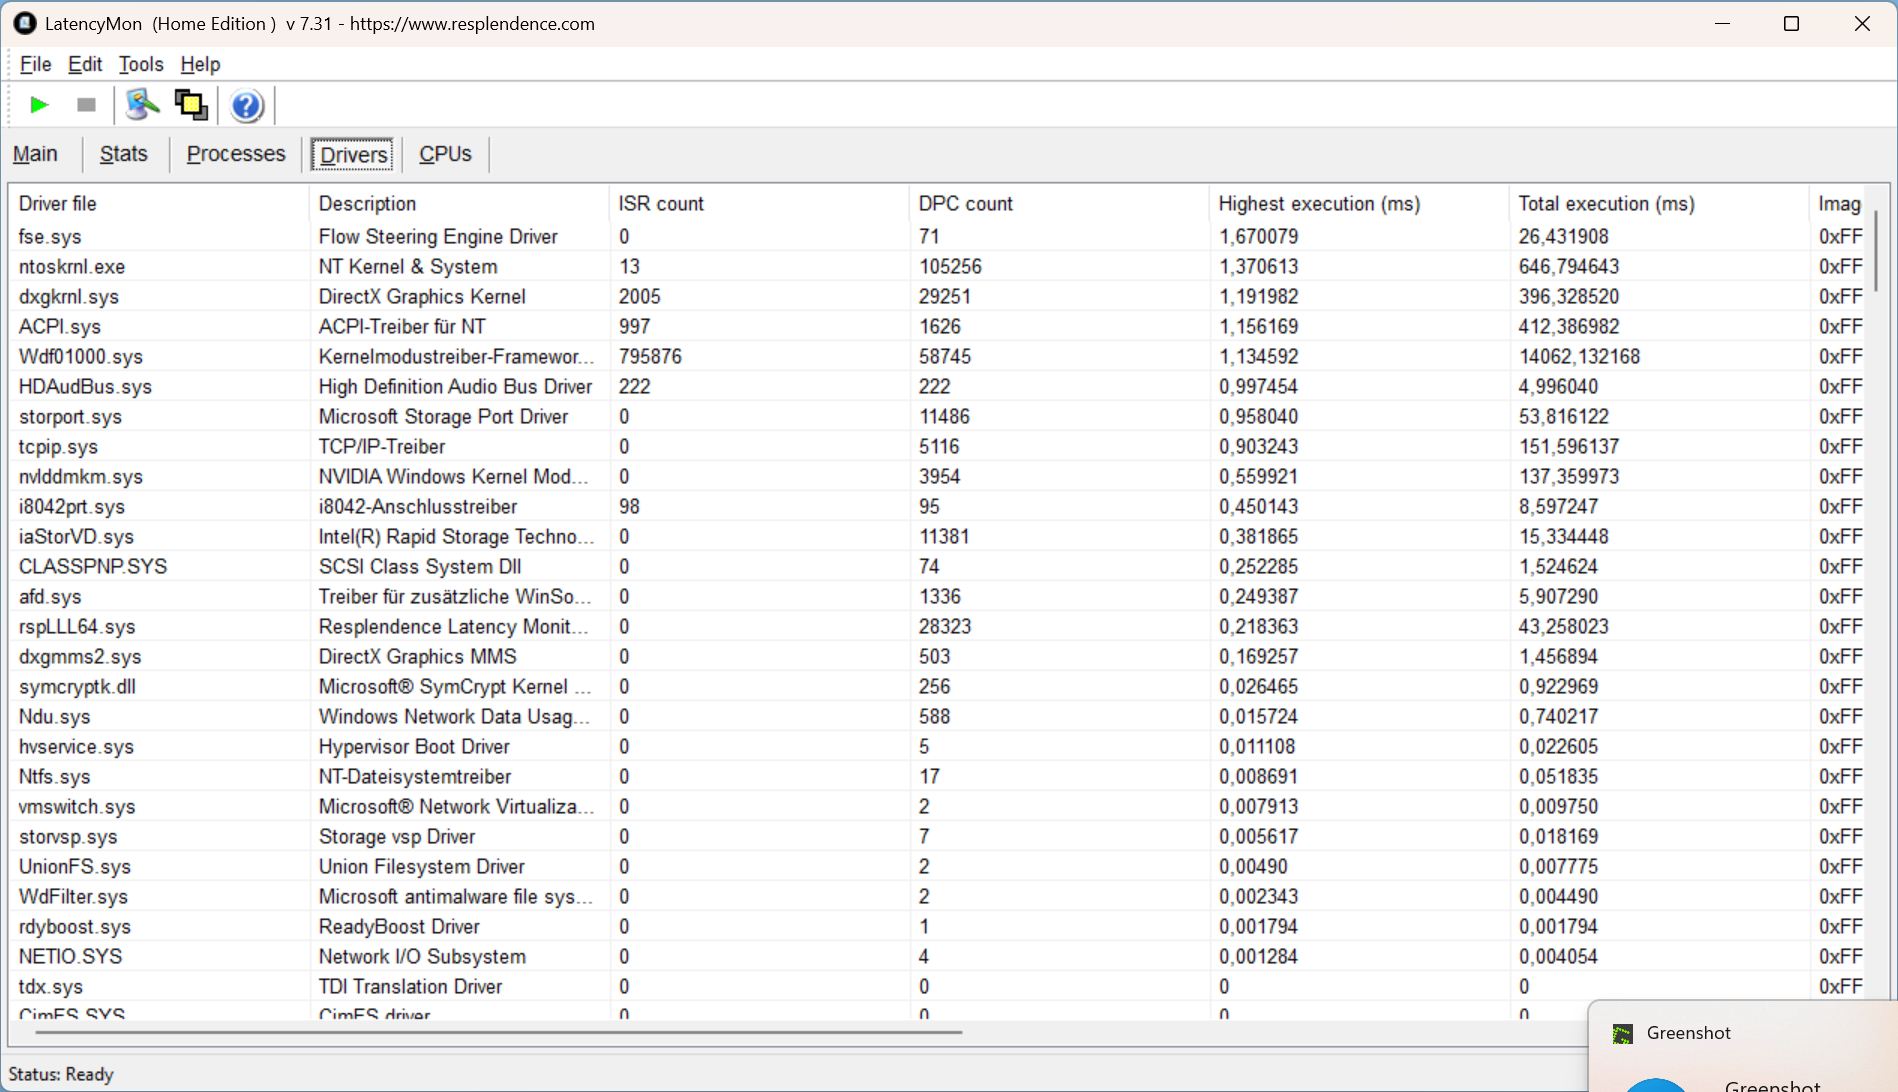
DPC 延迟
只有在打开多个浏览器标签页时才会出现延迟,之后的延迟也相对较低。我们播放 4K/60 fps 视频时没有出现任何丢帧现象。
| DPC Latencies / LatencyMon - interrupt to process latency (max), Web, Youtube, Prime95 | |
| Medion Erazer Beast 18 X1 MD62731 | |
| MSI Vector 16 HX AI A2XWHG | |
| Alienware 16 Area-51 | |
| MSI Vector 17 HX AI A2XWIG | |
| Lenovo Legion 5 Pro 16IAX10H | |
| MSI Raider A18 HX A9WIG-080 | |
| Lenovo Legion Pro 7i 16 Gen 10 | |
* ... smaller is better
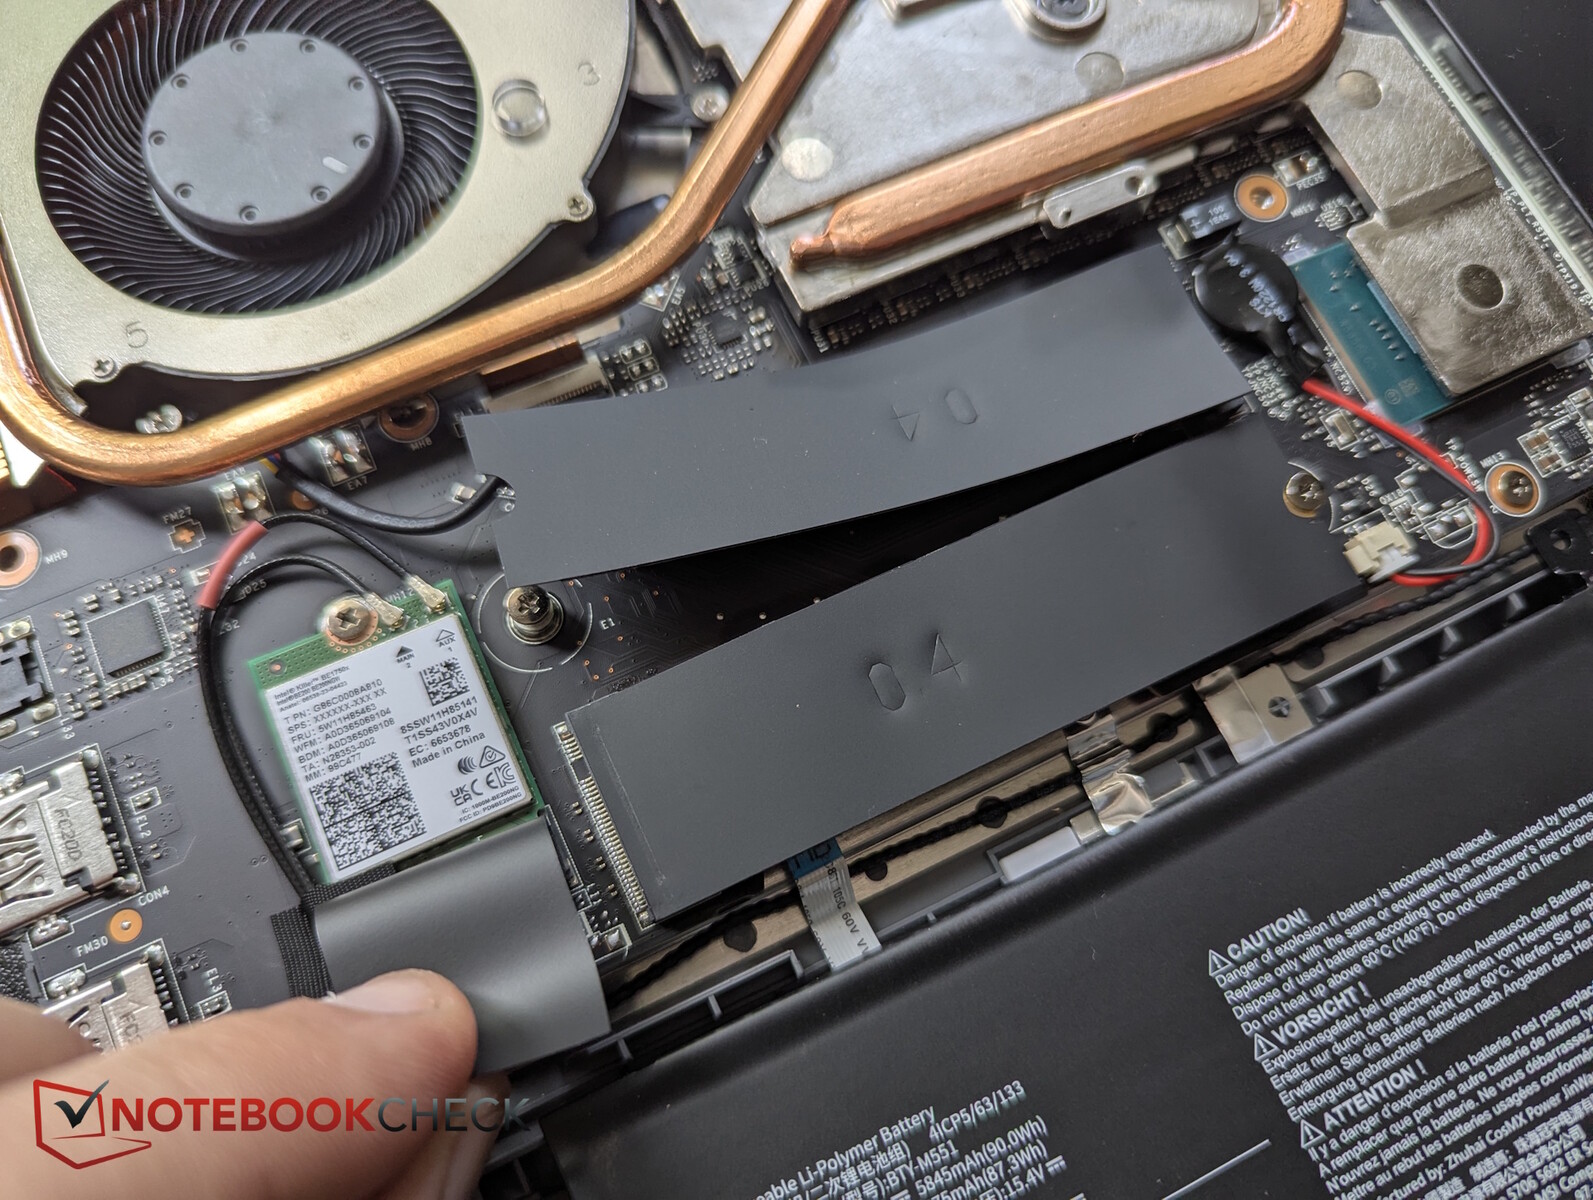
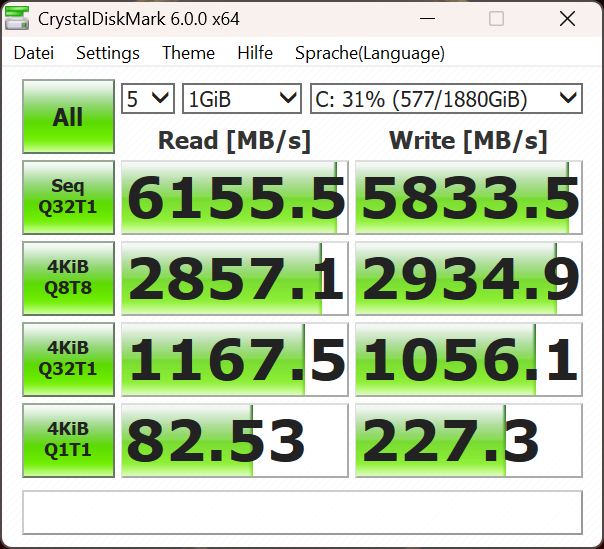
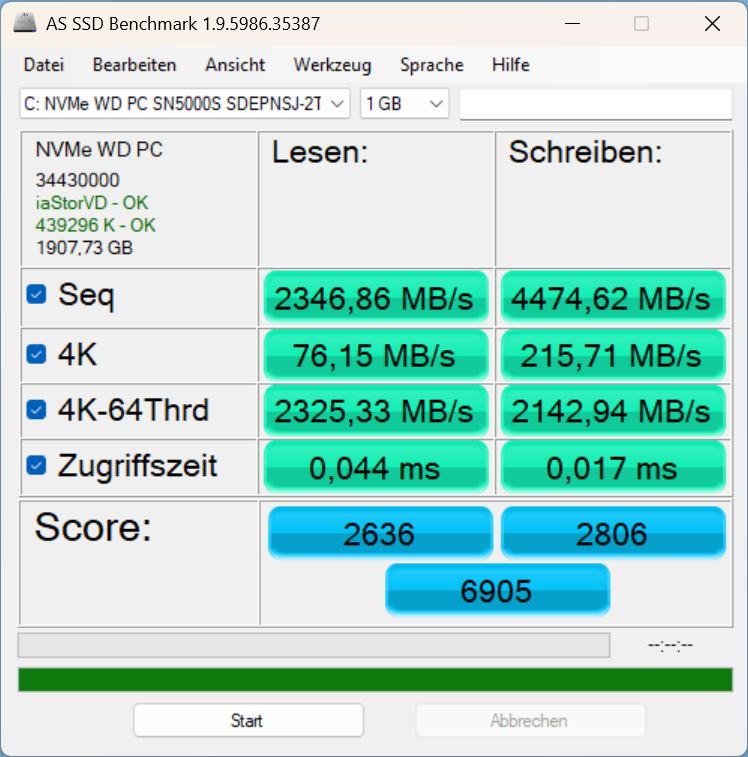
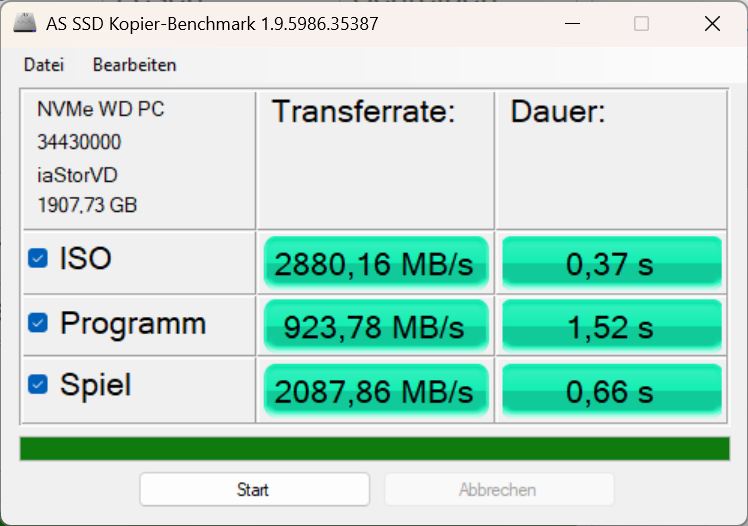
大容量存储器
西部数据 2 TB 固态硬盘的性能达到了一般到良好的水平,即使在长时间负载的情况下也不会出现节流现象。

* ... smaller is better
Continuous Reading: DiskSpd Read Loop, Queue Depth 8
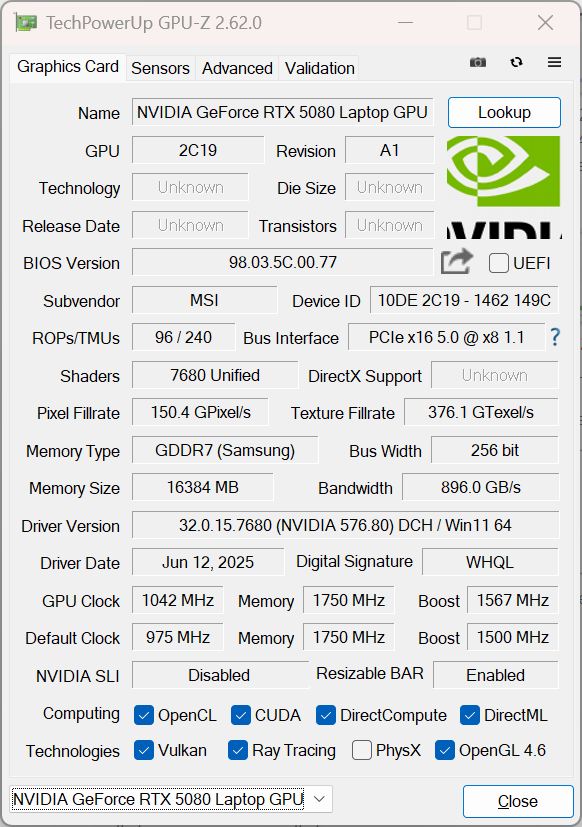
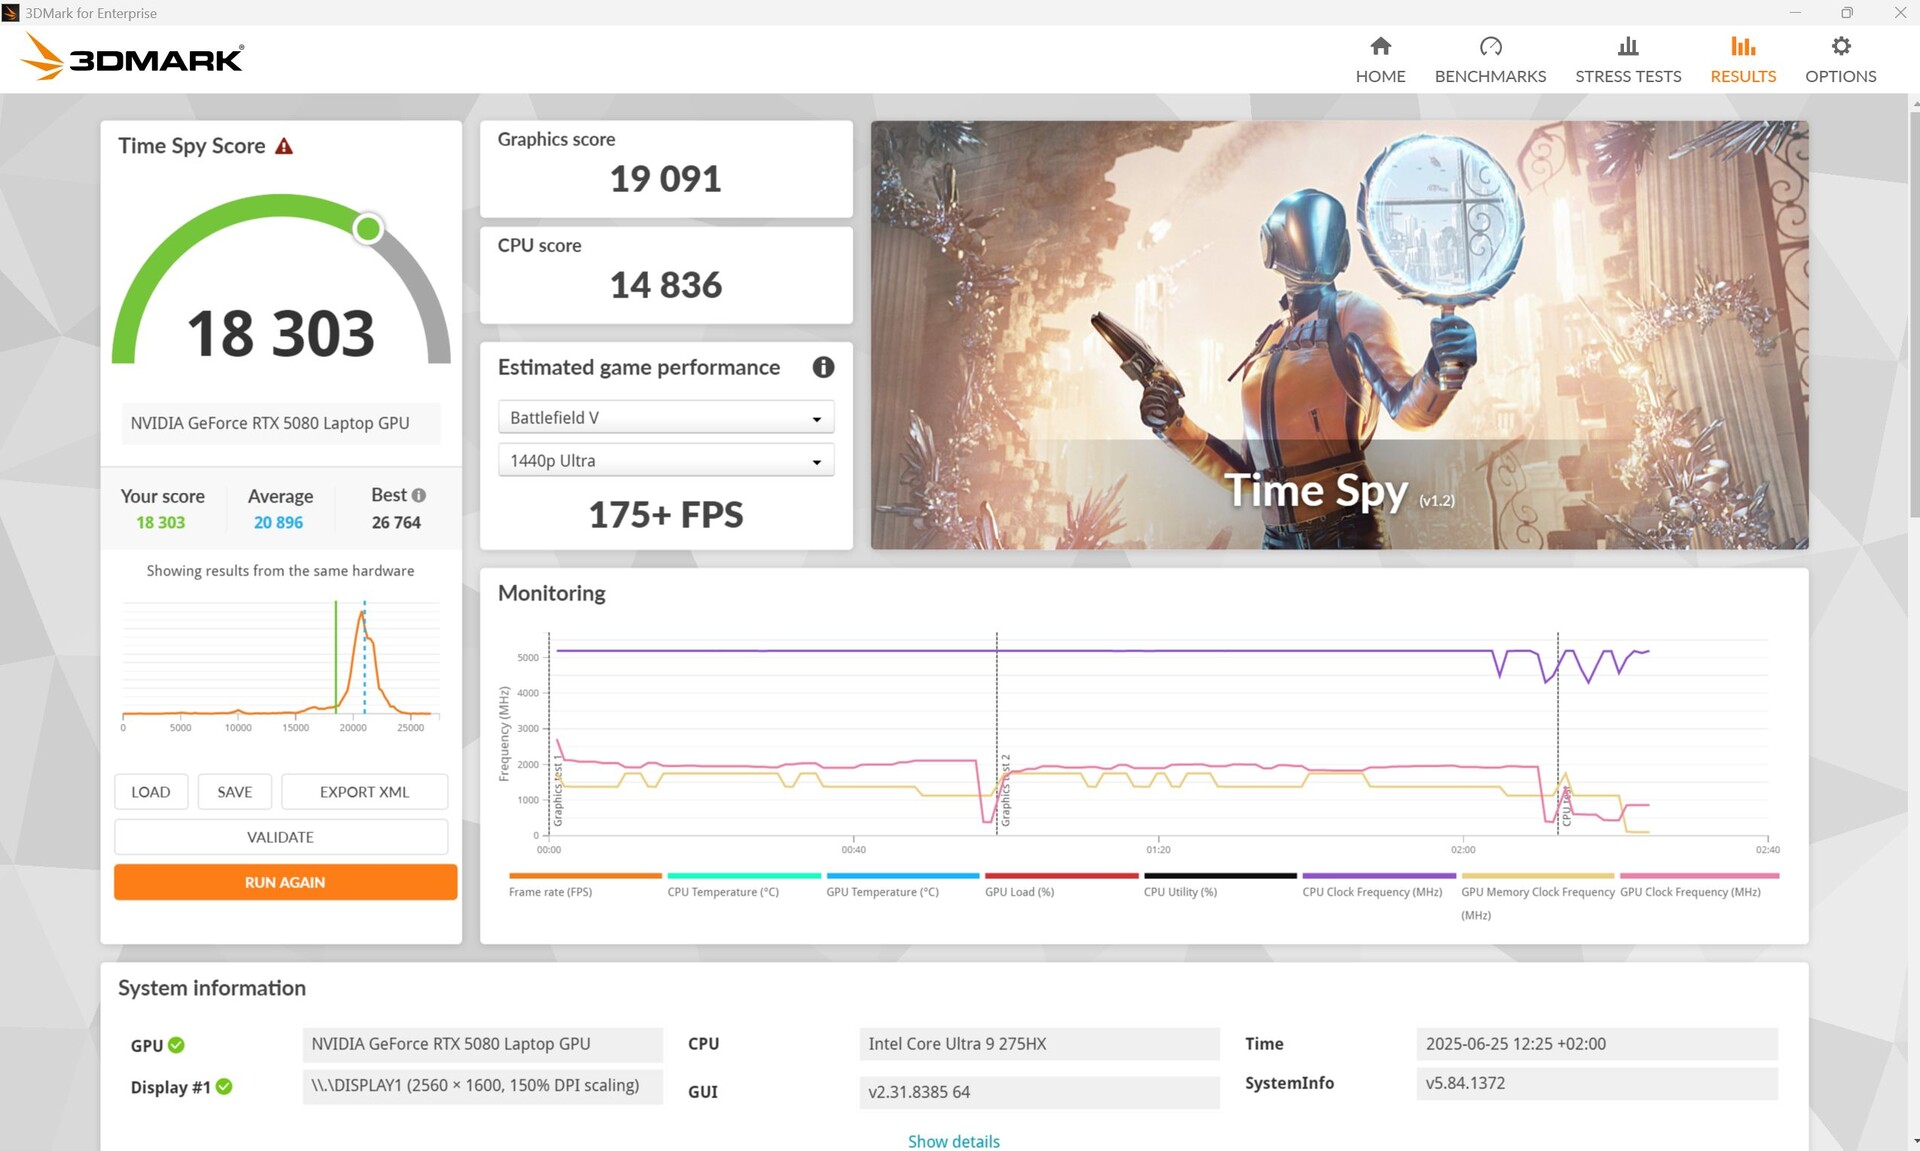
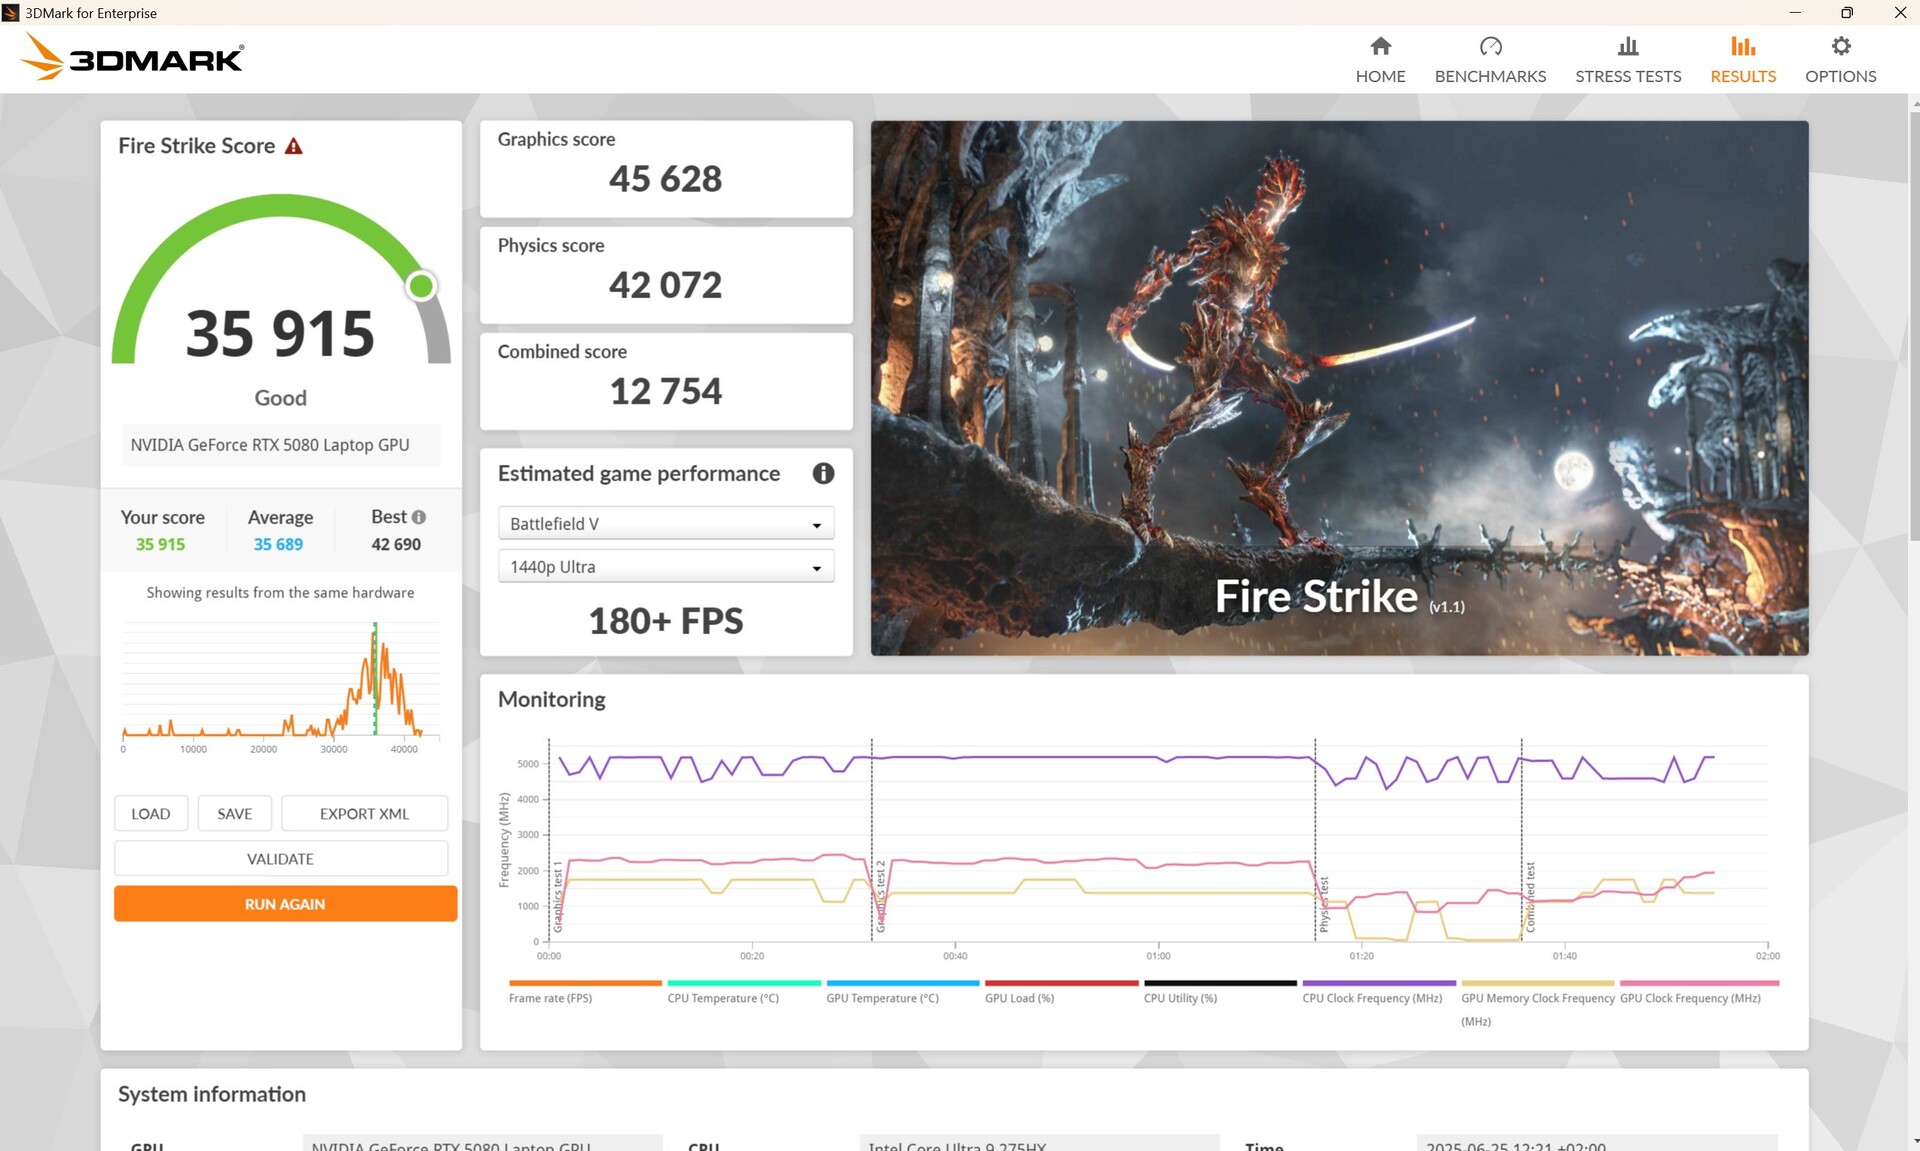
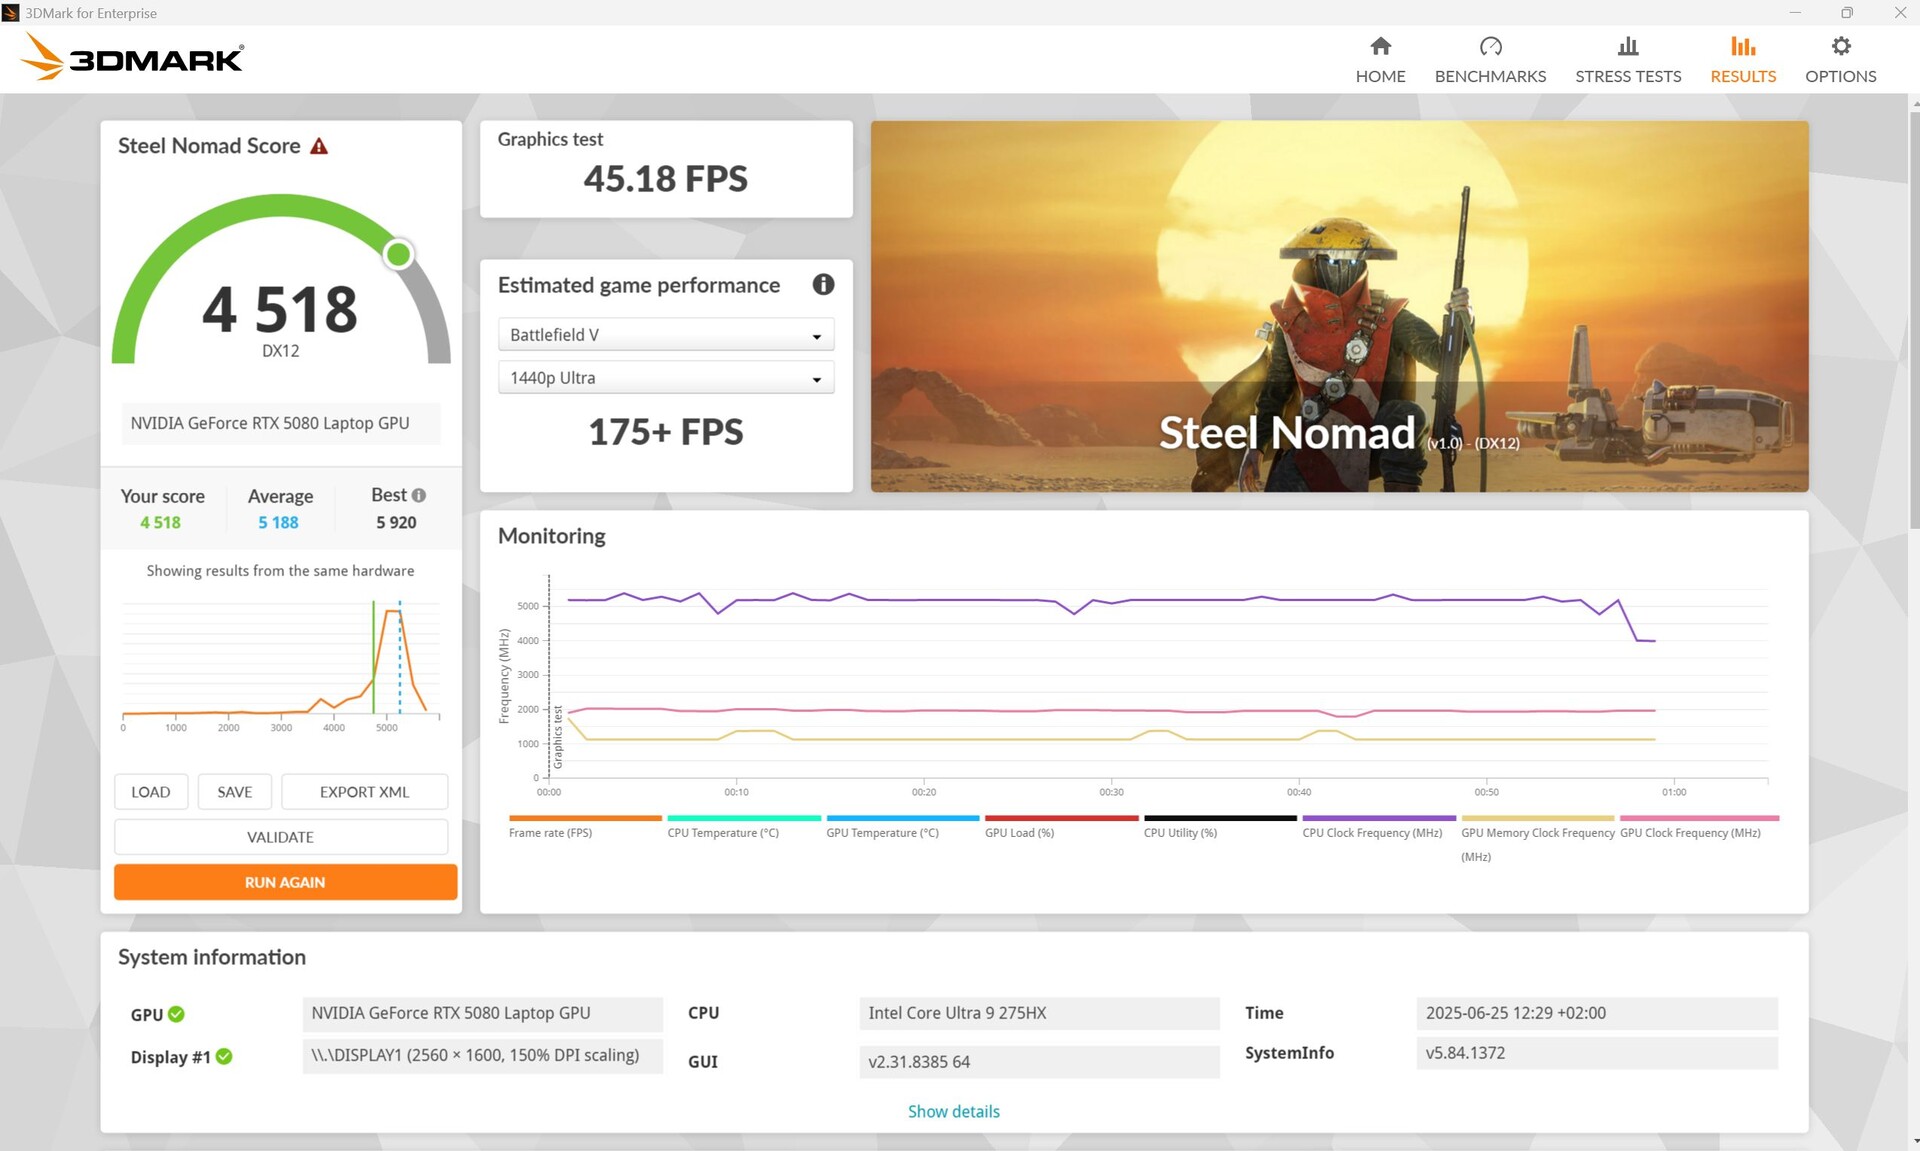
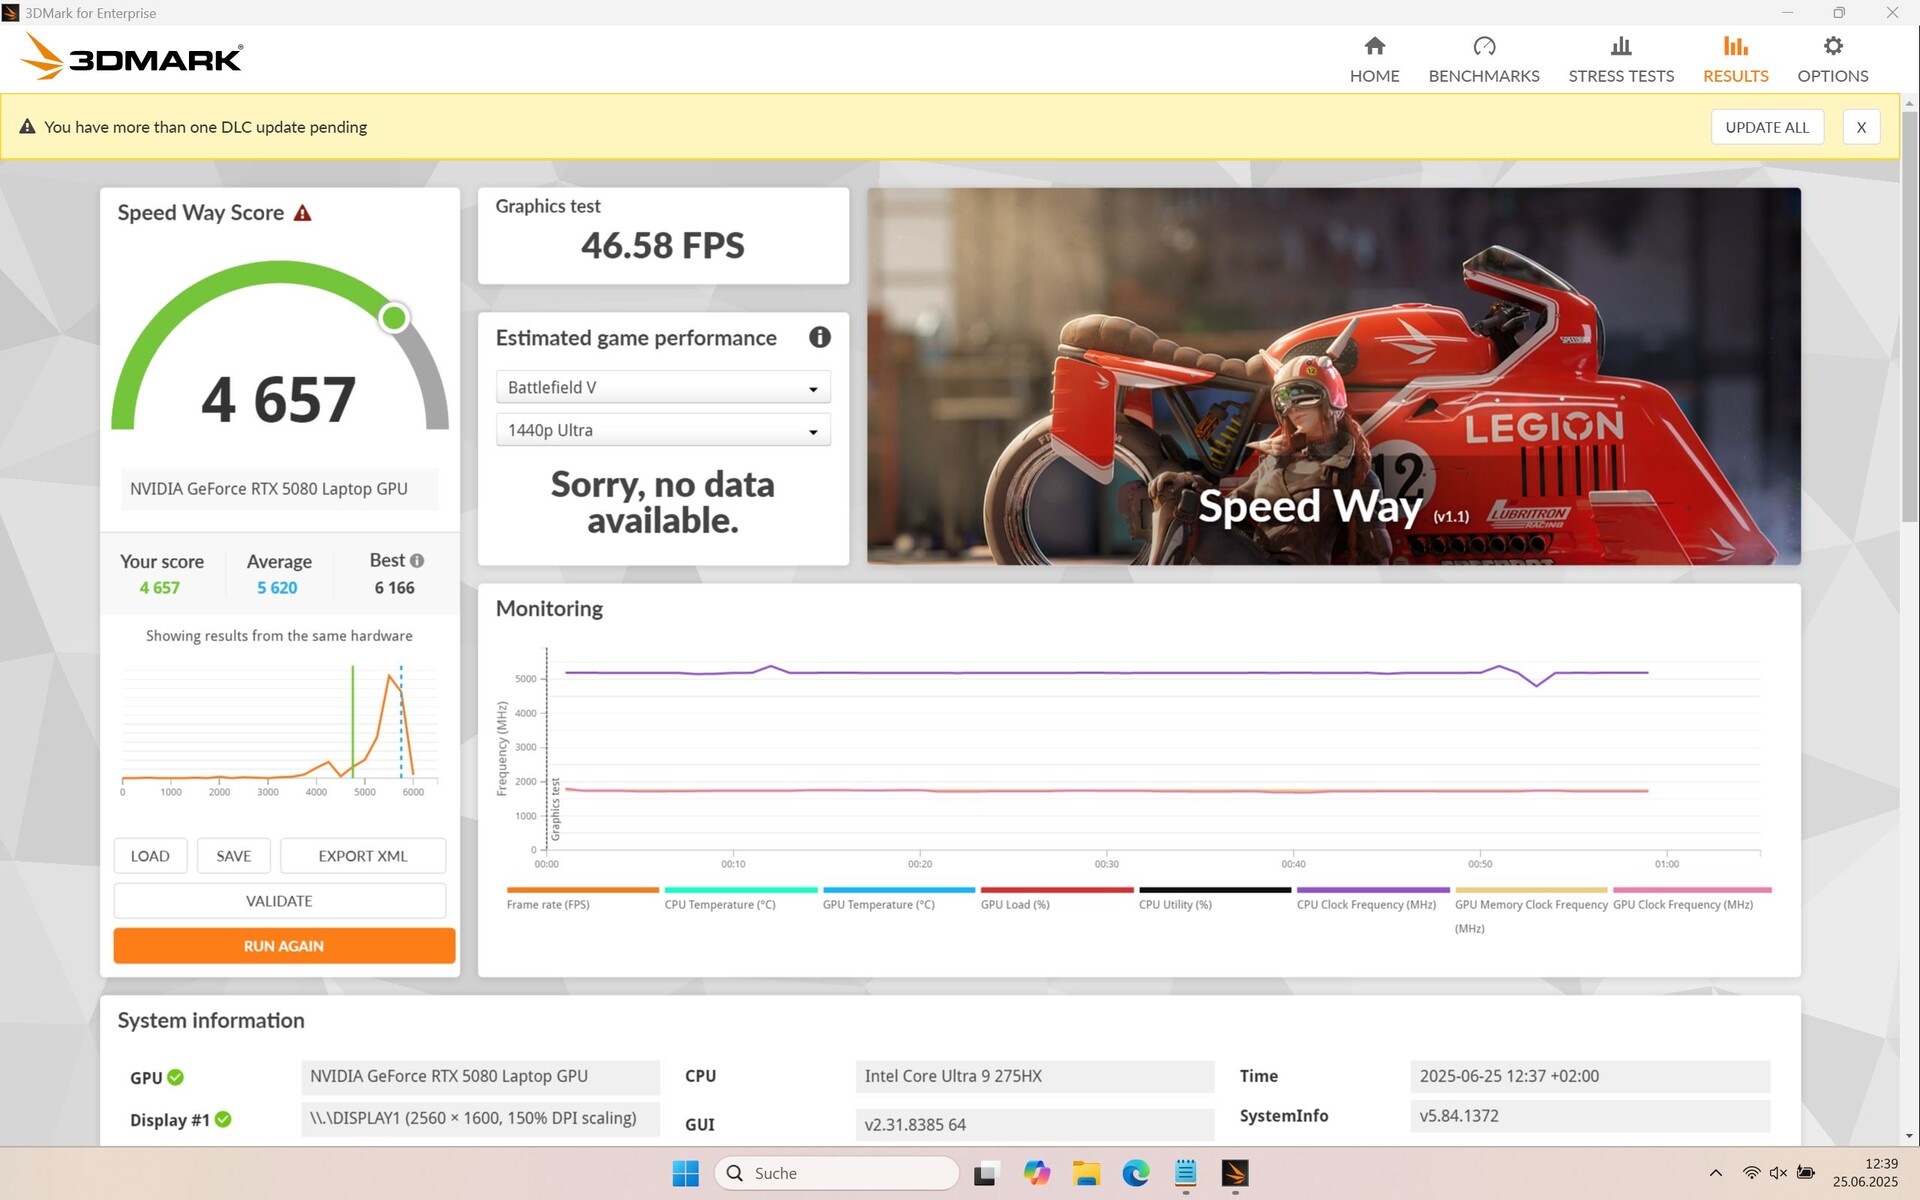
图形处理器性能
笔记本电脑 RTX 5080 笔记本电脑在 3DMarks 中的表现比平均水平低 4%。Fire Strike 测试显示,在电池模式下,3D 性能下降了 50%。
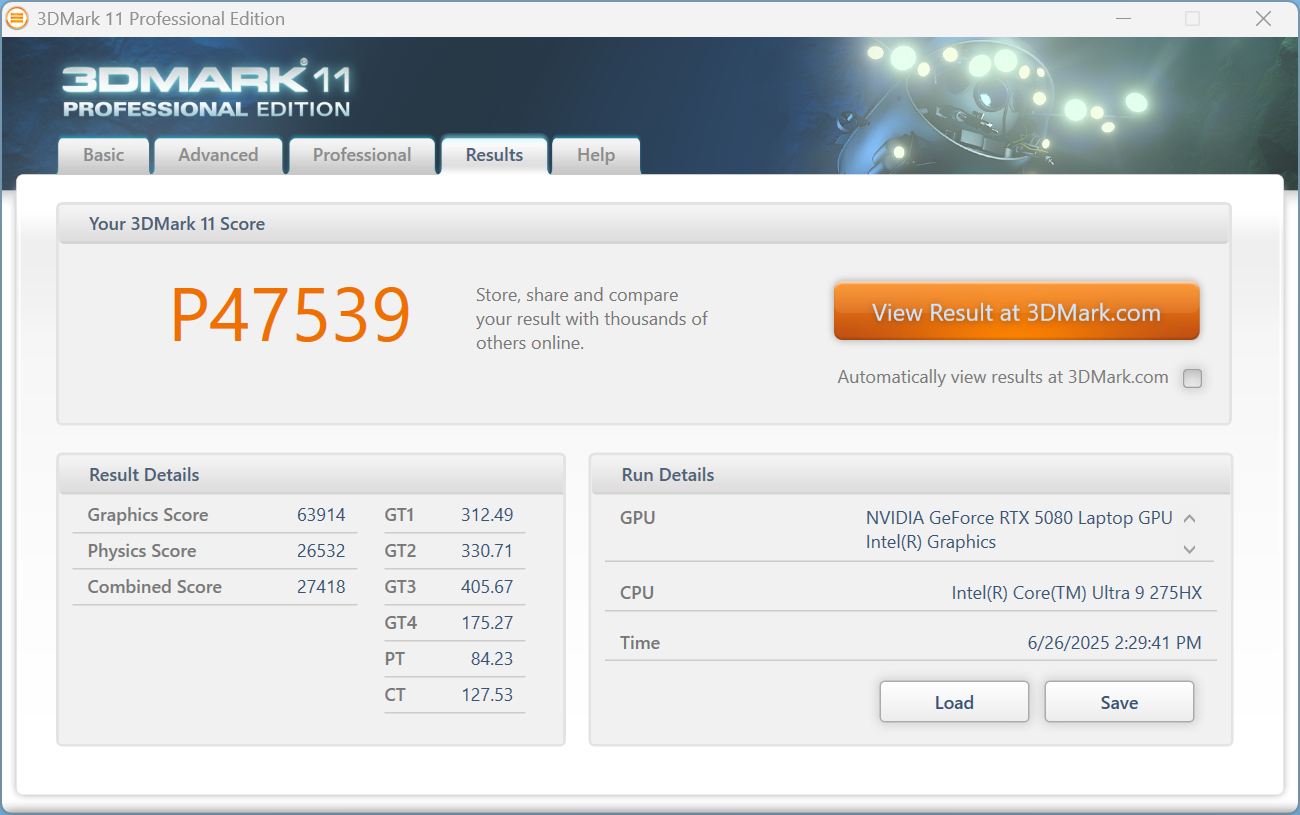
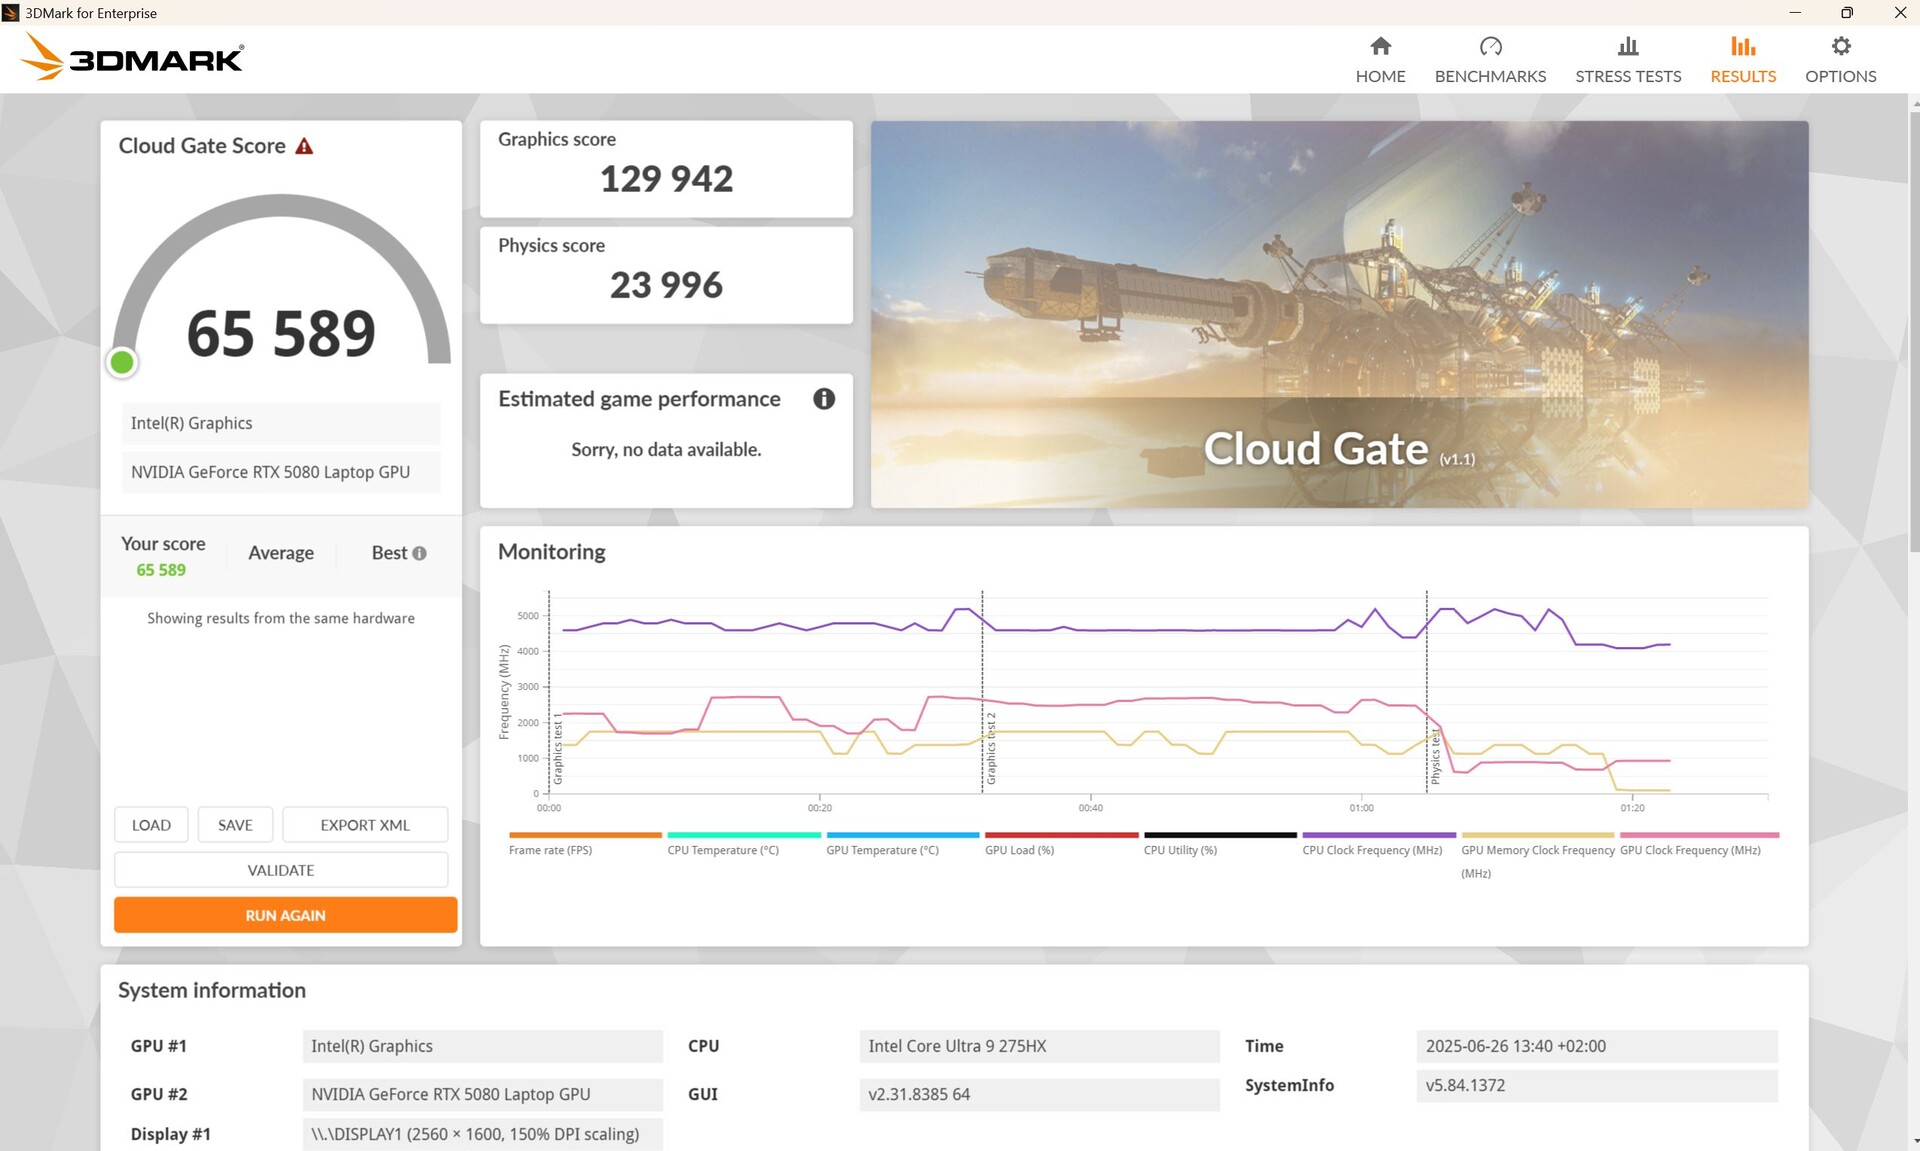
| 3DMark 11 Performance | 47539 points | |
| 3DMark Cloud Gate Standard Score | 65589 points | |
| 3DMark Fire Strike Score | 35915 points | |
| 3DMark Time Spy Score | 18303 points | |
| 3DMark Steel Nomad Score | 4518 points | |
Help | ||
* ... smaller is better
游戏性能
在我们的游戏中,Vector 17 的全高清性能与 Medion Erazer Beast 18 X1因此略低于 RTX 5080 玩家的平均水平。赛博朋克》中的连续性能非常稳定。
主要得益于 DLSS,它在 QHD 中的表现最为自如。例如,Doom: The Dark Ages,使用 DLSS 在 QHD 下的帧率与全高清下大致相同(85 - 88 fps)。结合 4 倍帧生成,我们的 Vector 17 甚至可以达到 214 帧/秒,接近显示器的原始刷新率。我们没有注意到任何延迟的增加,但主观体验可能会有所不同。
| GTA V - 1920x1080 Highest AA:4xMSAA + FX AF:16x | |
| MSI Raider A18 HX A9WIG-080 | |
| MSI Vector 17 HX AI A2XWIG | |
| Lenovo Legion 5 Pro 16IAX10H | |
| MSI Vector 16 HX AI A2XWHG | |
| Medion Erazer Beast 18 X1 MD62731 | |
| Average of class Gaming (48.3 - 186.9, n=93, last 2 years) | |
| Strange Brigade - 1920x1080 ultra AA:ultra AF:16 | |
| Lenovo Legion Pro 7i 16 Gen 10 | |
| Alienware 16 Area-51 | |
| Medion Erazer Beast 18 X1 MD62731 | |
| MSI Vector 17 HX AI A2XWIG | |
| Lenovo Legion 5 Pro 16IAX10H | |
| Average of class Gaming (76.3 - 456, n=86, last 2 years) | |
Cyberpunk 2077 ultra FPS-Diagram
赛博朋克 2077 GPU 数据

| low | med. | high | ultra | QHD DLSS | QHD | 4K DLSS | 4K | |
|---|---|---|---|---|---|---|---|---|
| GTA V (2015) | 186.5 | 184.1 | 181.5 | 158.7 | 151.7 | |||
| Dota 2 Reborn (2015) | 220 | 193.1 | 185.9 | 171.7 | 167.9 | |||
| Final Fantasy XV Benchmark (2018) | 231 | 207 | 183.7 | 111.2 | 68.6 | |||
| X-Plane 11.11 (2018) | 163.7 | 139.5 | 108.8 | 98.7 | ||||
| Strange Brigade (2018) | 549 | 429 | 393 | 356 | 265 | 144 | ||
| Baldur's Gate 3 (2023) | 203 | 160 | 141 | 166.3 | 167.3 | 118.3 | 83.2 | 55.7 |
| Cyberpunk 2077 (2023) | 171.8 | 136.6 | 103.9 | 90 | 39.1 | |||
| Doom: The Dark Ages (2025) | 88 | 85 | 64 |
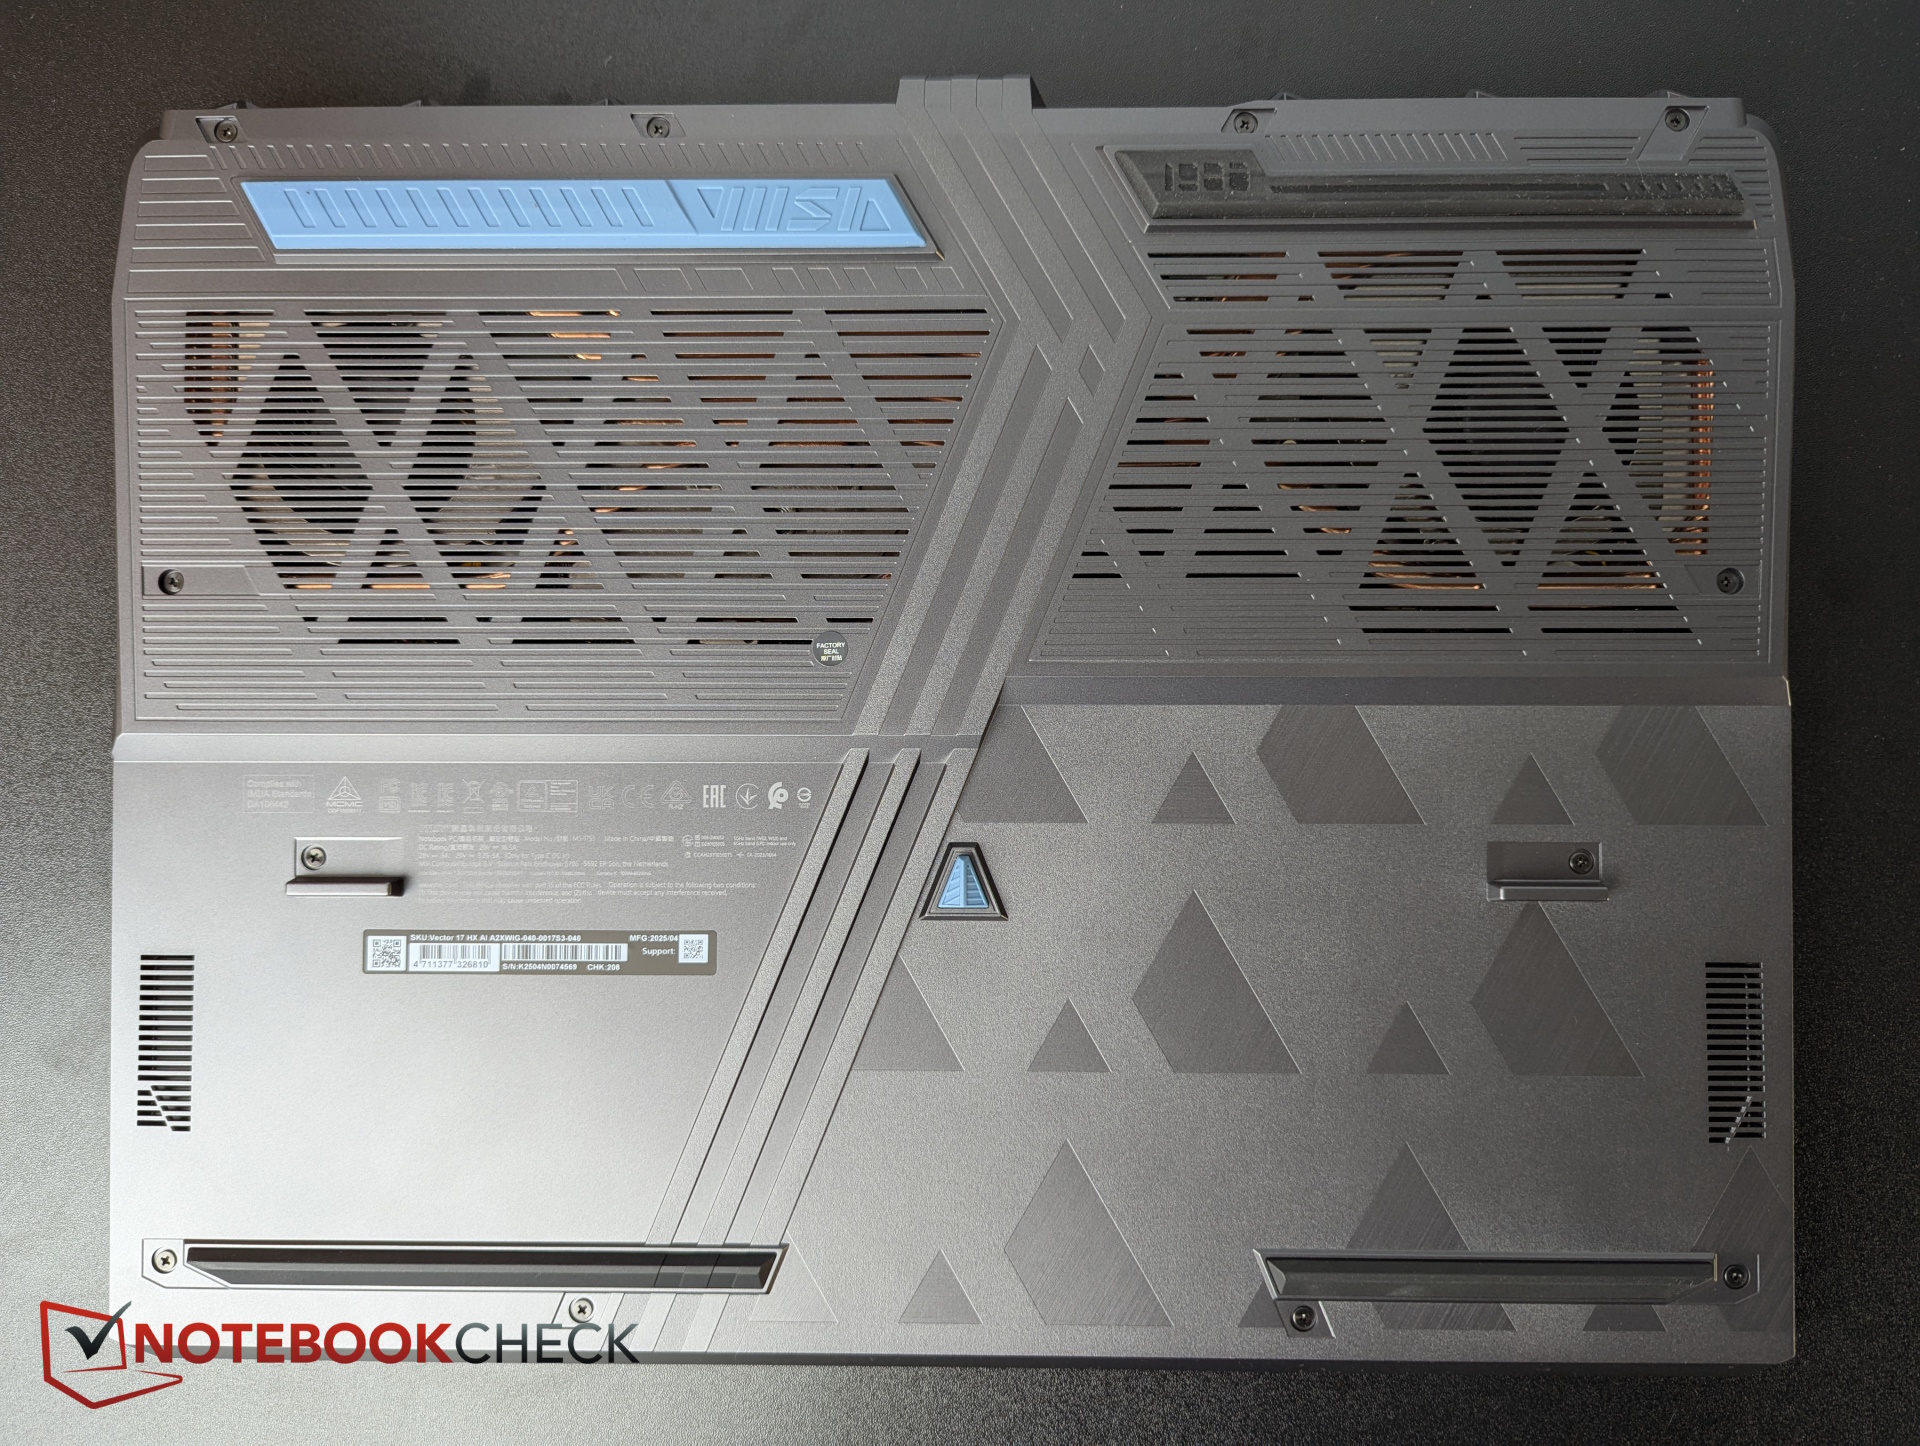
排放与能量 - 高达 60 dB(A)的噪音相比之下相当大
噪音排放
风扇在空转时经常关闭,但在负载后很长一段时间内都不会完全关闭,即使在 Eco 模式下也是如此。在玩游戏时,尽管 3D 性能一般,但风扇的声音往往比同类产品大。
Noise level
| Idle |
| 24 / 30.82 / 31.31 dB(A) |
| Load |
| 31.12 / 59.24 dB(A) |
 | ||
30 dB silent 40 dB(A) audible 50 dB(A) loud |
||
min: | ||
| MSI Vector 17 HX AI A2XWIG GeForce RTX 5080 Laptop, Ultra 9 275HX, Western Digital PC SN5000S SDEPNSJ-2T00-1032 | Alienware 16 Area-51 GeForce RTX 5080 Laptop, Ultra 9 275HX, Samsung PM9C1a MZ9L81T0HDLB | MSI Vector 16 HX AI A2XWHG GeForce RTX 5070 Ti Laptop, Ultra 7 255HX, Micron 2400 MTFDKBA512QFM | Lenovo Legion Pro 7i 16 Gen 10 GeForce RTX 5080 Laptop, Ultra 9 275HX, SK Hynix HFS001TEJ9X115N | Lenovo Legion 5 Pro 16IAX10H GeForce RTX 5070 Ti Laptop, Ultra 9 275HX, Western Digital PC SN8000S SDEPNRK-1T00 | MSI Raider A18 HX A9WIG-080 GeForce RTX 5080 Laptop, R9 9955HX3D, Samsung PM9E1 MZVLC2T0HBLD | Medion Erazer Beast 18 X1 MD62731 GeForce RTX 5080 Laptop, Ultra 9 275HX, Phison E31 2 TB | |
|---|---|---|---|---|---|---|---|
| Noise | 6% | -12% | 12% | -7% | -4% | -17% | |
| off / environment * (dB) | 24 | 23.6 2% | 25 -4% | 22.9 5% | 24 -0% | 25.1 -5% | 25 -4% |
| Idle Minimum * (dB) | 24 | 25.4 -6% | 33 -38% | 22.9 5% | 24 -0% | 28.6 -19% | 25 -4% |
| Idle Average * (dB) | 30.82 | 27.8 10% | 34 -10% | 22.9 26% | 24 22% | 28.9 6% | 39 -27% |
| Idle Maximum * (dB) | 31.31 | 28.1 10% | 38 -21% | 26.3 16% | 30.9 1% | 29.2 7% | 42 -34% |
| Load Average * (dB) | 31.12 | 28.8 7% | 46 -48% | 27.8 11% | 55.9 -80% | 45.6 -47% | 52 -67% |
| Cyberpunk 2077 ultra * (dB) | 59.24 | 50.4 15% | 47 21% | 54.2 9% | 56.72 4% | 55.6 6% | 53 11% |
| Load Maximum * (dB) | 59.24 | 56.4 5% | 49 17% | 53.9 9% | 56.72 4% | 45.8 23% | 55 7% |
* ... smaller is better
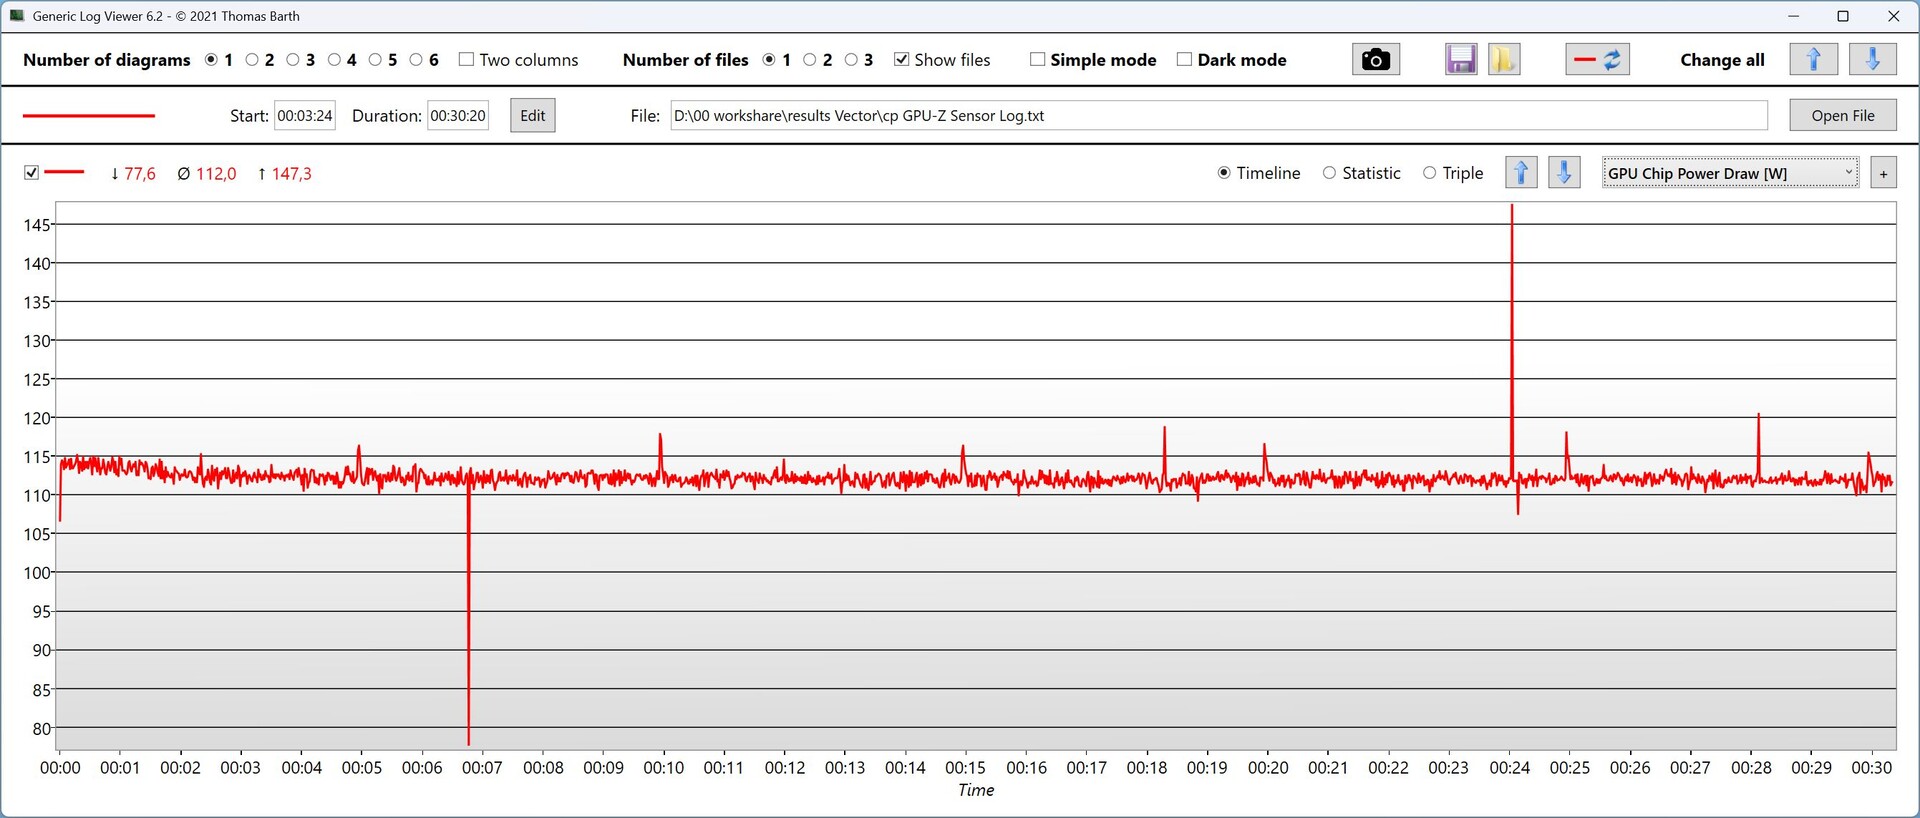
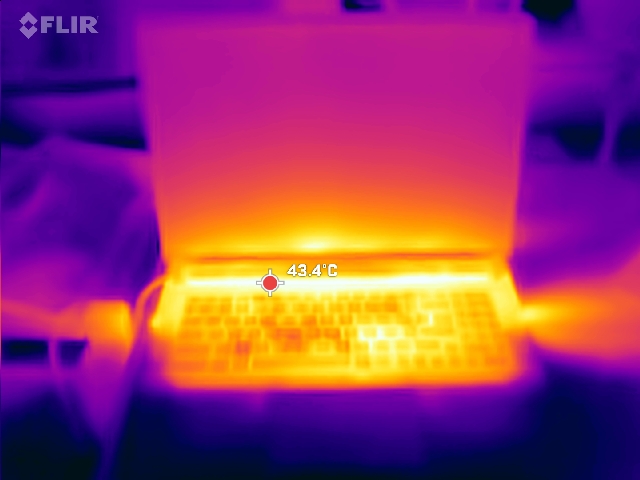
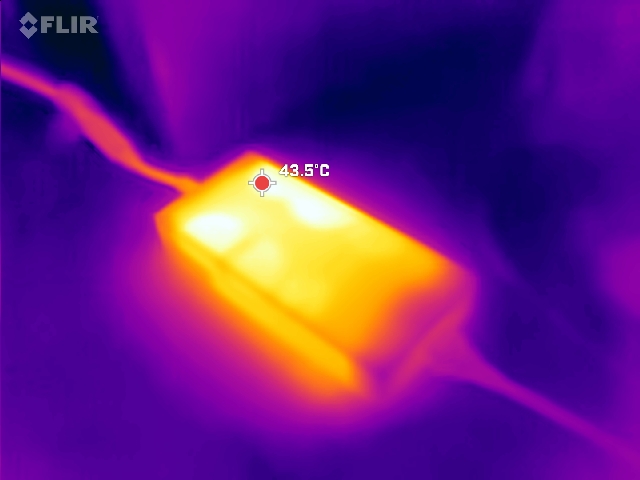
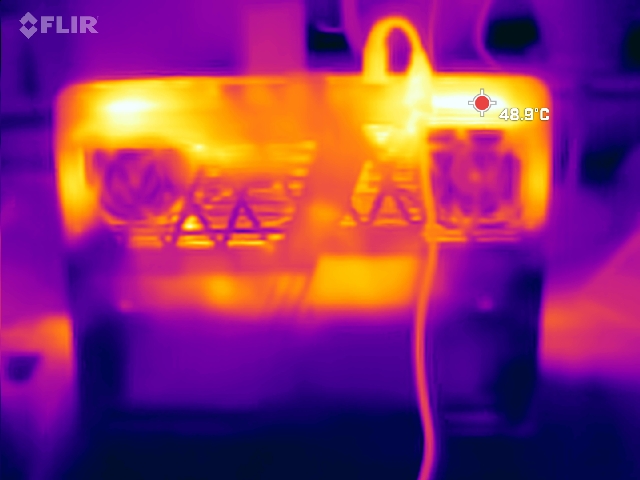
温度
在压力作用下,表面温度高达 53 °C(127.4 °F),而游戏温度为 47 °C(116.6 °F),WASD 关键区域的温度为 38 °C(100.4 °F)。
(-) The maximum temperature on the upper side is 53 °C / 127 F, compared to the average of 40.4 °C / 105 F, ranging from 21.2 to 68.8 °C for the class Gaming.
(-) The bottom heats up to a maximum of 54 °C / 129 F, compared to the average of 43.2 °C / 110 F
(+) In idle usage, the average temperature for the upper side is 31.4 °C / 89 F, compared to the device average of 33.9 °C / 93 F.
(±) 3: The average temperature for the upper side is 36.4 °C / 98 F, compared to the average of 33.9 °C / 93 F for the class Gaming.
(+) The palmrests and touchpad are cooler than skin temperature with a maximum of 29 °C / 84.2 F and are therefore cool to the touch.
(±) The average temperature of the palmrest area of similar devices was 28.8 °C / 83.8 F (-0.2 °C / -0.4 F).
| MSI Vector 17 HX AI A2XWIG Intel Core Ultra 9 275HX, NVIDIA GeForce RTX 5080 Laptop | Alienware 16 Area-51 Intel Core Ultra 9 275HX, NVIDIA GeForce RTX 5080 Laptop | MSI Vector 16 HX AI A2XWHG Intel Core Ultra 7 255HX, NVIDIA GeForce RTX 5070 Ti Laptop | Lenovo Legion Pro 7i 16 Gen 10 Intel Core Ultra 9 275HX, NVIDIA GeForce RTX 5080 Laptop | Lenovo Legion 5 Pro 16IAX10H Intel Core Ultra 9 275HX, NVIDIA GeForce RTX 5070 Ti Laptop | MSI Raider A18 HX A9WIG-080 AMD Ryzen 9 9955HX3D, NVIDIA GeForce RTX 5080 Laptop | Medion Erazer Beast 18 X1 MD62731 Intel Core Ultra 9 275HX, NVIDIA GeForce RTX 5080 Laptop | |
|---|---|---|---|---|---|---|---|
| Heat | 12% | 9% | 16% | -1% | 6% | 13% | |
| Maximum Upper Side * (°C) | 53 | 43.8 17% | 53 -0% | 42.6 20% | 48 9% | 49.3 7% | 47 11% |
| Maximum Bottom * (°C) | 54 | 40 26% | 52 4% | 41.2 24% | 50 7% | 50.9 6% | 48 11% |
| Idle Upper Side * (°C) | 39 | 35.8 8% | 33 15% | 32.6 16% | 38 3% | 35.2 10% | 29 26% |
| Idle Bottom * (°C) | 34 | 35.2 -4% | 29 15% | 32.4 5% | 42 -24% | 33.5 1% | 33 3% |
* ... smaller is better
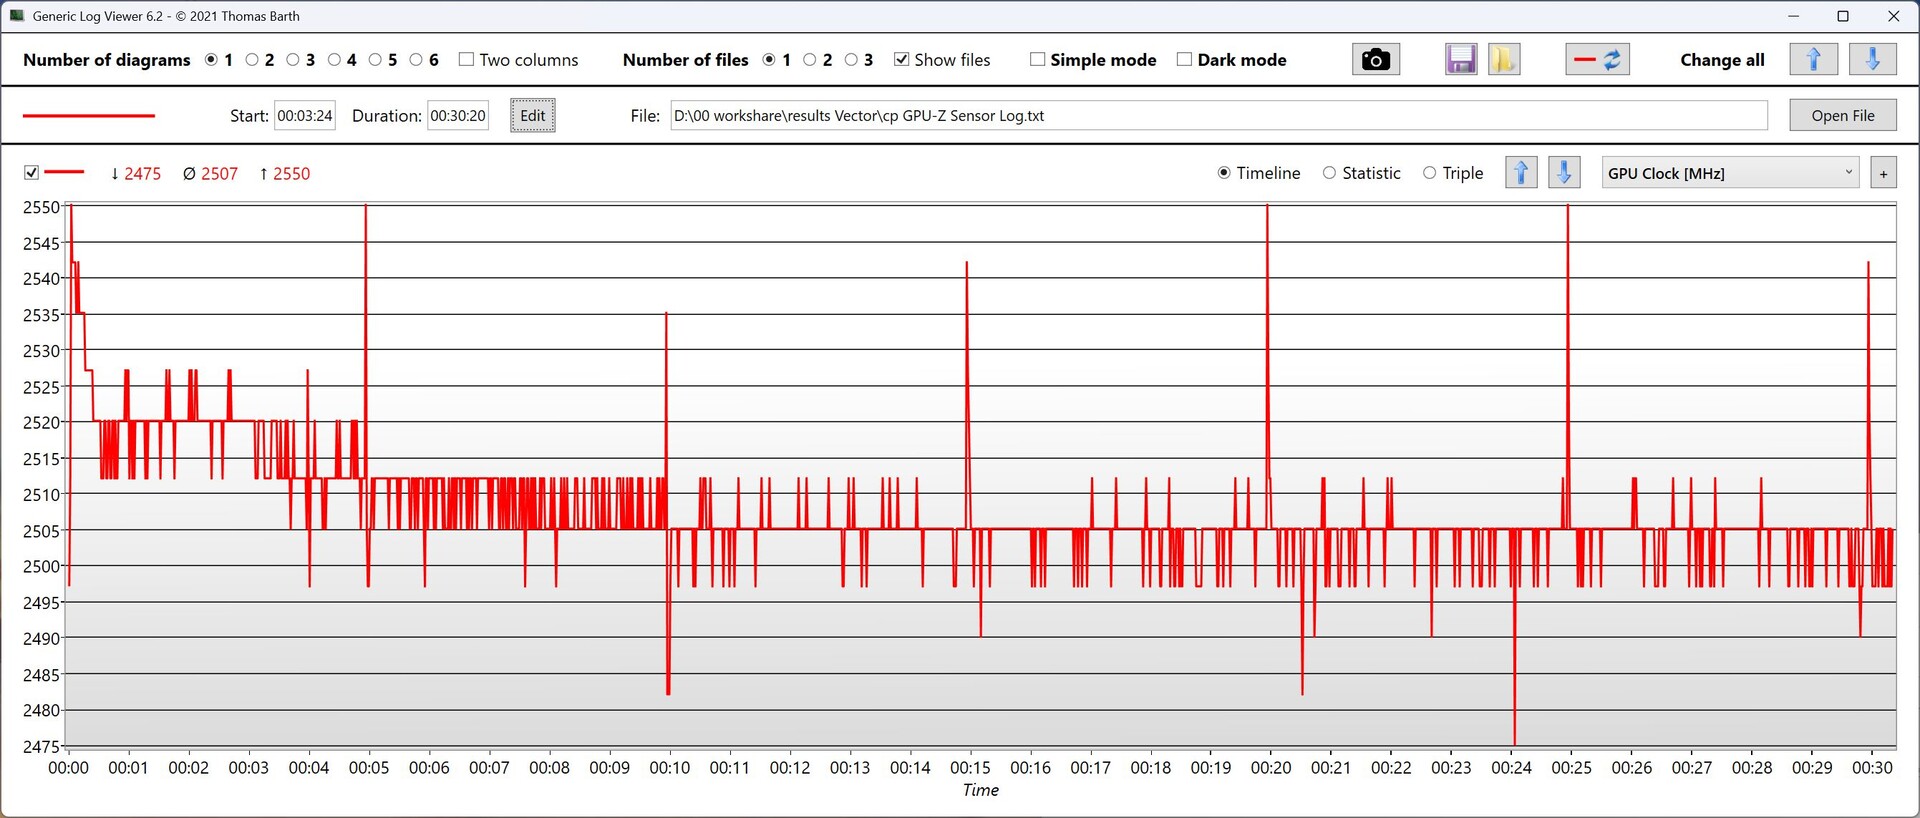
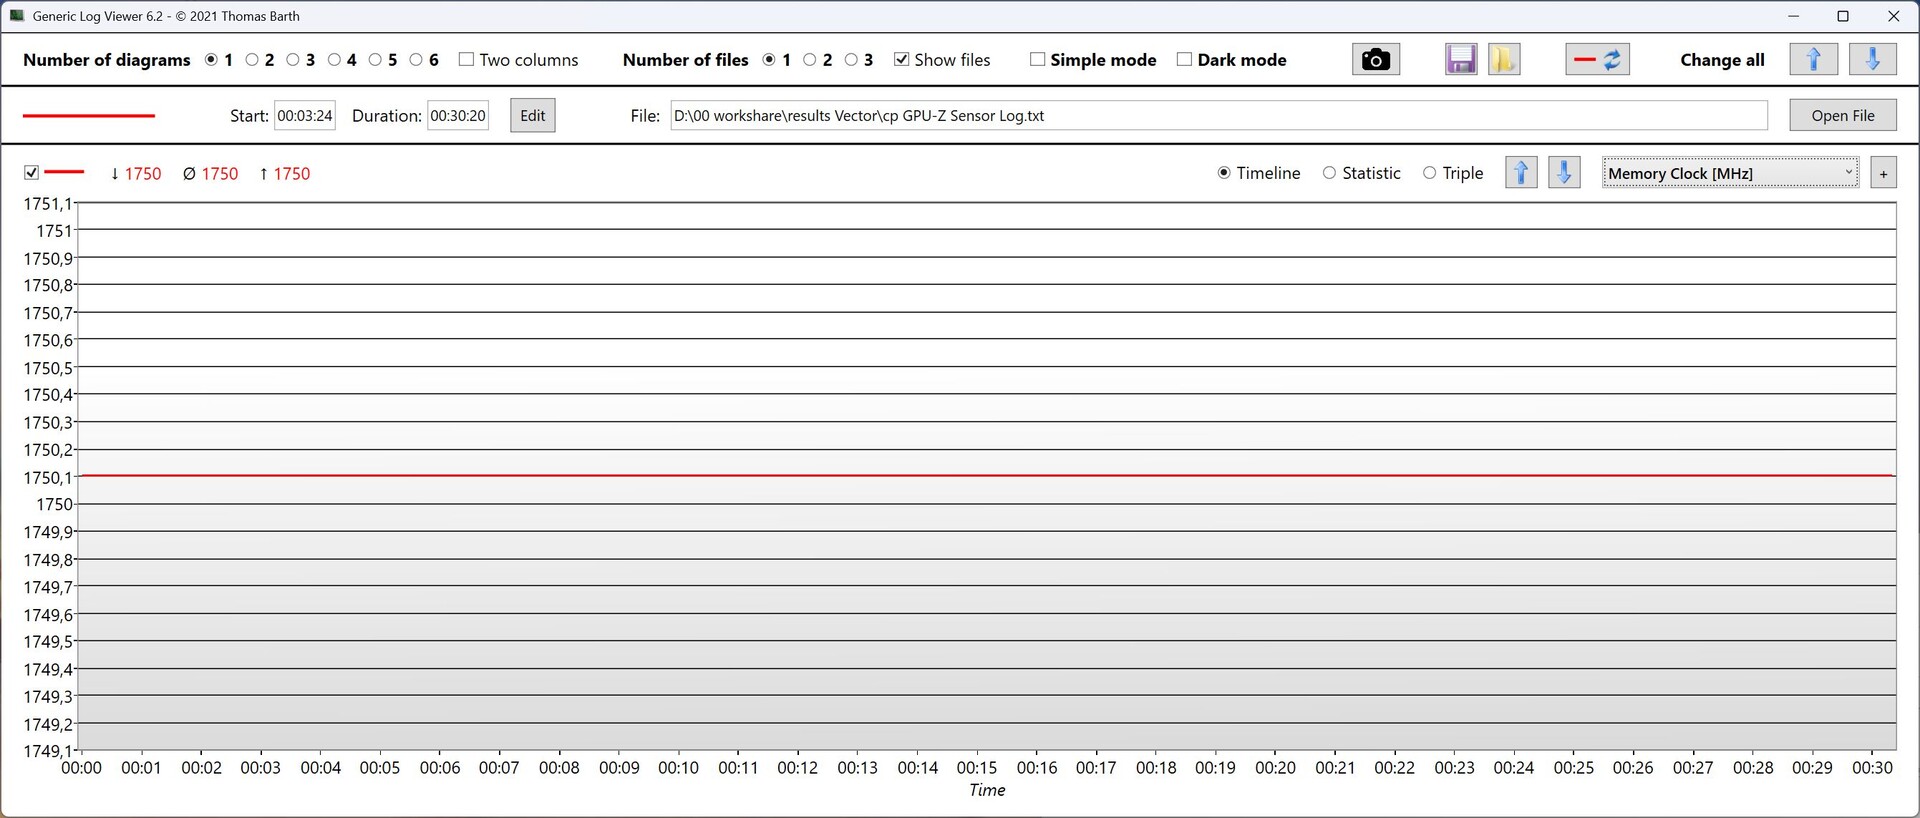
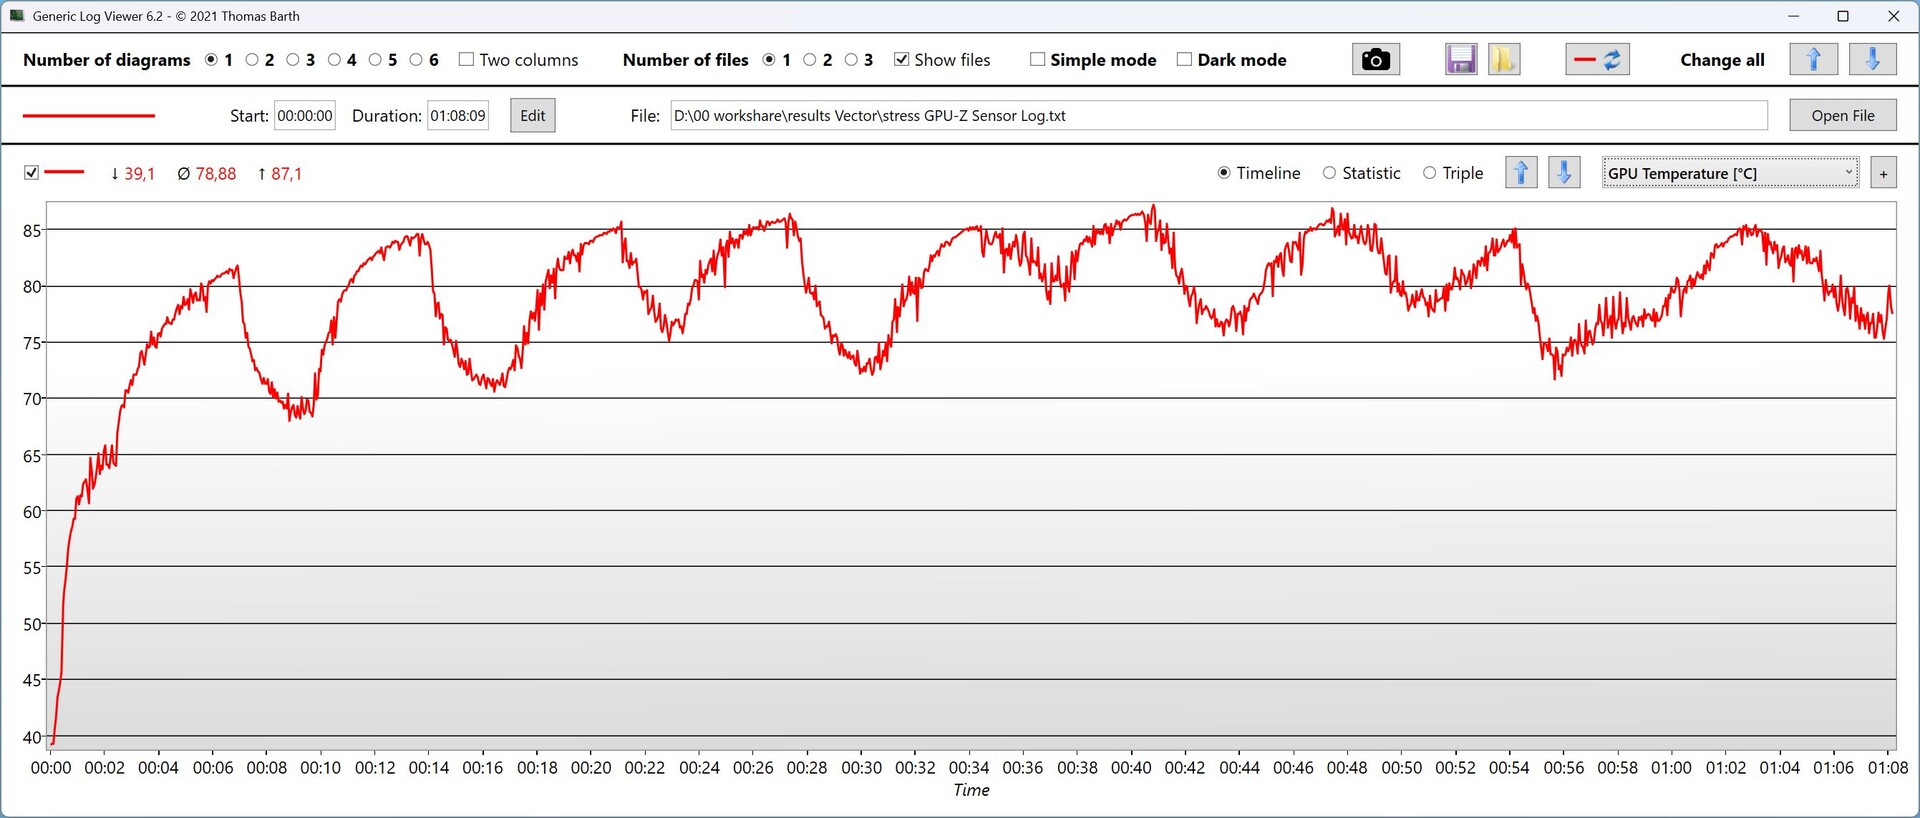
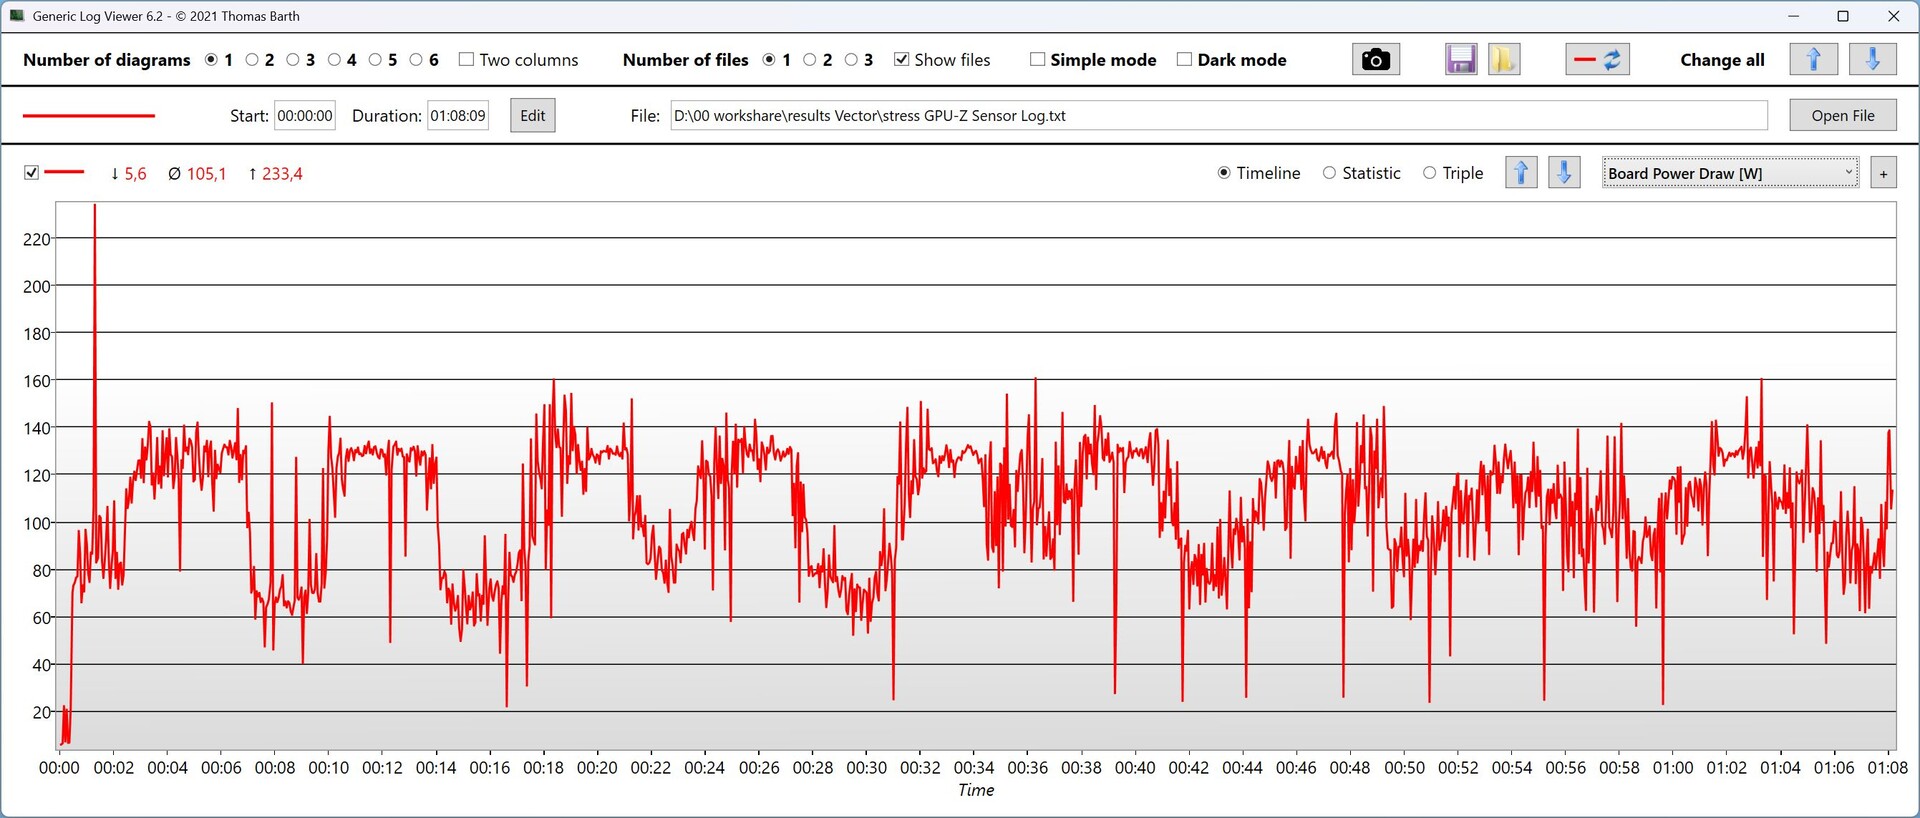
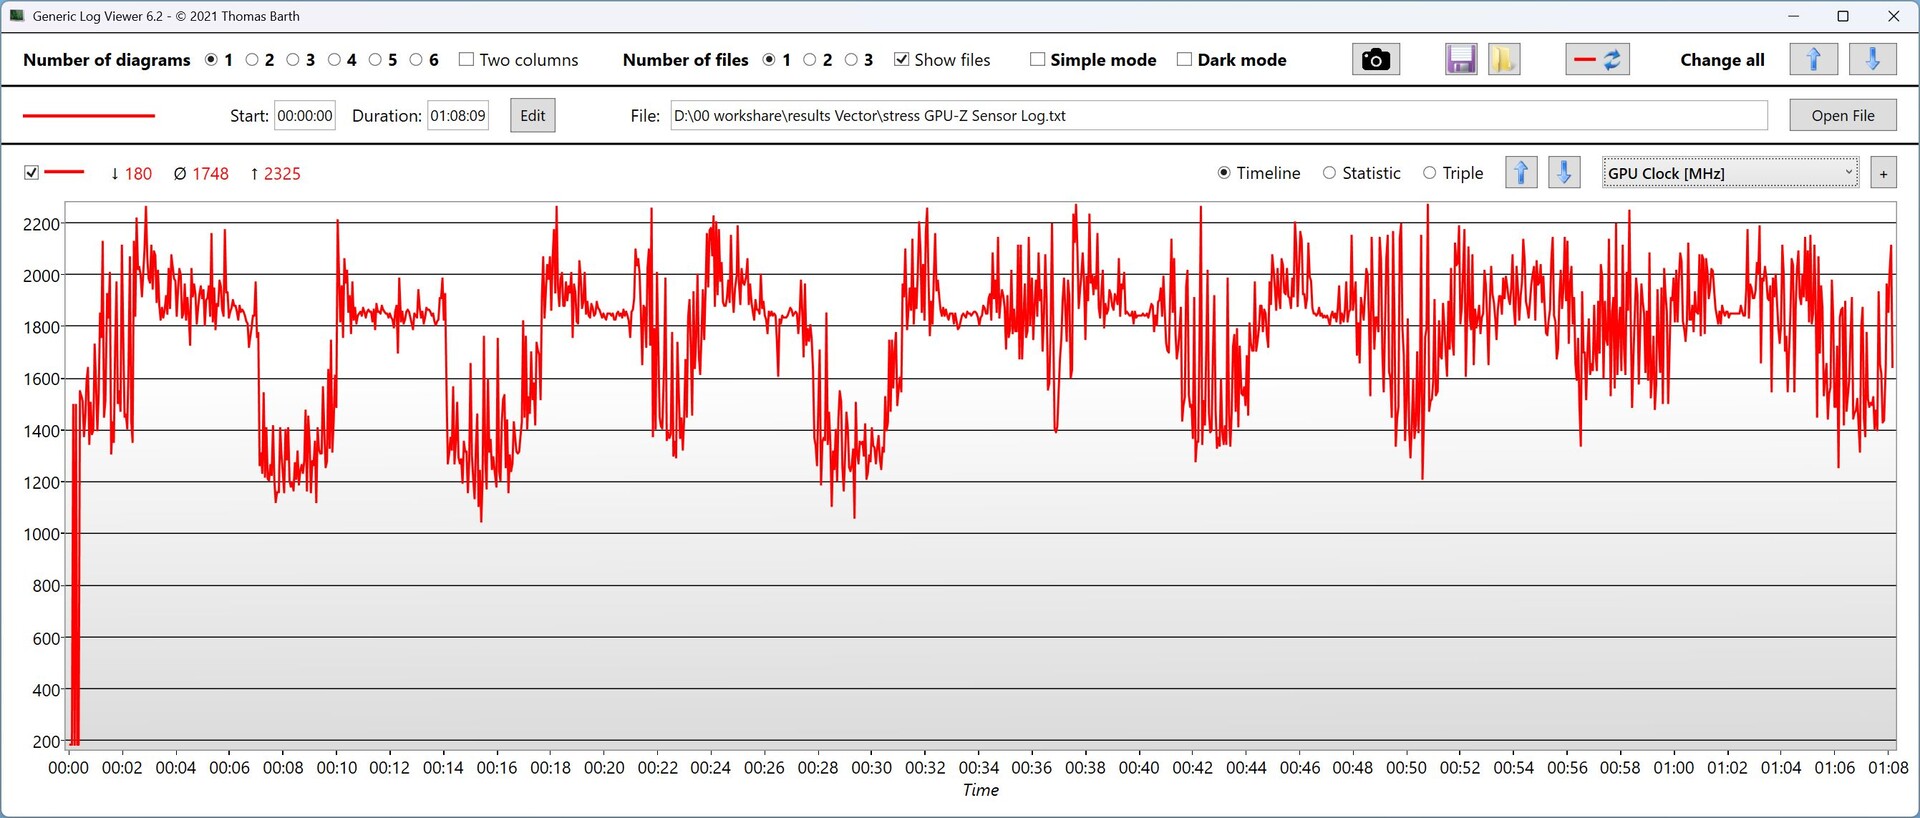
| CPU 时钟 (GHz) | GPU 时钟 (MHz) | CPU 平均温度 (°C) | GPU 平均温度 (°C) | |
| Prime95 压力 | 4.25 | 750 | 80 | 45 |
| Prime95 + FurMark Stress | 3.4 | 1,750 | 74 - 81 | 70 - 87 |
| 赛博朋克 2077》压力 | 1.9 | 2,500 | 81 - 89 | 高达 80 |
压力测试

发言人
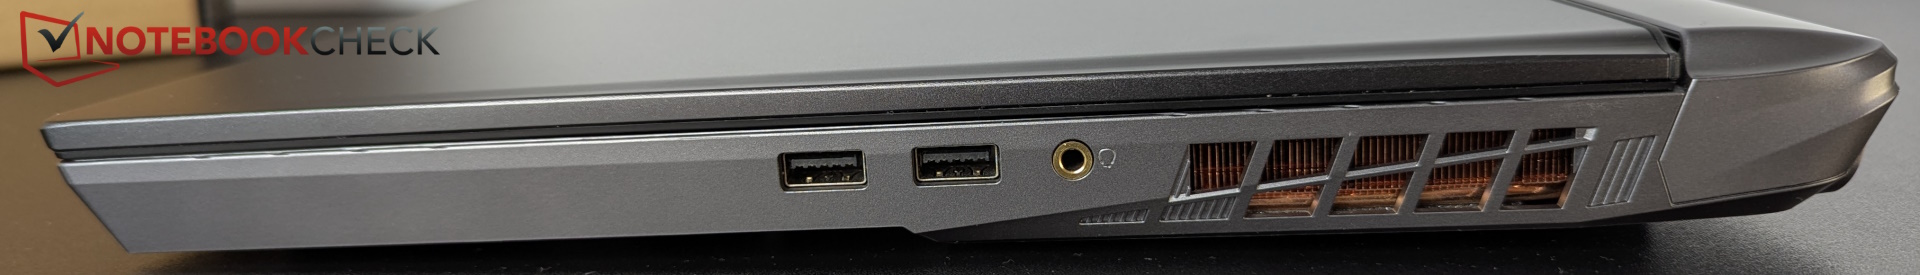
扬声器效果一般。3.5 毫米插孔可用于耳机等设备。
MSI Vector 17 HX AI A2XWIG audio analysis
(±) | speaker loudness is average but good (80.39 dB)
Bass 100 - 315 Hz
(±) | reduced bass - on average 10.4% lower than median
(±) | linearity of bass is average (7.4% delta to prev. frequency)
Mids 400 - 2000 Hz
(±) | higher mids - on average 6.2% higher than median
(+) | mids are linear (4.7% delta to prev. frequency)
Highs 2 - 16 kHz
(+) | balanced highs - only 4.3% away from median
(±) | linearity of highs is average (8.7% delta to prev. frequency)
Overall 100 - 16.000 Hz
(±) | linearity of overall sound is average (15.6% difference to median)
Compared to same class
» 36% of all tested devices in this class were better, 6% similar, 58% worse
» The best had a delta of 6%, average was 18%, worst was 132%
Compared to all devices tested
» 23% of all tested devices were better, 5% similar, 72% worse
» The best had a delta of 4%, average was 23%, worst was 134%
Lenovo Legion 5 Pro 16IAX10H audio analysis
(±) | speaker loudness is average but good (78.2 dB)
Bass 100 - 315 Hz
(-) | nearly no bass - on average 21.1% lower than median
(±) | linearity of bass is average (8% delta to prev. frequency)
Mids 400 - 2000 Hz
(±) | higher mids - on average 6.3% higher than median
(+) | mids are linear (6.5% delta to prev. frequency)
Highs 2 - 16 kHz
(+) | balanced highs - only 1.6% away from median
(+) | highs are linear (4.9% delta to prev. frequency)
Overall 100 - 16.000 Hz
(±) | linearity of overall sound is average (18.3% difference to median)
Compared to same class
» 58% of all tested devices in this class were better, 9% similar, 33% worse
» The best had a delta of 6%, average was 18%, worst was 132%
Compared to all devices tested
» 40% of all tested devices were better, 8% similar, 52% worse
» The best had a delta of 4%, average was 23%, worst was 134%
能源消耗
更新后,空闲时的耗电量现在还可以。但在游戏中,与所提供的性能相比,功耗仍然过高。如果通过 HDMI 连接外接显示器,dGPU 将处于激活状态,在空闲模式下会消耗更多电能。
| Off / Standby | |
| Idle | |
| Load |
|
Key:
min: | |
| MSI Vector 17 HX AI A2XWIG Ultra 9 275HX, GeForce RTX 5080 Laptop, Western Digital PC SN5000S SDEPNSJ-2T00-1032, IPS, 2560x1600, 17" | Alienware 16 Area-51 Ultra 9 275HX, GeForce RTX 5080 Laptop, Samsung PM9C1a MZ9L81T0HDLB, IPS, 2560x1600, 16" | MSI Vector 16 HX AI A2XWHG Ultra 7 255HX, GeForce RTX 5070 Ti Laptop, Micron 2400 MTFDKBA512QFM, IPS, 2560x1600, 16" | Lenovo Legion Pro 7i 16 Gen 10 Ultra 9 275HX, GeForce RTX 5080 Laptop, SK Hynix HFS001TEJ9X115N, OLED, 2560x1600, 16" | Lenovo Legion 5 Pro 16IAX10H Ultra 9 275HX, GeForce RTX 5070 Ti Laptop, Western Digital PC SN8000S SDEPNRK-1T00, OLED, 2560x1600, 16" | MSI Raider A18 HX A9WIG-080 R9 9955HX3D, GeForce RTX 5080 Laptop, Samsung PM9E1 MZVLC2T0HBLD, MiniLED IPS, 3840x2400, 18" | Medion Erazer Beast 18 X1 MD62731 Ultra 9 275HX, GeForce RTX 5080 Laptop, Phison E31 2 TB, IPS, 2560x1600, 18" | Average NVIDIA GeForce RTX 5080 Laptop | Average of class Gaming | |
|---|---|---|---|---|---|---|---|---|---|
| Power Consumption | -61% | -3% | -80% | -14% | -119% | 6% | -52% | -17% | |
| Idle Minimum * (Watt) | 10 | 27 -170% | 7.1 29% | 28.5 -185% | 14 -40% | 41.5 -315% | 7.9 21% | 19.1 ? -91% | 13 ? -30% |
| Idle Average * (Watt) | 15.4 | 33.5 -118% | 15.9 -3% | 38.8 -152% | 14.3 7% | 53.5 -247% | 11.5 25% | 25.3 ? -64% | 18.7 ? -21% |
| Idle Maximum * (Watt) | 18.7 | 41.4 -121% | 29.5 -58% | 45.6 -144% | 20.1 -7% | 53.8 -188% | 16.6 11% | 30.4 ? -63% | 24.3 ? -30% |
| Load Average * (Watt) | 89.7 | 124.7 -39% | 124 -38% | 132.2 -47% | 177 -97% | 168.5 -88% | 130 -45% | 128.5 ? -43% | 110.2 ? -23% |
| Cyberpunk 2077 ultra * (Watt) | 308 | 256 17% | 222 28% | 318 -3% | 255 17% | 298 3% | 253 18% | ||
| Cyberpunk 2077 ultra external monitor * (Watt) | 300 | 249 17% | 217 28% | 319 -6% | 255 15% | 295 2% | 245 18% | ||
| Load Maximum * (Watt) | 321 | 367.2 -14% | 336 -5% | 384 -20% | 294 8% | 323.7 -1% | 330 -3% | 314 ? 2% | 258 ? 20% |
* ... smaller is better
Energy consumption Cyberpunk / Stress test
Energy consumption with external Monitor
电池寿命
在我们的 Wi-Fi 测试中,Vector 17 配备了 90 Wh 的电池,在降低亮度(Eco 模式)的情况下可使用约 6.75 小时。相比之下,这是一个不错的值。
| MSI Vector 17 HX AI A2XWIG Ultra 9 275HX, GeForce RTX 5080 Laptop, 90 Wh | Alienware 16 Area-51 Ultra 9 275HX, GeForce RTX 5080 Laptop, 96 Wh | MSI Vector 16 HX AI A2XWHG Ultra 7 255HX, GeForce RTX 5070 Ti Laptop, 90 Wh | Lenovo Legion Pro 7i 16 Gen 10 Ultra 9 275HX, GeForce RTX 5080 Laptop, 99 Wh | Lenovo Legion 5 Pro 16IAX10H Ultra 9 275HX, GeForce RTX 5070 Ti Laptop, 80 Wh | MSI Raider A18 HX A9WIG-080 R9 9955HX3D, GeForce RTX 5080 Laptop, 99 Wh | Medion Erazer Beast 18 X1 MD62731 Ultra 9 275HX, GeForce RTX 5080 Laptop, 99 Wh | Average of class Gaming | |
|---|---|---|---|---|---|---|---|---|
| Battery runtime | -58% | 4% | -39% | -19% | -56% | 18% | -7% | |
| WiFi v1.3 (h) | 6.7 | 2.8 -58% | 7 4% | 5.4 -19% | 4.9 -27% | 2.1 -69% | 7.9 18% | 7.15 ? 7% |
| Load (h) | 1.9 | 0.8 -58% | 1.7 -11% | 1.1 -42% | 1.502 ? -21% | |||
| Reader / Idle (h) | 3.1 | 8.71 ? | ||||||
| H.264 (h) | 4.8 | 8.64 ? |
Notebookcheck 总体评分
微星 Vector 17 HX AI 是一款普通的游戏笔记本电脑,由于配备了双通道雷电 5 和 Wi-Fi 7,它的性能得到了一些加分。
MSI Vector 17 HX AI A2XWIG
- 07/16/2025 v8
Christian Hintze
 Total Sustainability Score:
 对可能的替代品进行比较
Transparency
The selection of devices to be reviewed is made by our editorial team. The test sample was provided to the author as a loan by the manufacturer or retailer for the purpose of this review. The lender had no influence on this review, nor did the manufacturer receive a copy of this review before publication. There was no obligation to publish this review. As an independent media company, Notebookcheck is not subjected to the authority of manufacturers, retailers or publishers.
This is how Notebookcheck is testing
Every year, Notebookcheck independently reviews hundreds of laptops and smartphones using standardized procedures to ensure that all results are comparable. We have continuously developed our test methods for around 20 years and set industry standards in the process. In our test labs, high-quality measuring equipment is utilized by experienced technicians and editors. These tests involve a multi-stage validation process. Our complex rating system is based on hundreds of well-founded measurements and benchmarks, which maintains objectivity. Further information on our test methods can be found here.
