结论极致性能,但微星 Raider A18 HX 的移动性为零
如果您正在寻找目前最强大的笔记本电脑之一,微星 Raider A18 HX 肯定是您的首选。AMD Ryzen 9 9955HX3D 是 2025 年 AMD 移动处理器的旗舰产品,目前市场上没有多少笔记本电脑能超越这款游戏巨头。这同样适用于 dGPU - 虽然它 "只 "内置了 NvidiaGeForce RTX 5080 而不是 RTX 5090,但用户同样可以期待旗舰级 GPU 的性能。
他们不能期望什么?良好的电池续航能力或安静的笔记本电脑。如果你追求这些品质,微星 Raider A18 并不适合你。扬声器系统也令我们失望,虽然声音很大,但没有低音。从好的方面看,微星笔记本电脑提供了 SD 读卡器或 2.5Gbit 以太网等功能,这使它不仅是一款出色的游戏笔记本电脑,也有可能成为一款强大的移动工作站。
Pros
Cons
Table of Contents
AMD 的移动产品中最受关注的无疑是 Strix Point,以及功能更强大、更注重 GPU 的 Strix Halo 变体。但 Strix Halo 并不是 AMD 笔记本电脑中最强大的产品,AMD Fire Range 才是最强大的产品,它基本上是 AMD 笔记本电脑中的台式机芯片。通过这次评测,我们测试了一款巨大的笔记本电脑,其散热性能足以满足这些巨型处理器的需求:微星 Raider A18 HX A9WIG-080 配备了 18 英寸 miniLED 显示屏和 NvidiaGeForce RTX 5080。
规格AMD Fire 系列结合 RTX 5080
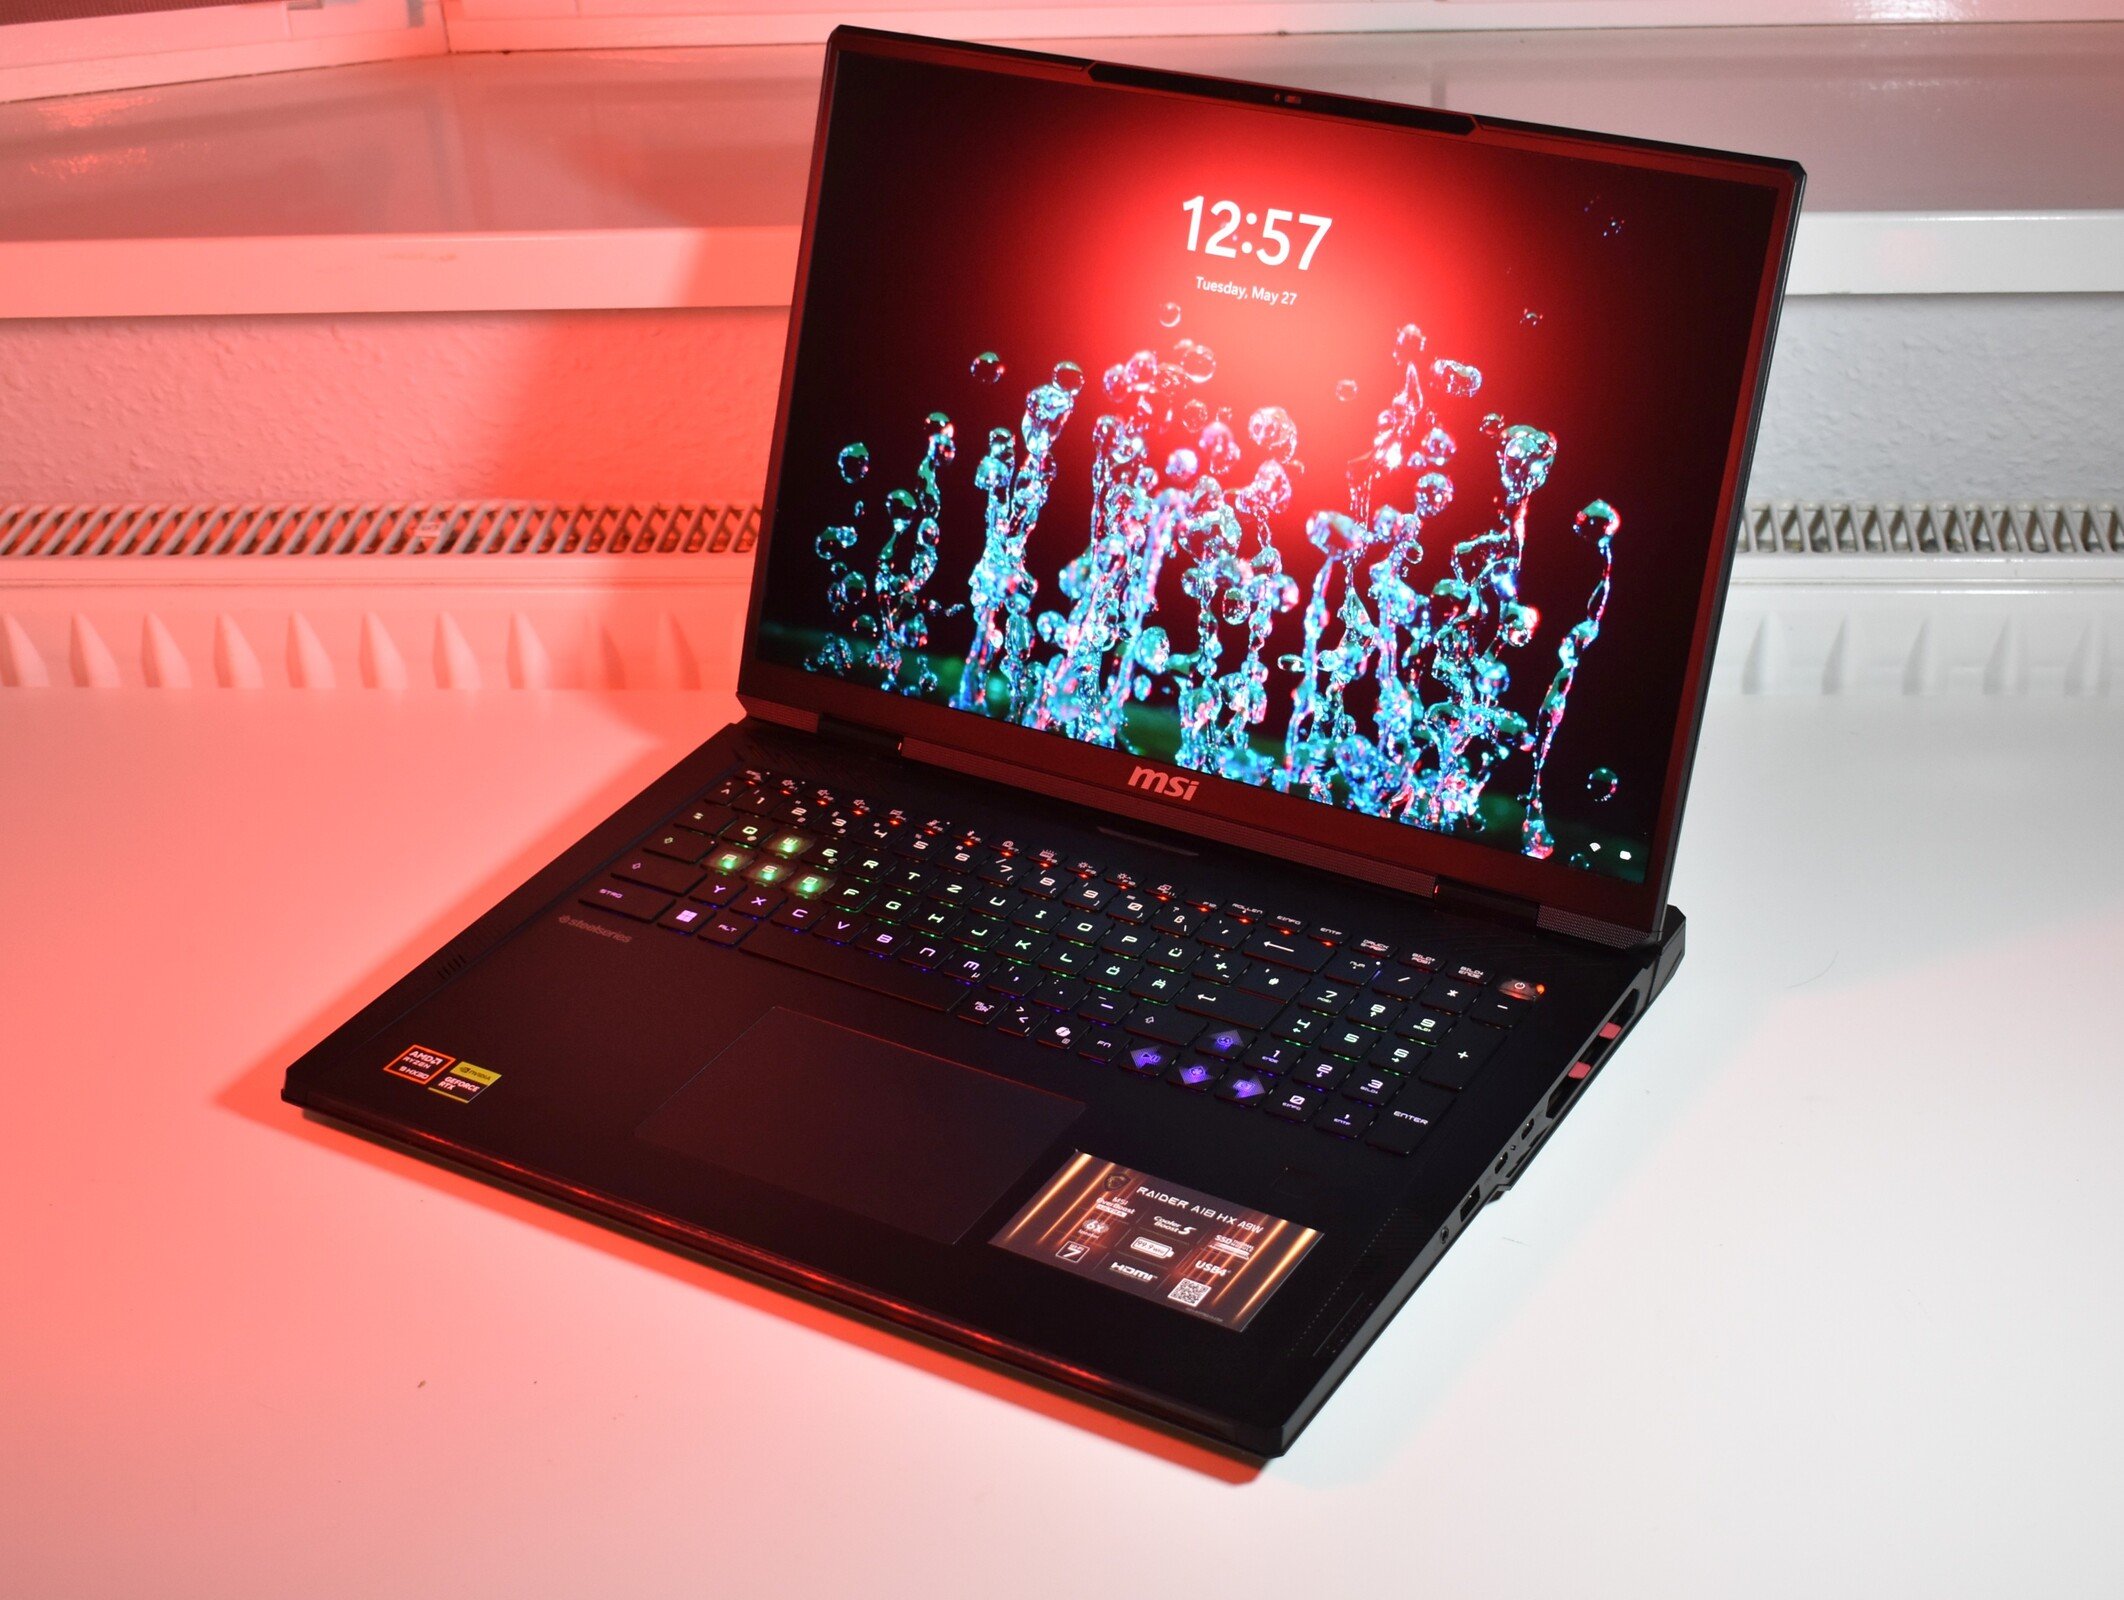
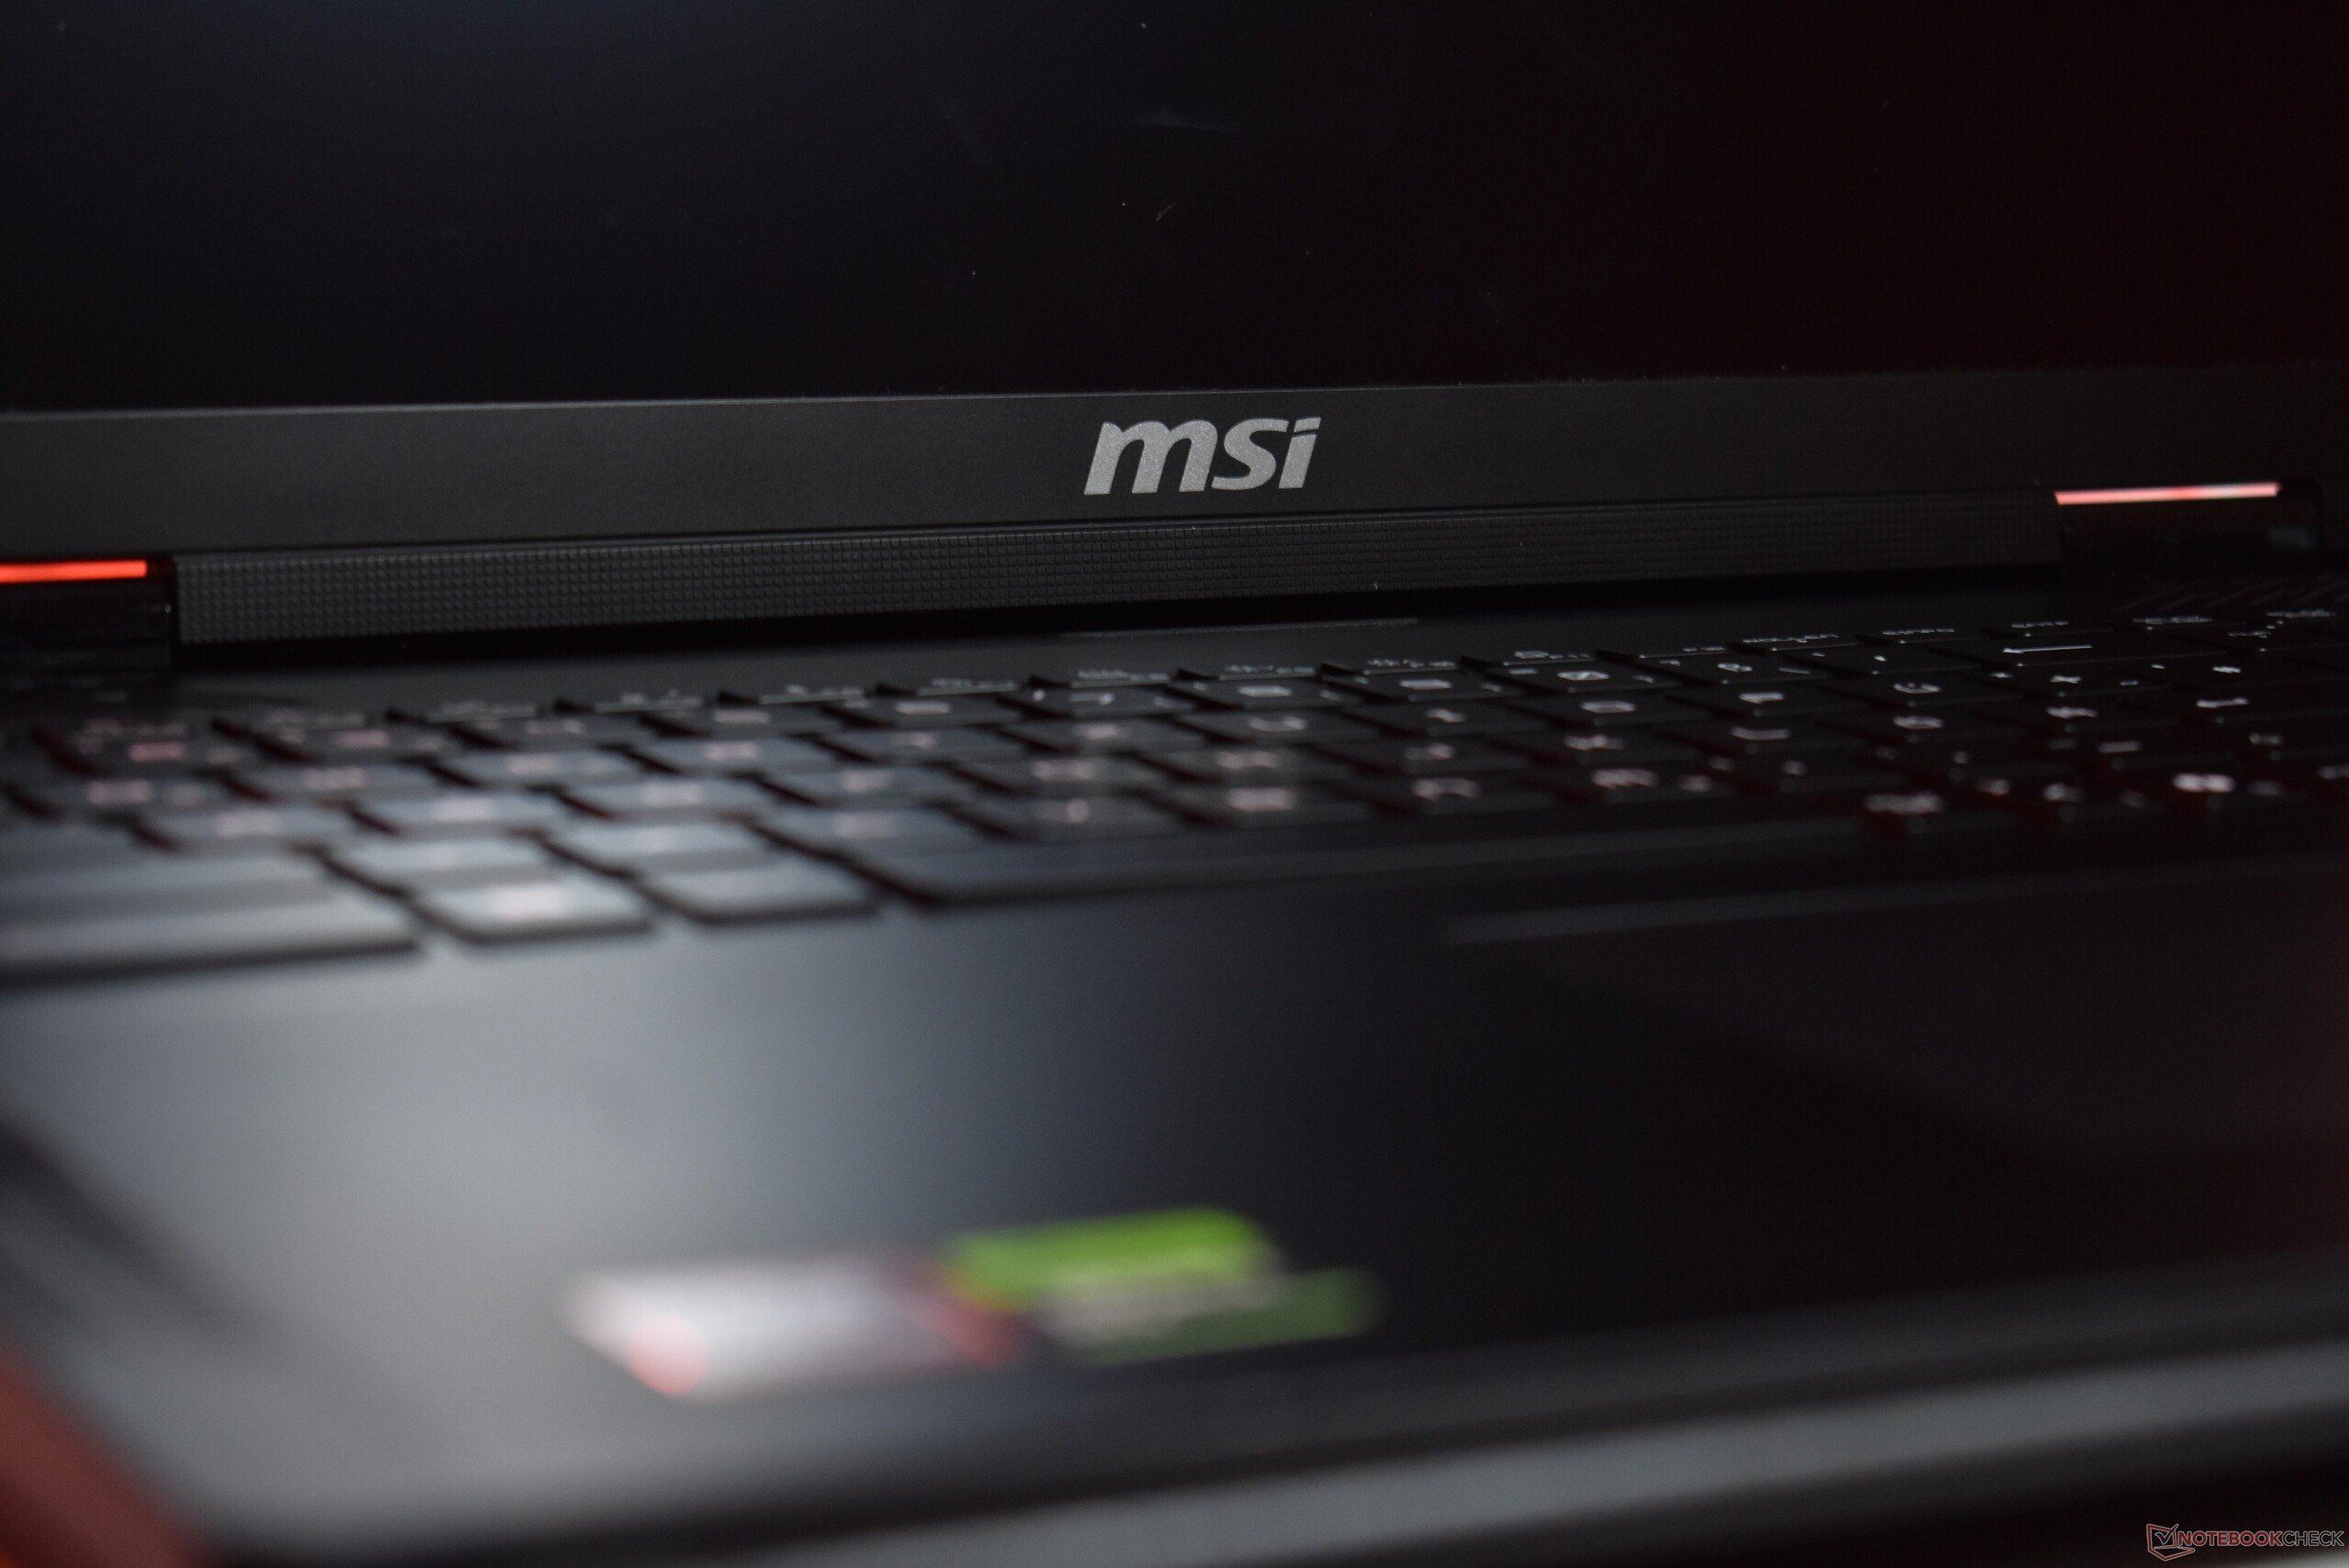
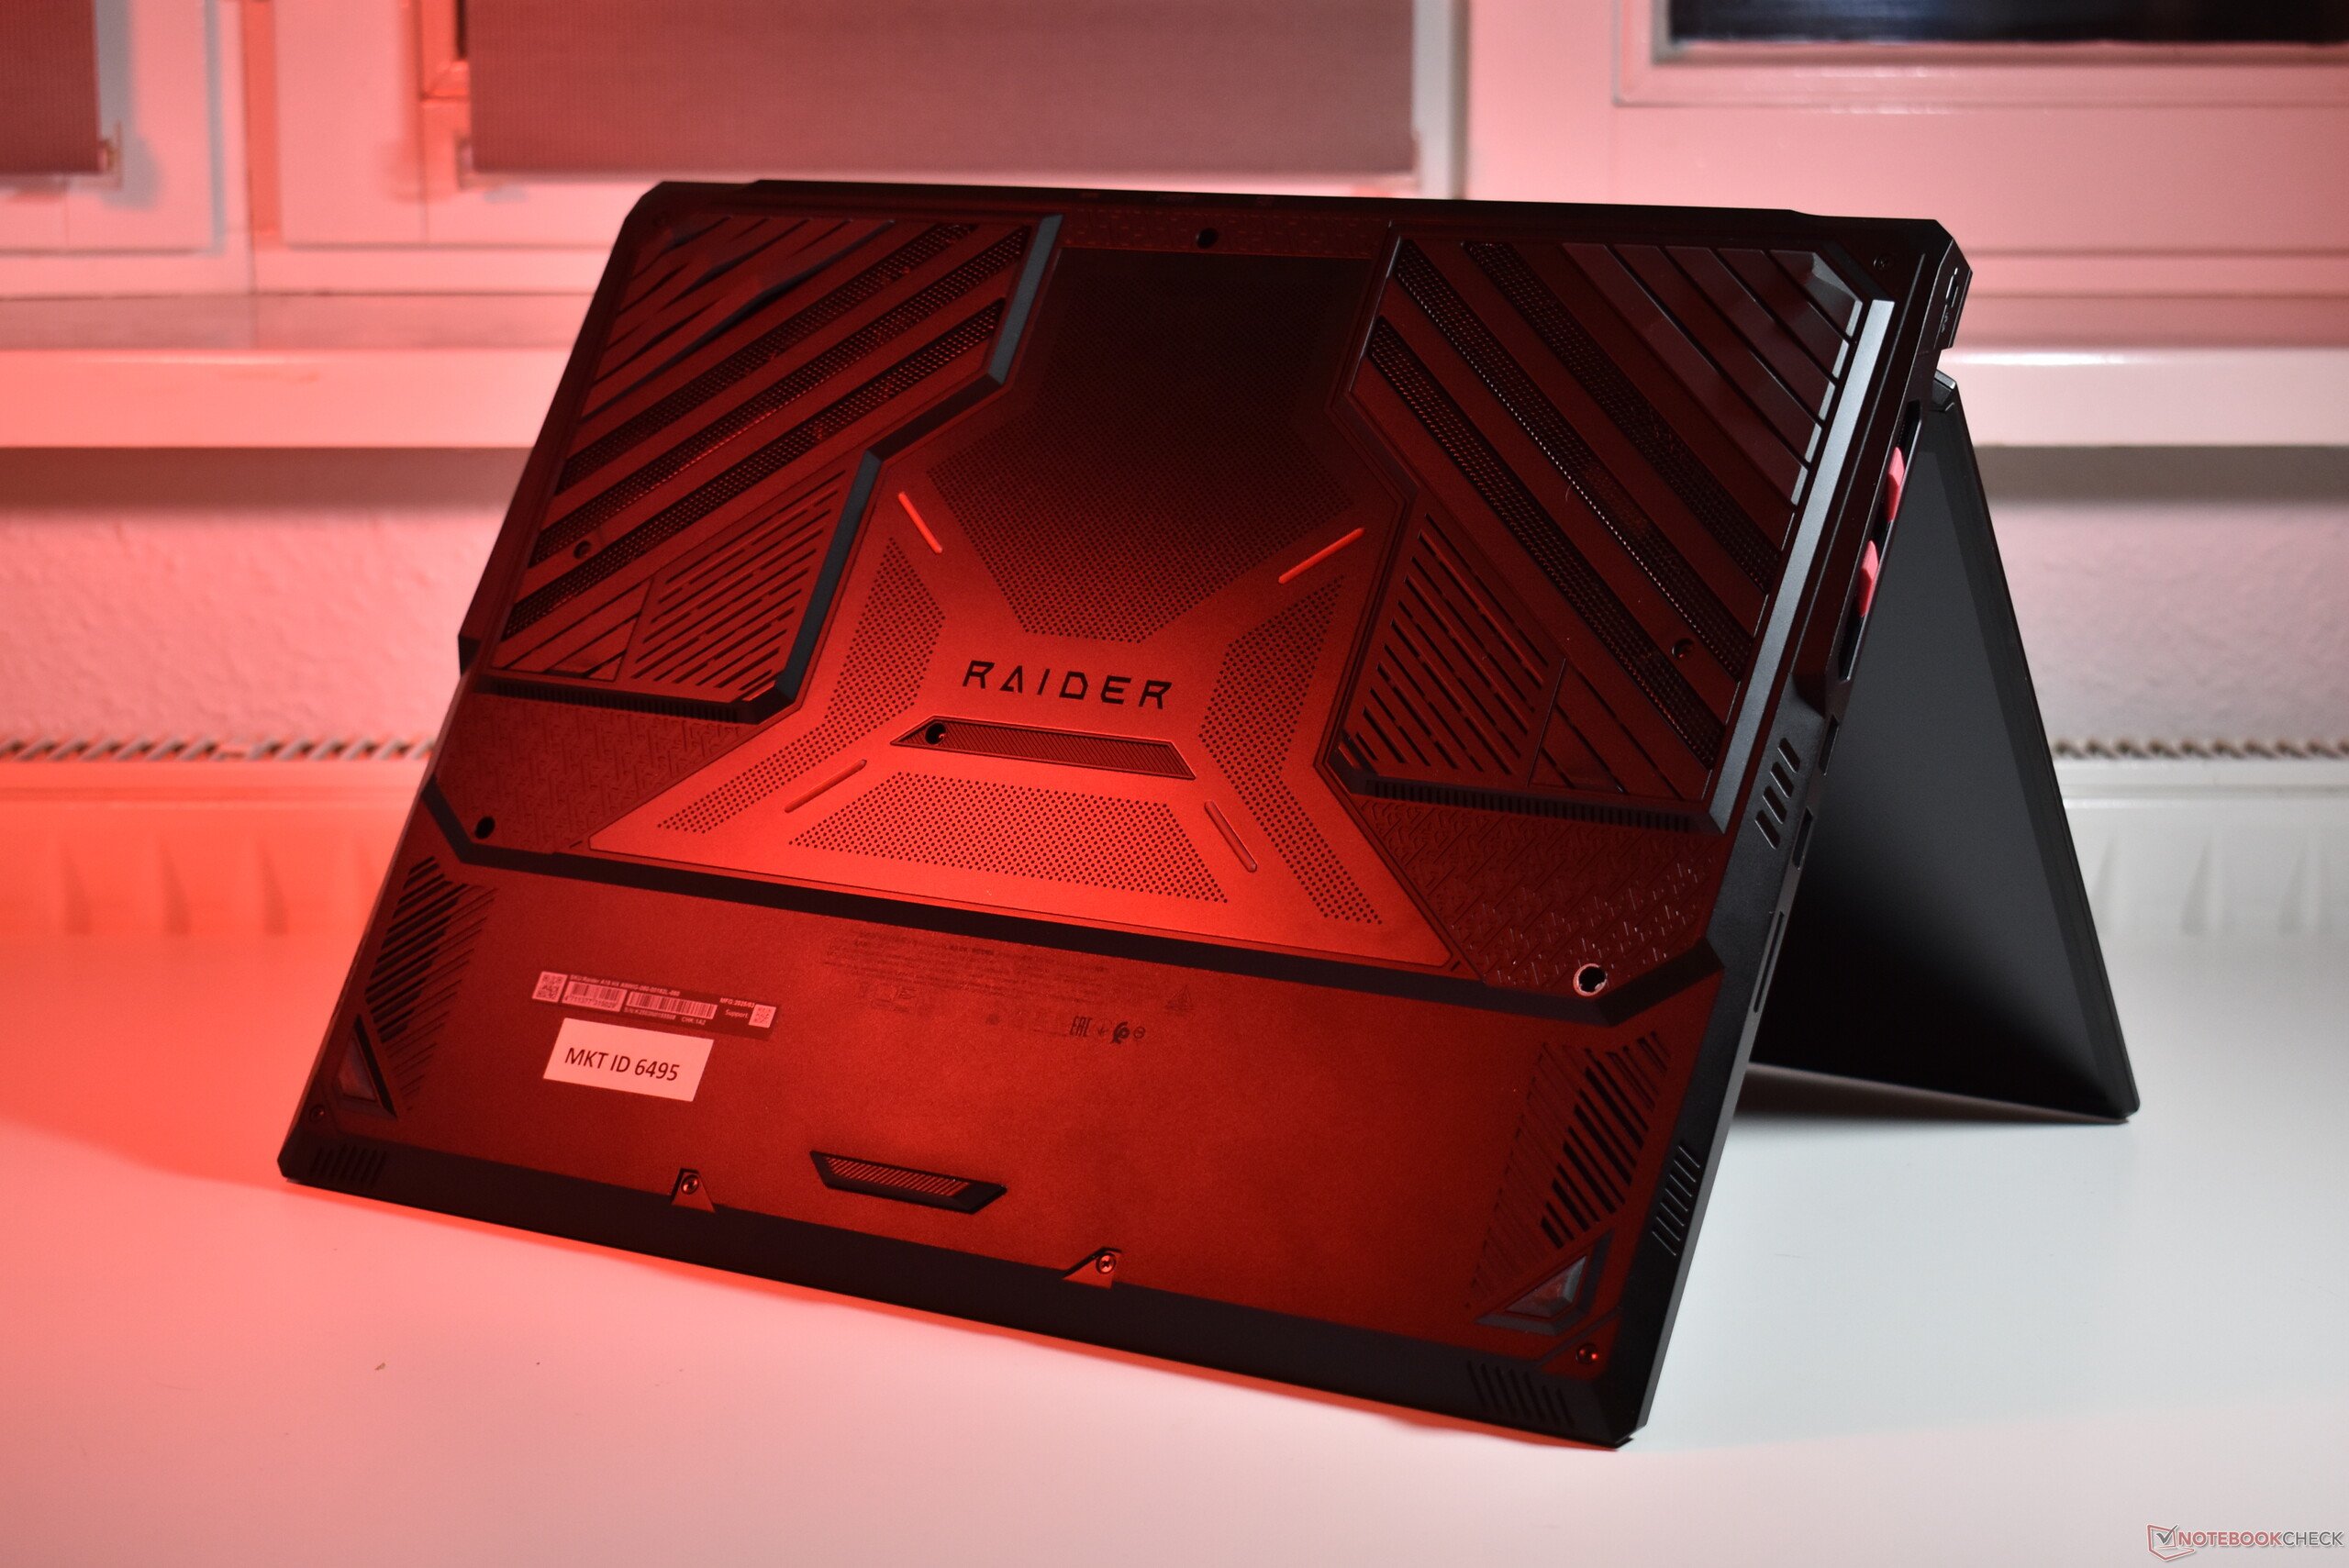
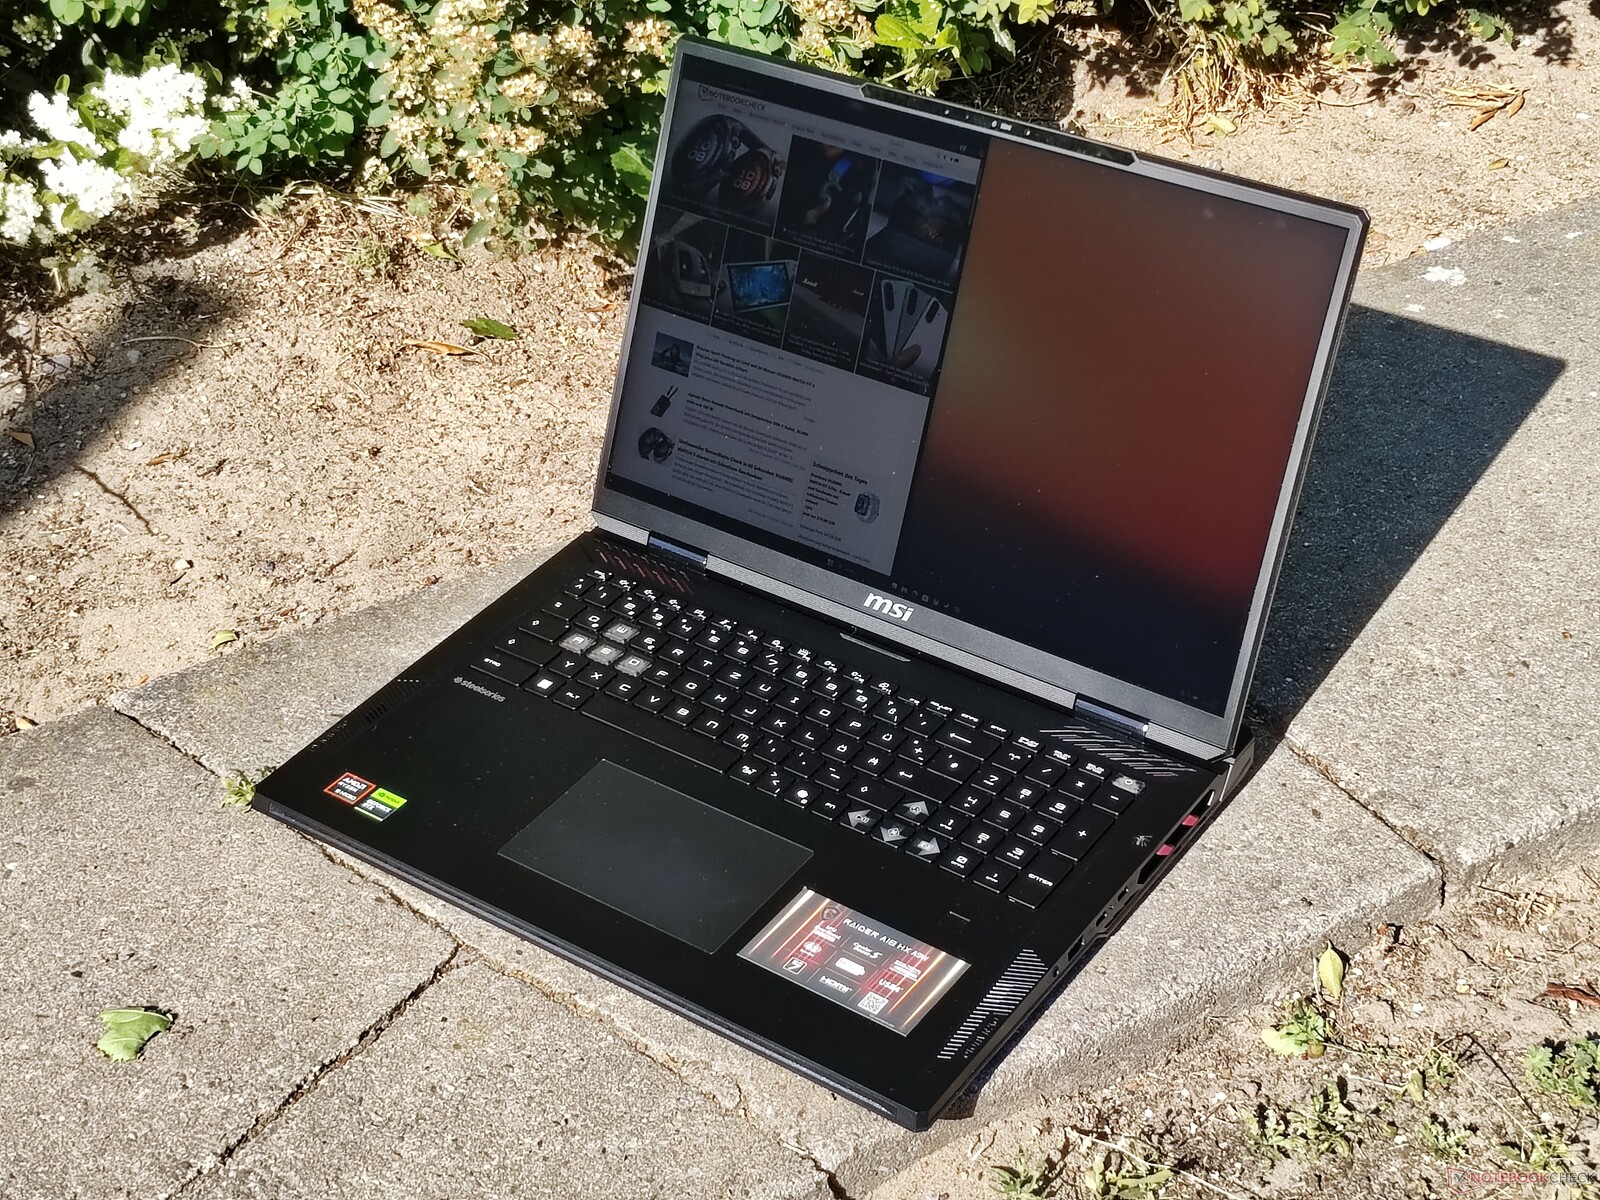
机箱:超大微星笔记本电脑,彰显游戏魅力
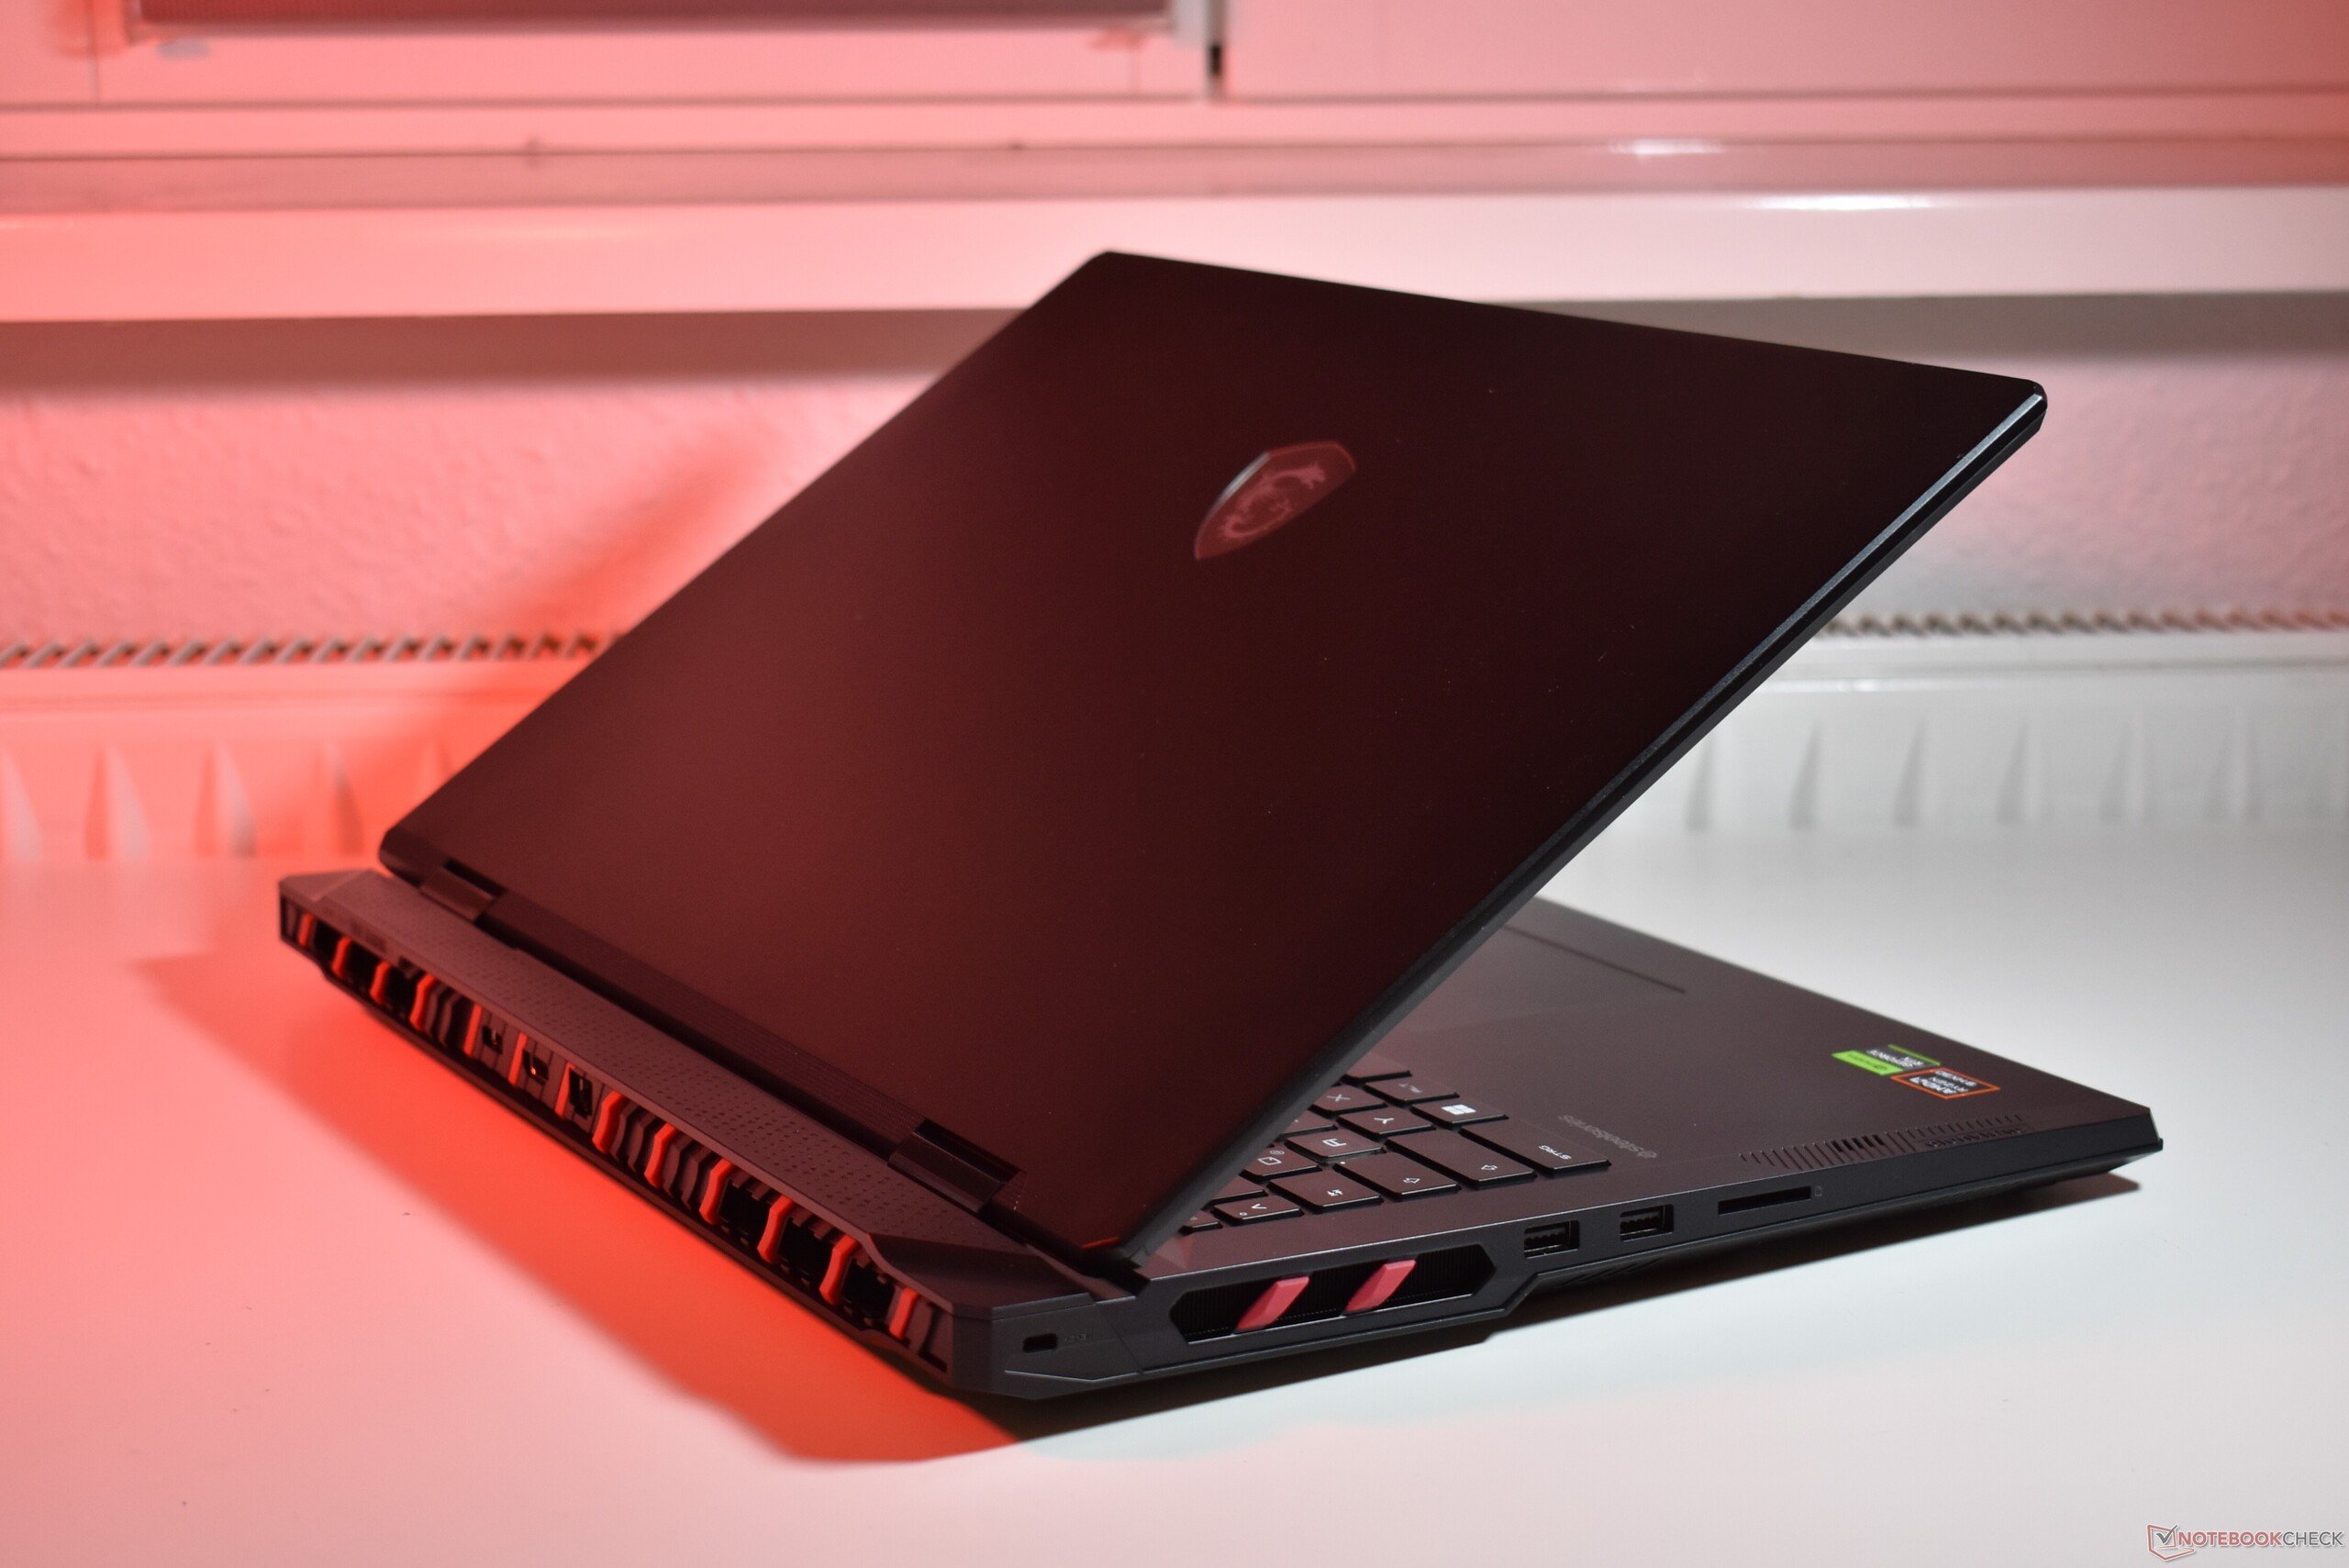
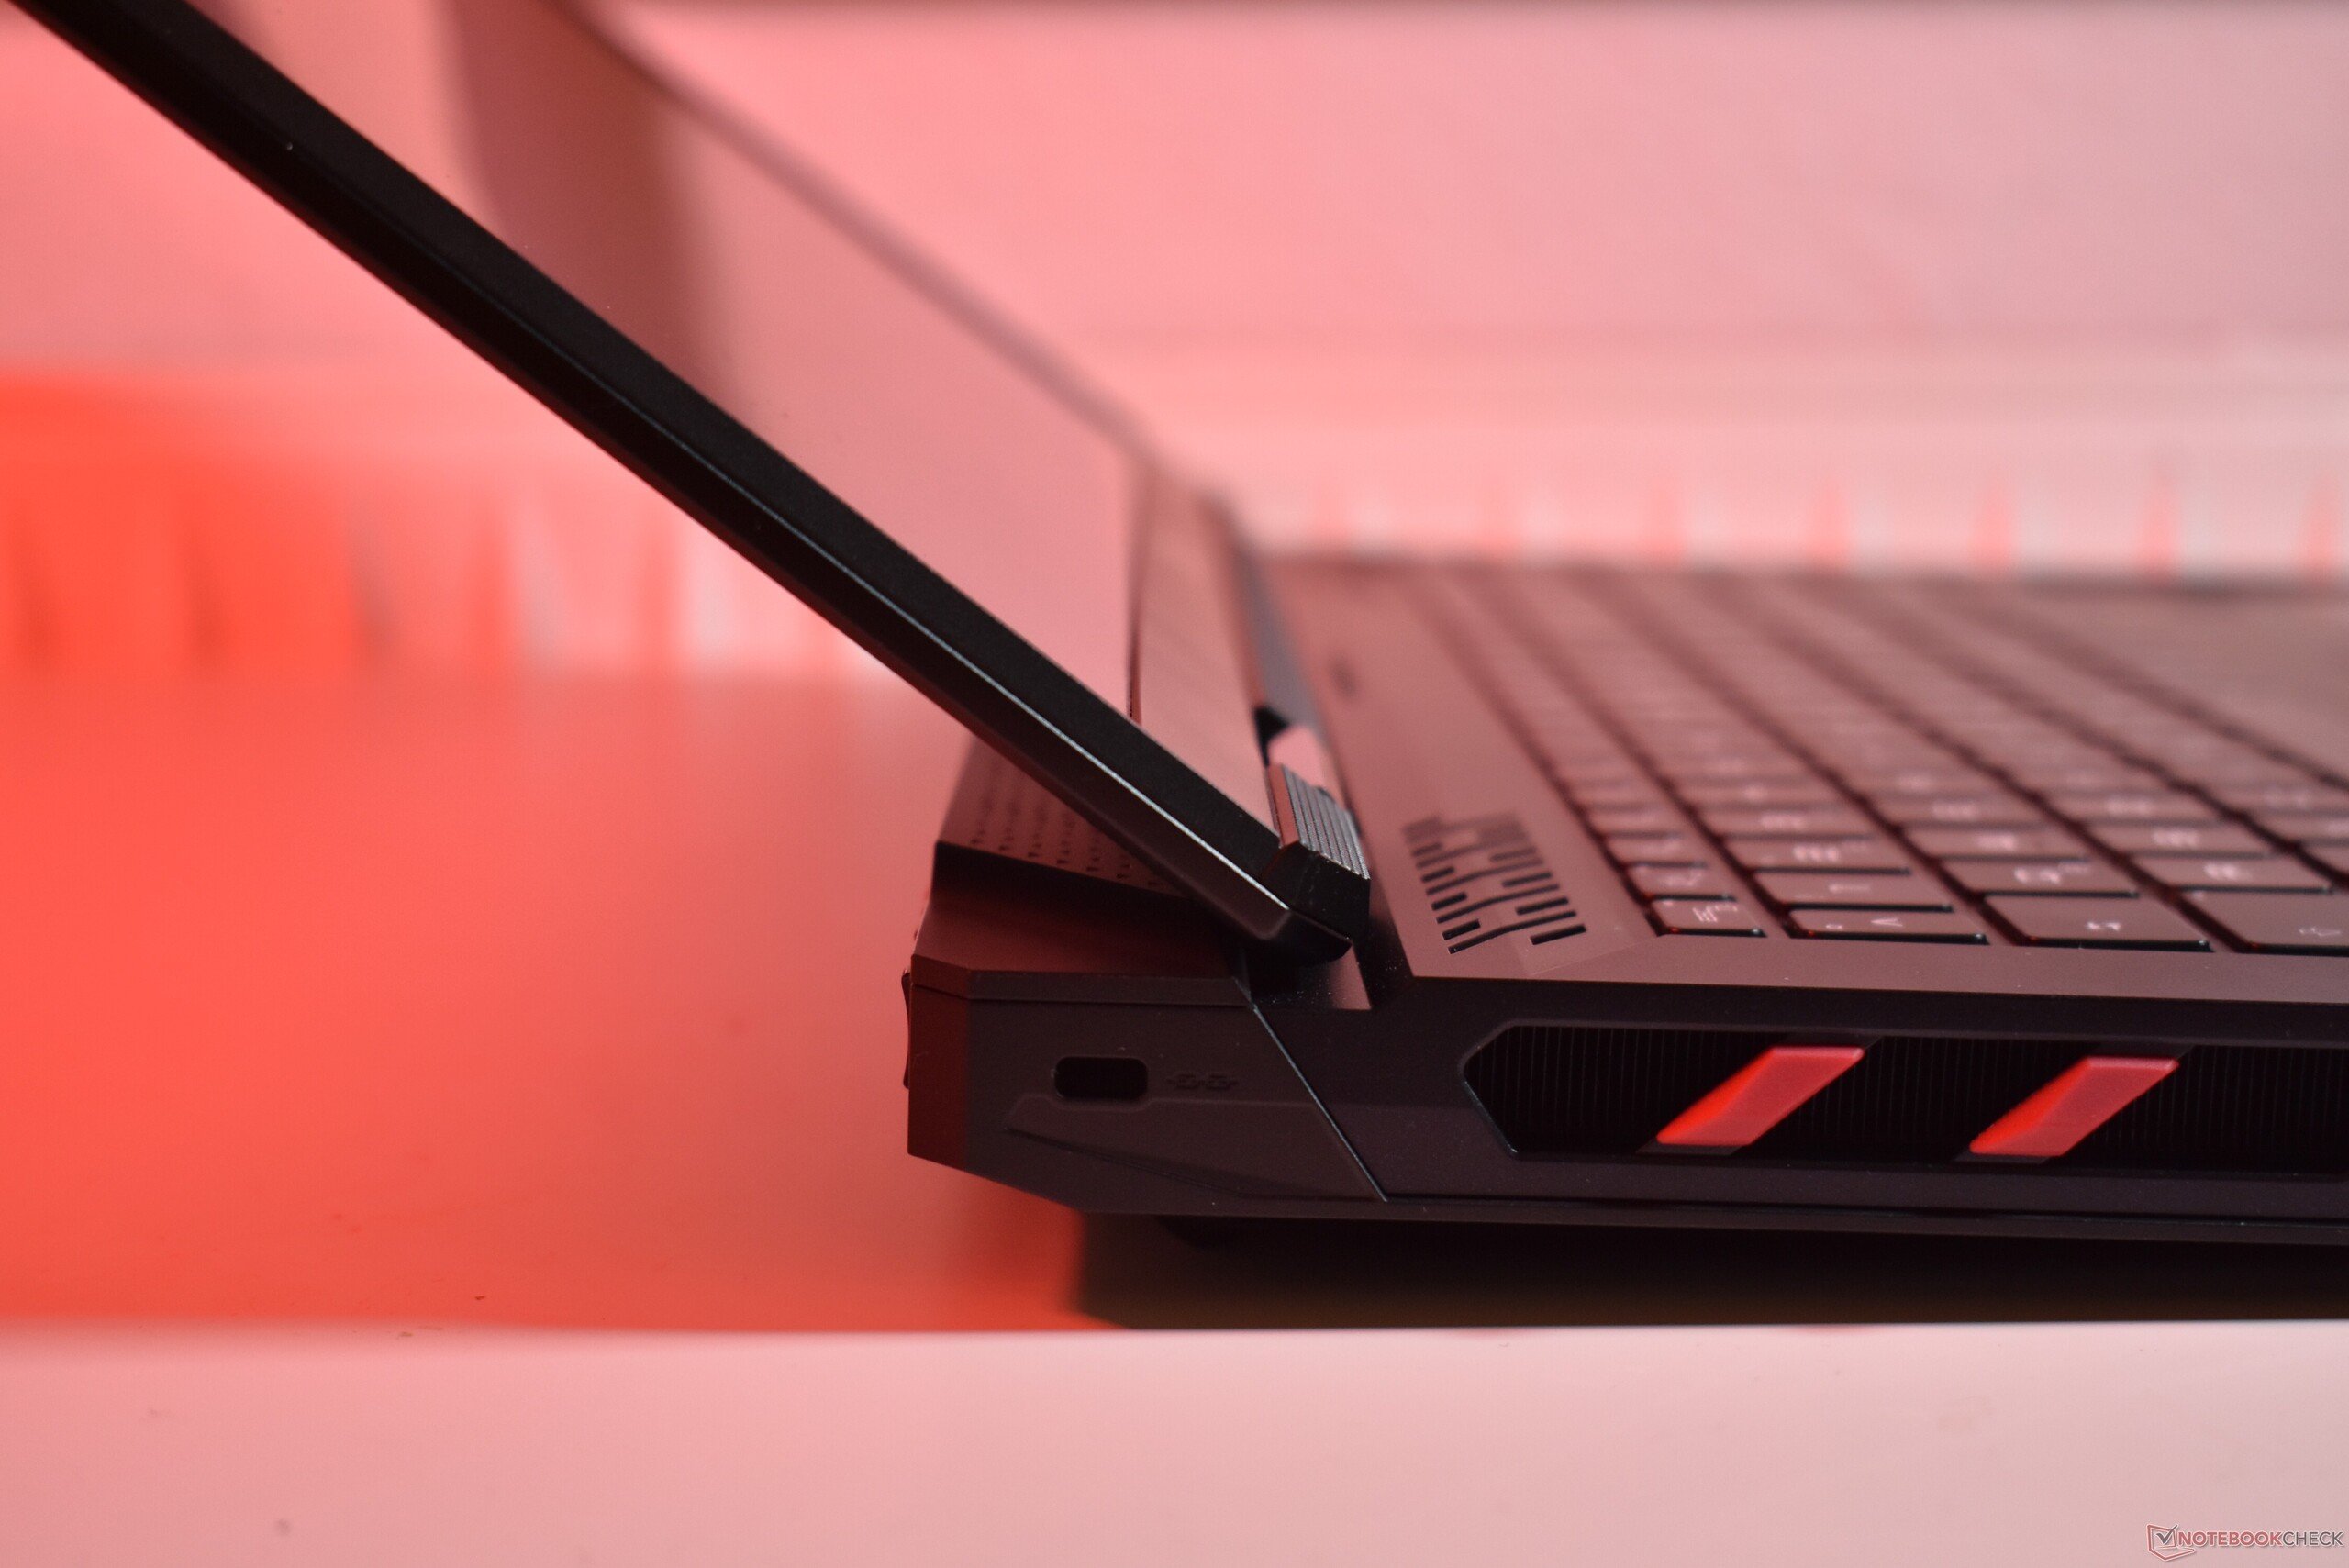
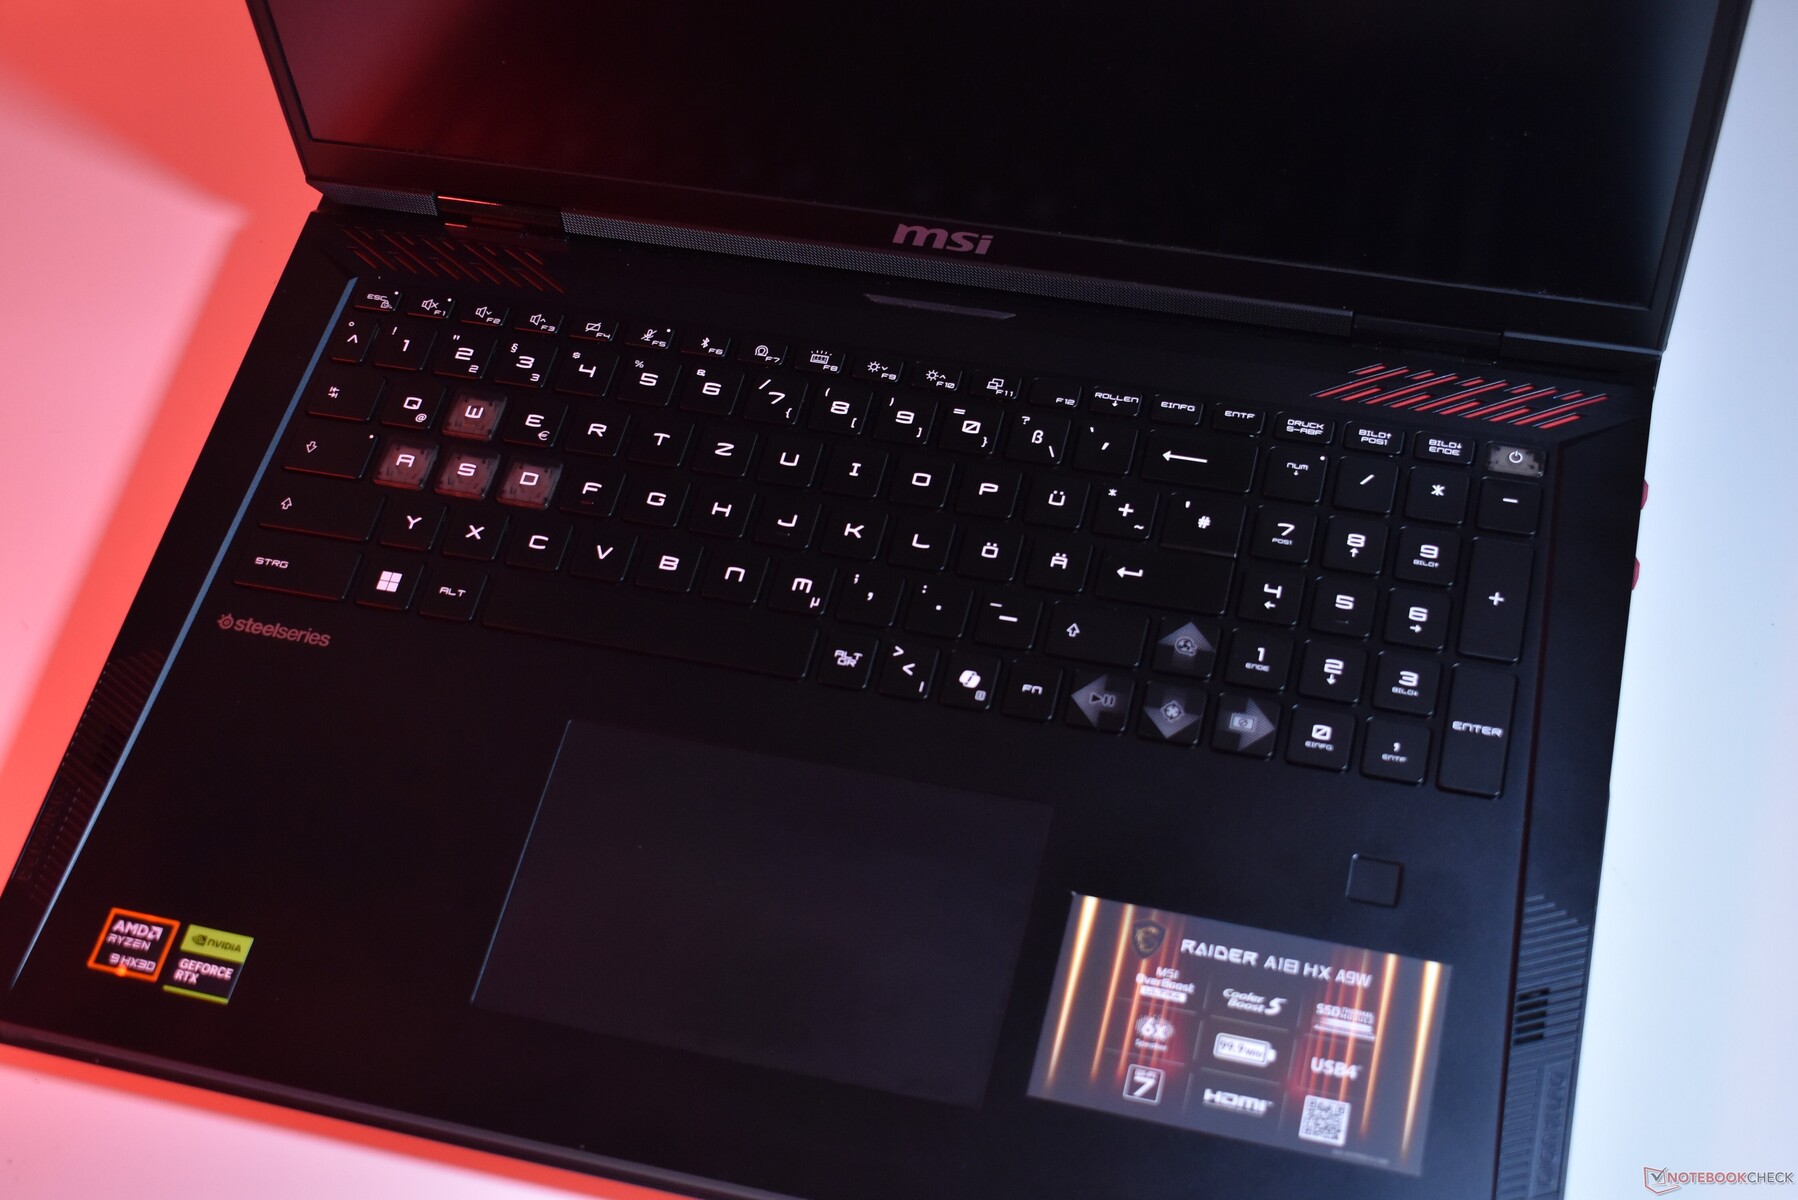
这款巨大的笔记本电脑是一款游戏电脑,而且看起来也很像。黑色机身上有大量红色点缀,机盖上的徽标以及键盘和前边缘都有 RGB 灯。机箱上还有棱角和许多折痕,进一步彰显了 "玩家魅力"。微星为 Raider A18 选用了铝合金和塑料两种材料。厚实的底座内部采用了镁合金边框,具有很高的强度,不过屏幕盖的强度就差强人意了,表现出一定的挠性。
虽然可以单手打开屏幕,但铰链有一些轻微的晃动。此外,屏幕只能打开到 130 度,因为屏幕后面的散热块阻挡了屏幕的进一步打开。
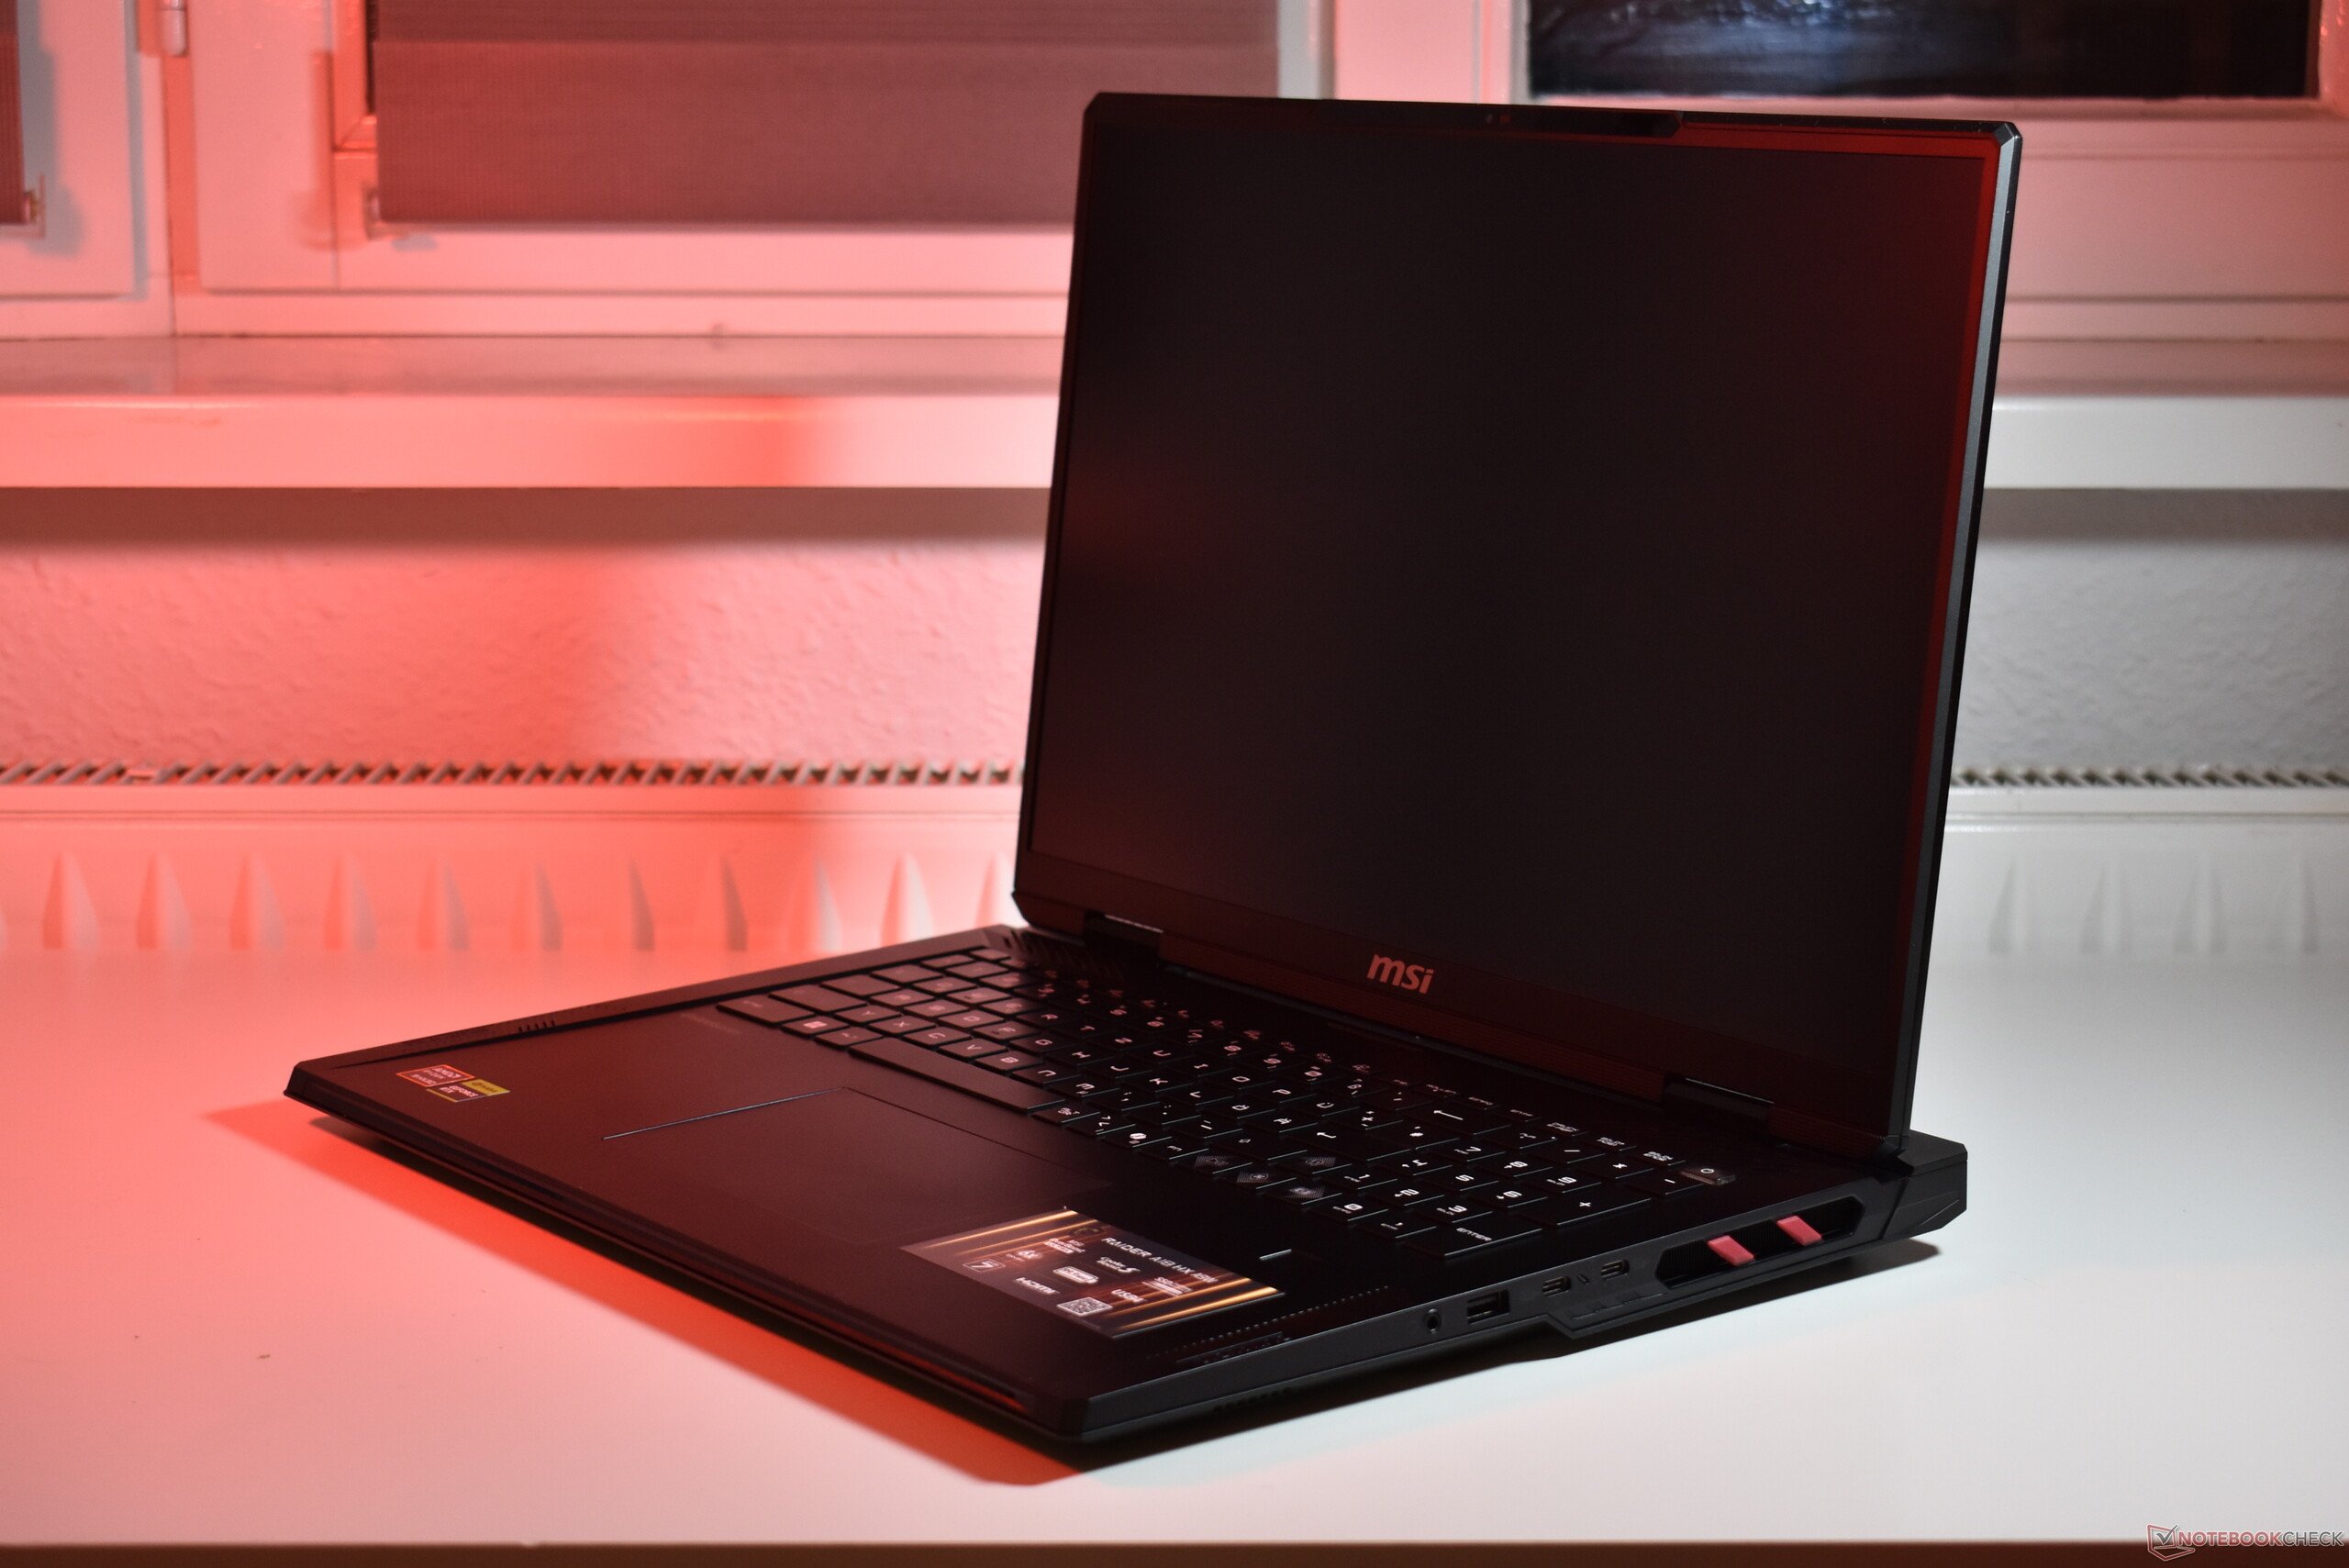
微星 Raider A18 是我们对比中最重的 18 英寸笔记本电脑,尽管这些设备都不适合移动使用。迄今为止,18 英寸笔记本电脑主要是台式机的替代机型,它们很少会离开家庭办公桌。
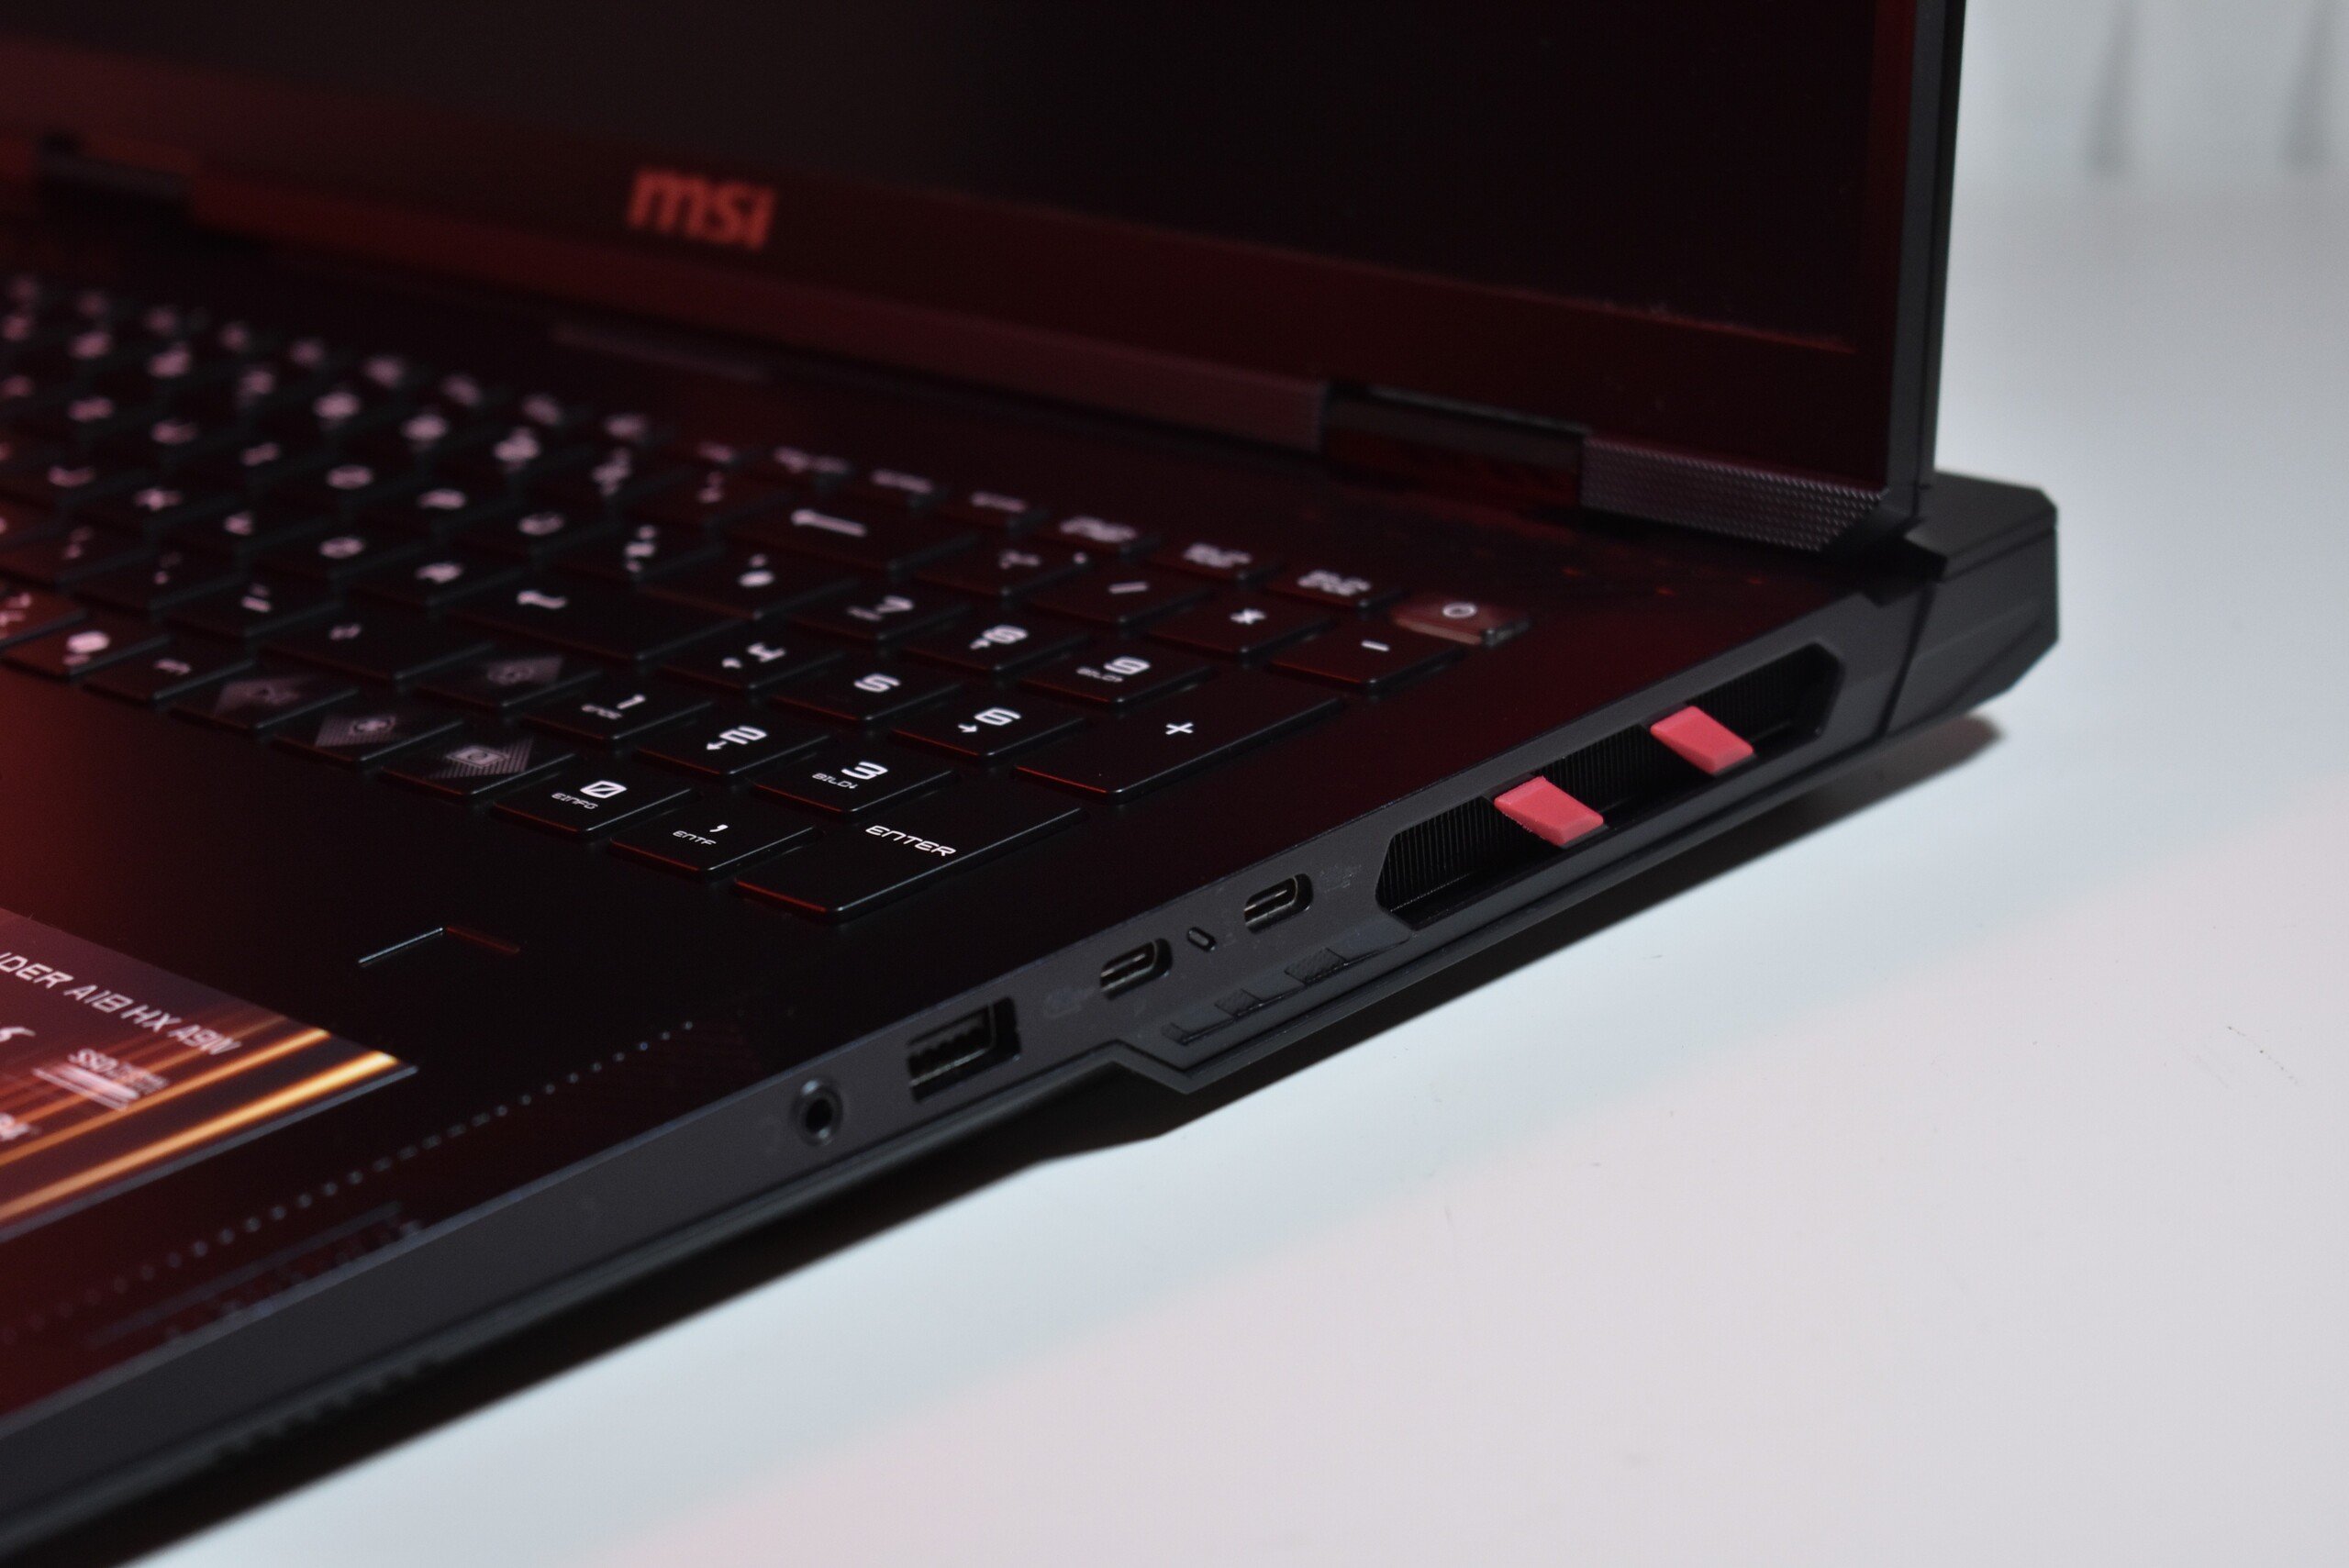
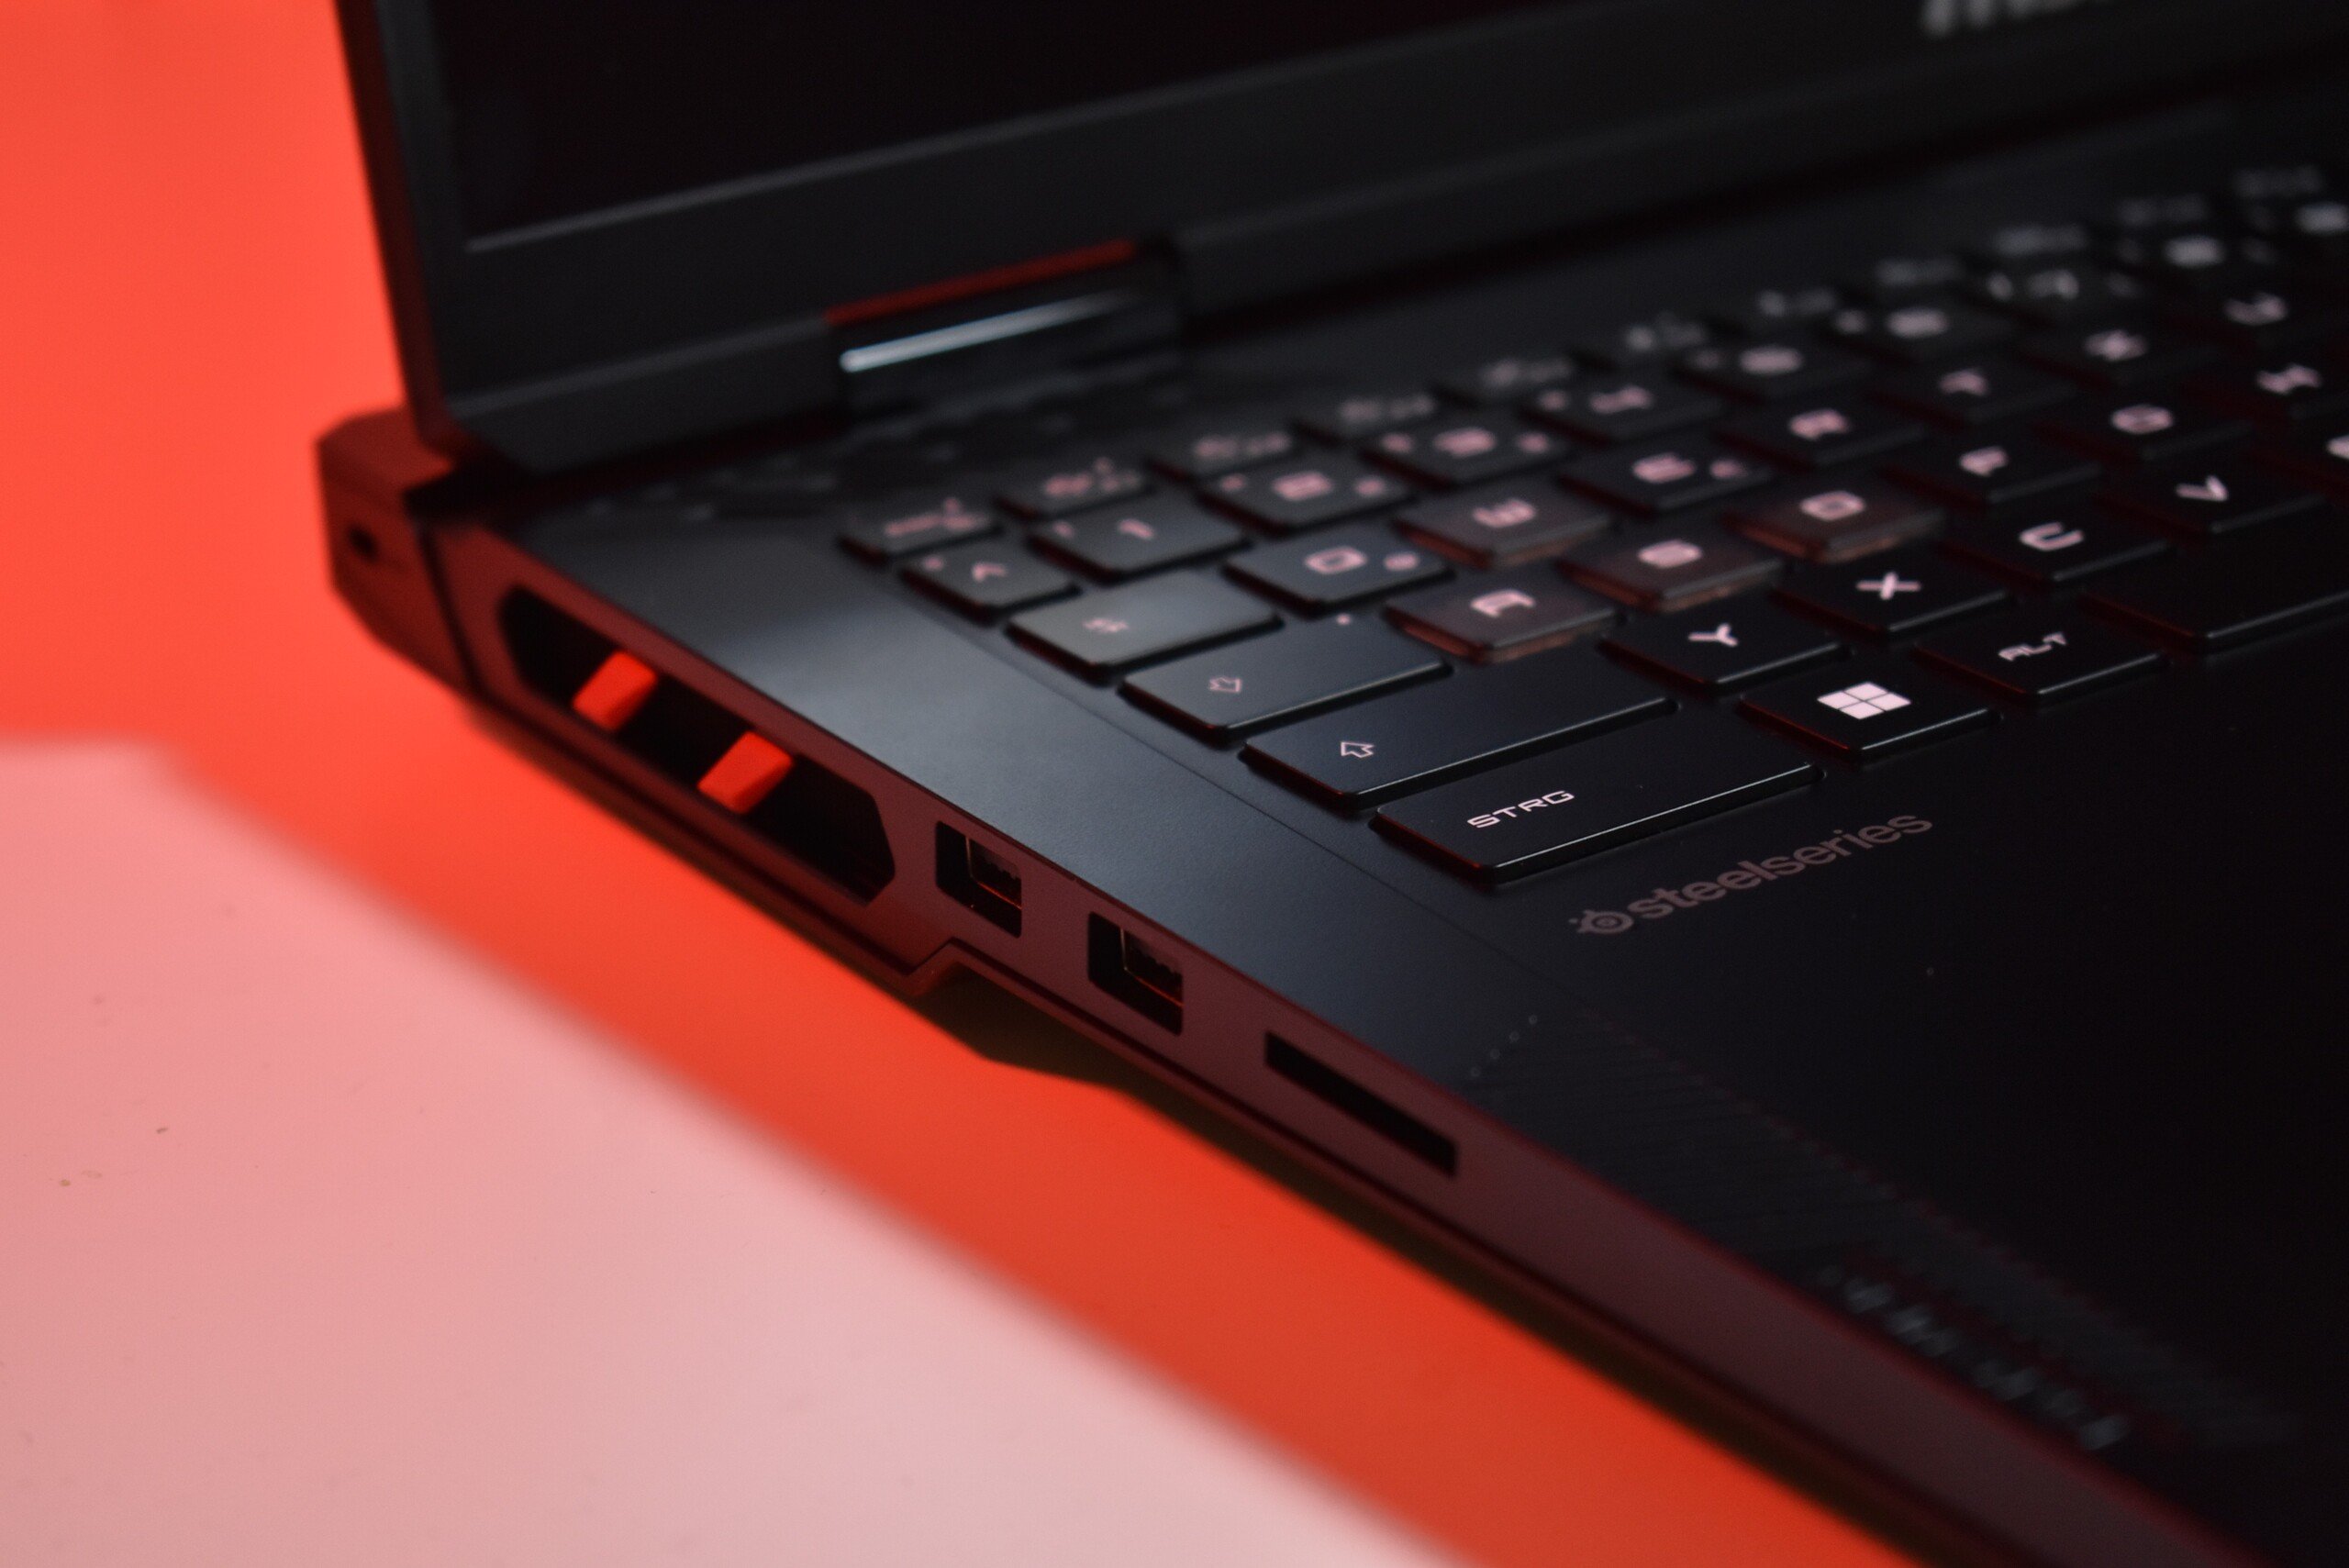
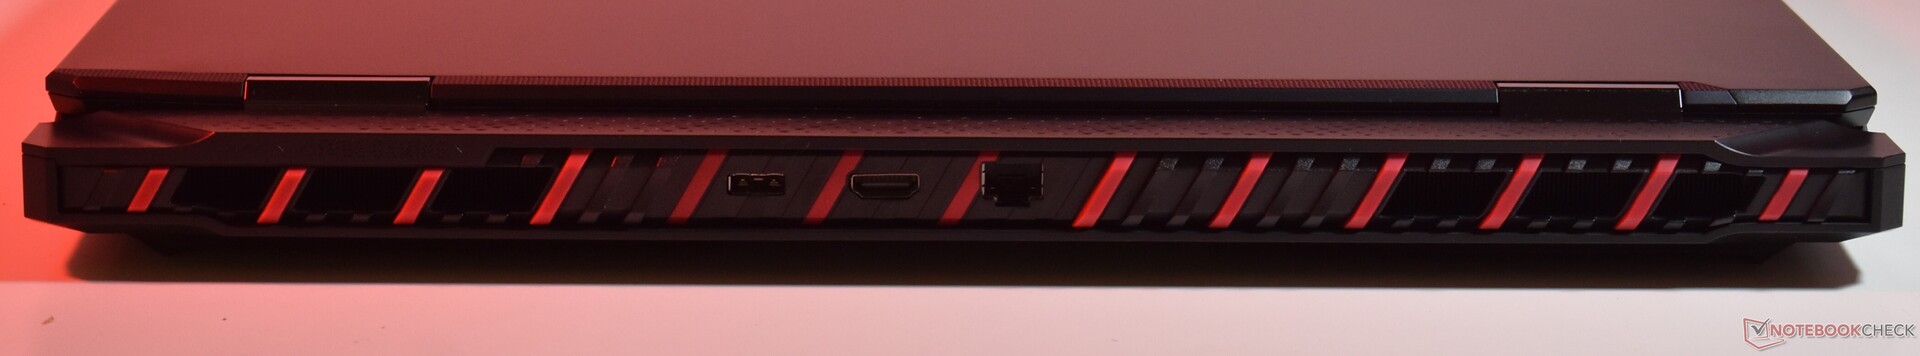
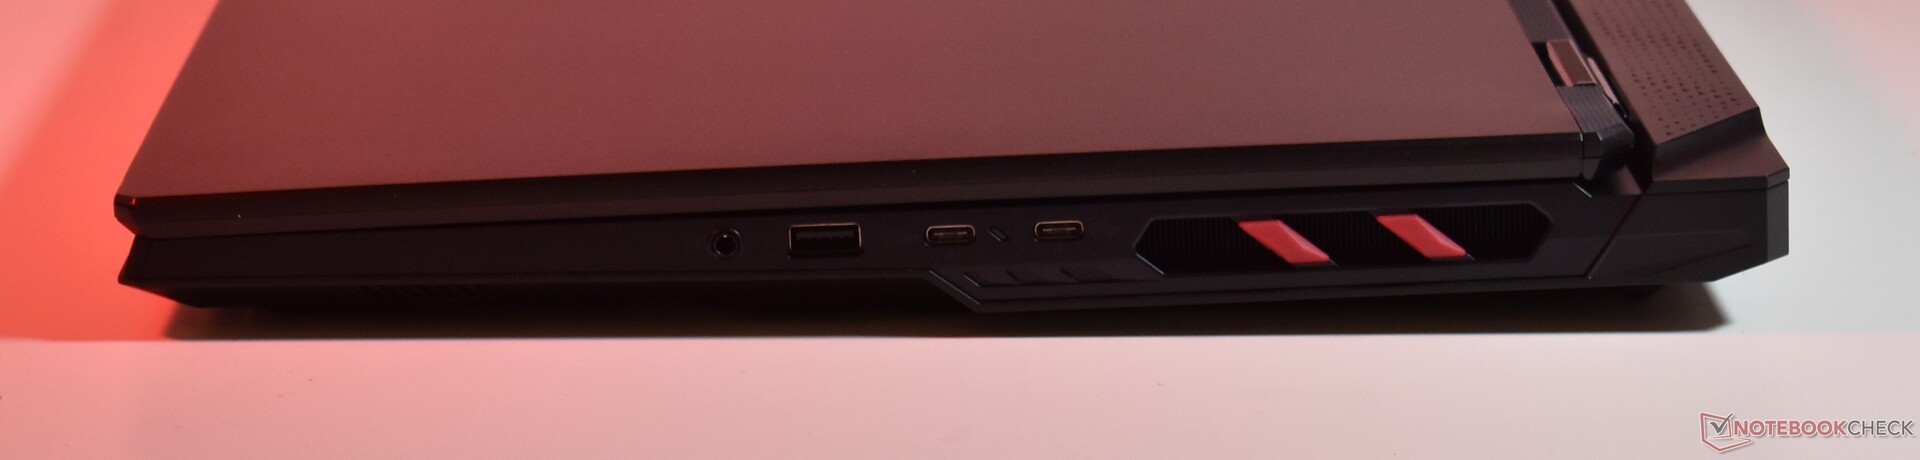
连接性微星内置 SD 卡和 2.5Gbit 以太网
微星在现代笔记本电脑上配备了所有你想要的端口--值得庆幸的是,又厚又大的机箱提供了足够的空间。接口分布在左右两侧和背面。有点混乱:充电端口看起来像 USB A 端口,但其实不是。此外,如果微星能把一个 USB-C/Thunderbolt 4 端口也放在左侧就更好了。
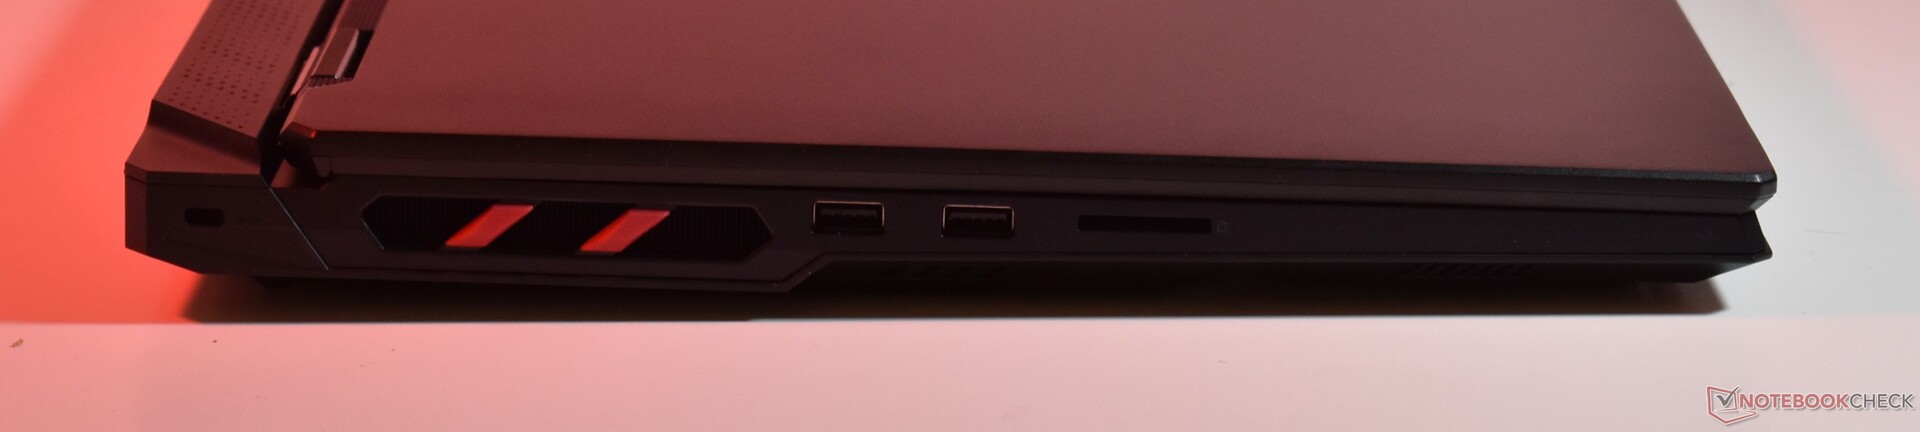
SD 读卡器
全尺寸的 SD 读卡器无法完全容纳卡,卡会突出来。我们用 AV PRO microSD 128 GB V60 参考卡测试了它的速度:读卡器在实际读取数据时速度非常快,但在向卡中传输数据时速度一般。
| SD Card Reader | |
| average JPG Copy Test (av. of 3 runs) | |
| Medion Erazer Beast 18 X1 MD62731 (AV PRO microSD 128 GB V60) | |
| Aorus Master 18 AM8H (AV PRO microSD 128 GB V60) | |
| Average of class Gaming (20.9 - 210, n=54, last 2 years) | |
| MSI Raider 18 HX A14V (Toshiba Exceria Pro SDXC 64 GB UHS-II) | |
| MSI Raider A18 HX A9WIG-080 | |
| maximum AS SSD Seq Read Test (1GB) | |
| MSI Raider A18 HX A9WIG-080 | |
| Aorus Master 18 AM8H (AV PRO microSD 128 GB V60) | |
| Medion Erazer Beast 18 X1 MD62731 (AV PRO microSD 128 GB V60) | |
| Average of class Gaming (25.5 - 261, n=51, last 2 years) | |
| MSI Raider 18 HX A14V (Toshiba Exceria Pro SDXC 64 GB UHS-II) | |
交流
微星 Raider A18 采用联发科 Wi-Fi 7 MT7925,支持 Wi-Fi 7 标准。传输速率非常高,在激烈的游戏过程中不会出现任何问题。此外,为了获得更稳定的连接,背面还配备了 2.5GBit 以太网接口。
网络摄像头
微星采用了一个简单的 1080p 网络摄像头,其中有一个红外摄像头和一个隐私快门。该网络摄像头足以满足视频通话的要求,但成像质量并不理想。


配件
除了配有专用插头的 400 瓦巨型充电器外,包装盒内没有其他配件。
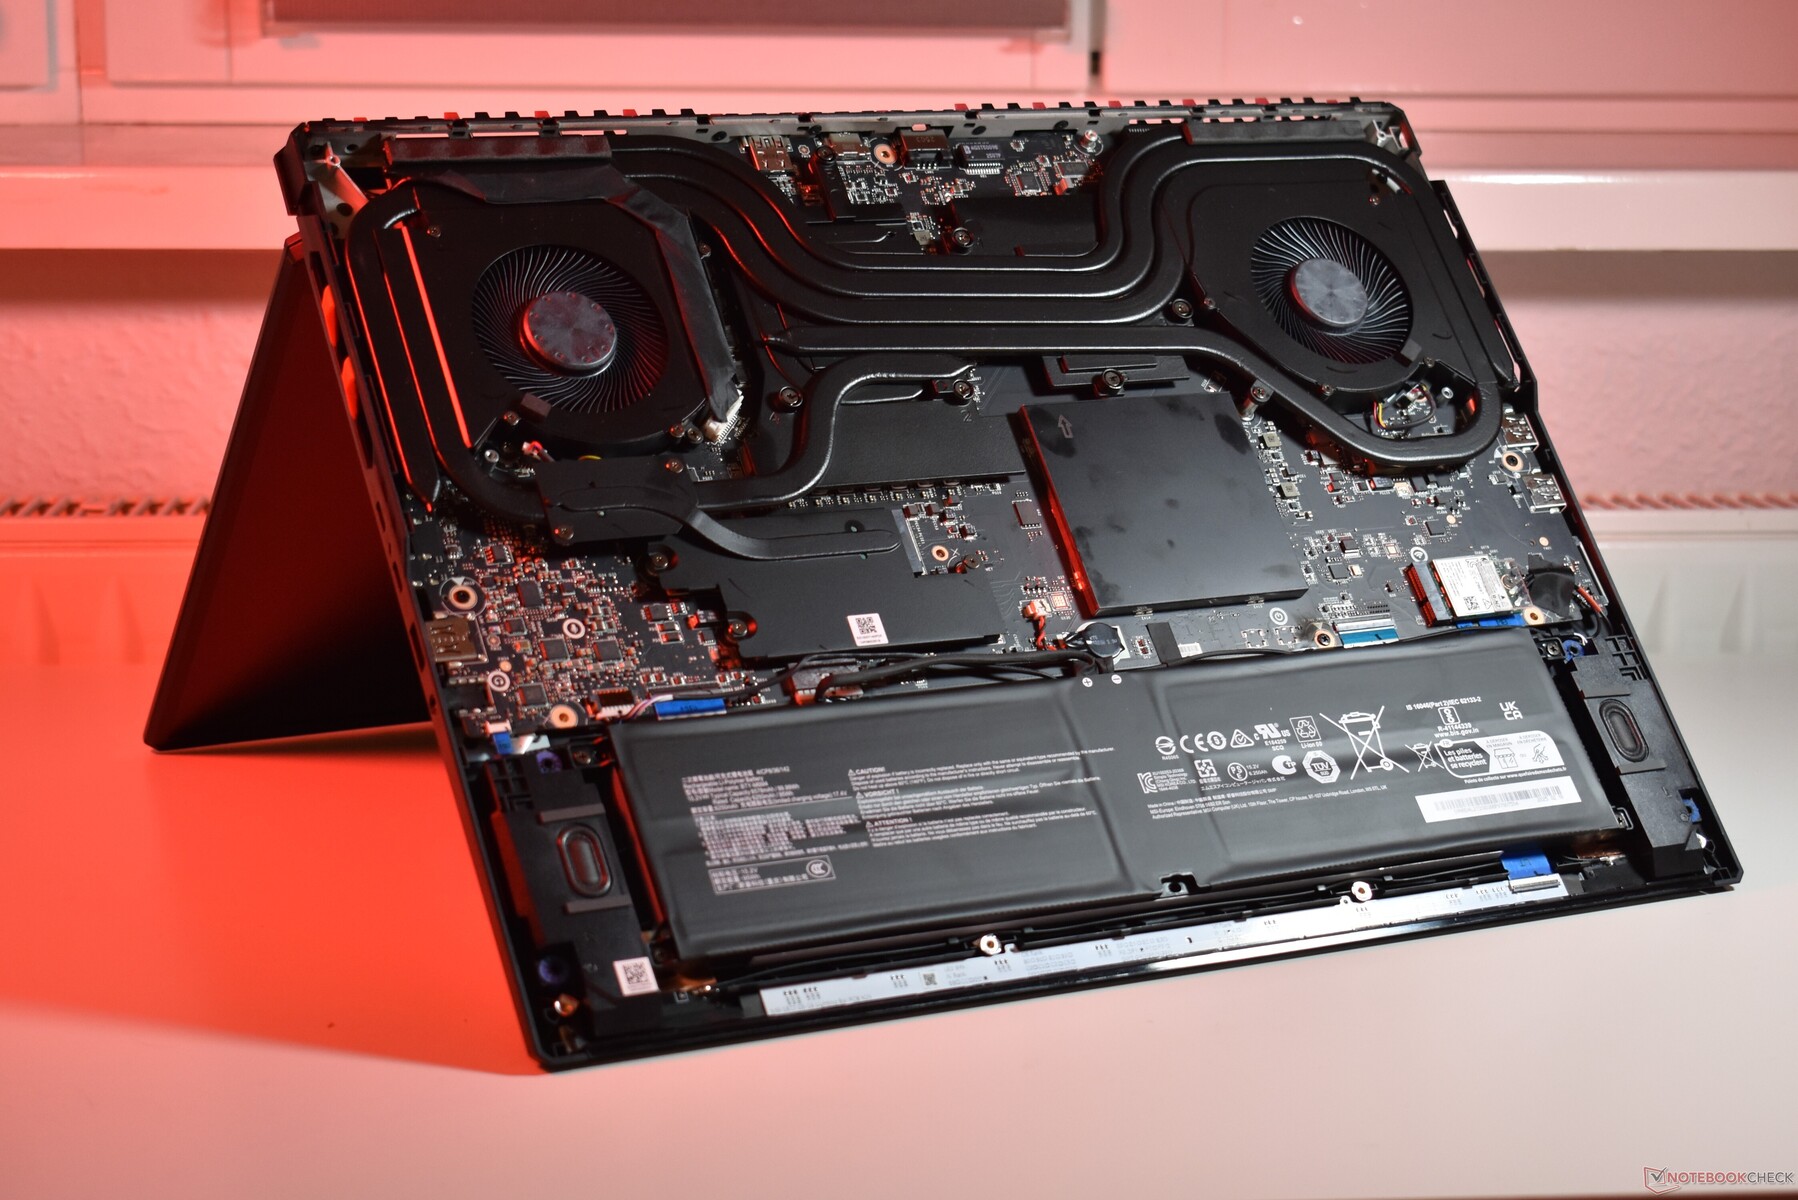
维护
微星 Raider A18 笔记本电脑的底盖总共有 12 颗飞利浦螺钉固定。此外,微星还在底座边缘放置了一些夹子,需要用塑料撬棍才能打开盖子。
取下盖子后,就可以进入内部。内存、存储和 Wi-Fi 全部采用模块化设计,固态硬盘隐藏在与散热系统相连的散热装置下方。此外,还可以清洁冷却系统,必要时更换电池。
可持续性
关于微星 Raider A18 HX 在可持续发展方面所做努力的信息并不多。这款笔记本电脑通过了 EPEAT 银牌认证,但这也是我们获得的所有信息。
保修
与欧盟市场上的许多其他消费类笔记本电脑一样,微星 Raider A18 HX 的保修期为 24 个月。该设备必须送修,保修期仅适用于德国。
输入设备:微星的 RGB 键盘可以随心所欲地发光
键盘
键盘是微星 Raider A18 HX 的关键部分。微星采用了 Steelseries 键盘,提供了非常出色的键入体验。这是一款带有数字键盘的全尺寸键盘,键程较长,手感柔软。键盘采用 RGB 背光,可按键自定义,并提供多种不同效果。
缺点也是有的:R 键周围的区域在重击时会有一些弯曲。此外,键盘的布局也不是很好,比如 FN 键的位置很奇怪,欧洲版的回车键也很小。
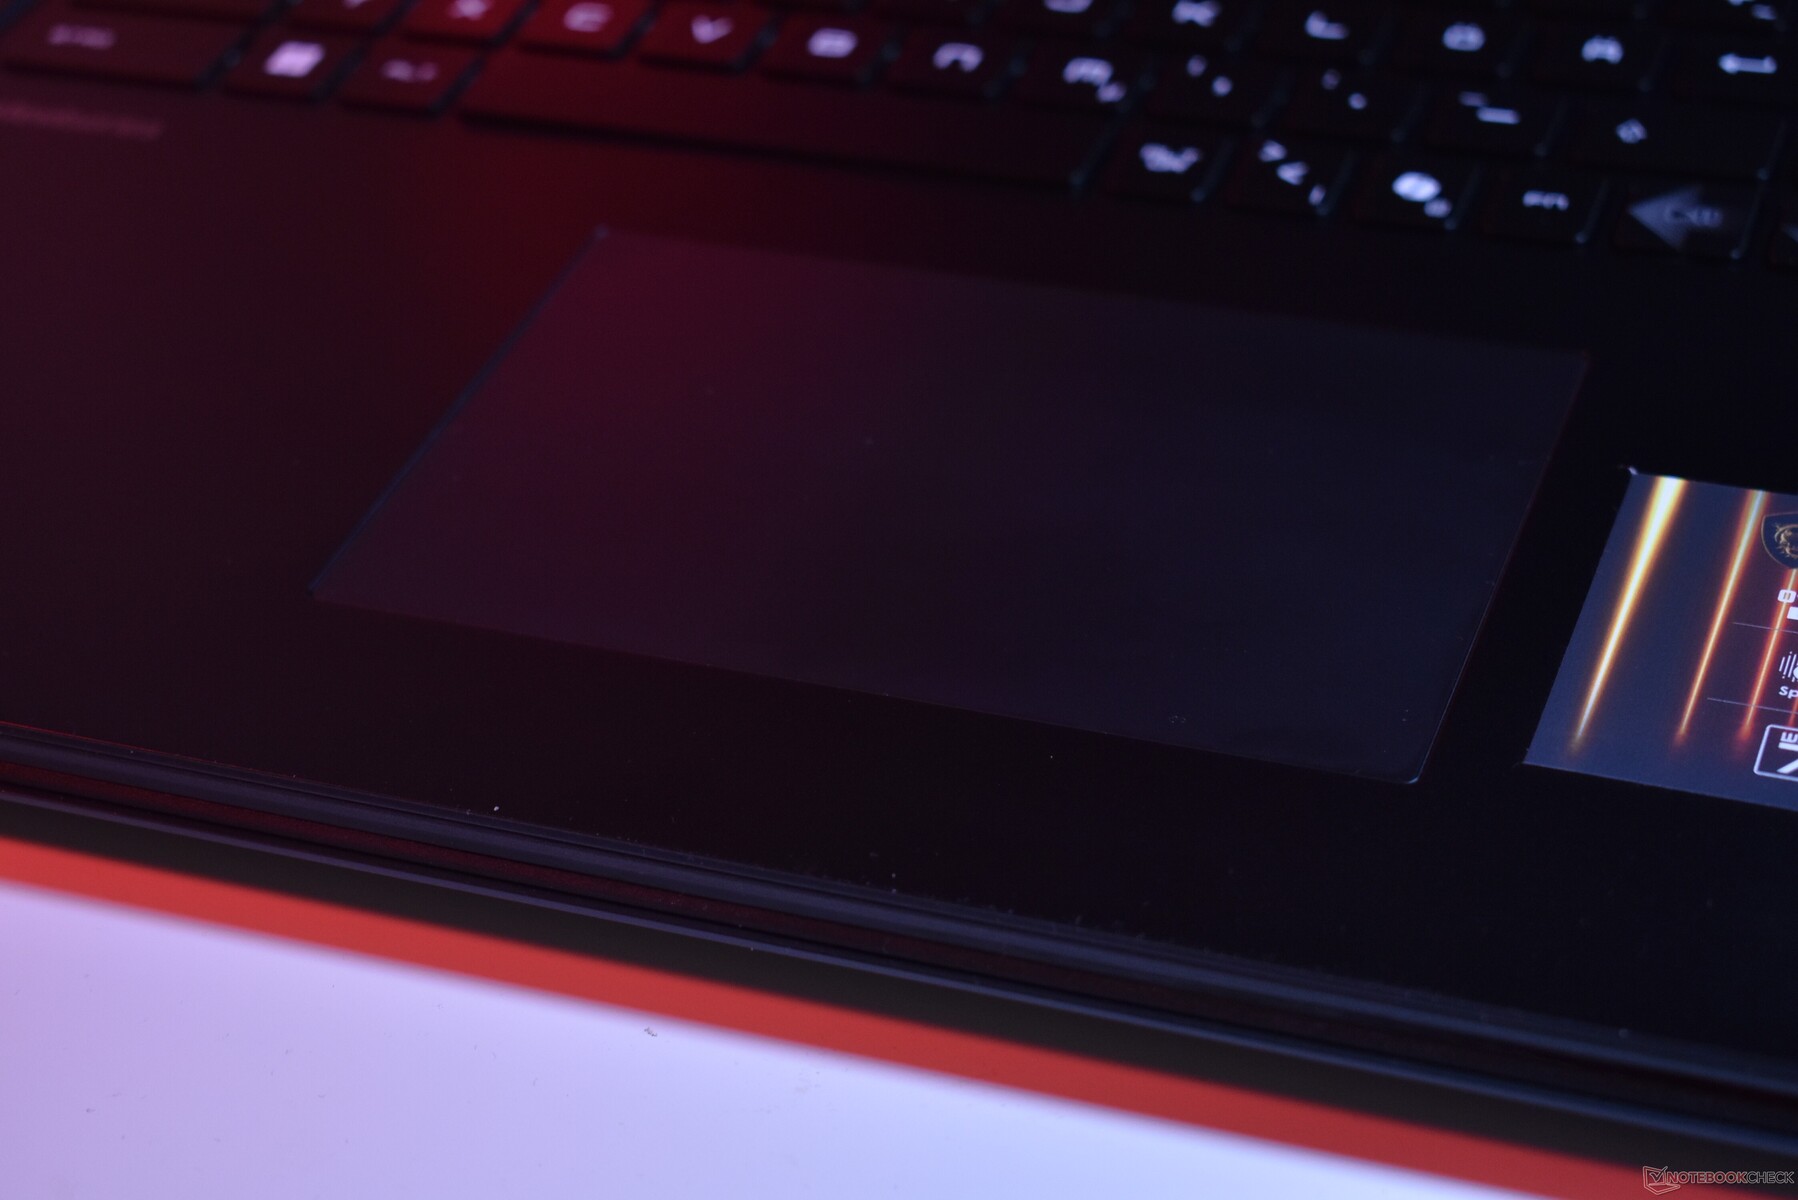
触摸板
微星内置了一块机械点击板,尺寸为 13.1 x 8.2 厘米。机械点击的声音很好听,够硬但仍有阻尼。机械装置的声音也不大。表面由黑色哑光塑料制成,非常光滑,适合手指在上面滑动。总的来说,我们喜欢这款触摸板,它非常好用,不过如果有一块触觉玻璃触摸板就更好了。
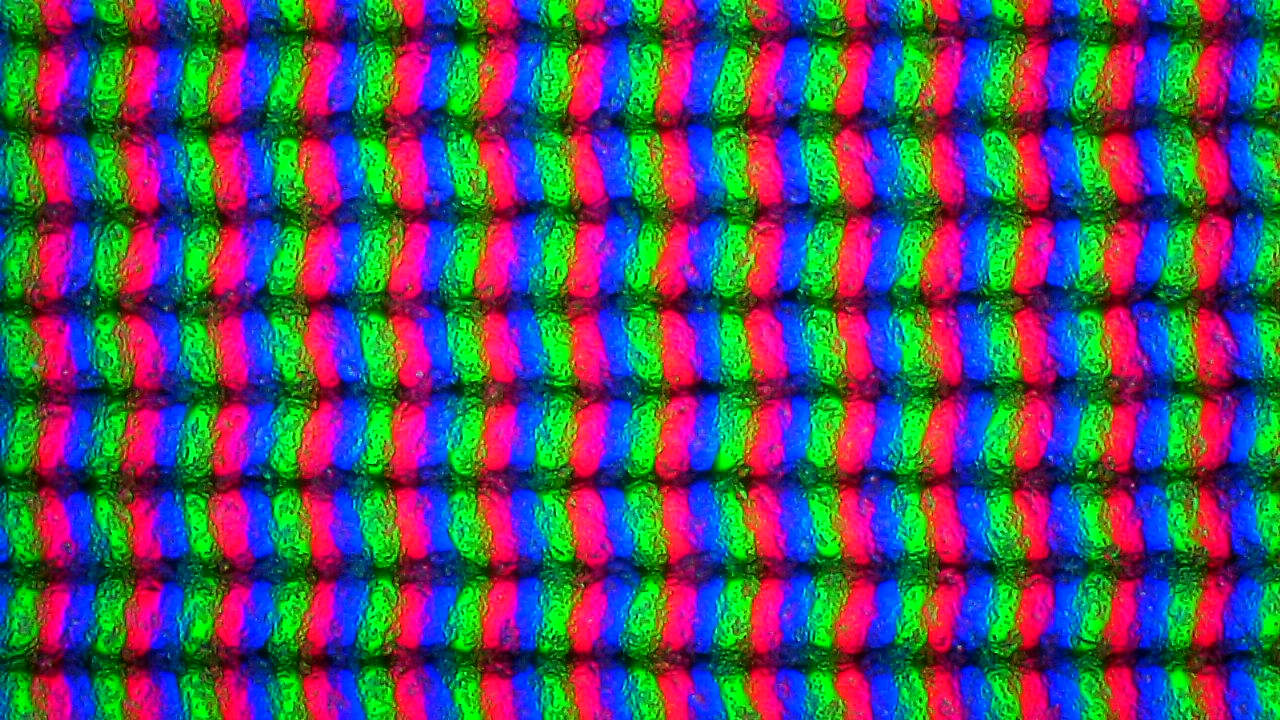
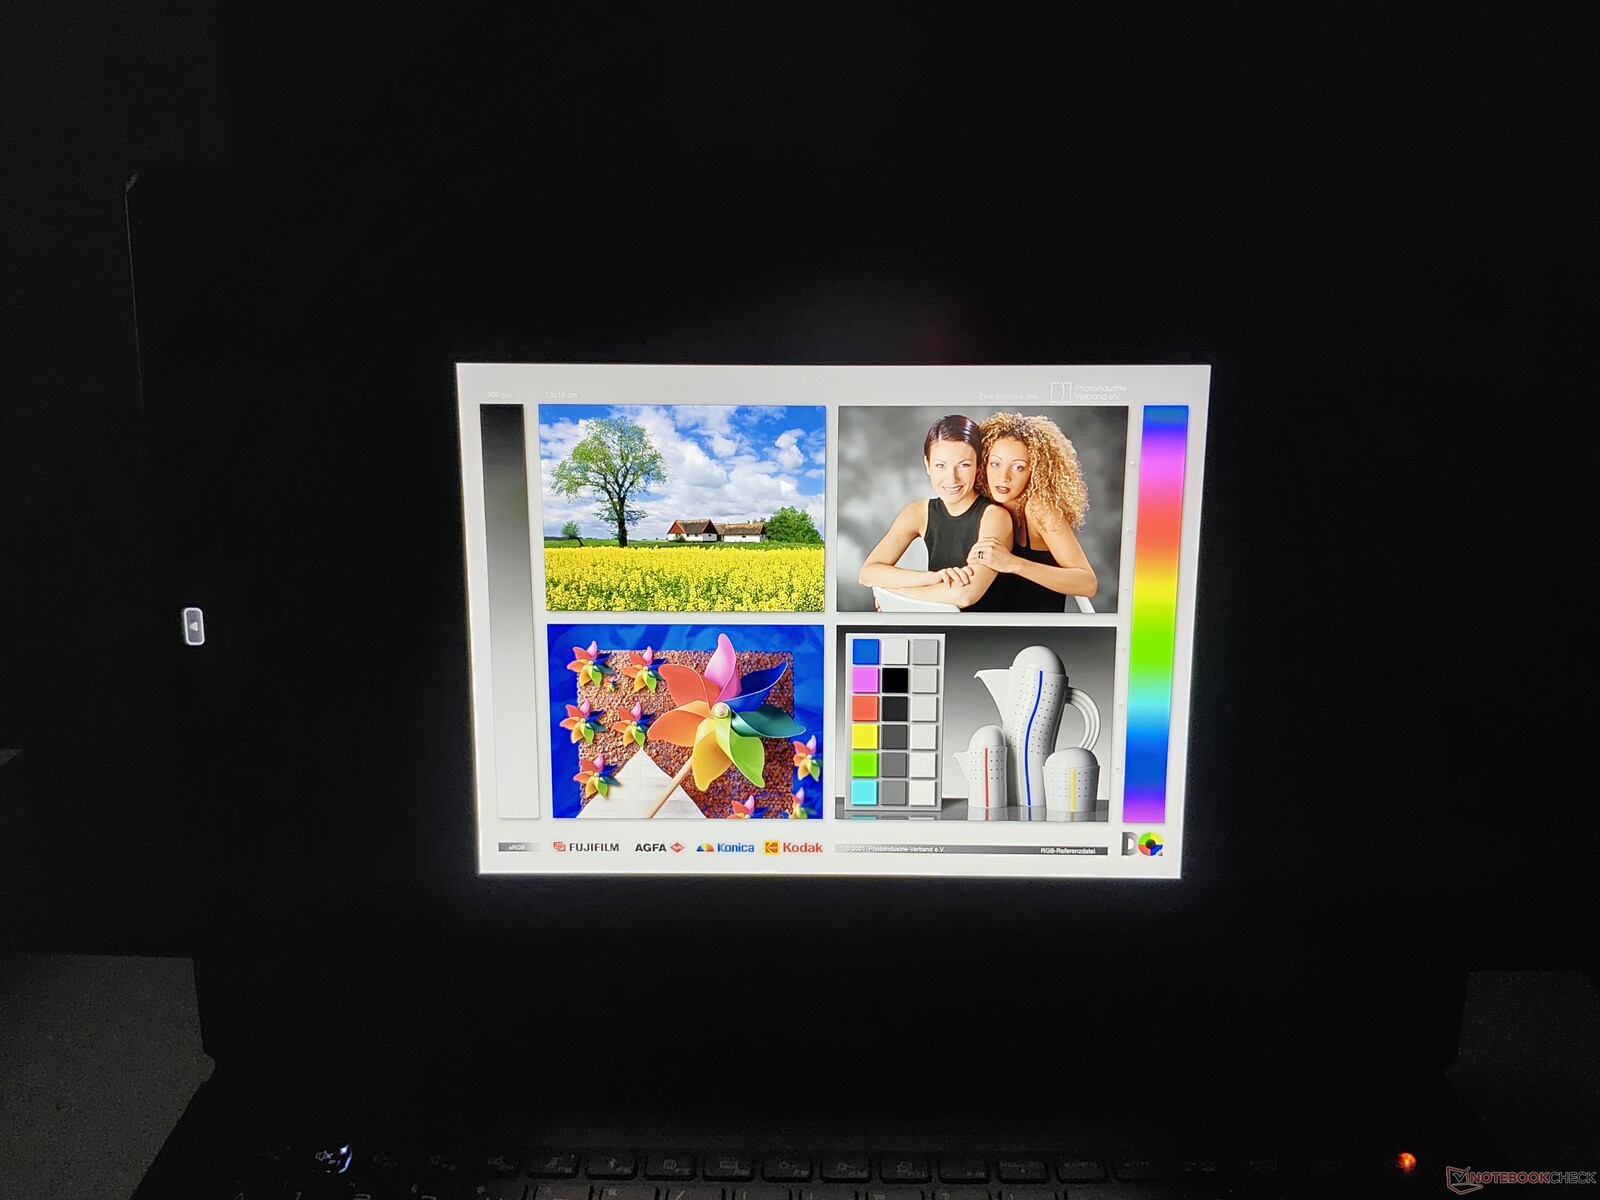
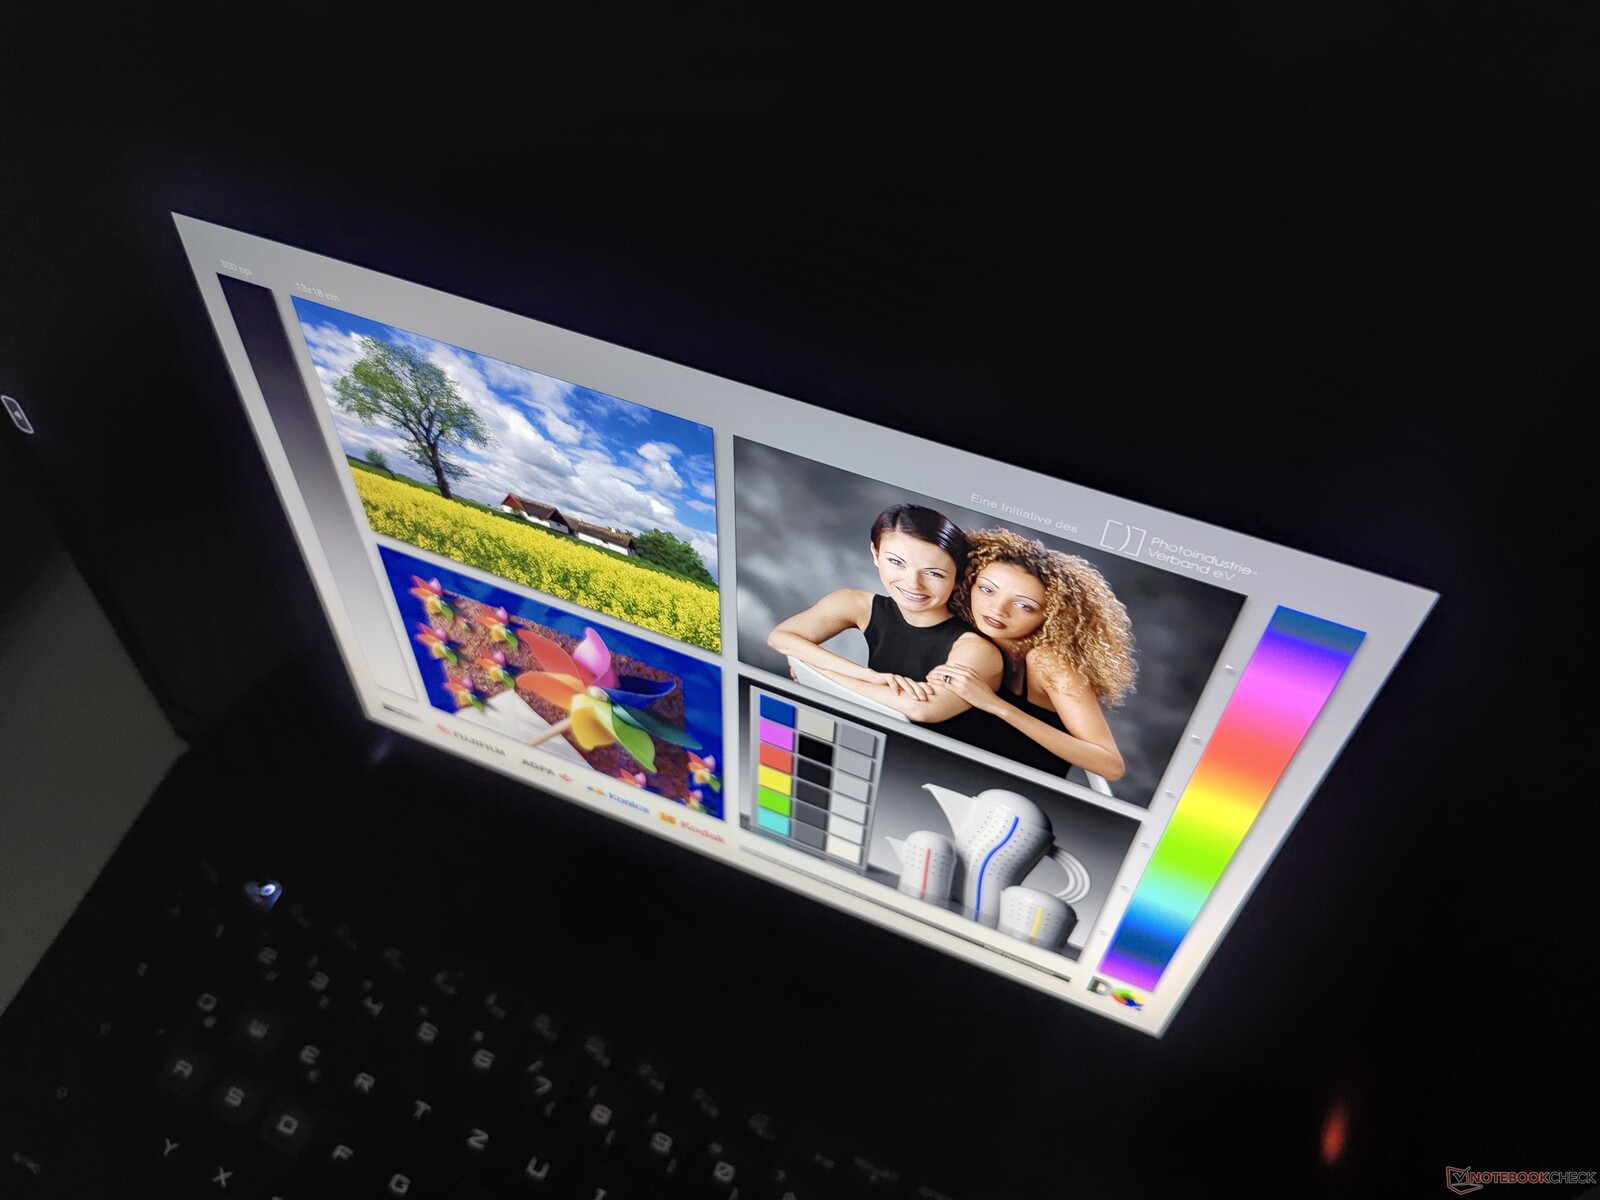
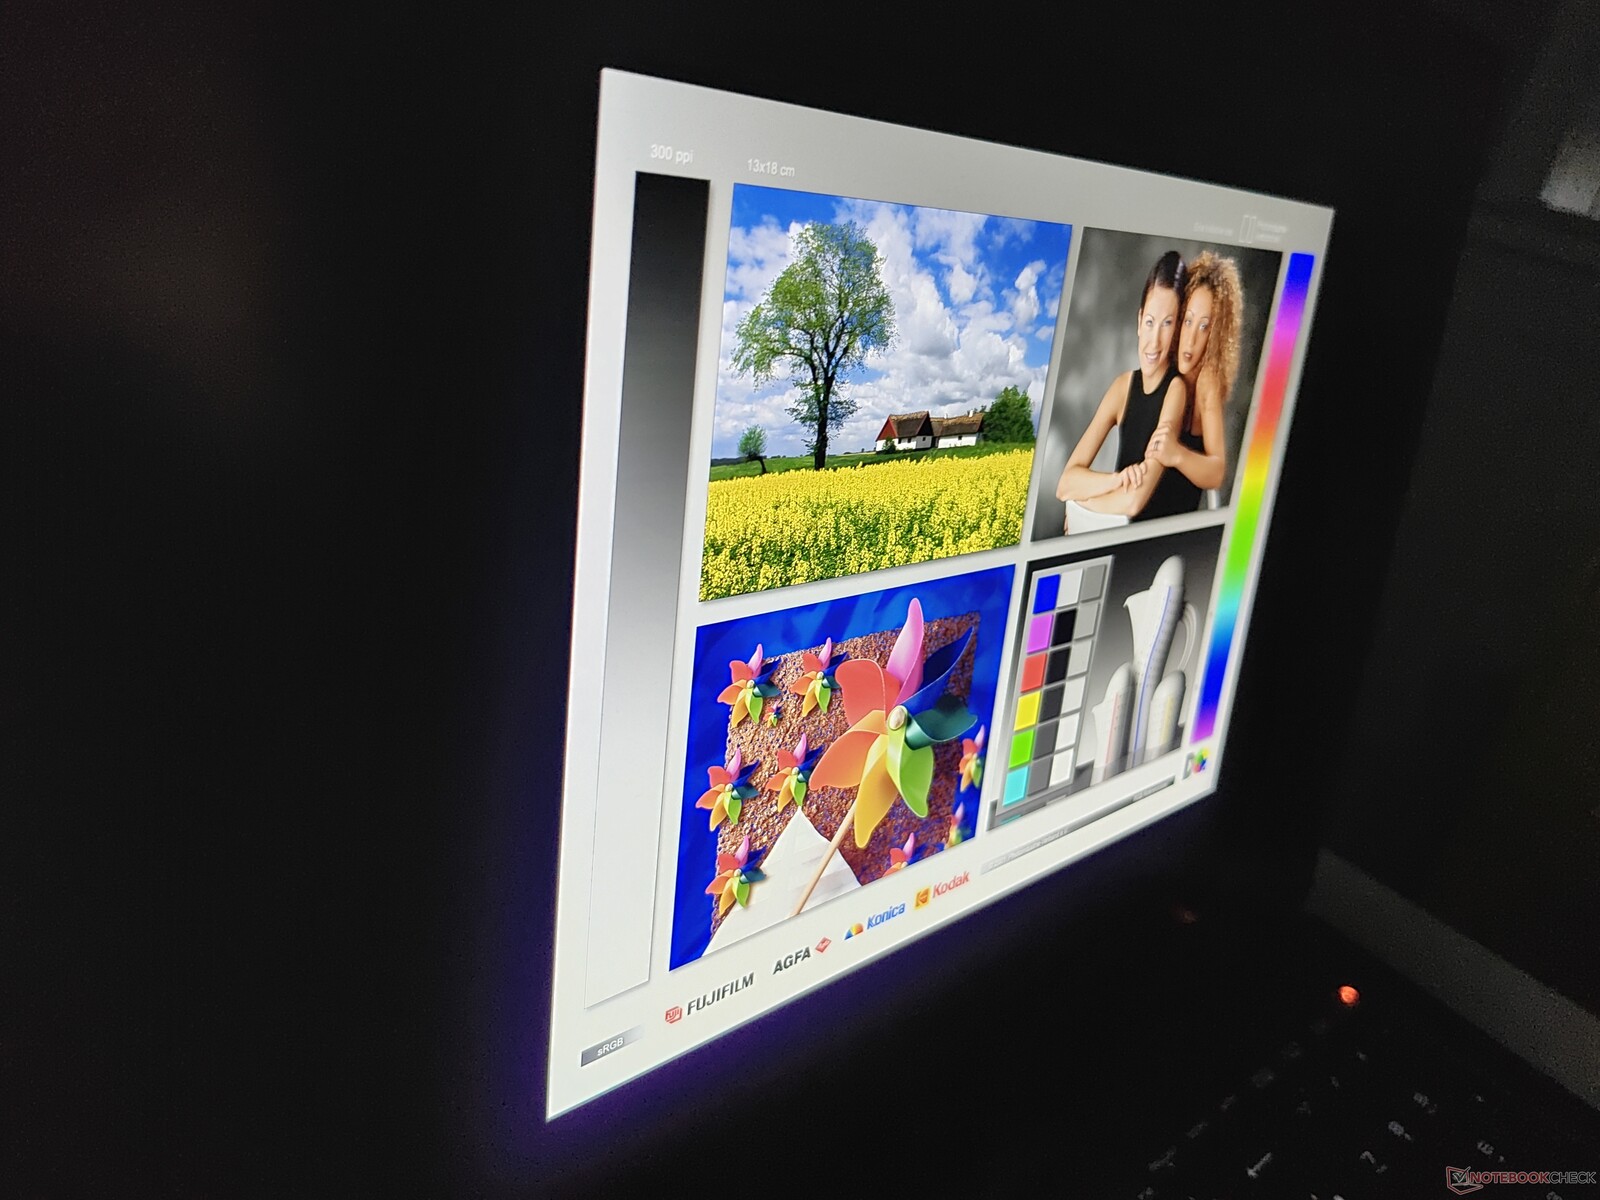
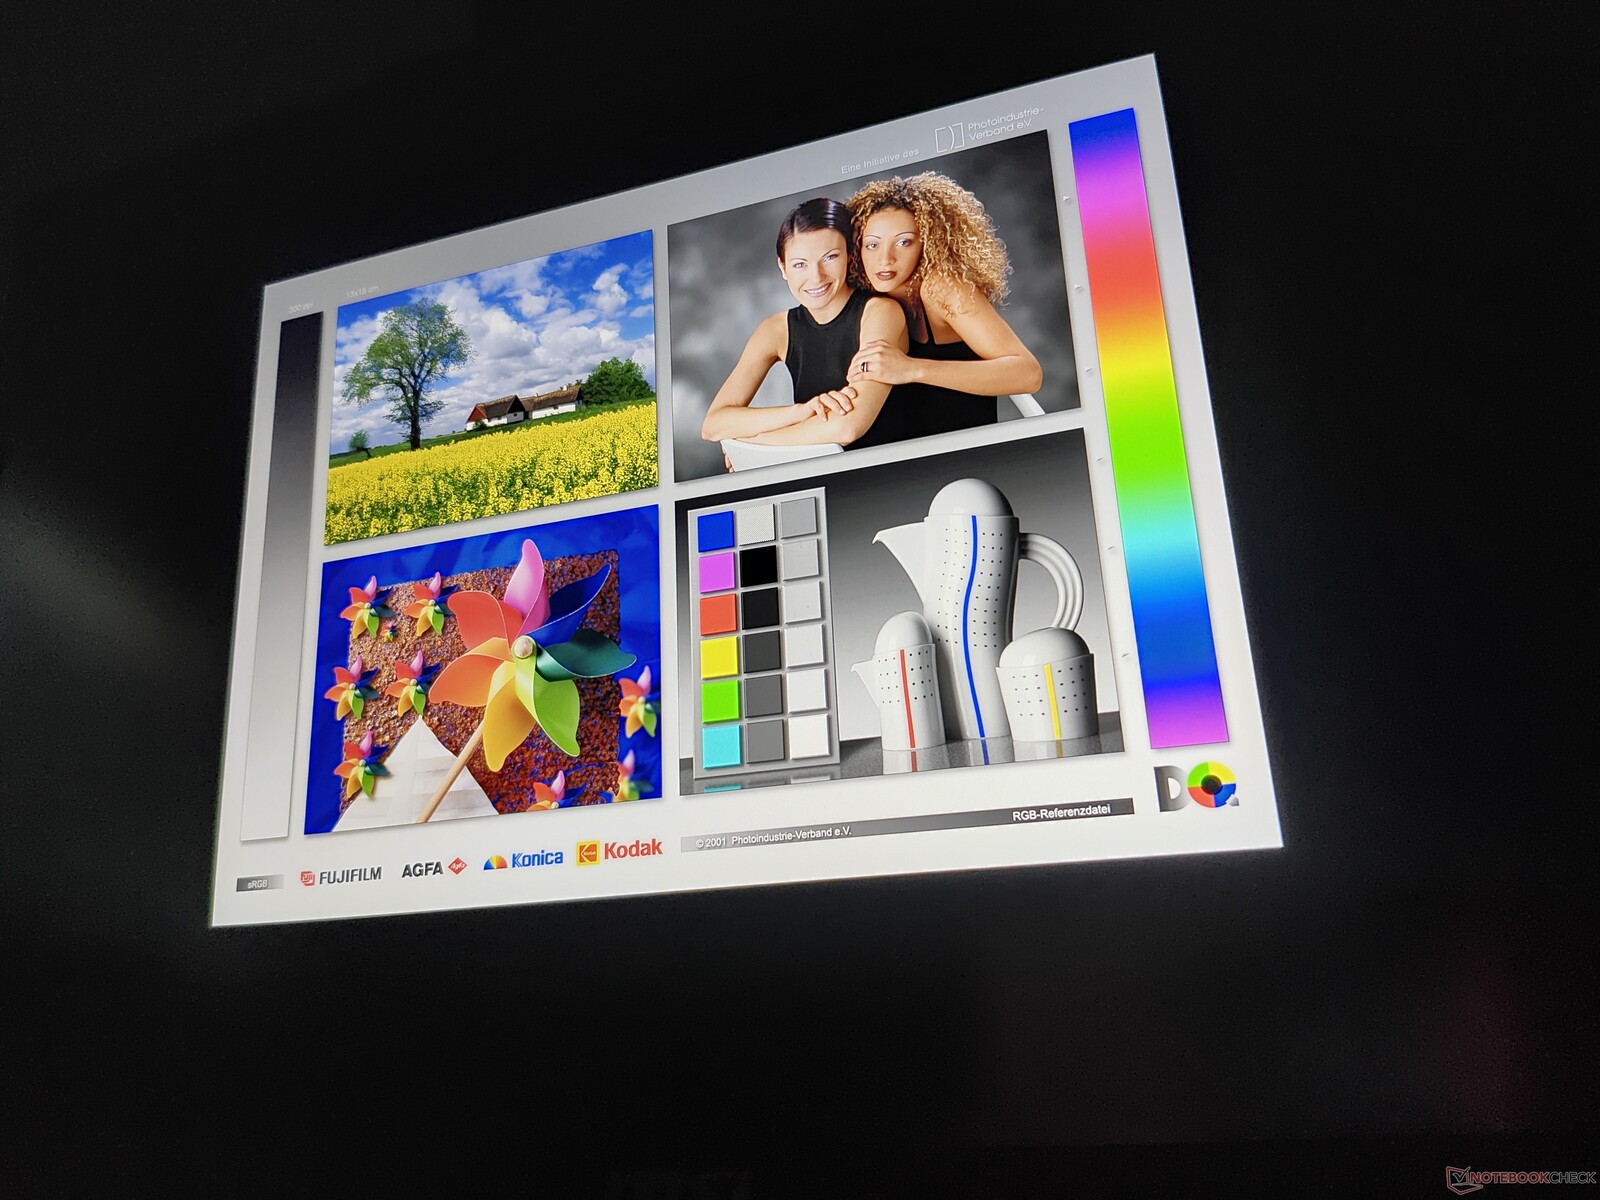
显示屏微星 Raider A18 HX 配备明亮的哑光 miniLED 屏幕
微星 Raider A18 HX 的规格列出了四种不同的屏幕,均为 16:10 宽高比的 18 英寸大小:
- WUXGA (1,920 x 1,200), IPS, 144 Hz
- WUXGA(1,920 x 1,200),IPS,165 Hz
- WQXGA / 2.5K (2,560 x 1,600), IPS, 240 Hz
- WQUXGA / 4K-UHD (3,840 x 2,400), miniLED, 120 Hz
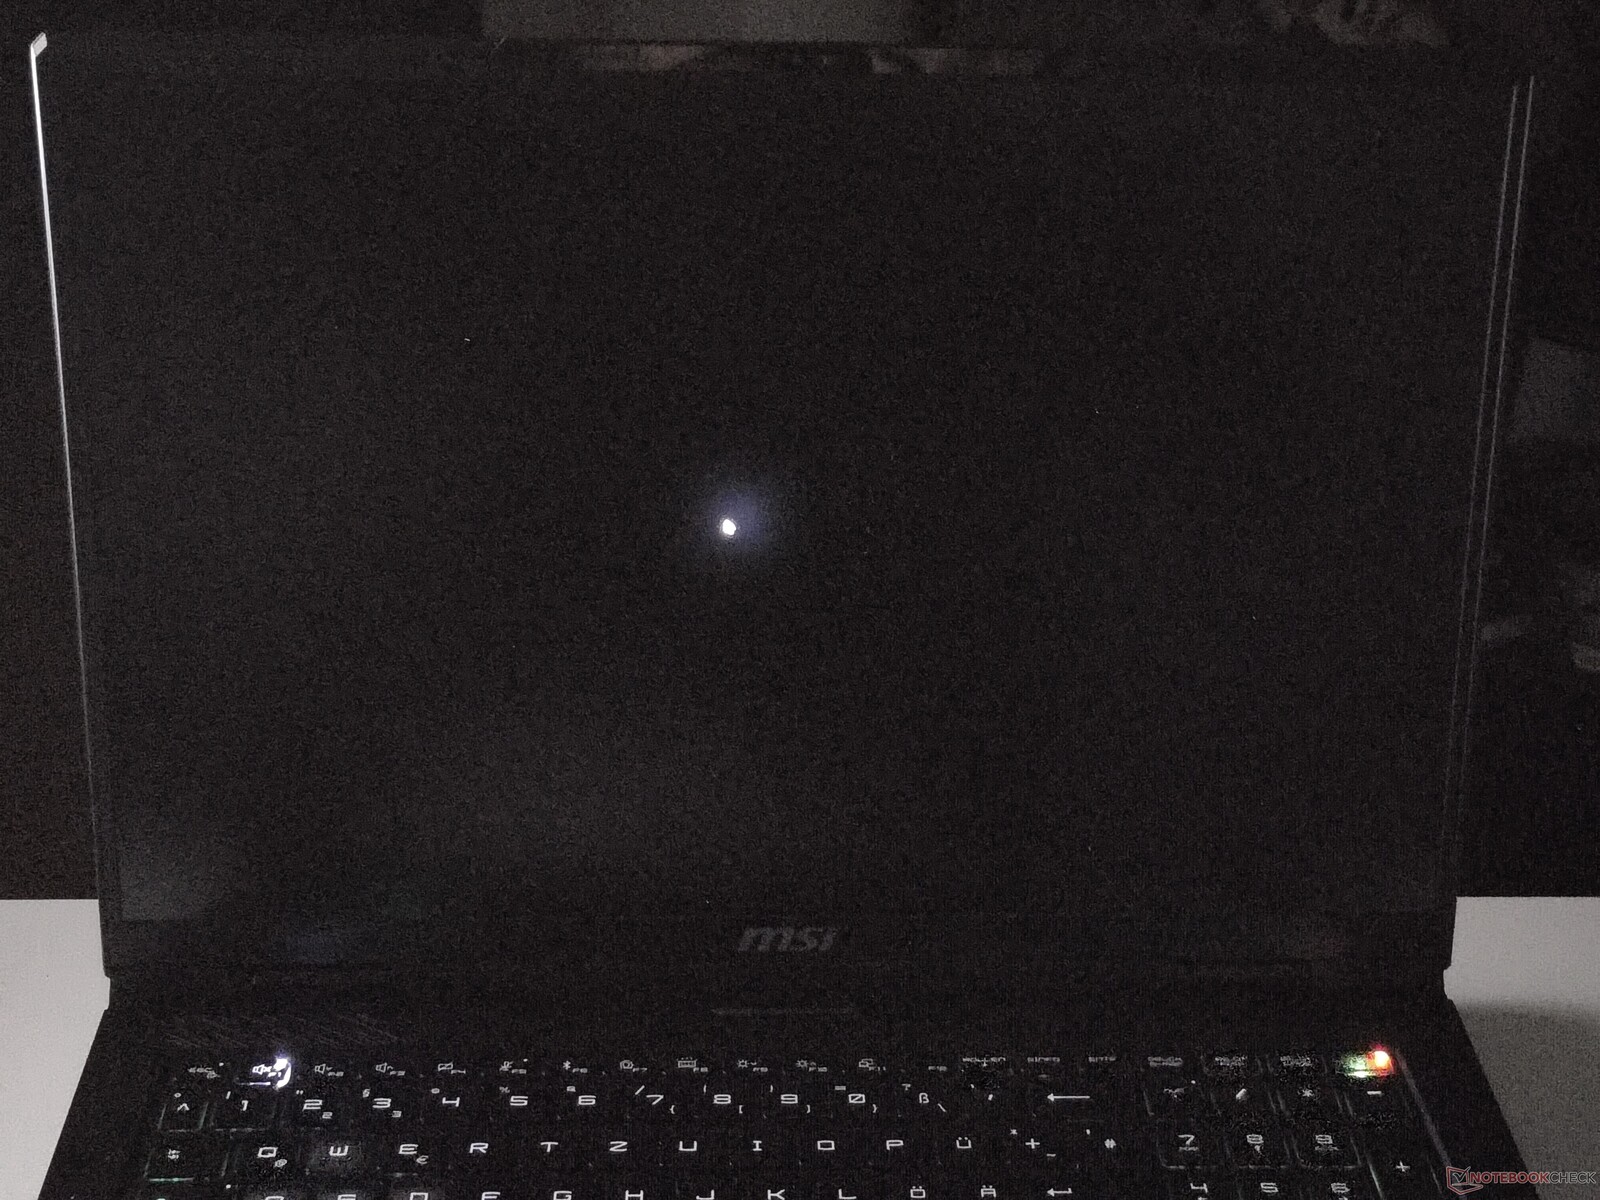
微星采用的是 AU Optotronics 生产的哑光屏幕。在 SDR 模式下使用时,屏幕亮度最高约为 500 cd/m²,而在 HDR 模式下,屏幕亮度则增至约 900 cd/m²。在 HDR 模式下,我们在显示屏中央测得的最高亮度为 889 cd/m²。
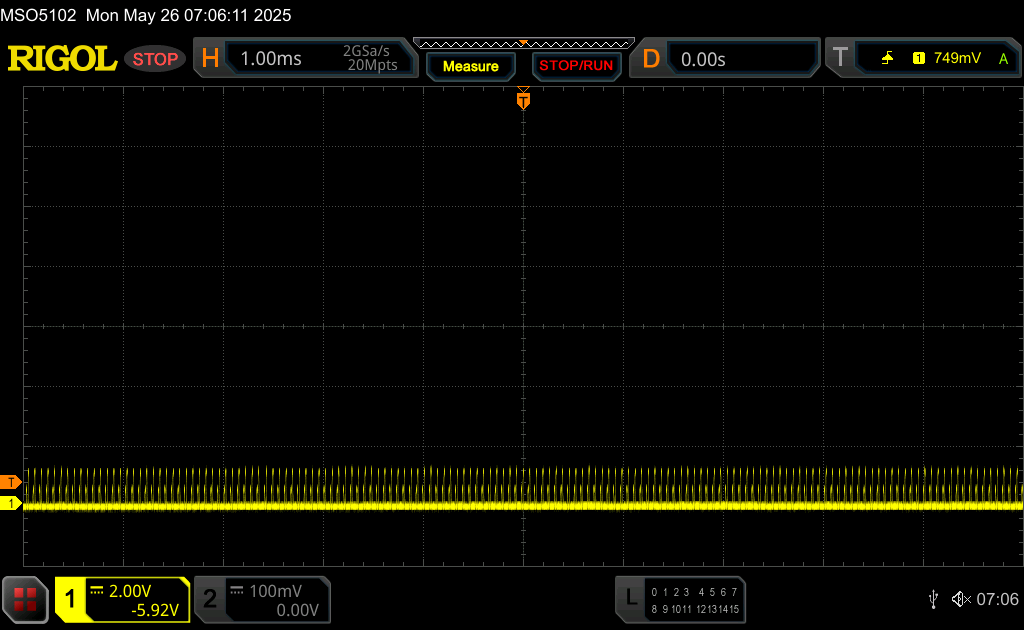
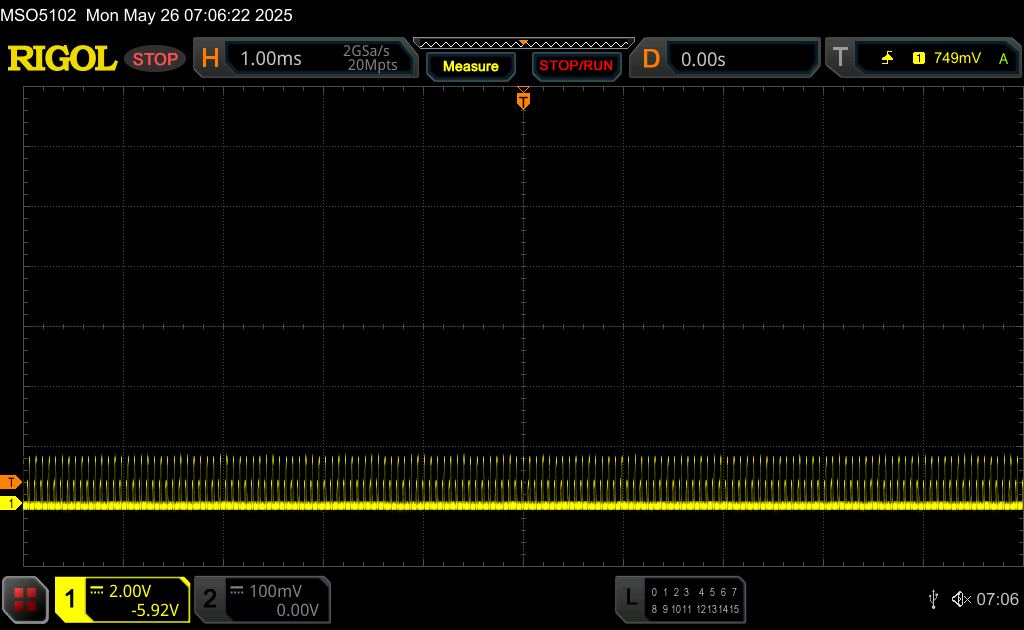
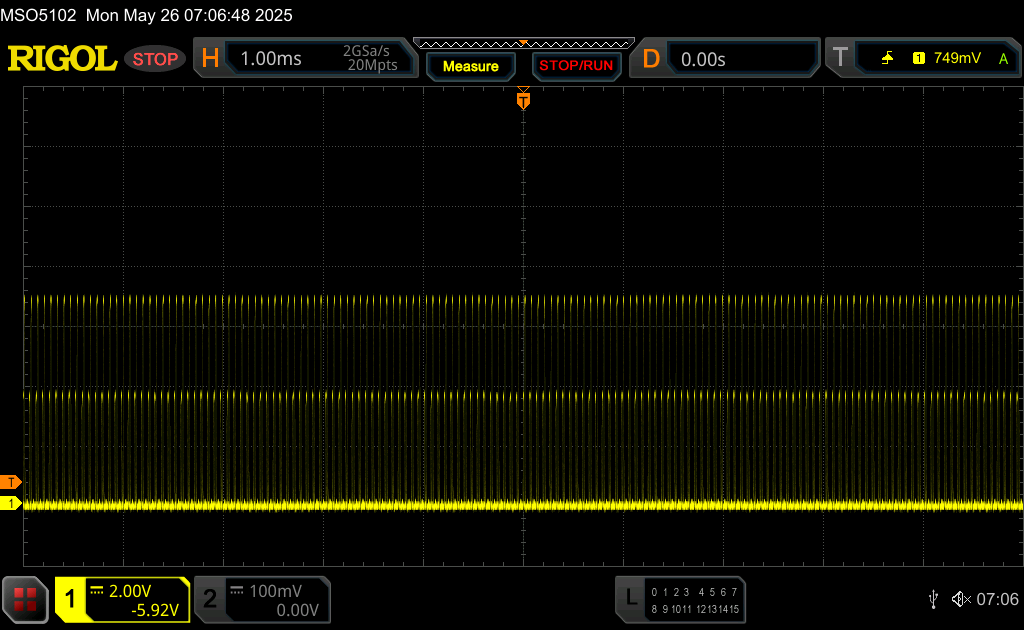
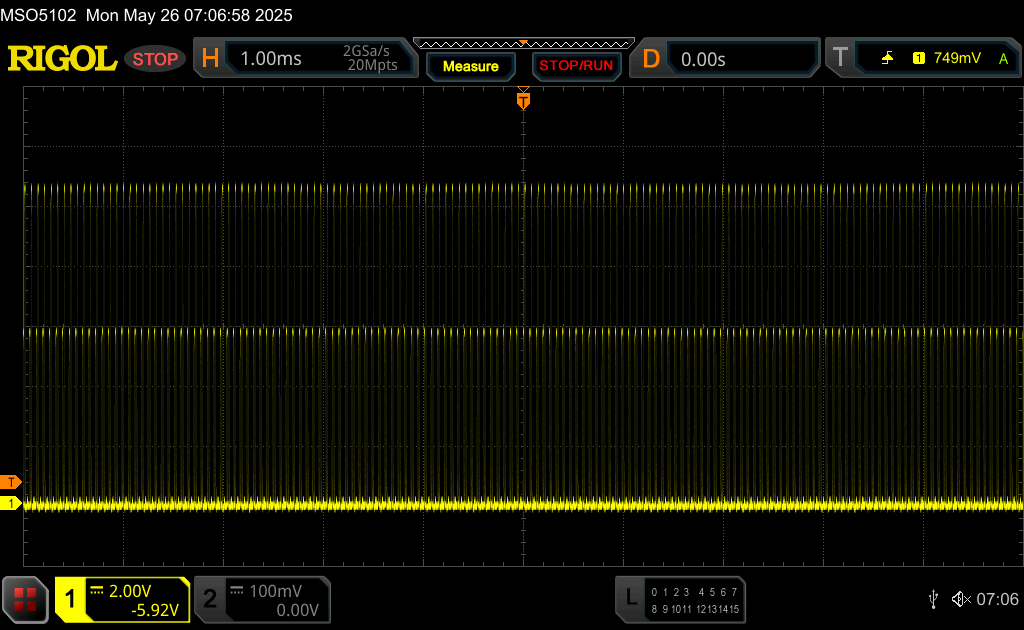
屏幕使用 PWM,但频率极高。尽管振幅非常高,但大多数用户应该不会受到这种高频率的影响。
| |||||||||||||||||||||||||
Brightness Distribution: 85 %
Center on Battery: 510 cd/m²
Contrast: 51000:1 (Black: 0.01 cd/m²)
ΔE ColorChecker Calman: 4.5 | ∀{0.5-29.43 Ø4.72}
calibrated: 5.7
ΔE Greyscale Calman: 2.3 | ∀{0.09-98 Ø4.97}
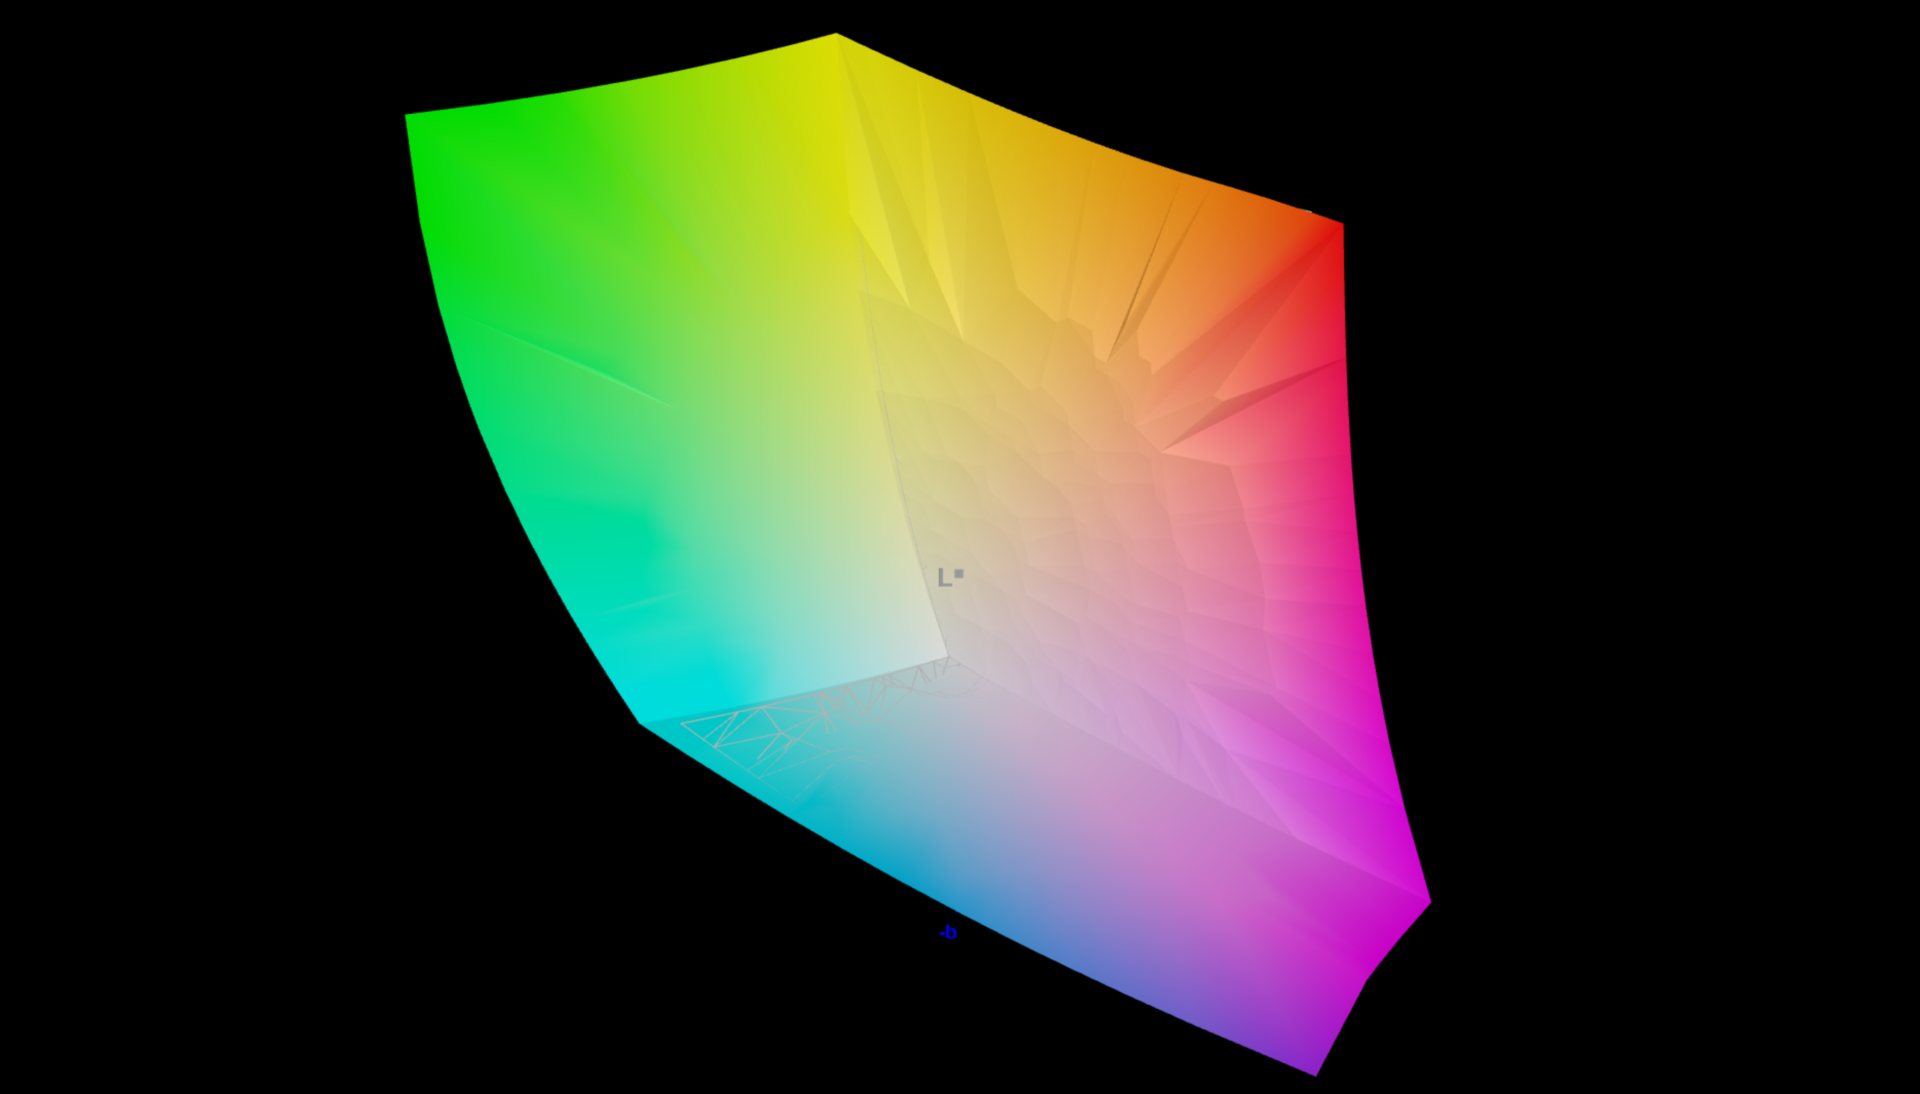
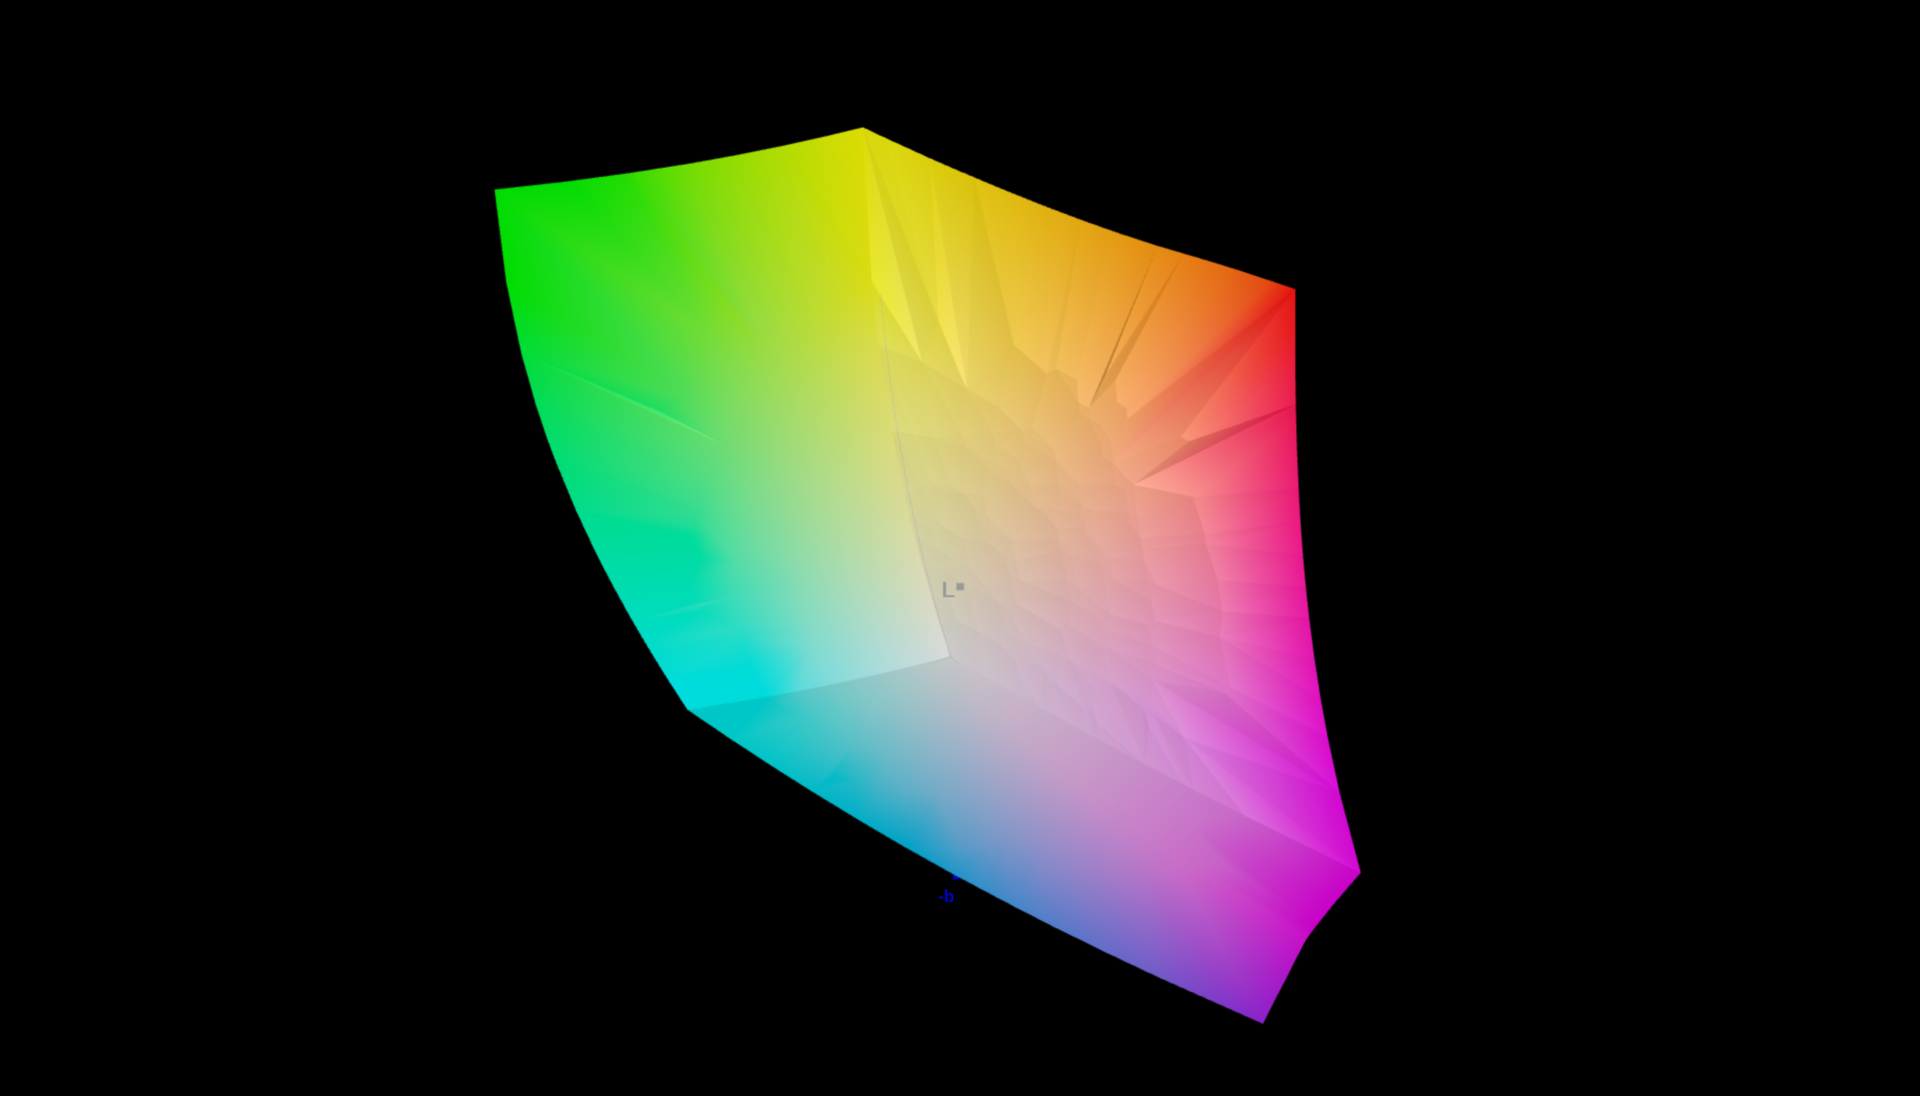
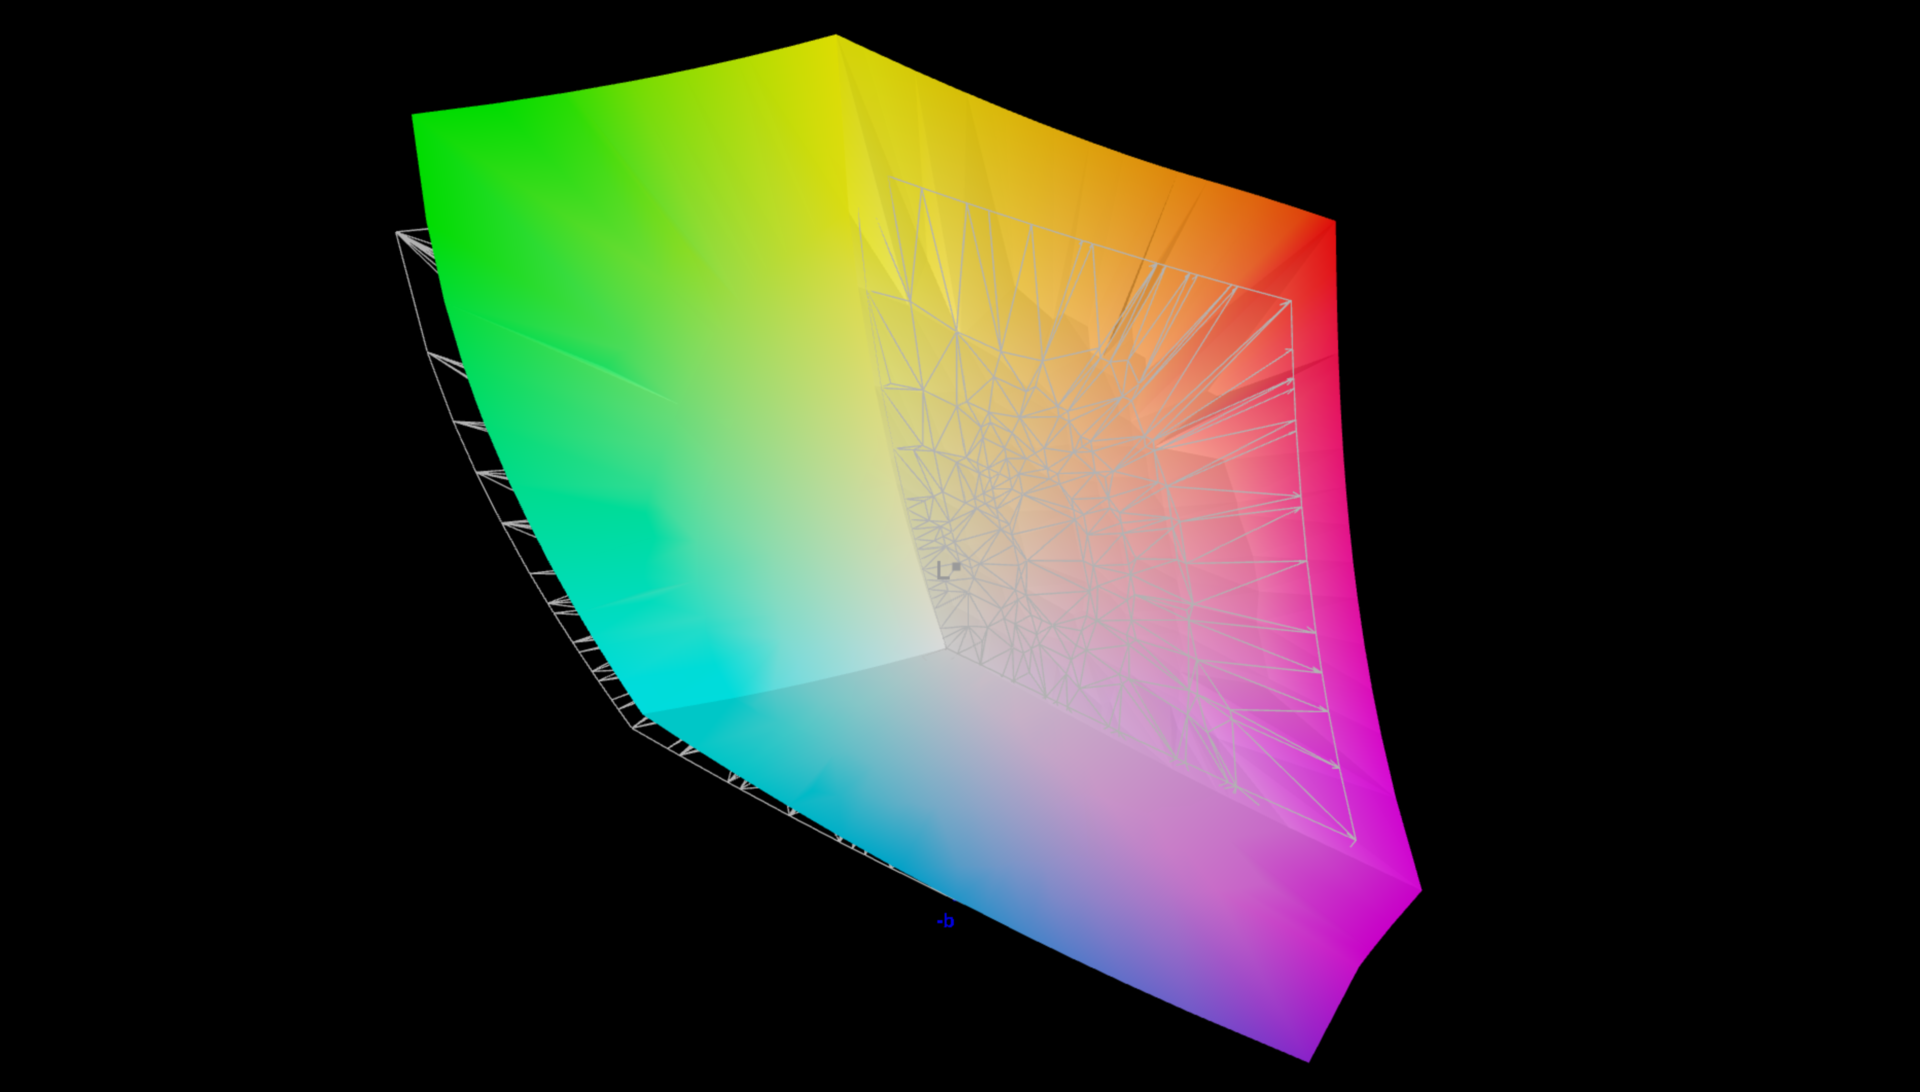
93.9% AdobeRGB 1998 (Argyll 3D)
100% sRGB (Argyll 3D)
99.9% Display P3 (Argyll 3D)
Gamma: 2.08
CCT: 6648 K
| MSI Raider A18 HX A9WIG-080 B180ZAN01.0, MiniLED IPS, 3840x2400, 18", 120 Hz | MSI Raider 18 HX A14V AU Optronics B180ZAN1.0, Mini-LED, 3840x2400, 18", 120 Hz | Medion Erazer Beast 18 X1 MD62731 BOEhydis NE180QDM-NZ2, IPS, 2560x1600, 18", 240 Hz | Aorus Master 18 AM8H NE180QDM-NM1 (BOE0C58), Mini-LED, 2560x1600, 18", 240 Hz | Asus Strix Scar 18 G835LX N180QDM-NM2, Mini-LED, 2560x1600, 18", 240 Hz | |
|---|---|---|---|---|---|
| Display | -4% | -4% | -2% | -3% | |
| Display P3 Coverage (%) | 99.9 | 96.6 -3% | 97.1 -3% | 99.9 0% | 99 -1% |
| sRGB Coverage (%) | 100 | 99.9 0% | 99.9 0% | 100 0% | 100 0% |
| AdobeRGB 1998 Coverage (%) | 93.9 | 84.8 -10% | 84.7 -10% | 87.7 -7% | 87.2 -7% |
| Response Times | -112% | 64% | 25% | 33% | |
| Response Time Grey 50% / Grey 80% * (ms) | 23 ? | 10.4 ? 55% | 5.6 ? 76% | 16.4 ? 29% | 7.4 ? 68% |
| Response Time Black / White * (ms) | 15.1 ? | 75.8 ? -402% | 7.3 ? 52% | 8.1 ? 46% | 10.4 ? 31% |
| PWM Frequency (Hz) | 15203 | 2606.2 ? | 1398 ? | 20610 ? | |
| PWM Amplitude * (%) | 100 | 90 10% | 100 -0% | 100 -0% | |
| Screen | -6% | -451% | -147% | -87% | |
| Brightness middle (cd/m²) | 510 | 575.7 13% | 478 -6% | 438 -14% | 764 50% |
| Brightness (cd/m²) | 470 | 574 22% | 456 -3% | 451 -4% | 747 59% |
| Brightness Distribution (%) | 85 | 94 11% | 89 5% | 90 6% | 93 9% |
| Black Level * (cd/m²) | 0.01 | 0.4 -3900% | 0.13 -1200% | 0.1 -900% | |
| Contrast (:1) | 51000 | 1195 -98% | 3369 -93% | 7640 -85% | |
| Colorchecker dE 2000 * | 4.5 | 3.56 21% | 3.94 12% | 1.25 72% | 1.2 73% |
| Colorchecker dE 2000 max. * | 7.3 | 8.64 -18% | 8.6 -18% | 4.93 32% | 2.8 62% |
| Colorchecker dE 2000 calibrated * | 5.7 | 2.69 53% | 0.75 87% | ||
| Greyscale dE 2000 * | 2.3 | 5.6 -143% | 5.5 -139% | 1.7 26% | 1.5 35% |
| Gamma | 2.08 106% | 2.34 94% | 2.212 99% | 2.173 101% | 2.17 101% |
| CCT | 6648 98% | 7872 83% | 7059 92% | 6518 100% | 6556 99% |
| Total Average (Program / Settings) | -41% /
-30% | -130% /
-282% | -41% /
-79% | -19% /
-43% |
* ... smaller is better
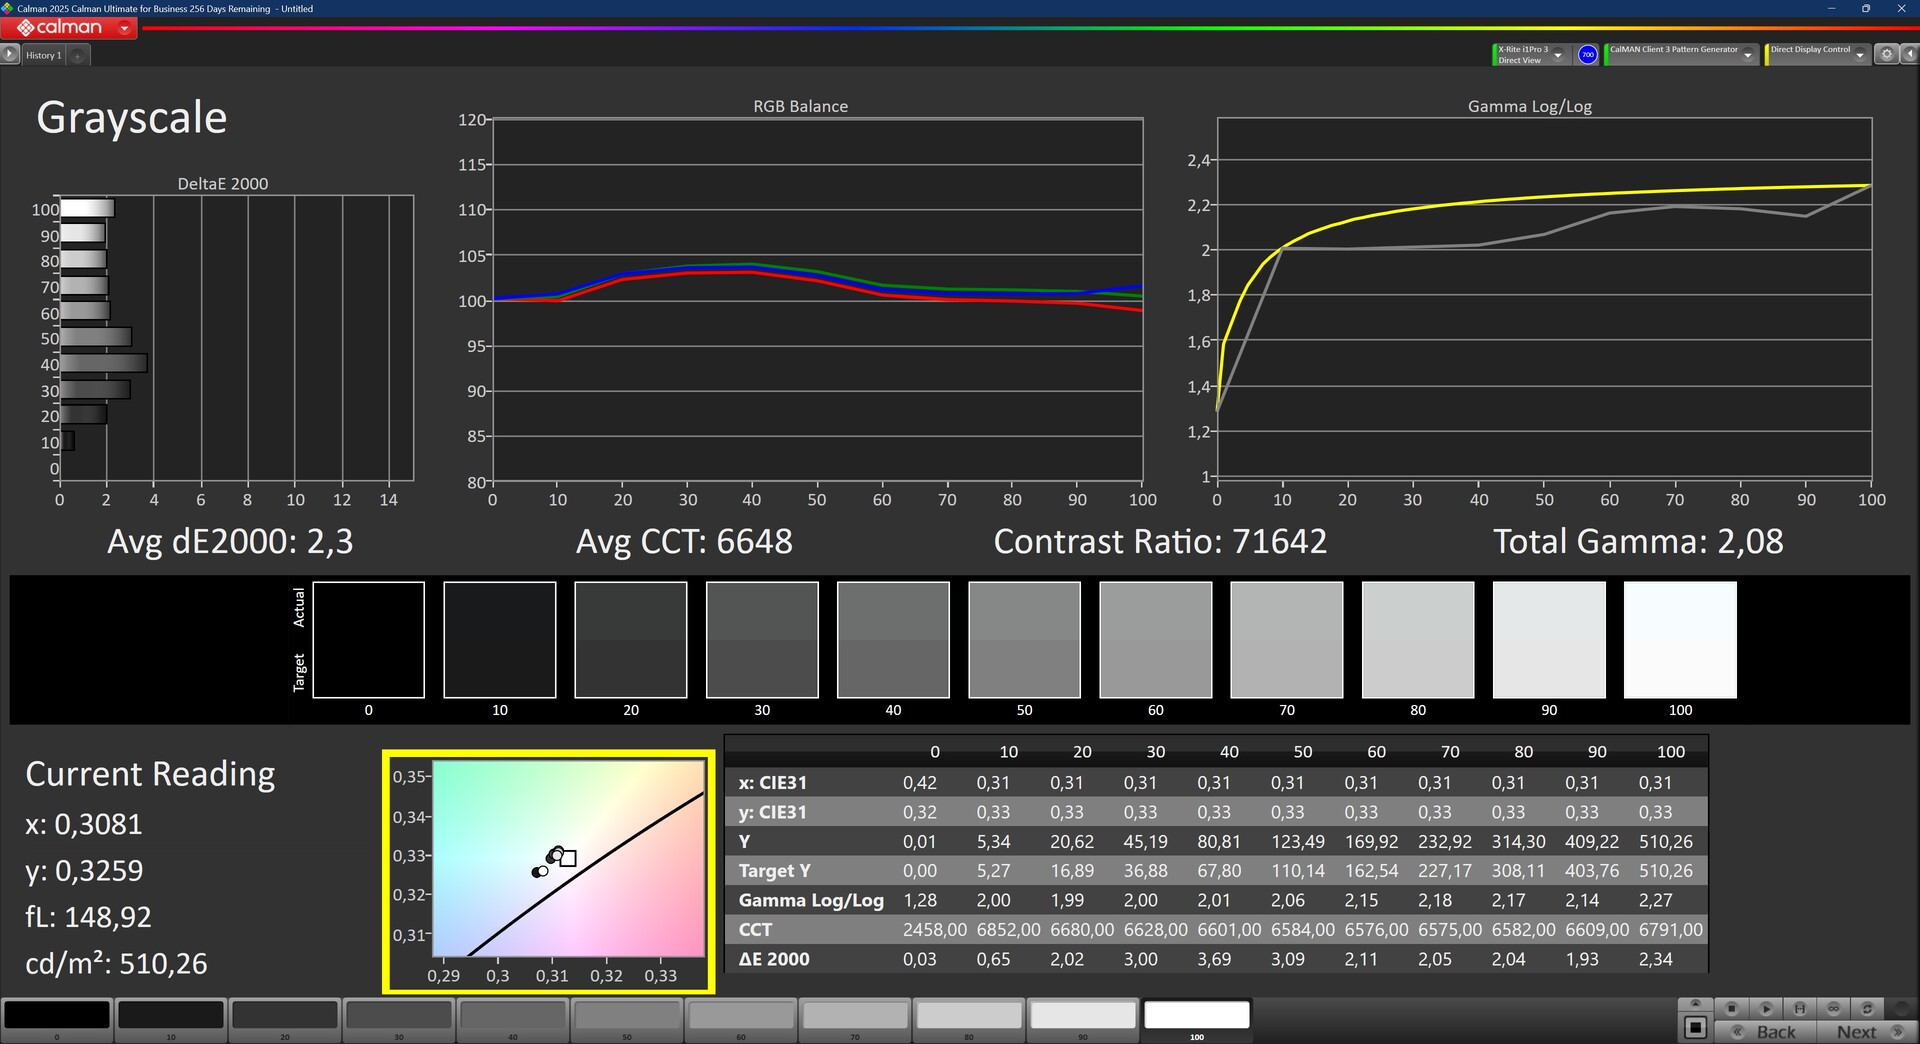

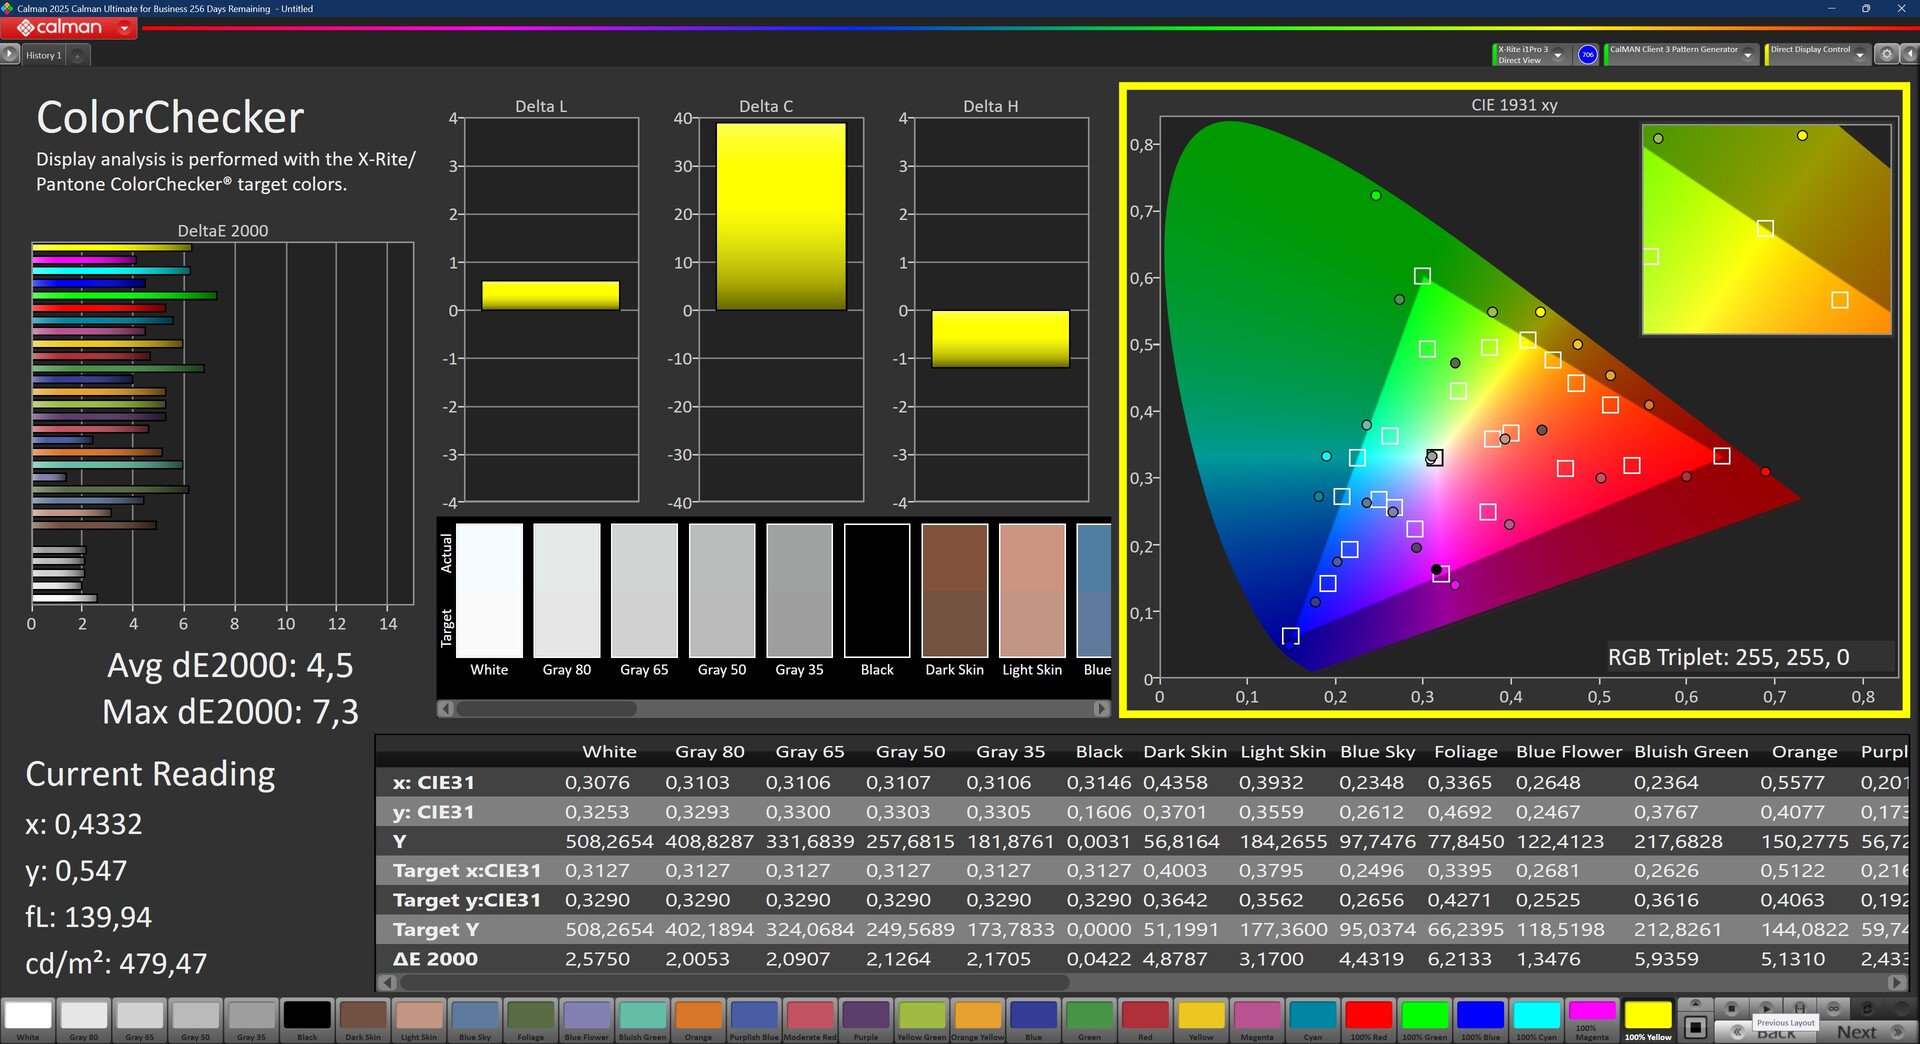
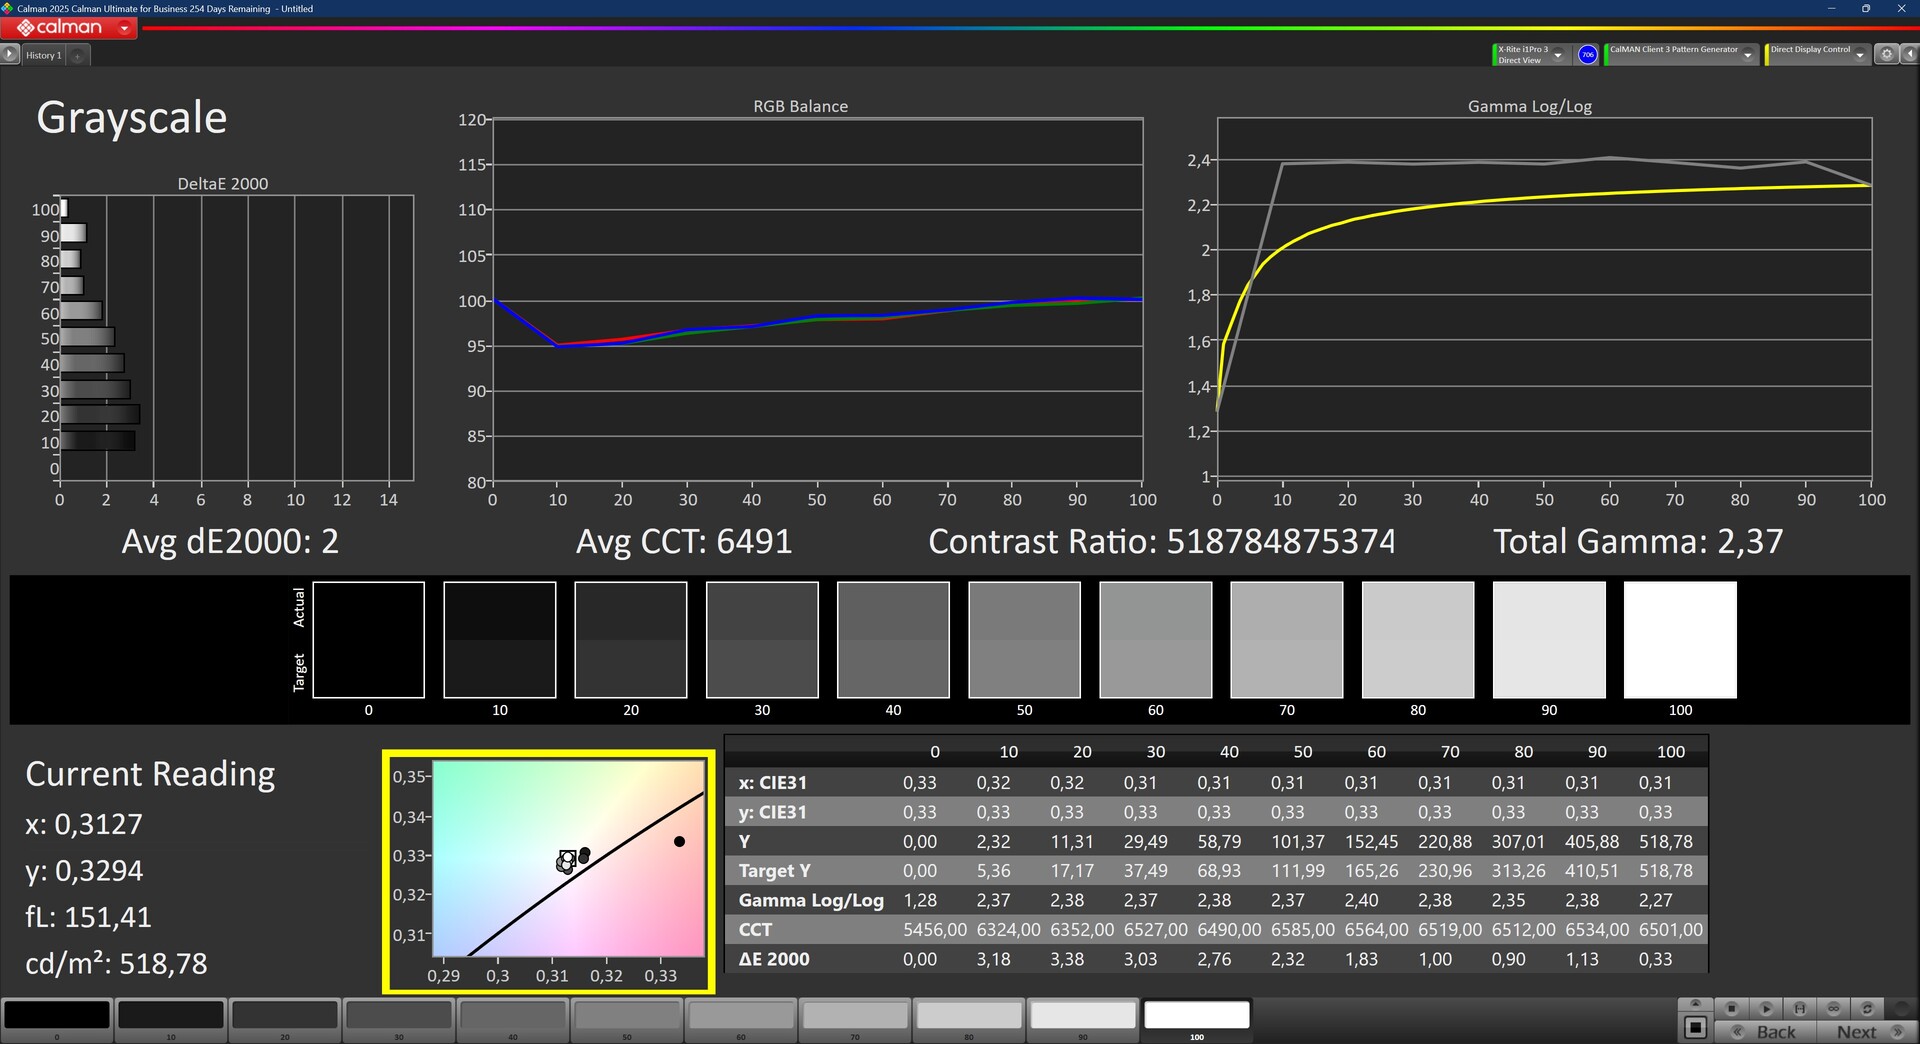
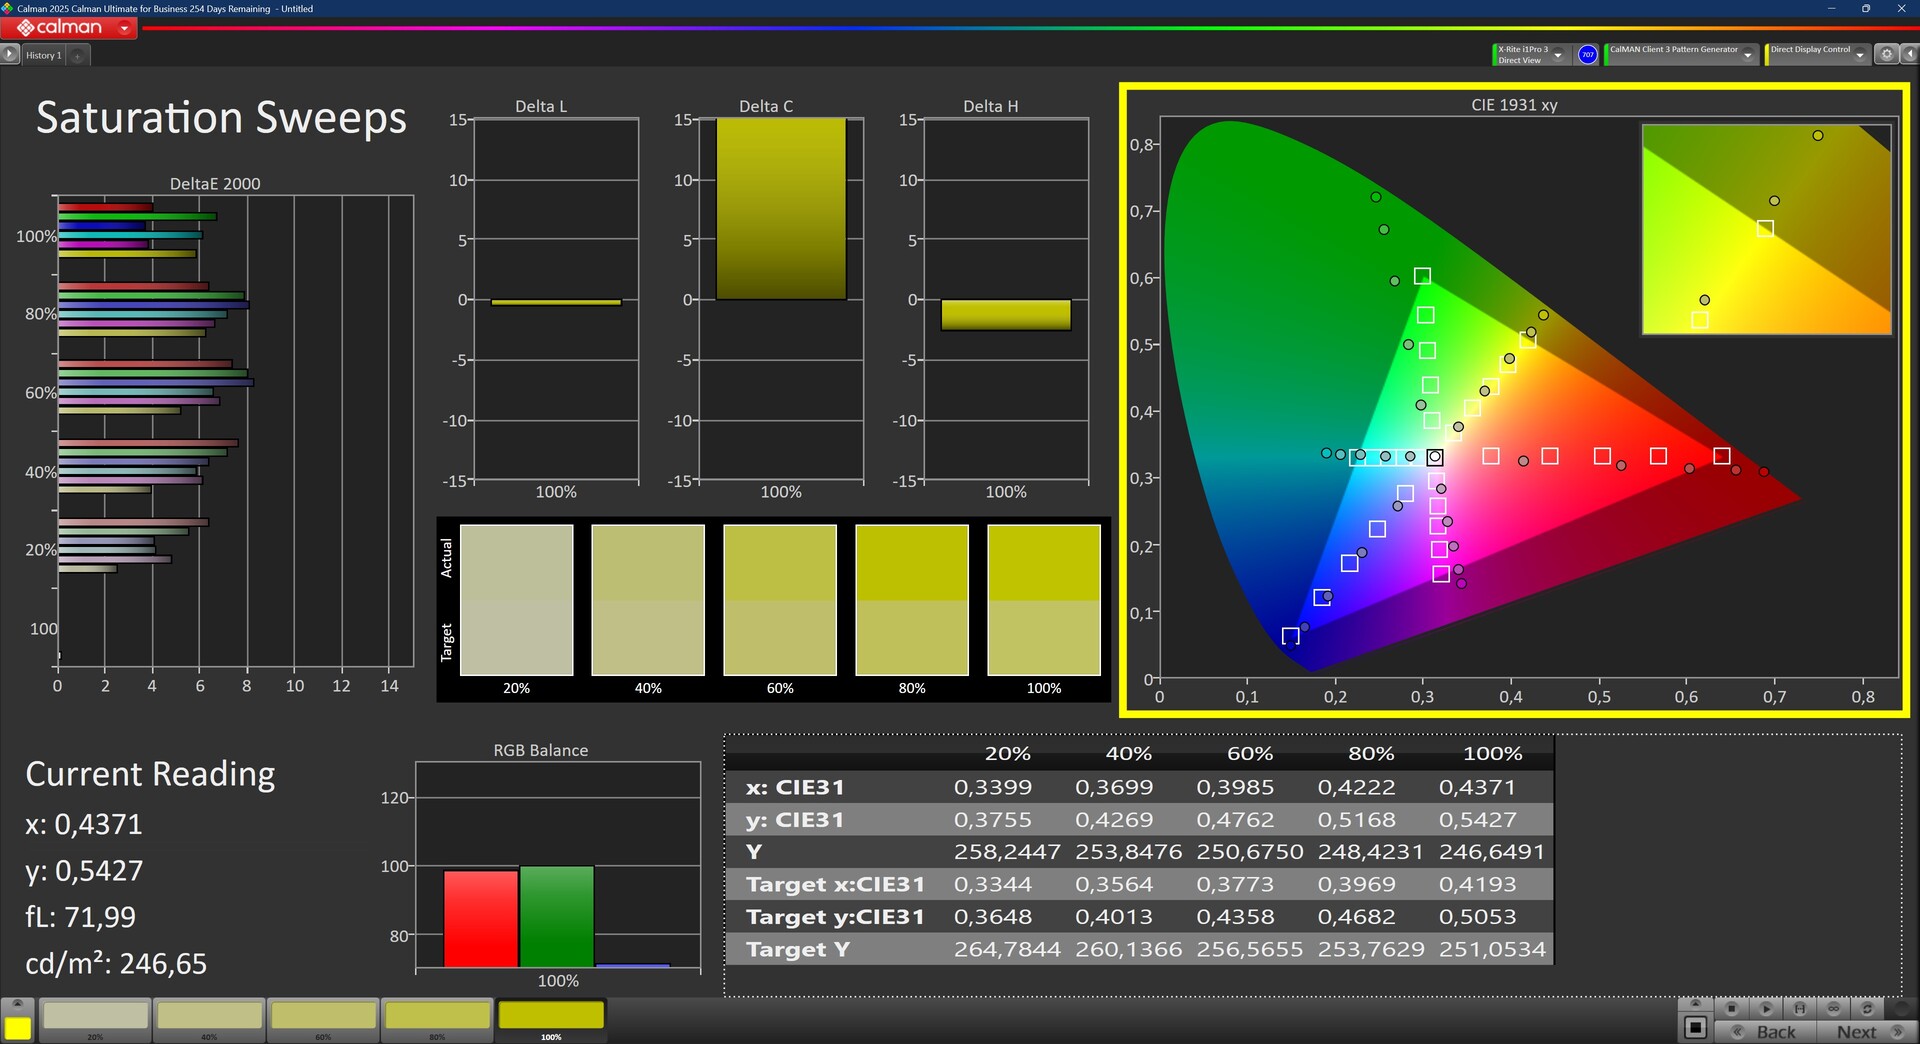

微星有一个色彩模式选择器,我们选择了 sRGB 模式进行测量。遗憾的是,即使经过校准,色彩也不是很准确。
屏幕的色域覆盖范围很大。sRGB 和 DCI P3 色域都完全覆盖,因此该屏幕适合一些对色彩要求较高的工作。
从外观上看,即使在 SDR 模式下,屏幕也是可用的。高亮度和磨砂表面的完美结合。
Display Response Times
| ↔ Response Time Black to White | ||
|---|---|---|
| 15.1 ms ... rise ↗ and fall ↘ combined | ↗ 8.6 ms rise | 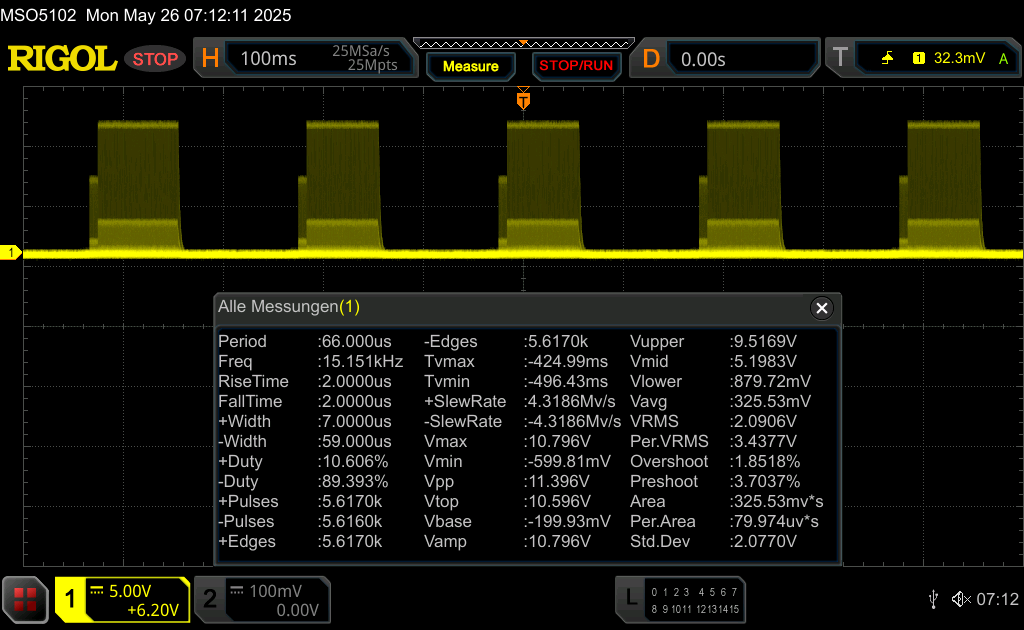 |
| ↘ 6.6 ms fall | ||
| The screen shows good response rates in our tests, but may be too slow for competitive gamers. In comparison, all tested devices range from 0.1 (minimum) to 240 (maximum) ms. » 36 % of all devices are better. This means that the measured response time is better than the average of all tested devices (19.8 ms). | ||
| ↔ Response Time 50% Grey to 80% Grey | ||
| 23 ms ... rise ↗ and fall ↘ combined | ↗ 12.4 ms rise | 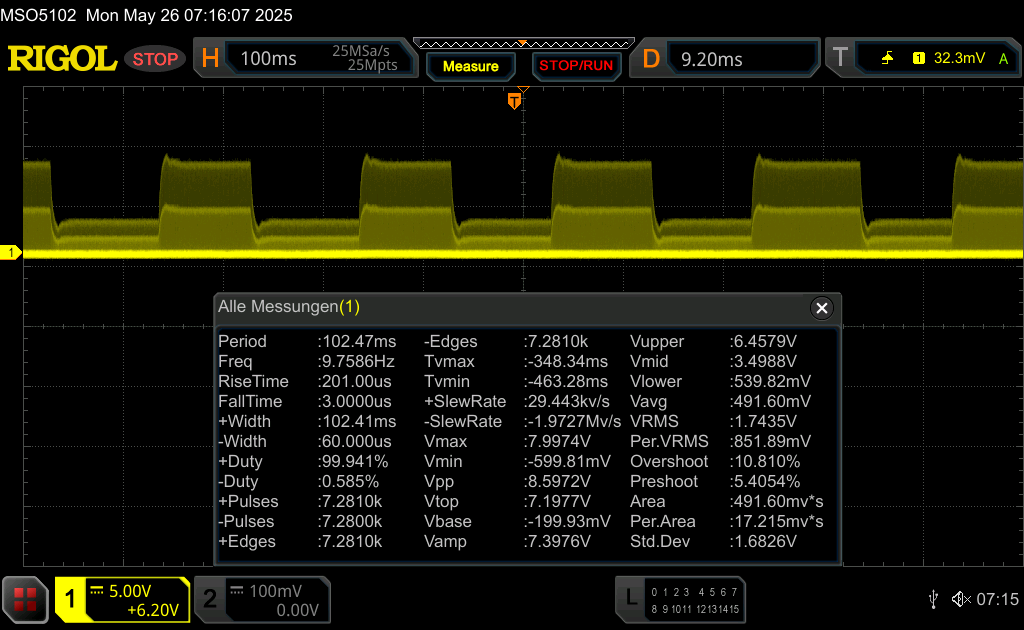 |
| ↘ 10.6 ms fall | ||
| The screen shows good response rates in our tests, but may be too slow for competitive gamers. In comparison, all tested devices range from 0.165 (minimum) to 636 (maximum) ms. » 34 % of all devices are better. This means that the measured response time is better than the average of all tested devices (31 ms). | ||
Screen Flickering / PWM (Pulse-Width Modulation)
| Screen flickering / PWM detected | 15203 Hz Amplitude: 100 % |  | |
The display backlight flickers at 15203 Hz (worst case, e.g., utilizing PWM) . The frequency of 15203 Hz is quite high, so most users sensitive to PWM should not notice any flickering. In comparison: 52 % of all tested devices do not use PWM to dim the display. If PWM was detected, an average of 7750 (minimum: 5 - maximum: 343500) Hz was measured. | |||

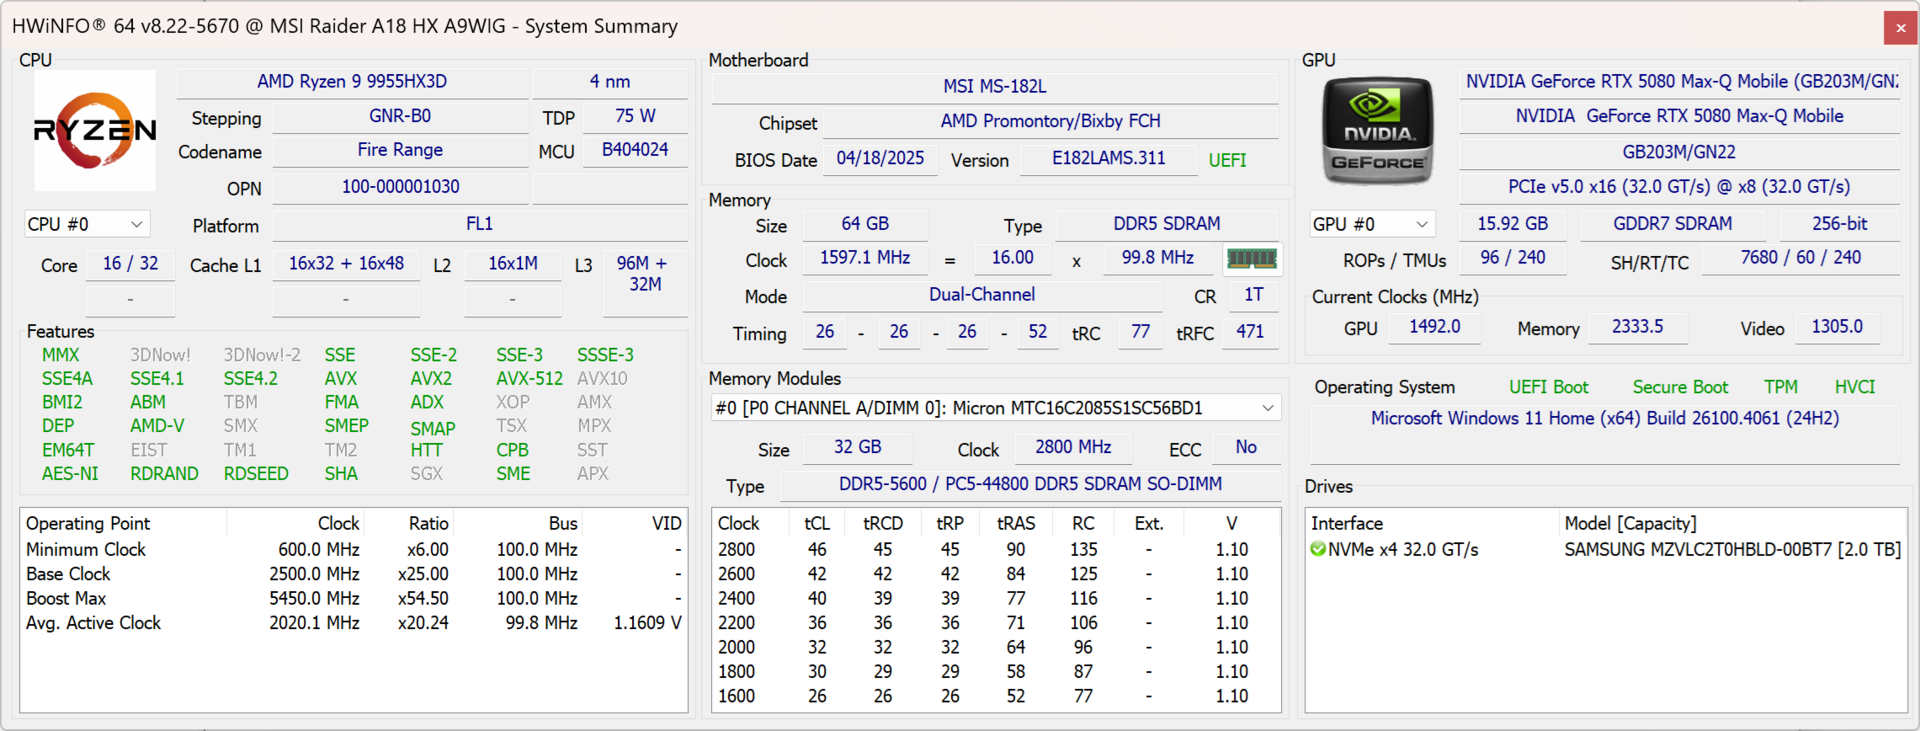
性能AMD Fire Range 与英特尔 Arrow Lake HX 性能相当,但功耗更低
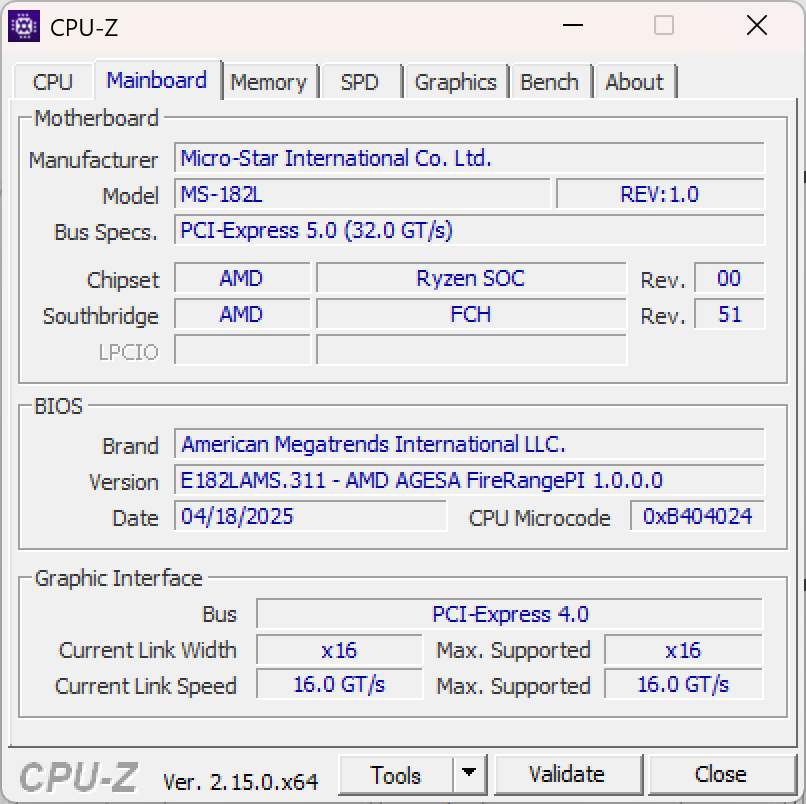
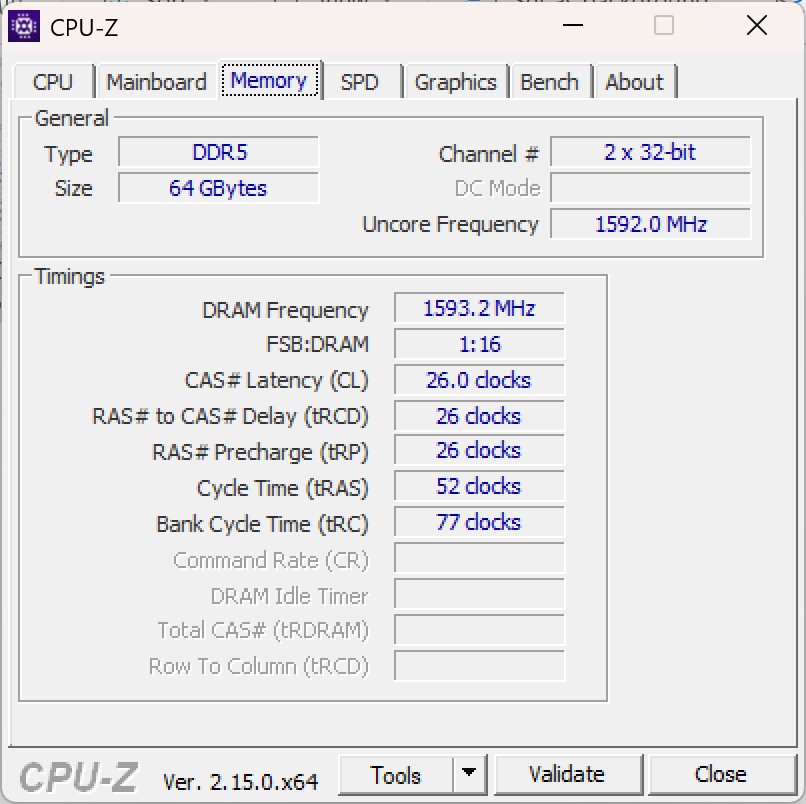
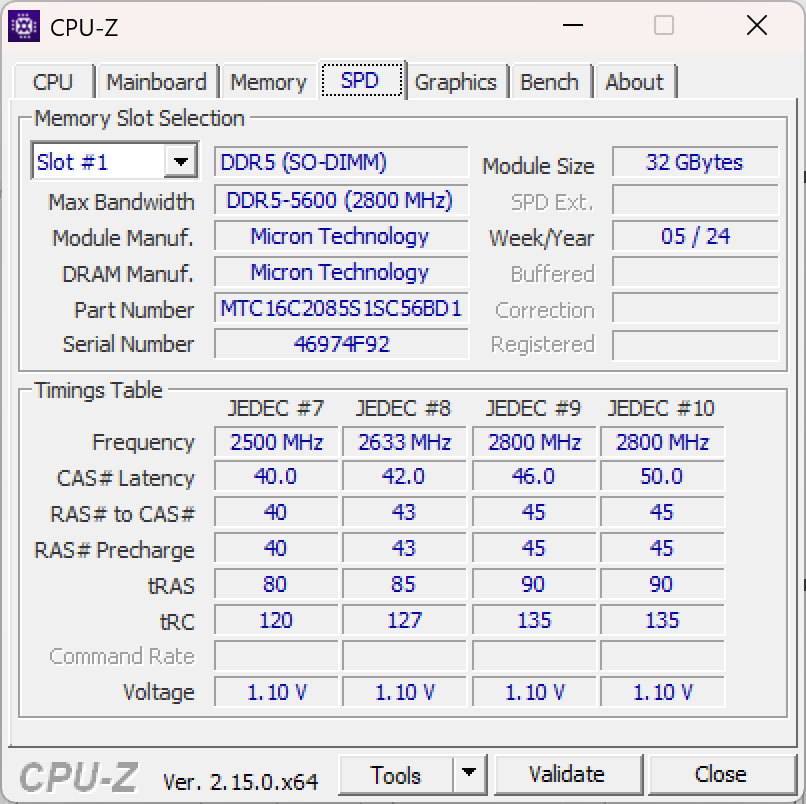
微星 Raider A18 HX 的 AMD 版本仅配备了 AMD Ryzen 9 9955HX3D.可用的专用 GPU 包括 英伟达GeForce RTX 5080和 GeForce RTX 5090.内存方面,有两个 SO-DIMM 插槽,可提供高达 96 GB 的 DDR5-5600 内存。有一个用于固态硬盘的 M.2 2280 插槽,微星提供高达 2 TB 的容量。
测试条件
电源配置文件可通过微星中心应用程序进行管理。下列配置文件可影响 CPU 功耗限制(PL1/CPU 持续功耗、PL2/CPU 最大功耗)以及 GPU TGP(图形总功耗):
- ECO-Silent 静音:PL1 30 W / PL2 30 W| TGP 85 W
- 平衡:PL1 72 W / PL2 72 W| TGP 105 W
- 极致性能:PL1 130 W / PL2 130 W| TGP 165 W
我们在 "极限性能 "模式下执行了所有基准测试。
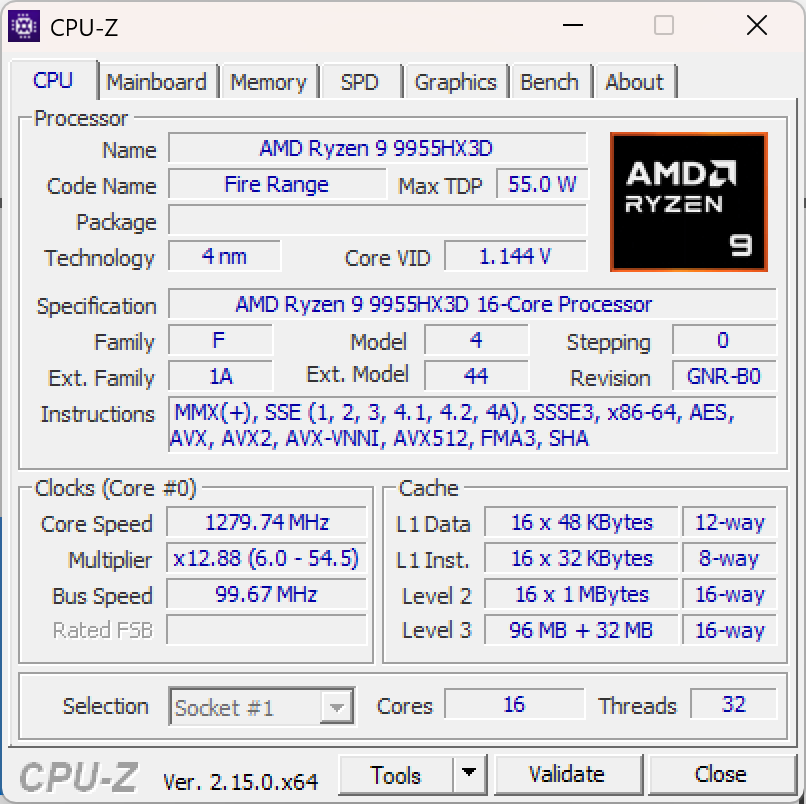
处理器
餈 AMD Ryzen 9 9955HX3D是最强大的 AMD 笔记本电脑处理器。这款 "Fire Range "CPU 拥有 16 个 Zen5 内核,主频为 2.5 至 5.4 GHz。该处理器的 TDP 为 55 W,适用于工作站和游戏笔记本电脑。如需进一步比较,建议使用我们的 CPU 比较列表.
在我们的测试中,微星 Raider A18 HX 的性能与 华硕 Strix Scar 18与 英特尔酷睿至尊9 275HX如果你想在笔记本电脑中获得极致的 CPU 性能,微星 Raider A18 绝对是你的不二之选。
不过,这只适用于连接交流适配器的情况。使用电池供电时,性能会减半(CB23 多核 19278 分,减去 102%)。
Cinebench R15 Multi Loop
Cinebench R23: Multi Core | Single Core
Cinebench R20: CPU (Multi Core) | CPU (Single Core)
Cinebench R15: CPU Multi 64Bit | CPU Single 64Bit
Blender: v2.79 BMW27 CPU
7-Zip 18.03: 7z b 4 | 7z b 4 -mmt1
Geekbench 6.7: Multi-Core | Single-Core
Geekbench 5.5: Multi-Core | Single-Core
HWBOT x265 Benchmark v2.2: 4k Preset
LibreOffice : 20 Documents To PDF
R Benchmark 2.5: Overall mean
| CPU Performance rating | |
| Average AMD Ryzen 9 9955HX3D | |
| Asus Strix Scar 18 G835LX | |
| MSI Raider A18 HX A9WIG-080 | |
| Aorus Master 18 AM8H | |
| MSI Raider 18 HX A14V | |
| Medion Erazer Beast 18 X1 MD62731 | |
| Average of class Gaming | |
| Cinebench R23 / Multi Core | |
| Average AMD Ryzen 9 9955HX3D (38864 - 39266, n=2) | |
| Asus Strix Scar 18 G835LX | |
| MSI Raider A18 HX A9WIG-080 | |
| Aorus Master 18 AM8H | |
| Medion Erazer Beast 18 X1 MD62731 | |
| MSI Raider 18 HX A14V | |
| Average of class Gaming (10488 - 40970, n=106, last 2 years) | |
| Cinebench R23 / Single Core | |
| Medion Erazer Beast 18 X1 MD62731 | |
| Asus Strix Scar 18 G835LX | |
| MSI Raider 18 HX A14V | |
| Average AMD Ryzen 9 9955HX3D (2165 - 2179, n=2) | |
| MSI Raider A18 HX A9WIG-080 | |
| Aorus Master 18 AM8H | |
| Average of class Gaming (1166 - 2387, n=106, last 2 years) | |
| Cinebench R20 / CPU (Multi Core) | |
| Asus Strix Scar 18 G835LX | |
| Average AMD Ryzen 9 9955HX3D (15146 - 15177, n=2) | |
| MSI Raider A18 HX A9WIG-080 | |
| Aorus Master 18 AM8H | |
| Medion Erazer Beast 18 X1 MD62731 | |
| MSI Raider 18 HX A14V | |
| Average of class Gaming (4029 - 16108, n=105, last 2 years) | |
| Cinebench R20 / CPU (Single Core) | |
| Asus Strix Scar 18 G835LX | |
| Medion Erazer Beast 18 X1 MD62731 | |
| MSI Raider 18 HX A14V | |
| MSI Raider A18 HX A9WIG-080 | |
| Average AMD Ryzen 9 9955HX3D (847 - 851, n=2) | |
| Aorus Master 18 AM8H | |
| Average of class Gaming (442 - 904, n=105, last 2 years) | |
| Cinebench R15 / CPU Multi 64Bit | |
| Asus Strix Scar 18 G835LX | |
| Average AMD Ryzen 9 9955HX3D (6041 - 6044, n=2) | |
| MSI Raider A18 HX A9WIG-080 | |
| Aorus Master 18 AM8H | |
| Medion Erazer Beast 18 X1 MD62731 | |
| MSI Raider 18 HX A14V | |
| Average of class Gaming (1578 - 6271, n=104, last 2 years) | |
| Cinebench R15 / CPU Single 64Bit | |
| Asus Strix Scar 18 G835LX | |
| Medion Erazer Beast 18 X1 MD62731 | |
| Aorus Master 18 AM8H | |
| Average AMD Ryzen 9 9955HX3D (321 - 333, n=2) | |
| MSI Raider A18 HX A9WIG-080 | |
| MSI Raider 18 HX A14V | |
| Average of class Gaming (188.8 - 344, n=105, last 2 years) | |
| Blender / v2.79 BMW27 CPU | |
| Average of class Gaming (80 - 330, n=103, last 2 years) | |
| Medion Erazer Beast 18 X1 MD62731 | |
| MSI Raider 18 HX A14V | |
| Aorus Master 18 AM8H | |
| Asus Strix Scar 18 G835LX | |
| MSI Raider A18 HX A9WIG-080 | |
| Average AMD Ryzen 9 9955HX3D (80 - 80, n=2) | |
| 7-Zip 18.03 / 7z b 4 | |
| Average AMD Ryzen 9 9955HX3D (145803 - 148086, n=2) | |
| MSI Raider A18 HX A9WIG-080 | |
| Asus Strix Scar 18 G835LX | |
| MSI Raider 18 HX A14V | |
| Aorus Master 18 AM8H | |
| Medion Erazer Beast 18 X1 MD62731 | |
| Average of class Gaming (33491 - 148086, n=104, last 2 years) | |
| 7-Zip 18.03 / 7z b 4 -mmt1 | |
| Average AMD Ryzen 9 9955HX3D (7151 - 7300, n=2) | |
| MSI Raider A18 HX A9WIG-080 | |
| Medion Erazer Beast 18 X1 MD62731 | |
| Asus Strix Scar 18 G835LX | |
| Aorus Master 18 AM8H | |
| MSI Raider 18 HX A14V | |
| Average of class Gaming (4199 - 7436, n=104, last 2 years) | |
| Geekbench 6.7 / Multi-Core | |
| Asus Strix Scar 18 G835LX | |
| Average AMD Ryzen 9 9955HX3D (19788 - 20551, n=4) | |
| MSI Raider A18 HX A9WIG-080 | |
| Aorus Master 18 AM8H | |
| Medion Erazer Beast 18 X1 MD62731 | |
| MSI Raider 18 HX A14V | |
| Average of class Gaming (6625 - 22104, n=105, last 2 years) | |
| Geekbench 6.7 / Single-Core | |
| Average AMD Ryzen 9 9955HX3D (3146 - 3237, n=4) | |
| Asus Strix Scar 18 G835LX | |
| MSI Raider A18 HX A9WIG-080 | |
| Medion Erazer Beast 18 X1 MD62731 | |
| Aorus Master 18 AM8H | |
| MSI Raider 18 HX A14V | |
| Average of class Gaming (1490 - 3259, n=105, last 2 years) | |
| Geekbench 5.5 / Multi-Core | |
| Asus Strix Scar 18 G835LX | |
| Average AMD Ryzen 9 9955HX3D (23468 - 23669, n=2) | |
| MSI Raider A18 HX A9WIG-080 | |
| Aorus Master 18 AM8H | |
| MSI Raider 18 HX A14V | |
| Medion Erazer Beast 18 X1 MD62731 | |
| Average of class Gaming (6460 - 27010, n=104, last 2 years) | |
| Geekbench 5.5 / Single-Core | |
| MSI Raider A18 HX A9WIG-080 | |
| Average AMD Ryzen 9 9955HX3D (2381 - 2401, n=2) | |
| Asus Strix Scar 18 G835LX | |
| Medion Erazer Beast 18 X1 MD62731 | |
| Aorus Master 18 AM8H | |
| MSI Raider 18 HX A14V | |
| Average of class Gaming (986 - 2474, n=104, last 2 years) | |
| HWBOT x265 Benchmark v2.2 / 4k Preset | |
| MSI Raider A18 HX A9WIG-080 | |
| Average AMD Ryzen 9 9955HX3D (42.3 - 42.7, n=2) | |
| Asus Strix Scar 18 G835LX | |
| Aorus Master 18 AM8H | |
| MSI Raider 18 HX A14V | |
| Medion Erazer Beast 18 X1 MD62731 | |
| Average of class Gaming (11.5 - 44.3, n=104, last 2 years) | |
| LibreOffice / 20 Documents To PDF | |
| Aorus Master 18 AM8H | |
| Average of class Gaming (33.2 - 88.8, n=104, last 2 years) | |
| Medion Erazer Beast 18 X1 MD62731 | |
| Average AMD Ryzen 9 9955HX3D (44.9 - 46.6, n=2) | |
| MSI Raider A18 HX A9WIG-080 | |
| Asus Strix Scar 18 G835LX | |
| MSI Raider 18 HX A14V | |
| R Benchmark 2.5 / Overall mean | |
| Average of class Gaming (0.3439 - 0.759, n=105, last 2 years) | |
| Aorus Master 18 AM8H | |
| Medion Erazer Beast 18 X1 MD62731 | |
| Asus Strix Scar 18 G835LX | |
| MSI Raider 18 HX A14V | |
| MSI Raider A18 HX A9WIG-080 | |
| Average AMD Ryzen 9 9955HX3D (0.3552 - 0.3677, n=2) | |
* ... smaller is better
AIDA64: FP32 Ray-Trace | FPU Julia | CPU SHA3 | CPU Queen | FPU SinJulia | FPU Mandel | CPU AES | CPU ZLib | FP64 Ray-Trace | CPU PhotoWorxx
| Performance rating | |
| MSI Raider A18 HX A9WIG-080 | |
| Average AMD Ryzen 9 9955HX3D | |
| Asus Strix Scar 18 G835LX | |
| Aorus Master 18 AM8H | |
| MSI Raider 18 HX A14V | |
| Medion Erazer Beast 18 X1 MD62731 | |
| Average of class Gaming | |
| AIDA64 / FP32 Ray-Trace | |
| MSI Raider A18 HX A9WIG-080 | |
| Average AMD Ryzen 9 9955HX3D (80619 - 84943, n=2) | |
| Asus Strix Scar 18 G835LX | |
| Aorus Master 18 AM8H | |
| Average of class Gaming (10227 - 85542, n=103, last 2 years) | |
| Medion Erazer Beast 18 X1 MD62731 | |
| MSI Raider 18 HX A14V | |
| AIDA64 / FPU Julia | |
| MSI Raider A18 HX A9WIG-080 | |
| Average AMD Ryzen 9 9955HX3D (230738 - 238426, n=2) | |
| Asus Strix Scar 18 G835LX | |
| Aorus Master 18 AM8H | |
| Medion Erazer Beast 18 X1 MD62731 | |
| Average of class Gaming (51376 - 238426, n=103, last 2 years) | |
| MSI Raider 18 HX A14V | |
| AIDA64 / CPU SHA3 | |
| MSI Raider A18 HX A9WIG-080 | |
| Average AMD Ryzen 9 9955HX3D (9656 - 9750, n=2) | |
| Asus Strix Scar 18 G835LX | |
| Aorus Master 18 AM8H | |
| Medion Erazer Beast 18 X1 MD62731 | |
| MSI Raider 18 HX A14V | |
| Average of class Gaming (2180 - 9817, n=103, last 2 years) | |
| AIDA64 / CPU Queen | |
| Average AMD Ryzen 9 9955HX3D (171718 - 173351, n=2) | |
| MSI Raider A18 HX A9WIG-080 | |
| MSI Raider 18 HX A14V | |
| Asus Strix Scar 18 G835LX | |
| Aorus Master 18 AM8H | |
| Average of class Gaming (49785 - 173351, n=89, last 2 years) | |
| Medion Erazer Beast 18 X1 MD62731 | |
| AIDA64 / FPU SinJulia | |
| MSI Raider A18 HX A9WIG-080 | |
| Average AMD Ryzen 9 9955HX3D (32989 - 33636, n=2) | |
| MSI Raider 18 HX A14V | |
| Average of class Gaming (4424 - 33636, n=103, last 2 years) | |
| Asus Strix Scar 18 G835LX | |
| Aorus Master 18 AM8H | |
| Medion Erazer Beast 18 X1 MD62731 | |
| AIDA64 / FPU Mandel | |
| MSI Raider A18 HX A9WIG-080 | |
| Average AMD Ryzen 9 9955HX3D (122088 - 126658, n=2) | |
| Asus Strix Scar 18 G835LX | |
| Aorus Master 18 AM8H | |
| Average of class Gaming (25115 - 128721, n=103, last 2 years) | |
| Medion Erazer Beast 18 X1 MD62731 | |
| MSI Raider 18 HX A14V | |
| AIDA64 / CPU AES | |
| MSI Raider A18 HX A9WIG-080 | |
| Average AMD Ryzen 9 9955HX3D (161913 - 163423, n=2) | |
| Asus Strix Scar 18 G835LX | |
| MSI Raider 18 HX A14V | |
| Aorus Master 18 AM8H | |
| Medion Erazer Beast 18 X1 MD62731 | |
| Average of class Gaming (39258 - 247074, n=103, last 2 years) | |
| AIDA64 / CPU ZLib | |
| MSI Raider A18 HX A9WIG-080 | |
| Average AMD Ryzen 9 9955HX3D (2497 - 2517, n=2) | |
| Asus Strix Scar 18 G835LX | |
| MSI Raider 18 HX A14V | |
| Aorus Master 18 AM8H | |
| Medion Erazer Beast 18 X1 MD62731 | |
| Average of class Gaming (574 - 2531, n=103, last 2 years) | |
| AIDA64 / FP64 Ray-Trace | |
| MSI Raider A18 HX A9WIG-080 | |
| Average AMD Ryzen 9 9955HX3D (42676 - 45384, n=2) | |
| Asus Strix Scar 18 G835LX | |
| Aorus Master 18 AM8H | |
| Average of class Gaming (5509 - 45446, n=103, last 2 years) | |
| MSI Raider 18 HX A14V | |
| Medion Erazer Beast 18 X1 MD62731 | |
| AIDA64 / CPU PhotoWorxx | |
| Asus Strix Scar 18 G835LX | |
| Aorus Master 18 AM8H | |
| Medion Erazer Beast 18 X1 MD62731 | |
| Average of class Gaming (12271 - 89891, n=103, last 2 years) | |
| Average AMD Ryzen 9 9955HX3D (38765 - 43032, n=2) | |
| MSI Raider 18 HX A14V | |
| MSI Raider A18 HX A9WIG-080 | |
系统性能
不出所料,系统性能基准测试结果非常出色,微星笔记本电脑在日常使用中表现出色。
PCMark 10: Score | Essentials | Productivity | Digital Content Creation
CrossMark: Overall | Productivity | Creativity | Responsiveness
WebXPRT 3: Overall
WebXPRT 4: Overall
Mozilla Kraken 1.1: Total
| Performance rating | |
| MSI Raider A18 HX A9WIG-080 | |
| Average AMD Ryzen 9 9955HX3D, NVIDIA GeForce RTX 5080 Laptop | |
| MSI Raider 18 HX A14V | |
| Aorus Master 18 AM8H | |
| Asus Strix Scar 18 G835LX | |
| Average of class Gaming | |
| Medion Erazer Beast 18 X1 MD62731 | |
| PCMark 10 / Score | |
| MSI Raider 18 HX A14V | |
| MSI Raider A18 HX A9WIG-080 | |
| Average AMD Ryzen 9 9955HX3D, NVIDIA GeForce RTX 5080 Laptop (n=1) | |
| Asus Strix Scar 18 G835LX | |
| Aorus Master 18 AM8H | |
| Average of class Gaming (5828 - 11730, n=92, last 2 years) | |
| Medion Erazer Beast 18 X1 MD62731 | |
| PCMark 10 / Essentials | |
| MSI Raider 18 HX A14V | |
| MSI Raider A18 HX A9WIG-080 | |
| Average AMD Ryzen 9 9955HX3D, NVIDIA GeForce RTX 5080 Laptop (n=1) | |
| Aorus Master 18 AM8H | |
| Asus Strix Scar 18 G835LX | |
| Average of class Gaming (8810 - 11935, n=96, last 2 years) | |
| Medion Erazer Beast 18 X1 MD62731 | |
| PCMark 10 / Productivity | |
| MSI Raider 18 HX A14V | |
| Average of class Gaming (6845 - 21327, n=94, last 2 years) | |
| MSI Raider A18 HX A9WIG-080 | |
| Average AMD Ryzen 9 9955HX3D, NVIDIA GeForce RTX 5080 Laptop (n=1) | |
| Medion Erazer Beast 18 X1 MD62731 | |
| Asus Strix Scar 18 G835LX | |
| Aorus Master 18 AM8H | |
| PCMark 10 / Digital Content Creation | |
| Asus Strix Scar 18 G835LX | |
| Aorus Master 18 AM8H | |
| MSI Raider 18 HX A14V | |
| Medion Erazer Beast 18 X1 MD62731 | |
| MSI Raider A18 HX A9WIG-080 | |
| Average AMD Ryzen 9 9955HX3D, NVIDIA GeForce RTX 5080 Laptop (n=1) | |
| Average of class Gaming (7602 - 19954, n=94, last 2 years) | |
| CrossMark / Overall | |
| Aorus Master 18 AM8H | |
| MSI Raider A18 HX A9WIG-080 | |
| Average AMD Ryzen 9 9955HX3D, NVIDIA GeForce RTX 5080 Laptop (n=1) | |
| Asus Strix Scar 18 G835LX | |
| MSI Raider 18 HX A14V | |
| Average of class Gaming (1366 - 2409, n=93, last 2 years) | |
| Medion Erazer Beast 18 X1 MD62731 | |
| CrossMark / Productivity | |
| Aorus Master 18 AM8H | |
| Asus Strix Scar 18 G835LX | |
| MSI Raider A18 HX A9WIG-080 | |
| Average AMD Ryzen 9 9955HX3D, NVIDIA GeForce RTX 5080 Laptop (n=1) | |
| MSI Raider 18 HX A14V | |
| Average of class Gaming (1386 - 2254, n=93, last 2 years) | |
| Medion Erazer Beast 18 X1 MD62731 | |
| CrossMark / Creativity | |
| MSI Raider A18 HX A9WIG-080 | |
| Average AMD Ryzen 9 9955HX3D, NVIDIA GeForce RTX 5080 Laptop (n=1) | |
| Asus Strix Scar 18 G835LX | |
| Aorus Master 18 AM8H | |
| MSI Raider 18 HX A14V | |
| Average of class Gaming (1343 - 2729, n=93, last 2 years) | |
| Medion Erazer Beast 18 X1 MD62731 | |
| CrossMark / Responsiveness | |
| Aorus Master 18 AM8H | |
| MSI Raider 18 HX A14V | |
| MSI Raider A18 HX A9WIG-080 | |
| Average AMD Ryzen 9 9955HX3D, NVIDIA GeForce RTX 5080 Laptop (n=1) | |
| Asus Strix Scar 18 G835LX | |
| Average of class Gaming (1226 - 2334, n=93, last 2 years) | |
| Medion Erazer Beast 18 X1 MD62731 | |
| WebXPRT 3 / Overall | |
| MSI Raider A18 HX A9WIG-080 | |
| Average AMD Ryzen 9 9955HX3D, NVIDIA GeForce RTX 5080 Laptop (n=1) | |
| Asus Strix Scar 18 G835LX | |
| Medion Erazer Beast 18 X1 MD62731 | |
| MSI Raider 18 HX A14V | |
| Average of class Gaming (220 - 532, n=97, last 2 years) | |
| Aorus Master 18 AM8H | |
| WebXPRT 4 / Overall | |
| Asus Strix Scar 18 G835LX | |
| MSI Raider A18 HX A9WIG-080 | |
| Average AMD Ryzen 9 9955HX3D, NVIDIA GeForce RTX 5080 Laptop (n=1) | |
| Medion Erazer Beast 18 X1 MD62731 | |
| MSI Raider 18 HX A14V | |
| Aorus Master 18 AM8H | |
| Average of class Gaming (165 - 354, n=97, last 2 years) | |
| Mozilla Kraken 1.1 / Total | |
| Average of class Gaming (391 - 590, n=99, last 2 years) | |
| MSI Raider 18 HX A14V | |
| Aorus Master 18 AM8H | |
| Medion Erazer Beast 18 X1 MD62731 | |
| Asus Strix Scar 18 G835LX | |
| MSI Raider A18 HX A9WIG-080 | |
| Average AMD Ryzen 9 9955HX3D, NVIDIA GeForce RTX 5080 Laptop (n=1) | |
* ... smaller is better
| PCMark 10 Score | 8859 points | |
Help | ||
| AIDA64 / Memory Copy | |
| Asus Strix Scar 18 G835LX | |
| Medion Erazer Beast 18 X1 MD62731 | |
| Aorus Master 18 AM8H | |
| Average of class Gaming (21750 - 129946, n=103, last 2 years) | |
| MSI Raider 18 HX A14V | |
| Average AMD Ryzen 9 9955HX3D (56383 - 61533, n=2) | |
| MSI Raider A18 HX A9WIG-080 | |
| AIDA64 / Memory Read | |
| Medion Erazer Beast 18 X1 MD62731 | |
| Asus Strix Scar 18 G835LX | |
| Aorus Master 18 AM8H | |
| Average of class Gaming (22956 - 118858, n=103, last 2 years) | |
| Average AMD Ryzen 9 9955HX3D (59750 - 65369, n=2) | |
| MSI Raider 18 HX A14V | |
| MSI Raider A18 HX A9WIG-080 | |
| AIDA64 / Memory Write | |
| Asus Strix Scar 18 G835LX | |
| Medion Erazer Beast 18 X1 MD62731 | |
| Average of class Gaming (22297 - 135096, n=103, last 2 years) | |
| Aorus Master 18 AM8H | |
| Average AMD Ryzen 9 9955HX3D (59506 - 72898, n=2) | |
| MSI Raider 18 HX A14V | |
| MSI Raider A18 HX A9WIG-080 | |
| AIDA64 / Memory Latency | |
| Aorus Master 18 AM8H | |
| Medion Erazer Beast 18 X1 MD62731 | |
| Asus Strix Scar 18 G835LX | |
| Average of class Gaming (75.3 - 259, n=103, last 2 years) | |
| Average AMD Ryzen 9 9955HX3D (96.1 - 103.6, n=2) | |
| MSI Raider 18 HX A14V | |
| MSI Raider A18 HX A9WIG-080 | |
* ... smaller is better
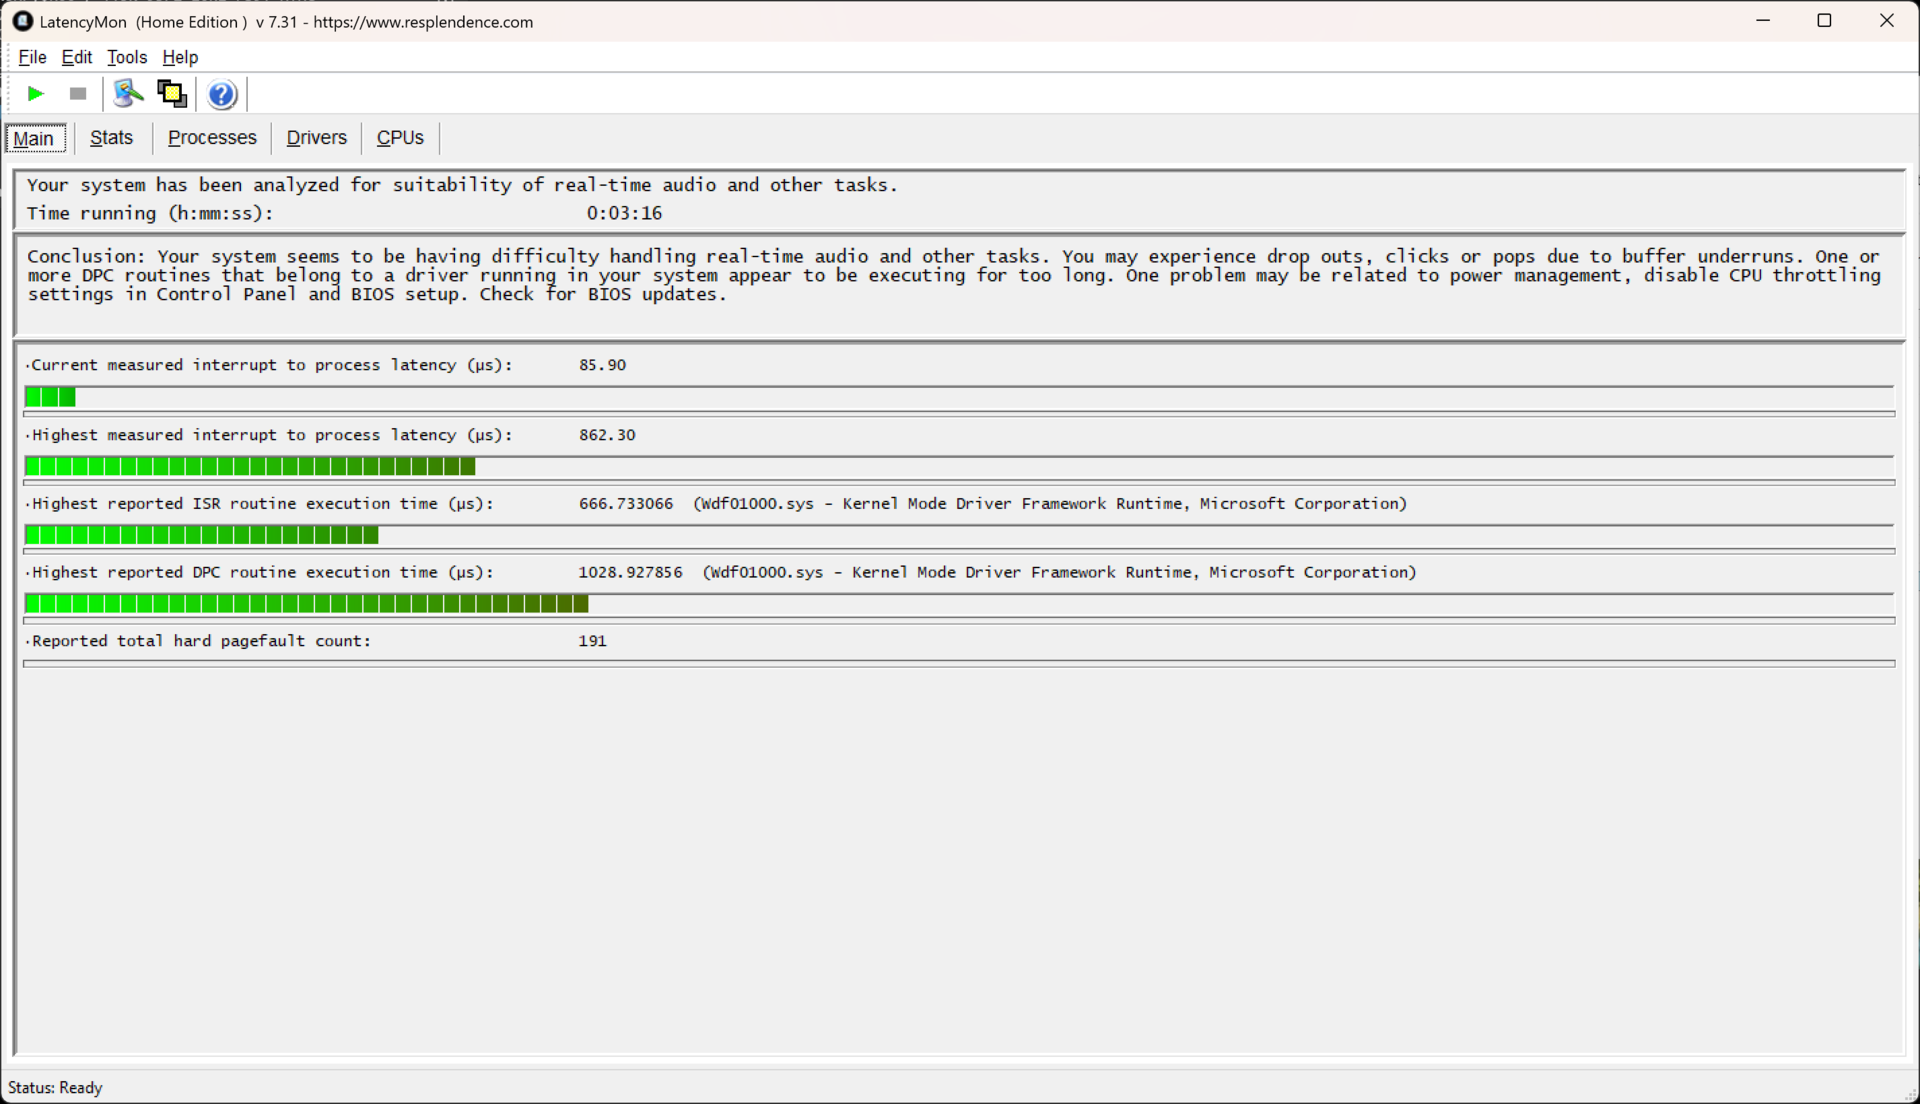
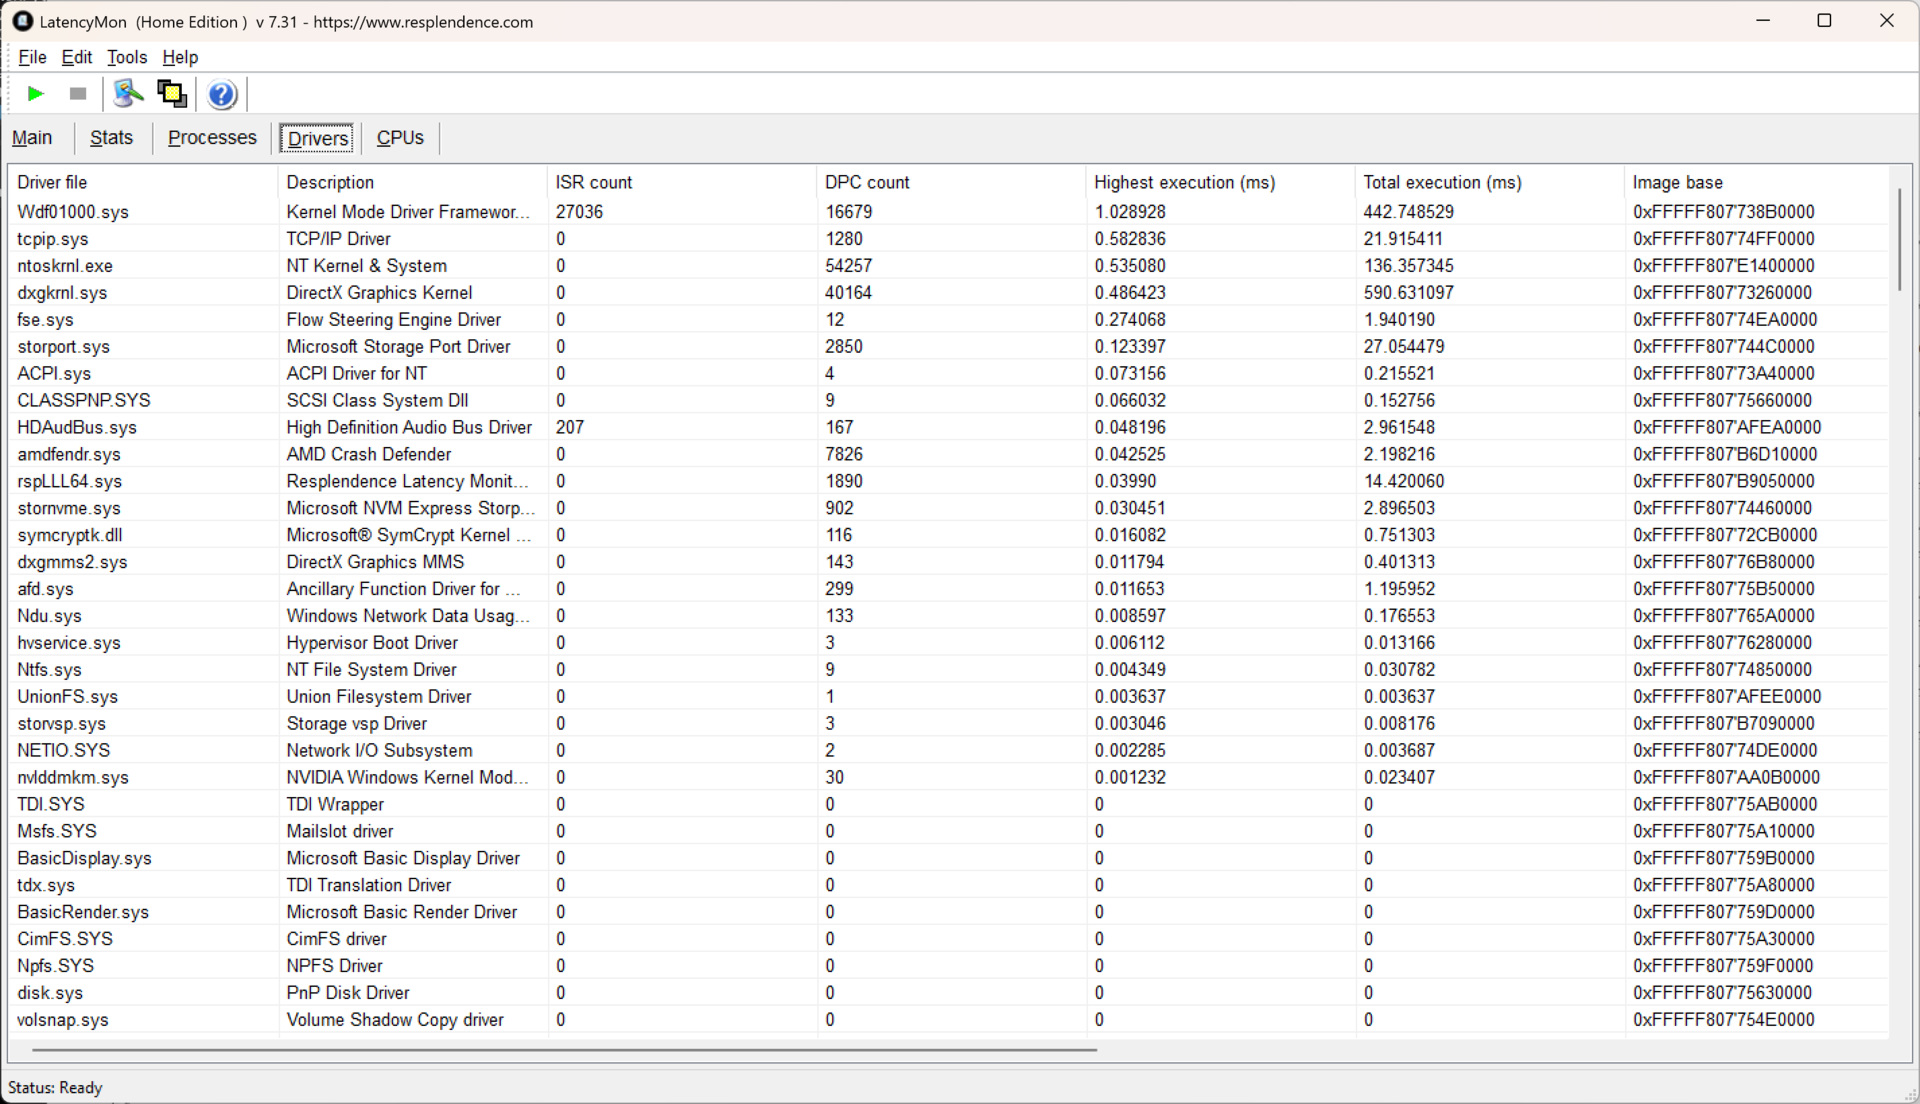
DPC 延迟
微星 Raider A18 HX 存在一些 DPC 延迟下降的问题,但通过驱动程序或 BIOS 更新可能会得到解决。
| DPC Latencies / LatencyMon - interrupt to process latency (max), Web, Youtube, Prime95 | |
| Medion Erazer Beast 18 X1 MD62731 | |
| MSI Raider 18 HX A14V | |
| Aorus Master 18 AM8H | |
| MSI Raider A18 HX A9WIG-080 | |
| Asus Strix Scar 18 G835LX | |
* ... smaller is better
存储设备
微星使用的是容量为 2 TB 的三星 NVMe PCIe 5.0 固态硬盘,速度非常快。在我们的对比中,PM9E1 是速度最快的硬盘,而且也没有出现任何节流现象--这要归功于微星出色的 SSD 冷却解决方案。

* ... smaller is better
Disk Throttling: DiskSpd Read Loop, Queue Depth 8
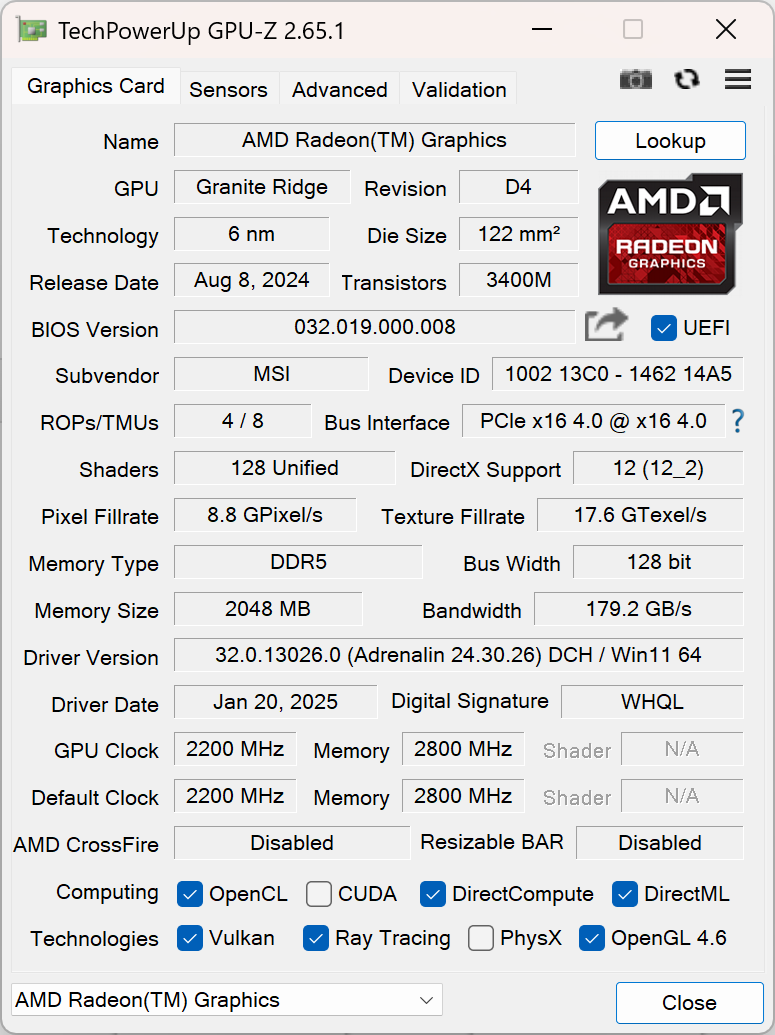
图形处理器性能
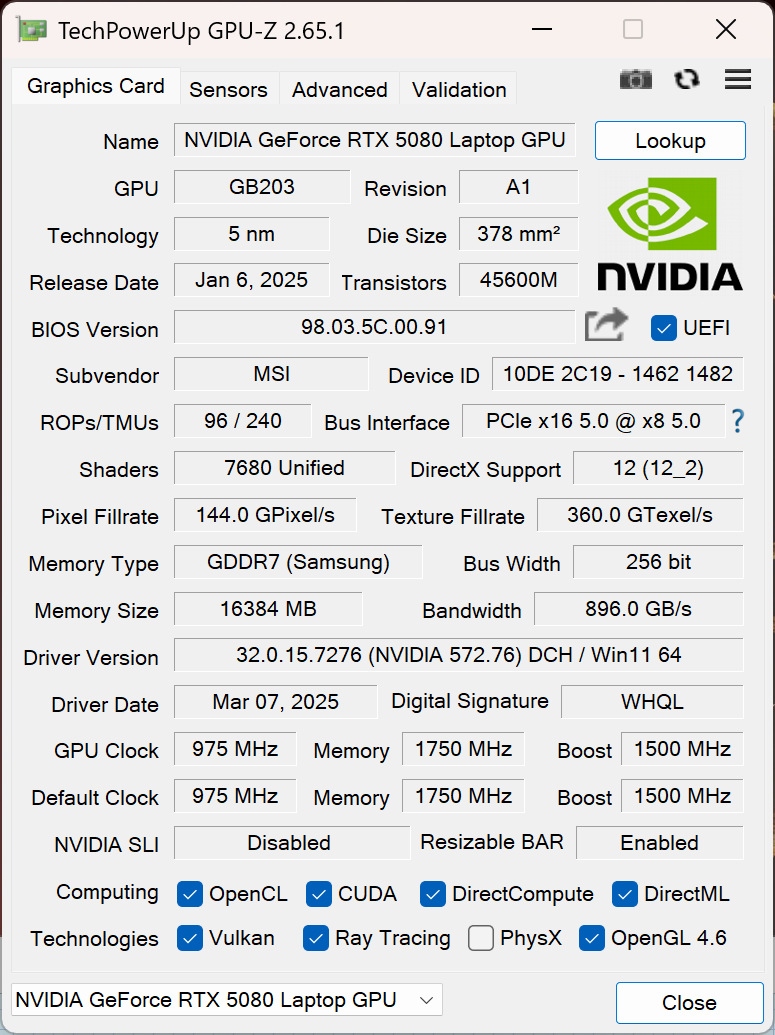
笔记本电脑 NvidiaGeForce RTX 5080 笔记本电脑是 Nvidia 当前 "Blackwell "一代中速度第二快的消费级 GPU。 它与更昂贵的 RTX 5090的 256 位显存接口,但着色器单元数量较少,为 8192 个,而不是 10496 个,但时钟频率更高,为 0.98 至 2.29 GHz。与 CPU 一样,我们有一个 GPU 对比列表提供了更多基准测试数据。
正如基准测试所显示的,RTX 5090 和 5080 在 GPU 合成基准测试方面的差异微乎其微。RTX 5090 的速度可能要快 5%,不过值得一提的是,RTX 5080 在 Raider A18 HX 中的速度也略高于该 GPU 的平均水平。
| 3DMark 11 Performance | 51993 points | |
| 3DMark Fire Strike Score | 41506 points | |
| 3DMark Time Spy Score | 19302 points | |
Help | ||
* ... smaller is better
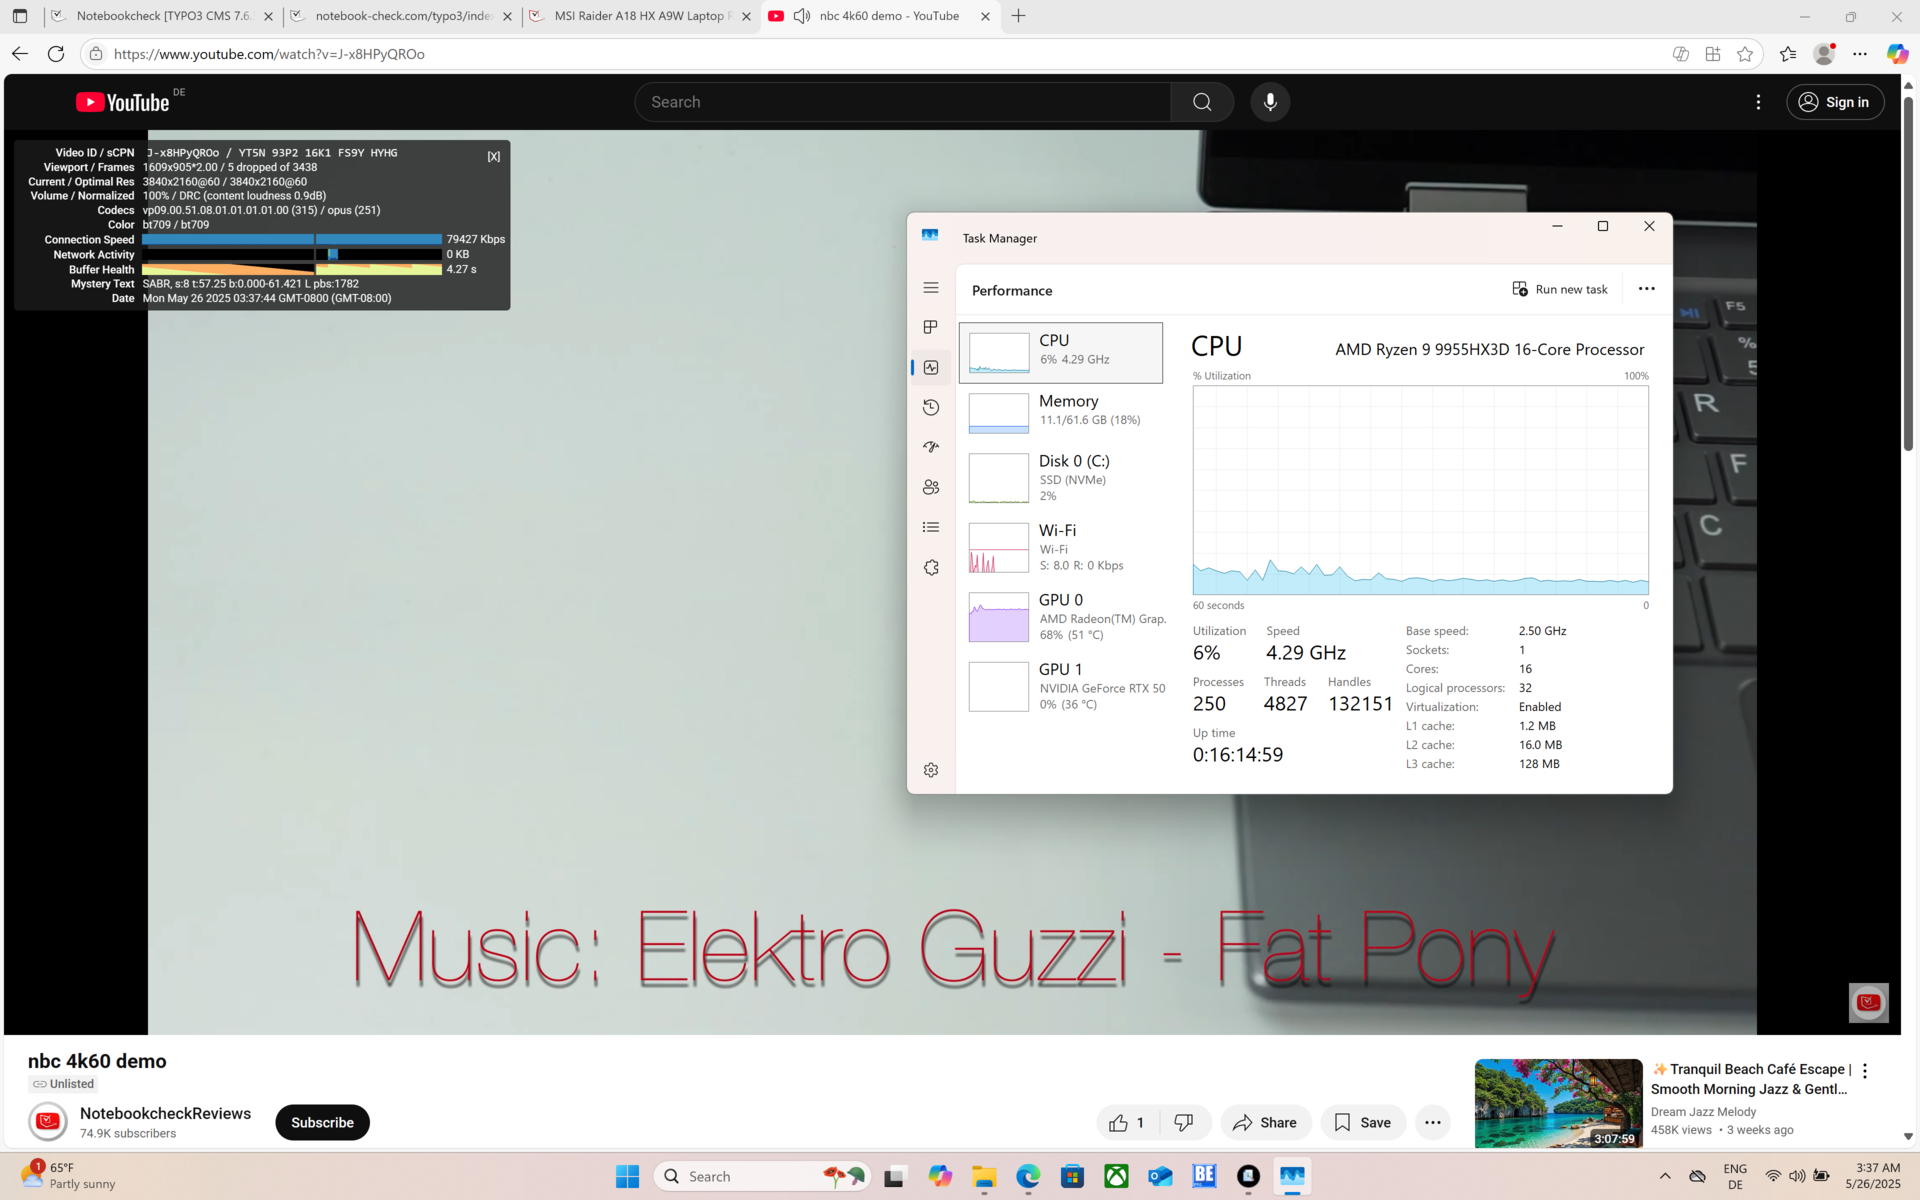
游戏性能
微星 Raider A18 HX 实现了出色的游戏性能。搭载 NvidiaGeForce RTX 5080,它甚至在对比中以微弱优势击败了配备 RTX 5090 的笔记本电脑。此外,在我们进行的《赛博朋克 2077》负载测试中,它的性能在持续负载下保持稳定。
| Performance rating - Percent | |
| MSI Raider A18 HX A9WIG-080 | |
| Asus Strix Scar 18 G835LX | |
| Aorus Master 18 AM8H -1! | |
| MSI Raider 18 HX A14V -1! | |
| Medion Erazer Beast 18 X1 MD62731 -1! | |
| Average of class Gaming | |
| Baldur's Gate 3 - 1920x1080 Ultra Preset AA:T | |
| Aorus Master 18 AM8H | |
| Asus Strix Scar 18 G835LX | |
| Medion Erazer Beast 18 X1 MD62731 | |
| MSI Raider A18 HX A9WIG-080 | |
| Average of class Gaming (59.4 - 246, n=101, last 2 years) | |
| GTA V - 1920x1080 Highest AA:4xMSAA + FX AF:16x | |
| MSI Raider A18 HX A9WIG-080 | |
| Aorus Master 18 AM8H | |
| Asus Strix Scar 18 G835LX | |
| MSI Raider 18 HX A14V | |
| Medion Erazer Beast 18 X1 MD62731 | |
| Average of class Gaming (48.3 - 186.9, n=93, last 2 years) | |
| Final Fantasy XV Benchmark - 1920x1080 High Quality | |
| Aorus Master 18 AM8H | |
| Asus Strix Scar 18 G835LX | |
| MSI Raider A18 HX A9WIG-080 | |
| Medion Erazer Beast 18 X1 MD62731 | |
| MSI Raider 18 HX A14V | |
| Average of class Gaming (41 - 215, n=94, last 2 years) | |
| Dota 2 Reborn - 1920x1080 ultra (3/3) best looking | |
| MSI Raider A18 HX A9WIG-080 | |
| Asus Strix Scar 18 G835LX | |
| MSI Raider 18 HX A14V | |
| Aorus Master 18 AM8H | |
| Medion Erazer Beast 18 X1 MD62731 | |
| Average of class Gaming (84.8 - 248, n=106, last 2 years) | |
| X-Plane 11.11 - 1920x1080 high (fps_test=3) | |
| MSI Raider 18 HX A14V | |
| Asus Strix Scar 18 G835LX | |
| MSI Raider A18 HX A9WIG-080 | |
| Aorus Master 18 AM8H | |
| Medion Erazer Beast 18 X1 MD62731 | |
| Average of class Gaming (55.5 - 143.5, n=108, last 2 years) | |
| Cyberpunk 2077 - 3840x2160 Ultra Preset (FSR off) | |
| Asus Strix Scar 18 G835LX | |
| MSI Raider A18 HX A9WIG-080 | |
| Average of class Gaming (25.1 - 128.8, n=35, last 2 years) | |
| MSI Raider 18 HX A14V | |
Cyberpunk 2077 ultra FPS Chart
| low | med. | high | ultra | QHD DLSS | QHD | 4K DLSS | 4K | |
|---|---|---|---|---|---|---|---|---|
| GTA V (2015) | 190.2 | 189.5 | 189 | 185 | 177.8 | 173.3 | ||
| Dota 2 Reborn (2015) | 327 | 304 | 271 | 239 | 199.2 | |||
| Final Fantasy XV Benchmark (2018) | 233 | 232 | 194.8 | 151.2 | 87 | |||
| X-Plane 11.11 (2018) | 158 | 138.2 | 113.9 | 124.1 | ||||
| Baldur's Gate 3 (2023) | 244 | 195.5 | 171.9 | 169.3 | 132.8 | 114.6 | 70.6 | |
| Cyberpunk 2077 (2023) | 225 | 197.1 | 167.9 | 151.9 | 104 | 46.3 | ||
| Alan Wake 2 (2023) | 134.7 | 125.7 | 116.4 | 78.3 | 63.1 | 40.7 | ||
| F1 24 (2024) | 396 | 349 | 277 | 134.8 | 126.9 | 79.3 | 68.2 | 39.4 |
| Black Myth: Wukong (2024) | 124 | 96 | 56 | 41 | 42 | 24 | ||
| Indiana Jones and the Great Circle (2024) | 189.3 | 141.8 | 127.2 | 99.5 | 61.8 | |||
| Monster Hunter Wilds (2025) | 127.6 | 111 | 90 | 70.6 | 59.3 | 42.9 | ||
| Assassin's Creed Shadows (2025) | 115 | 104 | 91 | 69 | 55 | 52 | 38 |
排放:脉动风扇让微星 Raider A18 令人讨厌
系统噪音
如果你购买了微星 Raider A18 HX,最好打算一直戴着耳机。除了关机时,这款微星 Raider 笔记本电脑的两个风扇从未关闭过。至少在空转时,风扇会保持在 30 dB(a)以下,但你肯定能听到它们的声音。更糟糕的是,风扇往往会发出非常恼人的脉动噪音。在负载情况下,运行《赛博朋克 2077》时,微星最高可达到 55 dB(a)。
Noise level
| Idle |
| 28.6 / 28.9 / 29.2 dB(A) |
| Load |
| 45.6 / 45.8 dB(A) |
 | ||
30 dB silent 40 dB(A) audible 50 dB(A) loud |
||
min: | ||
| MSI Raider A18 HX A9WIG-080 GeForce RTX 5080 Laptop, R9 9955HX3D, Samsung PM9E1 MZVLC2T0HBLD | MSI Raider 18 HX A14V GeForce RTX 4080 Laptop GPU, i9-14900HX, Samsung PM9A1 MZVL22T0HBLB | Medion Erazer Beast 18 X1 MD62731 GeForce RTX 5080 Laptop, Ultra 9 275HX, Phison E31 2 TB | Aorus Master 18 AM8H GeForce RTX 5090 Laptop, Ultra 9 275HX, Kingston KC3000 2048G SKC3000D2048G | Asus Strix Scar 18 G835LX GeForce RTX 5090 Laptop, Ultra 9 275HX, WD PC SN8000S 2TB | |
|---|---|---|---|---|---|
| Noise | -6% | -14% | -4% | -1% | |
| off / environment * (dB) | 25.1 | 23.3 7% | 25 -0% | 25 -0% | 23.3 7% |
| Idle Minimum * (dB) | 28.6 | 28.6 -0% | 25 13% | 26 9% | 29.8 -4% |
| Idle Average * (dB) | 28.9 | 28.6 1% | 39 -35% | 29 -0% | 29.8 -3% |
| Idle Maximum * (dB) | 29.2 | 31.3 -7% | 42 -44% | 34 -16% | 29.8 -2% |
| Load Average * (dB) | 45.6 | 44.1 3% | 52 -14% | 50 -10% | 42.9 6% |
| Cyberpunk 2077 ultra * (dB) | 55.6 | 59.4 -7% | 53 5% | 52 6% | 53.7 3% |
| Load Maximum * (dB) | 45.8 | 62.7 -37% | 55 -20% | 53 -16% | 53.7 -17% |
* ... smaller is better
温度
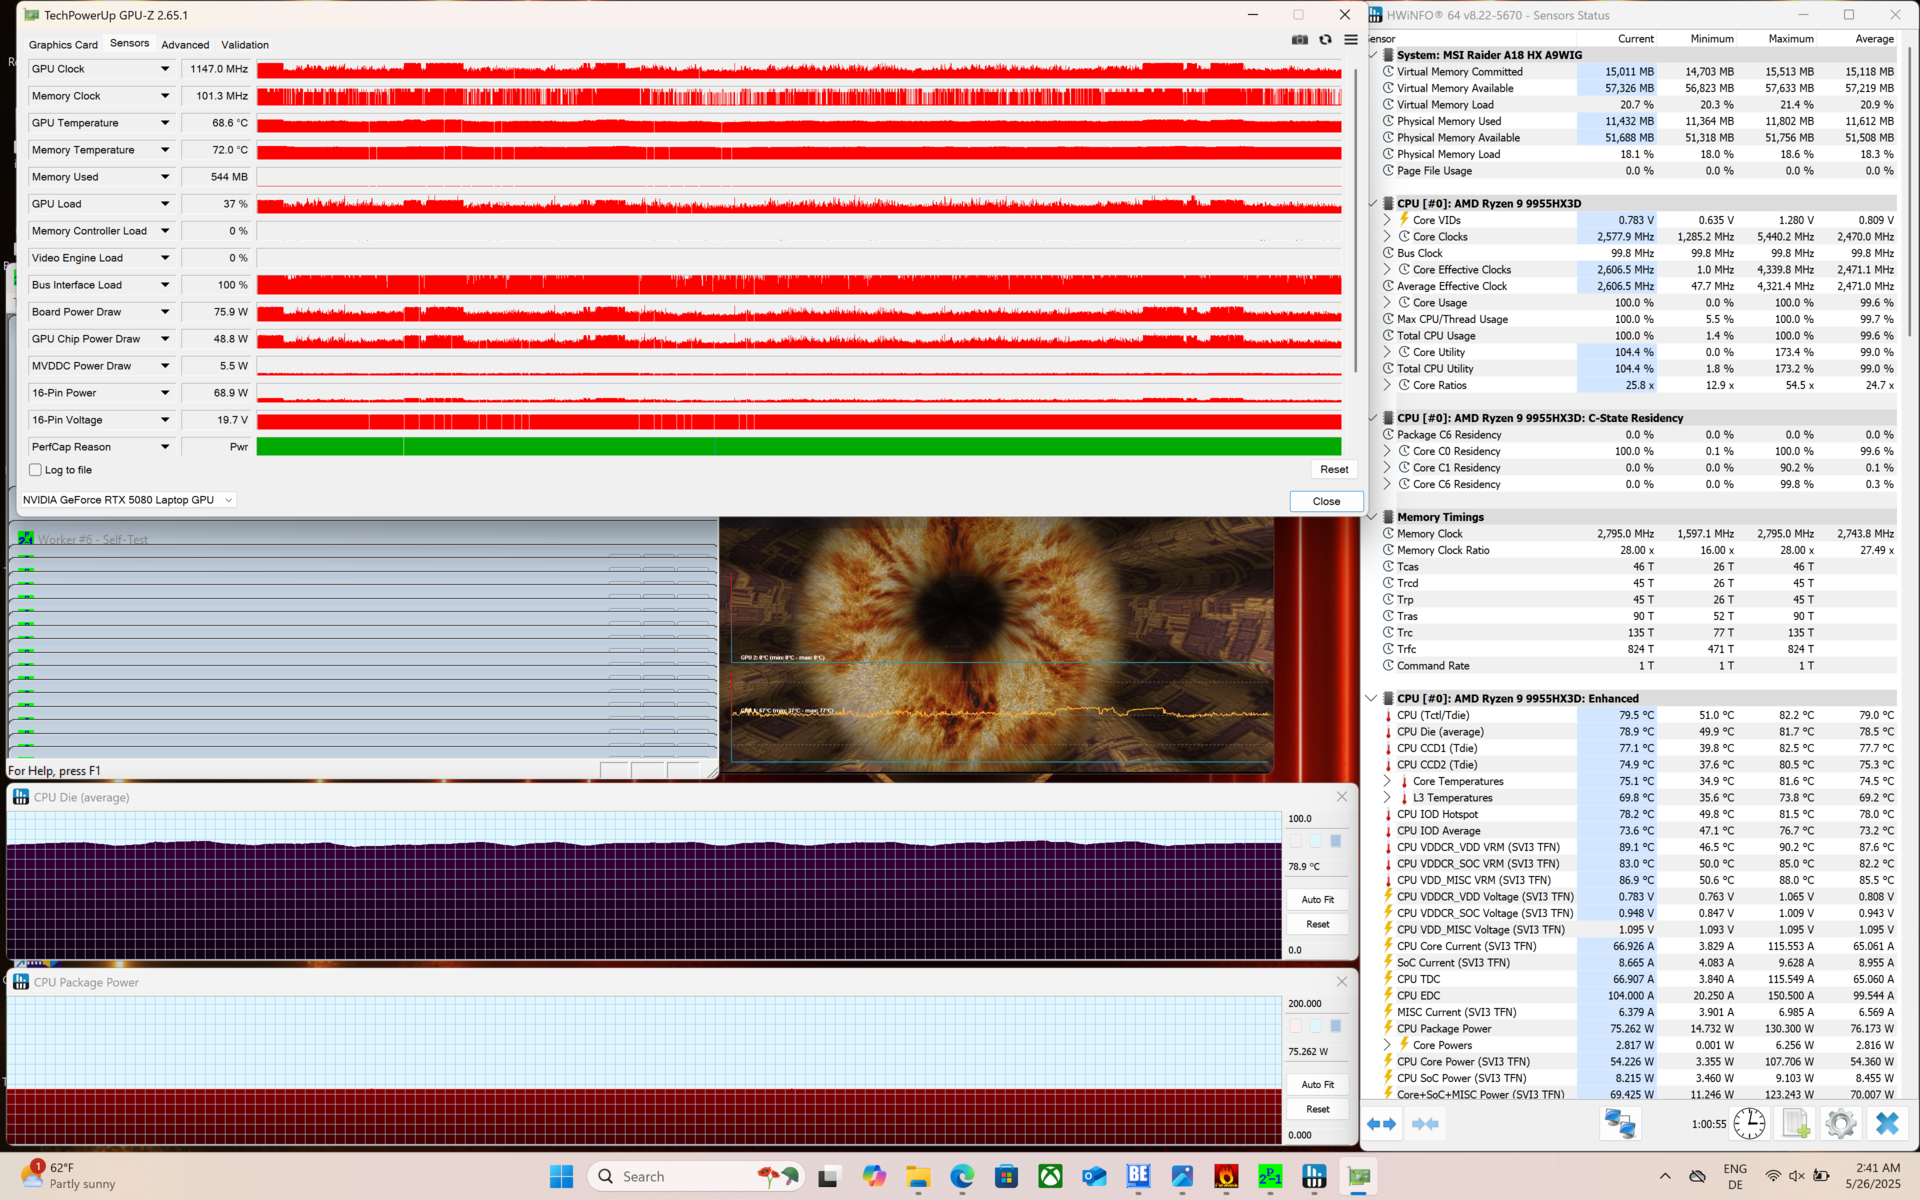
即使风扇加班加点地工作,拥有如此强劲性能的设备也会发热。至少温度不会达到极致,我们在《赛博朋克 2077》 测试中测得的最高温度为 52.7 摄氏度或 127 华氏度。此外,用户接触最多的掌托区域也完全没有发热。
在 CPU 和 GPU 均为 100% 负载的情况下,处理器的功耗可达 75 W,GPU 也是如此。这意味着,当两者结合使用时,该设备最多可持续冷却 150 瓦的功率。
(-) The maximum temperature on the upper side is 49.3 °C / 121 F, compared to the average of 40.4 °C / 105 F, ranging from 21.2 to 68.8 °C for the class Gaming.
(-) The bottom heats up to a maximum of 50.9 °C / 124 F, compared to the average of 43.2 °C / 110 F
(+) In idle usage, the average temperature for the upper side is 30 °C / 86 F, compared to the device average of 33.9 °C / 93 F.
(±) 3: The average temperature for the upper side is 34.8 °C / 95 F, compared to the average of 33.9 °C / 93 F for the class Gaming.
(+) The palmrests and touchpad are cooler than skin temperature with a maximum of 29.4 °C / 84.9 F and are therefore cool to the touch.
(±) The average temperature of the palmrest area of similar devices was 28.8 °C / 83.8 F (-0.6 °C / -1.1 F).
| MSI Raider A18 HX A9WIG-080 AMD Ryzen 9 9955HX3D, NVIDIA GeForce RTX 5080 Laptop | MSI Raider 18 HX A14V Intel Core i9-14900HX, NVIDIA GeForce RTX 4080 Laptop GPU | Medion Erazer Beast 18 X1 MD62731 Intel Core Ultra 9 275HX, NVIDIA GeForce RTX 5080 Laptop | Aorus Master 18 AM8H Intel Core Ultra 9 275HX, NVIDIA GeForce RTX 5090 Laptop | Asus Strix Scar 18 G835LX Intel Core Ultra 9 275HX, NVIDIA GeForce RTX 5090 Laptop | |
|---|---|---|---|---|---|
| Heat | 5% | 8% | 1% | 12% | |
| Maximum Upper Side * (°C) | 49.3 | 40.8 17% | 47 5% | 50 -1% | 45.6 8% |
| Maximum Bottom * (°C) | 50.9 | 43.4 15% | 48 6% | 46 10% | 46 10% |
| Idle Upper Side * (°C) | 35.2 | 36.4 -3% | 29 18% | 36 -2% | 28.9 18% |
| Idle Bottom * (°C) | 33.5 | 36.4 -9% | 33 1% | 35 -4% | 29.2 13% |
* ... smaller is better
发言人
微星 Raider A18 HX 共有 6 个扬声器,音量高达 85.9 dB(a)。不过,微星似乎忘记了低音,因为声音实在太小,高音太重--完全不是我们所期望的游戏笔记本电脑的高级体验。
MSI Raider A18 HX A9WIG-080 audio analysis
(+) | speakers can play relatively loud (85.9 dB)
Bass 100 - 315 Hz
(-) | nearly no bass - on average 17.1% lower than median
(±) | linearity of bass is average (8.5% delta to prev. frequency)
Mids 400 - 2000 Hz
(±) | higher mids - on average 9.4% higher than median
(±) | linearity of mids is average (9.1% delta to prev. frequency)
Highs 2 - 16 kHz
(+) | balanced highs - only 3.8% away from median
(+) | highs are linear (5.8% delta to prev. frequency)
Overall 100 - 16.000 Hz
(±) | linearity of overall sound is average (18.9% difference to median)
Compared to same class
» 63% of all tested devices in this class were better, 8% similar, 29% worse
» The best had a delta of 6%, average was 18%, worst was 132%
Compared to all devices tested
» 44% of all tested devices were better, 8% similar, 48% worse
» The best had a delta of 4%, average was 23%, worst was 134%
Asus Strix Scar 18 G835LX audio analysis
(+) | speakers can play relatively loud (86.3 dB)
Bass 100 - 315 Hz
(±) | reduced bass - on average 7.5% lower than median
(±) | linearity of bass is average (7.7% delta to prev. frequency)
Mids 400 - 2000 Hz
(±) | higher mids - on average 9.9% higher than median
(+) | mids are linear (6.9% delta to prev. frequency)
Highs 2 - 16 kHz
(+) | balanced highs - only 2.2% away from median
(+) | highs are linear (4.1% delta to prev. frequency)
Overall 100 - 16.000 Hz
(+) | overall sound is linear (13.7% difference to median)
Compared to same class
» 21% of all tested devices in this class were better, 7% similar, 72% worse
» The best had a delta of 6%, average was 18%, worst was 132%
Compared to all devices tested
» 15% of all tested devices were better, 4% similar, 81% worse
» The best had a delta of 4%, average was 23%, worst was 134%
能源管理:微星笔记本电脑快速耗尽大容量电池
耗电量
微星 Raider A18 并不省电。即使关闭所有功能并调低屏幕亮度,它的耗电量仍超过 40 W。
微星笔记本电脑的最大功耗为 323 W,这对 400 W 的充电器来说并非难事。
| Off / Standby | |
| Idle | |
| Load |
|
Key:
min: | |
| MSI Raider A18 HX A9WIG-080 R9 9955HX3D, GeForce RTX 5080 Laptop, Samsung PM9E1 MZVLC2T0HBLD, MiniLED IPS, 3840x2400, 18" | MSI Raider 18 HX A14V i9-14900HX, GeForce RTX 4080 Laptop GPU, Samsung PM9A1 MZVL22T0HBLB, Mini-LED, 3840x2400, 18" | Medion Erazer Beast 18 X1 MD62731 Ultra 9 275HX, GeForce RTX 5080 Laptop, Phison E31 2 TB, IPS, 2560x1600, 18" | Aorus Master 18 AM8H Ultra 9 275HX, GeForce RTX 5090 Laptop, Kingston KC3000 2048G SKC3000D2048G, Mini-LED, 2560x1600, 18" | Asus Strix Scar 18 G835LX Ultra 9 275HX, GeForce RTX 5090 Laptop, WD PC SN8000S 2TB, Mini-LED, 2560x1600, 18" | Average NVIDIA GeForce RTX 5080 Laptop | Average of class Gaming | |
|---|---|---|---|---|---|---|---|
| Power Consumption | 13% | 40% | 14% | 13% | 35% | 49% | |
| Idle Minimum * (Watt) | 41.5 | 27.7 33% | 7.9 81% | 29 30% | 11.4 73% | 19.1 ? 54% | 13 ? 69% |
| Idle Average * (Watt) | 53.5 | 38.3 28% | 11.5 79% | 33 38% | 39.2 27% | 25.3 ? 53% | 18.7 ? 65% |
| Idle Maximum * (Watt) | 53.8 | 47.1 12% | 16.6 69% | 48 11% | 40.2 25% | 30.4 ? 43% | 24.3 ? 55% |
| Load Average * (Watt) | 168.5 | 121.2 28% | 130 23% | 141 16% | 161.2 4% | 128.5 ? 24% | 110.2 ? 35% |
| Cyberpunk 2077 ultra * (Watt) | 298 | 313 -5% | 253 15% | 283 5% | 303 -2% | ||
| Cyberpunk 2077 ultra external monitor * (Watt) | 295 | 306 -4% | 245 17% | 283 4% | 295 -0% | ||
| Load Maximum * (Watt) | 323.7 | 321.8 1% | 330 -2% | 340 -5% | 430.9 -33% | 314 ? 3% | 258 ? 20% |
* ... smaller is better
Power Consumption Cyberpunk / Stress Test
Power Consumption external Monitor
电池寿命
如果您希望在不连接充电器的情况下使用微星 Raider A18 HX:算了吧。尽管配备了 99.9 Wh 的电池,但在我们的 Wi-Fi 测试中(亮度为 150 cd/m²),这款笔记本只能勉强使用两个小时。这基本上就是一台可以在不同办公桌之间移动的台式机,而且总是带着充电器。
| MSI Raider A18 HX A9WIG-080 R9 9955HX3D, GeForce RTX 5080 Laptop, 99 Wh | MSI Raider 18 HX A14V i9-14900HX, GeForce RTX 4080 Laptop GPU, 99.9 Wh | Medion Erazer Beast 18 X1 MD62731 Ultra 9 275HX, GeForce RTX 5080 Laptop, 99 Wh | Aorus Master 18 AM8H Ultra 9 275HX, GeForce RTX 5090 Laptop, 99 Wh | Asus Strix Scar 18 G835LX Ultra 9 275HX, GeForce RTX 5090 Laptop, 90 Wh | Average of class Gaming | |
|---|---|---|---|---|---|---|
| Battery runtime | 38% | 276% | 103% | 86% | 139% | |
| WiFi v1.3 (h) | 2.1 | 3.3 57% | 7.9 276% | 4.9 133% | 5.5 162% | 7.15 ? 240% |
| Load (h) | 1.1 | 1.3 18% | 1.9 73% | 1.2 9% | 1.502 ? 37% | |
| Cyberpunk 2077 ultra 150cd (h) | 0.7 |
笔记本检查评级
微星 Raider A18 HX 是市场上功能最强大的笔记本电脑之一,适合游戏和高强度工作。不过,您需要始终将其连接到 400 W 的巨大充电器上,因为即使使用 99 Wh 的电池,它的续航时间也最多不超过两小时。
MSI Raider A18 HX A9WIG-080
- 06/01/2025 v8
Benjamin Herzig
 Total Sustainability Score:
 Potential Competitors in Comparison
Image | Model / Review | Price | Weight | Height | Display |
|---|---|---|---|---|---|
1. 85.1%  | MSI Raider A18 HX A9WIG-080 AMD Ryzen 9 9955HX3D ⎘ NVIDIA GeForce RTX 5080 Laptop ⎘ 64 GB Memory, 2048 GB SSD | Amazon: List Price: 4350 Euro | 3.6 kg | 34 mm | 18.00" 3840x2400 252 PPI MiniLED IPS |
2. 84.7%  | MSI Raider 18 HX A14V Intel Core i9-14900HX ⎘ NVIDIA GeForce RTX 4080 Laptop GPU ⎘ 64 GB Memory, 2048 GB SSD | Amazon: 1. $74.99 330W 280W Laptop Charger Fit... 2. $89.99 400W 20V 20A Laptop Charger ... 3. $99.99 400W 20V 20A AC Adapter for ... List Price: 3400 USD | 3.6 kg | 32 mm | 18.00" 3840x2400 252 PPI Mini-LED |
3. 82.5% 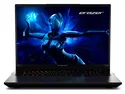 | Medion Erazer Beast 18 X1 MD62731 Intel Core Ultra 9 275HX ⎘ NVIDIA GeForce RTX 5080 Laptop ⎘ 32 GB Memory, SSD | Amazon: List Price: 3700 EUR | 3.6 kg | 30.4 mm | 18.00" 2560x1600 168 PPI IPS |
4. 86.8%  | Aorus Master 18 AM8H Intel Core Ultra 9 275HX ⎘ NVIDIA GeForce RTX 5090 Laptop ⎘ 64 GB Memory, 2048 GB SSD | Amazon: List Price: 5000 EUR | 3.4 kg | 31 mm | 18.00" 2560x1600 168 PPI Mini-LED |
5. 88% 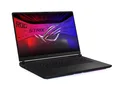 | Asus Strix Scar 18 G835LX Intel Core Ultra 9 275HX ⎘ NVIDIA GeForce RTX 5090 Laptop ⎘ 64 GB Memory, 2048 GB SSD | Amazon: List Price: 5799€ | 3.3 kg | 32 mm | 18.00" 2560x1600 168 PPI Mini-LED |
Transparency
The selection of devices to be reviewed is made by our editorial team. The test sample was provided to the author as a loan by the manufacturer or retailer for the purpose of this review. The lender had no influence on this review, nor did the manufacturer receive a copy of this review before publication. There was no obligation to publish this review. As an independent media company, Notebookcheck is not subjected to the authority of manufacturers, retailers or publishers.
This is how Notebookcheck is testing
Every year, Notebookcheck independently reviews hundreds of laptops and smartphones using standardized procedures to ensure that all results are comparable. We have continuously developed our test methods for around 20 years and set industry standards in the process. In our test labs, high-quality measuring equipment is utilized by experienced technicians and editors. These tests involve a multi-stage validation process. Our complex rating system is based on hundreds of well-founded measurements and benchmarks, which maintains objectivity. Further information on our test methods can be found here.

