结论 - Beast 18 X1 性能不错,但仍有改进空间
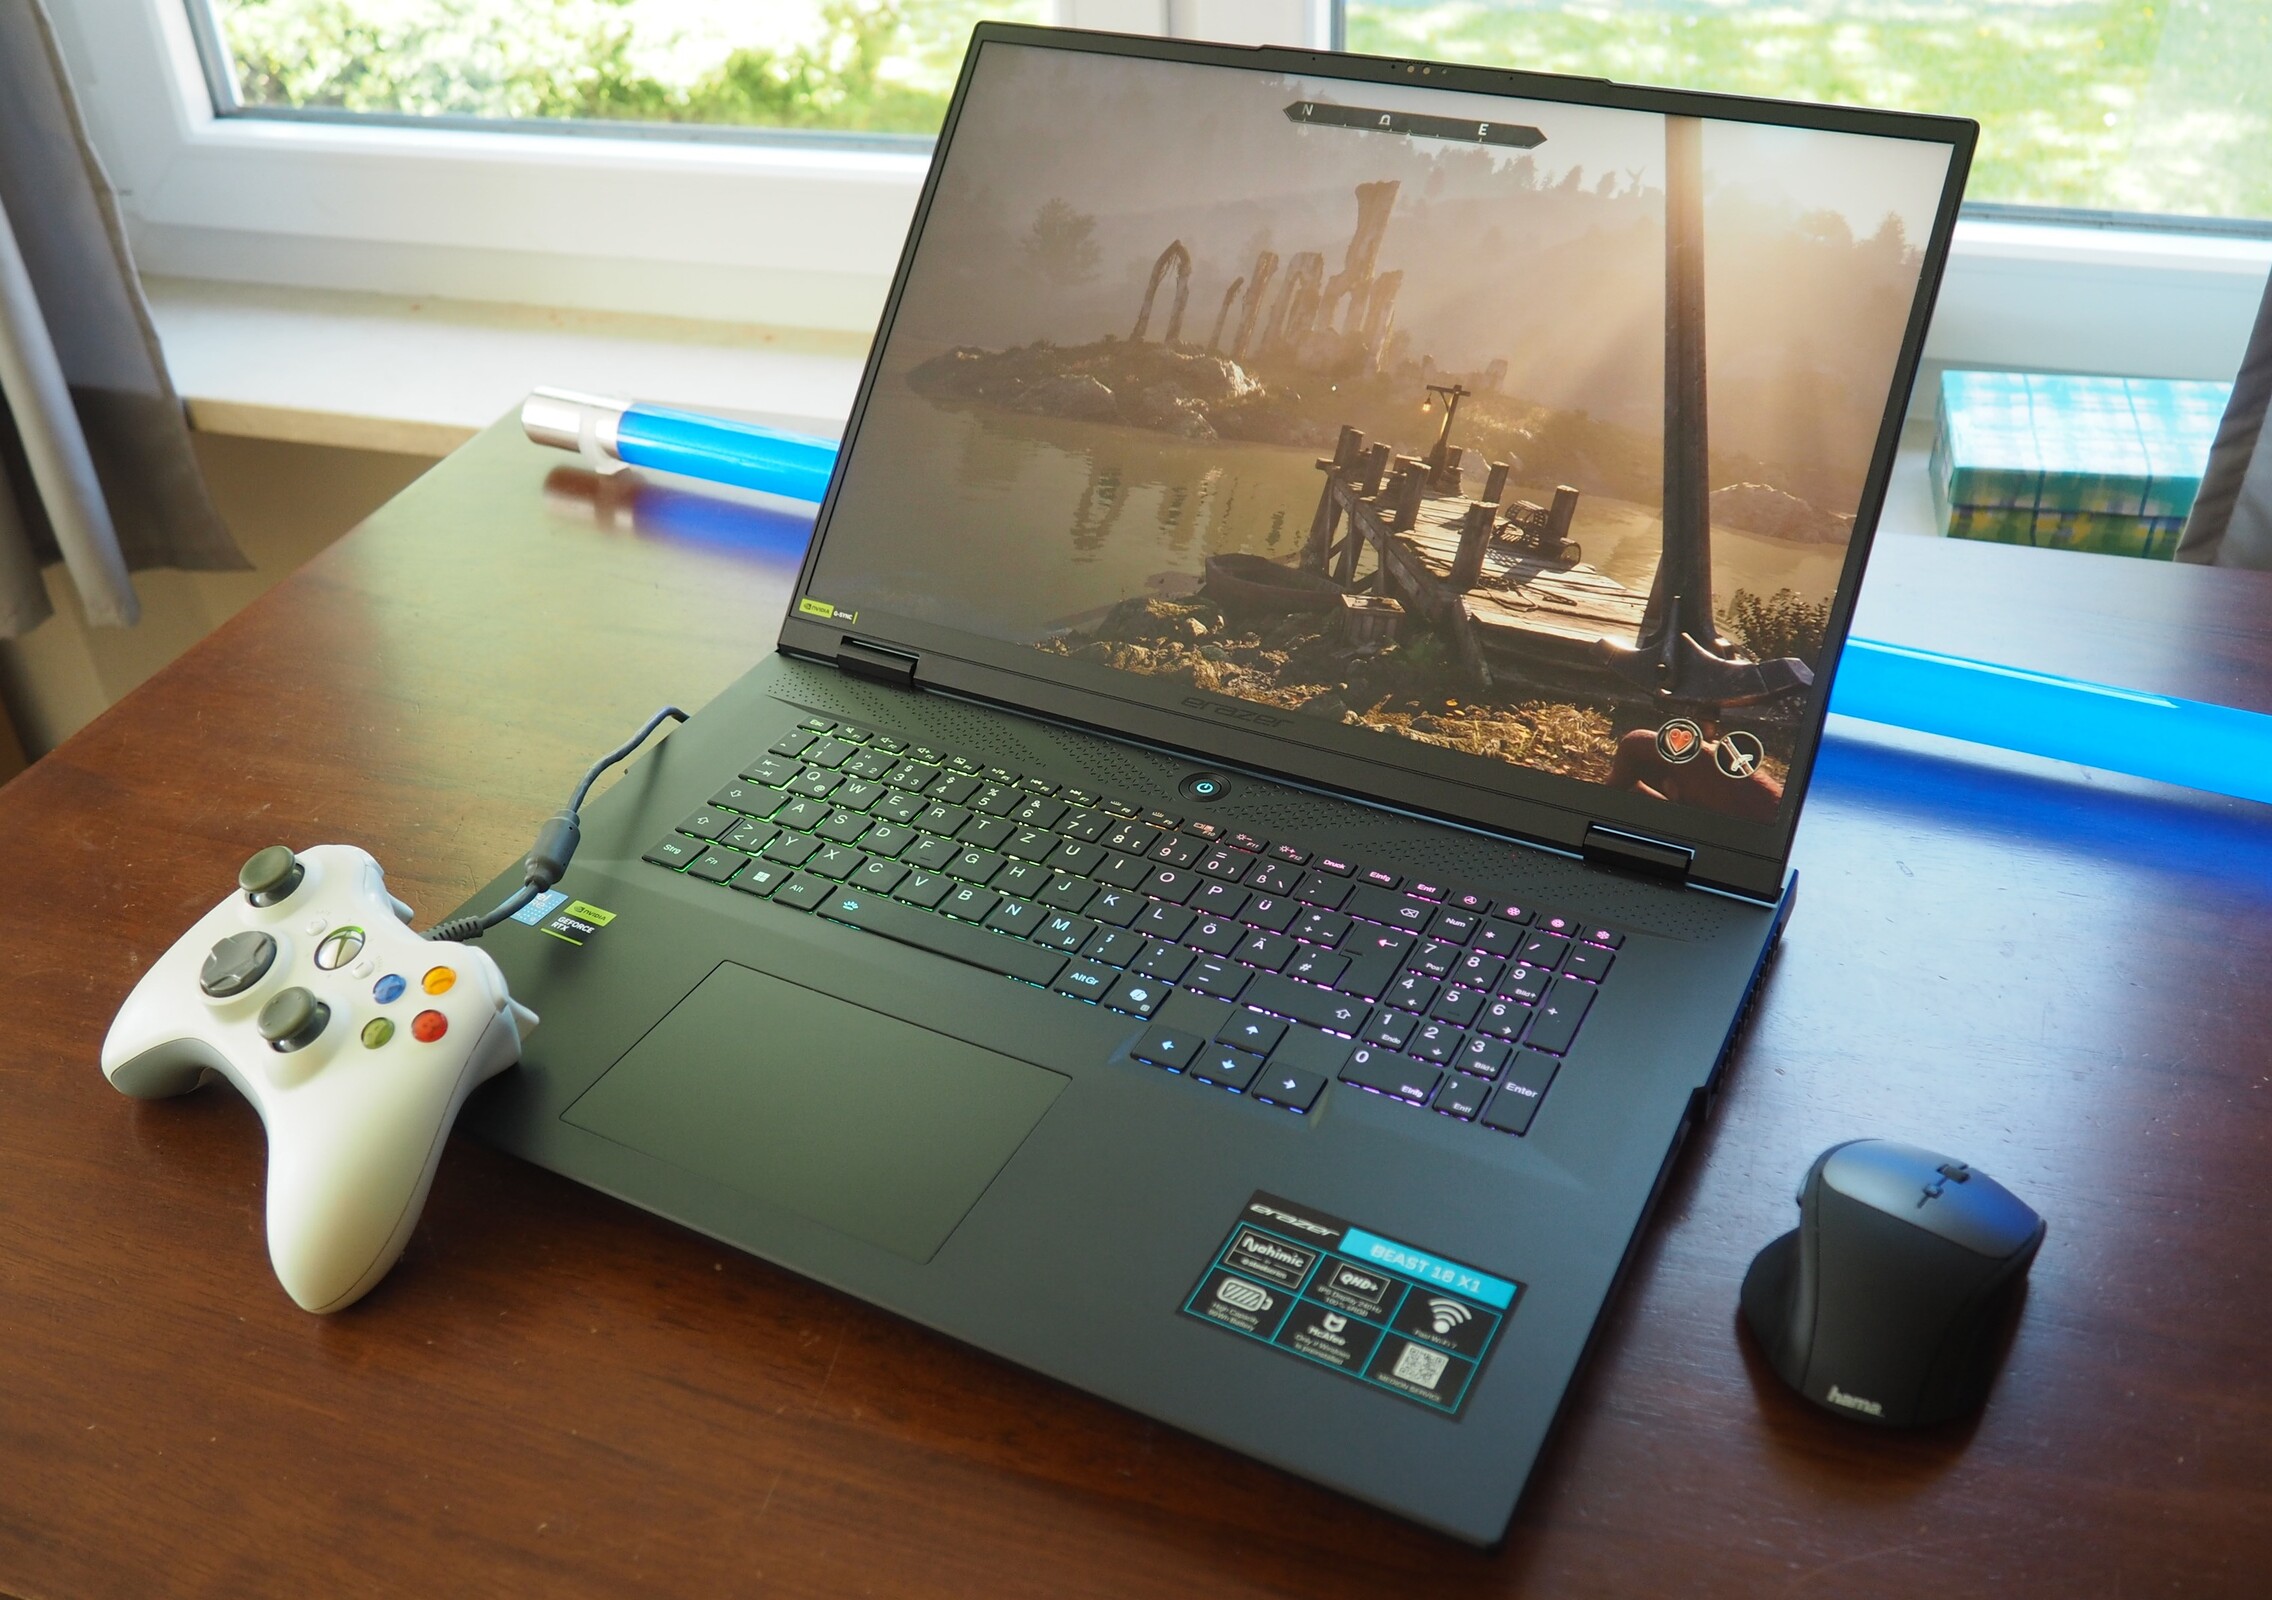
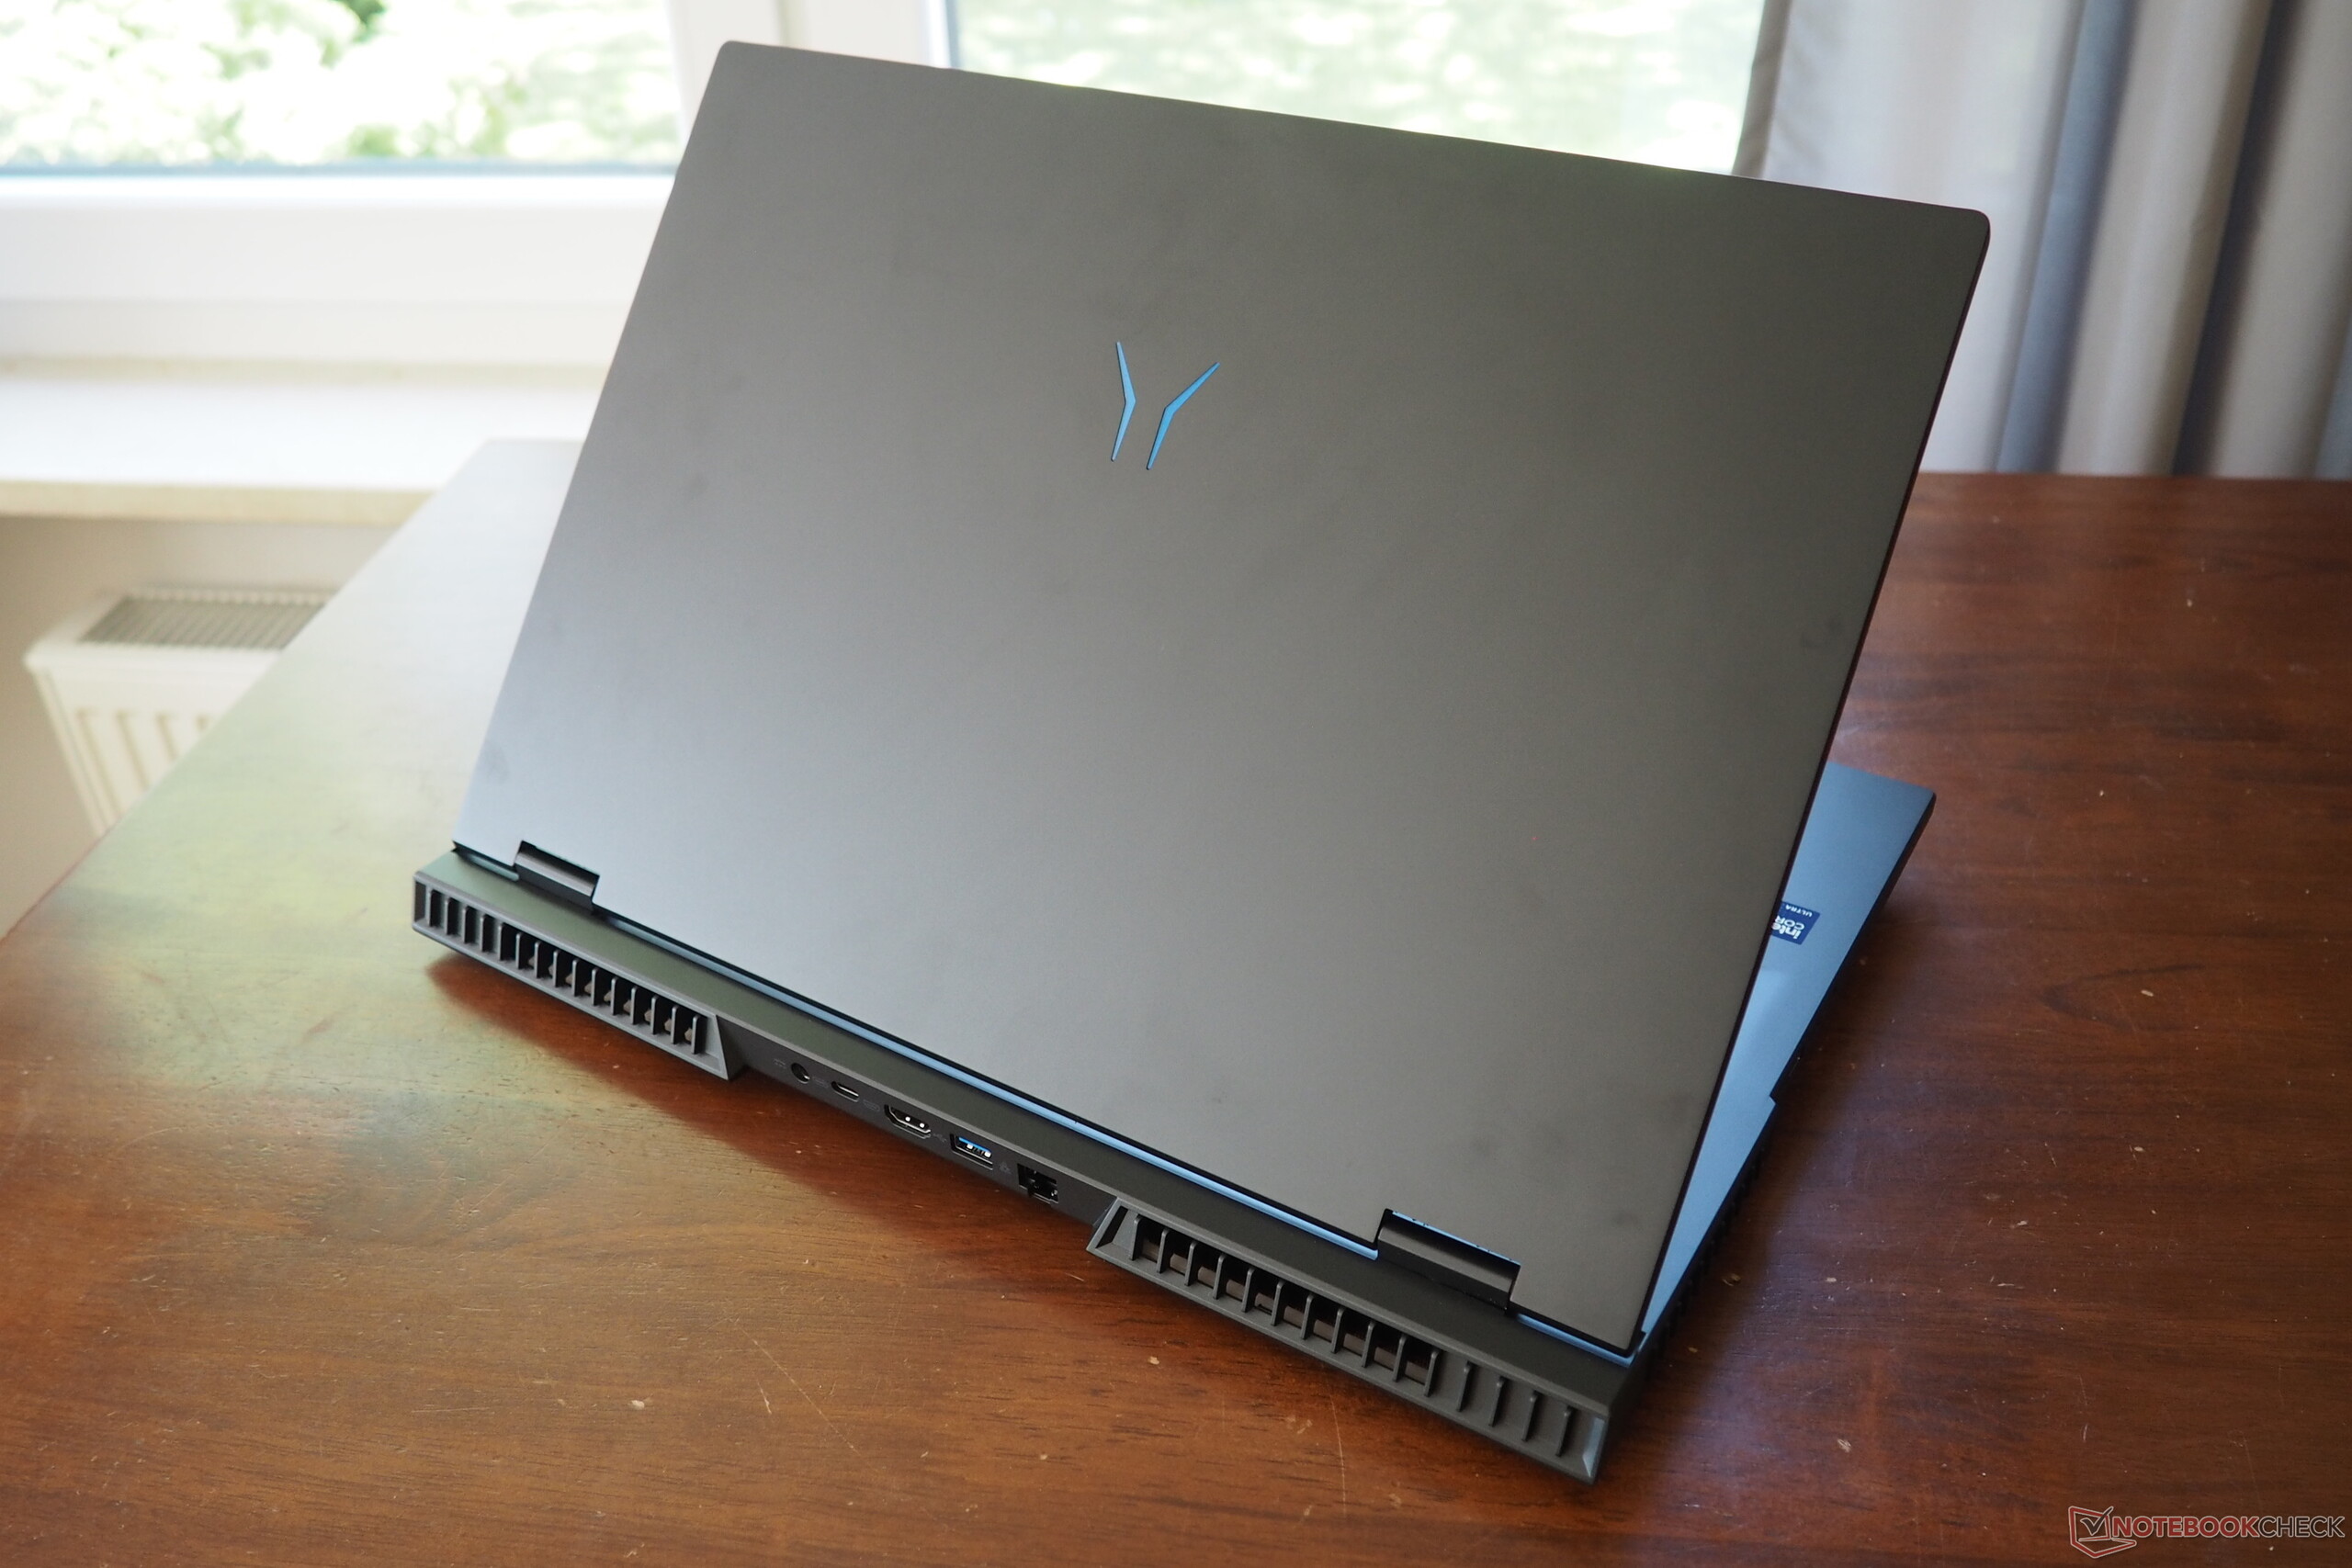
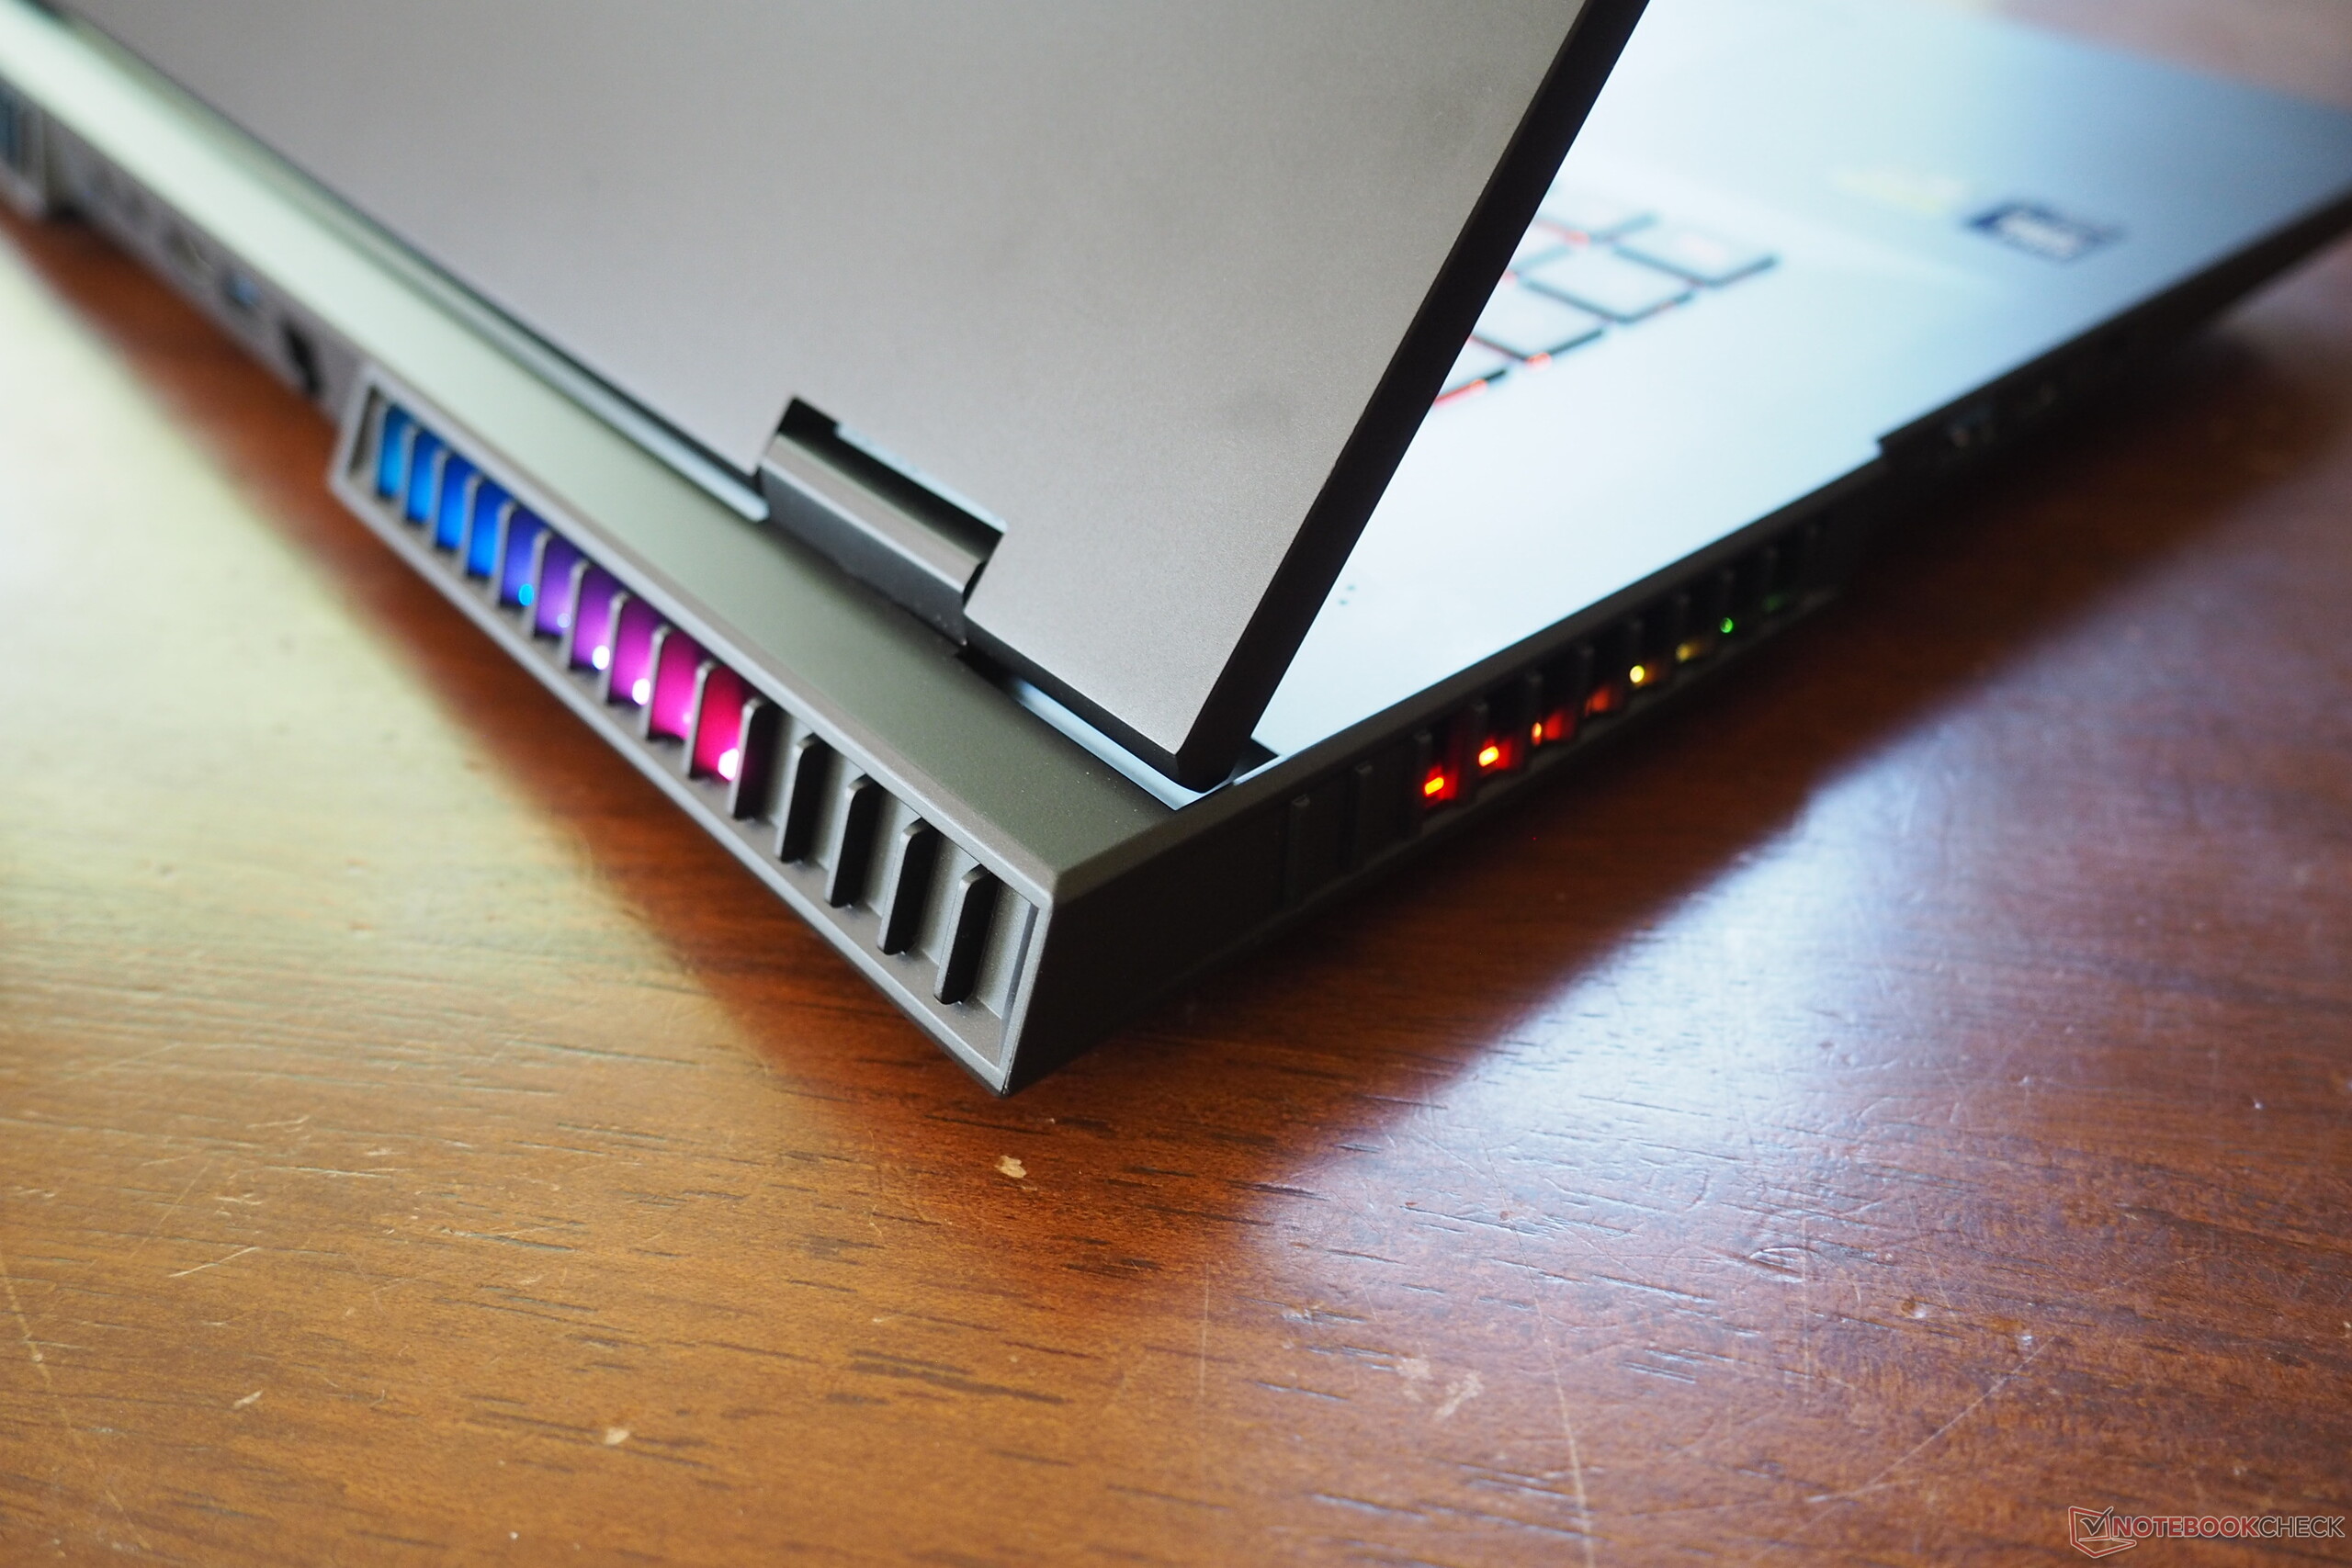
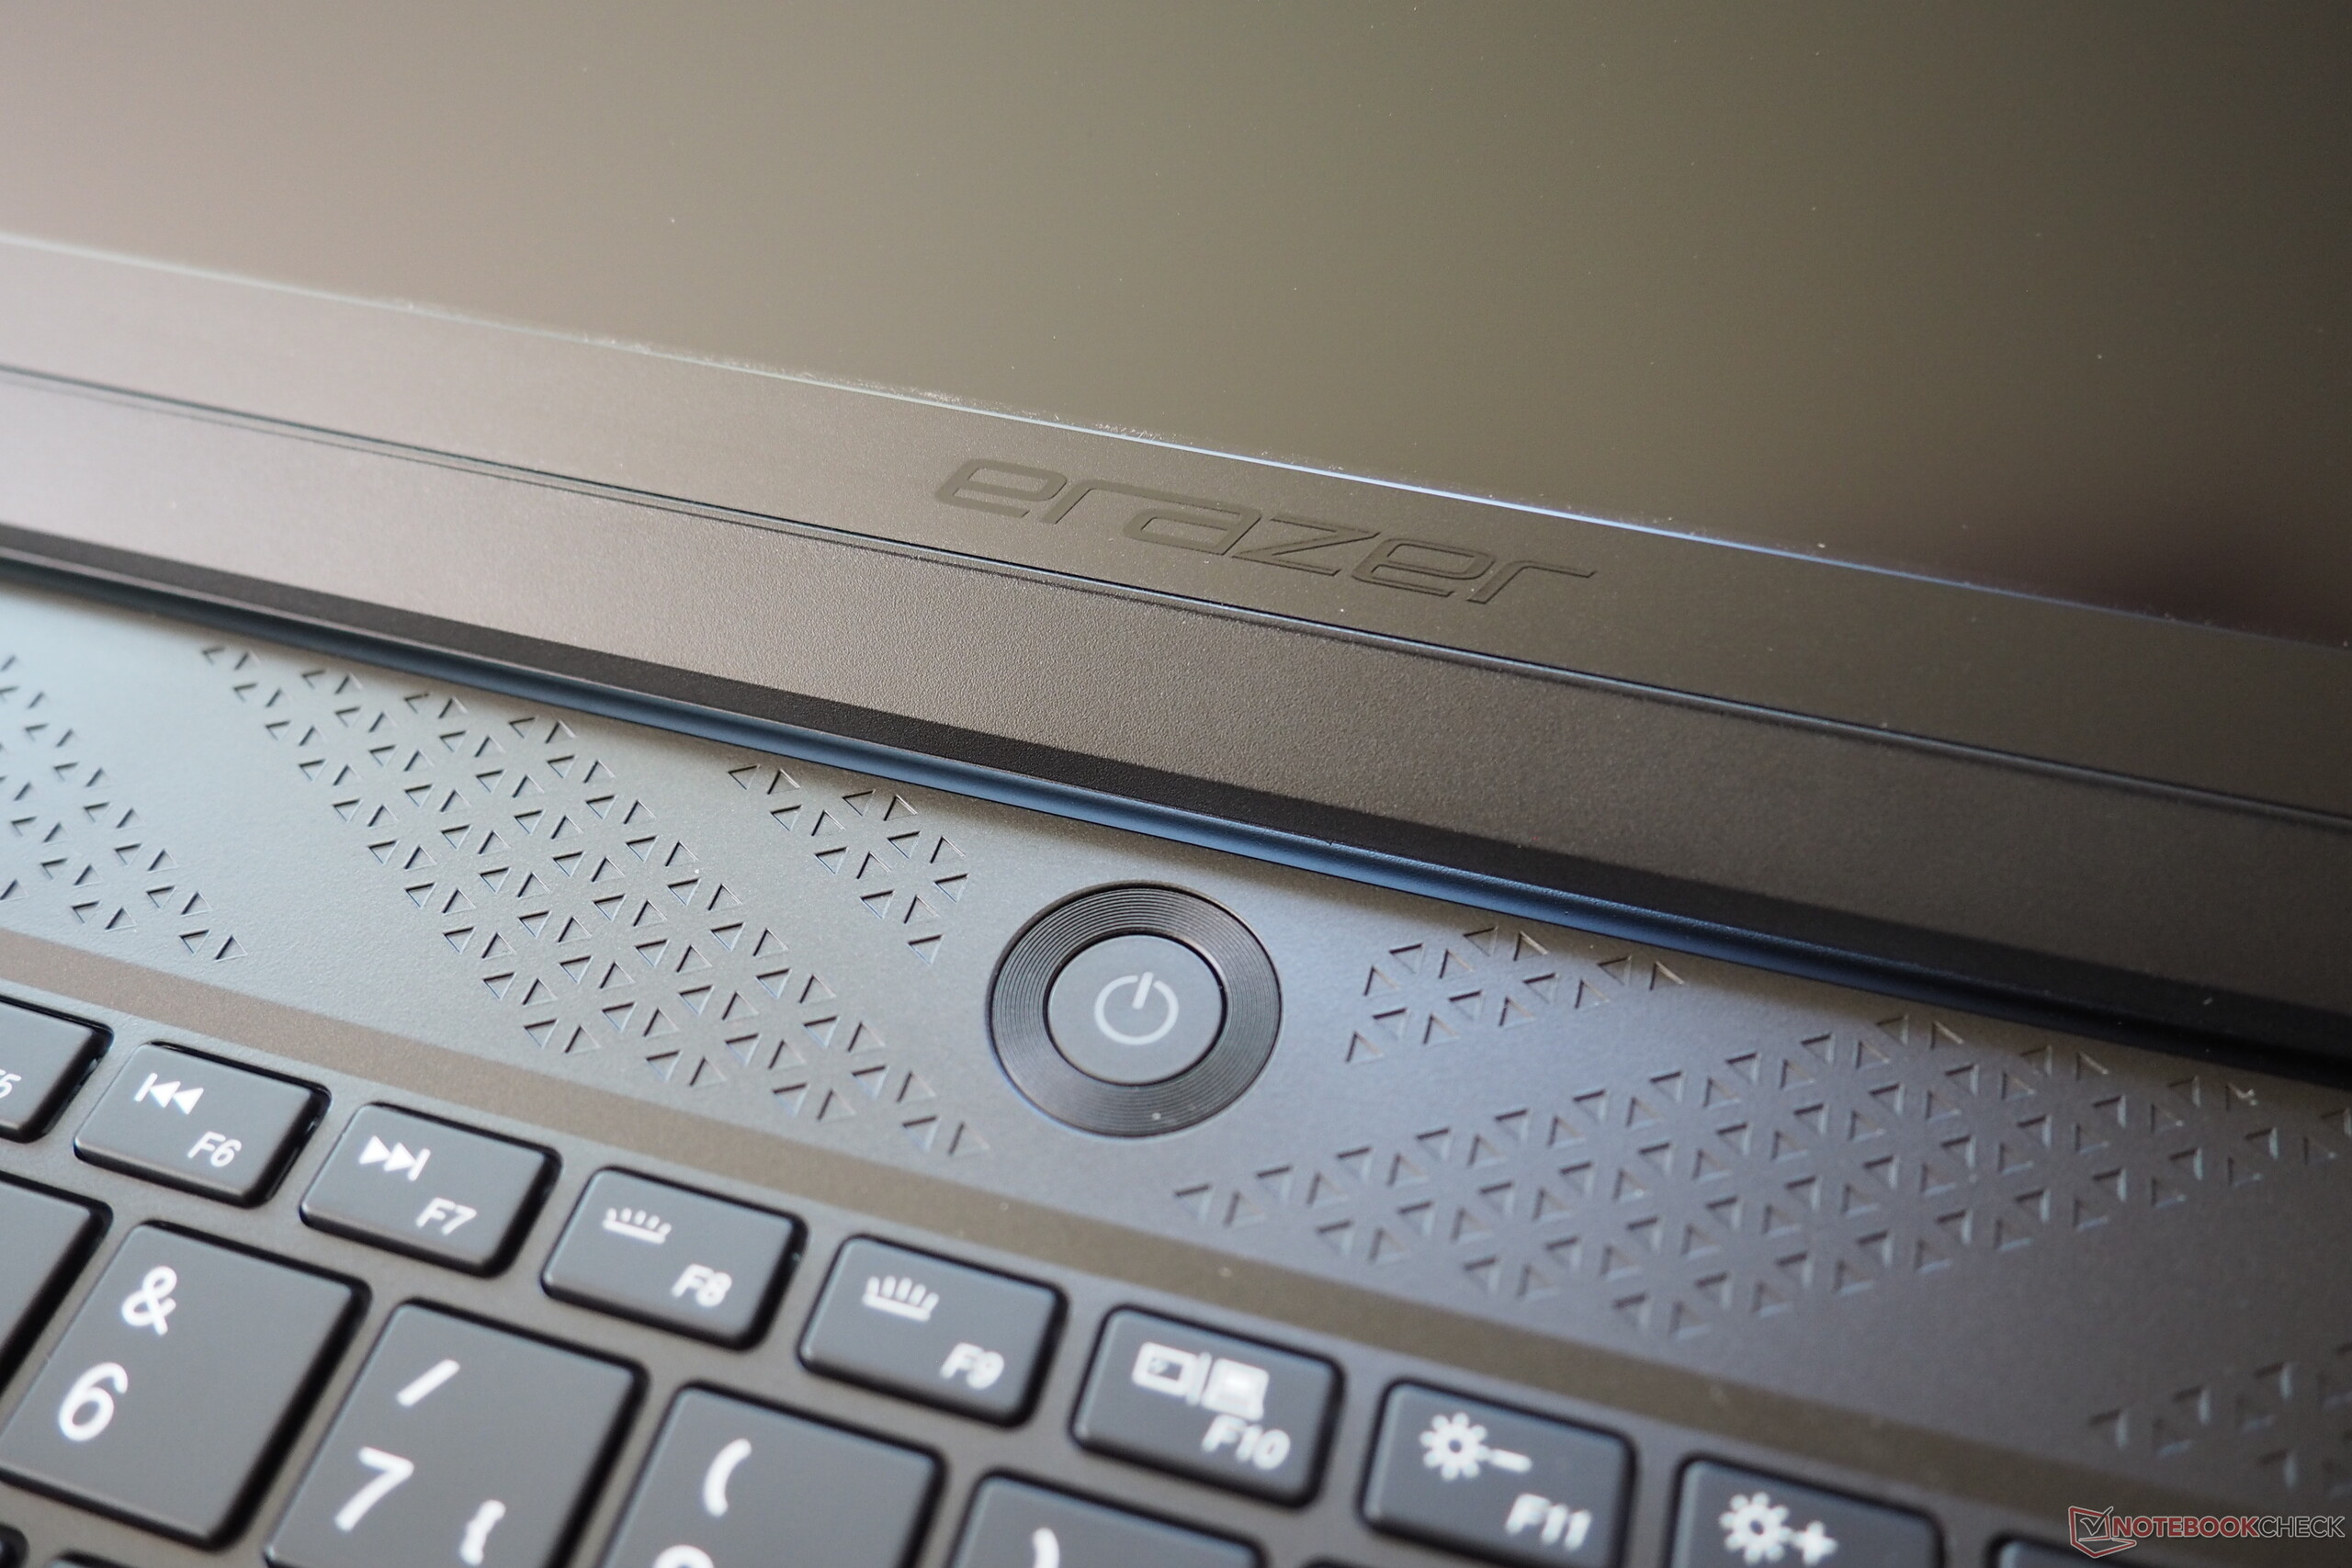
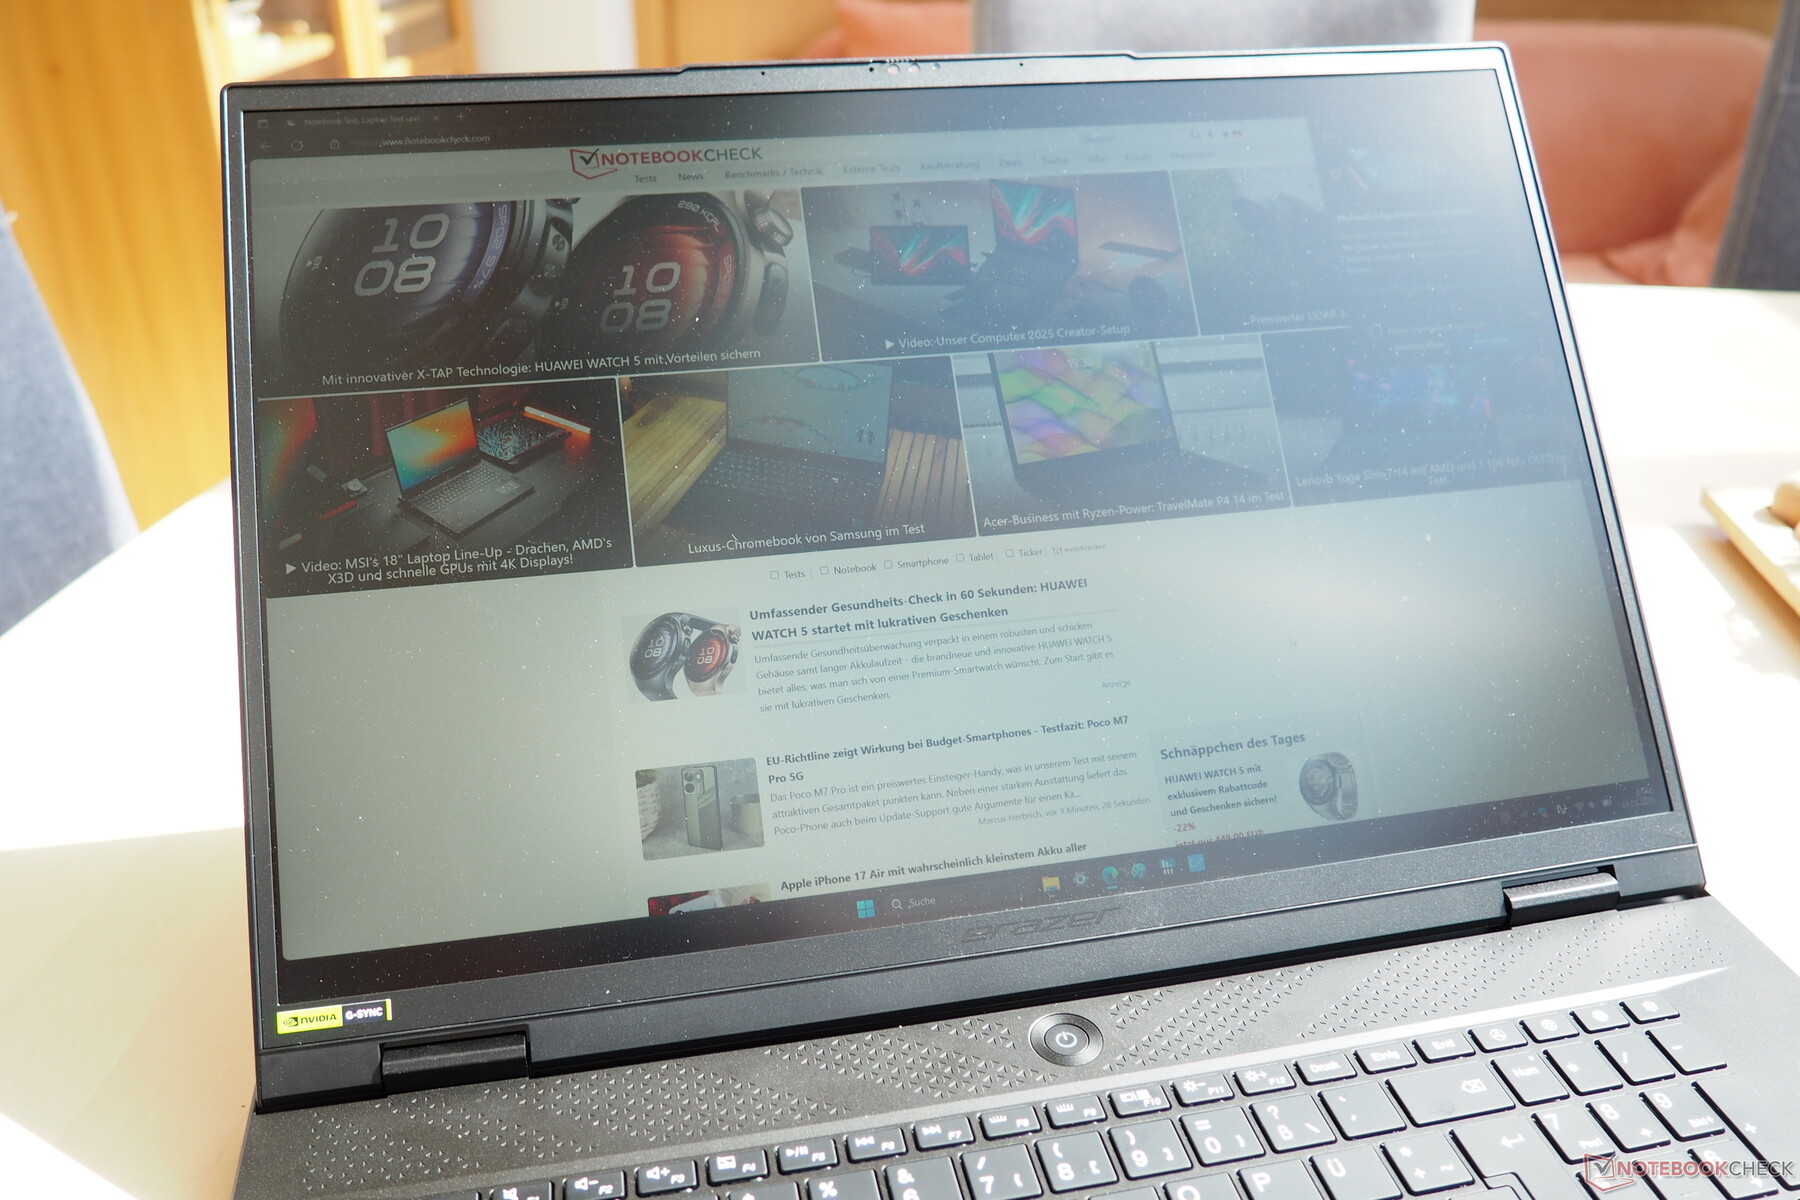
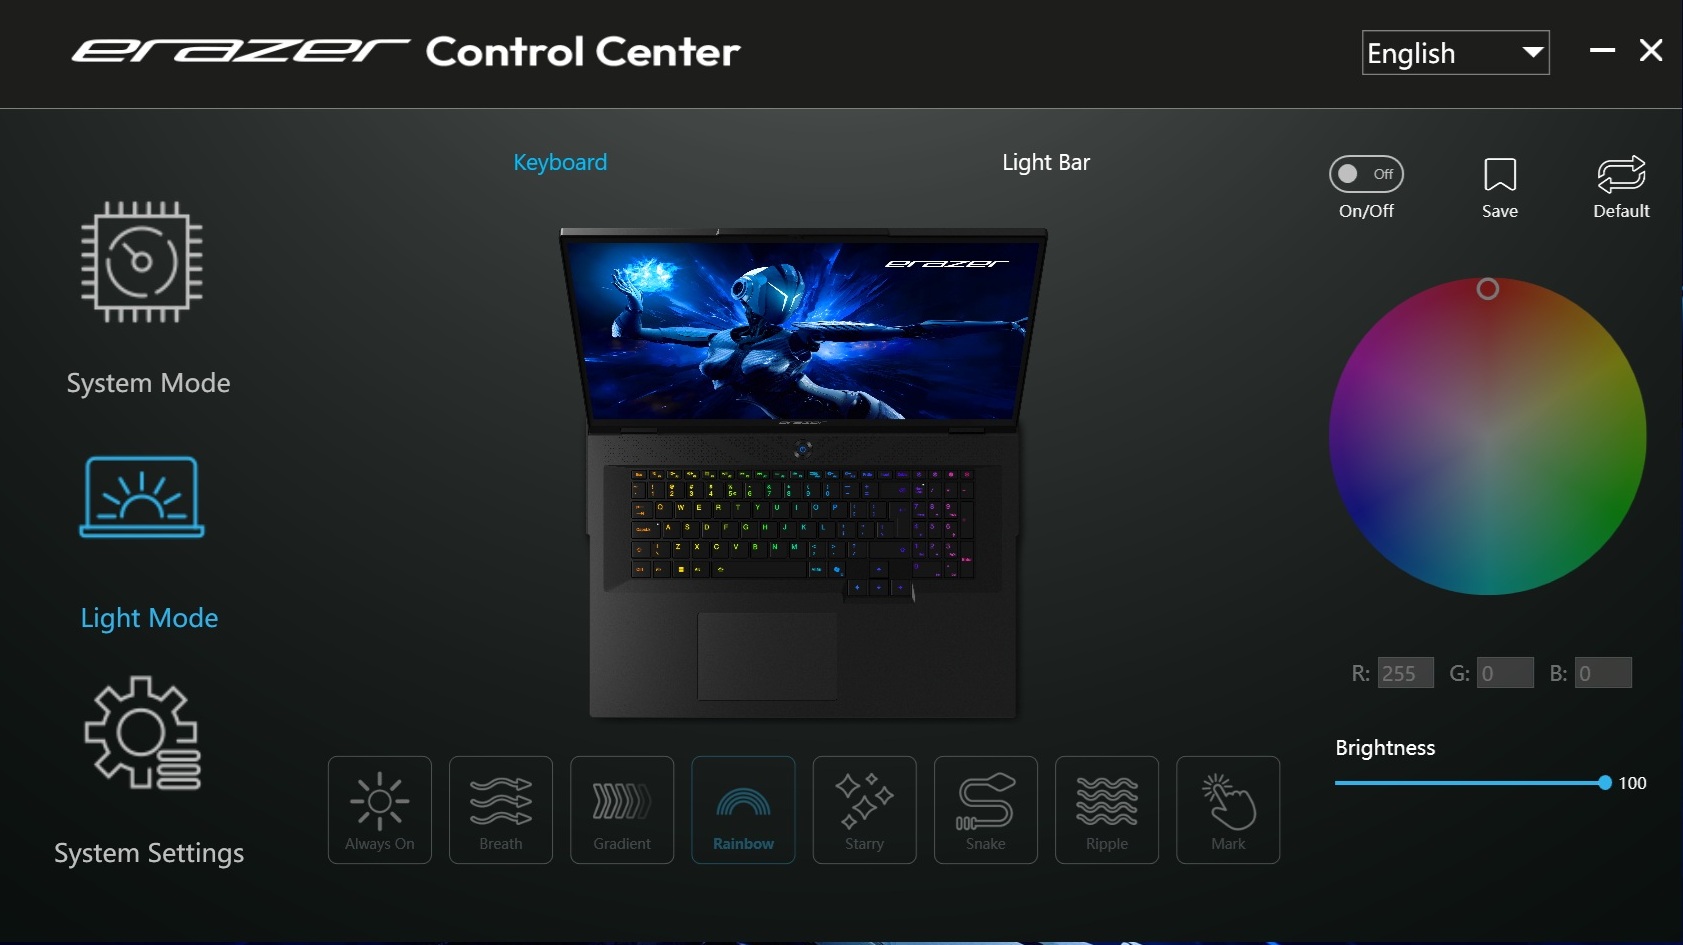
如果你想要一台功能强大的台式机替代品,你可能会喜欢 Erazer Beast 18 X1。虽然这台 18 英寸的笔记本电脑在负载情况下(甚至在平衡模式下)会变得非常吵闹,但与许多其他游戏笔记本电脑一样,对噪音不是很敏感和/或使用耳机进行游戏的用户还是可以忍受其音量的。这台庞大的设备外形稳重,连接功能相当丰富,包括 Thunderbolt 5、RGB 键盘以及侧面和背面的时尚灯带(见照片)。输入设备还算不错,但该机型在这方面确实无法给人留下深刻印象。
Nvidia 的GeForce RTX 5080 笔记本电脑的性能在预期范围内,而英特尔的酷睿 Ultra 9 275HX 在长时间负载情况下性能会有所下降(稍后详述)。竞争对手包括 Aorus Master 18和 华硕 ROG Strix Scar 18我们使用更强大的 RTX 5090 笔记本电脑对它们进行了测试。
Pros
Cons
规格
案例

设备
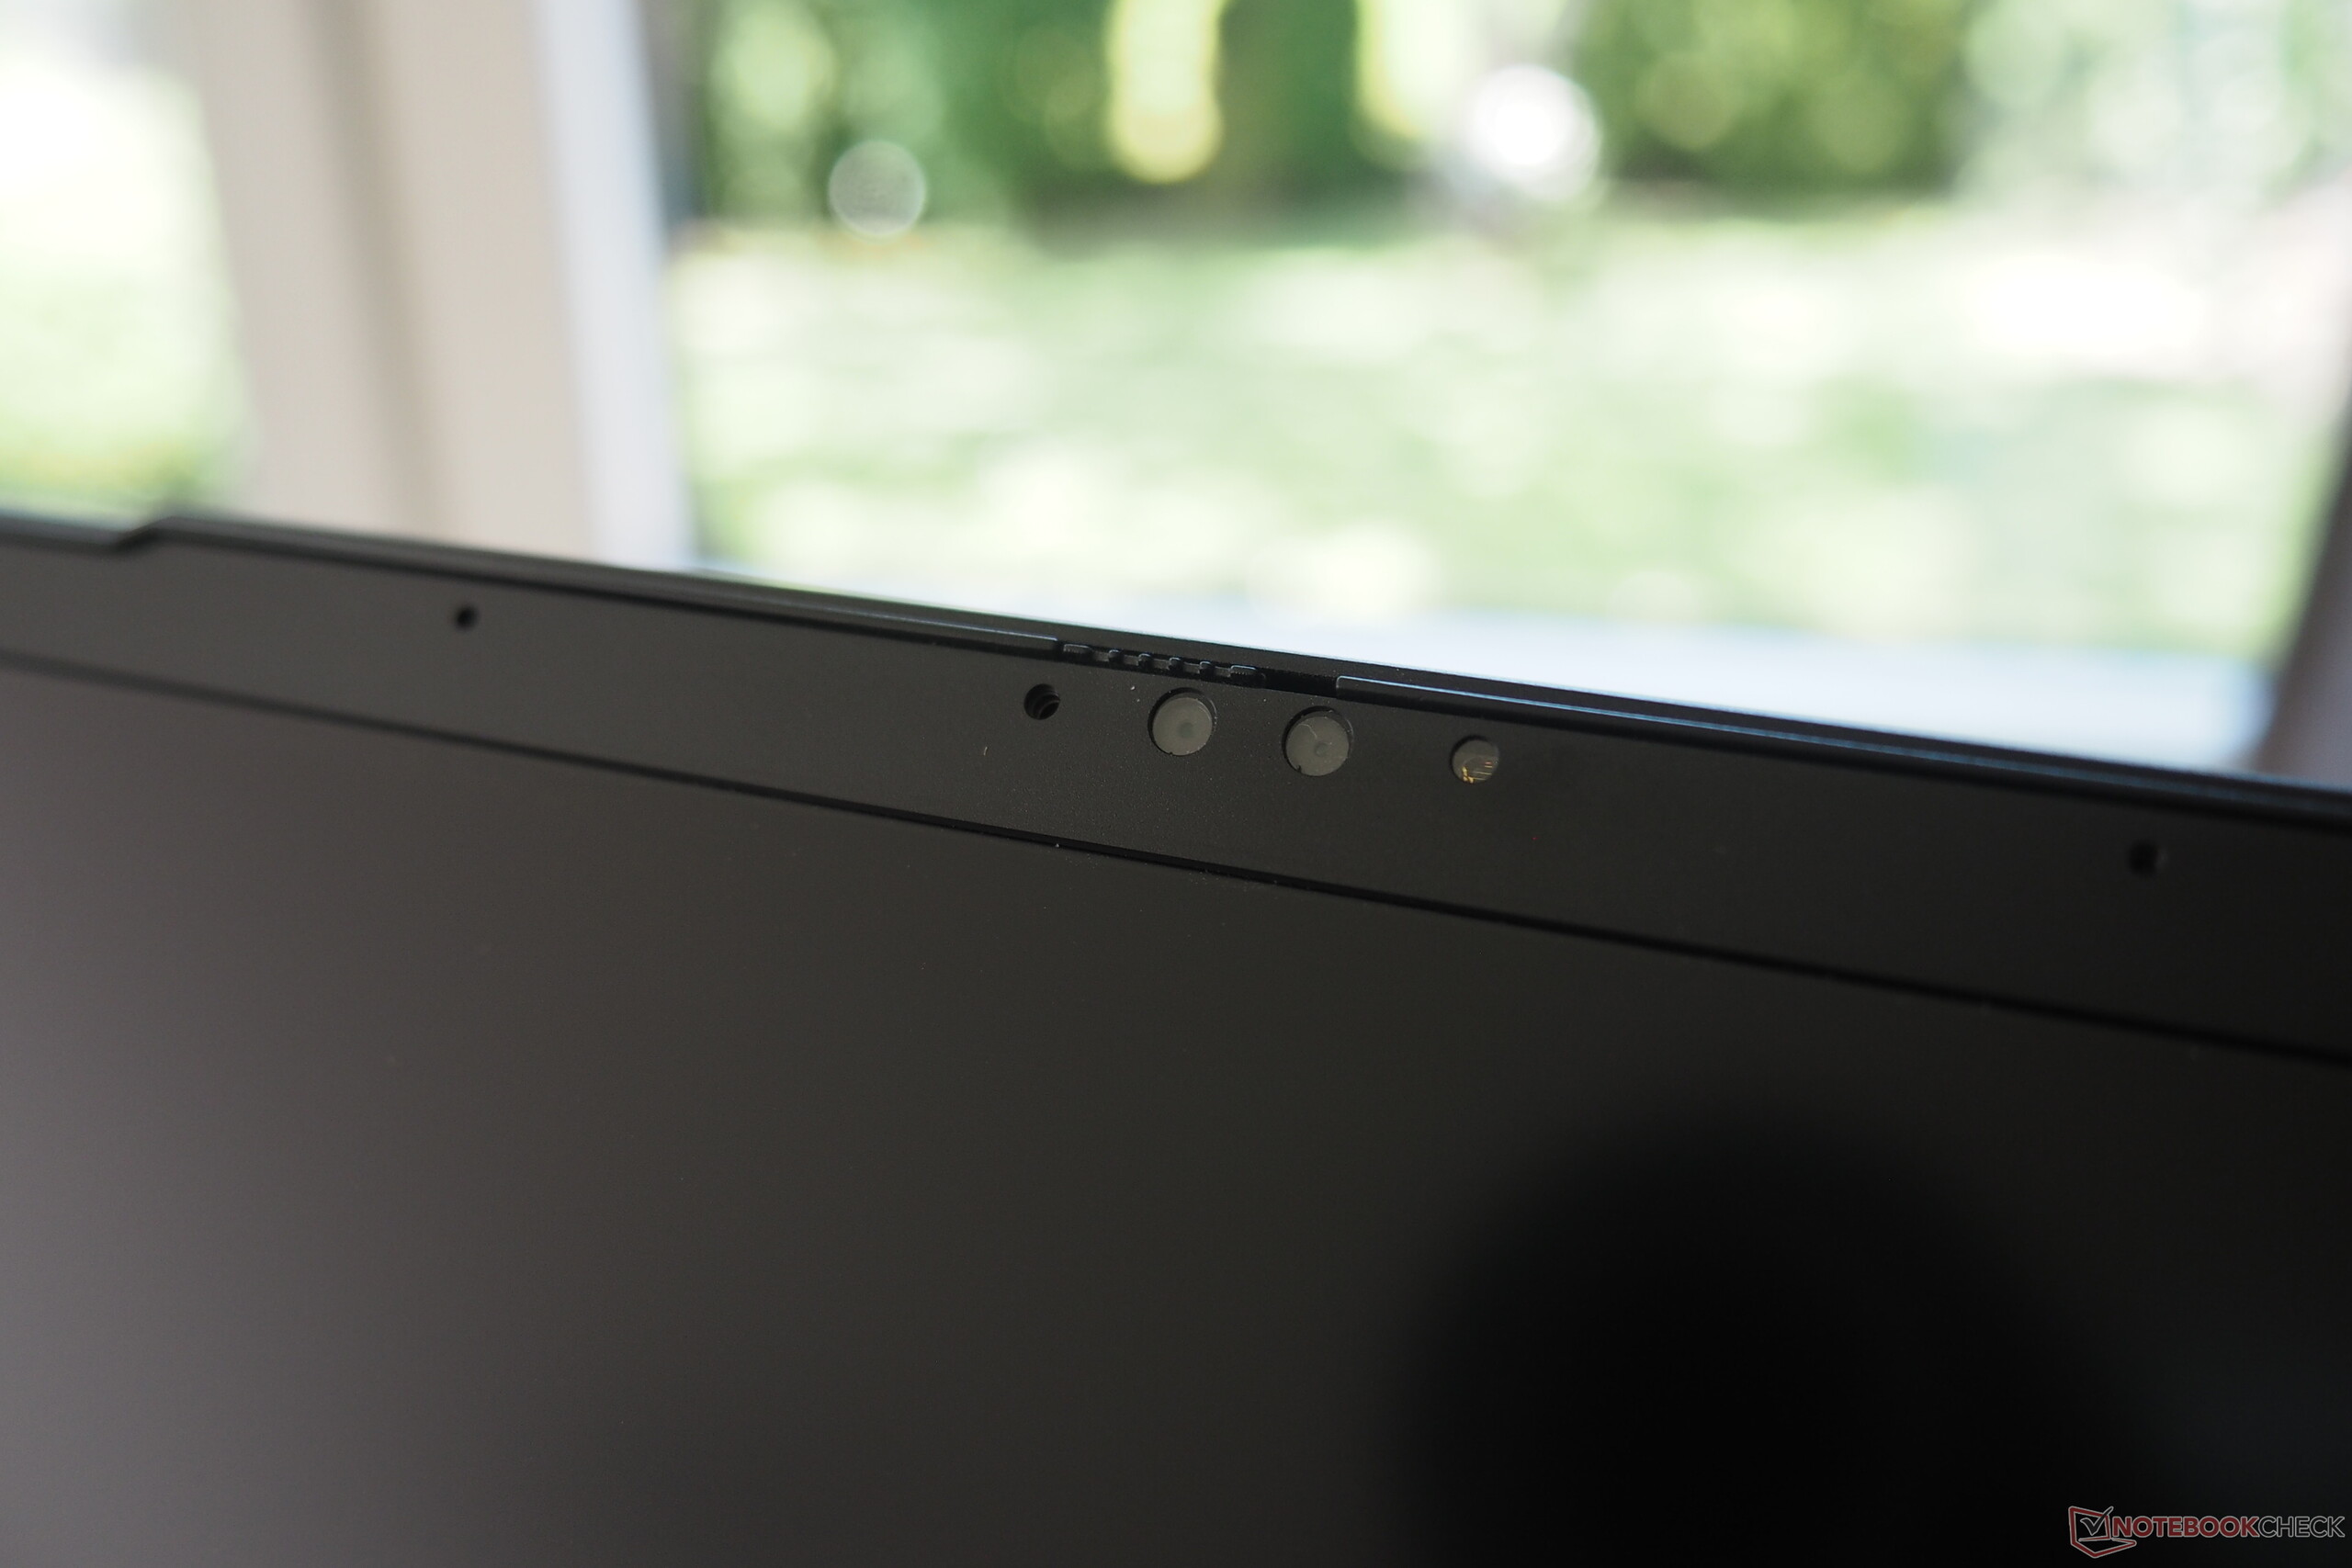
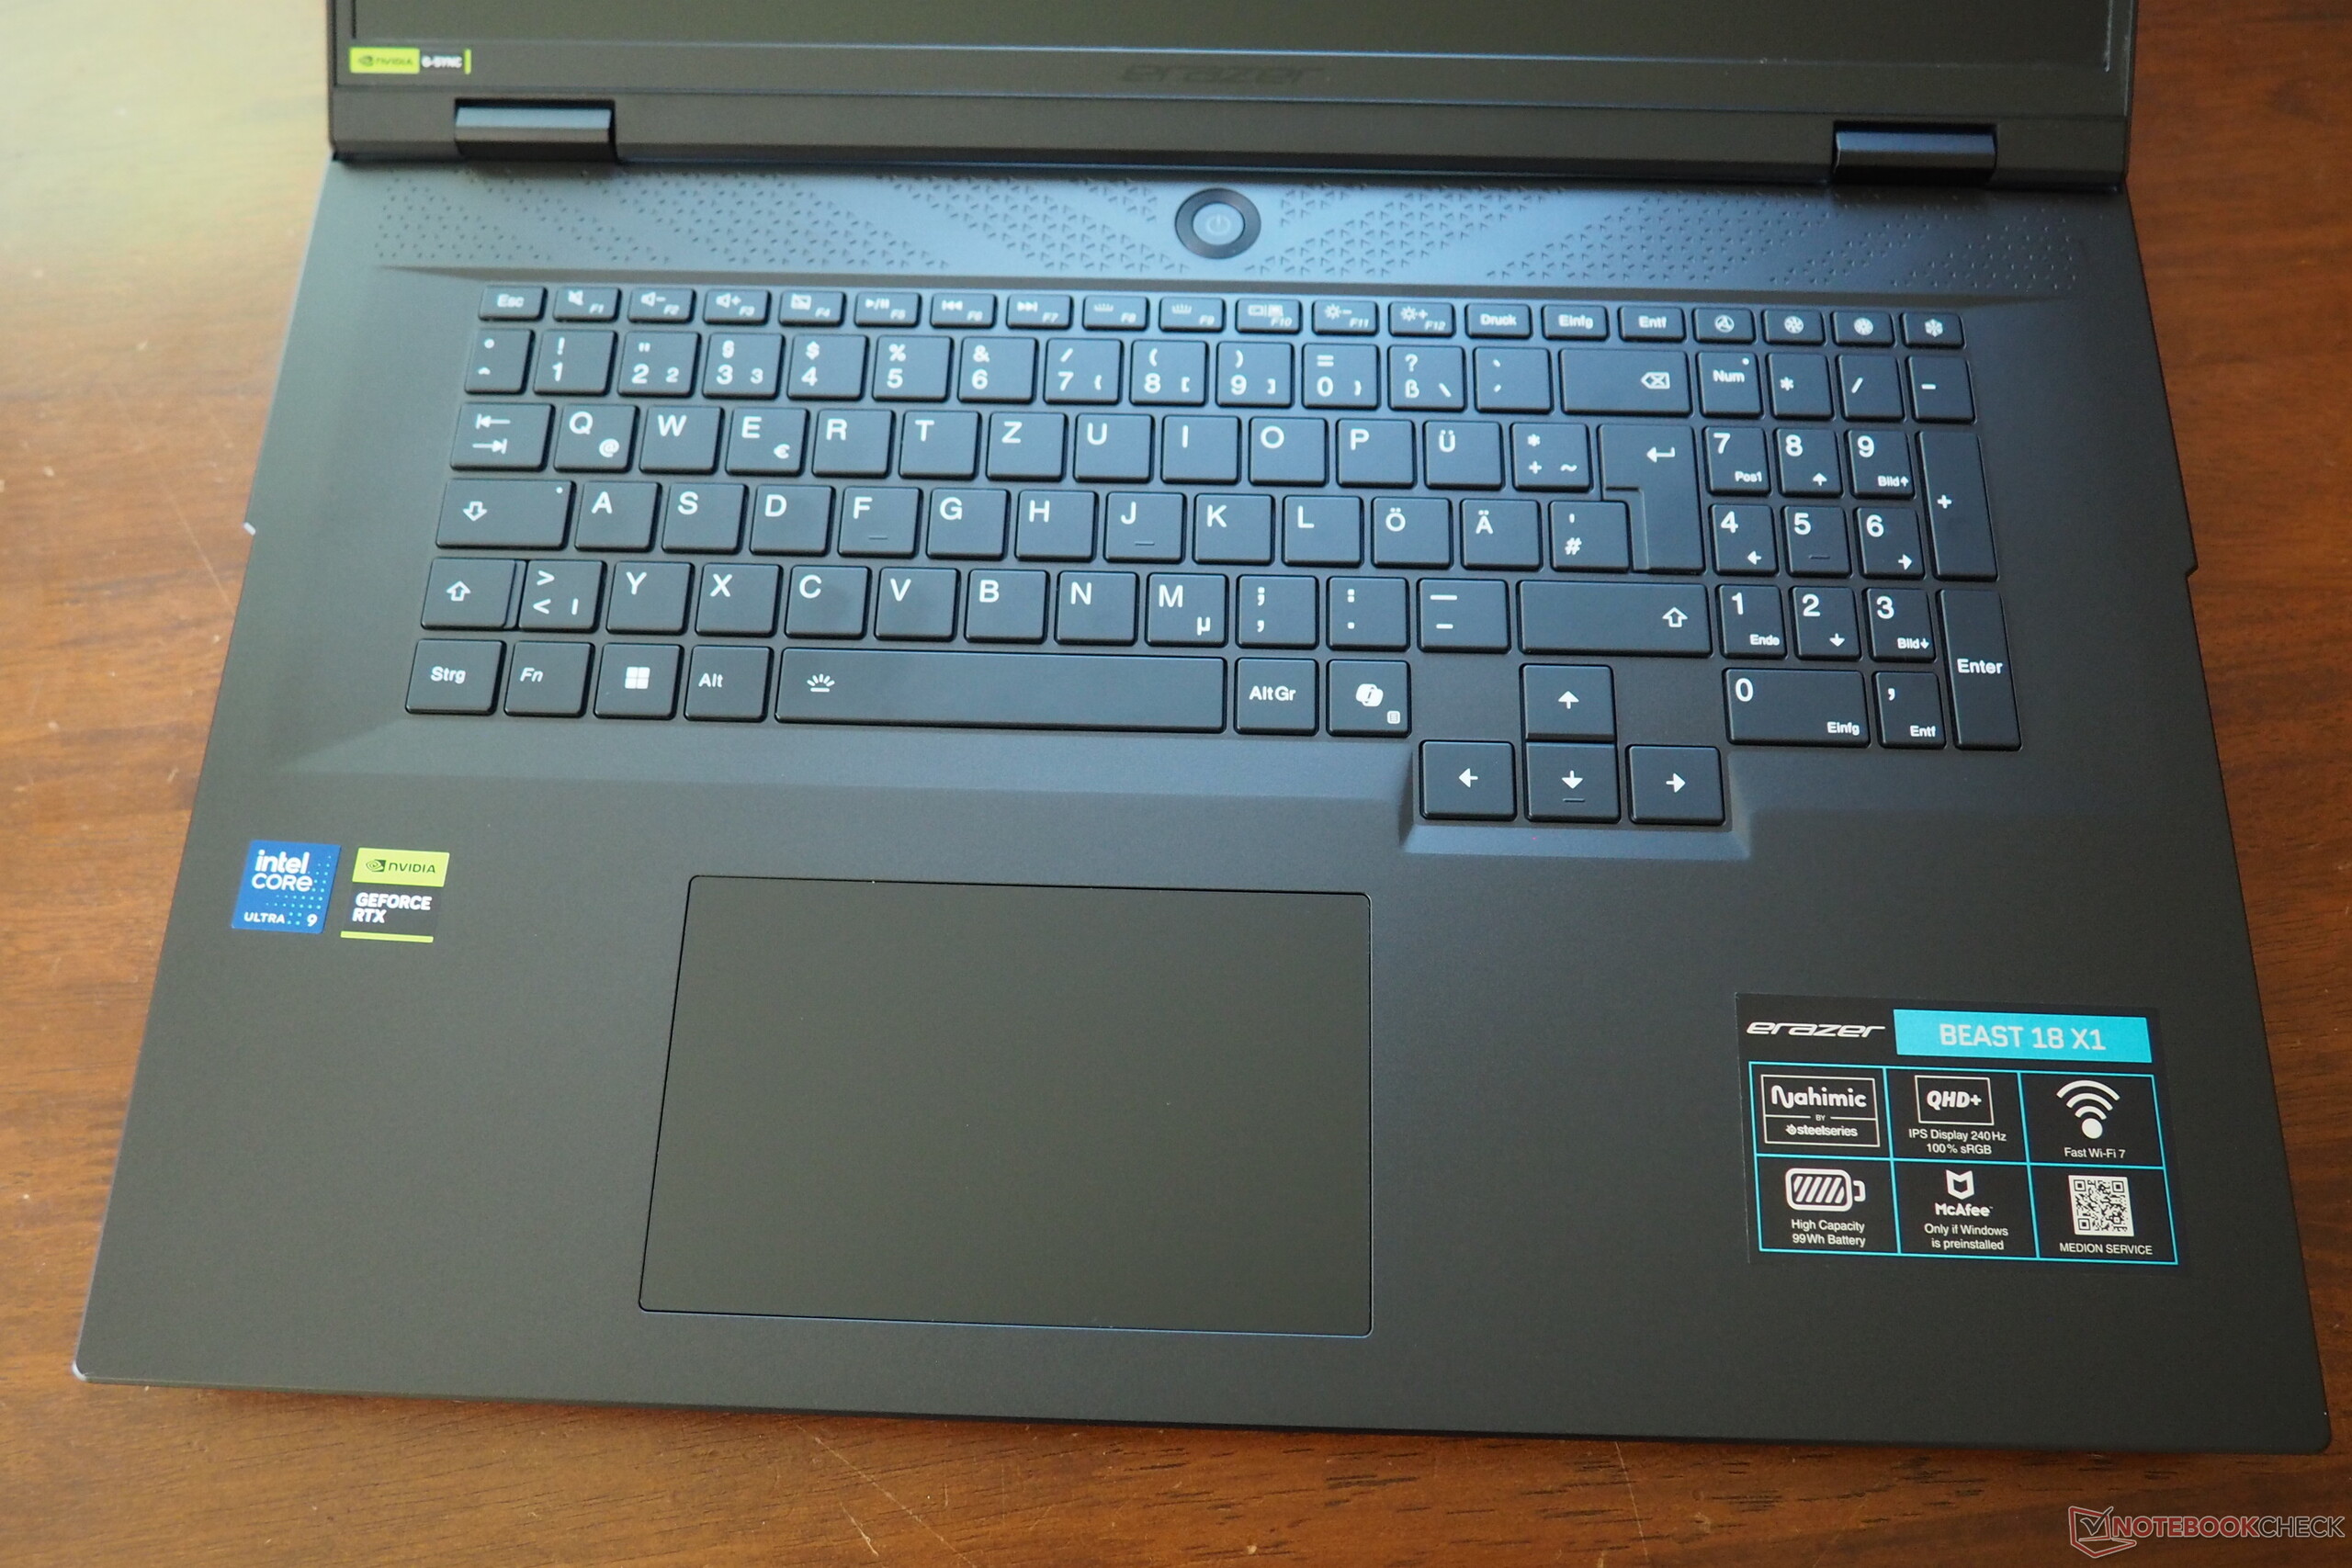
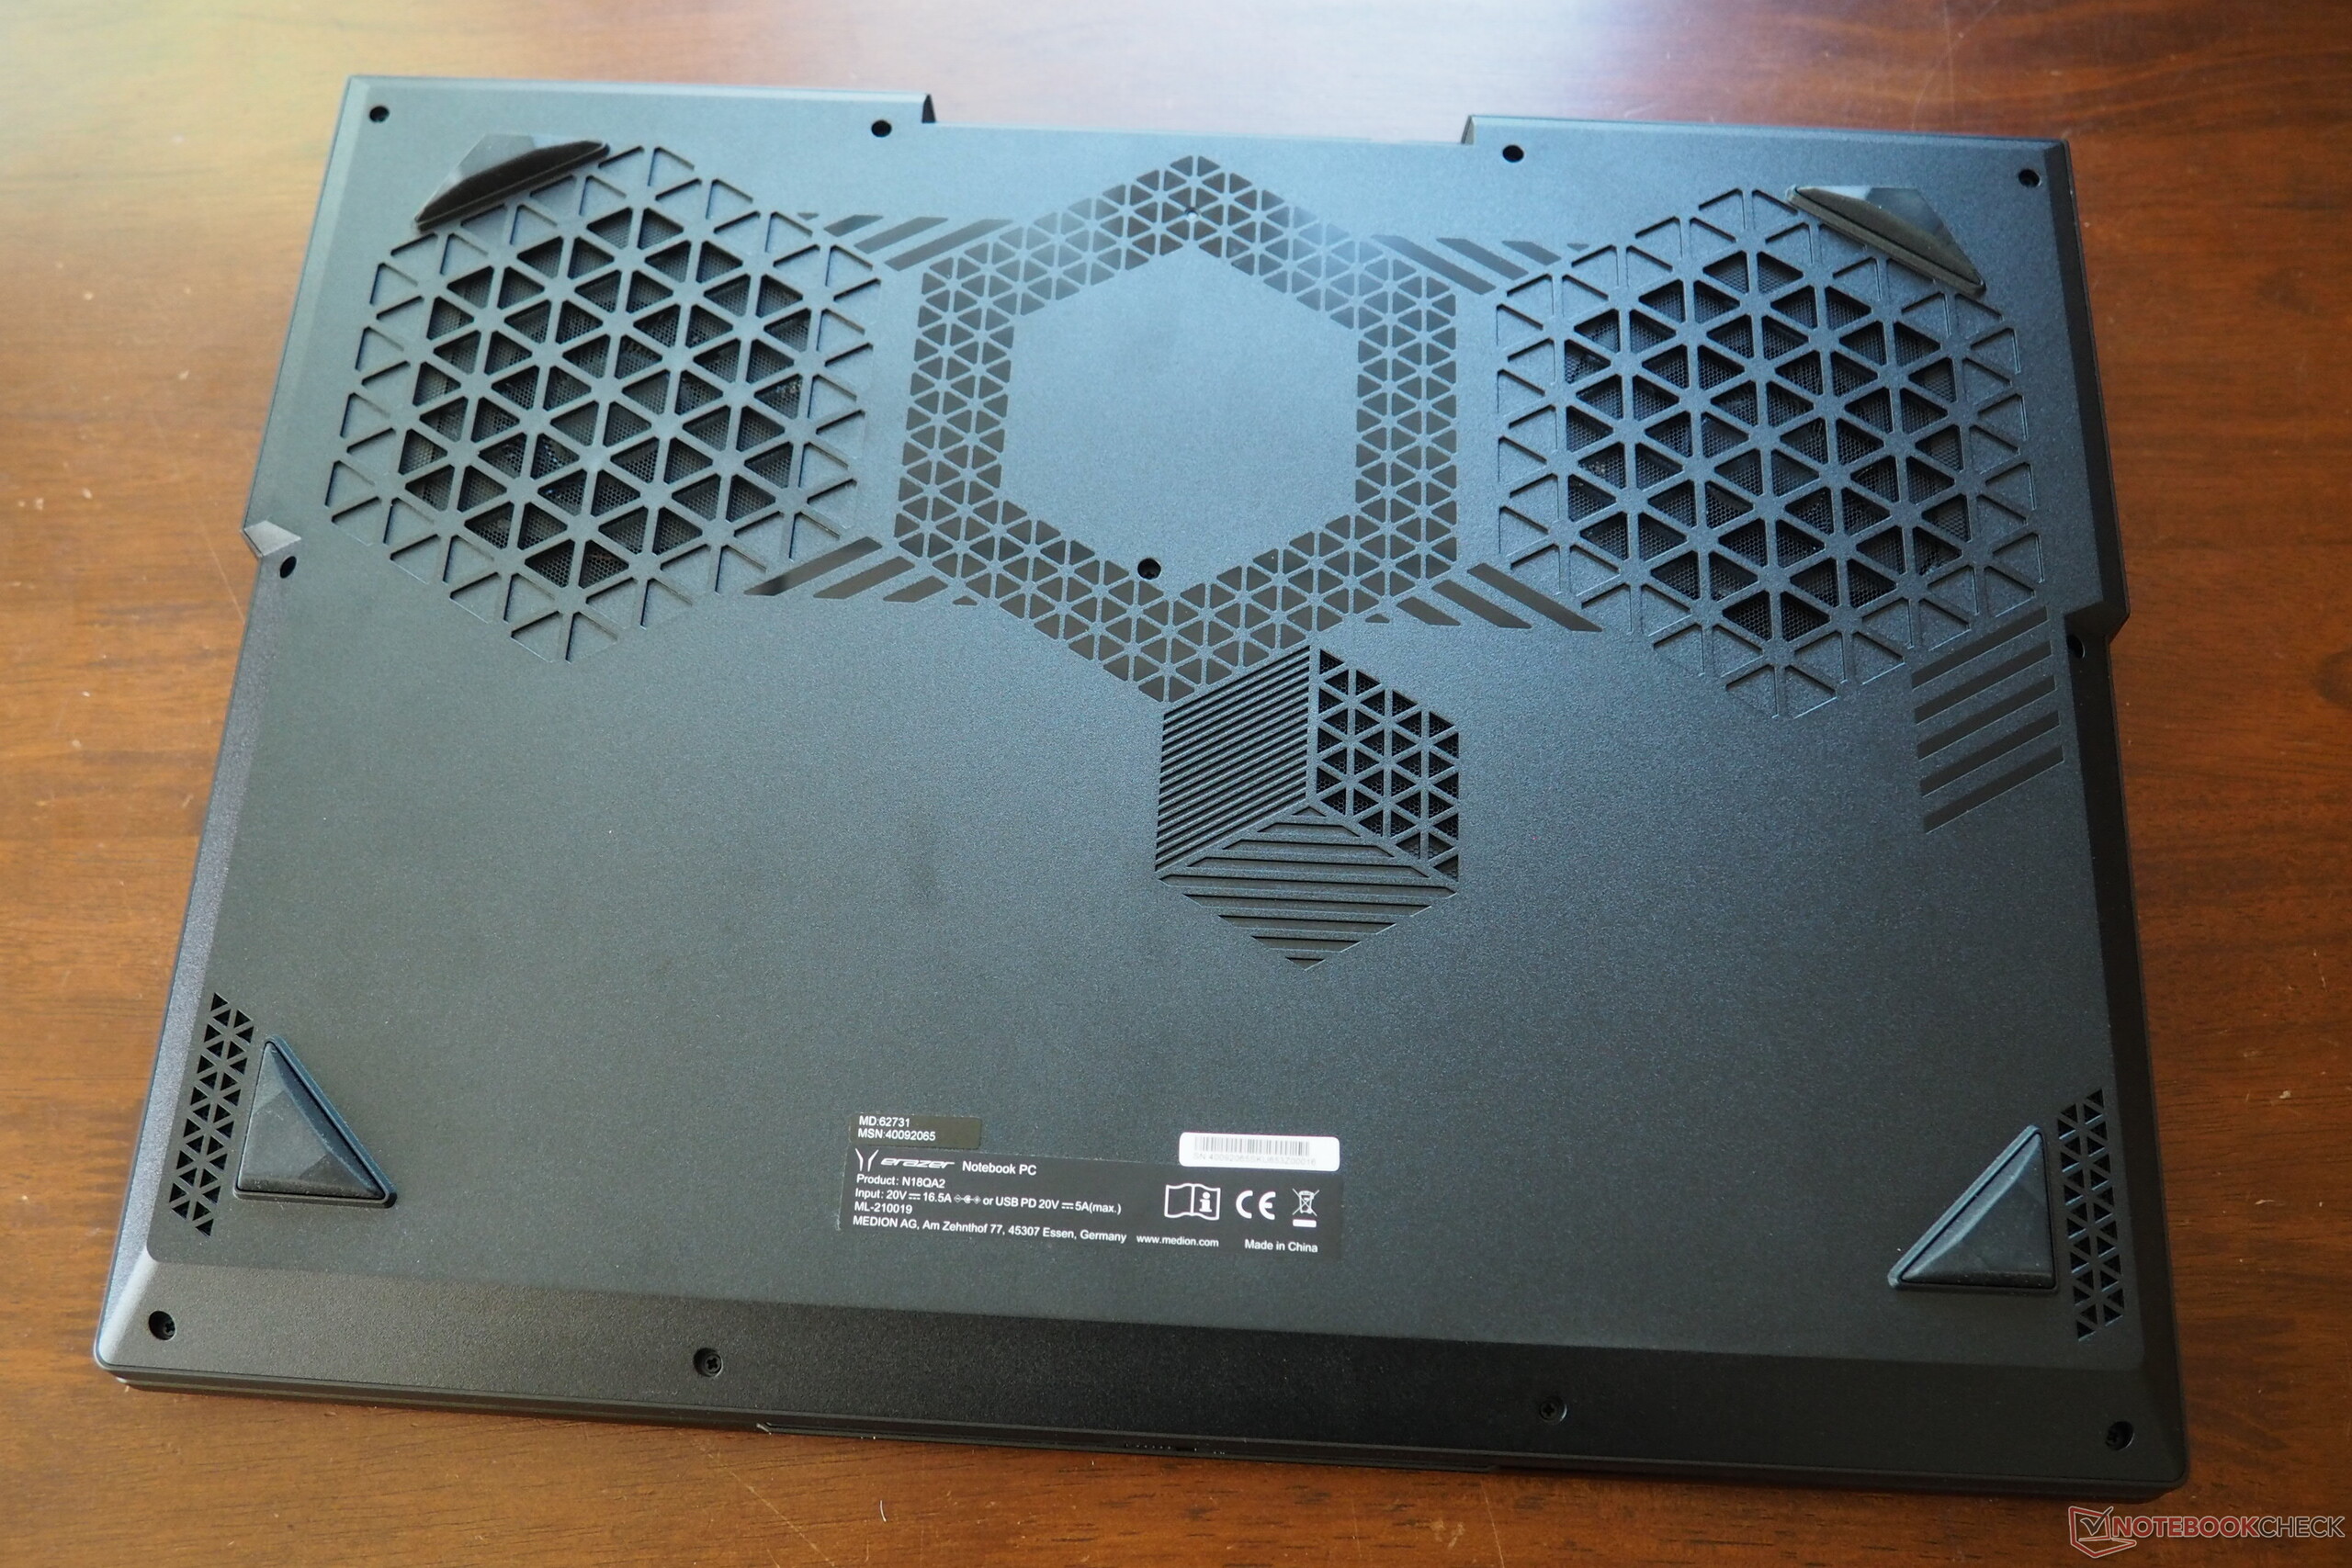
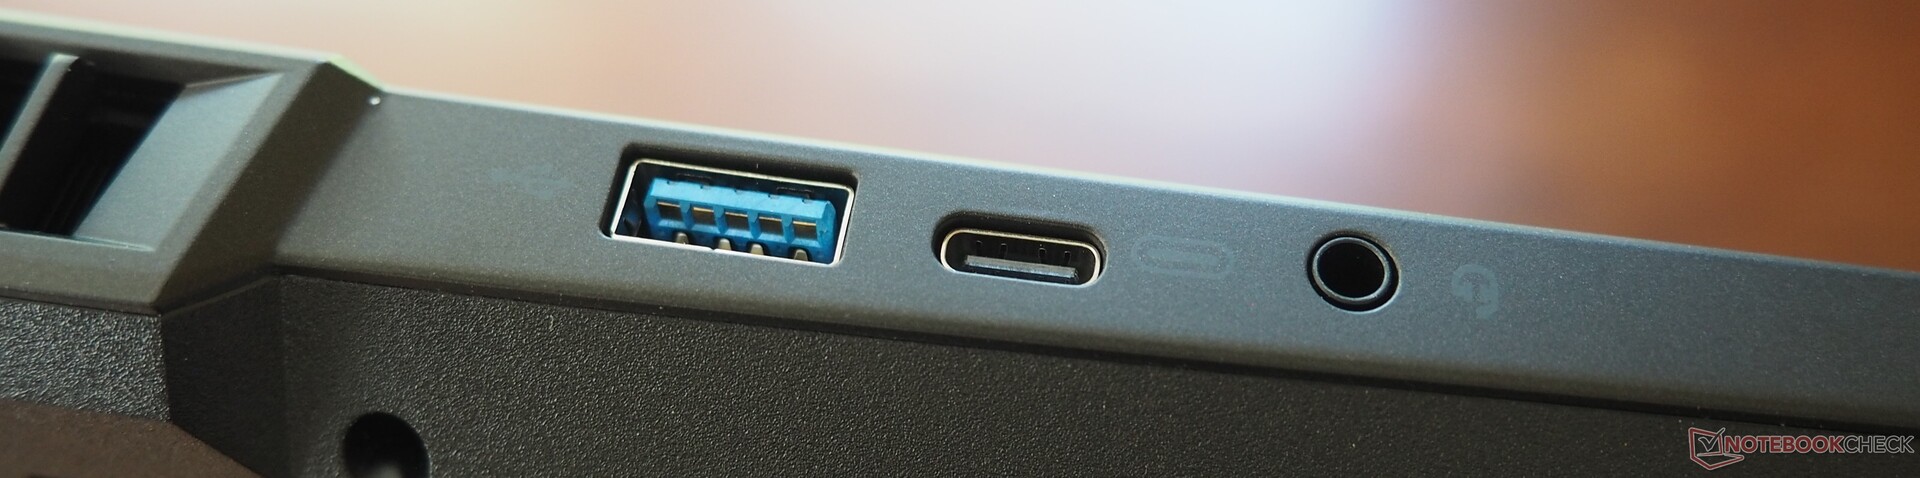
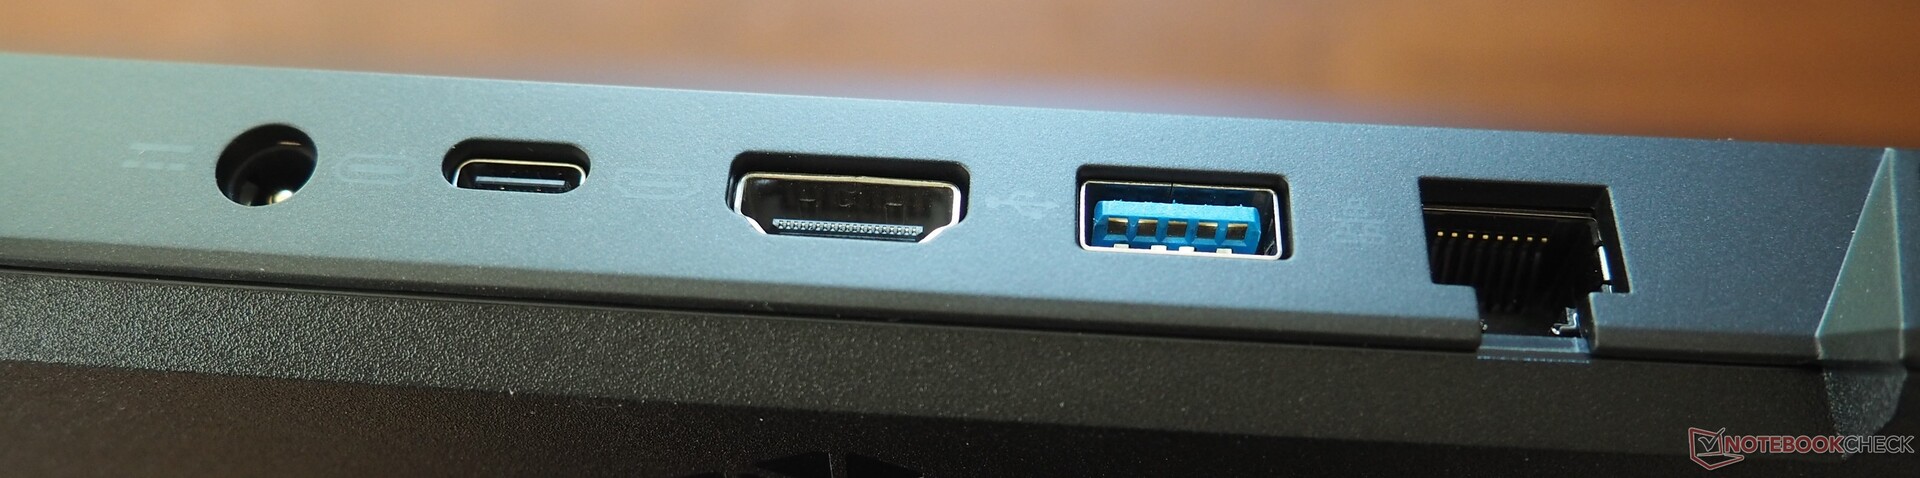
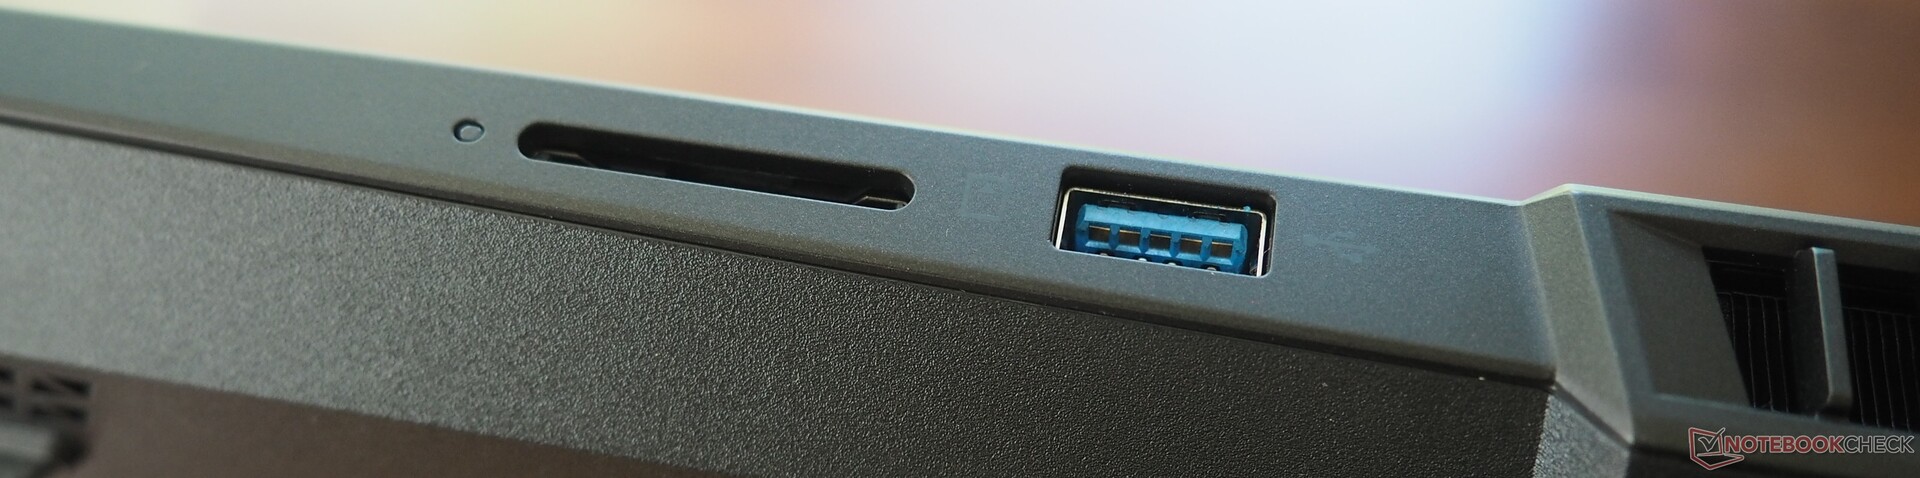
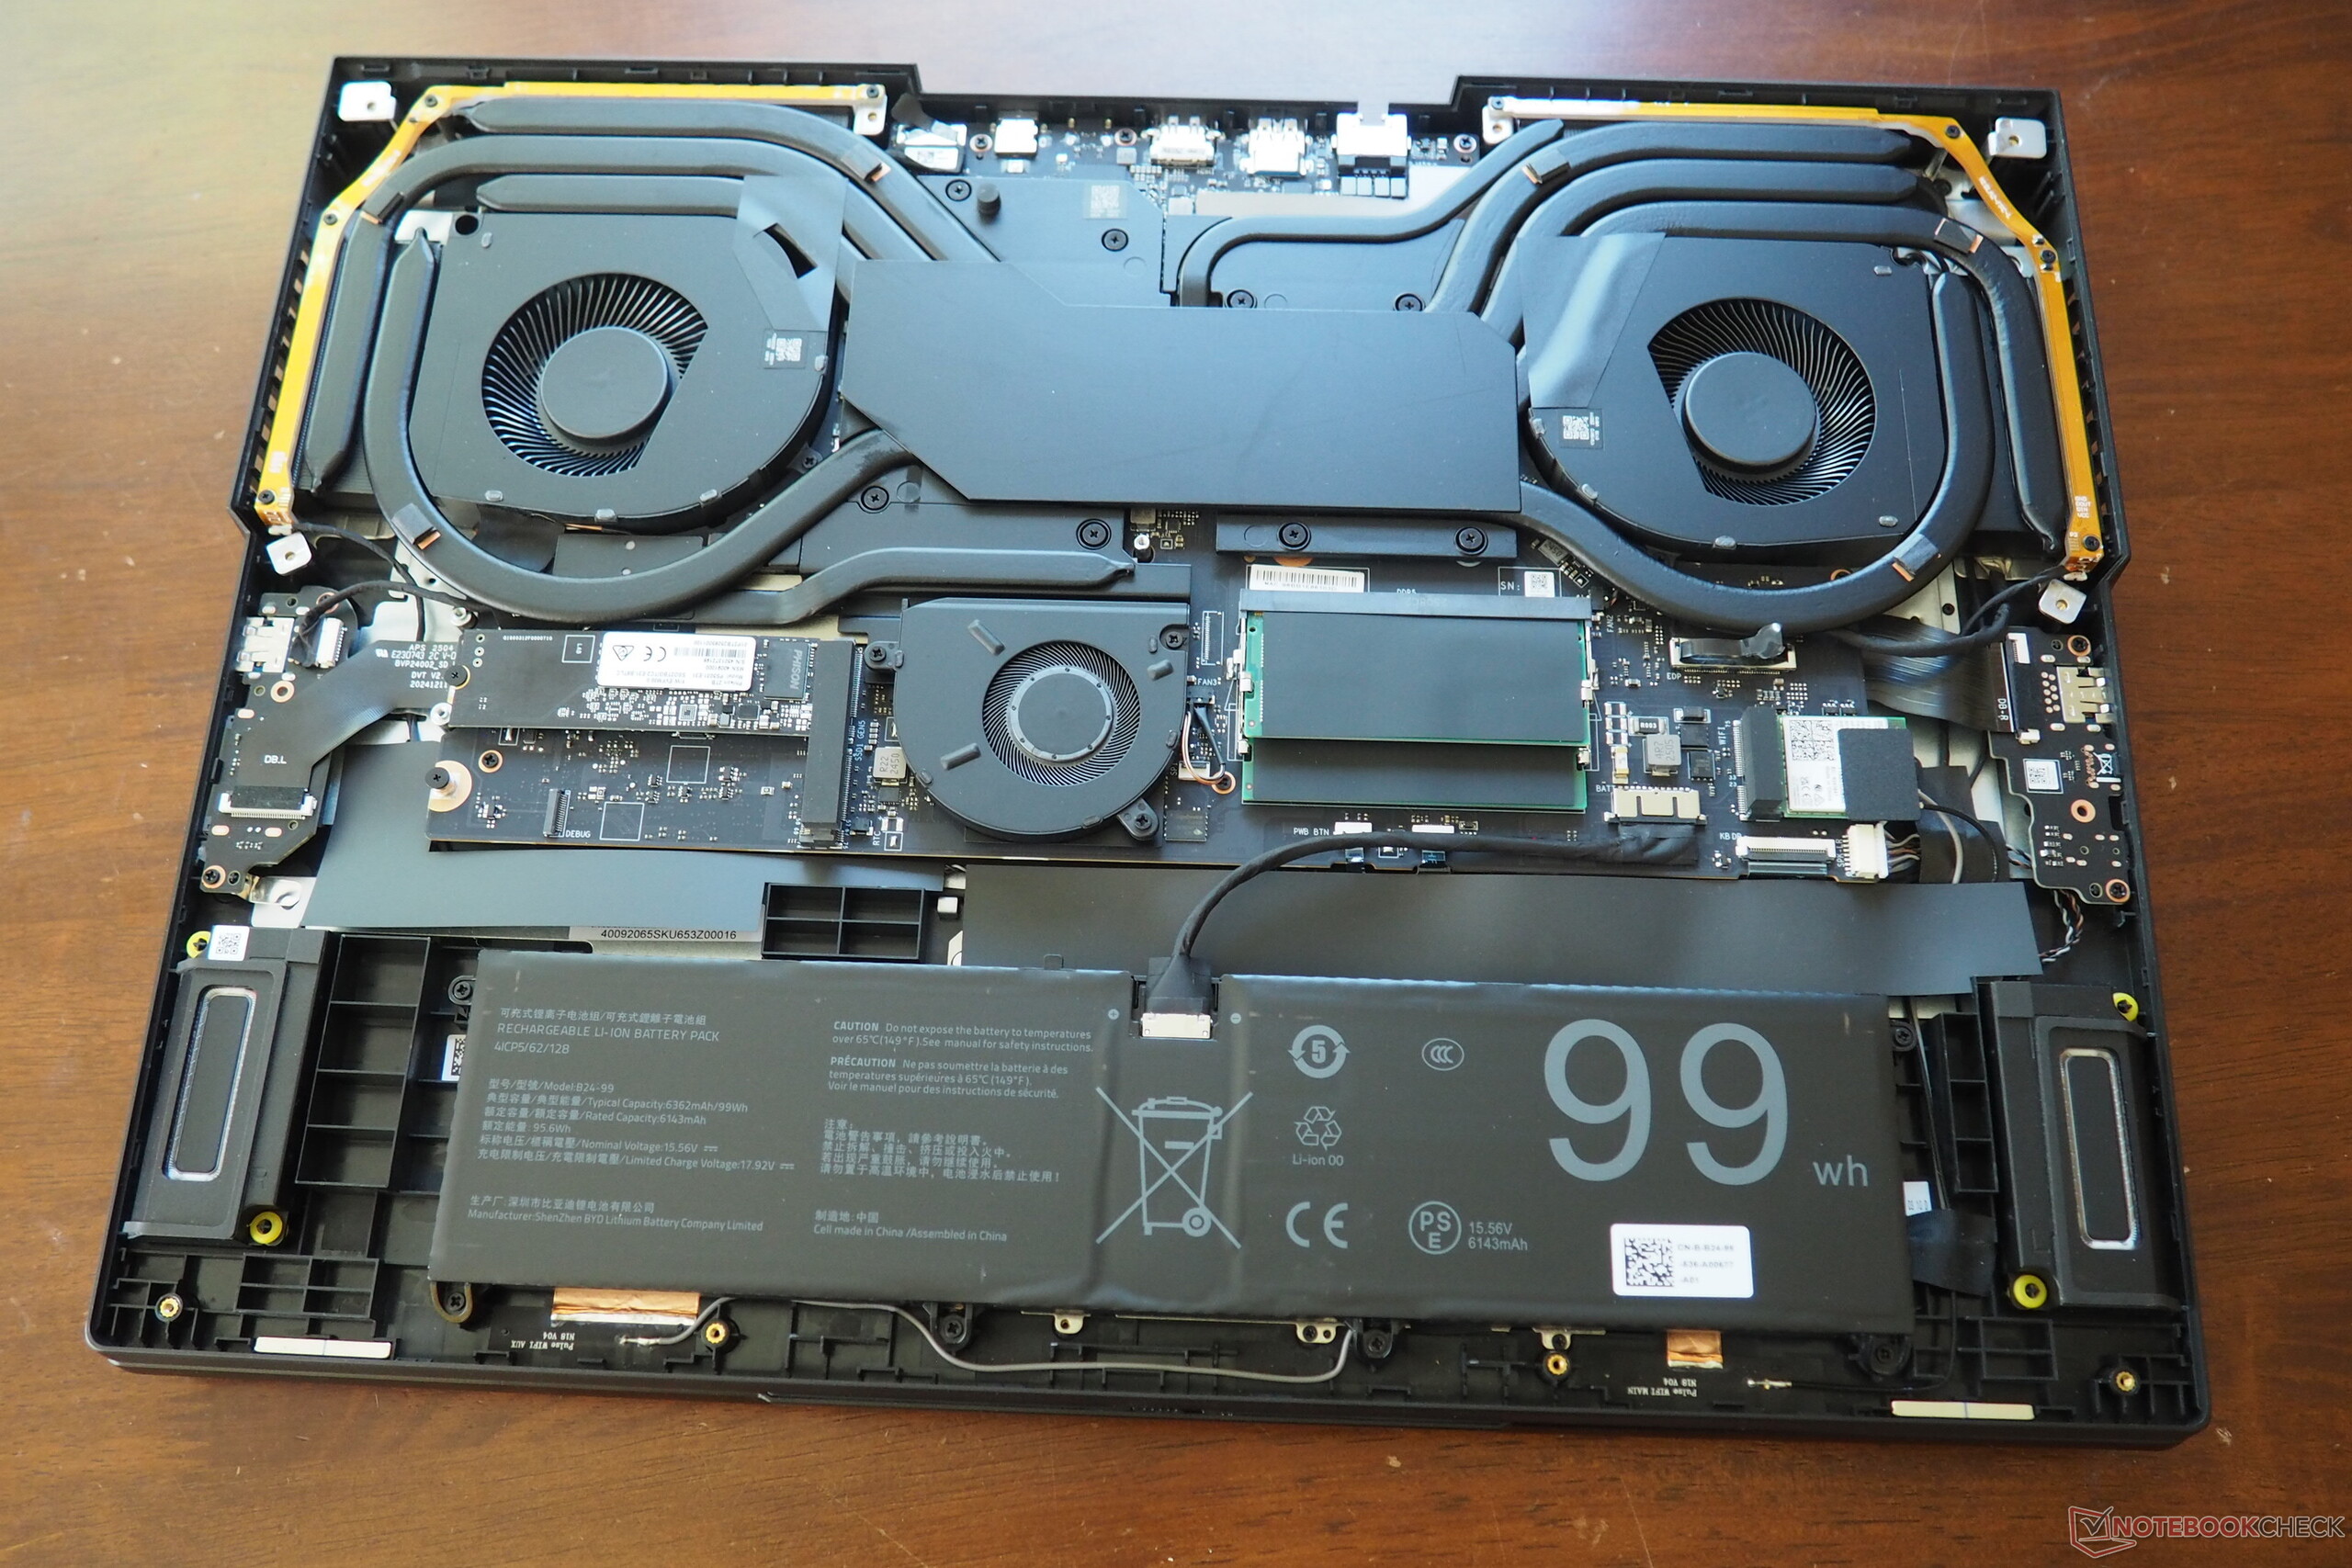
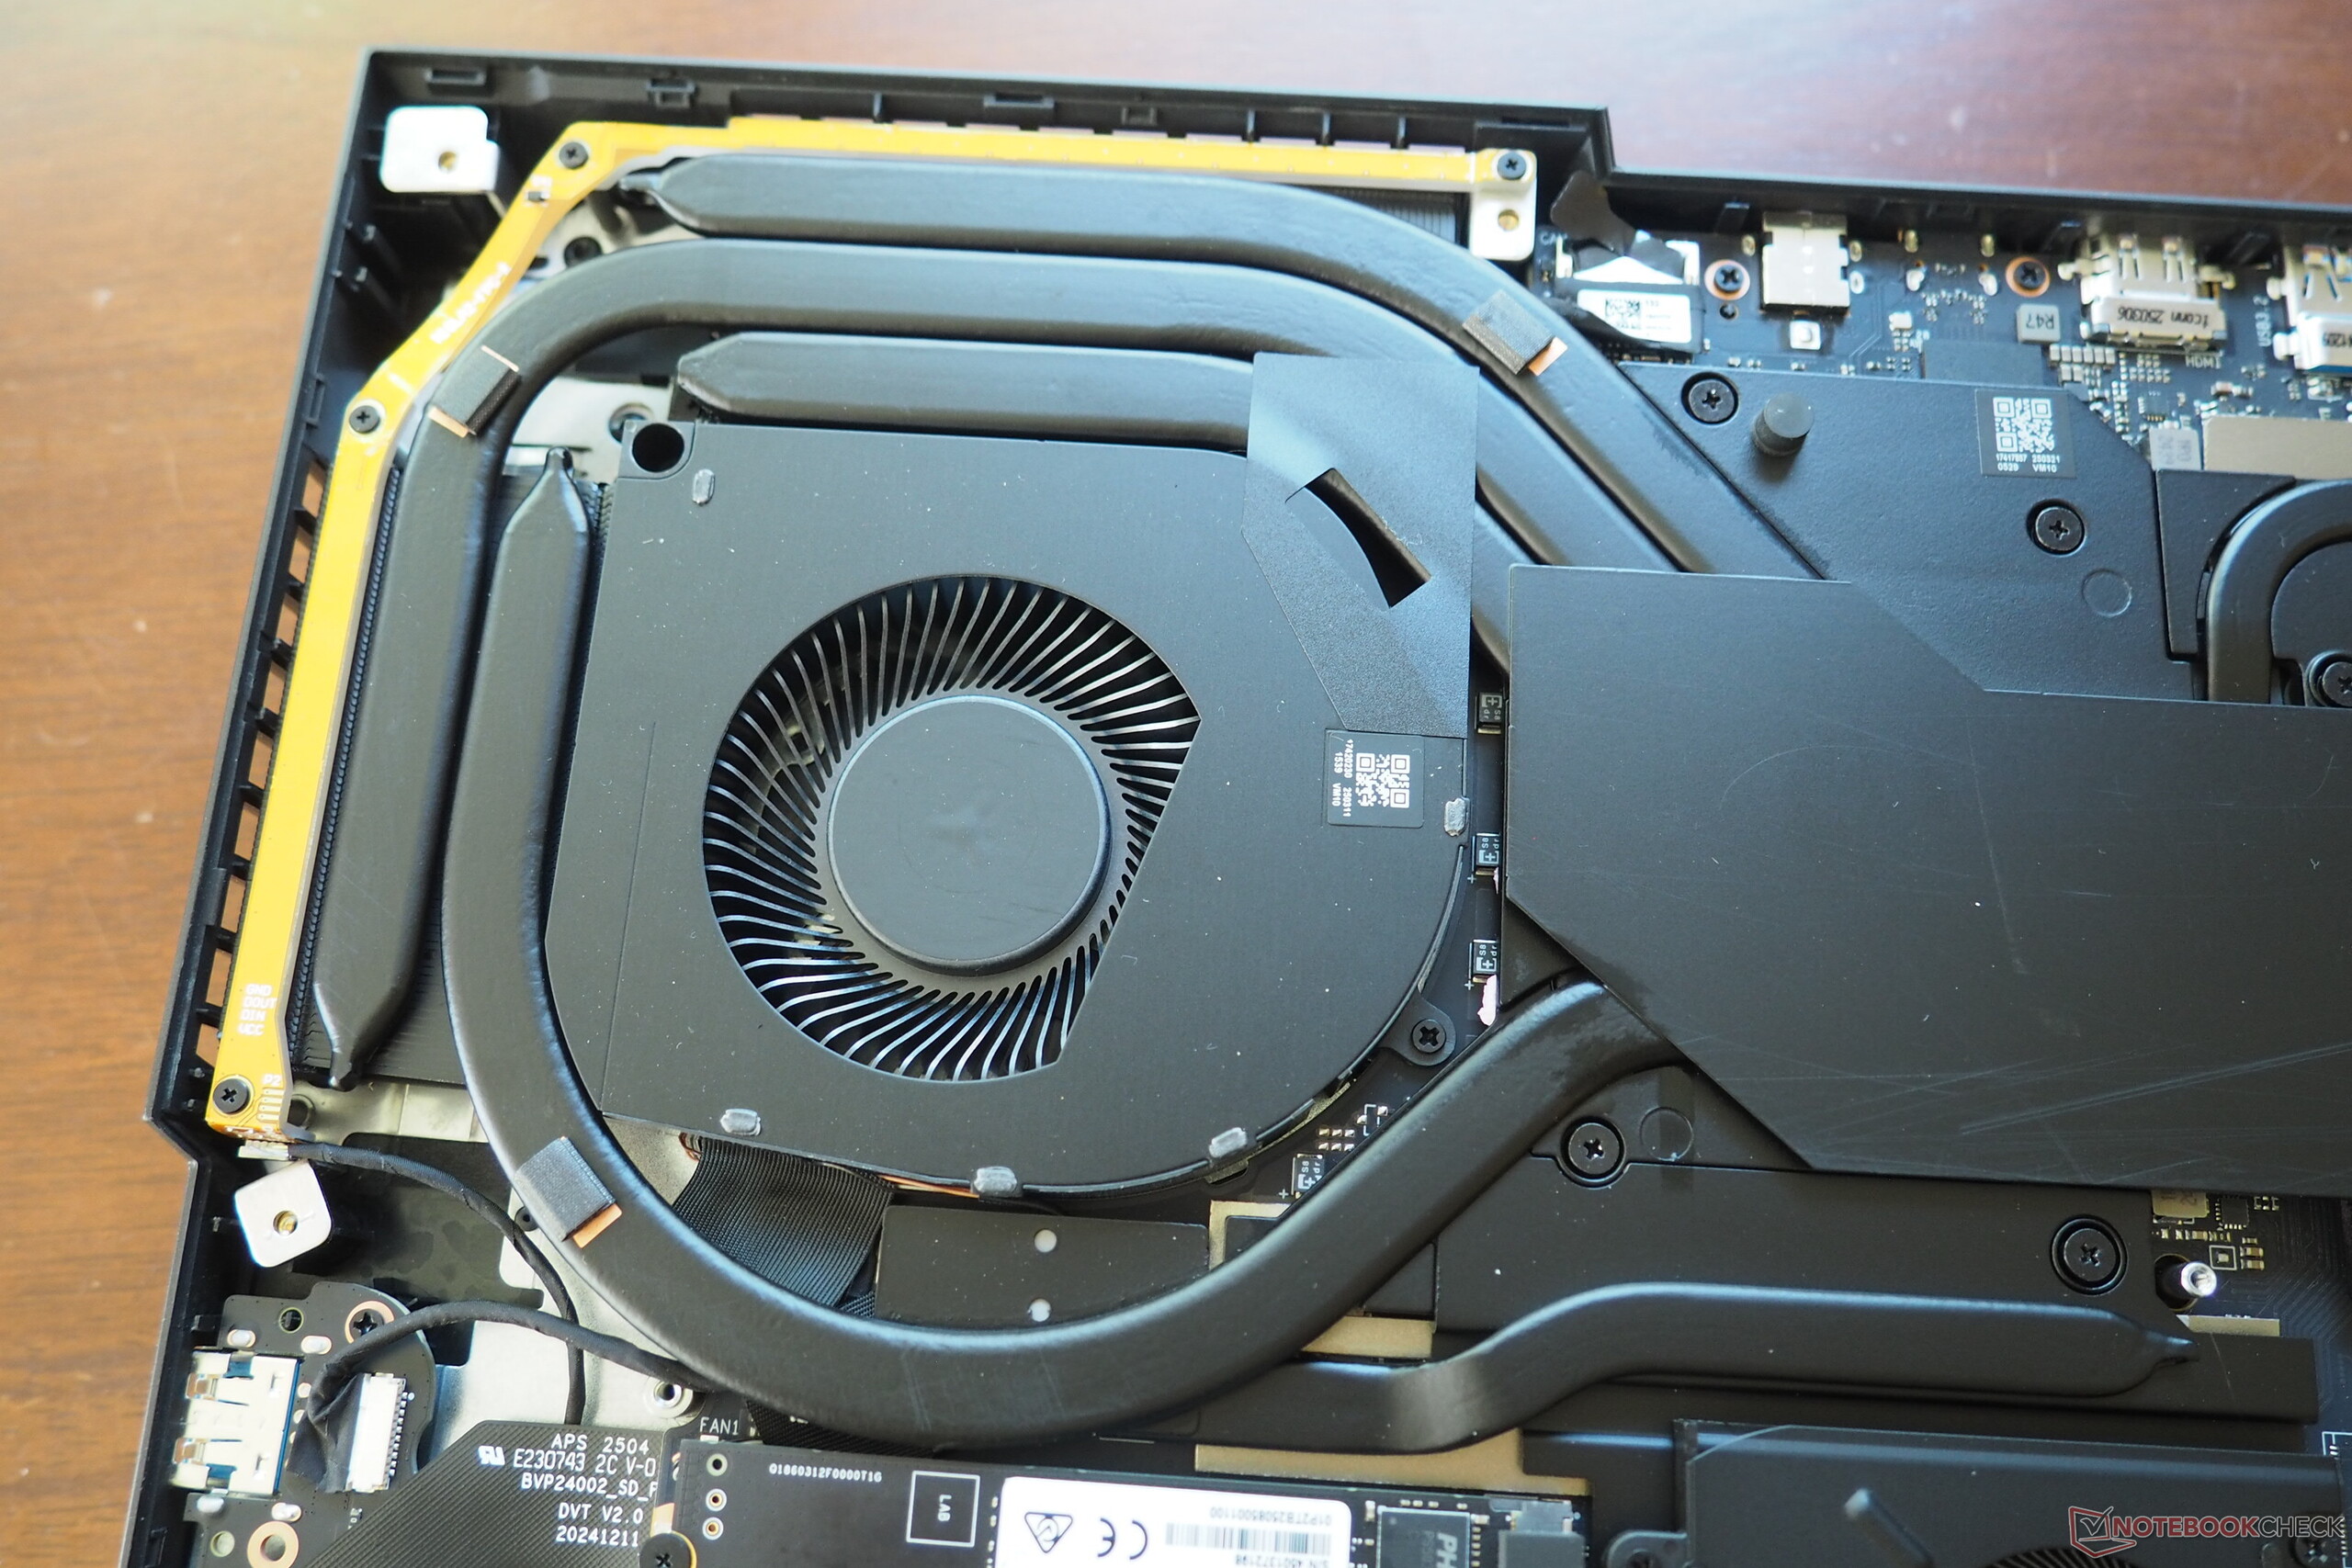
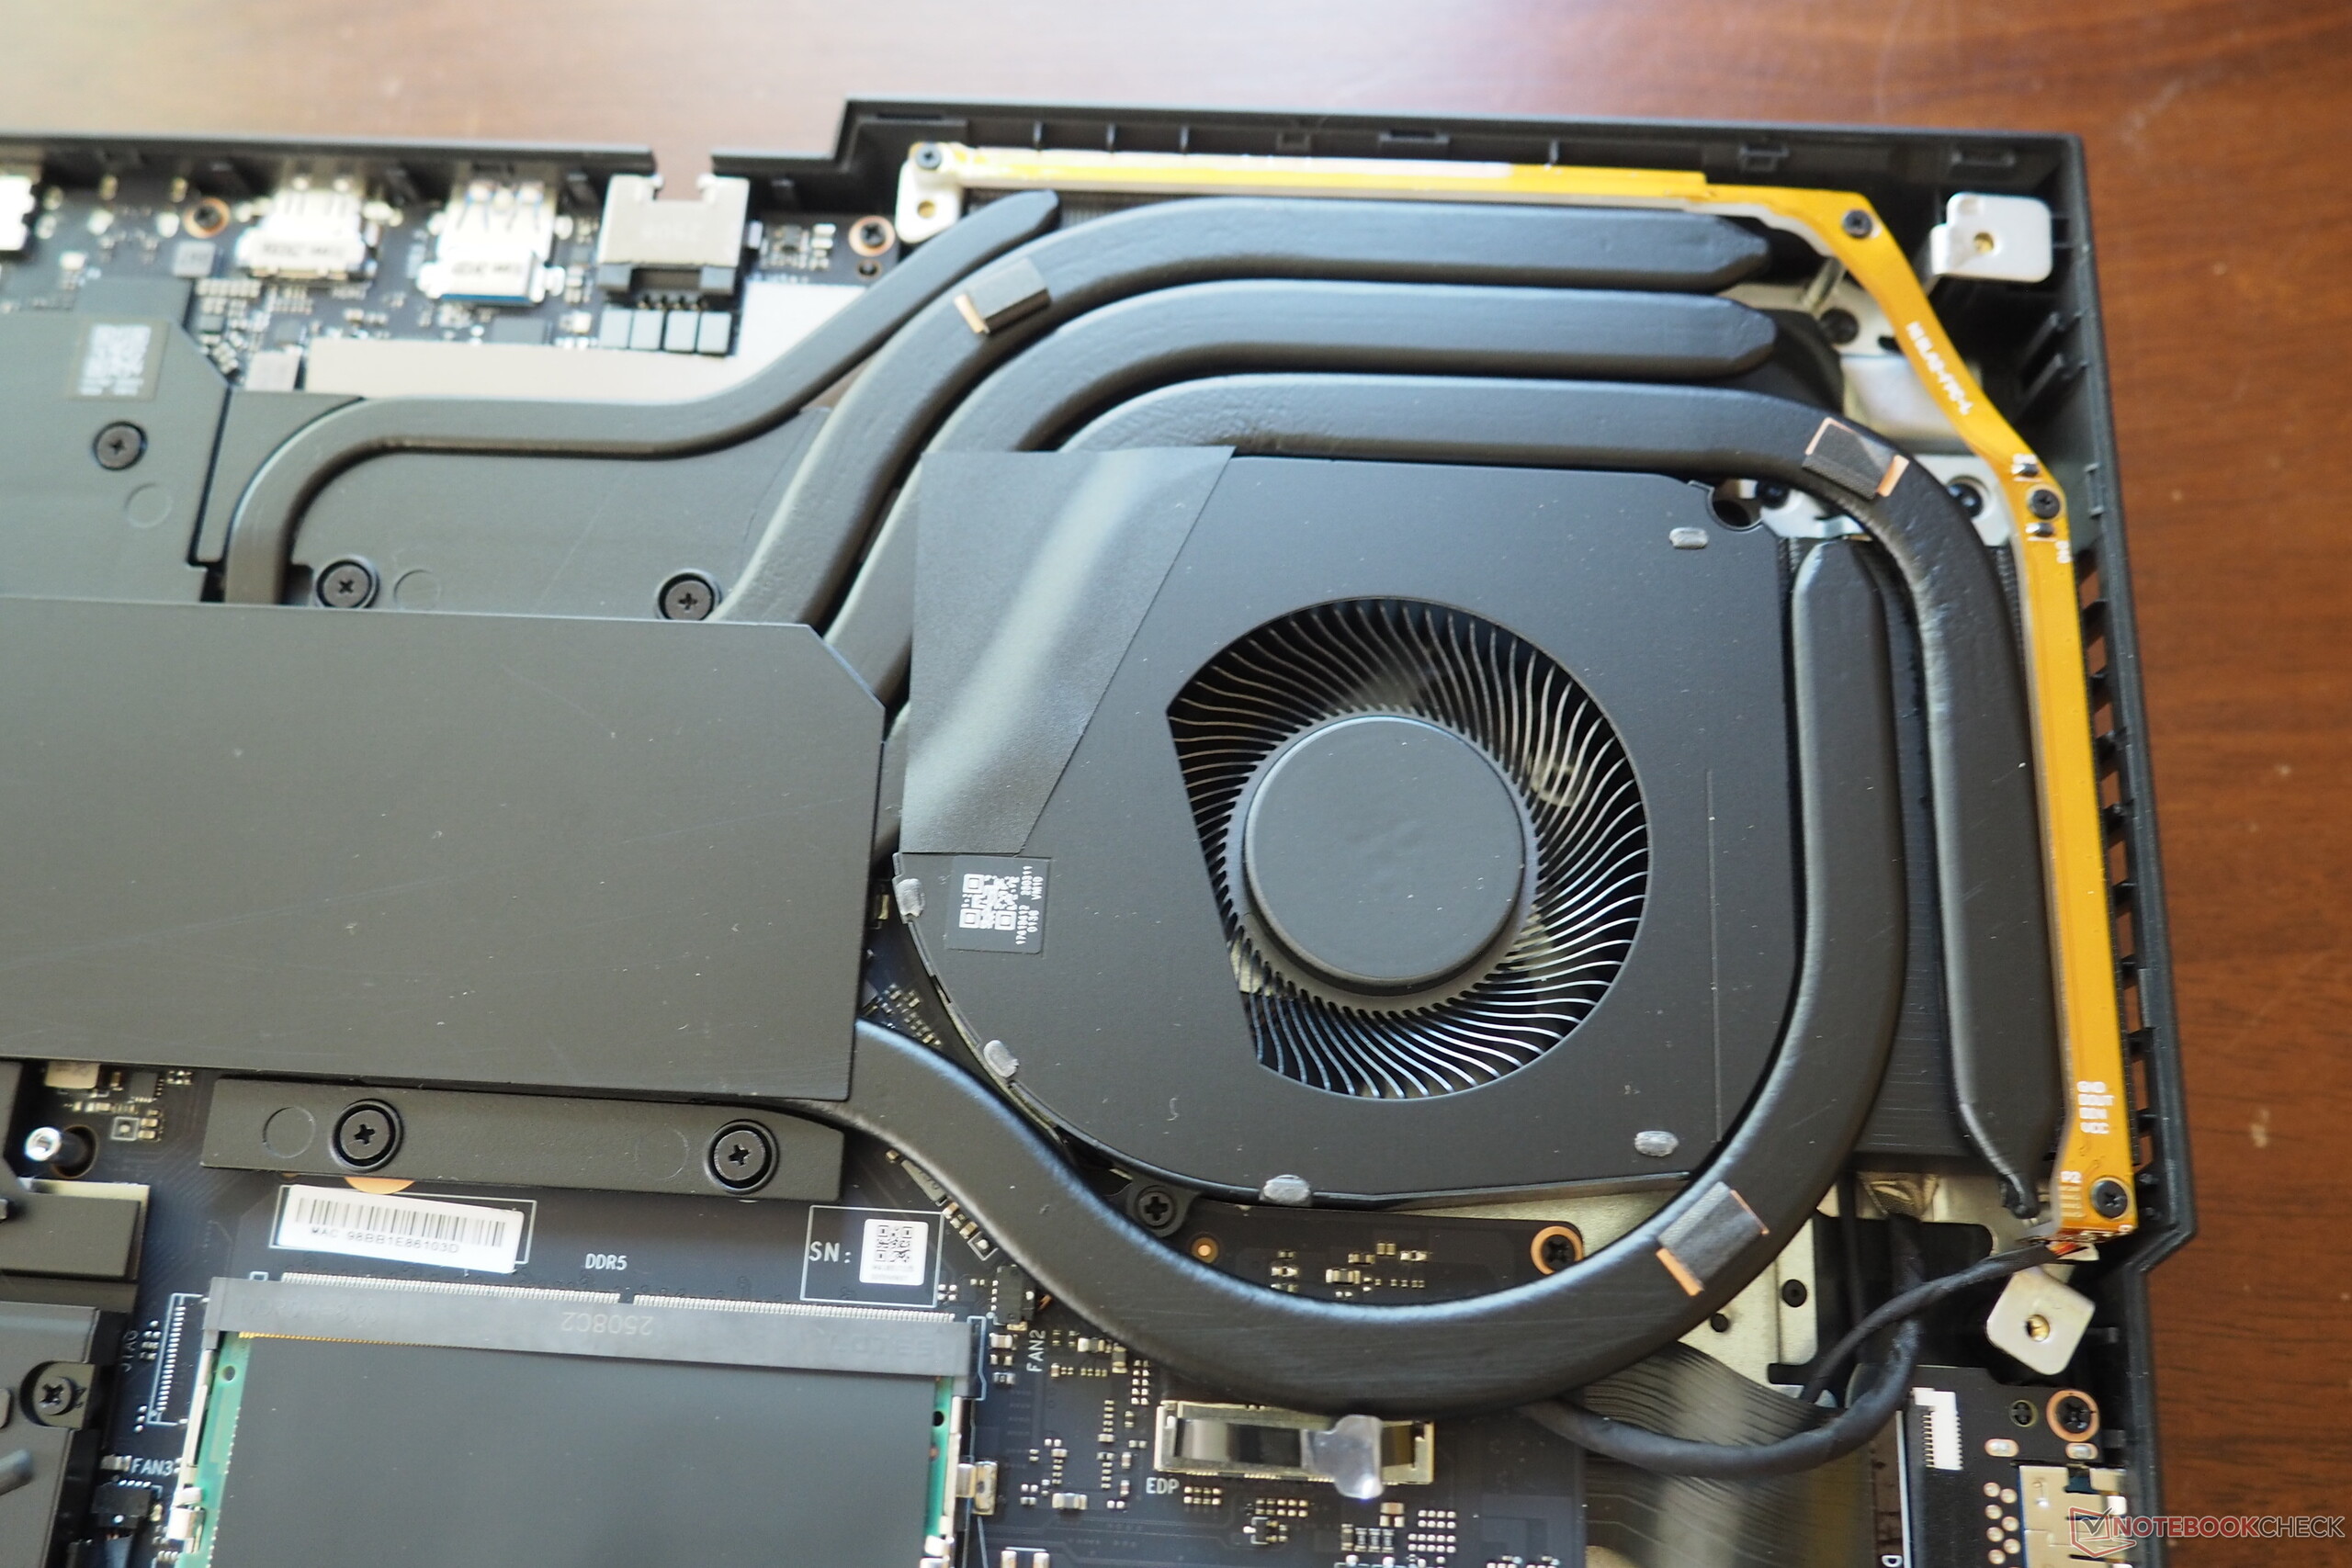
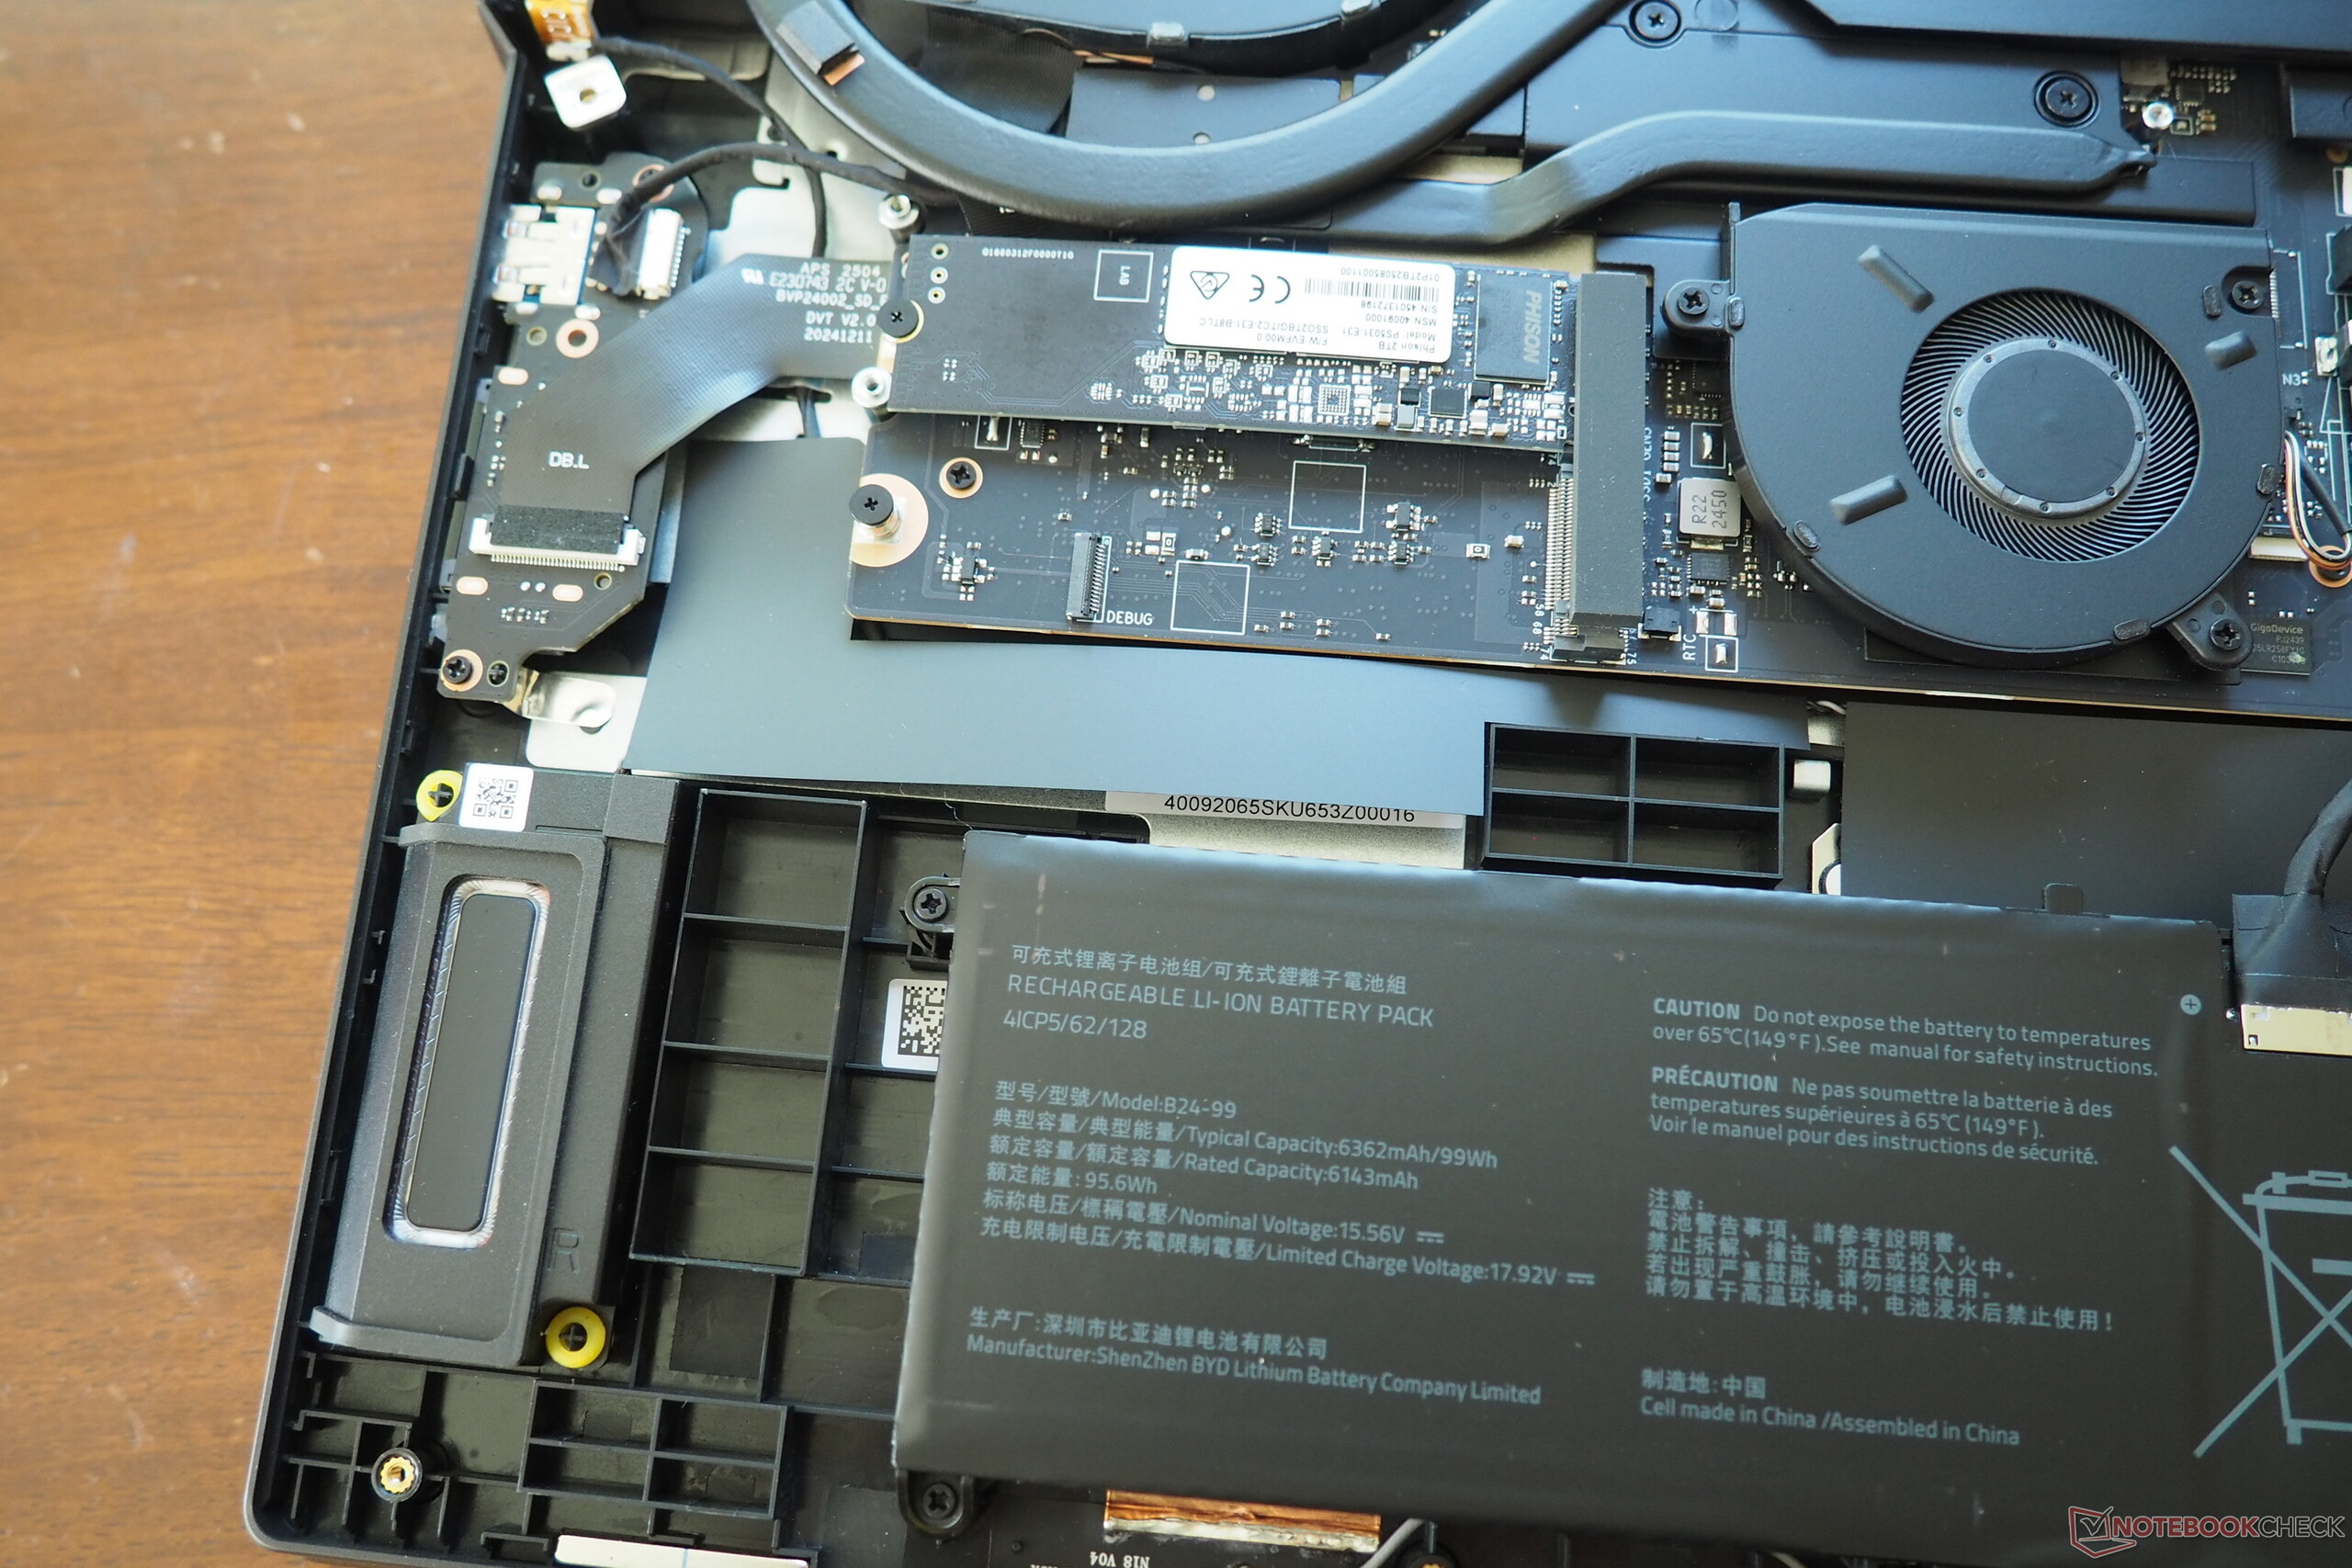
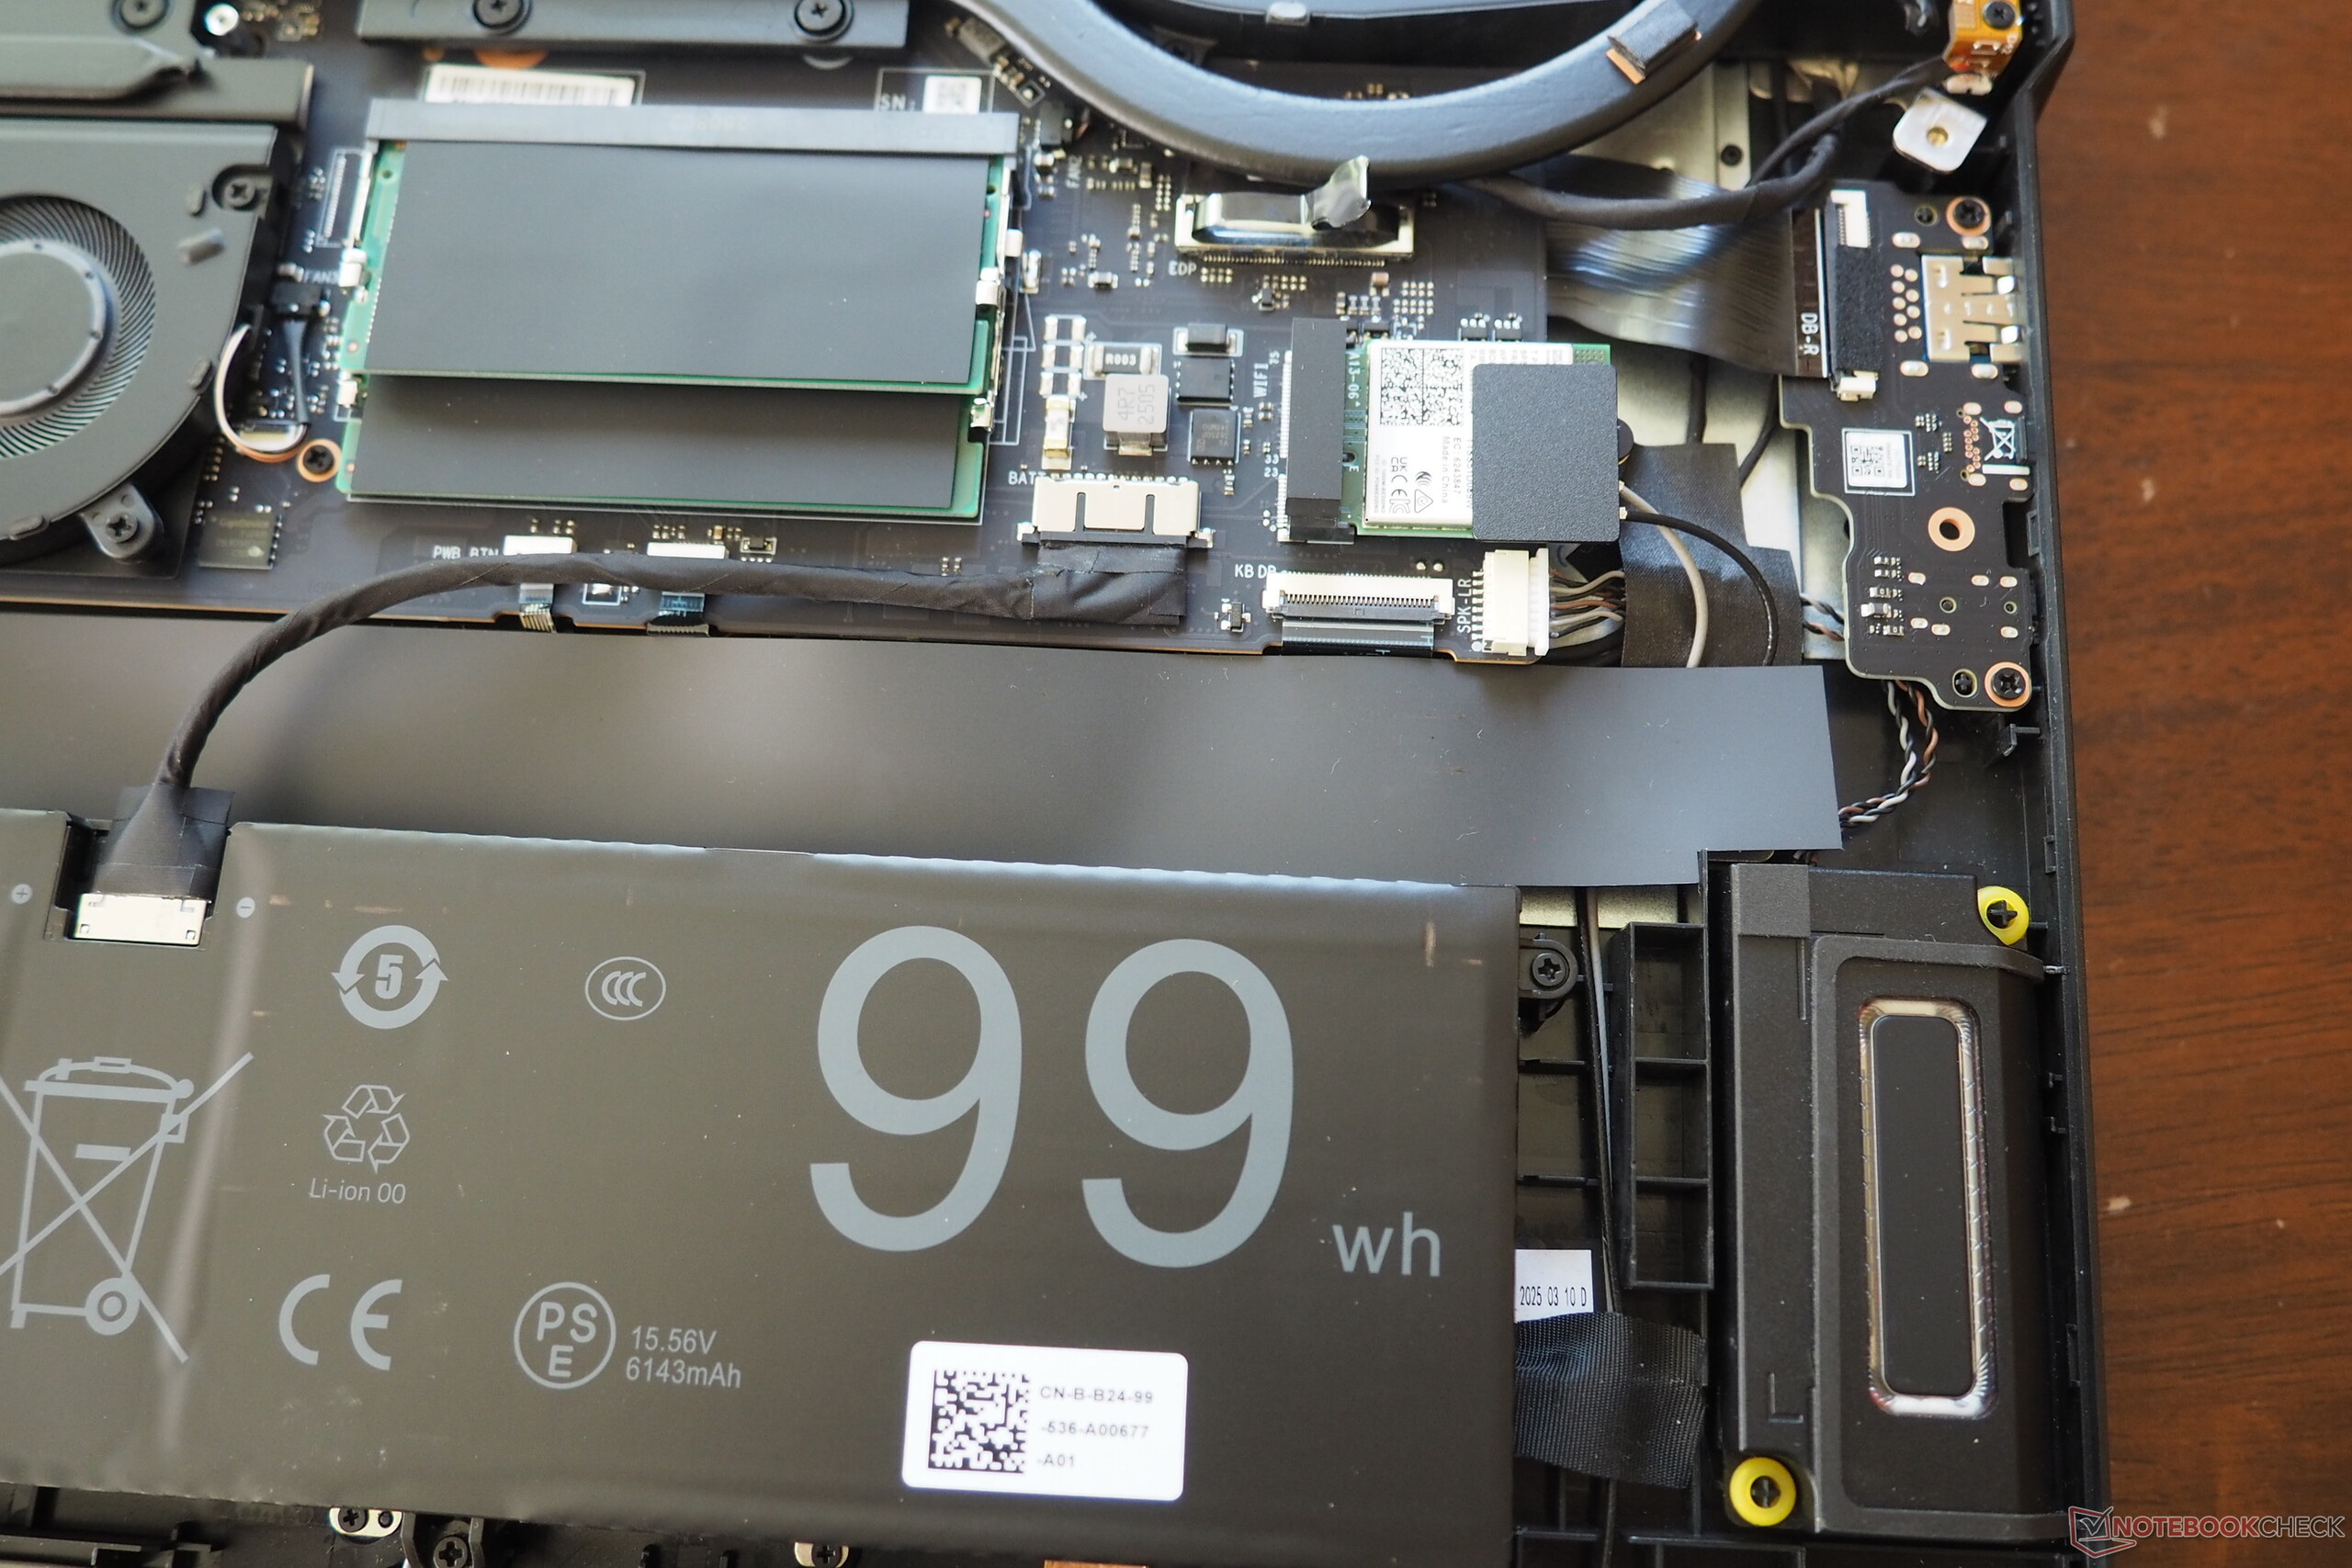
作为台式机的替代品,接口的选择令人印象深刻。除了两个 USB-A 端口(3.2 Gen1),还有两个 Type-C 端口,其中一个支持 Thunderbolt 5 接口。此外,还有一个音频插座、一个 HDMI 2.1 输出端口、一个快速读卡器和一个 2.5 Gbit 网络端口。无线连接由英特尔 Wi-Fi 7 芯片(BE200)负责,其速度在测试中表现尤为突出。同时,FHD 网络摄像头不会产生任何欢呼声,但能提供物理覆盖范围,这不是必然的。Erazer Beast 18 X1 的维护难易适中:拧下 11 颗十字螺丝后,底板就可以从固定位置撬出,露出带有三个风扇的散热系统。两个内存插槽都被占用,但 M.2 插槽仍有空间。
SD 读卡器
| SD Card Reader | |
| average JPG Copy Test (av. of 3 runs) | |
| Medion Erazer Beast 18 X1 MD62731 (AV PRO microSD 128 GB V60) | |
| Aorus Master 18 AM8H (AV PRO microSD 128 GB V60) | |
| Average of class Gaming (20.9 - 210, n=54, last 2 years) | |
| Acer Predator Helios 18 N23Q2 | |
| MSI GE78HX 13VH-070US (Angelibird AV Pro V60) | |
| maximum AS SSD Seq Read Test (1GB) | |
| Aorus Master 18 AM8H (AV PRO microSD 128 GB V60) | |
| Medion Erazer Beast 18 X1 MD62731 (AV PRO microSD 128 GB V60) | |
| Average of class Gaming (25.5 - 261, n=51, last 2 years) | |
| MSI GE78HX 13VH-070US (Angelibird AV Pro V60) | |
| Acer Predator Helios 18 N23Q2 | |
交流
网络摄像头


输入设备
小键盘上有一个专用数字键盘,正常大小的方向箭头和(右上角)实用的风扇控制专用键给人留下了深刻印象。我们认为键盘的反馈和按键手感都可以接受;例如,Aorus Master 18 在这方面的表现甚至更好。按键的稳定性还可以再提高一些,但它的尺寸约为 13 x 8 厘米,对于一款 18 英寸的产品来说是合适的。

显示屏
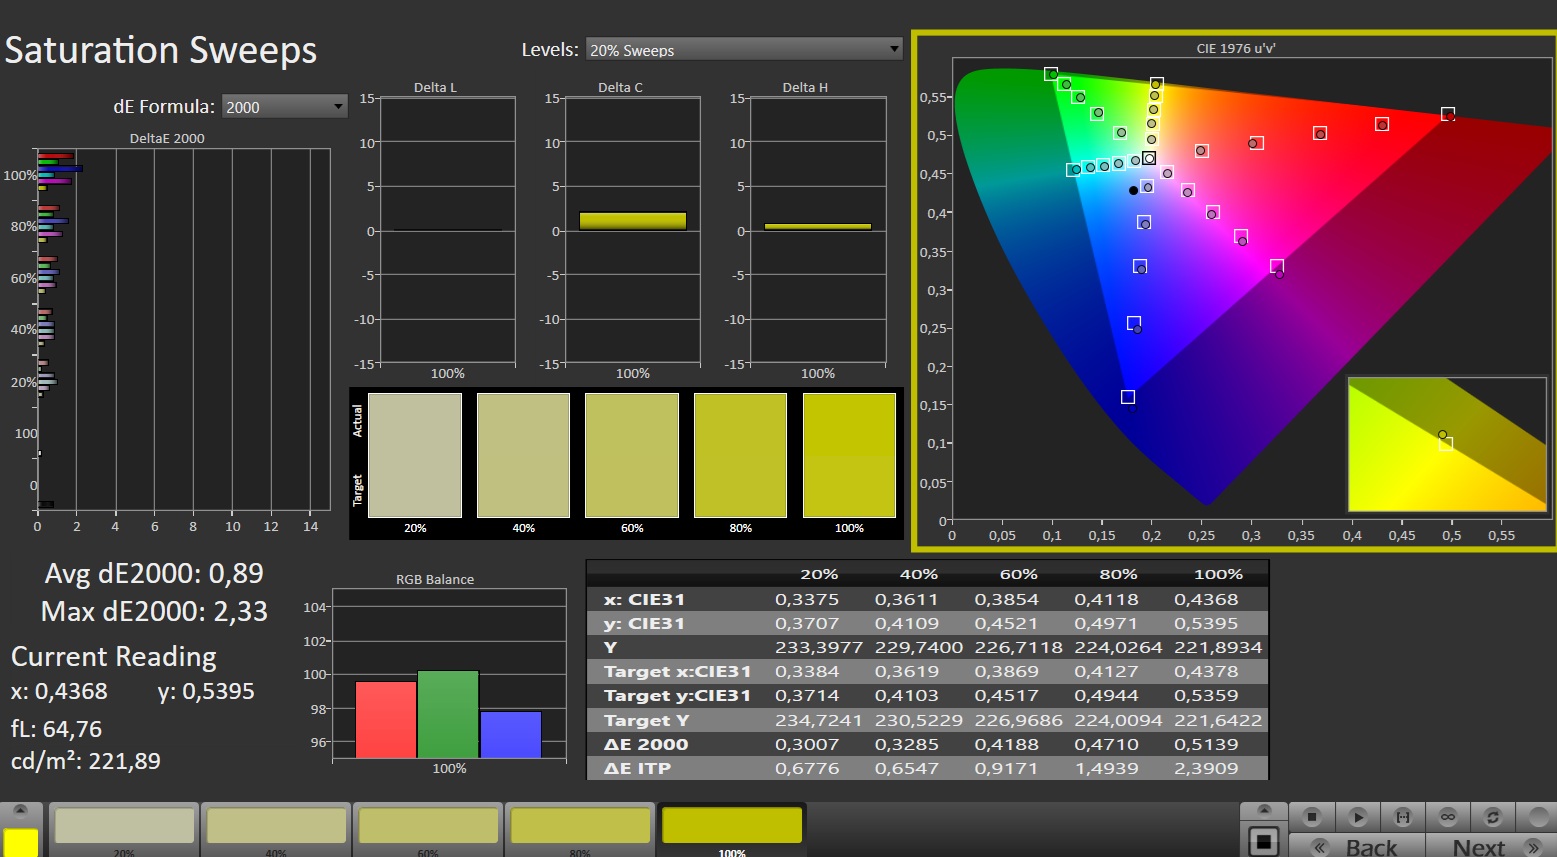
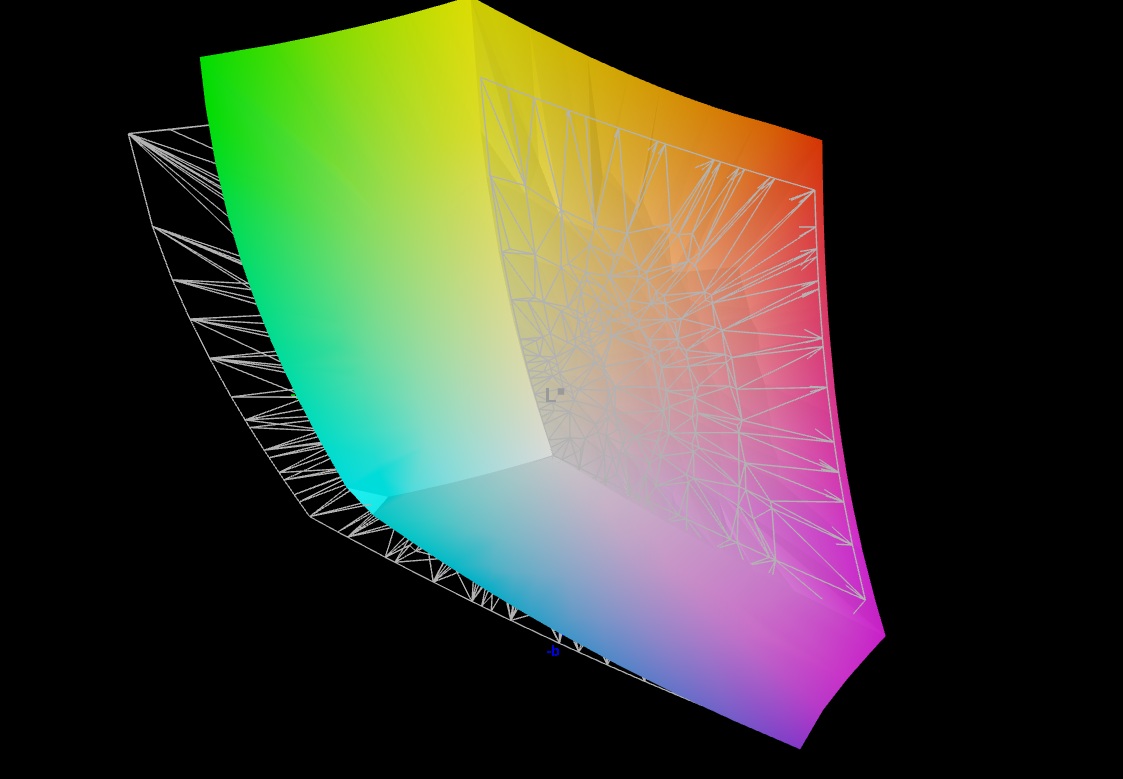
Medion 没有使用 OLED 或 mini-LED 面板,而是采用了经典的 IPS 显示屏,但在大多数领域都有不俗的表现。
| |||||||||||||||||||||||||
Brightness Distribution: 89 %
Center on Battery: 478 cd/m²
Contrast: 1195:1 (Black: 0.4 cd/m²)
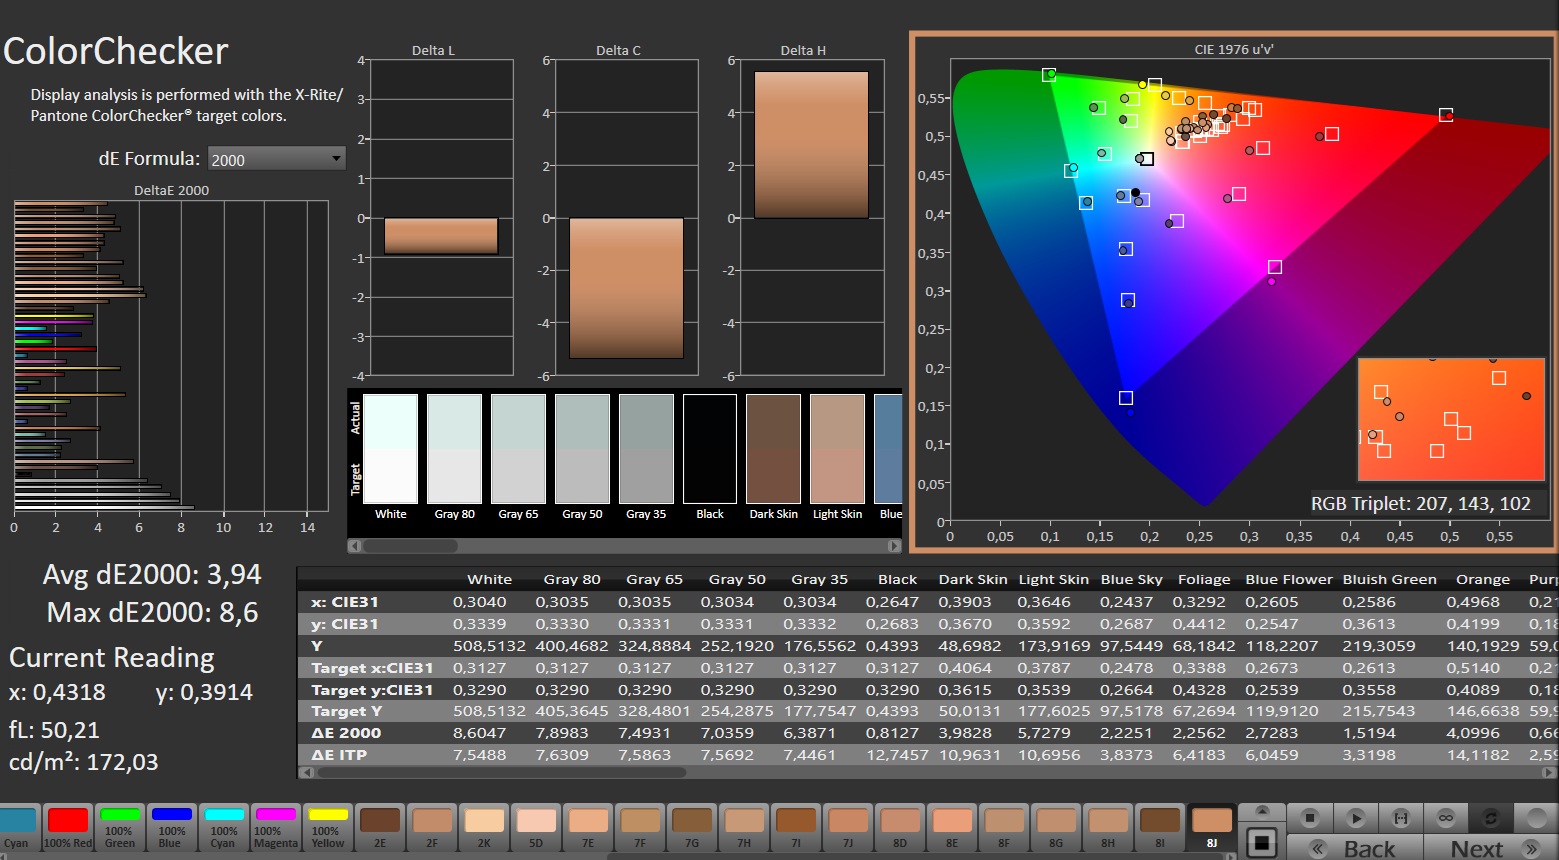
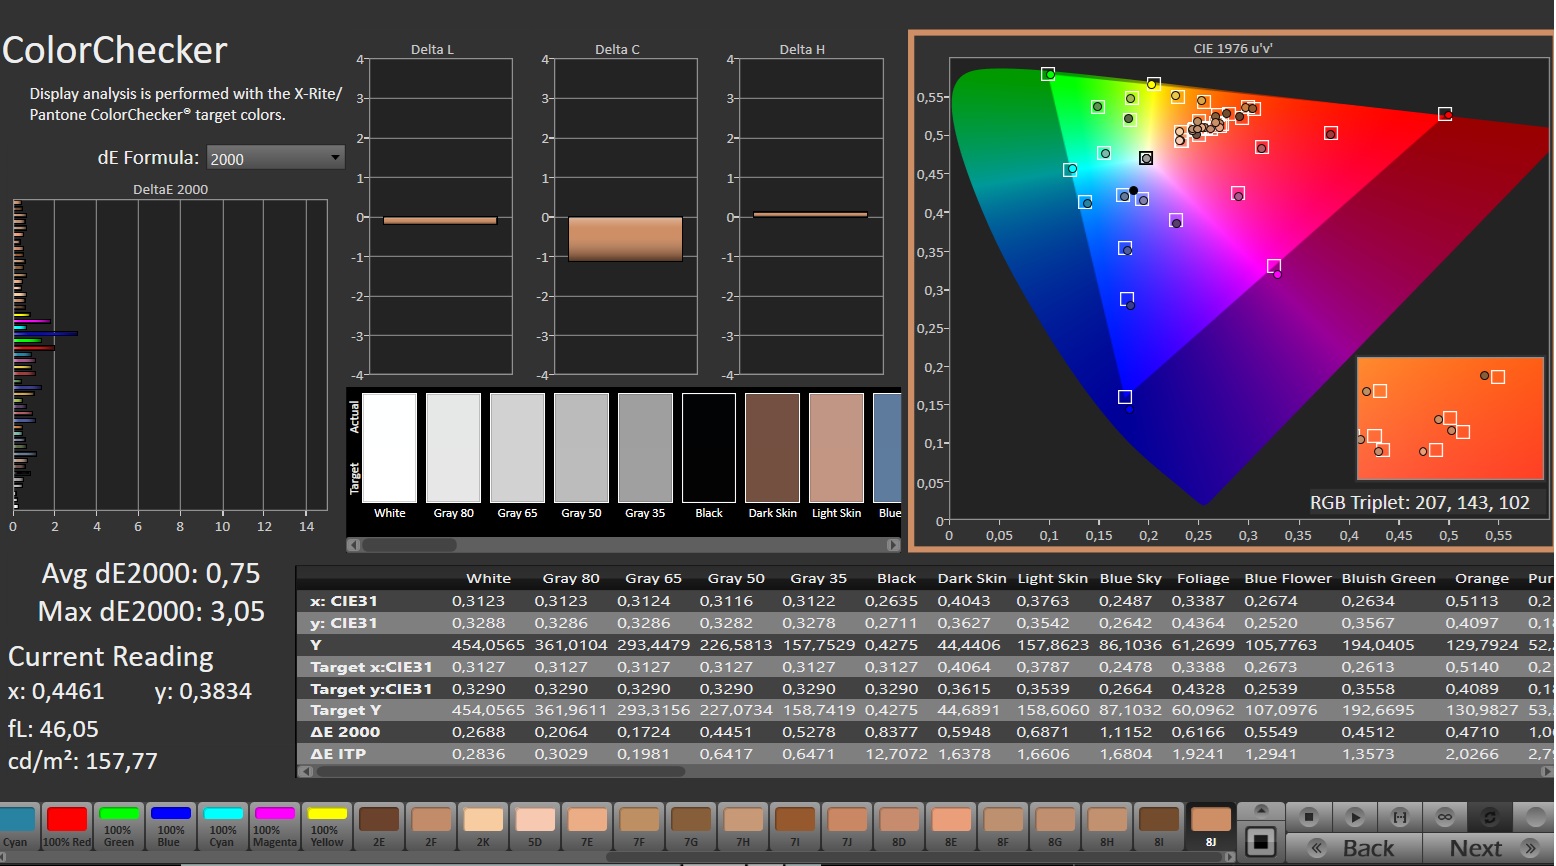
ΔE ColorChecker Calman: 3.94 | ∀{0.5-29.43 Ø4.72}
calibrated: 0.75
ΔE Greyscale Calman: 5.5 | ∀{0.09-98 Ø4.97}
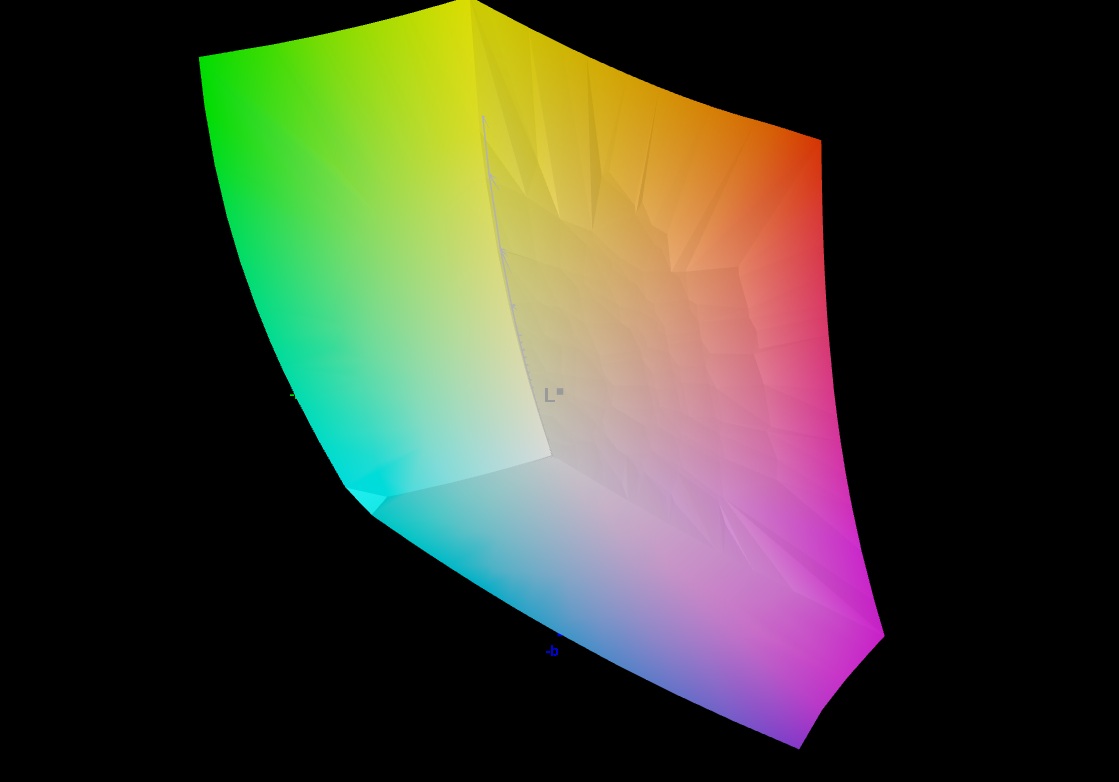
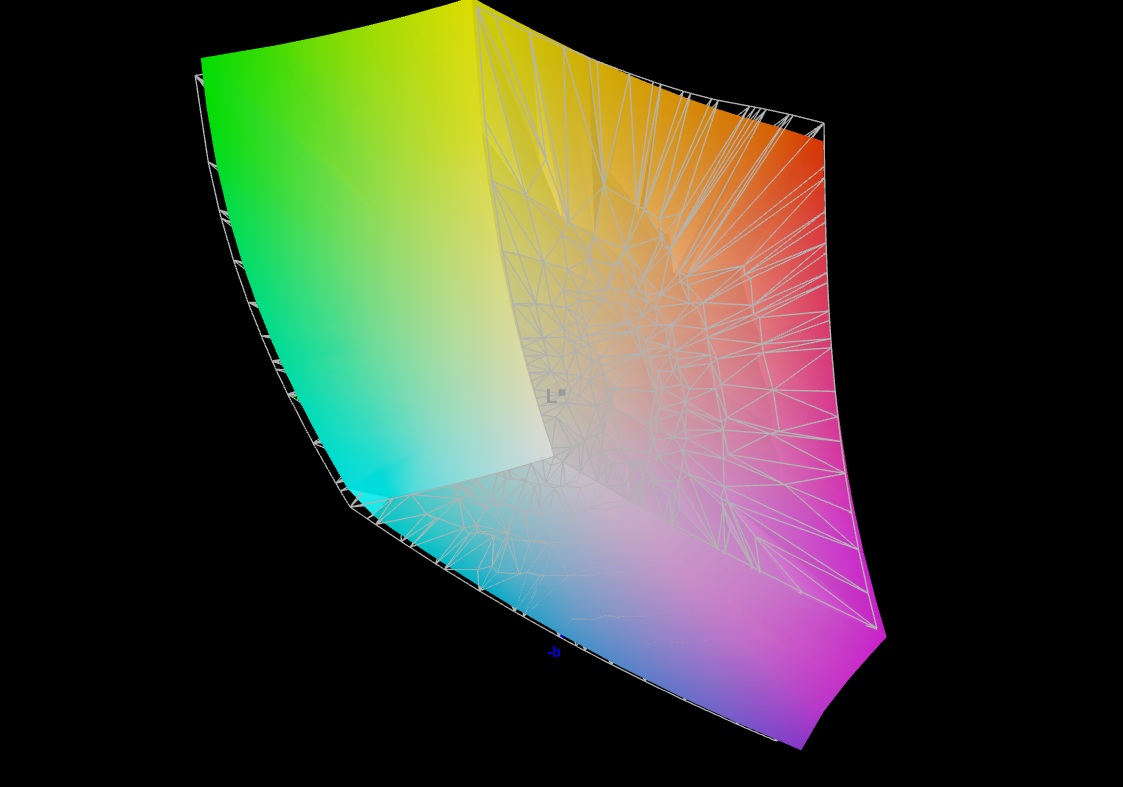
84.7% AdobeRGB 1998 (Argyll 3D)
99.9% sRGB (Argyll 3D)
97.1% Display P3 (Argyll 3D)
Gamma: 2.212
CCT: 7059 K
| Medion Erazer Beast 18 X1 MD62731 BOEhydis NE180QDM-NZ2, IPS, 2560x1600, 18", 240 Hz | MSI GE78HX 13VH-070US AU Optronics B170QAN01.2, IPS, 2560x1600, 17", 240 Hz | Acer Predator Helios 18 N23Q2 AUO45A8 (B180QAN01.2), IPS, 2560x1600, 18", 250 Hz | Asus Strix Scar 18 G835LX N180QDM-NM2, Mini-LED, 2560x1600, 18", 240 Hz | Aorus Master 18 AM8H NE180QDM-NM1 (BOE0C58), Mini-LED, 2560x1600, 18", 240 Hz | Lenovo Legion Pro 7i 16 Gen 10 Samsung ATNA60HU01-0, OLED, 2560x1600, 16", 240 Hz | |
|---|---|---|---|---|---|---|
| Display | 1% | 4% | 2% | 2% | 4% | |
| Display P3 Coverage (%) | 97.1 | 97.6 1% | 99.8 3% | 99 2% | 99.9 3% | 99.5 2% |
| sRGB Coverage (%) | 99.9 | 99.9 0% | 100 0% | 100 0% | 100 0% | 100 0% |
| AdobeRGB 1998 Coverage (%) | 84.7 | 86.5 2% | 91.8 8% | 87.2 3% | 87.7 4% | 94.4 11% |
| Response Times | 19% | -90% | -37% | -102% | 95% | |
| Response Time Grey 50% / Grey 80% * (ms) | 5.6 ? | 4.2 ? 25% | 7.6 ? -36% | 7.4 ? -32% | 16.4 ? -193% | 0.28 ? 95% |
| Response Time Black / White * (ms) | 7.3 ? | 6.4 ? 12% | 17.8 ? -144% | 10.4 ? -42% | 8.1 ? -11% | 0.43 ? 94% |
| PWM Frequency (Hz) | 2509 | 20610 ? | 1398 ? | 1438 ? | ||
| PWM Amplitude * (%) | 100 | 100 | 29 | |||
| Screen | -15% | -14% | 119% | 53% | 20% | |
| Brightness middle (cd/m²) | 478 | 398.6 -17% | 360 -25% | 764 60% | 438 -8% | 490.4 3% |
| Brightness (cd/m²) | 456 | 384 -16% | 355 -22% | 747 64% | 451 -1% | 498 9% |
| Brightness Distribution (%) | 89 | 89 0% | 92 3% | 93 4% | 90 1% | 97 9% |
| Black Level * (cd/m²) | 0.4 | 0.46 -15% | 0.21 48% | 0.1 75% | 0.13 67% | |
| Contrast (:1) | 1195 | 867 -27% | 1714 43% | 7640 539% | 3369 182% | |
| Colorchecker dE 2000 * | 3.94 | 4.05 -3% | 3.82 3% | 1.2 70% | 1.25 68% | 3.2 19% |
| Colorchecker dE 2000 max. * | 8.6 | 8.68 -1% | 7.38 14% | 2.8 67% | 4.93 43% | 6.04 30% |
| Colorchecker dE 2000 calibrated * | 0.75 | 1.02 -36% | 2.24 -199% | 0.84 -12% | ||
| Greyscale dE 2000 * | 5.5 | 6.5 -18% | 5.06 8% | 1.5 73% | 1.7 69% | 1 82% |
| Gamma | 2.212 99% | 2.11 104% | 2.52 87% | 2.17 101% | 2.173 101% | 2.24 98% |
| CCT | 7059 92% | 7518 86% | 5657 115% | 6556 99% | 6518 100% | 6373 102% |
| Total Average (Program / Settings) | 2% /
-7% | -33% /
-21% | 28% /
68% | -16% /
17% | 40% /
29% |
* ... smaller is better
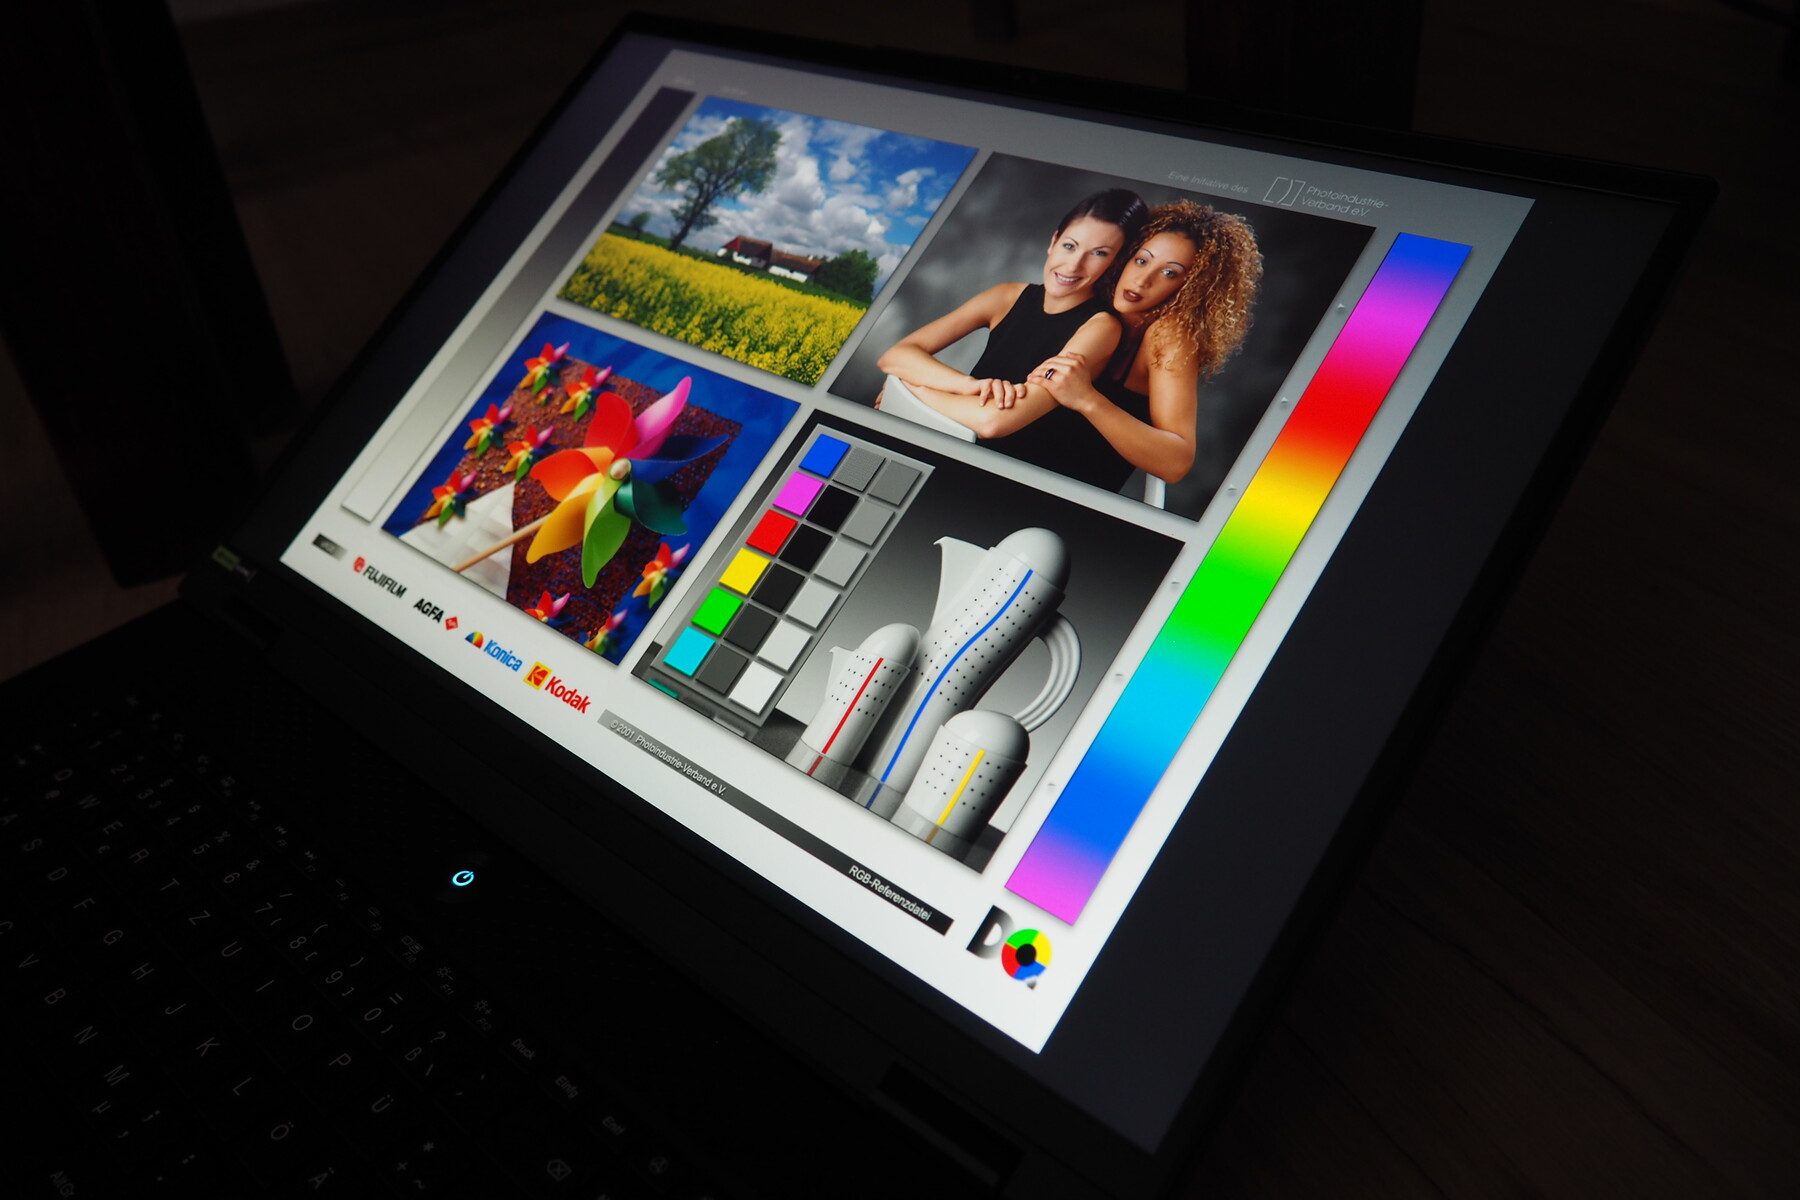
首先是色彩空间,几乎覆盖了 100%的 sRGB 和 DCI-P3(AdobeRGB 覆盖率为 85%)。亮度也不错,平均亮度为 456 cd/m²。
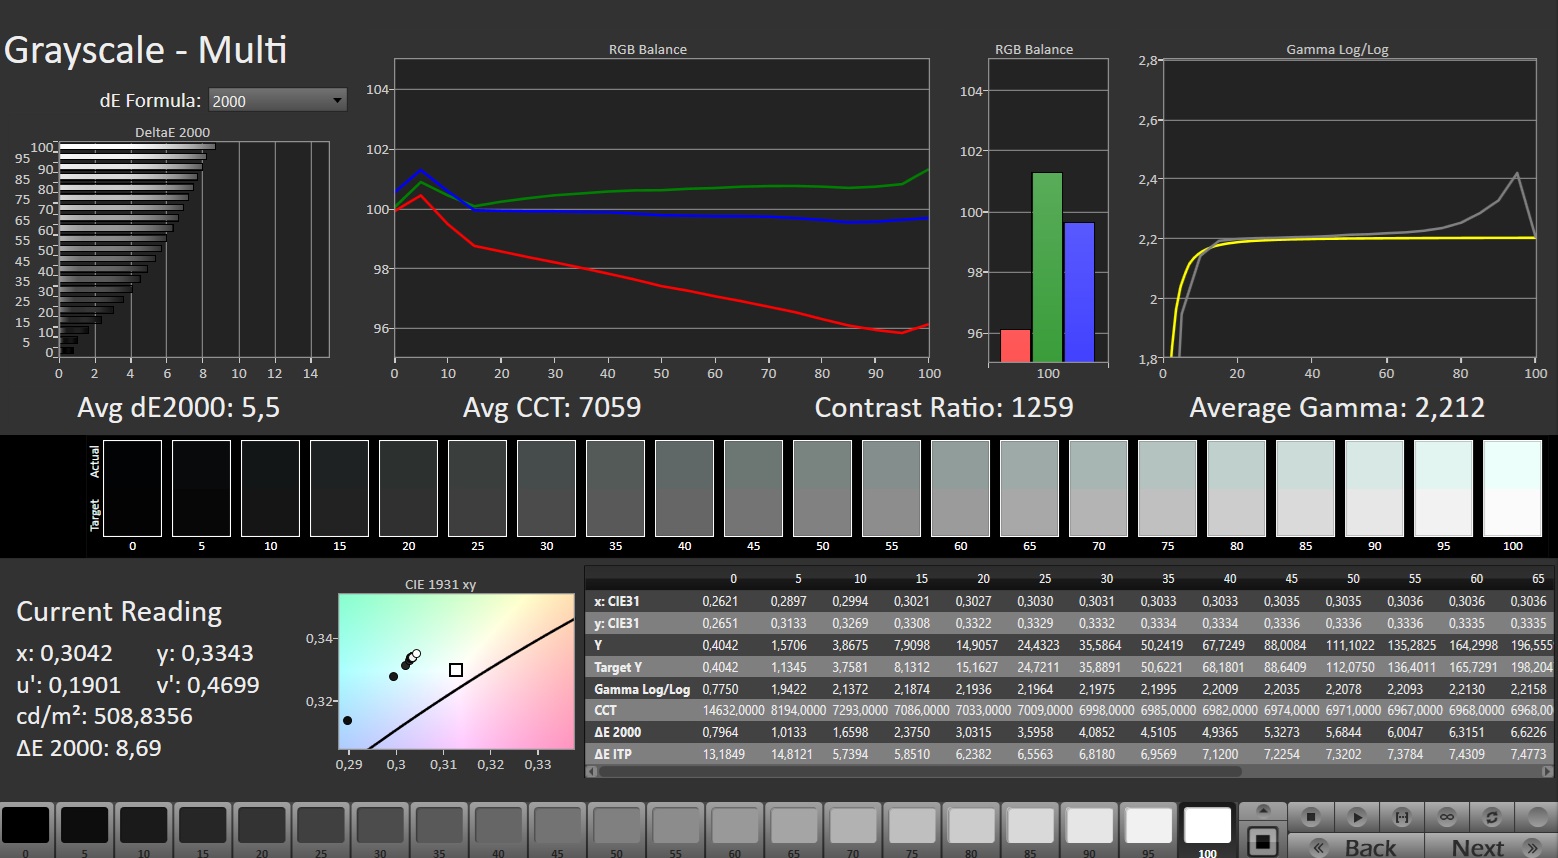
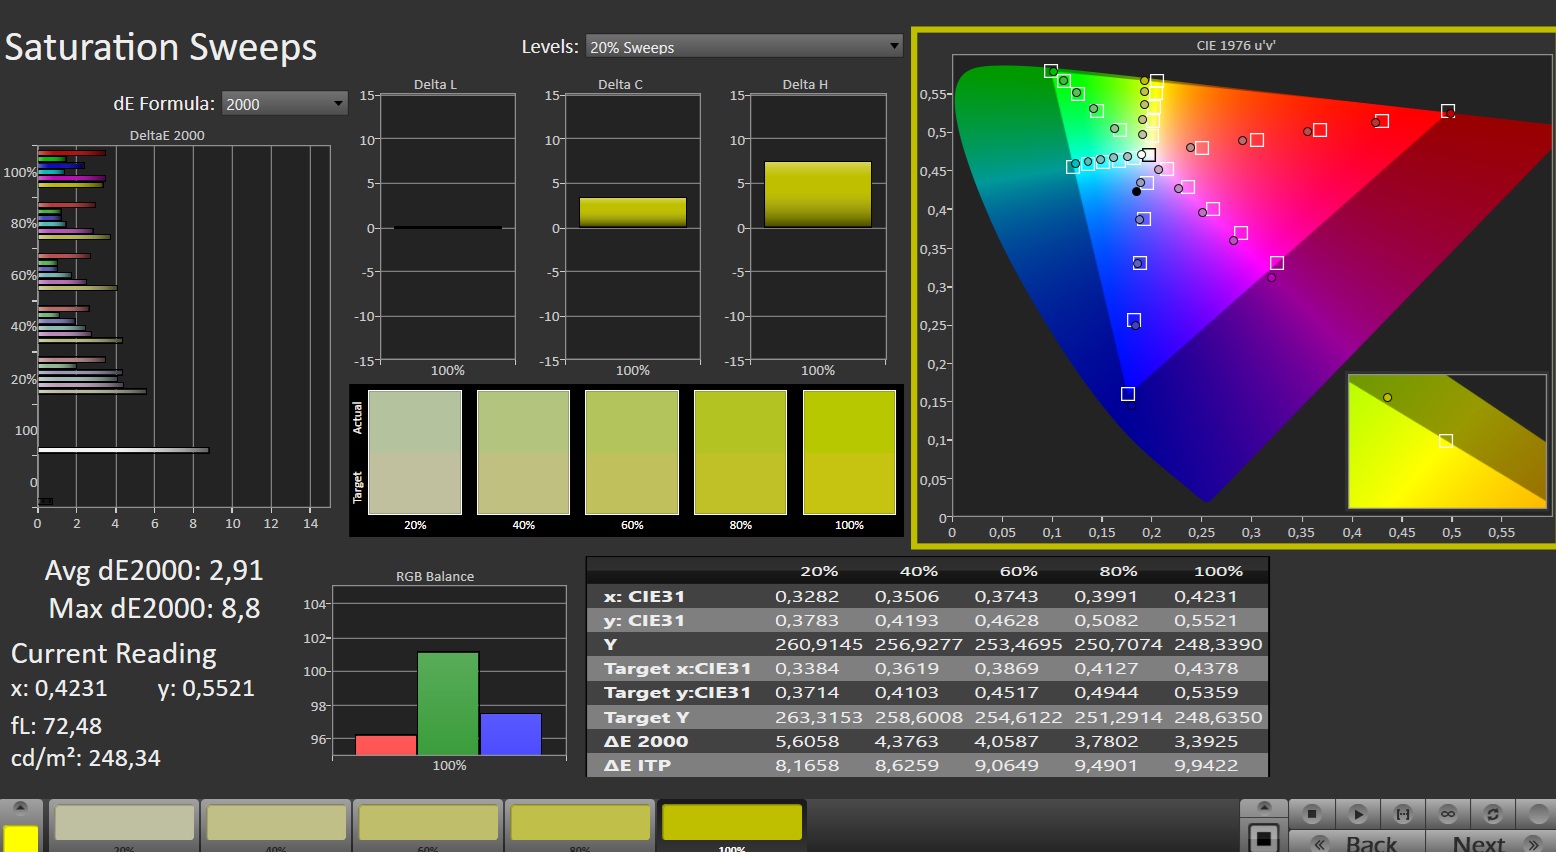
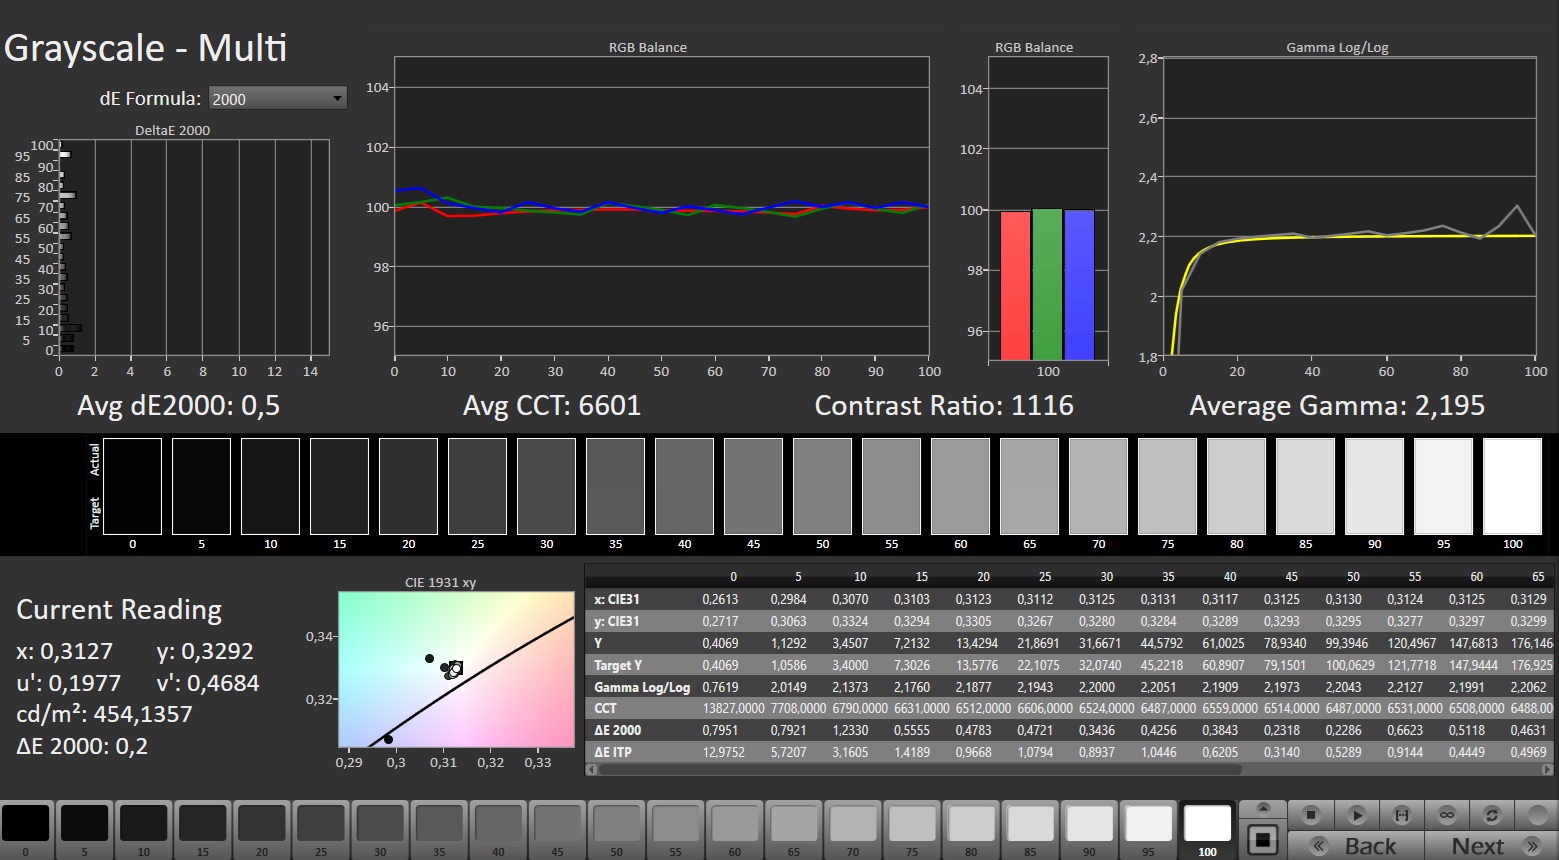
由于黑色值仅为 0.4 cd/m²,对比度只能算一般,但 1 195:1 仍在通常的 IPS 范围内。可视角度和响应时间也是如此,根据我们的测量,响应时间约为 5 至 7 毫秒。
根据规格,18 英寸屏幕还支持 240 Hz 刷新率。它的分辨率为 2,560 x 1,600 像素(16:10 格式),相对于屏幕对角线来说既不算低也不算高。
Display Response Times
| ↔ Response Time Black to White | ||
|---|---|---|
| 7.3 ms ... rise ↗ and fall ↘ combined | ↗ 2.2 ms rise | 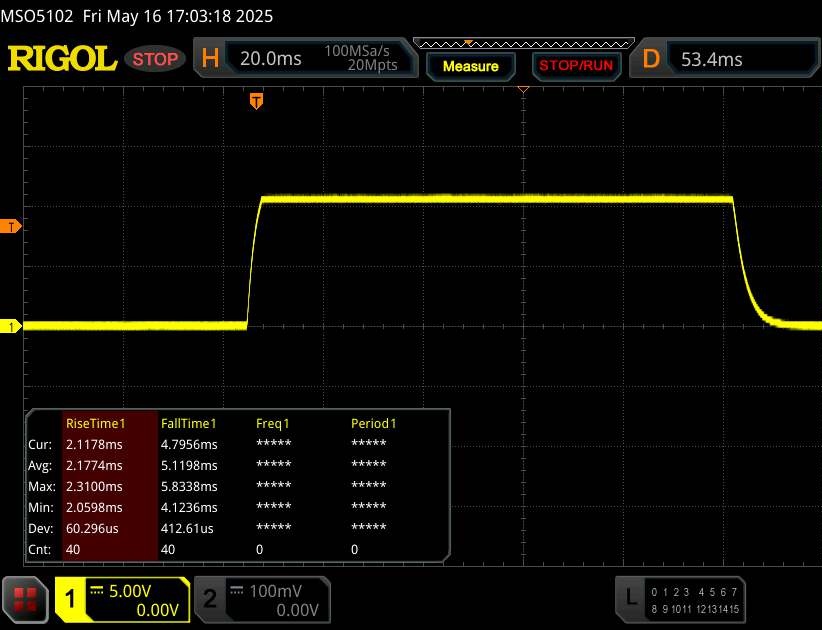 |
| ↘ 5.1 ms fall | ||
| The screen shows very fast response rates in our tests and should be very well suited for fast-paced gaming. In comparison, all tested devices range from 0.1 (minimum) to 240 (maximum) ms. » 22 % of all devices are better. This means that the measured response time is better than the average of all tested devices (19.8 ms). | ||
| ↔ Response Time 50% Grey to 80% Grey | ||
| 5.6 ms ... rise ↗ and fall ↘ combined | ↗ 2.7 ms rise | 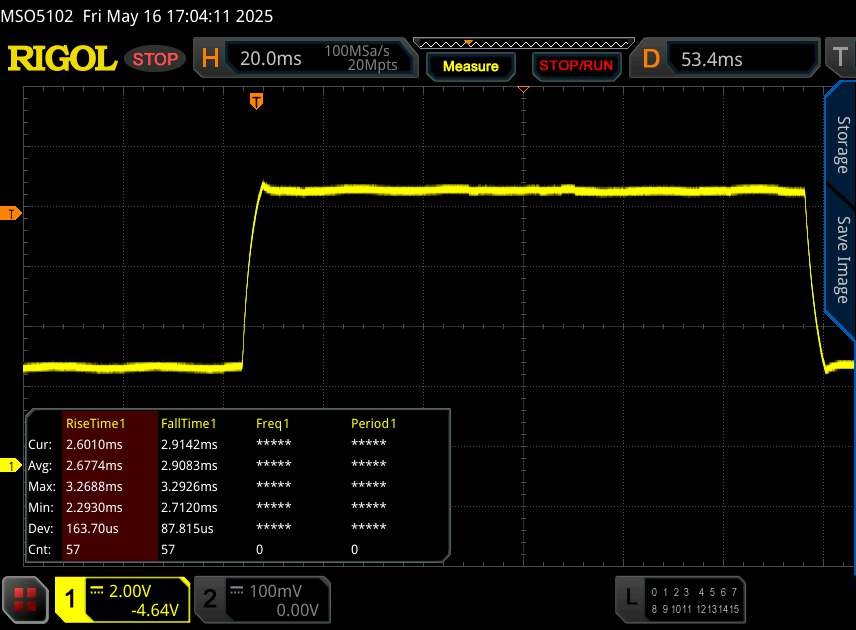 |
| ↘ 2.9 ms fall | ||
| The screen shows very fast response rates in our tests and should be very well suited for fast-paced gaming. In comparison, all tested devices range from 0.165 (minimum) to 636 (maximum) ms. » 18 % of all devices are better. This means that the measured response time is better than the average of all tested devices (31 ms). | ||
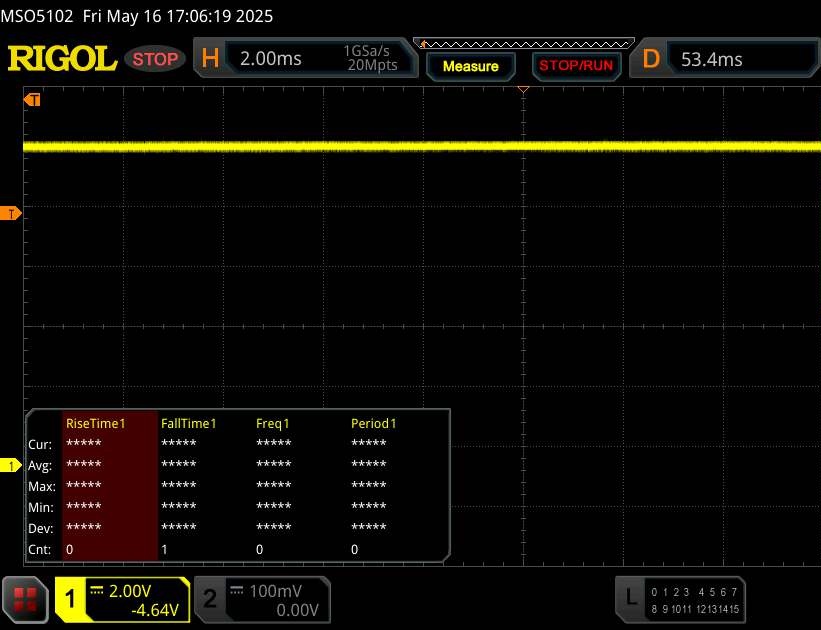
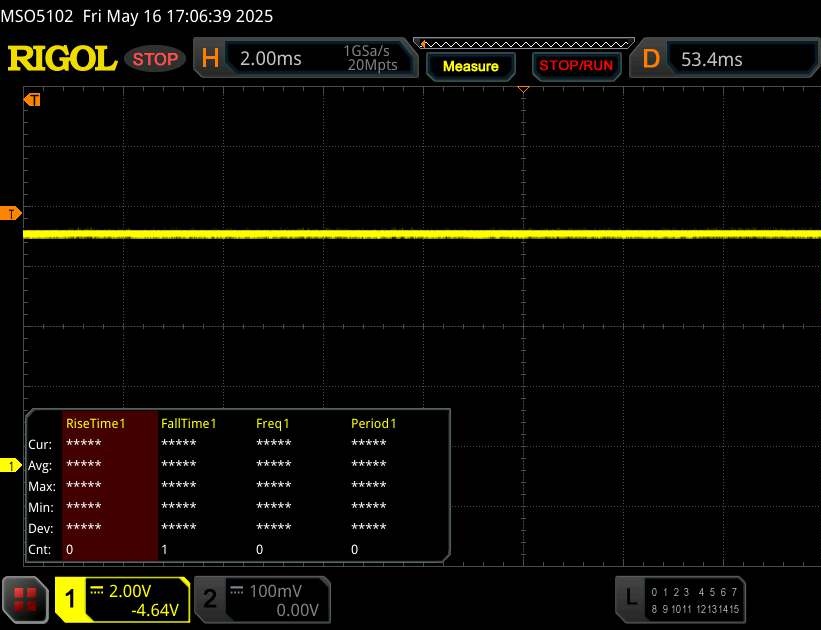
Screen Flickering / PWM (Pulse-Width Modulation)
| Screen flickering / PWM not detected |  | ||
In comparison: 52 % of all tested devices do not use PWM to dim the display. If PWM was detected, an average of 7772 (minimum: 5 - maximum: 343500) Hz was measured. | |||
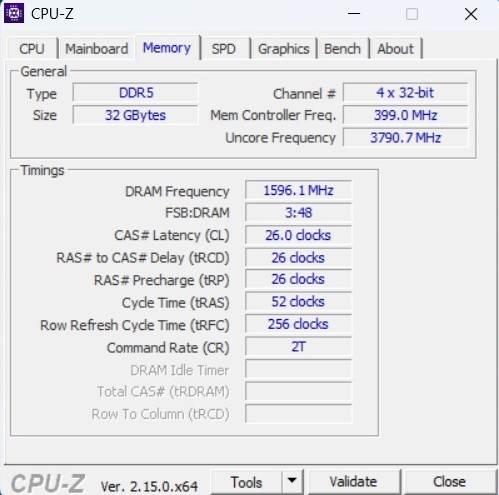
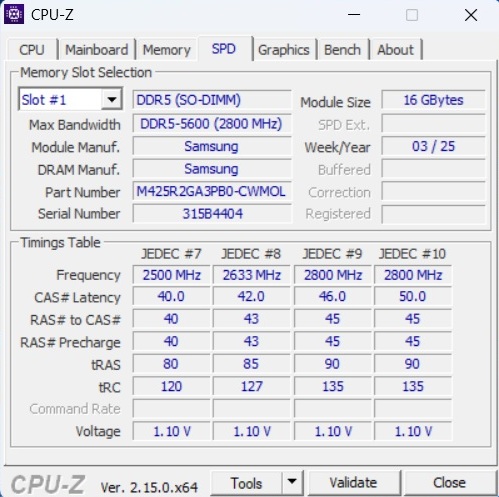
性能
Beast 18 X1 不仅在价格上属于高端产品,在性能上也是如此。32 GB 内存在 2025 年与 2 TB 固态硬盘一样充足,尽管你可以期望 4,000 多美元的价格(甚至)更高。顺便提一下,Medion 还提供配备移动 RTX 5090 的 Beast 18 X1,售价约为 5650 美元。
测试条件
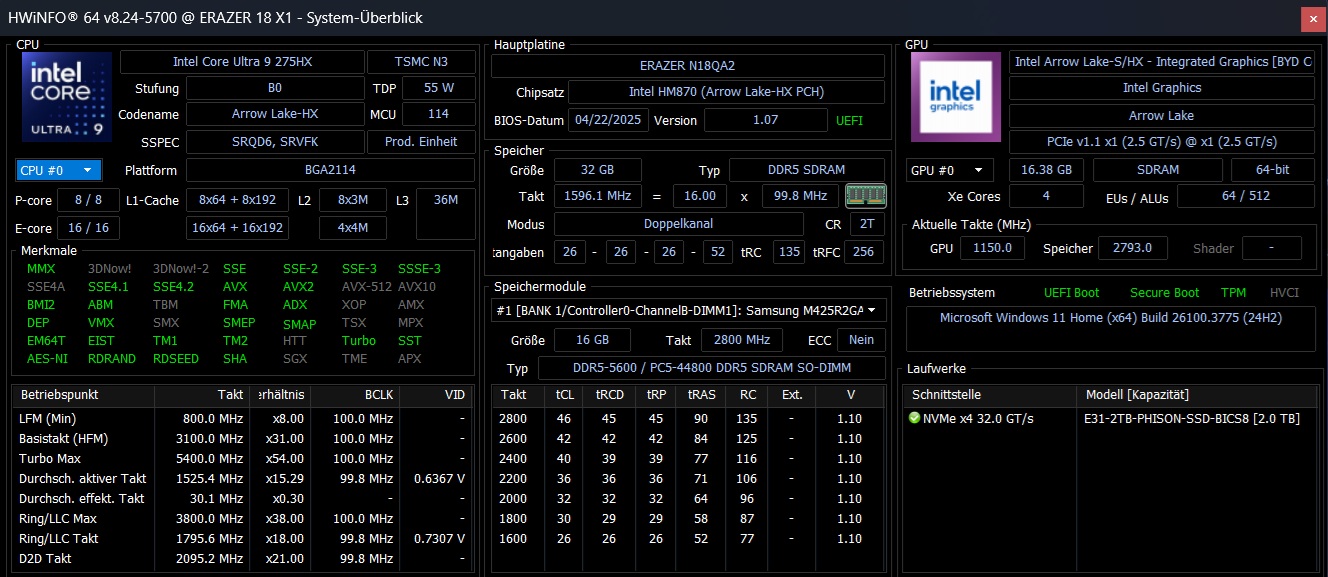
Erazer 控制中心有三种运行模式,其中一些模式会严重影响辐射和速度。由于 18 英寸显卡在 "性能 "模式下的声音几乎大得离谱,有些地方甚至超过 60 分贝(A),因此我们仅限于在声音同样响亮的 "平衡 "模式下进行测量,该模式下的 CPU 功耗略高于 GPU 功耗(见表)。
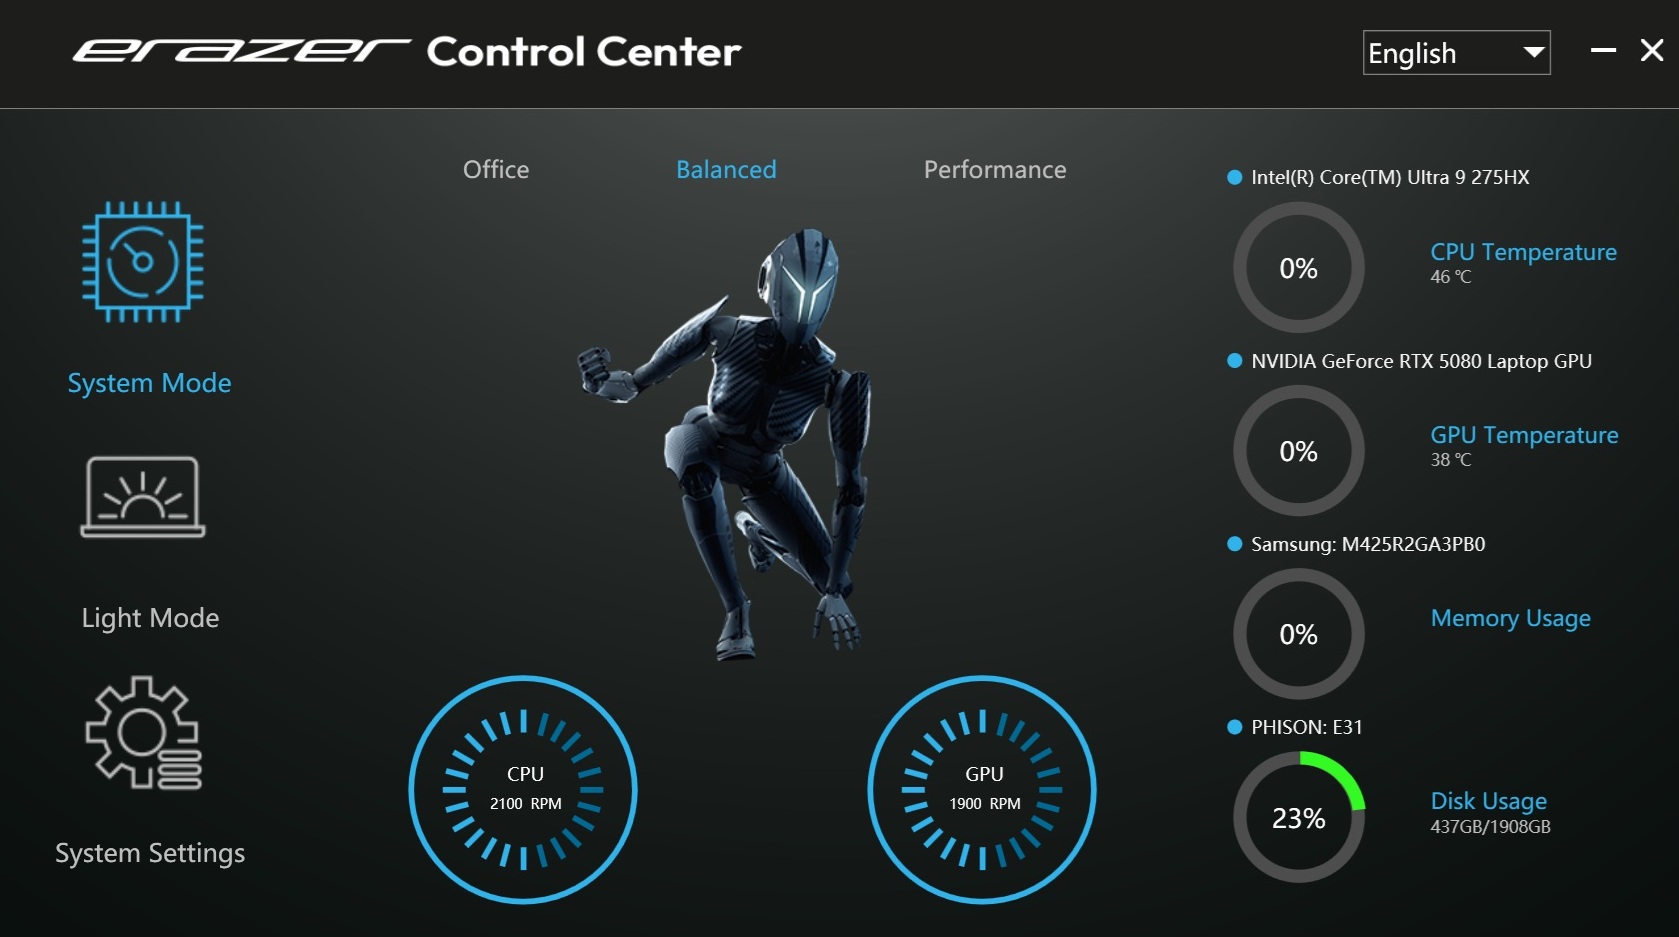
| Erazer 控制中心模式 | Office | 平衡 | 性能 |
| 赛博朋克 2077 噪音 | 最大。46 dB(A) | 最大。53 dB(A) | 最大。61 dB(A) |
| 赛博朋克 2077》性能(FHD/超高清) | 78.8 帧/秒 | 139.8 帧/秒 | 146.5 帧/秒 |
| Cinebench R15 Multi Score | 3596 分数 | 4871 分数 | 6154 分数 |
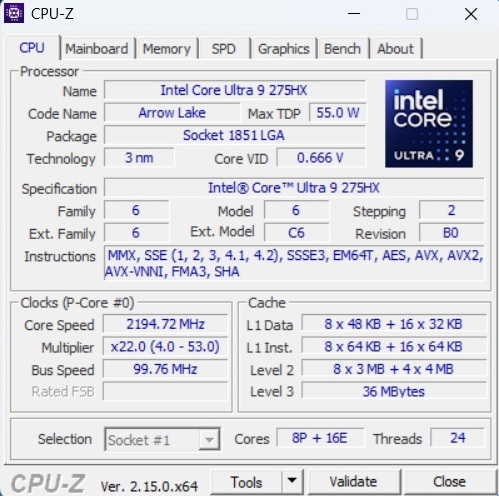
处理器
如果以平衡模式为基础,安装的 酷睿至尊 9 275HX包含 8 个性能核心和 16 个效率核心(每个核心均不含超线程技术),其性能略低于迄今为止为该 CPU 确定的平均值,大致达到了 Aorus Master 18 的水平(由于背景噪音较大,也未在最大模式下进行测试)。特别遗憾的是,Cinebench 循环的结果随着时间的推移下降了几个百分点,而竞争对手的设备却没有出现这种情况。
Cinebench R15 Multi loop
* ... smaller is better
AIDA64: FP32 Ray-Trace | FPU Julia | CPU SHA3 | CPU Queen | FPU SinJulia | FPU Mandel | CPU AES | CPU ZLib | FP64 Ray-Trace | CPU PhotoWorxx
| Performance rating | |
| Asus Strix Scar 18 G835LX | |
| Lenovo Legion Pro 7i 16 Gen 10 | |
| Average Intel Core Ultra 9 275HX | |
| Acer Predator Helios 18 N23Q2 | |
| Aorus Master 18 AM8H | |
| MSI GE78HX 13VH-070US | |
| Average of class Gaming | |
| Medion Erazer Beast 18 X1 MD62731 | |
| AIDA64 / FP32 Ray-Trace | |
| Asus Strix Scar 18 G835LX | |
| Lenovo Legion Pro 7i 16 Gen 10 | |
| Average Intel Core Ultra 9 275HX (28039 - 39895, n=30) | |
| Aorus Master 18 AM8H | |
| Average of class Gaming (10227 - 85542, n=108, last 2 years) | |
| Medion Erazer Beast 18 X1 MD62731 | |
| MSI GE78HX 13VH-070US | |
| Acer Predator Helios 18 N23Q2 | |
| AIDA64 / FPU Julia | |
| Asus Strix Scar 18 G835LX | |
| Lenovo Legion Pro 7i 16 Gen 10 | |
| Average Intel Core Ultra 9 275HX (140254 - 200744, n=30) | |
| Aorus Master 18 AM8H | |
| MSI GE78HX 13VH-070US | |
| Medion Erazer Beast 18 X1 MD62731 | |
| Acer Predator Helios 18 N23Q2 | |
| Average of class Gaming (51376 - 238426, n=108, last 2 years) | |
| AIDA64 / CPU SHA3 | |
| Asus Strix Scar 18 G835LX | |
| Lenovo Legion Pro 7i 16 Gen 10 | |
| Average Intel Core Ultra 9 275HX (6710 - 9817, n=30) | |
| Aorus Master 18 AM8H | |
| Medion Erazer Beast 18 X1 MD62731 | |
| MSI GE78HX 13VH-070US | |
| Acer Predator Helios 18 N23Q2 | |
| Average of class Gaming (2180 - 9817, n=108, last 2 years) | |
| AIDA64 / CPU Queen | |
| MSI GE78HX 13VH-070US | |
| Asus Strix Scar 18 G835LX | |
| Lenovo Legion Pro 7i 16 Gen 10 | |
| Acer Predator Helios 18 N23Q2 | |
| Average Intel Core Ultra 9 275HX (113887 - 140937, n=30) | |
| Aorus Master 18 AM8H | |
| Average of class Gaming (49785 - 173351, n=96, last 2 years) | |
| Medion Erazer Beast 18 X1 MD62731 | |
| AIDA64 / FPU SinJulia | |
| MSI GE78HX 13VH-070US | |
| Acer Predator Helios 18 N23Q2 | |
| Average of class Gaming (4424 - 33636, n=108, last 2 years) | |
| Asus Strix Scar 18 G835LX | |
| Lenovo Legion Pro 7i 16 Gen 10 | |
| Average Intel Core Ultra 9 275HX (11172 - 14425, n=30) | |
| Aorus Master 18 AM8H | |
| Medion Erazer Beast 18 X1 MD62731 | |
| AIDA64 / FPU Mandel | |
| Asus Strix Scar 18 G835LX | |
| Lenovo Legion Pro 7i 16 Gen 10 | |
| Average Intel Core Ultra 9 275HX (72596 - 104508, n=30) | |
| Aorus Master 18 AM8H | |
| Medion Erazer Beast 18 X1 MD62731 | |
| Average of class Gaming (25115 - 128721, n=108, last 2 years) | |
| MSI GE78HX 13VH-070US | |
| Acer Predator Helios 18 N23Q2 | |
| AIDA64 / CPU AES | |
| Acer Predator Helios 18 N23Q2 | |
| Asus Strix Scar 18 G835LX | |
| MSI GE78HX 13VH-070US | |
| Lenovo Legion Pro 7i 16 Gen 10 | |
| Average Intel Core Ultra 9 275HX (105608 - 247074, n=30) | |
| Aorus Master 18 AM8H | |
| Medion Erazer Beast 18 X1 MD62731 | |
| Average of class Gaming (39258 - 247074, n=108, last 2 years) | |
| AIDA64 / CPU ZLib | |
| Asus Strix Scar 18 G835LX | |
| MSI GE78HX 13VH-070US | |
| Lenovo Legion Pro 7i 16 Gen 10 | |
| Average Intel Core Ultra 9 275HX (1582 - 2263, n=30) | |
| Acer Predator Helios 18 N23Q2 | |
| Aorus Master 18 AM8H | |
| Medion Erazer Beast 18 X1 MD62731 | |
| Average of class Gaming (574 - 2531, n=108, last 2 years) | |
| AIDA64 / FP64 Ray-Trace | |
| Asus Strix Scar 18 G835LX | |
| Lenovo Legion Pro 7i 16 Gen 10 | |
| Average Intel Core Ultra 9 275HX (14847 - 21854, n=30) | |
| Aorus Master 18 AM8H | |
| Average of class Gaming (5509 - 45446, n=108, last 2 years) | |
| MSI GE78HX 13VH-070US | |
| Acer Predator Helios 18 N23Q2 | |
| Medion Erazer Beast 18 X1 MD62731 | |
| AIDA64 / CPU PhotoWorxx | |
| Asus Strix Scar 18 G835LX | |
| Lenovo Legion Pro 7i 16 Gen 10 | |
| Acer Predator Helios 18 N23Q2 | |
| MSI GE78HX 13VH-070US | |
| Average Intel Core Ultra 9 275HX (37482 - 62916, n=30) | |
| Aorus Master 18 AM8H | |
| Medion Erazer Beast 18 X1 MD62731 | |
| Average of class Gaming (12271 - 89891, n=108, last 2 years) | |
系统性能
在系统性能方面,竞争对手之间的差距非常有限。从主观上讲,我们有时会发现在打开程序时出现卡顿现象,这通常可能是由于图形切换造成的。与 Ada Lovelace 相比,Nvidia 的 Blackwell 代或其当前驱动程序在这方面问题更大(我们在 Aorus Master 18 上也发现了同样的问题)。
PCMark 10: Score | Essentials | Productivity | Digital Content Creation
CrossMark: Overall | Productivity | Creativity | Responsiveness
WebXPRT 3: Overall
WebXPRT 4: Overall
Mozilla Kraken 1.1: Total
| Performance rating | |
| Aorus Master 18 AM8H | |
| Asus Strix Scar 18 G835LX | |
| Lenovo Legion Pro 7i 16 Gen 10 | |
| Average Intel Core Ultra 9 275HX, NVIDIA GeForce RTX 5080 Laptop | |
| Acer Predator Helios 18 N23Q2 -1! | |
| MSI GE78HX 13VH-070US | |
| Average of class Gaming | |
| Medion Erazer Beast 18 X1 MD62731 | |
| PCMark 10 / Score | |
| Lenovo Legion Pro 7i 16 Gen 10 | |
| MSI GE78HX 13VH-070US | |
| Average Intel Core Ultra 9 275HX, NVIDIA GeForce RTX 5080 Laptop (7805 - 10409, n=9) | |
| Asus Strix Scar 18 G835LX | |
| Aorus Master 18 AM8H | |
| Acer Predator Helios 18 N23Q2 | |
| Medion Erazer Beast 18 X1 MD62731 | |
| Average of class Gaming (5828 - 11574, n=96, last 2 years) | |
| PCMark 10 / Essentials | |
| MSI GE78HX 13VH-070US | |
| Lenovo Legion Pro 7i 16 Gen 10 | |
| Aorus Master 18 AM8H | |
| Acer Predator Helios 18 N23Q2 | |
| Asus Strix Scar 18 G835LX | |
| Average Intel Core Ultra 9 275HX, NVIDIA GeForce RTX 5080 Laptop (10206 - 11472, n=9) | |
| Average of class Gaming (8810 - 12600, n=100, last 2 years) | |
| Medion Erazer Beast 18 X1 MD62731 | |
| PCMark 10 / Productivity | |
| Average of class Gaming (6845 - 21327, n=98, last 2 years) | |
| Average Intel Core Ultra 9 275HX, NVIDIA GeForce RTX 5080 Laptop (8319 - 20616, n=9) | |
| Acer Predator Helios 18 N23Q2 | |
| MSI GE78HX 13VH-070US | |
| Medion Erazer Beast 18 X1 MD62731 | |
| Lenovo Legion Pro 7i 16 Gen 10 | |
| Asus Strix Scar 18 G835LX | |
| Aorus Master 18 AM8H | |
| PCMark 10 / Digital Content Creation | |
| Lenovo Legion Pro 7i 16 Gen 10 | |
| Asus Strix Scar 18 G835LX | |
| Aorus Master 18 AM8H | |
| Average Intel Core Ultra 9 275HX, NVIDIA GeForce RTX 5080 Laptop (10505 - 19351, n=9) | |
| Medion Erazer Beast 18 X1 MD62731 | |
| MSI GE78HX 13VH-070US | |
| Acer Predator Helios 18 N23Q2 | |
| Average of class Gaming (7602 - 19657, n=98, last 2 years) | |
| CrossMark / Overall | |
| Aorus Master 18 AM8H | |
| Asus Strix Scar 18 G835LX | |
| Acer Predator Helios 18 N23Q2 | |
| Average Intel Core Ultra 9 275HX, NVIDIA GeForce RTX 5080 Laptop (1857 - 2244, n=9) | |
| Lenovo Legion Pro 7i 16 Gen 10 | |
| Average of class Gaming (1366 - 2409, n=96, last 2 years) | |
| MSI GE78HX 13VH-070US | |
| Medion Erazer Beast 18 X1 MD62731 | |
| CrossMark / Productivity | |
| Aorus Master 18 AM8H | |
| Acer Predator Helios 18 N23Q2 | |
| Asus Strix Scar 18 G835LX | |
| Average Intel Core Ultra 9 275HX, NVIDIA GeForce RTX 5080 Laptop (1764 - 2122, n=9) | |
| Lenovo Legion Pro 7i 16 Gen 10 | |
| Average of class Gaming (1386 - 2254, n=96, last 2 years) | |
| MSI GE78HX 13VH-070US | |
| Medion Erazer Beast 18 X1 MD62731 | |
| CrossMark / Creativity | |
| Asus Strix Scar 18 G835LX | |
| Aorus Master 18 AM8H | |
| Acer Predator Helios 18 N23Q2 | |
| Average Intel Core Ultra 9 275HX, NVIDIA GeForce RTX 5080 Laptop (2115 - 2498, n=9) | |
| Lenovo Legion Pro 7i 16 Gen 10 | |
| Average of class Gaming (1343 - 2729, n=96, last 2 years) | |
| Medion Erazer Beast 18 X1 MD62731 | |
| MSI GE78HX 13VH-070US | |
| CrossMark / Responsiveness | |
| Aorus Master 18 AM8H | |
| Acer Predator Helios 18 N23Q2 | |
| Average Intel Core Ultra 9 275HX, NVIDIA GeForce RTX 5080 Laptop (1466 - 2096, n=9) | |
| Asus Strix Scar 18 G835LX | |
| Average of class Gaming (1226 - 2334, n=96, last 2 years) | |
| MSI GE78HX 13VH-070US | |
| Lenovo Legion Pro 7i 16 Gen 10 | |
| Medion Erazer Beast 18 X1 MD62731 | |
| WebXPRT 3 / Overall | |
| Lenovo Legion Pro 7i 16 Gen 10 | |
| Asus Strix Scar 18 G835LX | |
| Average Intel Core Ultra 9 275HX, NVIDIA GeForce RTX 5080 Laptop (306 - 378, n=9) | |
| Medion Erazer Beast 18 X1 MD62731 | |
| Acer Predator Helios 18 N23Q2 | |
| Average of class Gaming (220 - 532, n=101, last 2 years) | |
| MSI GE78HX 13VH-070US | |
| Aorus Master 18 AM8H | |
| WebXPRT 4 / Overall | |
| Asus Strix Scar 18 G835LX | |
| Lenovo Legion Pro 7i 16 Gen 10 | |
| Medion Erazer Beast 18 X1 MD62731 | |
| Average Intel Core Ultra 9 275HX, NVIDIA GeForce RTX 5080 Laptop (285 - 336, n=9) | |
| Aorus Master 18 AM8H | |
| MSI GE78HX 13VH-070US | |
| Average of class Gaming (165 - 354, n=101, last 2 years) | |
| Mozilla Kraken 1.1 / Total | |
| MSI GE78HX 13VH-070US | |
| Average of class Gaming (391 - 590, n=106, last 2 years) | |
| Acer Predator Helios 18 N23Q2 | |
| Aorus Master 18 AM8H | |
| Medion Erazer Beast 18 X1 MD62731 | |
| Average Intel Core Ultra 9 275HX, NVIDIA GeForce RTX 5080 Laptop (405 - 432, n=9) | |
| Asus Strix Scar 18 G835LX | |
| Lenovo Legion Pro 7i 16 Gen 10 | |
* ... smaller is better
| PCMark 10 Score | 8378 points | |
Help | ||
| AIDA64 / Memory Copy | |
| Lenovo Legion Pro 7i 16 Gen 10 | |
| Asus Strix Scar 18 G835LX | |
| Average Intel Core Ultra 9 275HX (56003 - 94460, n=30) | |
| Acer Predator Helios 18 N23Q2 | |
| Medion Erazer Beast 18 X1 MD62731 | |
| MSI GE78HX 13VH-070US | |
| Aorus Master 18 AM8H | |
| Average of class Gaming (21750 - 129946, n=108, last 2 years) | |
| AIDA64 / Memory Read | |
| Lenovo Legion Pro 7i 16 Gen 10 | |
| Acer Predator Helios 18 N23Q2 | |
| Medion Erazer Beast 18 X1 MD62731 | |
| Asus Strix Scar 18 G835LX | |
| MSI GE78HX 13VH-070US | |
| Average Intel Core Ultra 9 275HX (55795 - 97151, n=30) | |
| Aorus Master 18 AM8H | |
| Average of class Gaming (22956 - 118858, n=108, last 2 years) | |
| AIDA64 / Memory Write | |
| Lenovo Legion Pro 7i 16 Gen 10 | |
| Asus Strix Scar 18 G835LX | |
| Average Intel Core Ultra 9 275HX (55663 - 116129, n=30) | |
| Medion Erazer Beast 18 X1 MD62731 | |
| MSI GE78HX 13VH-070US | |
| Average of class Gaming (22297 - 135096, n=108, last 2 years) | |
| Acer Predator Helios 18 N23Q2 | |
| Aorus Master 18 AM8H | |
| AIDA64 / Memory Latency | |
| Aorus Master 18 AM8H | |
| Average Intel Core Ultra 9 275HX (105.8 - 161.6, n=30) | |
| Medion Erazer Beast 18 X1 MD62731 | |
| Lenovo Legion Pro 7i 16 Gen 10 | |
| Asus Strix Scar 18 G835LX | |
| Average of class Gaming (75.3 - 259, n=108, last 2 years) | |
| MSI GE78HX 13VH-070US | |
| Acer Predator Helios 18 N23Q2 | |
* ... smaller is better
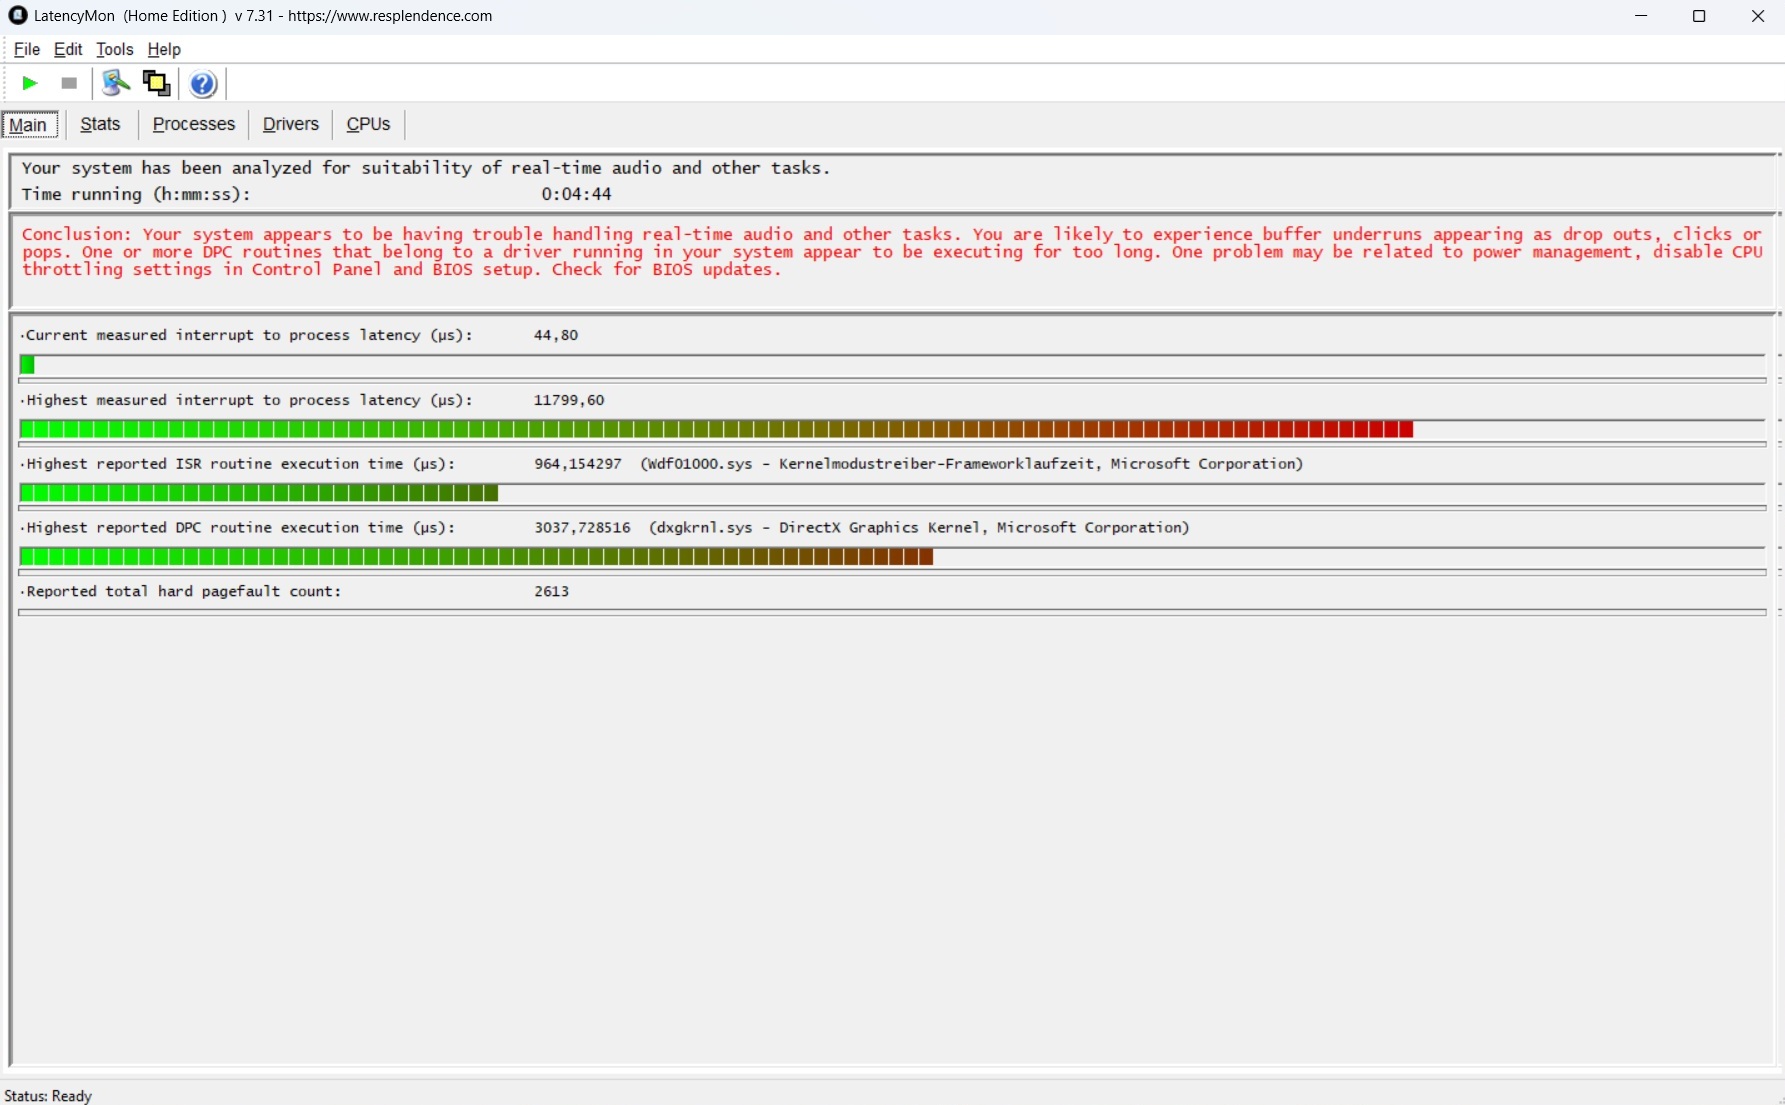
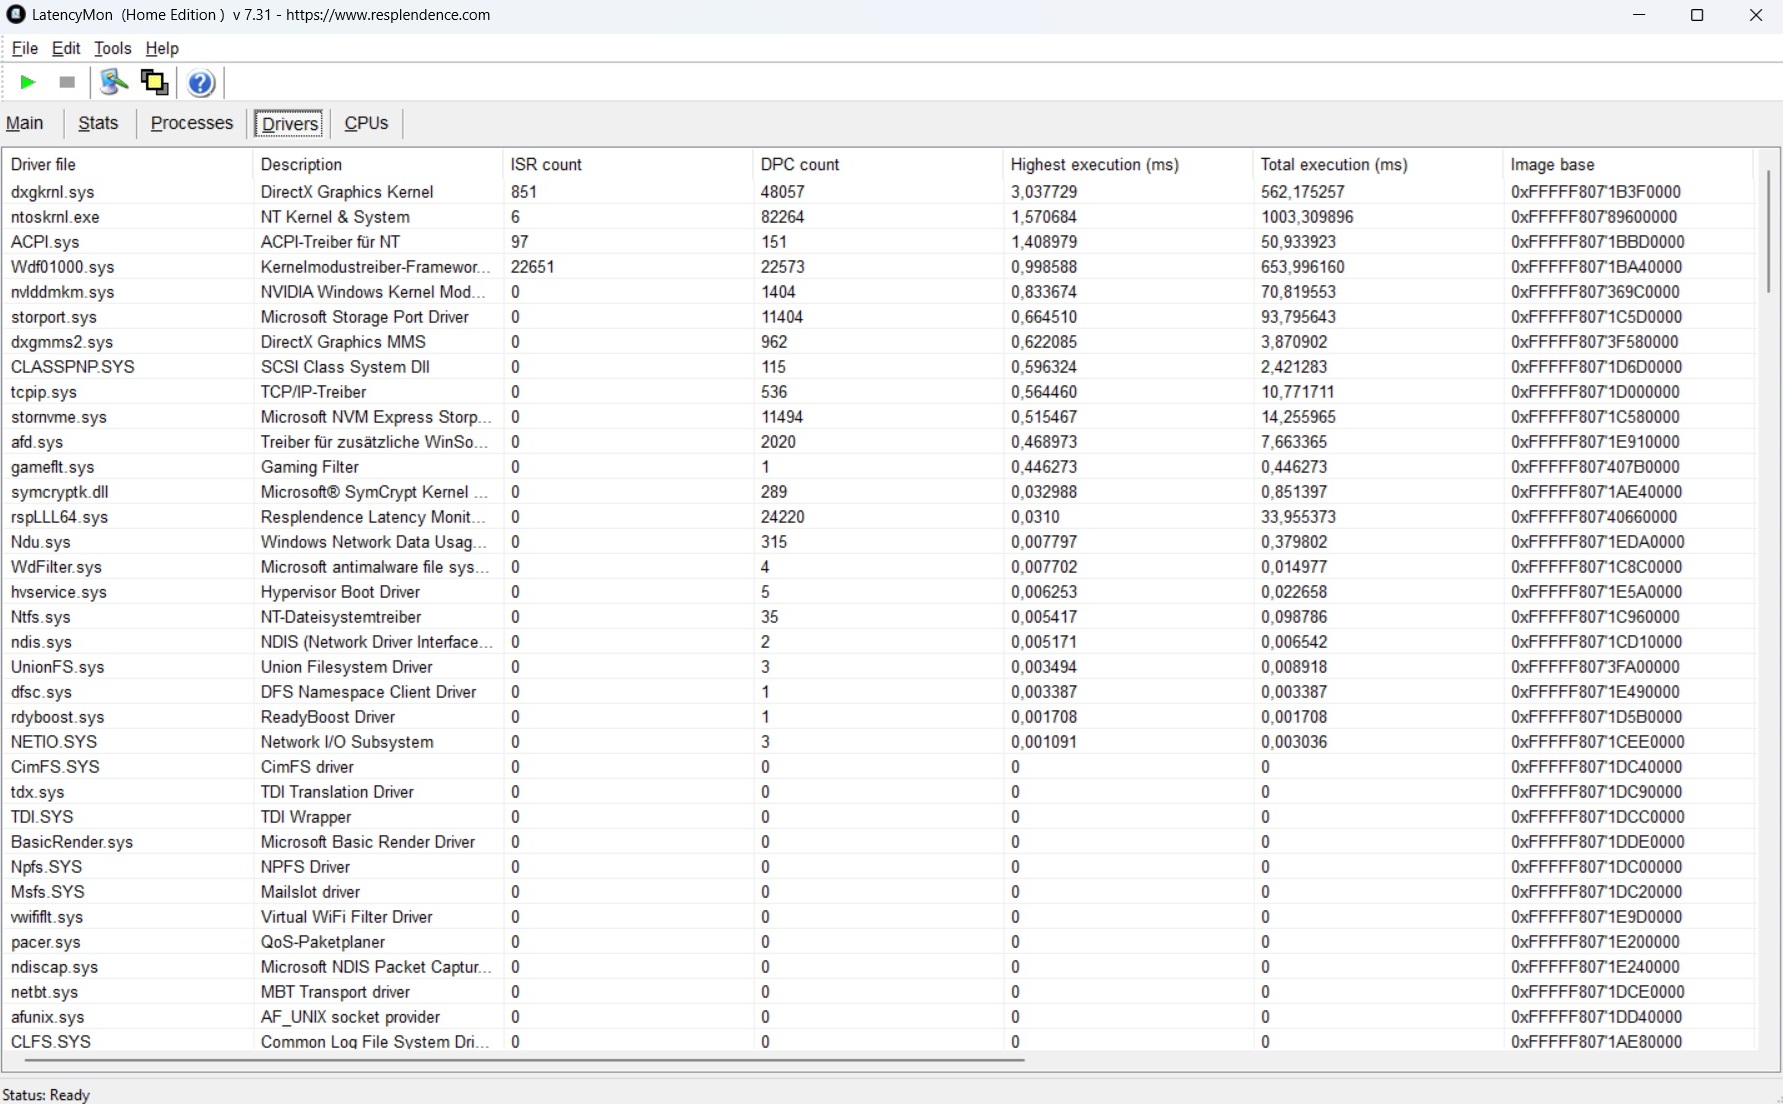
DPC 延迟
总的来说,延迟并不是 Beast 18 X1 的亮点:11,799 µs 的最大值甚至比 Acer Predator Helios 18 X1 还差。 宏碁掠夺者 Helios 18(8,290 µs)还要差。
| DPC Latencies / LatencyMon - interrupt to process latency (max), Web, Youtube, Prime95 | |
| Medion Erazer Beast 18 X1 MD62731 | |
| Acer Predator Helios 18 N23Q2 | |
| MSI GE78HX 13VH-070US | |
| Aorus Master 18 AM8H | |
| Asus Strix Scar 18 G835LX | |
| Lenovo Legion Pro 7i 16 Gen 10 | |
* ... smaller is better
大容量存储器
不过,速度极快的 PCIe Gen.5x4 SSD 还是值得尊敬的。2TB 硬盘在连续测试中的速度突破了 10,000 MB/秒大关,长期运行时甚至不会出现节流现象。

* ... smaller is better
Continuous read: DiskSpd Read Loop, Queue Depth 8
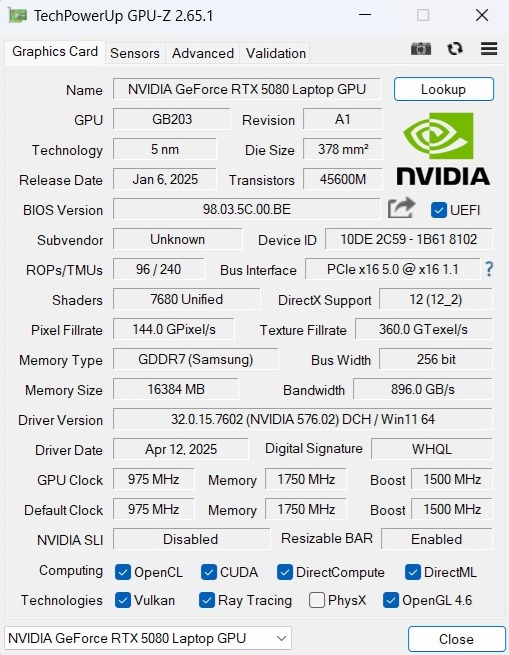
图形卡
笔记本电脑 GeForce RTX 5080 笔记本电脑是目前 Nvidia Blackwell 系列中性能第二强大的笔记本型号,仅次于 RTX 5090 笔记本电脑.不过,从竞争对手来看,后者在我们的 3DMark 课程中优势有限。相反,RTX 5080 的速度并不比旧款 RTX 4080 笔记本电脑,至少在合成测试中还能保持不错的速度。与此同时,16 GB GDDR7 VRAM 对于这个价格区间来说并不令人惊喜,但还是要好于前代产品的 12 GB GDDR6X。TGP 级别最高可达 175 瓦。
| 3DMark 11 Performance | 44491 points | |
| 3DMark Ice Storm Standard Score | 245418 points | |
| 3DMark Cloud Gate Standard Score | 61468 points | |
| 3DMark Fire Strike Score | 30780 points | |
| 3DMark Time Spy Score | 20170 points | |
Help | ||
* ... smaller is better
游戏性能
在游戏基准测试中,竞争对手设备之间的差距有些大,但在实际使用中,你往往不会注意到太多。基本上,移动 RTX 5080 的速度足以在最大细节和原生 QHD+ 分辨率下流畅运行大多数现代游戏。只有在要求非常苛刻或适度优化的游戏中,情况才会变得紧张,例如 上古卷轴湮没》重制版.在这种情况下,建议使用升频(关键字 DLSS)和/或(多)帧生成。使用 潜行者 2,QHD 帧率会因此翻倍(见表)。
| Stalker 2 | |
| 2560x1440 Epic Preset | |
| Aorus Master 18 AM8H | |
| Medion Erazer Beast 18 X1 MD62731 | |
| Average NVIDIA GeForce RTX 5080 Laptop (41.5 - 58.5, n=2) | |
| Average of class Gaming (29 - 110.7, n=13, last 2 years) | |
| 2560x1440 Epic Preset + Quality DLSS + FG | |
| Aorus Master 18 AM8H | |
| Medion Erazer Beast 18 X1 MD62731 | |
| Average NVIDIA GeForce RTX 5080 Laptop (80.7 - 122.1, n=2) | |
| Average of class Gaming (58.3 - 134.6, n=12, last 2 years) | |
| Horizon Forbidden West | |
| 2560x1440 Very High Preset AA:T | |
| Aorus Master 18 AM8H | |
| Medion Erazer Beast 18 X1 MD62731 | |
| Average NVIDIA GeForce RTX 5080 Laptop (n=1) | |
| Average of class Gaming (39.6 - 100.9, n=10, last 2 years) | |
| 2560x1440 Very High Preset + DLSS Quality | |
| Aorus Master 18 AM8H | |
| Medion Erazer Beast 18 X1 MD62731 | |
| Average NVIDIA GeForce RTX 5080 Laptop (n=1) | |
| Average of class Gaming (58.4 - 116.6, n=8, last 2 years) | |
| Ghost of Tsushima | |
| 2560x1440 Very High Preset AA:T | |
| Aorus Master 18 AM8H | |
| Medion Erazer Beast 18 X1 MD62731 | |
| Average NVIDIA GeForce RTX 5080 Laptop (n=1) | |
| Average of class Gaming (22.7 - 100.3, n=13, last 2 years) | |
| 2560x1440 Very High Preset + Quality DLSS | |
| Aorus Master 18 AM8H | |
| Medion Erazer Beast 18 X1 MD62731 | |
| Average NVIDIA GeForce RTX 5080 Laptop (n=1) | |
| Average of class Gaming (55.2 - 105.2, n=10, last 2 years) | |
| Senua's Saga Hellblade 2 | |
| 2560x1440 High Preset | |
| Aorus Master 18 AM8H | |
| Medion Erazer Beast 18 X1 MD62731 | |
| Average NVIDIA GeForce RTX 5080 Laptop (n=1) | |
| Average of class Gaming (24.2 - 63.1, n=11, last 2 years) | |
| 2560x1440 High Preset + Quality DLSS | |
| Aorus Master 18 AM8H | |
| Medion Erazer Beast 18 X1 MD62731 | |
| Average NVIDIA GeForce RTX 5080 Laptop (n=1) | |
| Average of class Gaming (39.6 - 81.9, n=9, last 2 years) | |
| Space Marine 2 | |
| 2560x1440 Ultra Preset AA:T | |
| Aorus Master 18 AM8H | |
| Medion Erazer Beast 18 X1 MD62731 | |
| Average NVIDIA GeForce RTX 5080 Laptop (n=1) | |
| Average of class Gaming (48.2 - 107.4, n=11, last 2 years) | |
| 2560x1440 Ultra Preset + Quality DLSS | |
| Aorus Master 18 AM8H | |
| Medion Erazer Beast 18 X1 MD62731 | |
| Average NVIDIA GeForce RTX 5080 Laptop (n=1) | |
| Average of class Gaming (58.5 - 100.8, n=10, last 2 years) | |
| Until Dawn | |
| 2560x1440 Ultra Preset | |
| Aorus Master 18 AM8H | |
| Medion Erazer Beast 18 X1 MD62731 | |
| Average NVIDIA GeForce RTX 5080 Laptop (n=1) | |
| Average of class Gaming (30.4 - 76.6, n=11, last 2 years) | |
| 2560x1440 Ultra Preset + Quality DLSS + Ray Tracing | |
| Aorus Master 18 AM8H | |
| Medion Erazer Beast 18 X1 MD62731 | |
| Average NVIDIA GeForce RTX 5080 Laptop (n=1) | |
| Average of class Gaming (39.5 - 86.3, n=10, last 2 years) | |
| Kingdom Come Deliverance 2 | |
| 2560x1440 Ultra Preset | |
| Aorus Master 18 AM8H | |
| Medion Erazer Beast 18 X1 MD62731 | |
| Average NVIDIA GeForce RTX 5080 Laptop (n=1) | |
| Average of class Gaming (36.8 - 97.2, n=13, last 2 years) | |
| 2560x1440 Ultra Preset + Quality DLSS | |
| Medion Erazer Beast 18 X1 MD62731 | |
| Average NVIDIA GeForce RTX 5080 Laptop (n=1) | |
| Aorus Master 18 AM8H | |
| Average of class Gaming (50.3 - 115.5, n=13, last 2 years) | |
| The Elder Scrolls IV Oblivion Remastered | |
| 2560x1440 Ultra Preset AA:T | |
| Medion Erazer Beast 18 X1 MD62731 | |
| Average NVIDIA GeForce RTX 5080 Laptop (17.9 - 36.6, n=3) | |
| Average of class Gaming (12.7 - 45.9, n=14, last 2 years) | |
| 2560x1440 Ultra Preset + Quality DLSS | |
| Medion Erazer Beast 18 X1 MD62731 | |
| Average NVIDIA GeForce RTX 5080 Laptop (51 - 53.2, n=2) | |
| Average of class Gaming (25.3 - 59.7, n=12, last 2 years) | |
| low | med. | high | ultra | QHD DLSS | QHD | |
|---|---|---|---|---|---|---|
| GTA V (2015) | 185.4 | 170.6 | 139.5 | 137.4 | ||
| Dota 2 Reborn (2015) | 211 | 186.4 | 175.1 | 162.3 | ||
| Final Fantasy XV Benchmark (2018) | 218 | 189.9 | 152.1 | |||
| X-Plane 11.11 (2018) | 143 | 132.2 | 108.9 | |||
| Strange Brigade (2018) | 434 | 403 | 371 | 281 | ||
| Baldur's Gate 3 (2023) | 202 | 181.6 | 179.6 | 130.5 | ||
| Cyberpunk 2077 (2023) | 157.8 | 148.1 | 139.8 | 96.4 | ||
| Counter-Strike 2 (2023) | 345 | 290 | 255 | 205 | ||
| Prince of Persia The Lost Crown (2024) | 356 | 356 | 356 | 356 | ||
| Helldivers 2 (2024) | 135.9 | 134.5 | 131.9 | 127.8 | ||
| Dragon's Dogma 2 (2024) | 84.8 | 82.3 | ||||
| Horizon Forbidden West (2024) | 148.2 | 117.7 | 115.5 | 110.6 | 90.7 | |
| Ghost of Tsushima (2024) | 110.7 | 105.7 | 97.5 | 96.1 | 76.7 | |
| Senua's Saga Hellblade 2 (2024) | 99.3 | 76 | 81 | 55.1 | ||
| Star Wars Outlaws (2024) | 79.8 | 72.7 | 67.8 | 64.8 | 51.4 | |
| Space Marine 2 (2024) | 90 | 89.7 | 88.7 | 86.9 | 86.2 | |
| Until Dawn (2024) | 92.9 | 91 | 81.6 | 74.4 | 59 | |
| Stalker 2 (2024) | 90.7 | 78.1 | 72.6 | 122.1 | 58.5 | |
| Kingdom Come Deliverance 2 (2025) | 173.8 | 145.6 | 101.6 | 98.9 | 74.5 | |
| Civilization 7 (2025) | 173.4 | 165.5 | 158 | |||
| The Elder Scrolls IV Oblivion Remastered (2025) | 106.3 | 94.1 | 50.6 | 53.2 | 36.6 | |
| Doom: The Dark Ages (2025) | 113 | 104 | 101 | 97 | 72 |
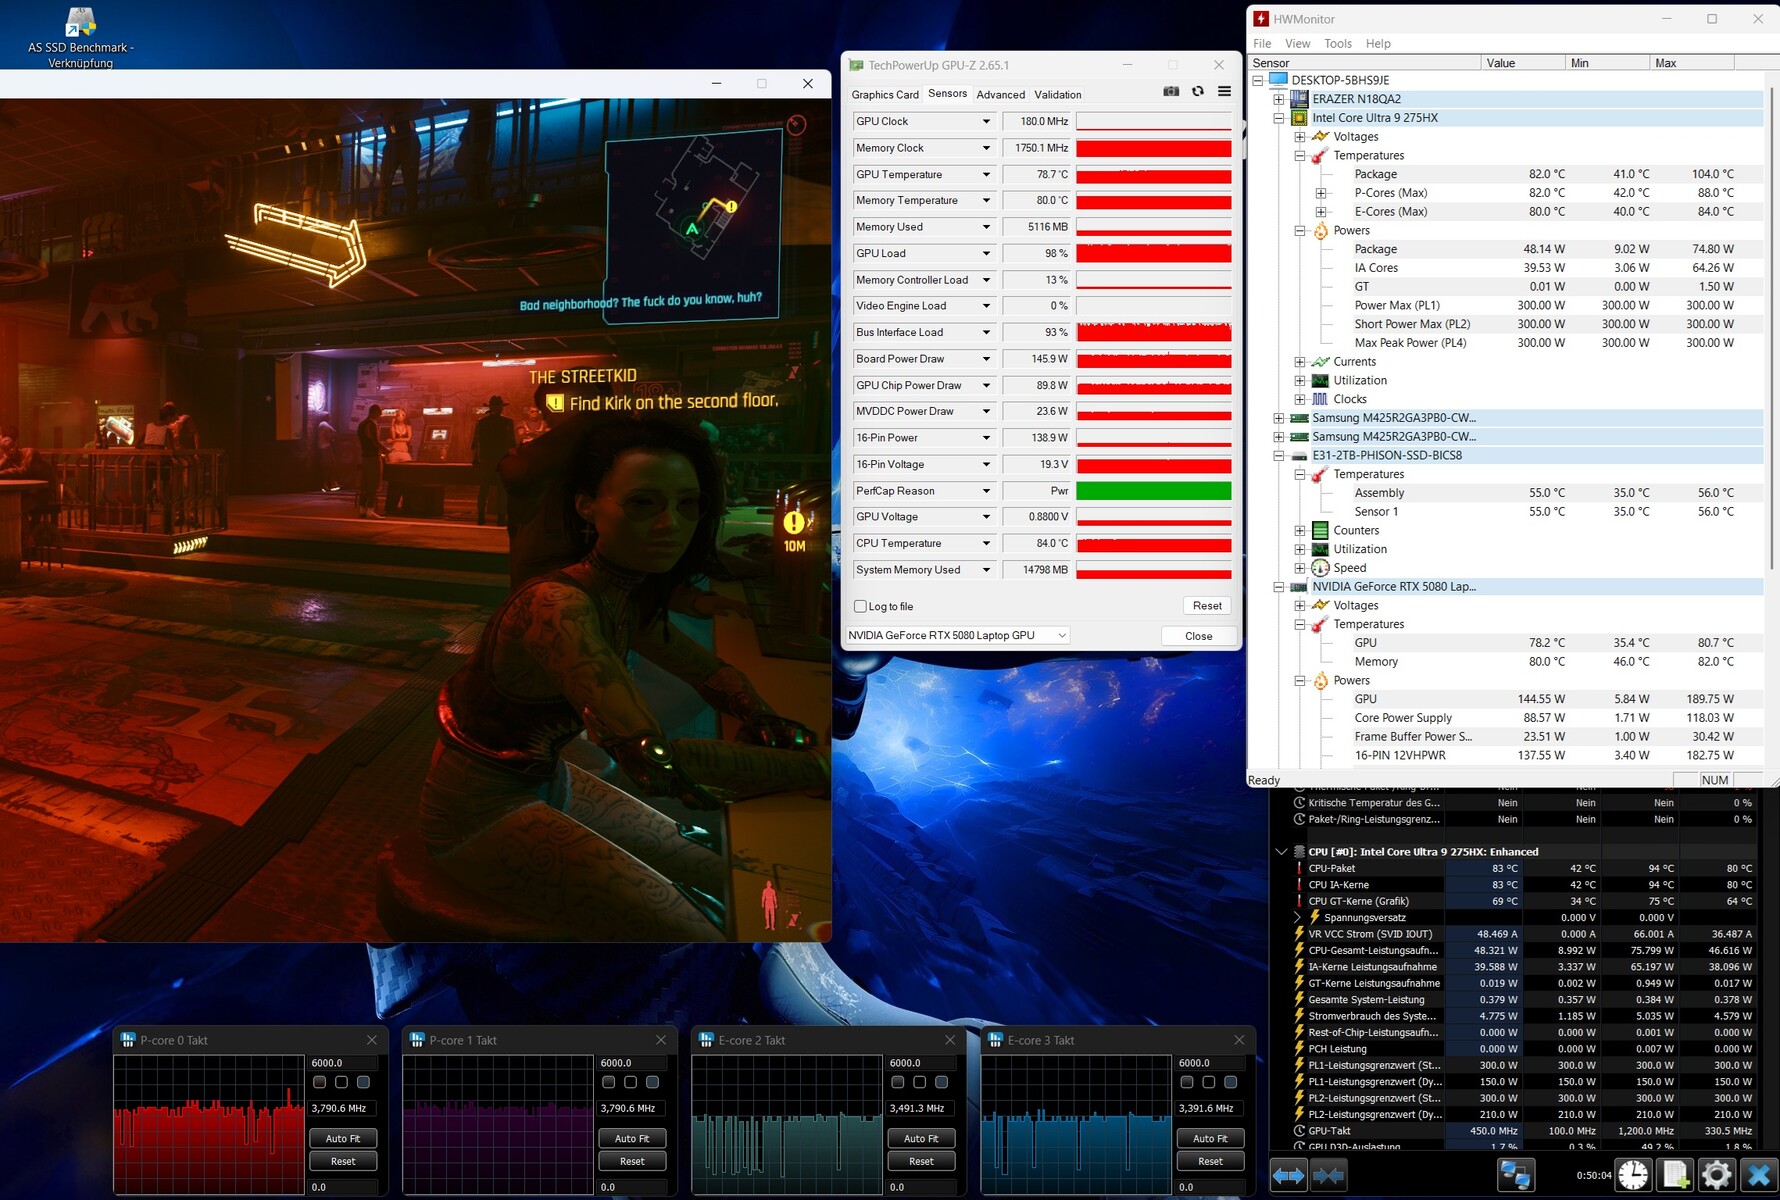
我们用《赛博朋克 2077》测试了 3D 性能在较长时间内的表现。 赛博朋克 2077进行了测试。在测试过程中,偶尔会出现短暂的 FPS 下降,但都很细微,并不严重。
Cyberpunk 2077 Ultra FPS chart
排放量
噪音排放
Beast 18 X1 最大的诟病之一是风扇控制不严。即使使用平衡模式,散热系统在空闲模式下有时也会达到令人不悦的 40 分贝(A),甚至更高,从长远来看会让许多用户感到厌烦。在负载情况下,平衡模式下的噪音值已经达到了某些竞争对手只有在性能模式下才能达到的水平(例如 Strix Scar 18)。
Noise level
| Idle |
| 25 / 39 / 42 dB(A) |
| Load |
| 52 / 55 dB(A) |
 | ||
30 dB silent 40 dB(A) audible 50 dB(A) loud |
||
min: | ||
| Medion Erazer Beast 18 X1 MD62731 Ultra 9 275HX, GeForce RTX 5080 Laptop | MSI GE78HX 13VH-070US i9-13950HX, GeForce RTX 4080 Laptop GPU | Acer Predator Helios 18 N23Q2 i9-13900HX, GeForce RTX 4080 Laptop GPU | Asus Strix Scar 18 G835LX Ultra 9 275HX, GeForce RTX 5090 Laptop | Aorus Master 18 AM8H Ultra 9 275HX, GeForce RTX 5090 Laptop | Lenovo Legion Pro 7i 16 Gen 10 Ultra 9 275HX, GeForce RTX 5080 Laptop | |
|---|---|---|---|---|---|---|
| Noise | 13% | 18% | 8% | 7% | 20% | |
| off / environment * (dB) | 25 | 23.4 6% | 23 8% | 23.3 7% | 25 -0% | 22.9 8% |
| Idle Minimum * (dB) | 25 | 24.2 3% | 23 8% | 29.8 -19% | 26 -4% | 22.9 8% |
| Idle Average * (dB) | 39 | 25.6 34% | 23 41% | 29.8 24% | 29 26% | 22.9 41% |
| Idle Maximum * (dB) | 42 | 31 26% | 23 45% | 29.8 29% | 34 19% | 26.3 37% |
| Load Average * (dB) | 52 | 43.3 17% | 45.26 13% | 42.9 17% | 50 4% | 27.8 47% |
| Cyberpunk 2077 ultra * (dB) | 53 | 53.7 -1% | 52 2% | 54.2 -2% | ||
| Load Maximum * (dB) | 55 | 59.1 -7% | 59.94 -9% | 53.7 2% | 53 4% | 53.9 2% |
| Witcher 3 ultra * (dB) | 56.3 | 59.82 |
* ... smaller is better
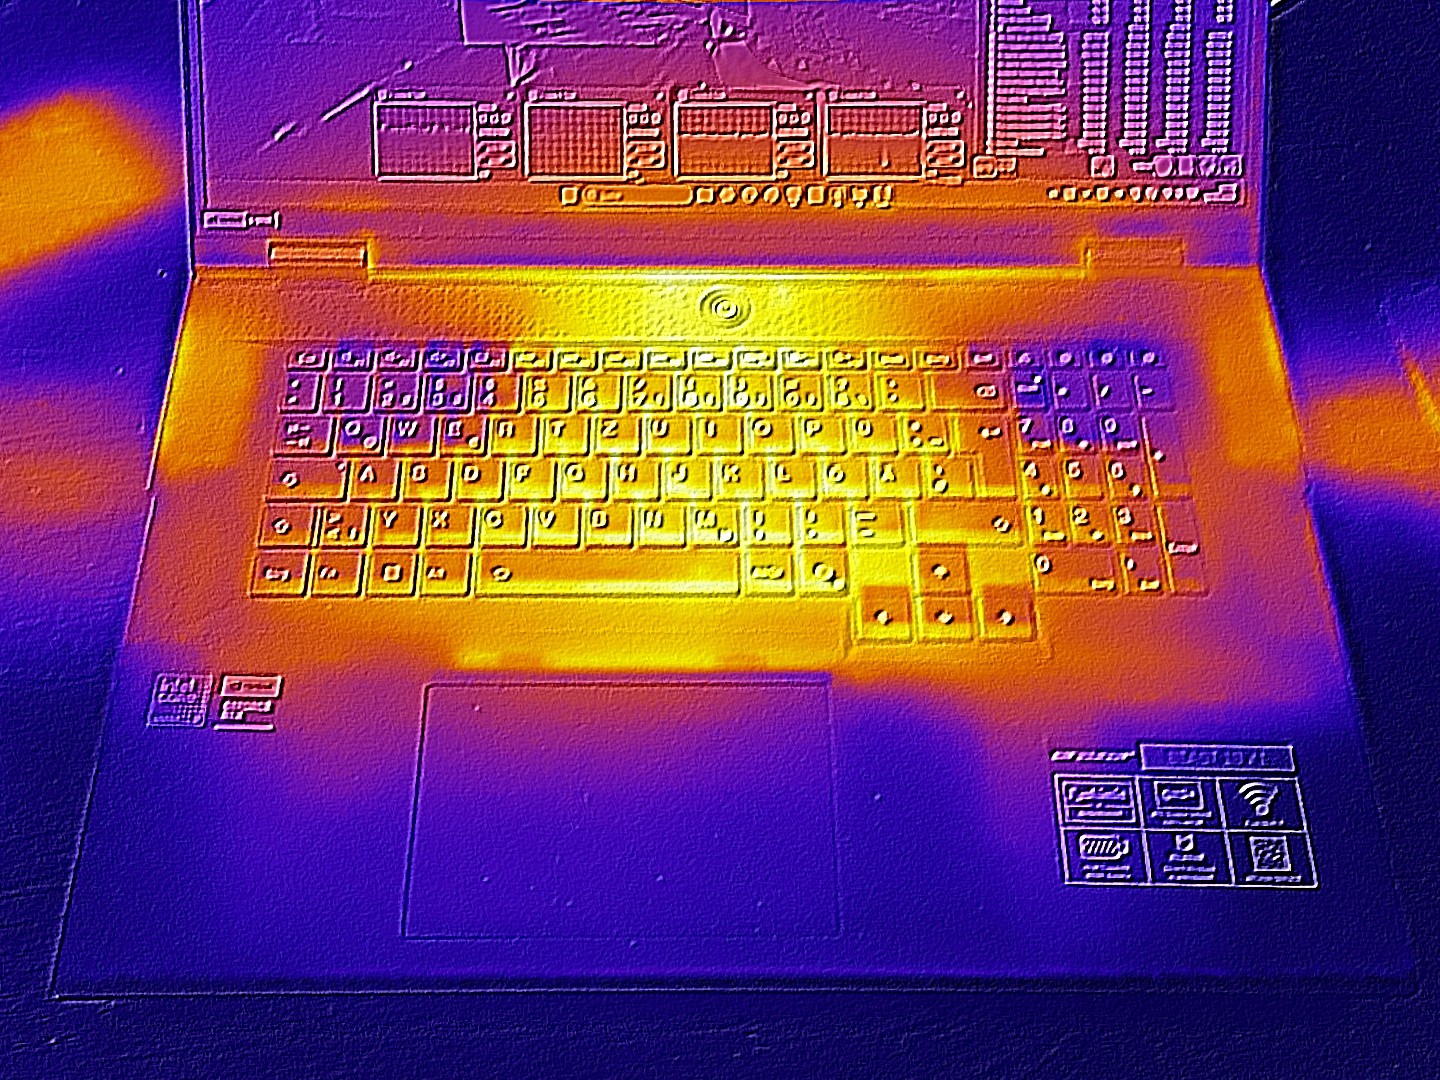
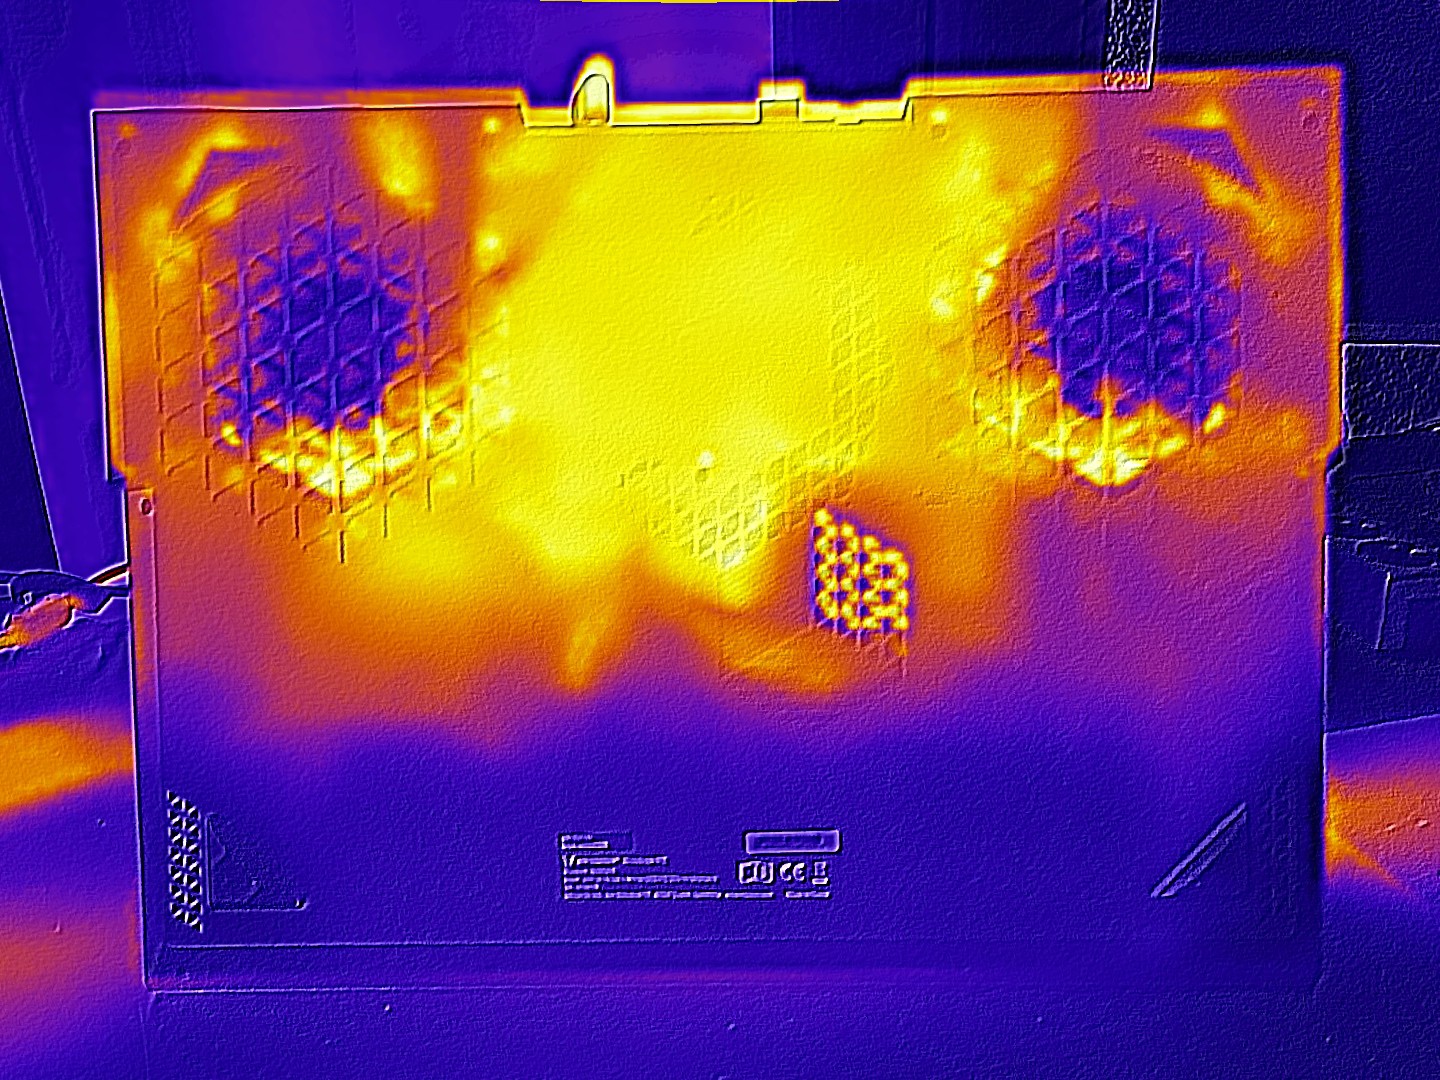
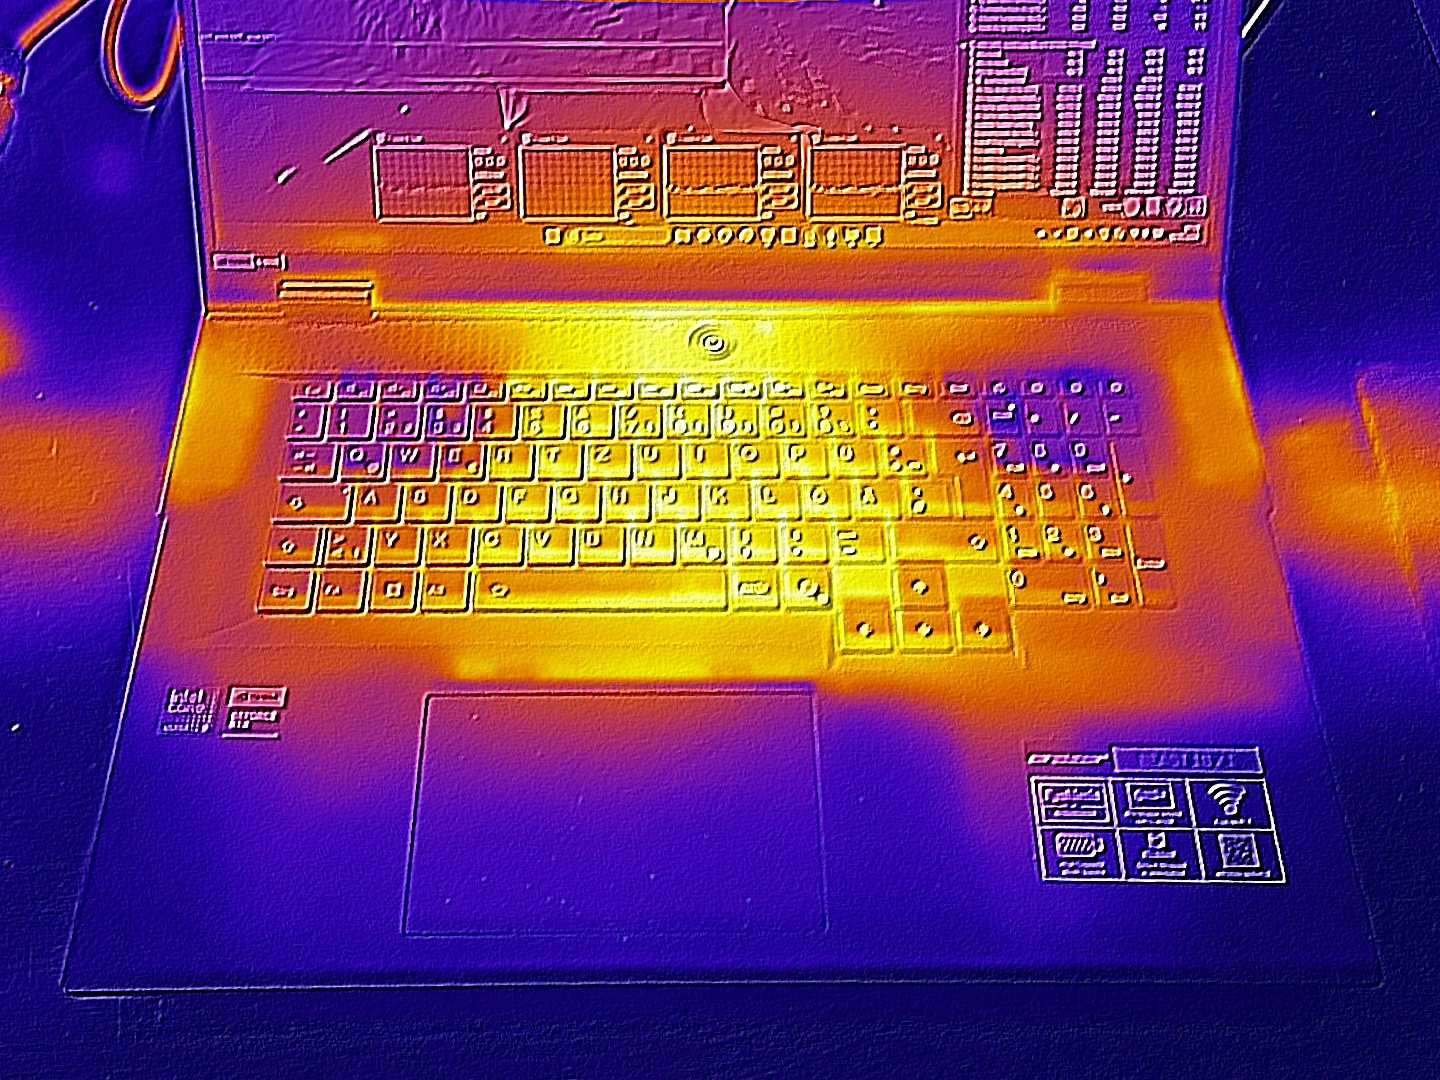
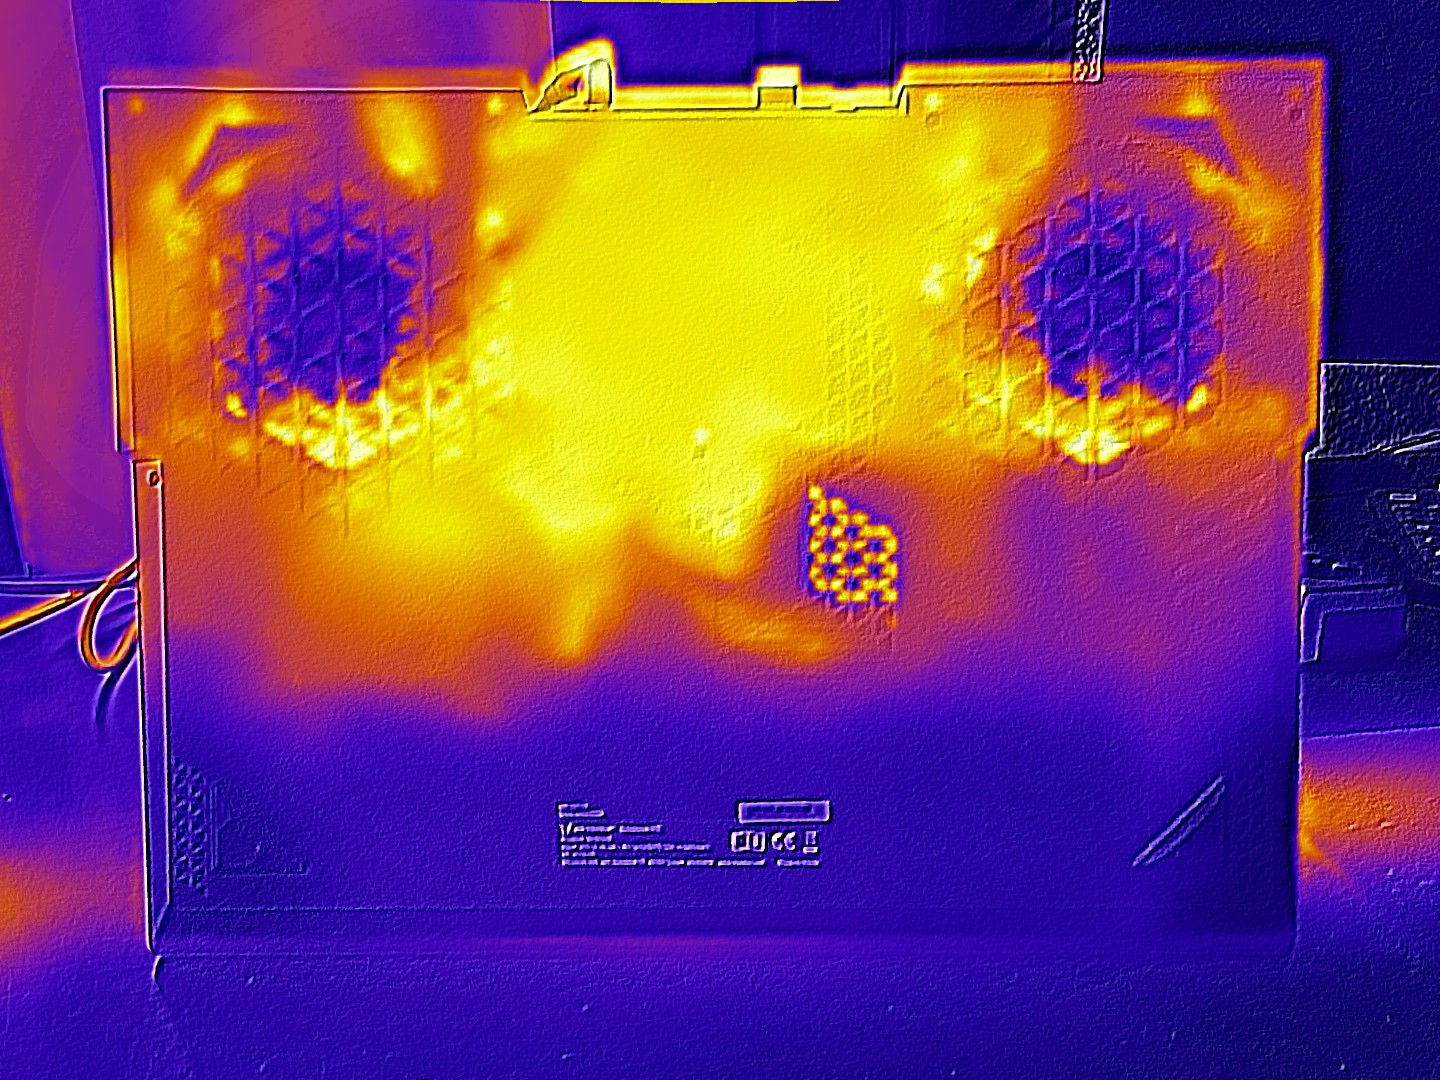
温度
机箱温度不太令人担忧。对于高端笔记本电脑来说,机箱顶部和底部的最高温度分别为 47 °C和 48 °C。在空闲模式下,表面温度大多低于 30 °C,保持凉爽宜人。
(-) The maximum temperature on the upper side is 47 °C / 117 F, compared to the average of 40.4 °C / 105 F, ranging from 21.2 to 68.8 °C for the class Gaming.
(-) The bottom heats up to a maximum of 48 °C / 118 F, compared to the average of 43.2 °C / 110 F
(+) In idle usage, the average temperature for the upper side is 27.9 °C / 82 F, compared to the device average of 33.9 °C / 93 F.
(-) 3: The average temperature for the upper side is 42 °C / 108 F, compared to the average of 33.9 °C / 93 F for the class Gaming.
(-) The palmrests and touchpad can get very hot to the touch with a maximum of 41 °C / 105.8 F.
(-) The average temperature of the palmrest area of similar devices was 28.8 °C / 83.8 F (-12.2 °C / -22 F).
| Medion Erazer Beast 18 X1 MD62731 Ultra 9 275HX, GeForce RTX 5080 Laptop | MSI GE78HX 13VH-070US i9-13950HX, GeForce RTX 4080 Laptop GPU | Acer Predator Helios 18 N23Q2 i9-13900HX, GeForce RTX 4080 Laptop GPU | Asus Strix Scar 18 G835LX Ultra 9 275HX, GeForce RTX 5090 Laptop | Aorus Master 18 AM8H Ultra 9 275HX, GeForce RTX 5090 Laptop | Lenovo Legion Pro 7i 16 Gen 10 Ultra 9 275HX, GeForce RTX 5080 Laptop | |
|---|---|---|---|---|---|---|
| Heat | 6% | -7% | 5% | -8% | 3% | |
| Maximum Upper Side * (°C) | 47 | 37.4 20% | 35 26% | 45.6 3% | 50 -6% | 42.6 9% |
| Maximum Bottom * (°C) | 48 | 45 6% | 56 -17% | 46 4% | 46 4% | 41.2 14% |
| Idle Upper Side * (°C) | 29 | 29.8 -3% | 34 -17% | 28.9 -0% | 36 -24% | 32.6 -12% |
| Idle Bottom * (°C) | 33 | 32.4 2% | 39 -18% | 29.2 12% | 35 -6% | 32.4 2% |
* ... smaller is better
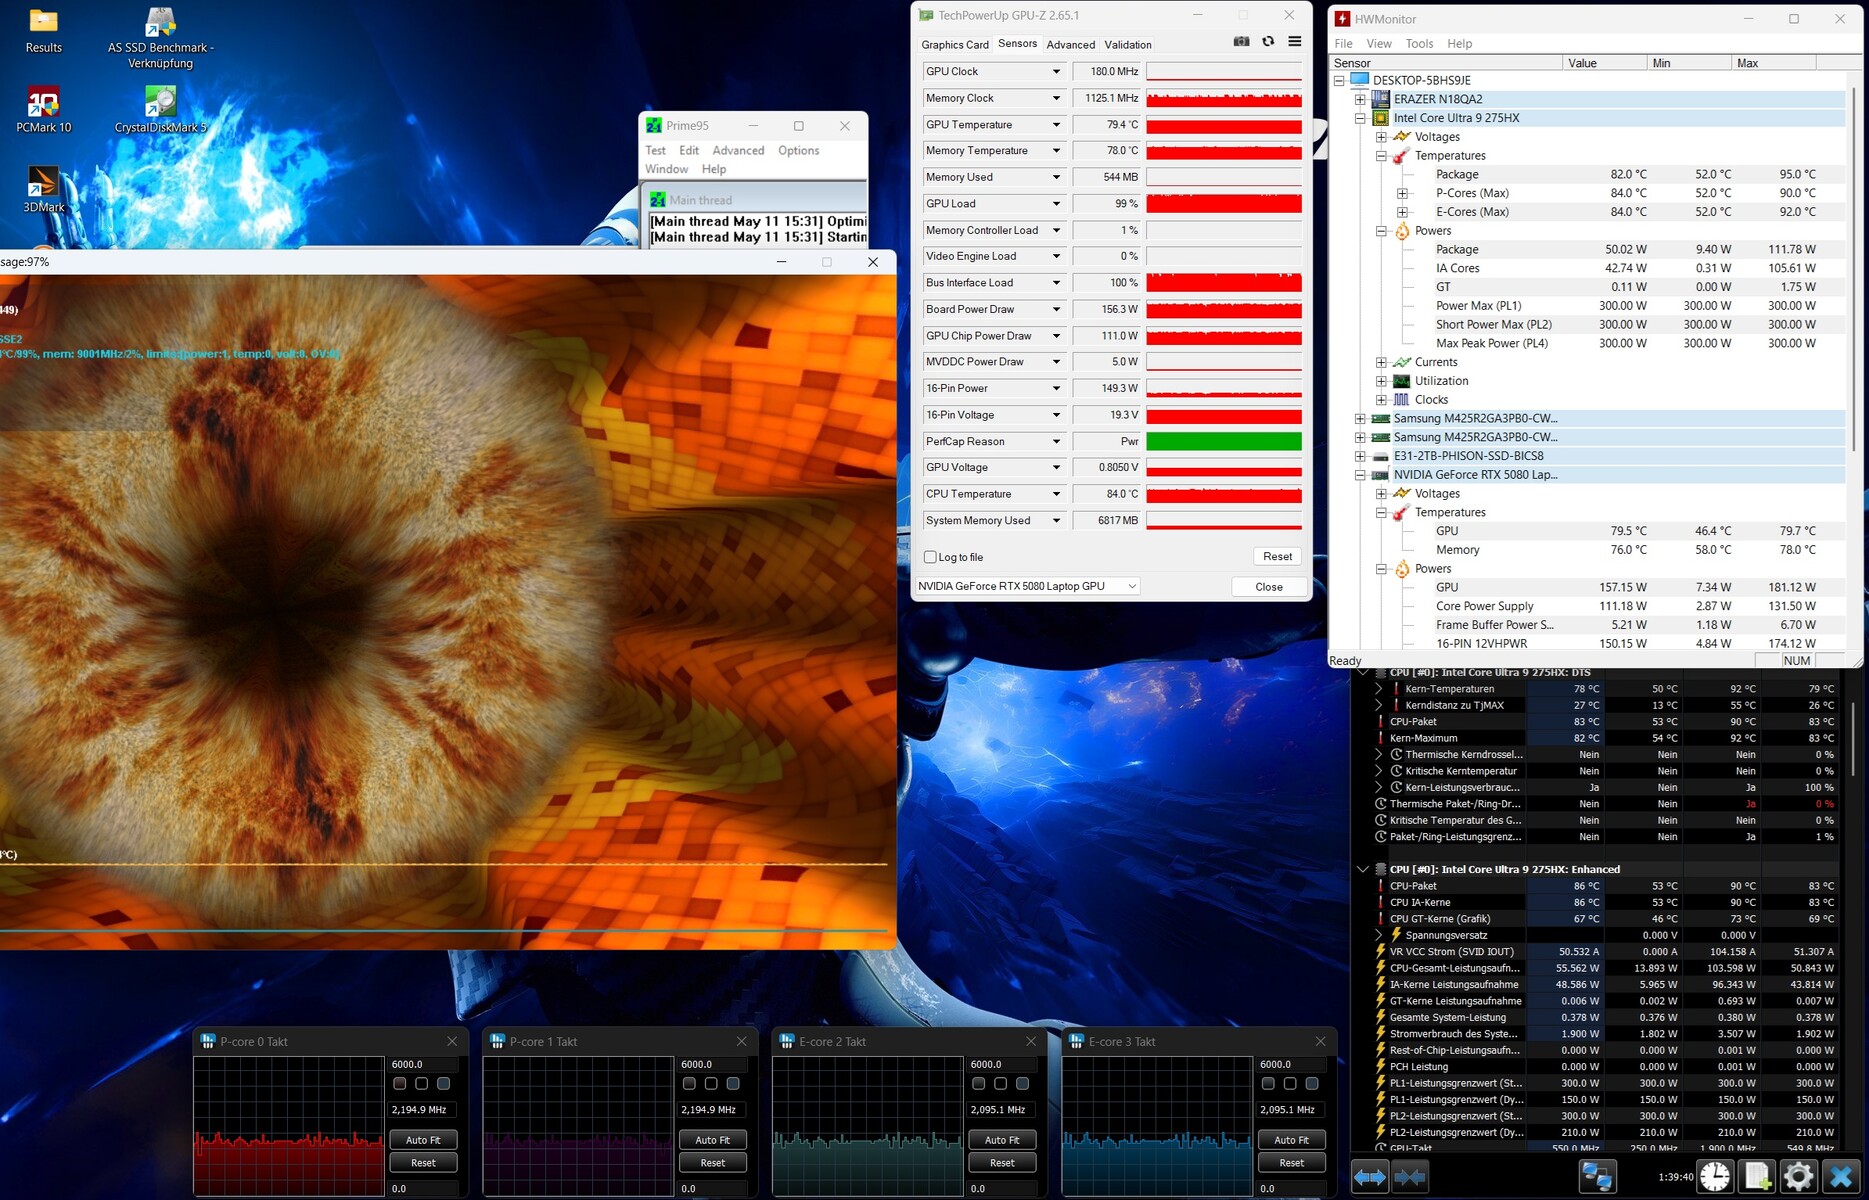
压力测试
我们使用 Furmark 和 Prime95 进行的压力测试并没有让部件出太多汗。CPU 和 GPU 的温度在 80 °C 左右是可以接受的。
发言人
该音响系统的最大音量为 89 dB(A),也能充斥较大的房间。根据音频分析,音质略低于 Aorus Master 18,但对于笔记本电脑来说,尽管低音通常较弱,音质仍然相对较好。
Medion Erazer Beast 18 X1 MD62731 audio analysis
(+) | speakers can play relatively loud (89 dB)
Bass 100 - 315 Hz
(-) | nearly no bass - on average 18.6% lower than median
(±) | linearity of bass is average (13% delta to prev. frequency)
Mids 400 - 2000 Hz
(+) | balanced mids - only 2.8% away from median
(+) | mids are linear (4.5% delta to prev. frequency)
Highs 2 - 16 kHz
(±) | higher highs - on average 5.3% higher than median
(+) | highs are linear (6.4% delta to prev. frequency)
Overall 100 - 16.000 Hz
(+) | overall sound is linear (14.2% difference to median)
Compared to same class
» 25% of all tested devices in this class were better, 7% similar, 68% worse
» The best had a delta of 6%, average was 18%, worst was 132%
Compared to all devices tested
» 17% of all tested devices were better, 4% similar, 79% worse
» The best had a delta of 4%, average was 24%, worst was 134%
Aorus Master 18 AM8H audio analysis
(±) | speaker loudness is average but good (77 dB)
Bass 100 - 315 Hz
(±) | reduced bass - on average 8.7% lower than median
(±) | linearity of bass is average (10.3% delta to prev. frequency)
Mids 400 - 2000 Hz
(+) | balanced mids - only 3% away from median
(+) | mids are linear (4.3% delta to prev. frequency)
Highs 2 - 16 kHz
(+) | balanced highs - only 2.8% away from median
(+) | highs are linear (5.4% delta to prev. frequency)
Overall 100 - 16.000 Hz
(+) | overall sound is linear (11.9% difference to median)
Compared to same class
» 12% of all tested devices in this class were better, 4% similar, 84% worse
» The best had a delta of 6%, average was 18%, worst was 132%
Compared to all devices tested
» 9% of all tested devices were better, 2% similar, 89% worse
» The best had a delta of 4%, average was 24%, worst was 134%
能源管理
耗电量
空闲时,功耗与噪音水平波动相似。理想情况下,功耗仅为 7.9 至 16.6 瓦,优于所有同类设备(连接外部显示器时,dGPU 会自动激活)。在 3D 模式下,功耗高达 330 瓦,而所提供的电源装置也规定为 330 瓦。
| Off / Standby | |
| Idle | |
| Load |
|
Key:
min: | |
| Medion Erazer Beast 18 X1 MD62731 Ultra 9 275HX, GeForce RTX 5080 Laptop | MSI GE78HX 13VH-070US i9-13950HX, GeForce RTX 4080 Laptop GPU | Acer Predator Helios 18 N23Q2 i9-13900HX, GeForce RTX 4080 Laptop GPU | Asus Strix Scar 18 G835LX Ultra 9 275HX, GeForce RTX 5090 Laptop | Aorus Master 18 AM8H Ultra 9 275HX, GeForce RTX 5090 Laptop | Lenovo Legion Pro 7i 16 Gen 10 Ultra 9 275HX, GeForce RTX 5080 Laptop | Average of class Gaming | |
|---|---|---|---|---|---|---|---|
| Power Consumption | -60% | -38% | -75% | -97% | -107% | -27% | |
| Idle Minimum * (Watt) | 7.9 | 16.1 -104% | 16 -103% | 11.4 -44% | 29 -267% | 28.5 -261% | 13.1 ? -66% |
| Idle Average * (Watt) | 11.5 | 24 -109% | 19 -65% | 39.2 -241% | 33 -187% | 38.8 -237% | 18.8 ? -63% |
| Idle Maximum * (Watt) | 16.6 | 34 -105% | 21.3 -28% | 40.2 -142% | 48 -189% | 45.6 -175% | 24.4 ? -47% |
| Load Average * (Watt) | 130 | 123.6 5% | 124 5% | 161.2 -24% | 141 -8% | 132.2 -2% | 108.5 ? 17% |
| Cyberpunk 2077 ultra * (Watt) | 253 | 303 -20% | 283 -12% | 318 -26% | |||
| Cyberpunk 2077 ultra external monitor * (Watt) | 245 | 295 -20% | 283 -16% | 319 -30% | |||
| Load Maximum * (Watt) | 330 | 285.7 13% | 319 3% | 430.9 -31% | 340 -3% | 384 -16% | 254 ? 23% |
| Witcher 3 ultra * (Watt) | 286 | 289 |
* ... smaller is better
Power consumption Cyberpunk / Stress test
Power consumption with external monitor
电池寿命
由于在闲置模式下功耗适中,Erazer Beast 18 X1 是测试设备中电池续航时间最长的。在亮度设置为 150 cd/m² 的情况下,上网浏览时间约为 8 小时。
| Medion Erazer Beast 18 X1 MD62731 Ultra 9 275HX, GeForce RTX 5080 Laptop, 99 Wh | MSI GE78HX 13VH-070US i9-13950HX, GeForce RTX 4080 Laptop GPU, 99 Wh | Acer Predator Helios 18 N23Q2 i9-13900HX, GeForce RTX 4080 Laptop GPU, 90 Wh | Asus Strix Scar 18 G835LX Ultra 9 275HX, GeForce RTX 5090 Laptop, 90 Wh | Aorus Master 18 AM8H Ultra 9 275HX, GeForce RTX 5090 Laptop, 99 Wh | Lenovo Legion Pro 7i 16 Gen 10 Ultra 9 275HX, GeForce RTX 5080 Laptop, 99 Wh | Average of class Gaming | |
|---|---|---|---|---|---|---|---|
| Battery runtime | -23% | -44% | -30% | -38% | -32% | -12% | |
| WiFi v1.3 (h) | 7.9 | 6.1 -23% | 4.4 -44% | 5.5 -30% | 4.9 -38% | 5.4 -32% | 6.98 ? -12% |
| Reader / Idle (h) | 7.3 | 5.8 | 8.71 ? | ||||
| Load (h) | 1.5 | 1.7 | 1.2 | 1.9 | 0.8 | 1.47 ? | |
| H.264 (h) | 4.8 | 5.8 | 8.26 ? | ||||
| Cyberpunk 2077 ultra 150cd (h) | 0.7 |
Notebookcheck 总体评分
Medion Erazer Beast 18 X1 以其可观的电池续航时间在 18 英寸竞争产品中脱颖而出,但在负载情况下(相同性能模式下)往往比同类产品声音更大。
Medion Erazer Beast 18 X1 MD62731
- 05/21/2025 v8
Florian Glaser
 Total Sustainability Score:
 可能的替代品比较
Transparency
The selection of devices to be reviewed is made by our editorial team. The test sample was provided to the author as a loan by the manufacturer or retailer for the purpose of this review. The lender had no influence on this review, nor did the manufacturer receive a copy of this review before publication. There was no obligation to publish this review. As an independent media company, Notebookcheck is not subjected to the authority of manufacturers, retailers or publishers.
This is how Notebookcheck is testing
Every year, Notebookcheck independently reviews hundreds of laptops and smartphones using standardized procedures to ensure that all results are comparable. We have continuously developed our test methods for around 20 years and set industry standards in the process. In our test labs, high-quality measuring equipment is utilized by experienced technicians and editors. These tests involve a multi-stage validation process. Our complex rating system is based on hundreds of well-founded measurements and benchmarks, which maintains objectivity. Further information on our test methods can be found here.
