Alienware外星人m17 R2笔记本电脑评测:让i9显得值得
Rating | Date | Model | Weight | Height | Size | Resolution | Price |
|---|---|---|---|---|---|---|---|
| 84.2 % v7 (old) | 04 / 2020 | Alienware m17 R2 P41E i9-9980HK, GeForce RTX 2080 Max-Q | 2.6 kg | 20.5 mm | 17.30" | 1920x1080 | |
| 82.9 % v7 (old) | 07 / 2019 | MSI GS75 Stealth 9SG i7-9750H, GeForce RTX 2080 Max-Q | 2.3 kg | 18.9 mm | 17.30" | 1920x1080 | |
| 87.7 % v7 (old) | 08 / 2019 | Razer Blade Pro 17 RTX 2080 Max-Q i7-9750H, GeForce RTX 2080 Max-Q | 2.8 kg | 19.9 mm | 17.30" | 1920x1080 | |
| 86.1 % v7 (old) | 11 / 2019 | Gigabyte Aero 17 XA RP77 i9-9980HK, GeForce RTX 2070 Max-Q | 2.5 kg | 21.4 mm | 17.30" | 3840x2160 | |
| 85.6 % v6 (old) | 04 / 2019 | Asus ROG Strix Scar II GL704GW i7-8750H, GeForce RTX 2070 Mobile | 2.9 kg | 26.4 mm | 17.30" | 1920x1080 |
| Networking | |
| iperf3 transmit AX12 | |
| Acer Aspire 5 A514-52 | |
| Alienware m17 R2 P41E | |
| iperf3 receive AX12 | |
| Acer Aspire 5 A514-52 | |
| Alienware m17 R2 P41E | |

| |||||||||||||||||||||||||
Brightness Distribution: 90 %
Contrast: 1325:1 (Black: 0.29 cd/m²)
ΔE ColorChecker Calman: 1.35 | ∀{0.5-29.43 Ø4.72}
calibrated: 1.42
ΔE Greyscale Calman: 1.2 | ∀{0.09-98 Ø4.97}
98.5% sRGB (Argyll 1.6.3 3D)
65.5% AdobeRGB 1998 (Argyll 1.6.3 3D)
72.2% AdobeRGB 1998 (Argyll 3D)
98.5% sRGB (Argyll 3D)
70.8% Display P3 (Argyll 3D)
Gamma: 2.23
CCT: 6580 K
| Alienware m17 R2 P41E Chi Mei 173HCE, CMN175F, IPS, 17.3", 1920x1080 | Alienware m17 P37E AU Optronics B173ZAN01.0, IPS, 17.3", 3840x2160 | MSI GS75 Stealth 9SG Chi Mei N173HCE-G33 (CMN175C), IPS, 17.3", 1920x1080 | Razer Blade Pro 17 RTX 2080 Max-Q AU Optronics B173HAN04.0, IPS, 17.3", 1920x1080 | Gigabyte Aero 17 XA RP77 AU Optronics B173ZAN03.2, IPS, 17.3", 3840x2160 | Asus ROG Strix Scar II GL704GW B173HAN04.0 (AUO409D), AHVA, 17.3", 1920x1080 | |
|---|---|---|---|---|---|---|
| Display | 20% | -9% | -13% | 21% | -12% | |
| Display P3 Coverage (%) | 70.8 | 86.4 22% | 62.6 -12% | 60.6 -14% | 86.8 23% | 62.9 -11% |
| sRGB Coverage (%) | 98.5 | 99.9 1% | 93.5 -5% | 89 -10% | 100 2% | 87.1 -12% |
| AdobeRGB 1998 Coverage (%) | 72.2 | 99.1 37% | 64.7 -10% | 62.1 -14% | 99.5 38% | 63.7 -12% |
| Response Times | -133% | 33% | 36% | -173% | -3% | |
| Response Time Grey 50% / Grey 80% * (ms) | 17.2 ? | 35.6 ? -107% | 7.2 ? 58% | 6.8 ? 60% | 45.6 ? -165% | 17.6 ? -2% |
| Response Time Black / White * (ms) | 10.8 ? | 28 ? -159% | 10 ? 7% | 9.6 ? 11% | 30.4 ? -181% | 11.2 ? -4% |
| PWM Frequency (Hz) | 26320 ? | 25510 ? | ||||
| Screen | -110% | -4% | -46% | -24% | -40% | |
| Brightness middle (cd/m²) | 384.2 | 357.9 -7% | 366 -5% | 299.3 -22% | 667.3 74% | 295 -23% |
| Brightness (cd/m²) | 357 | 347 -3% | 343 -4% | 294 -18% | 633 77% | 291 -18% |
| Brightness Distribution (%) | 90 | 94 4% | 91 1% | 94 4% | 90 0% | 96 7% |
| Black Level * (cd/m²) | 0.29 | 0.33 -14% | 0.29 -0% | 0.29 -0% | 0.46 -59% | 0.24 17% |
| Contrast (:1) | 1325 | 1085 -18% | 1262 -5% | 1032 -22% | 1451 10% | 1229 -7% |
| Colorchecker dE 2000 * | 1.35 | 6.57 -387% | 1.51 -12% | 2.55 -89% | 3.53 -161% | 3.2 -137% |
| Colorchecker dE 2000 max. * | 3.45 | 9.86 -186% | 3.22 7% | 4.73 -37% | 6.88 -99% | 6.64 -92% |
| Colorchecker dE 2000 calibrated * | 1.42 | 6.74 -375% | 0.71 50% | 2.9 -104% | 3.79 -167% | 2.52 -77% |
| Greyscale dE 2000 * | 1.2 | 4.3 -258% | 1.93 -61% | 3.5 -192% | 0.9 25% | 2.16 -80% |
| Gamma | 2.23 99% | 2.6 85% | 2.38 92% | 2.28 96% | 2.17 101% | 2.46 89% |
| CCT | 6580 99% | 6403 102% | 6881 94% | 7101 92% | 6533 99% | 6872 95% |
| Color Space (Percent of AdobeRGB 1998) (%) | 65.5 | 88.4 35% | 60 -8% | 57 -13% | 87.1 33% | 57 -13% |
| Color Space (Percent of sRGB) (%) | 98.5 | 100 2% | 94 -5% | 88.7 -10% | 100 2% | 87 -12% |
| Total Average (Program / Settings) | -74% /
-88% | 7% /
-0% | -8% /
-29% | -59% /
-34% | -18% /
-30% |
* ... smaller is better
Display Response Times
| ↔ Response Time Black to White | ||
|---|---|---|
| 10.8 ms ... rise ↗ and fall ↘ combined | ↗ 6 ms rise | 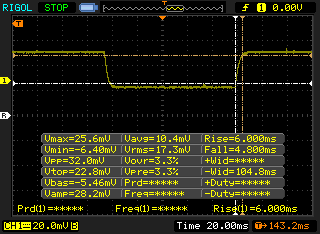 |
| ↘ 4.8 ms fall | ||
| The screen shows good response rates in our tests, but may be too slow for competitive gamers. In comparison, all tested devices range from 0.1 (minimum) to 240 (maximum) ms. » 29 % of all devices are better. This means that the measured response time is better than the average of all tested devices (19.8 ms). | ||
| ↔ Response Time 50% Grey to 80% Grey | ||
| 17.2 ms ... rise ↗ and fall ↘ combined | ↗ 8.8 ms rise | 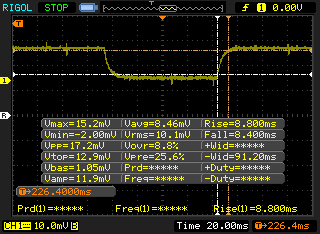 |
| ↘ 8.4 ms fall | ||
| The screen shows good response rates in our tests, but may be too slow for competitive gamers. In comparison, all tested devices range from 0.165 (minimum) to 636 (maximum) ms. » 31 % of all devices are better. This means that the measured response time is better than the average of all tested devices (31 ms). | ||
Screen Flickering / PWM (Pulse-Width Modulation)
| Screen flickering / PWM detected | 26320 Hz | ≤ 25 % brightness setting | 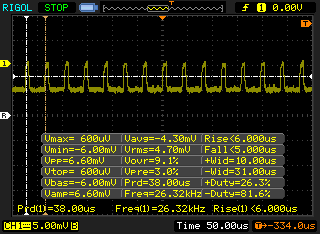 |
The display backlight flickers at 26320 Hz (worst case, e.g., utilizing PWM) Flickering detected at a brightness setting of 25 % and below. There should be no flickering or PWM above this brightness setting. The frequency of 26320 Hz is quite high, so most users sensitive to PWM should not notice any flickering. In comparison: 52 % of all tested devices do not use PWM to dim the display. If PWM was detected, an average of 7763 (minimum: 5 - maximum: 343500) Hz was measured. | |||
| Cinebench R20 | |
| CPU (Multi Core) | |
| Eurocom Sky X4C i9-9900KS | |
| Alienware m17 R2 P41E | |
| Average Intel Core i9-9980HK (2974 - 4150, n=10) | |
| MSI GE65 Raider 9SF-049US | |
| Apple MacBook Pro 15 2019 i9 Vega 20 | |
| Medion Erazer X15805 | |
| Alienware m15 R2 P87F | |
| MSI GE63 Raider 8SG | |
| MSI GF63 Thin 9SC | |
| MSI Alpha 15 A3DDK-034 | |
| Razer Blade Stealth i7-1065G7 Iris Plus | |
| CPU (Single Core) | |
| Eurocom Sky X4C i9-9900KS | |
| Medion Erazer X15805 | |
| Apple MacBook Pro 15 2019 i9 Vega 20 | |
| Alienware m17 R2 P41E | |
| MSI GE65 Raider 9SF-049US | |
| Average Intel Core i9-9980HK (431 - 505, n=10) | |
| Alienware m15 R2 P87F | |
| MSI GF63 Thin 9SC | |
| MSI GE63 Raider 8SG | |
| Razer Blade Stealth i7-1065G7 Iris Plus | |
| MSI Alpha 15 A3DDK-034 | |
| Cinebench R15 | |
| CPU Single 64Bit | |
| Eurocom Sky X4C i9-9900KS | |
| Medion Erazer X15805 | |
| Average Intel Core i9-9980HK (181 - 215, n=13) | |
| MSI GE65 Raider 9SF-049US | |
| Alienware m17 R2 P41E | |
| Apple MacBook Pro 15 2019 i9 Vega 20 | |
| Alienware m15 R2 P87F | |
| MSI GF63 Thin 9SC | |
| MSI GE63 Raider 8SG | |
| Razer Blade Stealth i7-1065G7 Iris Plus | |
| MSI Alpha 15 A3DDK-034 | |
| CPU Multi 64Bit | |
| Eurocom Sky X4C i9-9900KS | |
| Alienware m17 R2 P41E | |
| Average Intel Core i9-9980HK (1327 - 1930, n=14) | |
| MSI GE65 Raider 9SF-049US | |
| Apple MacBook Pro 15 2019 i9 Vega 20 | |
| Medion Erazer X15805 | |
| Alienware m15 R2 P87F | |
| MSI GE63 Raider 8SG | |
| MSI GF63 Thin 9SC | |
| MSI Alpha 15 A3DDK-034 | |
| Razer Blade Stealth i7-1065G7 Iris Plus | |
| Cinebench R11.5 | |
| CPU Single 64Bit | |
| Eurocom Sky X4C i9-9900KS | |
| Average Intel Core i9-9980HK (2.25 - 2.4, n=3) | |
| CPU Multi 64Bit | |
| Eurocom Sky X4C i9-9900KS | |
| Average Intel Core i9-9980HK (14.8 - 18, n=3) | |
| Cinebench R10 | |
| Rendering Multiple CPUs 32Bit | |
| Eurocom Sky X4C i9-9900KS | |
| Average Intel Core i9-9980HK (39440 - 50439, n=4) | |
| Medion Erazer X15805 | |
| MSI Alpha 15 A3DDK-034 | |
| Rendering Single 32Bit | |
| Average Intel Core i9-9980HK (7709 - 9734, n=4) | |
| Eurocom Sky X4C i9-9900KS | |
| Medion Erazer X15805 | |
| MSI Alpha 15 A3DDK-034 | |
| wPrime 2.10 - 1024m | |
| Average Intel Core i9-9980HK (110.4 - 120.2, n=2) | |
| Eurocom Sky X4C i9-9900KS | |
* ... smaller is better
| PCMark 8 Home Score Accelerated v2 | 4384 points | |
| PCMark 8 Work Score Accelerated v2 | 5818 points | |
| PCMark 10 Score | 5502 points | |
Help | ||
| Alienware m17 R2 P41E 2x SK Hynix PC601 NVMe 512 GB (RAID 0) | Alienware m17 P37E SK Hynix PC401 512GB M.2 (HFS512GD9TNG) | MSI GS75 Stealth 9SG 2x Samsung SSD PM981 MZVLB1T0HALR (RAID 0) | Gigabyte Aero 17 XA RP77 Intel SSD 760p SSDPEKKW512G8 | Asus ROG Strix Scar II GL704GW Intel SSD 660p SSDPEKNW512G8 | Lenovo ThinkBook 15 Samsung SSD PM981 MZVLB512HAJQ | |
|---|---|---|---|---|---|---|
| AS SSD | -23% | 13% | -34% | -26% | 28% | |
| Seq Read (MB/s) | 1938 | 1835 -5% | 2855 47% | 1812 -7% | 1315 -32% | 2564 32% |
| Seq Write (MB/s) | 2094 | 1121 -46% | 2687 28% | 1512 -28% | 927 -56% | 2268 8% |
| 4K Read (MB/s) | 25.88 | 23.98 -7% | 30.31 17% | 32.68 26% | 52.4 102% | 57 120% |
| 4K Write (MB/s) | 100.8 | 100 -1% | 96.3 -4% | 107.7 7% | 122.8 22% | 141.4 40% |
| 4K-64 Read (MB/s) | 1217 | 687 -44% | 1460 20% | 504 -59% | 326.5 -73% | 1175 -3% |
| 4K-64 Write (MB/s) | 1137 | 776 -32% | 1224 8% | 534 -53% | 727 -36% | 1665 46% |
| Access Time Read * (ms) | 0.051 | 0.047 8% | 0.054 -6% | 0.05 2% | 0.11 -116% | 0.032 37% |
| Access Time Write * (ms) | 0.107 | 0.053 50% | 0.038 64% | 0.227 -112% | 0.045 58% | 0.025 77% |
| Score Read (Points) | 1437 | 895 -38% | 1776 24% | 718 -50% | 510 -65% | 1488 4% |
| Score Write (Points) | 1447 | 988 -32% | 1589 10% | 793 -45% | 942 -35% | 2033 40% |
| Score Total (Points) | 3624 | 2306 -36% | 4259 18% | 1871 -48% | 1715 -53% | 4279 18% |
| Copy ISO MB/s (MB/s) | 1926 | 773 -60% | 2226 16% | 946 -51% | 2118 10% | |
| Copy Program MB/s (MB/s) | 626 | 493 -21% | 426.4 -32% | 414.3 -34% | 495.6 -21% | |
| Copy Game MB/s (MB/s) | 1533 | 647 -58% | 1152 -25% | 1263 -18% | 1174 -23% | |
| CrystalDiskMark 5.2 / 6 | -18% | 6% | 2% | -33% | 6% | |
| Write 4K (MB/s) | 110.6 | 120.2 9% | 95.5 -14% | 169.6 53% | 99.6 -10% | 176.3 59% |
| Read 4K (MB/s) | 41.46 | 44.3 7% | 42.59 3% | 58 40% | 48.99 18% | 48.98 18% |
| Write Seq (MB/s) | 2378 | 1278 -46% | 2851 20% | 1516 -36% | 972 -59% | 1789 -25% |
| Read Seq (MB/s) | 2114 | 1389 -34% | 2696 28% | 2362 12% | 1515 -28% | 1671 -21% |
| Write 4K Q32T1 (MB/s) | 445.4 | 436.2 -2% | 402.6 -10% | 481.8 8% | 280.6 -37% | 433.5 -3% |
| Read 4K Q32T1 (MB/s) | 509 | 515 1% | 443.9 -13% | 506 -1% | 327.8 -36% | 526 3% |
| Write Seq Q32T1 (MB/s) | 2735 | 1157 -58% | 3420 25% | 1530 -44% | 970 -65% | 2983 9% |
| Read Seq Q32T1 (MB/s) | 3206 | 2671 -17% | 3514 10% | 2645 -17% | 1757 -45% | 3555 11% |
| Write 4K Q8T8 (MB/s) | 1688 | |||||
| Read 4K Q8T8 (MB/s) | 1036 | |||||
| Total Average (Program / Settings) | -21% /
-21% | 10% /
11% | -16% /
-21% | -30% /
-29% | 17% /
20% |
* ... smaller is better

| 3DMark | |
| 1280x720 Cloud Gate Standard Graphics | |
| MSI RTX 2080 Ti Gaming X Trio | |
| MSI GE65 Raider 9SF-049US | |
| Alienware m17 R2 P41E | |
| Walmart EVOO Gaming 17 | |
| Alienware 17 R5 | |
| Average NVIDIA GeForce RTX 2080 Max-Q (38256 - 129506, n=17) | |
| Dell G5 15 5590-P8RVW | |
| Maingear Vector 15 | |
| HP Omen X 17-ap0xx | |
| MSI GE63 Raider 8SG | |
| MSI GT72S-6QEG16SR421BW | |
| 1920x1080 Fire Strike Graphics | |
| MSI RTX 2080 Ti Gaming X Trio | |
| MSI GE63 Raider 8SG | |
| Alienware m17 R2 P41E | |
| MSI GE65 Raider 9SF-049US | |
| Average NVIDIA GeForce RTX 2080 Max-Q (18048 - 23032, n=19) | |
| HP Omen X 17-ap0xx | |
| Walmart EVOO Gaming 17 | |
| Alienware 17 R5 | |
| Dell G5 15 5590-P8RVW | |
| Maingear Vector 15 | |
| MSI GT72S-6QEG16SR421BW | |
| 2560x1440 Time Spy Graphics | |
| MSI RTX 2080 Ti Gaming X Trio | |
| MSI GE63 Raider 8SG | |
| Alienware m17 R2 P41E | |
| MSI GE65 Raider 9SF-049US | |
| Average NVIDIA GeForce RTX 2080 Max-Q (6464 - 8844, n=19) | |
| Walmart EVOO Gaming 17 | |
| HP Omen X 17-ap0xx | |
| Dell G5 15 5590-P8RVW | |
| Alienware 17 R5 | |
| Maingear Vector 15 | |
| MSI GT72S-6QEG16SR421BW | |
| 3DMark 11 | |
| 1280x720 Performance GPU | |
| MSI RTX 2080 Ti Gaming X Trio | |
| MSI GE63 Raider 8SG | |
| Alienware m17 R2 P41E | |
| Average NVIDIA GeForce RTX 2080 Max-Q (23386 - 30910, n=20) | |
| HP Omen X 17-ap0xx | |
| MSI GE65 Raider 9SF-049US | |
| Walmart EVOO Gaming 17 | |
| Alienware 17 R5 | |
| Dell G5 15 5590-P8RVW | |
| Maingear Vector 15 | |
| MSI GT72S-6QEG16SR421BW | |
| 1280x720 Performance Combined | |
| MSI RTX 2080 Ti Gaming X Trio | |
| MSI GE65 Raider 9SF-049US | |
| Alienware m17 R2 P41E | |
| Walmart EVOO Gaming 17 | |
| Maingear Vector 15 | |
| Dell G5 15 5590-P8RVW | |
| Average NVIDIA GeForce RTX 2080 Max-Q (9212 - 14894, n=20) | |
| Alienware 17 R5 | |
| HP Omen X 17-ap0xx | |
| MSI GT72S-6QEG16SR421BW | |
| MSI GE63 Raider 8SG | |
| 3DMark 11 Performance | 23774 points | |
| 3DMark Cloud Gate Standard Score | 50705 points | |
| 3DMark Fire Strike Score | 19583 points | |
| 3DMark Time Spy Score | 8604 points | |
Help | ||
| Shadow of the Tomb Raider | |
| 1280x720 Lowest Preset | |
| Corsair One i160 | |
| MSI GE75 9SG | |
| MSI GE65 Raider 9SF-049US | |
| Alienware m17 R2 P41E | |
| Walmart EVOO Gaming 17 | |
| Average NVIDIA GeForce RTX 2080 Max-Q (114 - 142, n=5) | |
| HP Omen 15-dc0015ng | |
| HP Omen X 2S 15-dg0075cl | |
| Acer Predator Triton 700 | |
| Razer Blade 15 GTX 1660 Ti | |
| Dell G3 3590 | |
| HP Pavilion Gaming 15-ec0017ng | |
| 1920x1080 Highest Preset AA:T | |
| Corsair One i160 | |
| MSI GE75 9SG | |
| Alienware m17 R2 P41E | |
| MSI GE65 Raider 9SF-049US | |
| Average NVIDIA GeForce RTX 2080 Max-Q (71 - 105, n=8) | |
| HP Omen X 2S 15-dg0075cl | |
| Walmart EVOO Gaming 17 | |
| Acer Predator Triton 700 | |
| Razer Blade 15 GTX 1660 Ti | |
| HP Omen 15-dc0015ng | |
| HP Pavilion Gaming 15-ec0017ng | |
| Asus TUF FX705GM | |
| The Witcher 3 - 1920x1080 Ultra Graphics & Postprocessing (HBAO+) | |
| Corsair One i160 | |
| MSI GE75 9SG | |
| Average NVIDIA GeForce RTX 2080 Max-Q (65.7 - 92.7, n=22) | |
| MSI GE65 Raider 9SF-049US | |
| Alienware m17 R2 P41E | |
| HP Omen X 2S 15-dg0075cl | |
| Walmart EVOO Gaming 17 | |
| HP Omen 15-dc0015ng | |
| HP Pavilion Gaming 15-ec0017ng | |
| Razer Blade 15 GTX 1660 Ti | |
| Asus TUF FX705GM | |
| Dell G3 3590 | |
| low | med. | high | ultra | |
|---|---|---|---|---|
| BioShock Infinite (2013) | 396.1 | 337.3 | 321 | 179 |
| The Witcher 3 (2015) | 326.6 | 239.3 | 149.6 | 78 |
| Shadow of the Tomb Raider (2018) | 142 | 110 | 105 | 99 |
| Alienware m17 R2 P41E GeForce RTX 2080 Max-Q, i9-9980HK, 2x SK Hynix PC601 NVMe 512 GB (RAID 0) | Alienware m17 P37E GeForce RTX 2080 Max-Q, i9-8950HK, SK Hynix PC401 512GB M.2 (HFS512GD9TNG) | MSI GS75 Stealth 9SG GeForce RTX 2080 Max-Q, i7-9750H, 2x Samsung SSD PM981 MZVLB1T0HALR (RAID 0) | Razer Blade Pro 17 RTX 2080 Max-Q GeForce RTX 2080 Max-Q, i7-9750H, Samsung SSD PM981 MZVLB512HAJQ | Gigabyte Aero 17 XA RP77 GeForce RTX 2070 Max-Q, i9-9980HK, Intel SSD 760p SSDPEKKW512G8 | Asus ROG Strix Scar II GL704GW GeForce RTX 2070 Mobile, i7-8750H, Intel SSD 660p SSDPEKNW512G8 | |
|---|---|---|---|---|---|---|
| Noise | 2% | -3% | 4% | -2% | -4% | |
| off / environment * (dB) | 29.1 | 28.2 3% | 30 -3% | 28.2 3% | 29.3 -1% | 29 -0% |
| Idle Minimum * (dB) | 29.4 | 28.2 4% | 31 -5% | 28.2 4% | 33 -12% | 29 1% |
| Idle Average * (dB) | 29.4 | 28.2 4% | 32 -9% | 28.2 4% | 33 -12% | 32 -9% |
| Idle Maximum * (dB) | 31.5 | 31 2% | 38 -21% | 30.8 2% | 33 -5% | 40 -27% |
| Load Average * (dB) | 49.7 | 50.8 -2% | 47 5% | 42 15% | 42.5 14% | 46 7% |
| Witcher 3 ultra * (dB) | 49.5 | 50.8 -3% | 48 3% | 51 -3% | 42 15% | 51 -3% |
| Load Maximum * (dB) | 53.3 | 50.8 5% | 49 8% | 53 1% | 59.6 -12% | 52 2% |
* ... smaller is better
Noise level
| Idle |
| 29.4 / 29.4 / 31.5 dB(A) |
| Load |
| 49.7 / 53.3 dB(A) |
 | ||
30 dB silent 40 dB(A) audible 50 dB(A) loud |
||
min: | ||
(-) The maximum temperature on the upper side is 54.2 °C / 130 F, compared to the average of 40.4 °C / 105 F, ranging from 21.2 to 68.8 °C for the class Gaming.
(-) The bottom heats up to a maximum of 61.4 °C / 143 F, compared to the average of 43.2 °C / 110 F
(+) In idle usage, the average temperature for the upper side is 31.9 °C / 89 F, compared to the device average of 33.9 °C / 93 F.
(±) Playing The Witcher 3, the average temperature for the upper side is 33.8 °C / 93 F, compared to the device average of 33.9 °C / 93 F.
(+) The palmrests and touchpad are cooler than skin temperature with a maximum of 31.4 °C / 88.5 F and are therefore cool to the touch.
(-) The average temperature of the palmrest area of similar devices was 28.8 °C / 83.8 F (-2.6 °C / -4.7 F).
| Off / Standby | |
| Idle | |
| Load |
|
Key:
min: | |
| Alienware m17 R2 P41E i9-9980HK, GeForce RTX 2080 Max-Q, 2x SK Hynix PC601 NVMe 512 GB (RAID 0), IPS, 1920x1080, 17.3" | Alienware m17 P37E i9-8950HK, GeForce RTX 2080 Max-Q, SK Hynix PC401 512GB M.2 (HFS512GD9TNG), IPS, 3840x2160, 17.3" | MSI GS75 Stealth 9SG i7-9750H, GeForce RTX 2080 Max-Q, 2x Samsung SSD PM981 MZVLB1T0HALR (RAID 0), IPS, 1920x1080, 17.3" | Razer Blade Pro 17 RTX 2080 Max-Q i7-9750H, GeForce RTX 2080 Max-Q, Samsung SSD PM981 MZVLB512HAJQ, IPS, 1920x1080, 17.3" | Gigabyte Aero 17 XA RP77 i9-9980HK, GeForce RTX 2070 Max-Q, Intel SSD 760p SSDPEKKW512G8, IPS, 3840x2160, 17.3" | Asus ROG Strix Scar II GL704GW i7-8750H, GeForce RTX 2070 Mobile, Intel SSD 660p SSDPEKNW512G8, AHVA, 1920x1080, 17.3" | |
|---|---|---|---|---|---|---|
| Power Consumption | 17% | 35% | 30% | 25% | 25% | |
| Idle Minimum * (Watt) | 24.7 | 21.2 14% | 13 47% | 16.2 34% | 13.9 44% | 19 23% |
| Idle Average * (Watt) | 35.9 | 29.6 18% | 17 53% | 20.4 43% | 24.3 32% | 22 39% |
| Idle Maximum * (Watt) | 69.6 | 34 51% | 25 64% | 26.1 62% | 35.5 49% | 29 58% |
| Load Average * (Watt) | 141.8 | 130.9 8% | 96 32% | 96.5 32% | 127.6 10% | 102 28% |
| Witcher 3 ultra * (Watt) | 185.8 | 177.5 4% | 156 16% | 182.9 2% | 158 15% | 190 -2% |
| Load Maximum * (Watt) | 235.4 | 219.7 7% | 239 -2% | 214.3 9% | 237.5 -1% | 231 2% |
* ... smaller is better
| Alienware m17 R2 P41E i9-9980HK, GeForce RTX 2080 Max-Q, 76 Wh | Alienware m17 P37E i9-8950HK, GeForce RTX 2080 Max-Q, 90 Wh | MSI GS75 Stealth 9SG i7-9750H, GeForce RTX 2080 Max-Q, 80.25 Wh | Razer Blade Pro 17 RTX 2080 Max-Q i7-9750H, GeForce RTX 2080 Max-Q, 70 Wh | Gigabyte Aero 17 XA RP77 i9-9980HK, GeForce RTX 2070 Max-Q, 94.24 Wh | Asus ROG Strix Scar II GL704GW i7-8750H, GeForce RTX 2070 Mobile, 66 Wh | |
|---|---|---|---|---|---|---|
| Battery runtime | 30% | 58% | 49% | 113% | 29% | |
| Reader / Idle (h) | 7.1 | 9.1 28% | 7.7 8% | 4.9 -31% | 11.9 68% | 6.2 -13% |
| WiFi v1.3 (h) | 4.8 | 4.9 2% | 6 25% | 4.7 -2% | 7.2 50% | 3.9 -19% |
| Load (h) | 0.5 | 0.8 60% | 1.2 140% | 1.4 180% | 1.6 220% | 1.1 120% |
| Witcher 3 ultra (h) | 0.9 |
Pros
Cons
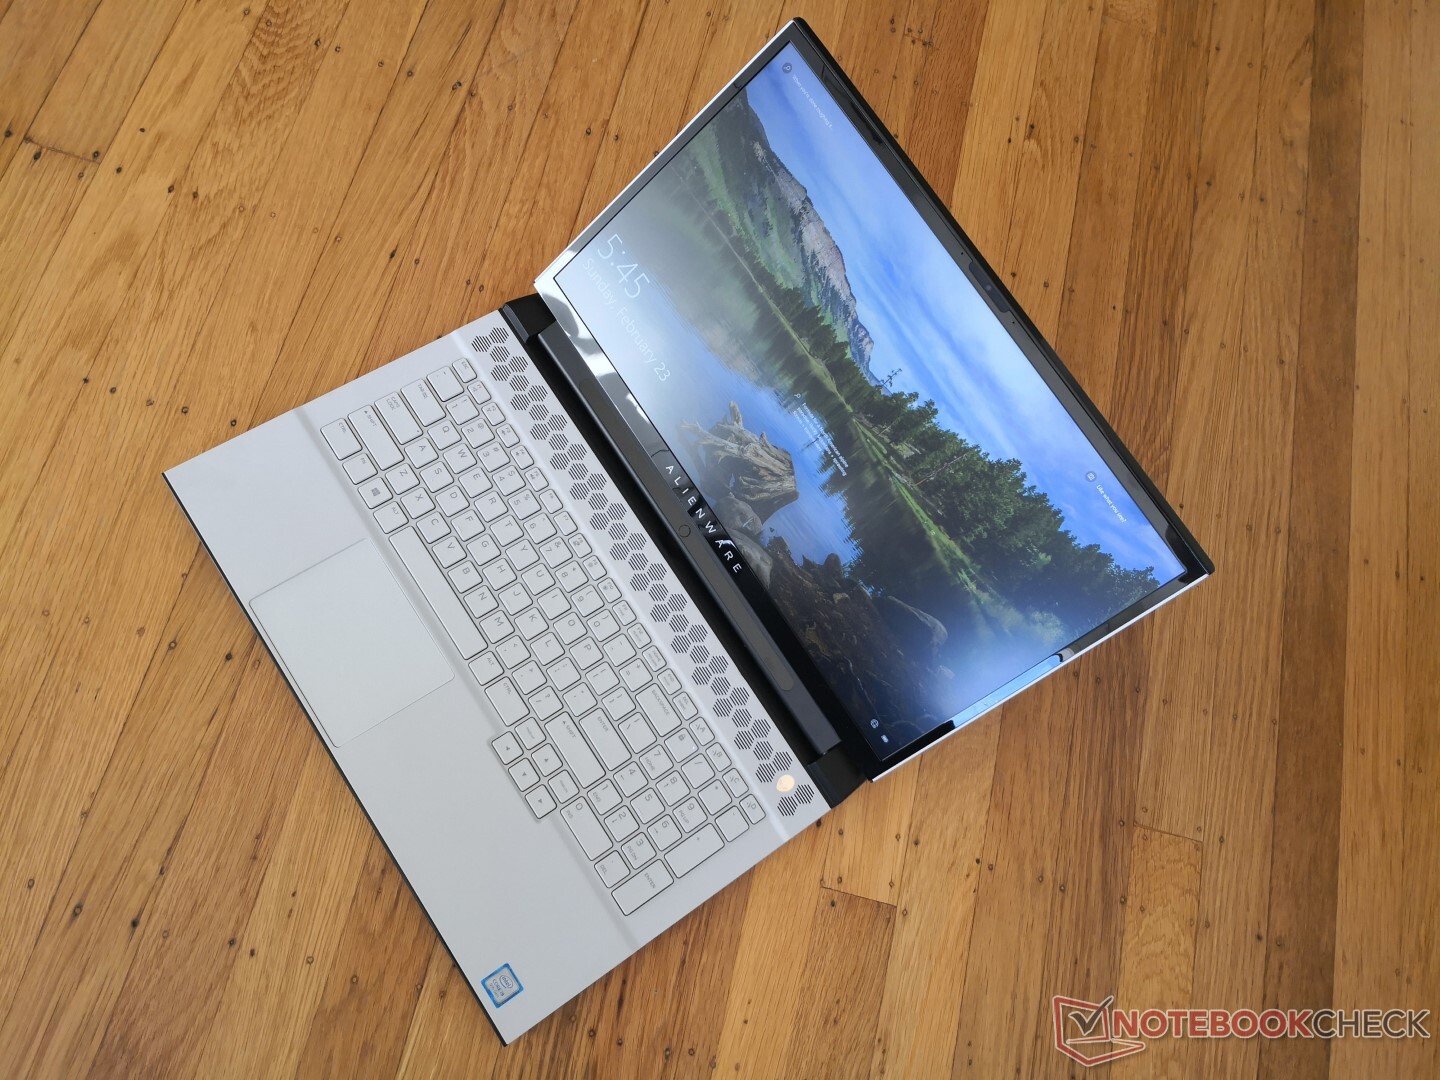
用户始终希望第二代在各个方面都比第一代更好。但是,在Alienware m17 R2的情况不太一样,它比Alienware m17 R1更侧重了一步。最新的迭代添加和删除了一些发烧友可能讨厌的功能。用户将不得不牺牲可升级RAM,Wi-Fi,2.5英寸SATA III选件,4K UHD显示选件以及更大的电池(如原装m17 R1所具有的),以改进键盘,更大的触控板,单键RGB照明,和较新的机身设计。如果您的工作依赖RAM和存储,那么您可能需要考虑使用更大的Alienware Area-51m。
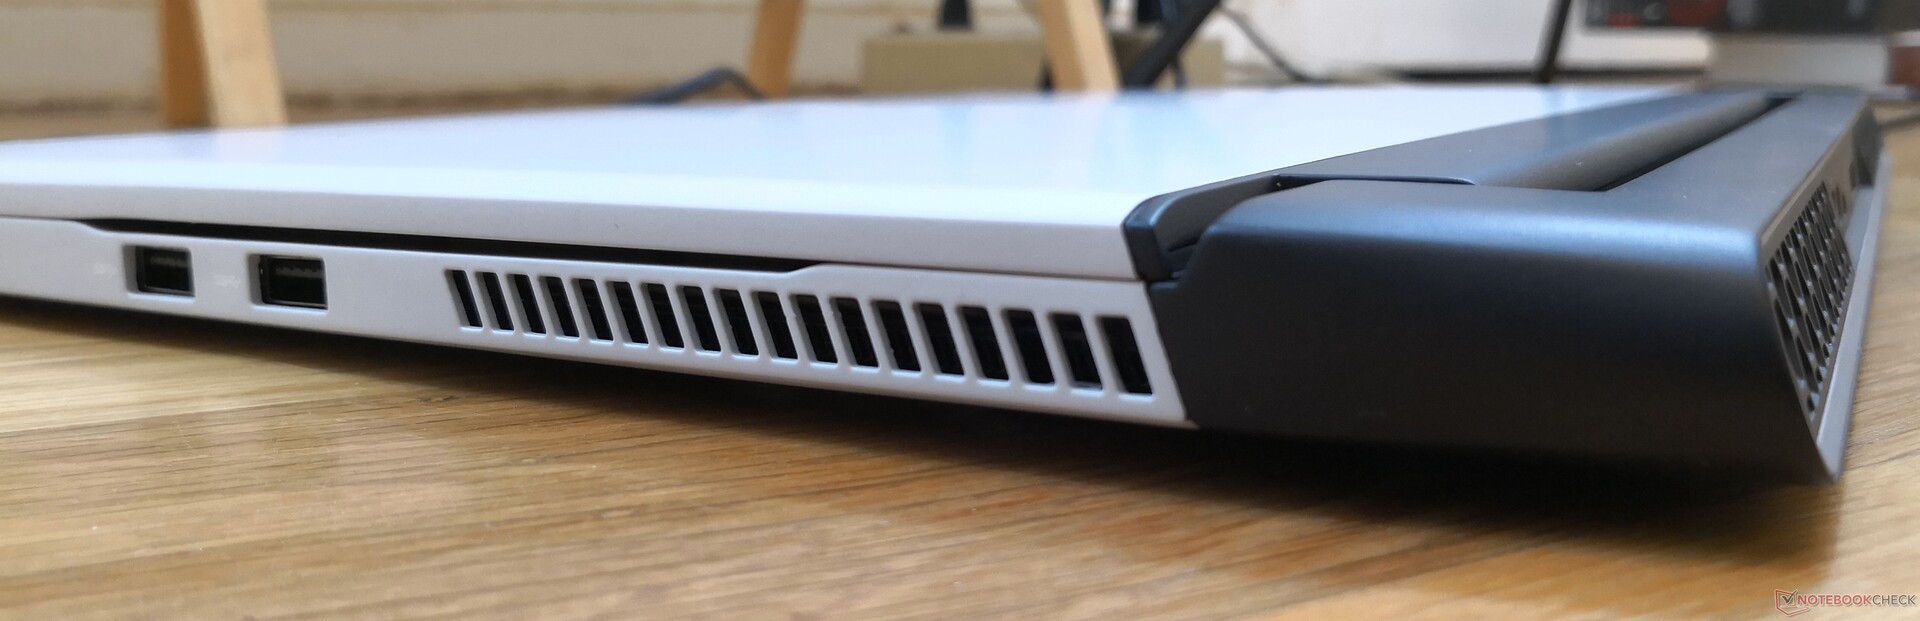
在性能方面,CPU的Turbo Boost可持续性给我们留下了深刻的印象。酷睿i9笔记本电脑(尤其是较薄的笔记本电脑)通常令人失望,因为大多数设计并未充分利用处理器的潜力,但是Alienware是一个明显的例外。主要缺点是占地面积更大,核心温度高,风扇噪音很大,相对m17 R1并没有真正改善。这些是在如此薄的机箱中塞下Core i9 CPU的不幸后果。尽管如此,我们怀疑配备Core i5或Core i7的的SKU的性能会比我们在此处记录的要差。
Alienware m17 R2是否足以让我们强烈推荐?除非您看重更好的键盘以及Core i9和Tobii眼动追踪选项,否则您可以从更小巧,更轻便的Core i7替代产品(如华硕ROG Strix Scar GL704GW 或 Razer Blade Pro 17获得类似的游戏性能。
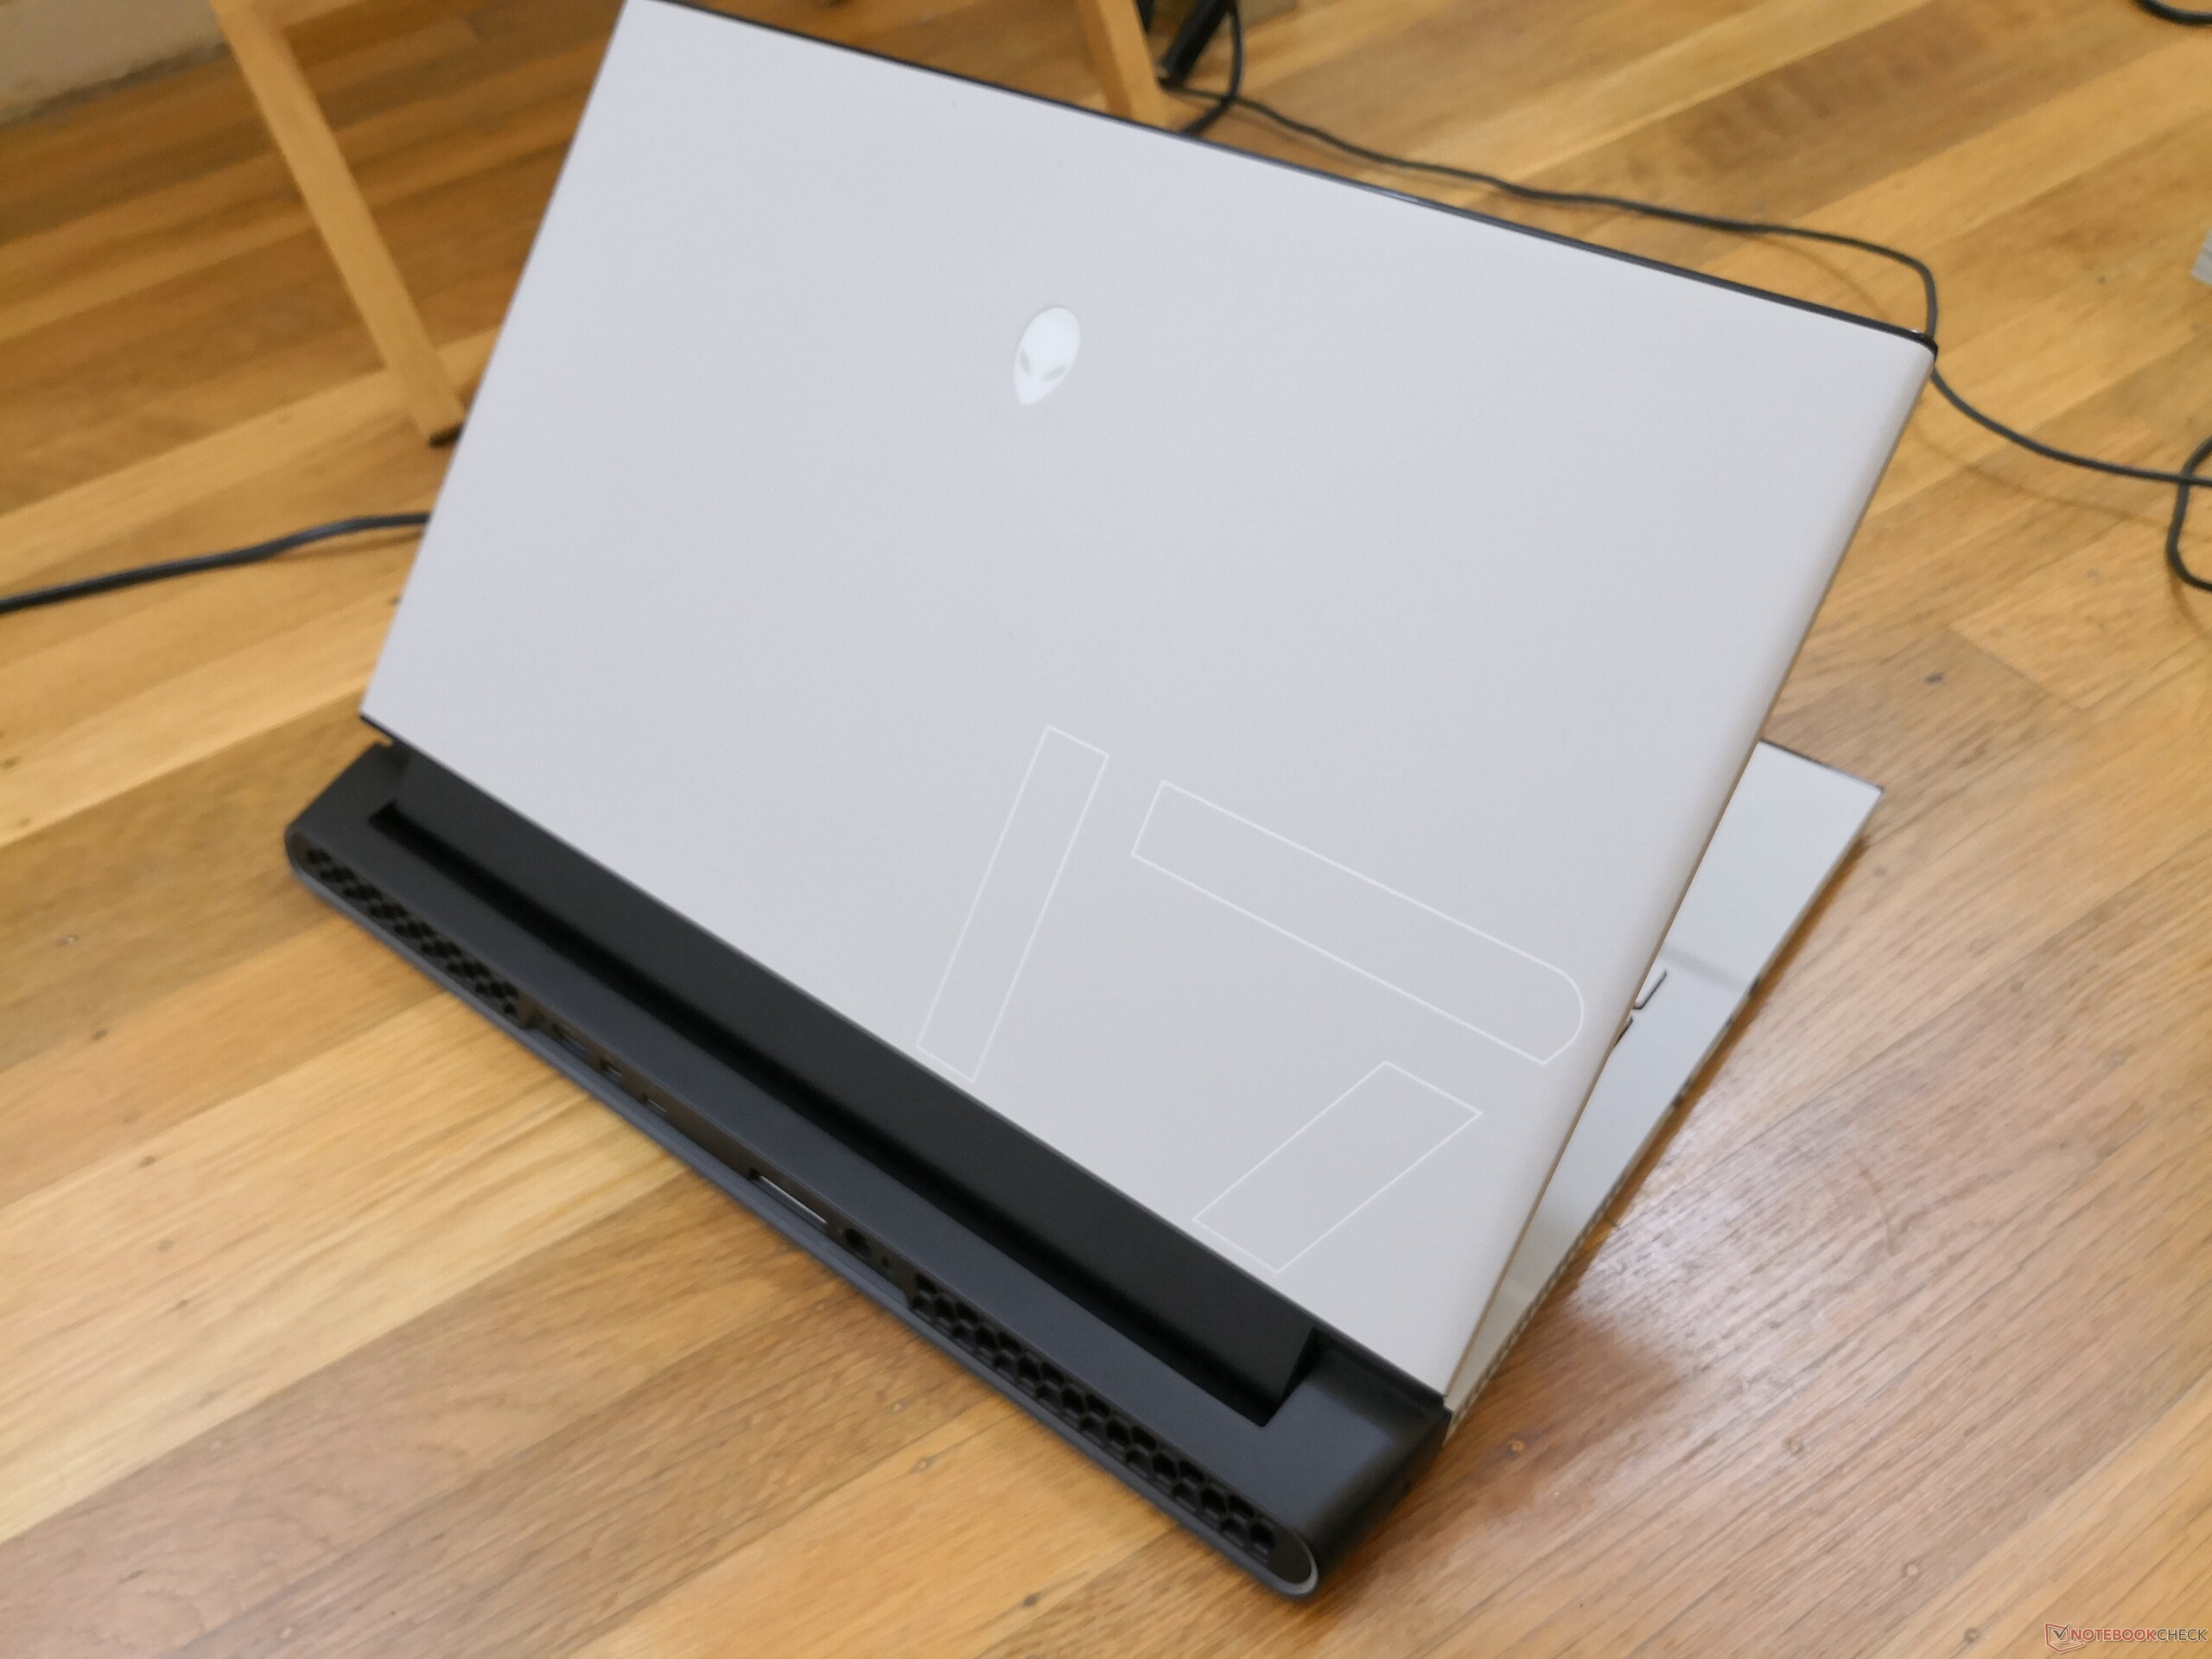
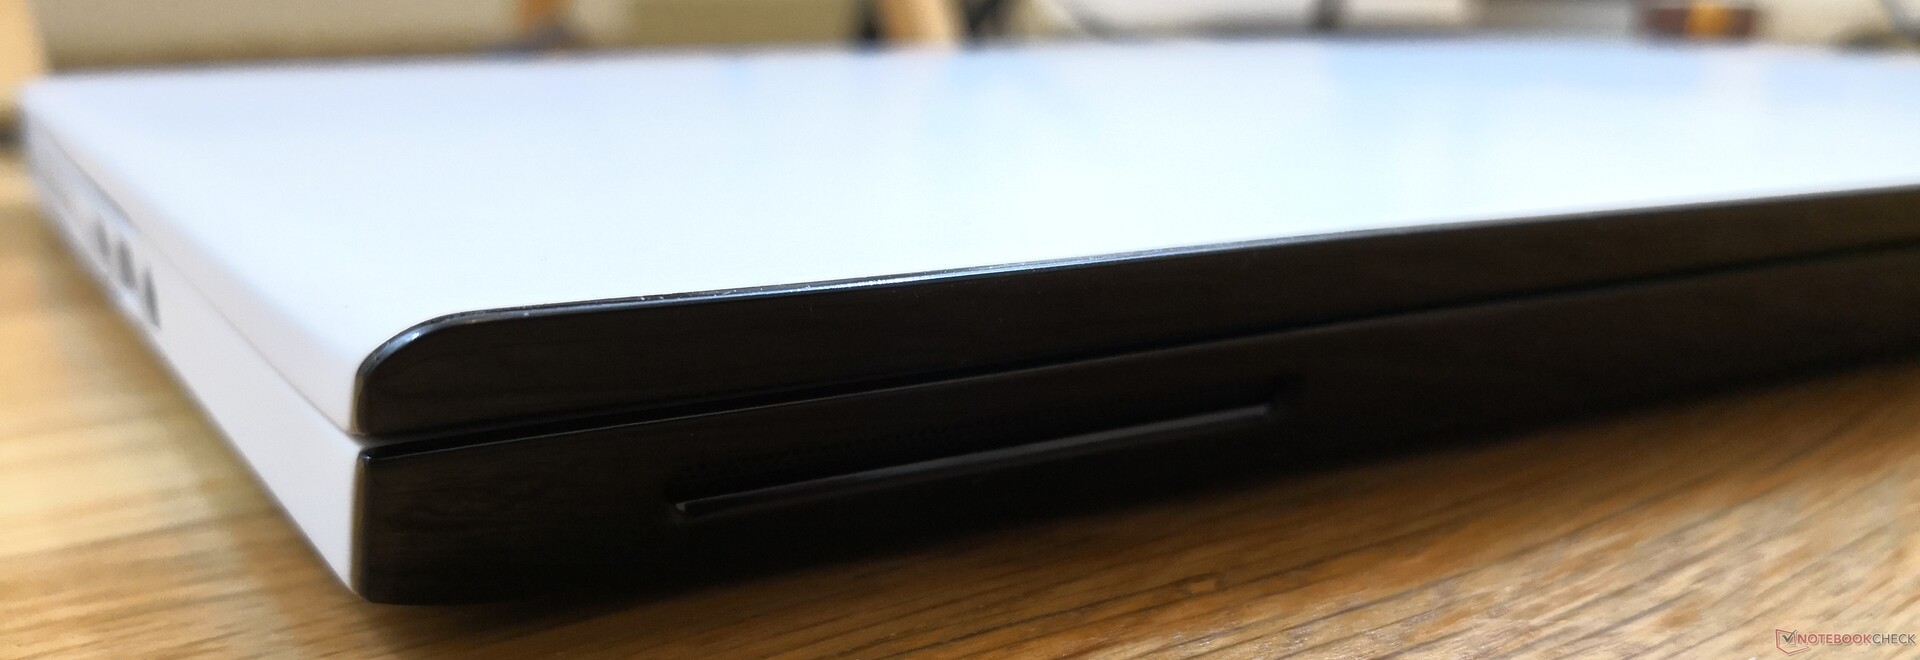
Alienware m17 R2旨在最大程度地发挥迄今为止该系列中最薄的机身内的性能。如果要充分利用系统所提供的功能,即使对于17.3英寸的游戏笔记本电脑,用户也将不得不面对更大的风扇,更高的核心温度和更大的占地面积。
Alienware m17 R2 P41E
- 07/31/2020 v7 (old)
Allen Ngo
Price comparison

