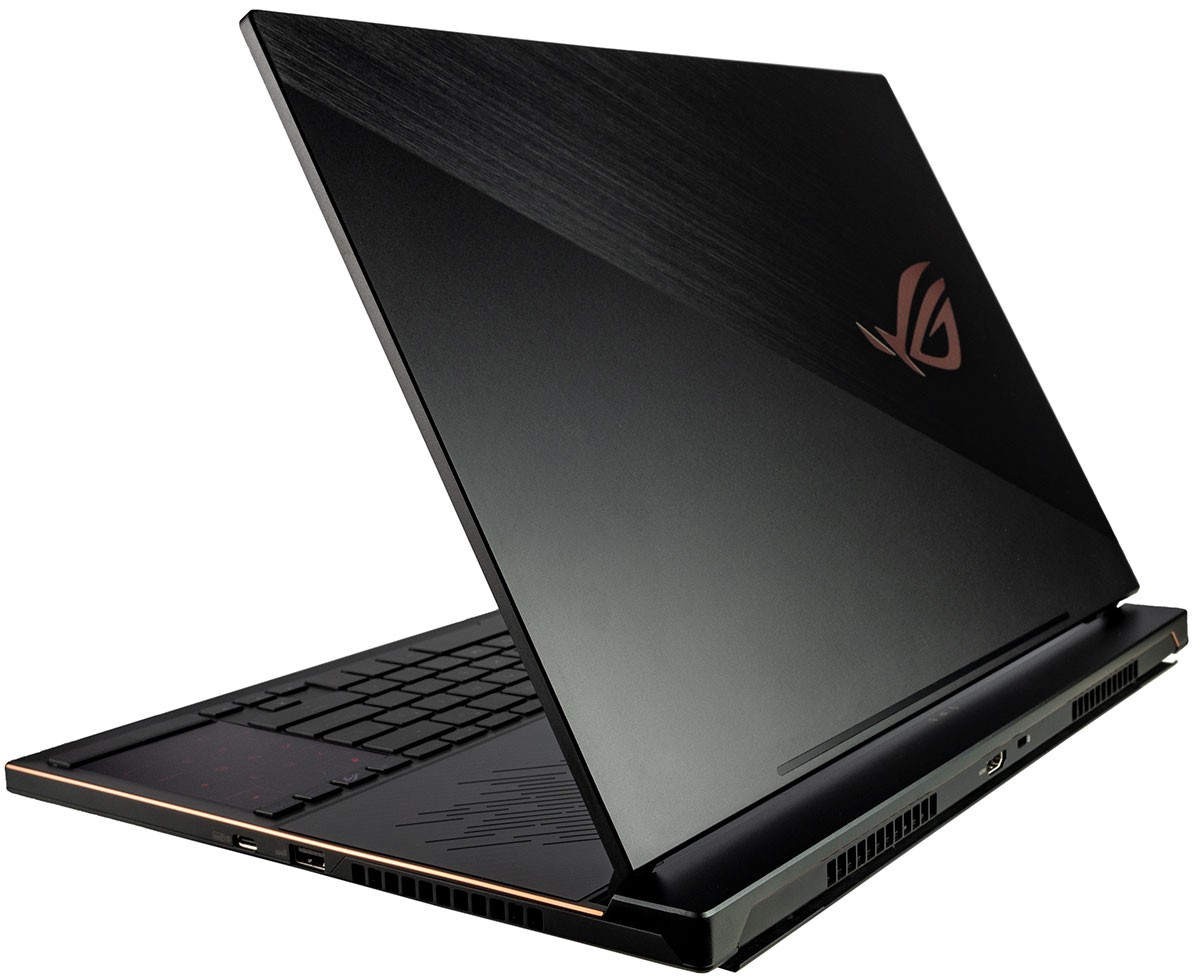
华硕Zephyrus S GX531GX (i7-8750H, RTX 2080 Max-Q) 笔记本电脑评测
| Networking | |
| iperf3 transmit AX12 | |
| Asus Strix GL504GM | |
| Razer Blade 15 RTX 2070 Max-Q | |
| Asus Zephyrus S GX531GX | |
| Aorus 15 X9 | |
| Asus Zephyrus GX501 | |
| iperf3 receive AX12 | |
| Razer Blade 15 RTX 2070 Max-Q | |
| Asus Zephyrus GX501 | |
| Asus Zephyrus S GX531GX | |
| Asus Strix GL504GM | |
| Aorus 15 X9 | |
| |||||||||||||||||||||||||
Brightness Distribution: 91 %
Center on Battery: 323.6 cd/m²
Contrast: 1116:1 (Black: 0.29 cd/m²)
ΔE ColorChecker Calman: 3.31 | ∀{0.5-29.43 Ø4.73}
calibrated: 2.73
ΔE Greyscale Calman: 2.9 | ∀{0.09-98 Ø4.97}
91.8% sRGB (Argyll 1.6.3 3D)
59.7% AdobeRGB 1998 (Argyll 1.6.3 3D)
66.9% AdobeRGB 1998 (Argyll 3D)
92.2% sRGB (Argyll 3D)
65.6% Display P3 (Argyll 3D)
Gamma: 2.29
CCT: 6765 K
| Asus Zephyrus S GX531GX AU Optronics B156HAN08.2, IPS, 15.6", 1920x1080 | Aorus 15 X9 LG Philips LP156WFG-SPB2, IPS, 15.6", 1920x1080 | Alienware m15 GTX 1070 Max-Q AU Optronics B156HAN, IPS, 15.6", 1920x1080 | Razer Blade 15 RTX 2070 Max-Q LG Philips LGD05C0, IPS, 15.6", 1920x1080 | Asus Strix GL504GM AU Optronics B156HAN08.2 (AUO82ED), IPS, 15.6", 1920x1080 | Asus Zephyrus GX501 AUO B156HAN04.2 (AUO42ED), IPS, 15.6", 1920x1080 | |
|---|---|---|---|---|---|---|
| Display | 1% | -3% | 1% | 0% | -1% | |
| Display P3 Coverage (%) | 65.6 | 64.9 -1% | 63.5 -3% | 65.3 0% | 65.3 0% | 64.8 -1% |
| sRGB Coverage (%) | 92.2 | 95.6 4% | 89.4 -3% | 94.9 3% | 92.8 1% | 91.8 0% |
| AdobeRGB 1998 Coverage (%) | 66.9 | 66.3 -1% | 64.5 -4% | 66.3 -1% | 66.7 0% | 65.9 -1% |
| Response Times | -73% | -91% | -81% | -10% | -314% | |
| Response Time Grey 50% / Grey 80% * (ms) | 7 ? | 15.2 ? -117% | 18 ? -157% | 16.8 ? -140% | 7.8 ? -11% | 40.4 ? -477% |
| Response Time Black / White * (ms) | 9.6 ? | 12.4 ? -29% | 12 ? -25% | 11.6 ? -21% | 10.4 ? -8% | 24 ? -150% |
| PWM Frequency (Hz) | ||||||
| Screen | 3% | -12% | 0% | -11% | -26% | |
| Brightness middle (cd/m²) | 323.6 | 305.1 -6% | 353.6 9% | 314.7 -3% | 350 8% | 328 1% |
| Brightness (cd/m²) | 315 | 295 -6% | 346 10% | 312 -1% | 338 7% | 305 -3% |
| Brightness Distribution (%) | 91 | 78 -14% | 86 -5% | 90 -1% | 90 -1% | 83 -9% |
| Black Level * (cd/m²) | 0.29 | 0.33 -14% | 0.3 -3% | 0.38 -31% | 0.33 -14% | 0.25 14% |
| Contrast (:1) | 1116 | 925 -17% | 1179 6% | 828 -26% | 1061 -5% | 1312 18% |
| Colorchecker dE 2000 * | 3.31 | 2.58 22% | 4.55 -37% | 2.56 23% | 4.3 -30% | 6.02 -82% |
| Colorchecker dE 2000 max. * | 5.74 | 4.32 25% | 7.91 -38% | 4.89 15% | 7.78 -36% | 10.14 -77% |
| Colorchecker dE 2000 calibrated * | 2.73 | 1.33 51% | 3.37 -23% | 1.71 37% | 2.83 -4% | |
| Greyscale dE 2000 * | 2.9 | 3.4 -17% | 4.1 -41% | 3.4 -17% | 4.4 -52% | 6.32 -118% |
| Gamma | 2.29 96% | 2.28 96% | 2.27 97% | 2.3 96% | 2.26 97% | 2.28 96% |
| CCT | 6765 96% | 6374 102% | 7434 87% | 6435 101% | 7517 86% | 8194 79% |
| Color Space (Percent of AdobeRGB 1998) (%) | 59.7 | 60.7 2% | 57.9 -3% | 60.7 2% | 60 1% | 60 1% |
| Color Space (Percent of sRGB) (%) | 91.8 | 95.2 4% | 88.9 -3% | 94.6 3% | 92.5 1% | 92 0% |
| Total Average (Program / Settings) | -23% /
-7% | -35% /
-20% | -27% /
-10% | -7% /
-9% | -114% /
-59% |
* ... smaller is better
Display Response Times
| ↔ Response Time Black to White | ||
|---|---|---|
| 9.6 ms ... rise ↗ and fall ↘ combined | ↗ 4.4 ms rise | 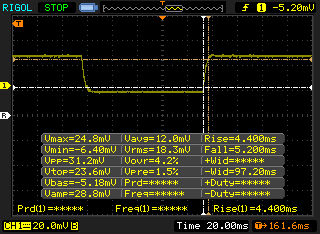 |
| ↘ 5.2 ms fall | ||
| The screen shows fast response rates in our tests and should be suited for gaming. In comparison, all tested devices range from 0.1 (minimum) to 240 (maximum) ms. » 26 % of all devices are better. This means that the measured response time is better than the average of all tested devices (19.9 ms). | ||
| ↔ Response Time 50% Grey to 80% Grey | ||
| 7 ms ... rise ↗ and fall ↘ combined | ↗ 3.6 ms rise | 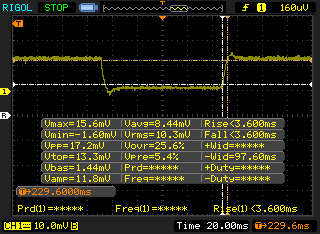 |
| ↘ 3.4 ms fall | ||
| The screen shows very fast response rates in our tests and should be very well suited for fast-paced gaming. In comparison, all tested devices range from 0.165 (minimum) to 636 (maximum) ms. » 20 % of all devices are better. This means that the measured response time is better than the average of all tested devices (31.1 ms). | ||
Screen Flickering / PWM (Pulse-Width Modulation)
| Screen flickering / PWM not detected | 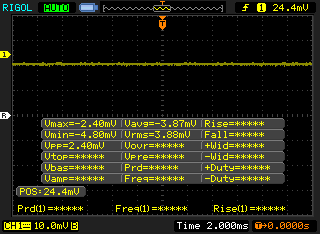 | ||
In comparison: 52 % of all tested devices do not use PWM to dim the display. If PWM was detected, an average of 7791 (minimum: 5 - maximum: 343500) Hz was measured. | |||
| PCMark 8 | |
| Home Score Accelerated v2 | |
| Asus Zephyrus GX501 | |
| Aorus 15 X9 | |
| Asus Zephyrus S GX531GS | |
| Average Intel Core i7-8750H, NVIDIA GeForce RTX 2080 Max-Q (3979 - 5107, n=3) | |
| Alienware m15 GTX 1070 Max-Q | |
| Asus Strix GL504GM | |
| Razer Blade 15 RTX 2070 Max-Q | |
| Asus Zephyrus S GX531GX | |
| Work Score Accelerated v2 | |
| Aorus 15 X9 | |
| Asus Zephyrus S GX531GS | |
| Razer Blade 15 RTX 2070 Max-Q | |
| Average Intel Core i7-8750H, NVIDIA GeForce RTX 2080 Max-Q (5289 - 5882, n=3) | |
| Asus Strix GL504GM | |
| Alienware m15 GTX 1070 Max-Q | |
| Asus Zephyrus GX501 | |
| Asus Zephyrus S GX531GX | |
| PCMark 8 Home Score Accelerated v2 | 3979 points | |
| PCMark 8 Work Score Accelerated v2 | 5289 points | |
| PCMark 10 Score | 5492 points | |
Help | ||
| Asus Zephyrus S GX531GX Intel SSD 660p SSDPEKNW512G8 | Aorus 15 X9 Intel SSD 760p SSDPEKKW512G8 | Razer Blade 15 RTX 2070 Max-Q Samsung SSD PM981 MZVLB512HAJQ | Asus Strix GL504GM Toshiba NVMe THNSN5256GPU7 | Asus Zephyrus S GX531GS WDC PC SN520 SDAPNUW-512G | |
|---|---|---|---|---|---|
| AS SSD | 40% | 83% | 20% | 50% | |
| Seq Read (MB/s) | 1239 | 1912 54% | 1840 49% | 1433 16% | 903 -27% |
| Seq Write (MB/s) | 920 | 1553 69% | 1822 98% | 1071 16% | 1261 37% |
| 4K Read (MB/s) | 45.74 | 56.5 24% | 52.3 14% | 32 -30% | 40.02 -13% |
| 4K Write (MB/s) | 95.7 | 119.6 25% | 110.7 16% | 96.5 1% | 103.6 8% |
| 4K-64 Read (MB/s) | 322 | 869 170% | 1126 250% | 832 158% | 1030 220% |
| 4K-64 Write (MB/s) | 722 | 584 -19% | 1717 138% | 520 -28% | 1285 78% |
| Access Time Read * (ms) | 0.073 | 0.049 33% | 0.047 36% | 0.072 1% | 0.129 -77% |
| Access Time Write * (ms) | 0.047 | 0.031 34% | 0.033 30% | 0.045 4% | 0.036 23% |
| Score Read (Points) | 492 | 1116 127% | 1362 177% | 1007 105% | 1161 136% |
| Score Write (Points) | 910 | 859 -6% | 2010 121% | 724 -20% | 1515 66% |
| Score Total (Points) | 1654 | 2544 54% | 4079 147% | 2233 35% | 3294 99% |
| Copy ISO MB/s (MB/s) | 1236 | 1329 8% | 1975 60% | 1006 -19% | |
| Copy Program MB/s (MB/s) | 703 | 404.3 -42% | 526 -25% | 752 7% | |
| Copy Game MB/s (MB/s) | 812 | 1071 32% | 1200 48% | 1088 34% |
* ... smaller is better

| 3DMark 11 | |
| 1280x720 Performance GPU | |
| Asus ROG Strix RTX 2080 OC | |
| Alienware Area-51m i9-9900K RTX 2080 | |
| Asus Zephyrus S GX531GX | |
| Average NVIDIA GeForce RTX 2080 Max-Q (23386 - 30910, n=20) | |
| Aorus 15 X9 | |
| Asus Zephyrus GX501 | |
| Razer Blade 15 RTX 2070 Max-Q | |
| Alienware m15 GTX 1070 Max-Q | |
| MSI GL73 8SE-010US | |
| Asus Zephyrus S GX531GS | |
| Asus Strix GL504GM | |
| 1280x720 Performance Combined | |
| Alienware Area-51m i9-9900K RTX 2080 | |
| Asus ROG Strix RTX 2080 OC | |
| Average NVIDIA GeForce RTX 2080 Max-Q (9212 - 14894, n=20) | |
| Asus Zephyrus S GX531GX | |
| Alienware m15 GTX 1070 Max-Q | |
| Asus Zephyrus S GX531GS | |
| Razer Blade 15 RTX 2070 Max-Q | |
| Asus Strix GL504GM | |
| MSI GL73 8SE-010US | |
| Asus Zephyrus GX501 | |
| Aorus 15 X9 | |
| 3DMark 11 Performance | 21324 points | |
| 3DMark Cloud Gate Standard Score | 32978 points | |
| 3DMark Fire Strike Score | 17774 points | |
| 3DMark Time Spy Score | 7688 points | |
Help | ||
| The Witcher 3 - 1920x1080 Ultra Graphics & Postprocessing (HBAO+) | |
| Alienware Area-51m i9-9900K RTX 2080 | |
| Asus Zephyrus S GX531GX | |
| Average NVIDIA GeForce RTX 2080 Max-Q (65.7 - 92.7, n=22) | |
| Asus Chimera G703GI | |
| Aorus 15 X9 | |
| Razer Blade 15 RTX 2070 Max-Q | |
| Asus Zephyrus GX501 | |
| MSI GL73 8SE-010US | |
| Asus Zephyrus S GX531GS | |
| Asus Strix GL504GM | |
| Asus ZenBook 15 UX533FD | |
| Asus TUF FX505DY | |
| Asus FX504GD | |
| low | med. | high | ultra | |
|---|---|---|---|---|
| BioShock Infinite (2013) | 276.8 | 246.7 | 232.3 | 166 |
| The Witcher 3 (2015) | 263.4 | 215.2 | 142 | 80.3 |
| Rise of the Tomb Raider (2016) | 215 | 163.6 | 146.5 | 124 |
| Asus Zephyrus S GX531GX GeForce RTX 2080 Max-Q, i7-8750H, Intel SSD 660p SSDPEKNW512G8 | Aorus 15 X9 GeForce RTX 2070 Mobile, i7-8750H, Intel SSD 760p SSDPEKKW512G8 | Alienware m15 GTX 1070 Max-Q GeForce GTX 1070 Max-Q, i7-8750H, Toshiba XG5 KXG50ZNV512G | Razer Blade 15 RTX 2070 Max-Q GeForce RTX 2070 Max-Q, i7-8750H, Samsung SSD PM981 MZVLB512HAJQ | Asus Strix GL504GM GeForce GTX 1060 Mobile, i7-8750H, Toshiba NVMe THNSN5256GPU7 | Asus Zephyrus GX501 GeForce GTX 1080 Max-Q, i7-7700HQ, Samsung SSD SM961 1TB M.2 MZVKW1T0HMLH | Asus Zephyrus S GX531GS GeForce GTX 1070 Max-Q, i7-8750H, WDC PC SN520 SDAPNUW-512G | |
|---|---|---|---|---|---|---|---|
| Noise | -0% | 8% | 13% | 7% | 5% | -4% | |
| off / environment * (dB) | 28.7 | 28.2 2% | 28.6 -0% | 28.8 -0% | 28.5 1% | 31 -8% | 29 -1% |
| Idle Minimum * (dB) | 29.8 | 32.6 -9% | 28.6 4% | 28.8 3% | 30 -1% | 32 -7% | 33 -11% |
| Idle Average * (dB) | 32.4 | 32.7 -1% | 28.6 12% | 28.8 11% | 30 7% | 33 -2% | 34 -5% |
| Idle Maximum * (dB) | 38 | 32.7 14% | 28.6 25% | 29.4 23% | 30 21% | 34 11% | 40 -5% |
| Load Average * (dB) | 38.2 | 38.9 -2% | 40.8 -7% | 35.7 7% | 41.8 -9% | 39 -2% | 47 -23% |
| Witcher 3 ultra * (dB) | 56.6 | 51.8 8% | 49.6 12% | 42.5 25% | 47.6 16% | 42 26% | 51 10% |
| Load Maximum * (dB) | 56.6 | 64.1 -13% | 49.6 12% | 45 20% | 50 12% | 46 19% | 53 6% |
* ... smaller is better
Noise level
| Idle |
| 29.8 / 32.4 / 38 dB(A) |
| Load |
| 38.2 / 56.6 dB(A) |
 | ||
30 dB silent 40 dB(A) audible 50 dB(A) loud |
||
min: | ||
(-) The maximum temperature on the upper side is 47 °C / 117 F, compared to the average of 40.4 °C / 105 F, ranging from 21.2 to 68.8 °C for the class Gaming.
(-) The bottom heats up to a maximum of 48.6 °C / 119 F, compared to the average of 43.2 °C / 110 F
(+) In idle usage, the average temperature for the upper side is 27.1 °C / 81 F, compared to the device average of 33.9 °C / 93 F.
(-) Playing The Witcher 3, the average temperature for the upper side is 38.1 °C / 101 F, compared to the device average of 33.9 °C / 93 F.
(+) The palmrests and touchpad are reaching skin temperature as a maximum (33.4 °C / 92.1 F) and are therefore not hot.
(-) The average temperature of the palmrest area of similar devices was 28.8 °C / 83.8 F (-4.6 °C / -8.3 F).
Asus Zephyrus S GX531GX audio analysis
(±) | speaker loudness is average but good (73 dB)
Bass 100 - 315 Hz
(±) | reduced bass - on average 13.3% lower than median
(±) | linearity of bass is average (14.9% delta to prev. frequency)
Mids 400 - 2000 Hz
(+) | balanced mids - only 1.9% away from median
(+) | mids are linear (5.2% delta to prev. frequency)
Highs 2 - 16 kHz
(±) | higher highs - on average 5.6% higher than median
(±) | linearity of highs is average (10.8% delta to prev. frequency)
Overall 100 - 16.000 Hz
(±) | linearity of overall sound is average (18.3% difference to median)
Compared to same class
» 58% of all tested devices in this class were better, 9% similar, 33% worse
» The best had a delta of 6%, average was 18%, worst was 132%
Compared to all devices tested
» 40% of all tested devices were better, 8% similar, 52% worse
» The best had a delta of 4%, average was 24%, worst was 134%
Apple MacBook 12 (Early 2016) 1.1 GHz audio analysis
(+) | speakers can play relatively loud (83.6 dB)
Bass 100 - 315 Hz
(±) | reduced bass - on average 11.3% lower than median
(±) | linearity of bass is average (14.2% delta to prev. frequency)
Mids 400 - 2000 Hz
(+) | balanced mids - only 2.4% away from median
(+) | mids are linear (5.5% delta to prev. frequency)
Highs 2 - 16 kHz
(+) | balanced highs - only 2% away from median
(+) | highs are linear (4.5% delta to prev. frequency)
Overall 100 - 16.000 Hz
(+) | overall sound is linear (10.2% difference to median)
Compared to same class
» 7% of all tested devices in this class were better, 2% similar, 91% worse
» The best had a delta of 5%, average was 18%, worst was 53%
Compared to all devices tested
» 5% of all tested devices were better, 1% similar, 94% worse
» The best had a delta of 4%, average was 24%, worst was 134%
| Off / Standby | |
| Idle | |
| Load |
|
Key:
min: | |
| Asus Zephyrus S GX531GX i7-8750H, GeForce RTX 2080 Max-Q, Intel SSD 660p SSDPEKNW512G8, IPS, 1920x1080, 15.6" | Aorus 15 X9 i7-8750H, GeForce RTX 2070 Mobile, Intel SSD 760p SSDPEKKW512G8, IPS, 1920x1080, 15.6" | Asus Zephyrus S GX531GS i7-8750H, GeForce GTX 1070 Max-Q, WDC PC SN520 SDAPNUW-512G, IPS, 1920x1080, 15.6" | Razer Blade 15 RTX 2070 Max-Q i7-8750H, GeForce RTX 2070 Max-Q, Samsung SSD PM981 MZVLB512HAJQ, IPS, 1920x1080, 15.6" | Asus Strix GL504GM i7-8750H, GeForce GTX 1060 Mobile, Toshiba NVMe THNSN5256GPU7, IPS, 1920x1080, 15.6" | Asus Zephyrus GX501 i7-7700HQ, GeForce GTX 1080 Max-Q, Samsung SSD SM961 1TB M.2 MZVKW1T0HMLH, IPS, 1920x1080, 15.6" | |
|---|---|---|---|---|---|---|
| Power Consumption | -25% | -3% | 22% | 18% | -0% | |
| Idle Minimum * (Watt) | 16.1 | 26 -61% | 17 -6% | 10.4 35% | 10 38% | 18 -12% |
| Idle Average * (Watt) | 20.9 | 30.8 -47% | 20 4% | 14.6 30% | 16.9 19% | 23 -10% |
| Idle Maximum * (Watt) | 27 | 34.9 -29% | 29 -7% | 16.3 40% | 21.1 22% | 31 -15% |
| Load Average * (Watt) | 93.4 | 90.7 3% | 112 -20% | 88.5 5% | 112.4 -20% | 79 15% |
| Witcher 3 ultra * (Watt) | 168.2 | 175 -4% | 152 10% | 155.4 8% | 135.5 19% | 148 12% |
| Load Maximum * (Watt) | 215.3 | 241.2 -12% | 211 2% | 182.4 15% | 157.3 27% | 196 9% |
* ... smaller is better
| Asus Zephyrus S GX531GX i7-8750H, GeForce RTX 2080 Max-Q, 50 Wh | Aorus 15 X9 i7-8750H, GeForce RTX 2070 Mobile, 62 Wh | Alienware m15 GTX 1070 Max-Q i7-8750H, GeForce GTX 1070 Max-Q, 90 Wh | Razer Blade 15 RTX 2070 Max-Q i7-8750H, GeForce RTX 2070 Max-Q, 80 Wh | Asus Strix GL504GM i7-8750H, GeForce GTX 1060 Mobile, 66 Wh | Asus Zephyrus GX501 i7-7700HQ, GeForce GTX 1080 Max-Q, 50 Wh | |
|---|---|---|---|---|---|---|
| Battery runtime | -47% | 157% | 117% | 97% | -27% | |
| WiFi v1.3 (h) | 3 | 1.6 -47% | 7.7 157% | 6.5 117% | 5.9 97% | 2.2 -27% |
| Reader / Idle (h) | 1.8 | 10.5 | 11.4 | 3.1 | ||
| Load (h) | 1 | 1.7 | 1.5 | 0.7 |
Pros
Cons

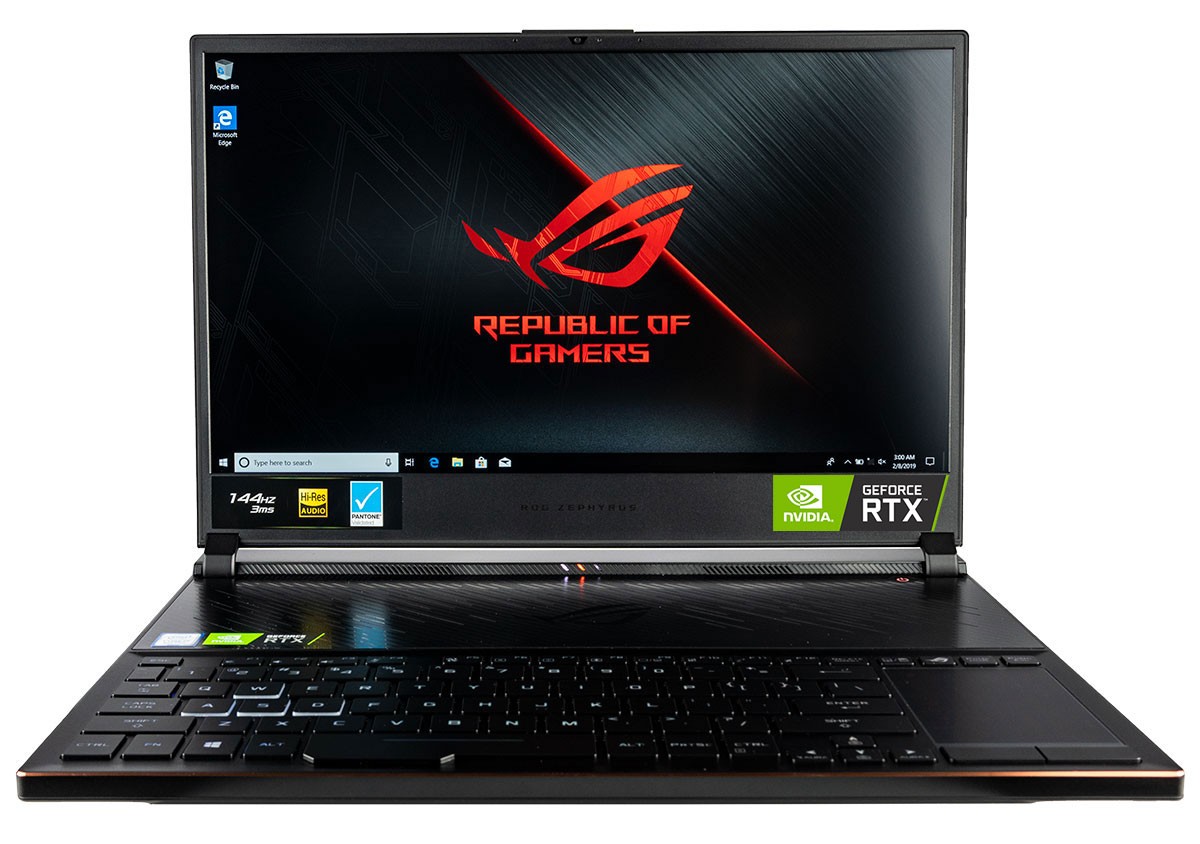
GX531在几个关键领域表现出色。除了具有窄边框的超薄机身外,核心温度比我们预期的更低,屏幕比GX501改进很多,尤其在拖影方面。当然,底盘的独特设计意味着令人不舒服的高温按键永远不会成为问题。与GTX 1080 Max-Q相比,用户可以从RTX 2080 Max-Q获得17%到45%的性能提升。
不过仍有很大的改进空间。屏幕下巴非常大,风扇噪音比MSI GS65或Razer Blade 15更大。在最大风扇的Turbo模式下运行笔记本电脑才能得到最大性能,而平衡模式将导致10%的性能损失。必须通过Armory Crate应用程序切换这些电源设置,因为它们独立于标准Windows电源配置文件运行。
其他缺失的功能包括RJ-45,SD卡读卡器,单键RGB照明和雷电3,我们认为这应该是价格高达20000元以上的旗舰游戏笔记本电脑的标准配置。游戏爱好者可能更愿意使用G-Sync代替Optimus,因为即使可以使用图形切换,这台电脑的电池续航时间也已达到平均水平。薄机身意味着不会有机械硬盘,这对于拥有大型游戏库的用户来说可能是一个问题。
由于GX531的缺点,我们建议用户改为使用华硕ROG GL504系列。我们发现通过更稳固的键盘按键,更坚硬的A面,更多存储选项,更多端口以及更大的触控板可以更好地平衡它们。它甚至与GX531共享完全相同的IPS面板。这是一个更厚的选择,但我们发现它的其他便利功能非常值得。
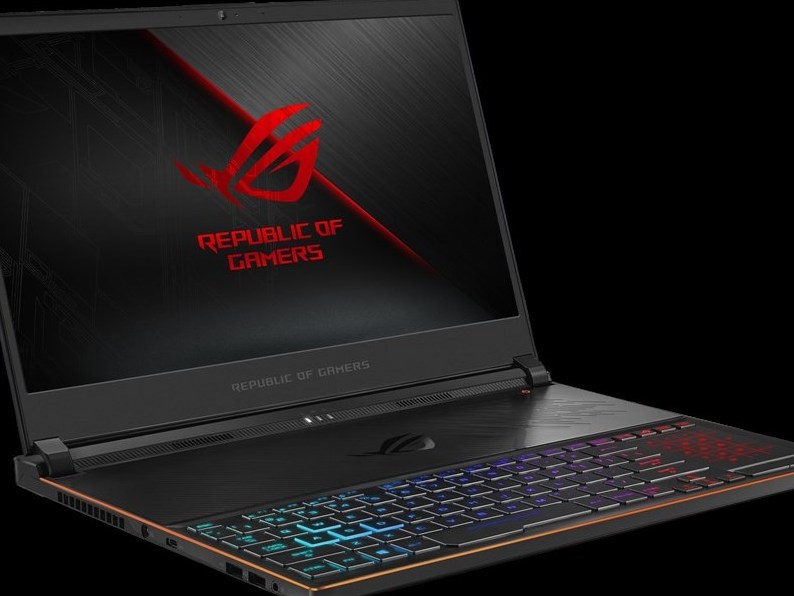
在性能,重量,厚度和外观方面,相较旧款GX501进行了重大升级。 GX531是迄今为止华硕最具视觉冲击力的15.6英寸游戏笔记本电脑,但它不得不牺牲一些有用的功能来达到如此轻薄的外形。
Asus Zephyrus S GX531GX
- 09/20/2019 v7 (old)
Allen Ngo
Price comparison

