MSI GS65 Stealth 9SG (i7-9750H, RTX 2080 Max-Q) 笔记本电脑评测
| |||||||||||||||||||||||||
Brightness Distribution: 90 %
Center on Battery: 282.3 cd/m²
Contrast: 882:1 (Black: 0.32 cd/m²)
ΔE ColorChecker Calman: 1.17 | ∀{0.5-29.43 Ø4.73}
calibrated: 1.06
ΔE Greyscale Calman: 1.3 | ∀{0.09-98 Ø4.97}
97.5% sRGB (Argyll 1.6.3 3D)
63.8% AdobeRGB 1998 (Argyll 1.6.3 3D)
68.9% AdobeRGB 1998 (Argyll 3D)
97.5% sRGB (Argyll 3D)
67.6% Display P3 (Argyll 3D)
Gamma: 2.2
CCT: 6643 K
| MSI GS65 Stealth 9SG Sharp LQ156M1JW03 (SHP14C5), IPS, 15.6", 1920x1080 | Razer Blade 15 RTX 2080 Max-Q Sharp LQ156M1JW03 (SHP14C5), IPS, 15.6", 1920x1080 | Lenovo Legion Y740-15ICHg LP156WFG-SPB2, IPS, 15.6", 1920x1080 | Asus Zephyrus S GX531GX AU Optronics B156HAN08.2, IPS, 15.6", 1920x1080 | Gigabyte Aero 15 Classic-XA Sharp LQ156M1JW03 (SHP14C5), IGZO, 15.6", 1920x1080 | MSI GS65 8RF-019DE Stealth Thin AU Optronics B156HAN08.0 (AUO80ED), IPS, 15.6", 1920x1080 | |
|---|---|---|---|---|---|---|
| Display | -0% | -6% | -4% | -3% | -3% | |
| Display P3 Coverage (%) | 67.6 | 66.9 -1% | 63.5 -6% | 65.6 -3% | 65.3 -3% | 66.2 -2% |
| sRGB Coverage (%) | 97.5 | 98.1 1% | 92.4 -5% | 92.2 -5% | 95.5 -2% | 92.1 -6% |
| AdobeRGB 1998 Coverage (%) | 68.9 | 68.5 -1% | 64.7 -6% | 66.9 -3% | 66.5 -3% | 67.2 -2% |
| Response Times | 10% | -24% | 35% | -3% | -18% | |
| Response Time Grey 50% / Grey 80% * (ms) | 13.6 ? | 12.8 ? 6% | 18.8 ? -38% | 7 ? 49% | 15.2 ? -12% | 17.6 ? -29% |
| Response Time Black / White * (ms) | 12 ? | 10.4 ? 13% | 13.2 ? -10% | 9.6 ? 20% | 11.2 ? 7% | 12.8 ? -7% |
| PWM Frequency (Hz) | 23260 ? | 23810 ? | 23580 ? | |||
| Screen | -10% | -53% | -44% | -36% | -19% | |
| Brightness middle (cd/m²) | 282.3 | 293 4% | 320.4 13% | 323.6 15% | 266 -6% | 254 -10% |
| Brightness (cd/m²) | 269 | 270 0% | 298 11% | 315 17% | 248 -8% | 262 -3% |
| Brightness Distribution (%) | 90 | 87 -3% | 85 -6% | 91 1% | 89 -1% | 89 -1% |
| Black Level * (cd/m²) | 0.32 | 0.29 9% | 0.42 -31% | 0.29 9% | 0.31 3% | 0.22 31% |
| Contrast (:1) | 882 | 1010 15% | 763 -13% | 1116 27% | 858 -3% | 1155 31% |
| Colorchecker dE 2000 * | 1.17 | 1.69 -44% | 3.21 -174% | 3.31 -183% | 2.78 -138% | 2.37 -103% |
| Colorchecker dE 2000 max. * | 3.29 | 3.37 -2% | 5.54 -68% | 5.74 -74% | 5.96 -81% | 4.71 -43% |
| Colorchecker dE 2000 calibrated * | 1.06 | 1.24 -17% | 2.36 -123% | 2.73 -158% | 0.91 14% | 1.84 -74% |
| Greyscale dE 2000 * | 1.3 | 2.3 -77% | 3.6 -177% | 2.9 -123% | 3.58 -175% | 1.58 -22% |
| Gamma | 2.2 100% | 2.3 96% | 2.27 97% | 2.29 96% | 2.46 89% | 2.48 89% |
| CCT | 6643 98% | 6758 96% | 6503 100% | 6765 96% | 7186 90% | 6785 96% |
| Color Space (Percent of AdobeRGB 1998) (%) | 63.8 | 63 -1% | 59 -8% | 59.7 -6% | 62 -3% | 60 -6% |
| Color Space (Percent of sRGB) (%) | 97.5 | 98.5 1% | 92 -6% | 91.8 -6% | 96 -2% | 92 -6% |
| Total Average (Program / Settings) | 0% /
-6% | -28% /
-40% | -4% /
-26% | -14% /
-26% | -13% /
-16% |
* ... smaller is better
Display Response Times
| ↔ Response Time Black to White | ||
|---|---|---|
| 12 ms ... rise ↗ and fall ↘ combined | ↗ 7.6 ms rise | 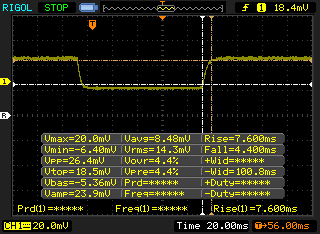 |
| ↘ 4.4 ms fall | ||
| The screen shows good response rates in our tests, but may be too slow for competitive gamers. In comparison, all tested devices range from 0.1 (minimum) to 240 (maximum) ms. » 31 % of all devices are better. This means that the measured response time is better than the average of all tested devices (19.9 ms). | ||
| ↔ Response Time 50% Grey to 80% Grey | ||
| 13.6 ms ... rise ↗ and fall ↘ combined | ↗ 8 ms rise | 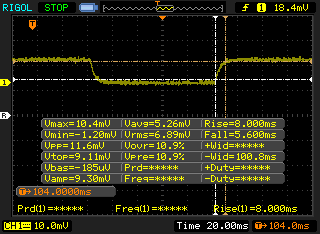 |
| ↘ 5.6 ms fall | ||
| The screen shows good response rates in our tests, but may be too slow for competitive gamers. In comparison, all tested devices range from 0.165 (minimum) to 636 (maximum) ms. » 27 % of all devices are better. This means that the measured response time is better than the average of all tested devices (31.1 ms). | ||
Screen Flickering / PWM (Pulse-Width Modulation)
| Screen flickering / PWM detected | 23260 Hz | ≤ 19 % brightness setting | 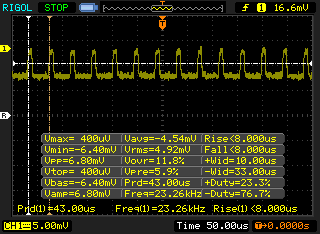 |
The display backlight flickers at 23260 Hz (worst case, e.g., utilizing PWM) Flickering detected at a brightness setting of 19 % and below. There should be no flickering or PWM above this brightness setting. The frequency of 23260 Hz is quite high, so most users sensitive to PWM should not notice any flickering. In comparison: 52 % of all tested devices do not use PWM to dim the display. If PWM was detected, an average of 7791 (minimum: 5 - maximum: 343500) Hz was measured. | |||
| Cinebench R15 | |
| CPU Single 64Bit | |
| MSI GT75 8RG-090 Titan | |
| MSI GE75 9SG | |
| Average Intel Core i7-9750H (170 - 194, n=82) | |
| Asus Zephyrus S GX502GW | |
| MSI GS65 Stealth Thin 8RE-051US | |
| MSI GS65 Stealth 9SG | |
| MSI GF63 8RC-040XPL | |
| Samsung Notebook 9 NP930QAA | |
| Acer Nitro 5 AN515-42-R6V0 | |
| MSI GF62VR 7RF-877 | |
| Asus ROG Zephyrus G15 GA502DU | |
| CPU Multi 64Bit | |
| MSI GE75 9SG | |
| MSI GT75 8RG-090 Titan | |
| MSI GS65 Stealth 9SG | |
| Asus Zephyrus S GX502GW | |
| Average Intel Core i7-9750H (952 - 1306, n=85) | |
| MSI GS65 Stealth Thin 8RE-051US | |
| MSI GF63 8RC-040XPL | |
| Asus ROG Zephyrus G15 GA502DU | |
| MSI GF62VR 7RF-877 | |
| Acer Nitro 5 AN515-42-R6V0 | |
| Samsung Notebook 9 NP930QAA | |
| Cinebench R11.5 | |
| CPU Single 64Bit | |
| MSI GT75 8RG-090 Titan | |
| MSI GE75 9SG | |
| Average Intel Core i7-9750H (1.96 - 2.19, n=10) | |
| MSI GF62VR 7RF-877 | |
| Acer Nitro 5 AN515-42-R6V0 | |
| Asus ROG Zephyrus G15 GA502DU | |
| CPU Multi 64Bit | |
| MSI GE75 9SG | |
| MSI GT75 8RG-090 Titan | |
| Average Intel Core i7-9750H (11.3 - 14.1, n=10) | |
| Asus ROG Zephyrus G15 GA502DU | |
| MSI GF62VR 7RF-877 | |
| Acer Nitro 5 AN515-42-R6V0 | |
| Cinebench R10 | |
| Rendering Multiple CPUs 32Bit | |
| MSI GE75 9SG | |
| Average Intel Core i7-9750H (28251 - 36304, n=13) | |
| MSI GF62VR 7RF-877 | |
| Asus ROG Zephyrus G15 GA502DU | |
| Rendering Single 32Bit | |
| MSI GE75 9SG | |
| Average Intel Core i7-9750H (6659 - 7214, n=13) | |
| MSI GF62VR 7RF-877 | |
| Asus ROG Zephyrus G15 GA502DU | |
| wPrime 2.10 - 1024m | |
| MSI GF63 8RC-040XPL | |
| MSI GF62VR 7RF-877 | |
| Asus ROG Zephyrus G15 GA502DU | |
| Average Intel Core i7-9750H (n=1) | |
| MSI GE75 9SG | |
* ... smaller is better
| PCMark 8 Home Score Accelerated v2 | 4454 points | |
| PCMark 8 Work Score Accelerated v2 | 5751 points | |
| PCMark 10 Score | 5725 points | |
Help | ||
| MSI GS65 Stealth 9SG Samsung SSD PM981 MZVLB512HAJQ | Razer Blade 15 RTX 2080 Max-Q Samsung SSD PM981 MZVLB512HAJQ | Lenovo Legion Y740-15ICHg Samsung SSD PM981 MZVLB256HAHQ | Asus Zephyrus S GX531GX Intel SSD 660p SSDPEKNW512G8 | MSI GS65 8RF-019DE Stealth Thin Samsung SSD PM981 MZVLB512HAJQ | Gigabyte Aero 15 Classic-XA Intel SSD 760p SSDPEKKW512G8 | |
|---|---|---|---|---|---|---|
| AS SSD | -5% | -23% | -42% | -6% | -21% | |
| Seq Read (MB/s) | 2005 | 1832 -9% | 1953 -3% | 1239 -38% | 1266 -37% | 2517 26% |
| Seq Write (MB/s) | 1580 | 1864 18% | 1629 3% | 920 -42% | 1834 16% | 924 -42% |
| 4K Read (MB/s) | 49.33 | 52.1 6% | 33.2 -33% | 45.74 -7% | 48.94 -1% | 59.1 20% |
| 4K Write (MB/s) | 103.8 | 108.3 4% | 88.1 -15% | 95.7 -8% | 107.2 3% | 126.5 22% |
| 4K-64 Read (MB/s) | 1241 | 1159 -7% | 757 -39% | 322 -74% | 1170 -6% | 876 -29% |
| 4K-64 Write (MB/s) | 1730 | 1807 4% | 1501 -13% | 722 -58% | 1760 2% | 922 -47% |
| Access Time Read * (ms) | 0.054 | 0.05 7% | 0.077 -43% | 0.073 -35% | 0.073 -35% | 0.042 22% |
| Access Time Write * (ms) | 0.036 | 0.034 6% | 0.043 -19% | 0.047 -31% | 0.035 3% | 0.065 -81% |
| Score Read (Points) | 1490 | 1394 -6% | 985 -34% | 492 -67% | 1346 -10% | 1186 -20% |
| Score Write (Points) | 1991 | 2102 6% | 1752 -12% | 910 -54% | 2051 3% | 1141 -43% |
| Score Total (Points) | 4230 | 4221 0% | 3230 -24% | 1654 -61% | 4122 -3% | 2870 -32% |
| Copy ISO MB/s (MB/s) | 3025 | 2083 -31% | 1872 -38% | 1236 -59% | 2086 -31% | |
| Copy Program MB/s (MB/s) | 713 | 496.5 -30% | 478.2 -33% | 703 -1% | 454.2 -36% | |
| Copy Game MB/s (MB/s) | 1554 | 977 -37% | 1165 -25% | 812 -48% | 1141 -27% |
* ... smaller is better

| 3DMark | |
| 1920x1080 Fire Strike Graphics | |
| MSI RTX 2080 Gaming X Trio | |
| MSI GE75 9SG | |
| Asus Zephyrus S GX531GX | |
| Average NVIDIA GeForce RTX 2080 Max-Q (18048 - 23032, n=19) | |
| HP Omen X 17-ap0xx | |
| Asus Zephyrus S GX502GW | |
| MSI GS65 Stealth 9SG | |
| Razer Blade 15 RTX 2070 Max-Q | |
| Alienware 17 R5 | |
| Aorus 15 W9 | |
| MSI GS65 8RF-019DE Stealth Thin | |
| MSI GS63VR 7RG-005 | |
| MSI GS65 Stealth Thin 8RE-051US | |
| Acer Nitro 5 AN515-42-R6V0 | |
| 2560x1440 Time Spy Graphics | |
| MSI RTX 2080 Gaming X Trio | |
| MSI GE75 9SG | |
| Asus Zephyrus S GX531GX | |
| Average NVIDIA GeForce RTX 2080 Max-Q (6464 - 8844, n=19) | |
| Asus Zephyrus S GX502GW | |
| MSI GS65 Stealth 9SG | |
| Razer Blade 15 RTX 2070 Max-Q | |
| HP Omen X 17-ap0xx | |
| Aorus 15 W9 | |
| Alienware 17 R5 | |
| MSI GS63VR 7RG-005 | |
| 2560x1440 Port Royal Graphics | |
| MSI GE75 9SG | |
| Average NVIDIA GeForce RTX 2080 Max-Q (3698 - 5295, n=19) | |
| Asus Zephyrus S GX531GX | |
| MSI GS65 Stealth 9SG | |
| Asus Zephyrus S GX502GW | |
| Razer Blade 15 RTX 2070 Max-Q | |
| Aorus 15 W9 | |
| 3DMark 11 | |
| 1280x720 Performance GPU | |
| MSI RTX 2080 Gaming X Trio | |
| MSI GE75 9SG | |
| Asus Zephyrus S GX531GX | |
| Average NVIDIA GeForce RTX 2080 Max-Q (23386 - 30910, n=20) | |
| HP Omen X 17-ap0xx | |
| MSI GS65 Stealth 9SG | |
| Asus Zephyrus S GX502GW | |
| Alienware 17 R5 | |
| Razer Blade 15 RTX 2070 Max-Q | |
| Aorus 15 W9 | |
| MSI GS65 8RF-019DE Stealth Thin | |
| MSI GS63VR 7RG-005 | |
| MSI GS65 Stealth Thin 8RE-051US | |
| Acer Nitro 5 AN515-42-R6V0 | |
| 1280x720 Performance Combined | |
| MSI GE75 9SG | |
| MSI RTX 2080 Gaming X Trio | |
| MSI GS65 Stealth 9SG | |
| Average NVIDIA GeForce RTX 2080 Max-Q (9212 - 14894, n=20) | |
| Asus Zephyrus S GX531GX | |
| Alienware 17 R5 | |
| Asus Zephyrus S GX502GW | |
| Razer Blade 15 RTX 2070 Max-Q | |
| MSI GS65 8RF-019DE Stealth Thin | |
| MSI GS65 Stealth Thin 8RE-051US | |
| HP Omen X 17-ap0xx | |
| Aorus 15 W9 | |
| MSI GS63VR 7RG-005 | |
| Acer Nitro 5 AN515-42-R6V0 | |
| 3DMark 11 Performance | 20209 points | |
| 3DMark Cloud Gate Standard Score | 37220 points | |
| 3DMark Fire Strike Score | 16598 points | |
| 3DMark Time Spy Score | 7099 points | |
Help | ||
| The Witcher 3 - 1920x1080 Ultra Graphics & Postprocessing (HBAO+) | |
| MSI RTX 2080 Gaming X Trio | |
| MSI GE75 9SG | |
| Asus Zephyrus S GX531GX | |
| Average NVIDIA GeForce RTX 2080 Max-Q (65.7 - 92.7, n=22) | |
| Asus Zephyrus S GX502GW | |
| Razer Blade 15 RTX 2070 Max-Q | |
| MSI GS65 Stealth 9SG | |
| HP Omen X 17-ap0xx | |
| Alienware 17 R5 | |
| Aorus 15 W9 | |
| MSI GS65 8RF-019DE Stealth Thin | |
| MSI GS65 Stealth Thin 8RE-051US | |
| Acer Nitro 5 AN515-42-R6V0 | |
| Shadow of the Tomb Raider - 1920x1080 Highest Preset AA:T | |
| MSI RTX 2080 Gaming X Trio | |
| MSI GE75 9SG | |
| Average NVIDIA GeForce RTX 2080 Max-Q (71 - 105, n=8) | |
| MSI GS65 Stealth 9SG | |
| Asus Zephyrus S GX502GW | |
| Acer Nitro 5 AN515-42-R6V0 | |
| low | med. | high | ultra | |
|---|---|---|---|---|
| BioShock Infinite (2013) | 306.4 | 273 | 254.1 | 156.9 |
| The Witcher 3 (2015) | 279 | 216 | 125.5 | 66.9 |
| Rise of the Tomb Raider (2016) | 223.3 | 176.7 | 139.8 | 108.6 |
| Shadow of the Tomb Raider (2018) | 133 | 102 | 97 | 84 |
| MSI GS65 Stealth 9SG GeForce RTX 2080 Max-Q, i7-9750H | Razer Blade 15 RTX 2080 Max-Q GeForce RTX 2080 Max-Q, i7-9750H | MSI GS65 8RF-019DE Stealth Thin GeForce GTX 1070 Max-Q, i7-8750H | Asus Zephyrus S GX531GX GeForce RTX 2080 Max-Q, i7-8750H | Gigabyte Aero 15 Classic-XA GeForce RTX 2070 Max-Q, i7-9750H | MSI GE75 9SG GeForce RTX 2080 Mobile, i9-9880H | |
|---|---|---|---|---|---|---|
| Noise | 7% | -0% | -8% | -12% | -4% | |
| off / environment * (dB) | 28.3 | 28.3 -0% | 30 -6% | 28.7 -1% | 30 -6% | 28.2 -0% |
| Idle Minimum * (dB) | 30.4 | 28.8 5% | 30 1% | 29.8 2% | 31 -2% | 30.4 -0% |
| Idle Average * (dB) | 30.5 | 28.8 6% | 31 -2% | 32.4 -6% | 34 -11% | 30.4 -0% |
| Idle Maximum * (dB) | 30.6 | 29 5% | 34 -11% | 38 -24% | 39 -27% | 33.4 -9% |
| Load Average * (dB) | 37.6 | 33.5 11% | 43 -14% | 38.2 -2% | 46 -22% | 37.1 1% |
| Witcher 3 ultra * (dB) | 46 | 45 2% | 42 9% | 56.6 -23% | 53 -15% | 54.2 -18% |
| Load Maximum * (dB) | 55.1 | 45.2 18% | 44 20% | 56.6 -3% | 55 -0% | 56.4 -2% |
* ... smaller is better
Noise level
| Idle |
| 30.4 / 30.5 / 30.6 dB(A) |
| Load |
| 37.6 / 55.1 dB(A) |
 | ||
30 dB silent 40 dB(A) audible 50 dB(A) loud |
||
min: | ||
(-) The maximum temperature on the upper side is 45.6 °C / 114 F, compared to the average of 40.4 °C / 105 F, ranging from 21.2 to 68.8 °C for the class Gaming.
(-) The bottom heats up to a maximum of 53.8 °C / 129 F, compared to the average of 43.2 °C / 110 F
(+) In idle usage, the average temperature for the upper side is 27.1 °C / 81 F, compared to the device average of 33.9 °C / 93 F.
(±) Playing The Witcher 3, the average temperature for the upper side is 35.2 °C / 95 F, compared to the device average of 33.9 °C / 93 F.
(+) The palmrests and touchpad are cooler than skin temperature with a maximum of 29 °C / 84.2 F and are therefore cool to the touch.
(±) The average temperature of the palmrest area of similar devices was 28.8 °C / 83.8 F (-0.2 °C / -0.4 F).
MSI GS65 Stealth 9SG audio analysis
(+) | speakers can play relatively loud (89.4 dB)
Bass 100 - 315 Hz
(-) | nearly no bass - on average 22.7% lower than median
(±) | linearity of bass is average (9% delta to prev. frequency)
Mids 400 - 2000 Hz
(±) | higher mids - on average 7% higher than median
(+) | mids are linear (6.4% delta to prev. frequency)
Highs 2 - 16 kHz
(+) | balanced highs - only 2.7% away from median
(±) | linearity of highs is average (10.6% delta to prev. frequency)
Overall 100 - 16.000 Hz
(±) | linearity of overall sound is average (23.1% difference to median)
Compared to same class
» 84% of all tested devices in this class were better, 5% similar, 12% worse
» The best had a delta of 6%, average was 18%, worst was 132%
Compared to all devices tested
» 69% of all tested devices were better, 5% similar, 26% worse
» The best had a delta of 4%, average was 24%, worst was 134%
Apple MacBook 12 (Early 2016) 1.1 GHz audio analysis
(+) | speakers can play relatively loud (83.6 dB)
Bass 100 - 315 Hz
(±) | reduced bass - on average 11.3% lower than median
(±) | linearity of bass is average (14.2% delta to prev. frequency)
Mids 400 - 2000 Hz
(+) | balanced mids - only 2.4% away from median
(+) | mids are linear (5.5% delta to prev. frequency)
Highs 2 - 16 kHz
(+) | balanced highs - only 2% away from median
(+) | highs are linear (4.5% delta to prev. frequency)
Overall 100 - 16.000 Hz
(+) | overall sound is linear (10.2% difference to median)
Compared to same class
» 7% of all tested devices in this class were better, 2% similar, 91% worse
» The best had a delta of 5%, average was 18%, worst was 53%
Compared to all devices tested
» 5% of all tested devices were better, 1% similar, 94% worse
» The best had a delta of 4%, average was 24%, worst was 134%
| Off / Standby | |
| Idle | |
| Load |
|
Key:
min: | |
| MSI GS65 Stealth 9SG i7-9750H, GeForce RTX 2080 Max-Q, Samsung SSD PM981 MZVLB512HAJQ, IPS, 1920x1080, 15.6" | Razer Blade 15 RTX 2080 Max-Q i7-9750H, GeForce RTX 2080 Max-Q, Samsung SSD PM981 MZVLB512HAJQ, IPS, 1920x1080, 15.6" | MSI GS65 8RF-019DE Stealth Thin i7-8750H, GeForce GTX 1070 Max-Q, Samsung SSD PM981 MZVLB512HAJQ, IPS, 1920x1080, 15.6" | Lenovo Legion Y740-15ICHg i7-8750H, GeForce RTX 2070 Max-Q, Samsung SSD PM981 MZVLB256HAHQ, IPS, 1920x1080, 15.6" | Aorus 15 W9 i7-8750H, GeForce RTX 2060 Mobile, Intel SSD 760p SSDPEKKW512G8, IPS, 1920x1080, 15.6" | MSI GE75 9SG i9-9880H, GeForce RTX 2080 Mobile, Samsung SSD PM981 MZVLB1T0HALR, AHVA, 1920x1080, 17.3" | |
|---|---|---|---|---|---|---|
| Power Consumption | 14% | 27% | -2% | 7% | -10% | |
| Idle Minimum * (Watt) | 18.3 | 12.5 32% | 7 62% | 22.9 -25% | 18 2% | 13.9 24% |
| Idle Average * (Watt) | 22 | 15.3 30% | 11 50% | 27.2 -24% | 20 9% | 18.8 15% |
| Idle Maximum * (Watt) | 28.8 | 20.7 28% | 20 31% | 27.5 5% | 28 3% | 23.1 20% |
| Load Average * (Watt) | 93 | 90.2 3% | 98 -5% | 83.4 10% | 87 6% | 112.3 -21% |
| Witcher 3 ultra * (Watt) | 142.6 | 162 -14% | 132 7% | 143.6 -1% | 135 5% | 231 -62% |
| Load Maximum * (Watt) | 215.9 | 209.3 3% | 182 16% | 160.5 26% | 175 19% | 291.5 -35% |
* ... smaller is better
| MSI GS65 Stealth 9SG i7-9750H, GeForce RTX 2080 Max-Q, 82 Wh | Razer Blade 15 RTX 2080 Max-Q i7-9750H, GeForce RTX 2080 Max-Q, 80 Wh | Lenovo Legion Y740-15ICHg i7-8750H, GeForce RTX 2070 Max-Q, 57 Wh | Alienware m15 GTX 1070 Max-Q i7-8750H, GeForce GTX 1070 Max-Q, 90 Wh | MSI GS65 8RF-019DE Stealth Thin i7-8750H, GeForce GTX 1070 Max-Q, 82 Wh | Asus Zephyrus S GX531GX i7-8750H, GeForce RTX 2080 Max-Q, 50 Wh | |
|---|---|---|---|---|---|---|
| Battery runtime | 10% | -53% | 28% | 0% | -50% | |
| WiFi v1.3 (h) | 6 | 6.6 10% | 2.8 -53% | 7.7 28% | 6 0% | 3 -50% |
| Reader / Idle (h) | 15.9 | 3.9 | 10.5 | 8.5 | ||
| Load (h) | 1.7 | 0.8 | 1.7 | 1.4 |
Pros
Cons

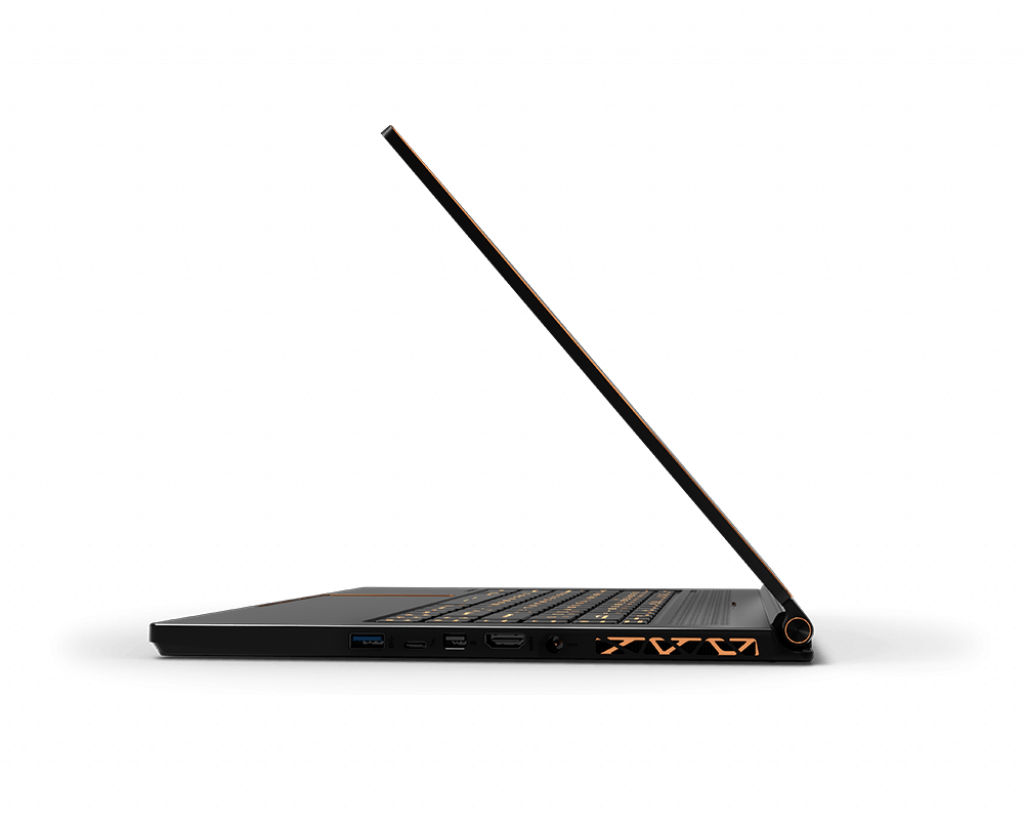
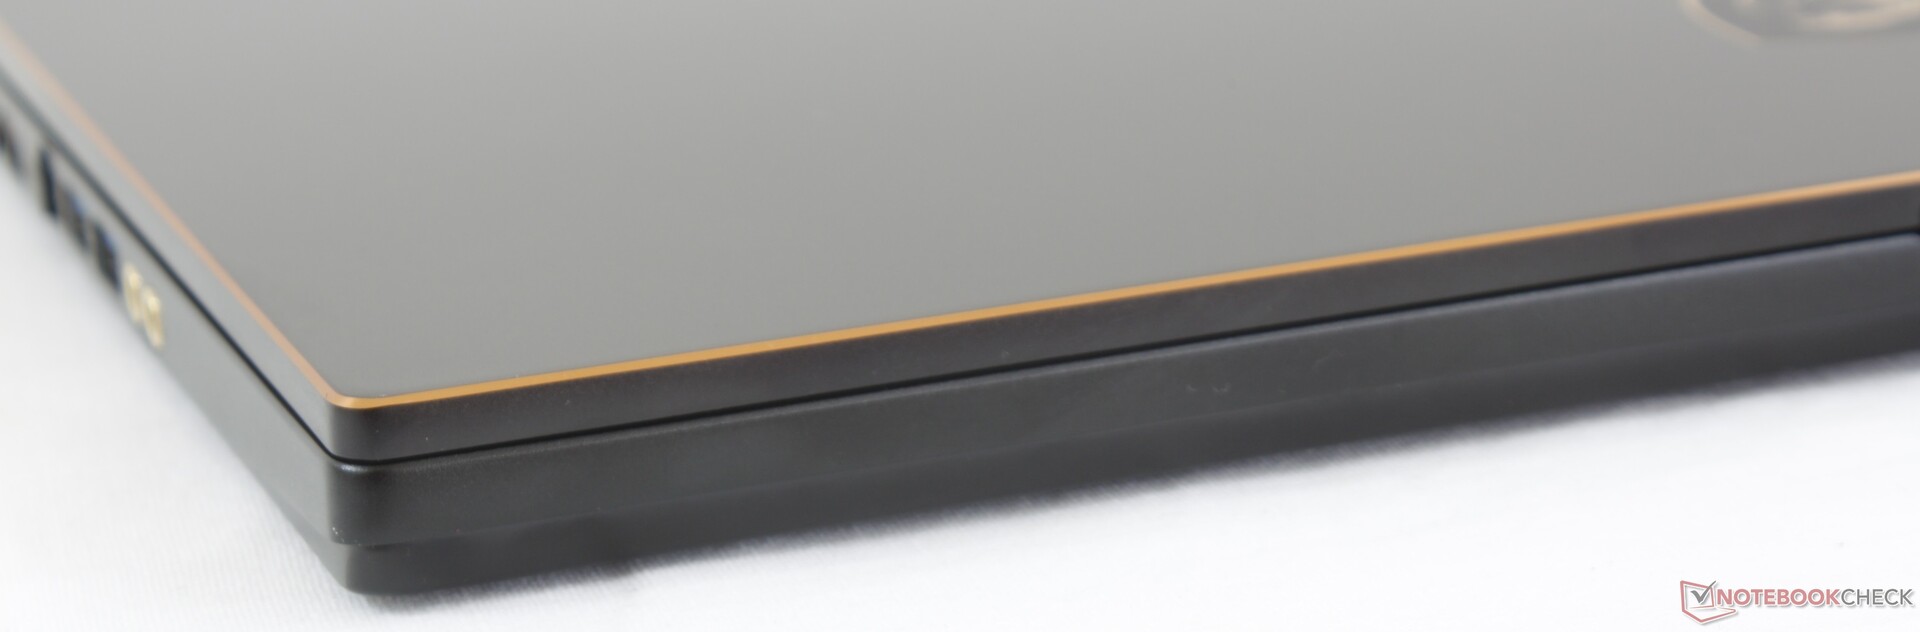
如果您想获得GS65的最佳游戏体验,那么毫无疑问,带有RTX 2080 Max-Q的240 Hz型号是最强的。我们过去对GS65赞扬和批评的一切仍然适用于2019年的最新版本,包括轻量化设计,难以维护,可靠的续航时间和平庸的机身刚性。
然而,为了获得最佳性价比,240 Hz屏幕和RTX 2080 Max-Q GPU的组合可能不是最佳选择。标配的144 Hz面板和240 Hz面板之间的差异很难被感觉到,而RTX 2080 Max-Q仅比RTX 2070 Max-Q性能强快8%。使用144 Hz,RTX 2070 Max-Q和i7-8750H SKU可以节省近900美元,而不会牺牲太多游戏性能。
RTX 2080 Max-Q比RTX 2070 Max-Q强了不到10%,而且它们之间的差价约为500美元。如果您想从GS65系列获得最强的GPU性能,那么这是一个很高的代价。
MSI GS65 Stealth 9SG
- 09/20/2019 v7 (old)
Allen Ngo
Price comparison

