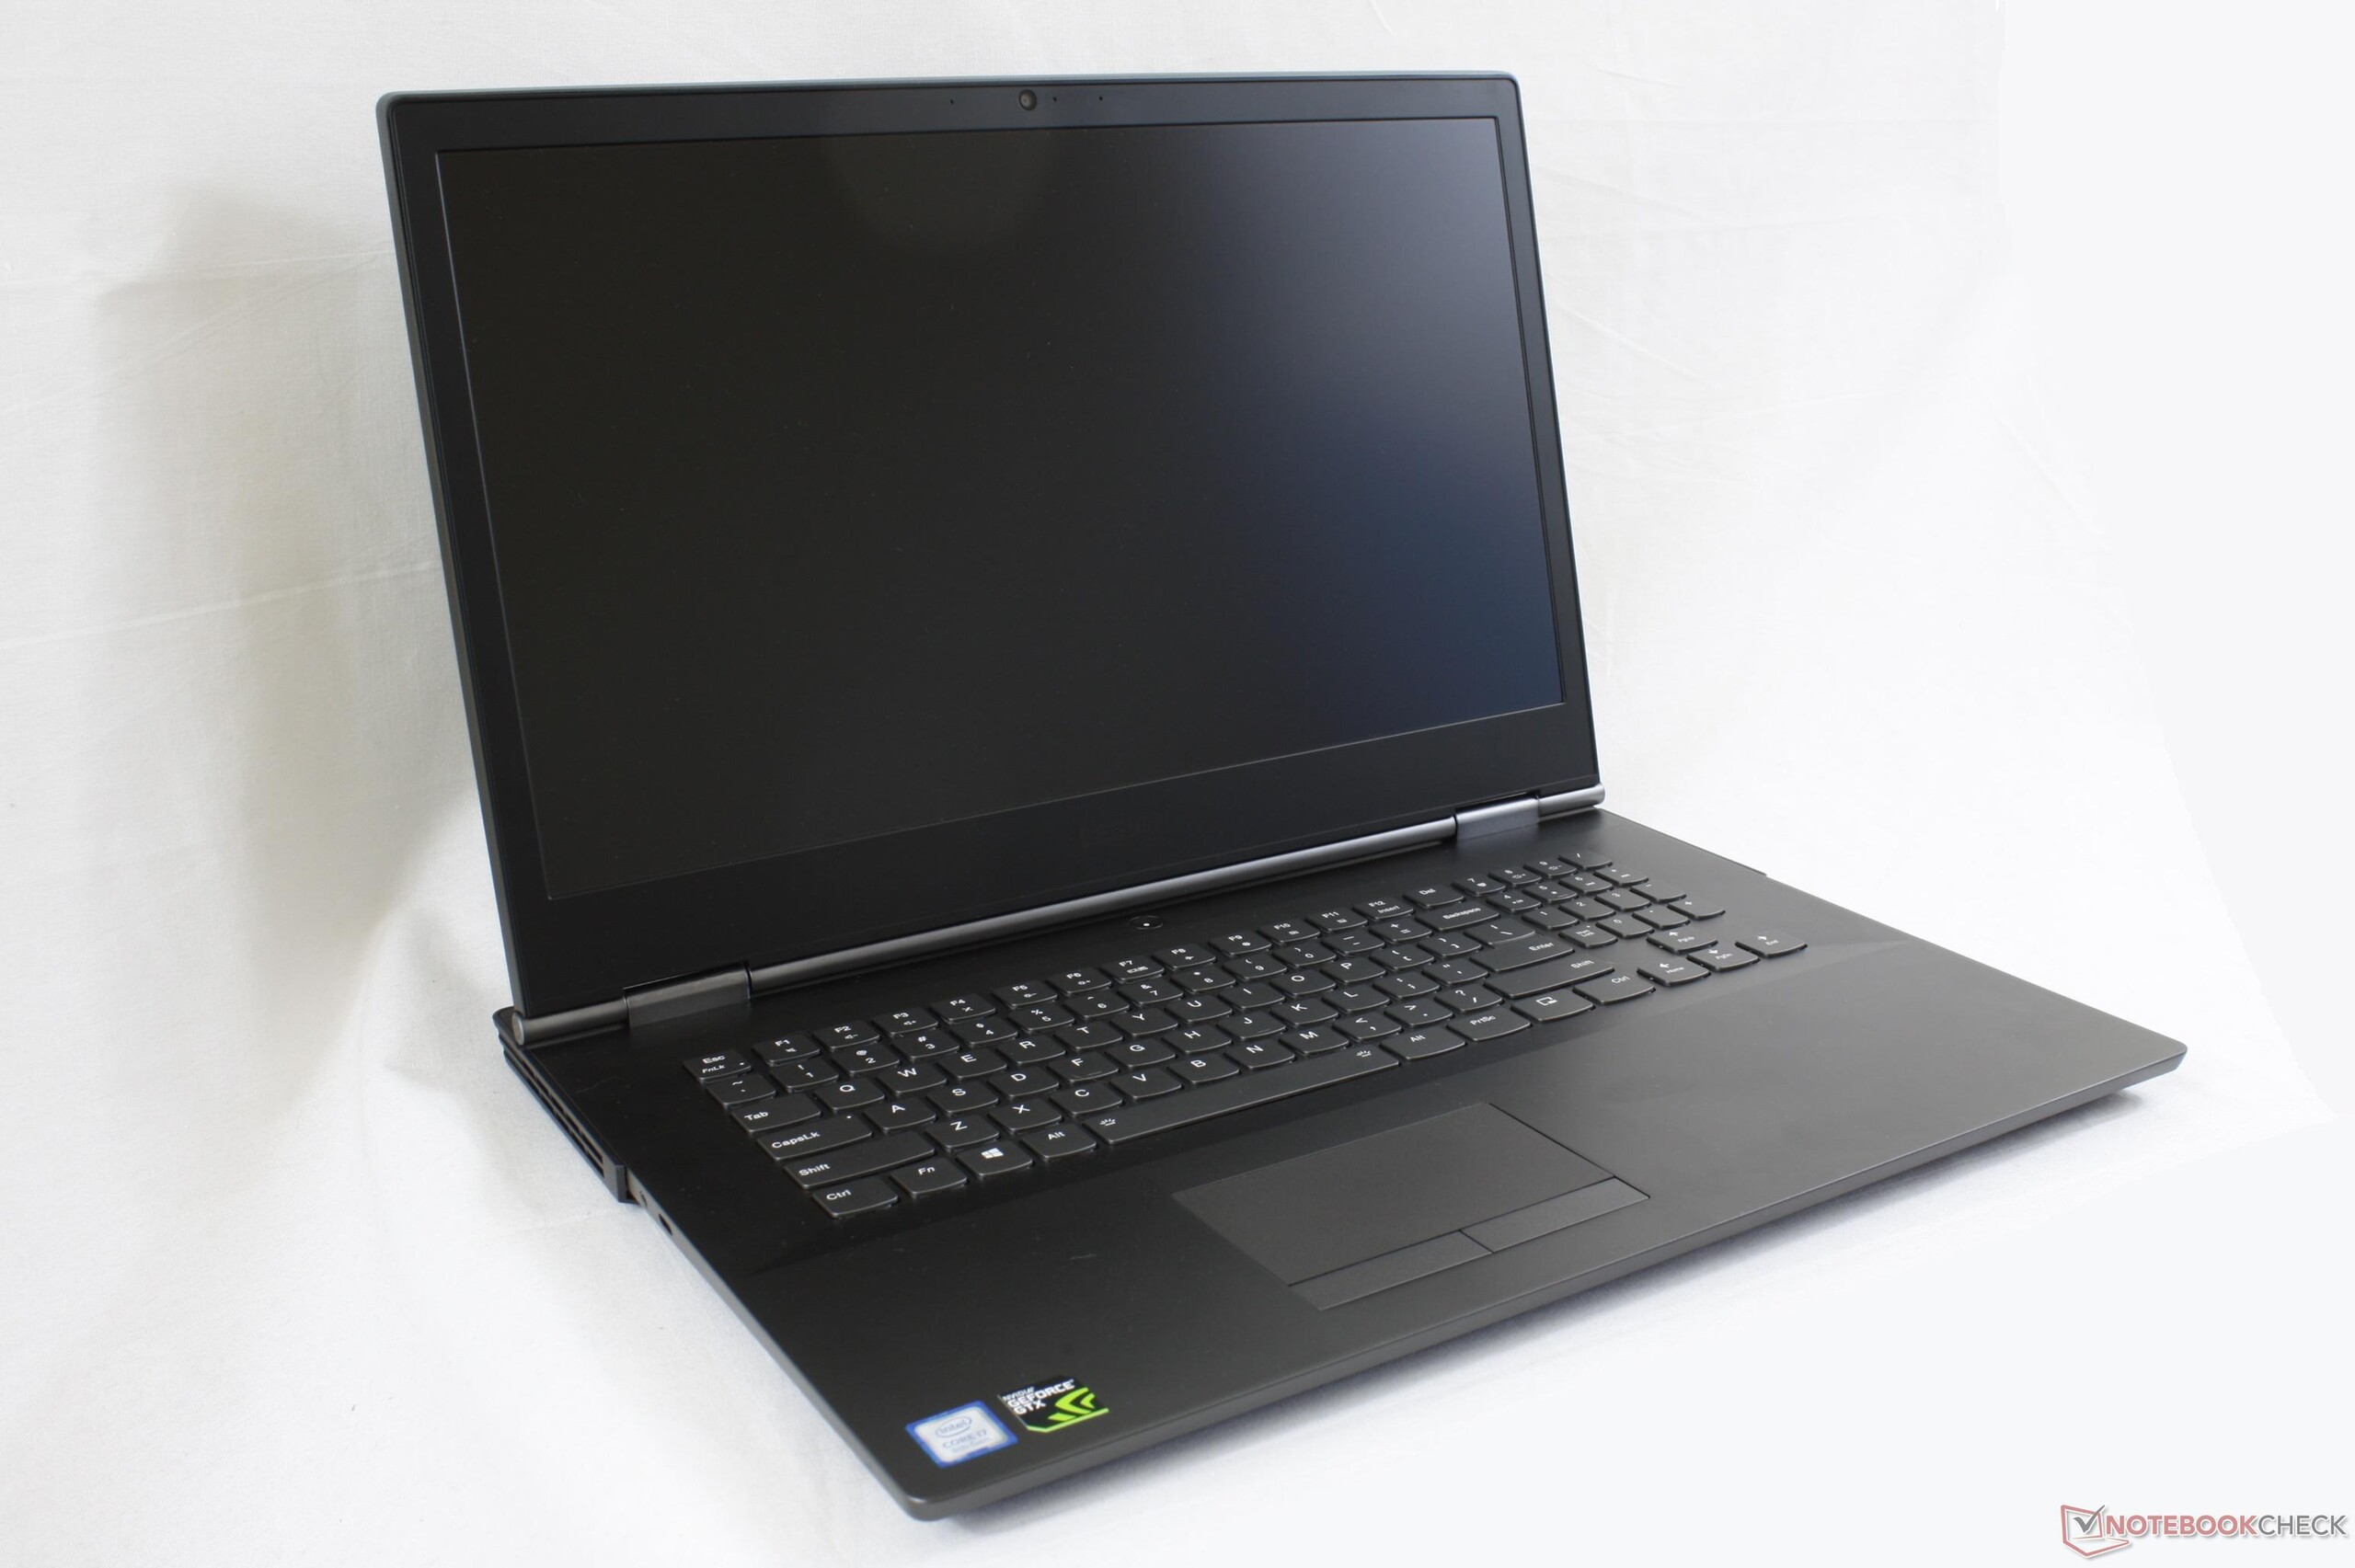
联想Legion Y740-17ICH (i7-8750H, RTX 2080 Max-Q) 笔记本电脑评测
| Networking | |
| iperf3 transmit AX12 | |
| MSI GE75 8SG Raider | |
| Lenovo Legion Y740-17ICH | |
| Alienware 17 R5 | |
| Razer Blade Pro 2017 | |
| Asus ROG Strix Scar II GL704GW | |
| iperf3 receive AX12 | |
| MSI GE75 8SG Raider | |
| Razer Blade Pro 2017 | |
| Alienware 17 R5 | |
| Lenovo Legion Y740-17ICH | |
| Asus ROG Strix Scar II GL704GW | |
| |||||||||||||||||||||||||
Brightness Distribution: 81 %
Center on Battery: 299.1 cd/m²
Contrast: 1108:1 (Black: 0.27 cd/m²)
ΔE ColorChecker Calman: 5.07 | ∀{0.5-29.43 Ø4.73}
calibrated: 3.31
ΔE Greyscale Calman: 6.8 | ∀{0.09-98 Ø4.97}
89.9% sRGB (Argyll 1.6.3 3D)
58.5% AdobeRGB 1998 (Argyll 1.6.3 3D)
64.8% AdobeRGB 1998 (Argyll 3D)
90.4% sRGB (Argyll 3D)
64% Display P3 (Argyll 3D)
Gamma: 2.46
CCT: 7805 K
| Lenovo Legion Y740-17ICH AU Optronics B173HAN03.2, IPS, 17.3", 1920x1080 | Asus ROG Strix Scar II GL704GW B173HAN04.0 (AUO409D), AHVA, 17.3", 1920x1080 | Razer Blade Pro 2017 Sharp LQ173D1JW33 (SHP145A), IGZO, 17.3", 3840x2160 | MSI GE75 8SG Raider CMN N173HCE-G33 (CMN175C), AHVA, 17.3", 1920x1080 | Alienware 17 R5 JYWWF_B173QTN (AUO1496), TN, 17.3", 2560x1440 | Lenovo Legion Y730-17ICH, i7-8750H LP173WF4-SPF6, IPS, 17.3", 1920x1080 | |
|---|---|---|---|---|---|---|
| Display | -3% | 35% | -2% | -3% | -2% | |
| Display P3 Coverage (%) | 64 | 62.9 -2% | 88.9 39% | 60.6 -5% | 63.4 -1% | 66.4 4% |
| sRGB Coverage (%) | 90.4 | 87.1 -4% | 100 11% | 91.2 1% | 86.1 -5% | 84.9 -6% |
| AdobeRGB 1998 Coverage (%) | 64.8 | 63.7 -2% | 99.7 54% | 62.6 -3% | 62.9 -3% | 62.1 -4% |
| Response Times | 0% | -245% | 39% | 10% | -112% | |
| Response Time Grey 50% / Grey 80% * (ms) | 15.6 ? | 17.6 ? -13% | 60.8 ? -290% | 8 ? 49% | 20.8 ? -33% | 36.8 ? -136% |
| Response Time Black / White * (ms) | 12.8 ? | 11.2 ? 13% | 38.4 ? -200% | 9.2 ? 28% | 6 ? 53% | 24 ? -88% |
| PWM Frequency (Hz) | 204.9 ? | 26040 ? | ||||
| Screen | 19% | 7% | 24% | -1% | -8% | |
| Brightness middle (cd/m²) | 299.1 | 295 -1% | 230 -23% | 363 21% | 398 33% | 328.7 10% |
| Brightness (cd/m²) | 273 | 291 7% | 207 -24% | 342 25% | 367 34% | 318 16% |
| Brightness Distribution (%) | 81 | 96 19% | 83 2% | 86 6% | 86 6% | 91 12% |
| Black Level * (cd/m²) | 0.27 | 0.24 11% | 0.2 26% | 0.27 -0% | 0.51 -89% | 0.51 -89% |
| Contrast (:1) | 1108 | 1229 11% | 1150 4% | 1344 21% | 780 -30% | 645 -42% |
| Colorchecker dE 2000 * | 5.07 | 3.2 37% | 5.62 -11% | 2.29 55% | 5.45 -7% | 4.91 3% |
| Colorchecker dE 2000 max. * | 10.55 | 6.64 37% | 10.24 3% | 4.54 57% | 10.36 2% | 10.15 4% |
| Colorchecker dE 2000 calibrated * | 3.31 | 2.52 24% | 2.45 26% | 2.56 23% | 4.27 -29% | |
| Greyscale dE 2000 * | 6.8 | 2.16 68% | 4.54 33% | 3.02 56% | 5.4 21% | 3.9 43% |
| Gamma | 2.46 89% | 2.46 89% | 2.36 93% | 2.38 92% | 2.4 92% | 2.13 103% |
| CCT | 7805 83% | 6872 95% | 6625 98% | 7048 92% | 7453 87% | 6911 94% |
| Color Space (Percent of AdobeRGB 1998) (%) | 58.5 | 57 -3% | 88 50% | 58 -1% | 56 -4% | 55.6 -5% |
| Color Space (Percent of sRGB) (%) | 89.9 | 87 -3% | 100 11% | 91 1% | 86 -4% | 84.7 -6% |
| Total Average (Program / Settings) | 5% /
12% | -68% /
-21% | 20% /
21% | 2% /
-0% | -41% /
-20% |
* ... smaller is better
Display Response Times
| ↔ Response Time Black to White | ||
|---|---|---|
| 12.8 ms ... rise ↗ and fall ↘ combined | ↗ 7.6 ms rise | 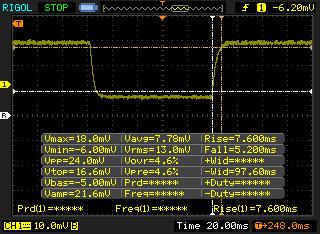 |
| ↘ 5.2 ms fall | ||
| The screen shows good response rates in our tests, but may be too slow for competitive gamers. In comparison, all tested devices range from 0.1 (minimum) to 240 (maximum) ms. » 33 % of all devices are better. This means that the measured response time is better than the average of all tested devices (19.9 ms). | ||
| ↔ Response Time 50% Grey to 80% Grey | ||
| 15.6 ms ... rise ↗ and fall ↘ combined | ↗ 8 ms rise | 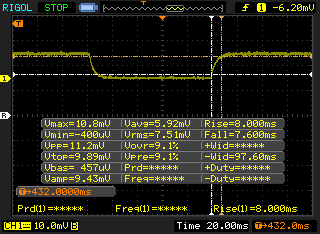 |
| ↘ 7.6 ms fall | ||
| The screen shows good response rates in our tests, but may be too slow for competitive gamers. In comparison, all tested devices range from 0.165 (minimum) to 636 (maximum) ms. » 30 % of all devices are better. This means that the measured response time is better than the average of all tested devices (31.1 ms). | ||
Screen Flickering / PWM (Pulse-Width Modulation)
| Screen flickering / PWM not detected | 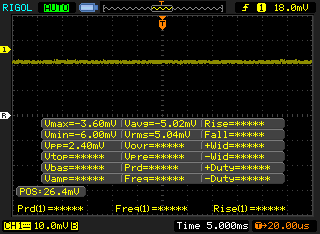 | ||
In comparison: 52 % of all tested devices do not use PWM to dim the display. If PWM was detected, an average of 7798 (minimum: 5 - maximum: 343500) Hz was measured. | |||
| Cinebench R15 | |
| CPU Single 64Bit | |
| Intel Core i7-9700K, AMD Radeon RX Vega 64 | |
| Dell XPS 15 9570 Core i9 UHD | |
| Lenovo Legion Y730-17ICH, i7-8750H | |
| Alienware m15 GTX 1070 Max-Q | |
| Average Intel Core i7-8750H (163 - 177, n=86) | |
| Lenovo ThinkPad X1 Carbon 2018-20KGS5DU00 | |
| Lenovo Legion Y740-17ICH | |
| Lenovo Legion Y730-15ICH i5-8300H | |
| Lenovo Ideapad 720S-15IKB 81AC001AGE | |
| Acer Nitro 5 AN515-42-R6V0 | |
| CPU Multi 64Bit | |
| Intel Core i7-9700K, AMD Radeon RX Vega 64 | |
| Lenovo Legion Y740-17ICH | |
| Lenovo Legion Y730-17ICH, i7-8750H | |
| Dell XPS 15 9570 Core i9 UHD | |
| Alienware m15 GTX 1070 Max-Q | |
| Average Intel Core i7-8750H (863 - 1251, n=93) | |
| Lenovo Legion Y730-15ICH i5-8300H | |
| Lenovo Ideapad 720S-15IKB 81AC001AGE | |
| Acer Nitro 5 AN515-42-R6V0 | |
| Lenovo ThinkPad X1 Carbon 2018-20KGS5DU00 | |
| PCMark 8 Home Score Accelerated v2 | 5107 points | |
| PCMark 8 Work Score Accelerated v2 | 5882 points | |
| PCMark 10 Score | 6053 points | |
Help | ||
| Lenovo Legion Y740-17ICH Samsung SSD PM981 MZVLB256HAHQ | Asus ROG Strix Scar II GL704GW Intel SSD 660p SSDPEKNW512G8 | Razer Blade Pro 2017 2x Samsung SSD PM951 MZVLV256HCHP (RAID 0) | Alienware 17 R5 SK hynix PC401 HFS256GD9TNG | HP Omen X 17-ap0xx Samsung PM961 MZVLW256HEHP | |
|---|---|---|---|---|---|
| AS SSD | -21% | 11% | -29% | 13% | |
| Seq Read (MB/s) | 1153 | 1315 14% | 2599 125% | 2203 91% | 2352 104% |
| Seq Write (MB/s) | 1328 | 927 -30% | 588 -56% | 559 -58% | 1145 -14% |
| 4K Read (MB/s) | 35.05 | 52.4 50% | 37.57 7% | 38.74 11% | 44.81 28% |
| 4K Write (MB/s) | 96 | 122.8 28% | 104.4 9% | 92.7 -3% | 116.2 21% |
| 4K-64 Read (MB/s) | 727 | 326.5 -55% | 1116 54% | 447.2 -38% | 967 33% |
| 4K-64 Write (MB/s) | 1212 | 727 -40% | 513 -58% | 279.1 -77% | 798 -34% |
| Access Time Read * (ms) | 0.063 | 0.11 -75% | 0.051 19% | 0.091 -44% | 0.05 21% |
| Access Time Write * (ms) | 0.04 | 0.045 -13% | 0.036 10% | 0.065 -63% | 0.032 20% |
| Score Read (Points) | 878 | 510 -42% | 1414 61% | 706 -20% | 1248 42% |
| Score Write (Points) | 1441 | 942 -35% | 676 -53% | 428 -70% | 1029 -29% |
| Score Total (Points) | 2784 | 1715 -38% | 2715 -2% | 1424 -49% | 2862 3% |
| Copy ISO MB/s (MB/s) | 1487 | 1834 23% | |||
| Copy Program MB/s (MB/s) | 608 | 492.1 -19% | |||
| Copy Game MB/s (MB/s) | 1162 | 983 -15% |
* ... smaller is better

| 3DMark 11 Performance | 20177 points | |
| 3DMark Cloud Gate Standard Score | 37537 points | |
| 3DMark Fire Strike Score | 16302 points | |
| 3DMark Fire Strike Extreme Score | 8104 points | |
| 3DMark Time Spy Score | 7153 points | |
Help | ||
| The Witcher 3 - 1920x1080 Ultra Graphics & Postprocessing (HBAO+) | |
| Asus ROG G703GX | |
| MSI GS75 8SG Stealth | |
| Lenovo Legion Y740-17ICH | |
| Asus ROG Strix Scar II GL704GW | |
| Razer Blade 15 RTX 2070 Max-Q | |
| HP Omen X 17-ap0xx | |
| Alienware 17 R5 | |
| Alienware m15 GTX 1070 Max-Q | |
| Lenovo Legion Y730-17ICH, i7-8750H | |
| Acer Nitro 5 AN515-42-R6V0 | |
| low | med. | high | ultra | |
|---|---|---|---|---|
| BioShock Infinite (2013) | 316.8 | 283.4 | 239.6 | 161.5 |
| The Witcher 3 (2015) | 305.4 | 222.4 | 144.2 | 73.1 |
| Rise of the Tomb Raider (2016) | 253.4 | 182.8 | 138.8 | 109 |
| Lenovo Legion Y740-17ICH GeForce RTX 2080 Max-Q, i7-8750H, Samsung SSD PM981 MZVLB256HAHQ | Asus ROG Strix Scar II GL704GW GeForce RTX 2070 Mobile, i7-8750H, Intel SSD 660p SSDPEKNW512G8 | Razer Blade Pro 2017 GeForce GTX 1080 Mobile, i7-7820HK, 2x Samsung SSD PM951 MZVLV256HCHP (RAID 0) | MSI GE75 8SG Raider GeForce RTX 2080 Mobile, i7-8750H, Kingston RBUSNS8154P3512GJ | Alienware 17 R5 GeForce GTX 1070 Mobile, i7-8750H, SK hynix PC401 HFS256GD9TNG | Lenovo Legion Y730-17ICH, i7-8750H GeForce GTX 1050 Ti Mobile, i7-8750H, Toshiba KBG30ZMT128G | |
|---|---|---|---|---|---|---|
| Noise | -14% | -13% | -18% | -12% | 3% | |
| off / environment * (dB) | 28.3 | 29 -2% | 30 -6% | 30 -6% | 30 -6% | 28 1% |
| Idle Minimum * (dB) | 31.5 | 29 8% | 30 5% | 30 5% | 32 -2% | 28 11% |
| Idle Average * (dB) | 31.6 | 32 -1% | 31 2% | 34 -8% | 33 -4% | 28 11% |
| Idle Maximum * (dB) | 31.6 | 40 -27% | 33 -4% | 37 -17% | 34 -8% | 31.3 1% |
| Load Average * (dB) | 32.3 | 46 -42% | 43 -33% | 52 -61% | 43 -33% | 33.4 -3% |
| Witcher 3 ultra * (dB) | 43 | 51 -19% | 55 -28% | 53 -23% | 51 -19% | 42.8 -0% |
| Load Maximum * (dB) | 45.5 | 52 -14% | 58 -27% | 54 -19% | 51 -12% | 46.2 -2% |
* ... smaller is better
Noise level
| Idle |
| 31.5 / 31.6 / 31.6 dB(A) |
| HDD |
| 31.6 dB(A) |
| Load |
| 32.3 / 45.5 dB(A) |
 | ||
30 dB silent 40 dB(A) audible 50 dB(A) loud |
||
min: | ||
(+) The maximum temperature on the upper side is 38.6 °C / 101 F, compared to the average of 40.4 °C / 105 F, ranging from 21.2 to 68.8 °C for the class Gaming.
(±) The bottom heats up to a maximum of 43.6 °C / 110 F, compared to the average of 43.2 °C / 110 F
(+) In idle usage, the average temperature for the upper side is 26.1 °C / 79 F, compared to the device average of 33.9 °C / 93 F.
(+) Playing The Witcher 3, the average temperature for the upper side is 29.6 °C / 85 F, compared to the device average of 33.9 °C / 93 F.
(+) The palmrests and touchpad are cooler than skin temperature with a maximum of 27 °C / 80.6 F and are therefore cool to the touch.
(±) The average temperature of the palmrest area of similar devices was 28.8 °C / 83.8 F (+1.8 °C / 3.2 F).
Lenovo Legion Y740-17ICH audio analysis
(±) | speaker loudness is average but good (74.3 dB)
Bass 100 - 315 Hz
(-) | nearly no bass - on average 21.1% lower than median
(-) | bass is not linear (16.5% delta to prev. frequency)
Mids 400 - 2000 Hz
(+) | balanced mids - only 3.3% away from median
(±) | linearity of mids is average (9.7% delta to prev. frequency)
Highs 2 - 16 kHz
(+) | balanced highs - only 1.7% away from median
(+) | highs are linear (4.6% delta to prev. frequency)
Overall 100 - 16.000 Hz
(±) | linearity of overall sound is average (23.4% difference to median)
Compared to same class
» 85% of all tested devices in this class were better, 5% similar, 11% worse
» The best had a delta of 6%, average was 18%, worst was 132%
Compared to all devices tested
» 70% of all tested devices were better, 6% similar, 24% worse
» The best had a delta of 4%, average was 24%, worst was 134%
Apple MacBook 12 (Early 2016) 1.1 GHz audio analysis
(+) | speakers can play relatively loud (83.6 dB)
Bass 100 - 315 Hz
(±) | reduced bass - on average 11.3% lower than median
(±) | linearity of bass is average (14.2% delta to prev. frequency)
Mids 400 - 2000 Hz
(+) | balanced mids - only 2.4% away from median
(+) | mids are linear (5.5% delta to prev. frequency)
Highs 2 - 16 kHz
(+) | balanced highs - only 2% away from median
(+) | highs are linear (4.5% delta to prev. frequency)
Overall 100 - 16.000 Hz
(+) | overall sound is linear (10.2% difference to median)
Compared to same class
» 7% of all tested devices in this class were better, 2% similar, 91% worse
» The best had a delta of 5%, average was 18%, worst was 53%
Compared to all devices tested
» 5% of all tested devices were better, 1% similar, 94% worse
» The best had a delta of 4%, average was 24%, worst was 134%
| Off / Standby | |
| Idle | |
| Load |
|
Key:
min: | |
| Lenovo Legion Y740-17ICH i7-8750H, GeForce RTX 2080 Max-Q, Samsung SSD PM981 MZVLB256HAHQ, IPS, 1920x1080, 17.3" | Asus ROG Strix Scar II GL704GW i7-8750H, GeForce RTX 2070 Mobile, Intel SSD 660p SSDPEKNW512G8, AHVA, 1920x1080, 17.3" | Razer Blade Pro 2017 i7-7820HK, GeForce GTX 1080 Mobile, 2x Samsung SSD PM951 MZVLV256HCHP (RAID 0), IGZO, 3840x2160, 17.3" | MSI GE75 8SG Raider i7-8750H, GeForce RTX 2080 Mobile, Kingston RBUSNS8154P3512GJ, AHVA, 1920x1080, 17.3" | Alienware 17 R5 i7-8750H, GeForce GTX 1070 Mobile, SK hynix PC401 HFS256GD9TNG, TN, 2560x1440, 17.3" | Lenovo Legion Y730-17ICH, i7-8750H i7-8750H, GeForce GTX 1050 Ti Mobile, Toshiba KBG30ZMT128G, IPS, 1920x1080, 17.3" | |
|---|---|---|---|---|---|---|
| Power Consumption | -9% | -42% | 7% | -29% | 41% | |
| Idle Minimum * (Watt) | 20.2 | 19 6% | 31 -53% | 7 65% | 28 -39% | 6.3 69% |
| Idle Average * (Watt) | 27.2 | 22 19% | 36 -32% | 15 45% | 32 -18% | 11 60% |
| Idle Maximum * (Watt) | 28.7 | 29 -1% | 44 -53% | 22 23% | 37 -29% | 11.5 60% |
| Load Average * (Watt) | 90.8 | 102 -12% | 107 -18% | 92 -1% | 112 -23% | 89.8 1% |
| Witcher 3 ultra * (Watt) | 152.1 | 190 -25% | 212 -39% | 207 -36% | 192 -26% | 102 33% |
| Load Maximum * (Watt) | 165.4 | 231 -40% | 258 -56% | 254 -54% | 231 -40% | 130.7 21% |
* ... smaller is better
| Lenovo Legion Y740-17ICH i7-8750H, GeForce RTX 2080 Max-Q, 76 Wh | Asus ROG Strix Scar II GL704GW i7-8750H, GeForce RTX 2070 Mobile, 66 Wh | Razer Blade Pro 2017 i7-7820HK, GeForce GTX 1080 Mobile, 99 Wh | MSI GE75 8SG Raider i7-8750H, GeForce RTX 2080 Mobile, 65 Wh | Alienware 17 R5 i7-8750H, GeForce GTX 1070 Mobile, 99 Wh | Lenovo Legion Y730-17ICH, i7-8750H i7-8750H, GeForce GTX 1050 Ti Mobile, 76 Wh | |
|---|---|---|---|---|---|---|
| Battery runtime | 22% | 3% | 47% | 13% | 109% | |
| WiFi v1.3 (h) | 3.2 | 3.9 22% | 3.3 3% | 4.7 47% | 3.6 13% | 6.7 109% |
| Reader / Idle (h) | 6.2 | 4.2 | 7.8 | 4.5 | 13.2 | |
| Witcher 3 ultra (h) | 0.9 | 0.8 | ||||
| Load (h) | 1.1 | 1.4 | 0.9 | 1.1 | 0.9 |
Pros
Cons
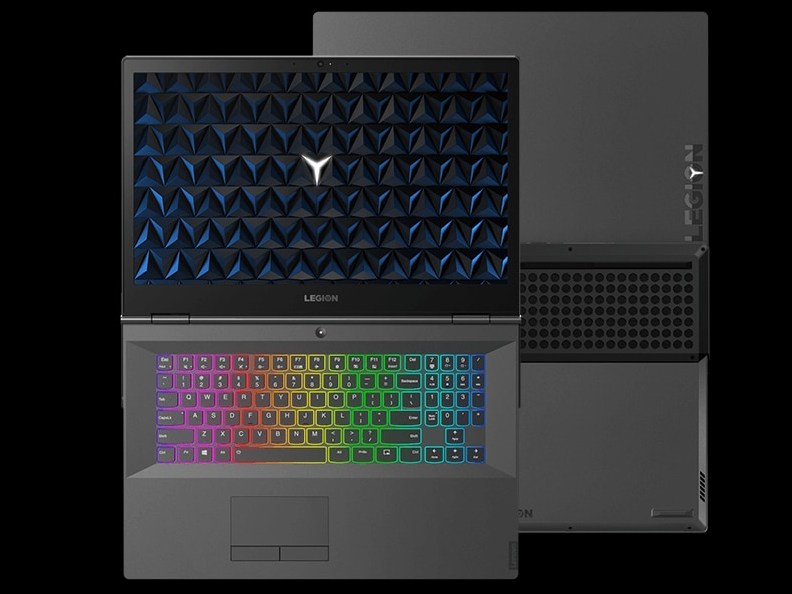
大多数OEM通常会为其发烧级旗舰型号预留高端GeForce 80级GPU。这曾经是联想的Legion Y900系列,但制造商已经叫停该系列,将中档Legion Y700系列的顶配作为最高端产品。我们所得到的是一款采用高端GeForce GPU的中端游戏笔记本电脑,价格比Alienware m17,华硕ROG G703,MSI GT75或Acer Triton 700等竞争对手的“超级”游戏笔记本价格更实惠。联想笔记本电脑在提供与这些发烧级笔记本相同的游戏性能下还便宜了几千元,主要是因为它的外形设计更简单。
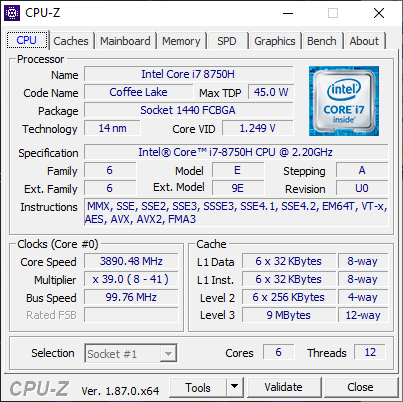
由于出色的Turbo Boost可持续性,CPU性能比一般的 i7-8750H更快。考虑到轻薄的外形和高性能,核心温度和风扇噪音都低于预期。
因为军团Y740带有中端机身,第一印象并不像上述高端替代品那样强劲。联想比更坚固(和更昂贵)的MSI GT75或华硕ROG G703更容易发生弯曲和摇摆。我们的评测单元还有中等程度的漏光和偏色。它的键盘键更软,也更差。游戏玩家并不会失去性能,但较弱的机身强度和键盘按键将削弱整体游戏体验。
中端的Legion Y740系列的零售价比竞争对手的17.3英寸游戏笔记本电脑低得多,同时拥有相同的高端CPU和GPU。它在性能方面具有出色的优势,前提是您对没什么特色的外观设计和强度一般的机身没什么意见。
Lenovo Legion Y740-17ICH
- 03/01/2019 v6 (old)
Allen Ngo
Price comparison

