宏碁掠夺者Triton 500 (i7-8750H, RTX 2080 Max-Q) 笔记本电脑评测
| Networking | |
| iperf3 transmit AX12 | |
| Asus Zephyrus S GX531GS | |
| Acer Predator Triton 500 | |
| Gigabyte Aero 15-X9 | |
| MSI GS65 8RF-019DE Stealth Thin | |
| Razer Blade 15 RTX 2070 Max-Q | |
| iperf3 receive AX12 | |
| Razer Blade 15 RTX 2070 Max-Q | |
| Asus Zephyrus S GX531GS | |
| Gigabyte Aero 15-X9 | |
| Acer Predator Triton 500 | |
| MSI GS65 8RF-019DE Stealth Thin | |
| |||||||||||||||||||||||||
Brightness Distribution: 89 %
Center on Battery: 304 cd/m²
Contrast: 1126:1 (Black: 0.27 cd/m²)
ΔE ColorChecker Calman: 4.66 | ∀{0.5-29.43 Ø4.71}
calibrated: 1.72
ΔE Greyscale Calman: 5.53 | ∀{0.09-98 Ø4.96}
93% sRGB (Argyll 1.6.3 3D)
60% AdobeRGB 1998 (Argyll 1.6.3 3D)
65.7% AdobeRGB 1998 (Argyll 3D)
92.6% sRGB (Argyll 3D)
64.2% Display P3 (Argyll 3D)
Gamma: 2.5
CCT: 8028 K
| Acer Predator Triton 500 AU Optronics B156HAN08.2 (AUO82ED), IPS, 1920x1080 | Gigabyte Aero 15-X9 LGD05C0, IPS, 1920x1080 | Razer Blade 15 RTX 2070 Max-Q LG Philips LGD05C0, IPS, 1920x1080 | MSI GS65 8RF-019DE Stealth Thin AU Optronics B156HAN08.0 (AUO80ED), IPS, 1920x1080 | Asus Zephyrus S GX531GS AU Optronics B156HAN08.2 (AUO82ED), IPS, 1920x1080 | |
|---|---|---|---|---|---|
| Display | -1% | 2% | 1% | 1% | |
| Display P3 Coverage (%) | 64.2 | 63.5 -1% | 65.3 2% | 66.2 3% | 66.7 4% |
| sRGB Coverage (%) | 92.6 | 93.1 1% | 94.9 2% | 92.1 -1% | 91.2 -2% |
| AdobeRGB 1998 Coverage (%) | 65.7 | 64.5 -2% | 66.3 1% | 67.2 2% | 66.7 2% |
| Response Times | -63% | -57% | -67% | 9% | |
| Response Time Grey 50% / Grey 80% * (ms) | 8 ? | 16.4 ? -105% | 16.8 ? -110% | 17.6 ? -120% | 7.4 ? 7% |
| Response Time Black / White * (ms) | 11.2 ? | 13.6 ? -21% | 11.6 ? -4% | 12.8 ? -14% | 10 ? 11% |
| PWM Frequency (Hz) | |||||
| Screen | 15% | 7% | 14% | 11% | |
| Brightness middle (cd/m²) | 304 | 250 -18% | 314.7 4% | 254 -16% | 294 -3% |
| Brightness (cd/m²) | 299 | 235 -21% | 312 4% | 262 -12% | 275 -8% |
| Brightness Distribution (%) | 89 | 85 -4% | 90 1% | 89 0% | 84 -6% |
| Black Level * (cd/m²) | 0.27 | 0.29 -7% | 0.38 -41% | 0.22 19% | 0.24 11% |
| Contrast (:1) | 1126 | 862 -23% | 828 -26% | 1155 3% | 1225 9% |
| Colorchecker dE 2000 * | 4.66 | 1.46 69% | 2.56 45% | 2.37 49% | 2.57 45% |
| Colorchecker dE 2000 max. * | 9.65 | 2.47 74% | 4.89 49% | 4.71 51% | 4.88 49% |
| Colorchecker dE 2000 calibrated * | 1.72 | 1.71 1% | 1.84 -7% | 2.14 -24% | |
| Greyscale dE 2000 * | 5.53 | 1.27 77% | 3.4 39% | 1.58 71% | 2.41 56% |
| Gamma | 2.5 88% | 2.4 92% | 2.3 96% | 2.48 89% | 2.5 88% |
| CCT | 8028 81% | 6749 96% | 6435 101% | 6785 96% | 6370 102% |
| Color Space (Percent of AdobeRGB 1998) (%) | 60 | 60 0% | 60.7 1% | 60 0% | 59 -2% |
| Color Space (Percent of sRGB) (%) | 93 | 93 0% | 94.6 2% | 92 -1% | 91 -2% |
| Total Average (Program / Settings) | -16% /
1% | -16% /
-2% | -17% /
2% | 7% /
9% |
* ... smaller is better
Display Response Times
| ↔ Response Time Black to White | ||
|---|---|---|
| 11.2 ms ... rise ↗ and fall ↘ combined | ↗ 6 ms rise | 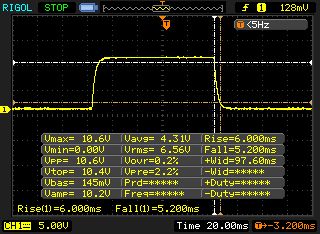 |
| ↘ 5.2 ms fall | ||
| The screen shows good response rates in our tests, but may be too slow for competitive gamers. In comparison, all tested devices range from 0.1 (minimum) to 240 (maximum) ms. » 30 % of all devices are better. This means that the measured response time is better than the average of all tested devices (19.8 ms). | ||
| ↔ Response Time 50% Grey to 80% Grey | ||
| 8 ms ... rise ↗ and fall ↘ combined | ↗ 4 ms rise | 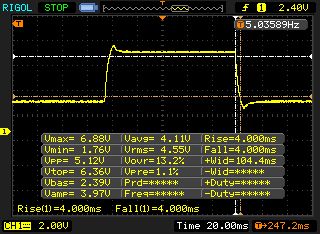 |
| ↘ 4 ms fall | ||
| The screen shows fast response rates in our tests and should be suited for gaming. In comparison, all tested devices range from 0.165 (minimum) to 636 (maximum) ms. » 21 % of all devices are better. This means that the measured response time is better than the average of all tested devices (30.9 ms). | ||
Screen Flickering / PWM (Pulse-Width Modulation)
| Screen flickering / PWM not detected | 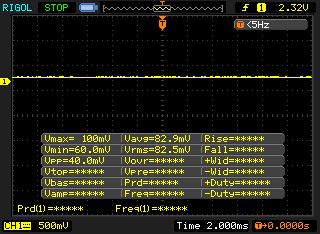 | ||
In comparison: 52 % of all tested devices do not use PWM to dim the display. If PWM was detected, an average of 7741 (minimum: 5 - maximum: 343500) Hz was measured. | |||
| Cinebench R15 | |
| CPU Single 64Bit | |
| Average of class Gaming (188.8 - 350, n=103, last 2 years) | |
| Acer Predator Triton 500 | |
| MSI GS65 8RF-019DE Stealth Thin | |
| Razer Blade 15 RTX 2070 Max-Q | |
| Asus Zephyrus S GX531GS | |
| Gigabyte Aero 15-X9 | |
| CPU Multi 64Bit | |
| Average of class Gaming (1578 - 6330, n=102, last 2 years) | |
| Gigabyte Aero 15-X9 | |
| Asus Zephyrus S GX531GS | |
| MSI GS65 8RF-019DE Stealth Thin | |
| Acer Predator Triton 500 | |
| Razer Blade 15 RTX 2070 Max-Q | |
| Cinebench R11.5 | |
| CPU Single 64Bit | |
| Average of class Gaming (3.3 - 4.16, n=9, last 2 years) | |
| MSI GS65 8RF-019DE Stealth Thin | |
| Acer Predator Triton 500 | |
| Asus Zephyrus S GX531GS | |
| CPU Multi 64Bit | |
| Average of class Gaming (29.8 - 76.7, n=9, last 2 years) | |
| Asus Zephyrus S GX531GS | |
| MSI GS65 8RF-019DE Stealth Thin | |
| Acer Predator Triton 500 | |
| PCMark 10 - Score | |
| Average of class Gaming (5828 - 12414, n=93, last 2 years) | |
| Acer Predator Triton 500 | |
| Razer Blade 15 RTX 2070 Max-Q | |
| Gigabyte Aero 15-X9 | |
| Asus Zephyrus S GX531GS | |
| MSI GS65 8RF-019DE Stealth Thin | |
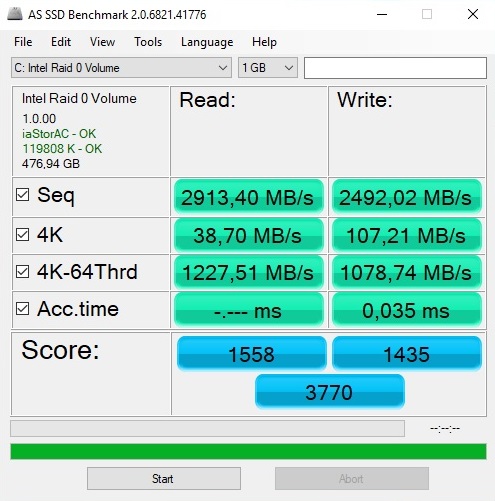
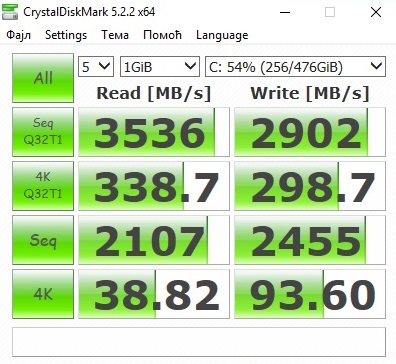
| Acer Predator Triton 500 2x WDC PC SN720 SDAPNTW-256G-1014 (RAID 0) | Gigabyte Aero 15-X9 Intel SSD 760p SSDPEKKW010T8 | Razer Blade 15 RTX 2070 Max-Q Samsung SSD PM981 MZVLB512HAJQ | MSI GS65 8RF-019DE Stealth Thin Samsung SSD PM981 MZVLB512HAJQ | Asus Zephyrus S GX531GS WDC PC SN520 SDAPNUW-512G | |
|---|---|---|---|---|---|
| AS SSD | -16% | 1% | -3% | -21% | |
| Score Total (Points) | 3770 | 2722 -28% | 4079 8% | 4122 9% | 3294 -13% |
| Seq Write (MB/s) | 2492 | 1471 -41% | 1822 -27% | 1834 -26% | 1261 -49% |
| Seq Read (MB/s) | 2913 | 2113 -27% | 1840 -37% | 1266 -57% | 903 -69% |
| 4K Write (MB/s) | 107.2 | 107.1 0% | 110.7 3% | 107.2 0% | 103.6 -3% |
| 4K Read (MB/s) | 38.7 | 55 42% | 52.3 35% | 48.94 26% | 40.02 3% |
| Score Write (Points) | 1435 | 957 -33% | 2010 40% | 2051 43% | 1515 6% |
| Score Read (Points) | 1558 | 1180 -24% | 1362 -13% | 1346 -14% | 1161 -25% |

| 3DMark 11 - 1280x720 Performance GPU | |
| Average of class Gaming (21841 - 80022, n=103, last 2 years) | |
| Acer Predator Triton 500 | |
| Razer Blade 15 RTX 2070 Max-Q | |
| Gigabyte Aero 15-X9 | |
| MSI GS65 8RF-019DE Stealth Thin | |
| Asus Zephyrus S GX531GS | |
| 3DMark 11 Performance | 20149 points | |
Help | ||
| The Witcher 3 | |
| 1920x1080 High Graphics & Postprocessing (Nvidia HairWorks Off) | |
| Average of class Gaming (341 - 404, n=2, last 2 years) | |
| Acer Predator Triton 500 | |
| Razer Blade 15 RTX 2070 Max-Q | |
| MSI GS65 8RF-019DE Stealth Thin | |
| Asus Zephyrus S GX531GS | |
| Gigabyte Aero 15-X9 | |
| 1920x1080 Ultra Graphics & Postprocessing (HBAO+) | |
| Average of class Gaming (104.7 - 240, n=7, last 2 years) | |
| Acer Predator Triton 500 | |
| Razer Blade 15 RTX 2070 Max-Q | |
| Gigabyte Aero 15-X9 | |
| MSI GS65 8RF-019DE Stealth Thin | |
| Asus Zephyrus S GX531GS | |
| low | med. | high | ultra | |
|---|---|---|---|---|
| The Witcher 3 (2015) | 136 | 76.5 | ||
| Battlefield 1 (2016) | 134 | 129 | ||
| Assassin´s Creed Origins (2017) | 65 | 62 |
Noise level
| Idle |
| 30 / 32 / 34 dB(A) |
| Load |
| 44 / 47 dB(A) |
 | ||
30 dB silent 40 dB(A) audible 50 dB(A) loud |
||
min: | ||
| Acer Predator Triton 500 GeForce RTX 2080 Max-Q, i7-8750H | Gigabyte Aero 15-X9 GeForce RTX 2070 Max-Q, i7-8750H | Razer Blade 15 RTX 2070 Max-Q GeForce RTX 2070 Max-Q, i7-8750H | MSI GS65 8RF-019DE Stealth Thin GeForce GTX 1070 Max-Q, i7-8750H | Asus Zephyrus S GX531GS GeForce GTX 1070 Max-Q, i7-8750H | Average of class Gaming | |
|---|---|---|---|---|---|---|
| Noise | -2% | 9% | 2% | -9% | 7% | |
| off / environment * (dB) | 29 | 30 -3% | 28.8 1% | 30 -3% | 29 -0% | 24.1 ? 17% |
| Idle Minimum * (dB) | 30 | 32 -7% | 28.8 4% | 30 -0% | 33 -10% | 25.9 ? 14% |
| Idle Average * (dB) | 32 | 34 -6% | 28.8 10% | 31 3% | 34 -6% | 27.4 ? 14% |
| Idle Maximum * (dB) | 34 | 36 -6% | 29.4 14% | 34 -0% | 40 -18% | 30.1 ? 11% |
| Load Average * (dB) | 44 | 42 5% | 35.7 19% | 43 2% | 47 -7% | 43.7 ? 1% |
| Witcher 3 ultra * (dB) | 46 | 44 4% | 42.5 8% | 42 9% | 51 -11% | |
| Load Maximum * (dB) | 47 | 48 -2% | 45 4% | 44 6% | 53 -13% | 54.3 ? -16% |
* ... smaller is better
(-) The maximum temperature on the upper side is 49 °C / 120 F, compared to the average of 40.4 °C / 105 F, ranging from 21.2 to 68.8 °C for the class Gaming.
(-) The bottom heats up to a maximum of 58 °C / 136 F, compared to the average of 43.2 °C / 110 F
(+) In idle usage, the average temperature for the upper side is 30.2 °C / 86 F, compared to the device average of 33.9 °C / 93 F.
(-) Playing The Witcher 3, the average temperature for the upper side is 42.8 °C / 109 F, compared to the device average of 33.9 °C / 93 F.
(±) The palmrests and touchpad can get very hot to the touch with a maximum of 39 °C / 102.2 F.
(-) The average temperature of the palmrest area of similar devices was 28.8 °C / 83.8 F (-10.2 °C / -18.4 F).
| Acer Predator Triton 500 GeForce RTX 2080 Max-Q, i7-8750H | Gigabyte Aero 15-X9 GeForce RTX 2070 Max-Q, i7-8750H | Razer Blade 15 RTX 2070 Max-Q GeForce RTX 2070 Max-Q, i7-8750H | MSI GS65 8RF-019DE Stealth Thin GeForce GTX 1070 Max-Q, i7-8750H | Asus Zephyrus S GX531GS GeForce GTX 1070 Max-Q, i7-8750H | Average of class Gaming | |
|---|---|---|---|---|---|---|
| Heat | 2% | 14% | 11% | 1% | 7% | |
| Maximum Upper Side * (°C) | 49 | 56 -14% | 49 -0% | 49 -0% | 54 -10% | 45.1 ? 8% |
| Maximum Bottom * (°C) | 58 | 66 -14% | 49 16% | 63 -9% | 60 -3% | 48.1 ? 17% |
| Idle Upper Side * (°C) | 33 | 27 18% | 25.4 23% | 24 27% | 30 9% | 31 ? 6% |
| Idle Bottom * (°C) | 33 | 27 18% | 27.2 18% | 25 24% | 30 9% | 34.2 ? -4% |
* ... smaller is better
Acer Predator Triton 500 audio analysis
(±) | speaker loudness is average but good (81 dB)
Bass 100 - 315 Hz
(±) | reduced bass - on average 13% lower than median
(±) | linearity of bass is average (12.3% delta to prev. frequency)
Mids 400 - 2000 Hz
(+) | balanced mids - only 3.8% away from median
(+) | mids are linear (5.3% delta to prev. frequency)
Highs 2 - 16 kHz
(+) | balanced highs - only 2.3% away from median
(+) | highs are linear (4.7% delta to prev. frequency)
Overall 100 - 16.000 Hz
(+) | overall sound is linear (14.5% difference to median)
Compared to same class
» 27% of all tested devices in this class were better, 7% similar, 66% worse
» The best had a delta of 6%, average was 18%, worst was 132%
Compared to all devices tested
» 19% of all tested devices were better, 4% similar, 77% worse
» The best had a delta of 4%, average was 23%, worst was 134%
Acer Predator Triton 700 audio analysis
(+) | speakers can play relatively loud (83 dB)
Bass 100 - 315 Hz
(-) | nearly no bass - on average 15.2% lower than median
(±) | linearity of bass is average (10.1% delta to prev. frequency)
Mids 400 - 2000 Hz
(±) | higher mids - on average 8% higher than median
(+) | mids are linear (6.7% delta to prev. frequency)
Highs 2 - 16 kHz
(+) | balanced highs - only 2% away from median
(+) | highs are linear (4.9% delta to prev. frequency)
Overall 100 - 16.000 Hz
(±) | linearity of overall sound is average (19.9% difference to median)
Compared to same class
» 70% of all tested devices in this class were better, 6% similar, 24% worse
» The best had a delta of 6%, average was 18%, worst was 132%
Compared to all devices tested
» 51% of all tested devices were better, 7% similar, 42% worse
» The best had a delta of 4%, average was 23%, worst was 134%
| Off / Standby | |
| Idle | |
| Load |
|
Key:
min: | |
| Acer Predator Triton 500 GeForce RTX 2080 Max-Q, i7-8750H | Gigabyte Aero 15-X9 GeForce RTX 2070 Max-Q, i7-8750H | Razer Blade 15 RTX 2070 Max-Q GeForce RTX 2070 Max-Q, i7-8750H | MSI GS65 8RF-019DE Stealth Thin GeForce GTX 1070 Max-Q, i7-8750H | Asus Zephyrus S GX531GS GeForce GTX 1070 Max-Q, i7-8750H | Average of class Gaming | |
|---|---|---|---|---|---|---|
| Power Consumption | 11% | 18% | 23% | -7% | -4% | |
| Idle Minimum * (Watt) | 16 | 16 -0% | 10.4 35% | 7 56% | 17 -6% | 13.1 ? 18% |
| Idle Average * (Watt) | 22 | 18 18% | 14.6 34% | 11 50% | 20 9% | 19 ? 14% |
| Idle Maximum * (Watt) | 32 | 23 28% | 16.3 49% | 20 37% | 29 9% | 24.6 ? 23% |
| Load Average * (Watt) | 89 | 88 1% | 88.5 1% | 98 -10% | 112 -26% | 111.3 ? -25% |
| Witcher 3 ultra * (Watt) | 147 | 120 18% | 155.4 -6% | 132 10% | 152 -3% | |
| Load Maximum * (Watt) | 173 | 167 3% | 182.4 -5% | 182 -5% | 211 -22% | 260 ? -50% |
* ... smaller is better
| Acer Predator Triton 500 GeForce RTX 2080 Max-Q, i7-8750H, 82 Wh | Gigabyte Aero 15-X9 GeForce RTX 2070 Max-Q, i7-8750H, 94.24 Wh | Razer Blade 15 RTX 2070 Max-Q GeForce RTX 2070 Max-Q, i7-8750H, 80 Wh | MSI GS65 8RF-019DE Stealth Thin GeForce GTX 1070 Max-Q, i7-8750H, 82 Wh | Asus Zephyrus S GX531GS GeForce GTX 1070 Max-Q, i7-8750H, 50 Wh | Average of class Gaming | |
|---|---|---|---|---|---|---|
| Battery runtime | 90% | 71% | 47% | -35% | 56% | |
| Reader / Idle (h) | 5.6 | 9.2 64% | 11.4 104% | 8.5 52% | 3.6 -36% | 7.84 ? 40% |
| WiFi v1.3 (h) | 3.2 | 6.4 100% | 6.5 103% | 6 88% | 2.6 -19% | 7.08 ? 121% |
| Load (h) | 1.4 | 2.9 107% | 1.5 7% | 1.4 0% | 0.7 -50% | 1.496 ? 7% |
| H.264 (h) | 6.1 | 5.9 | 8.27 ? |
Pros
Cons
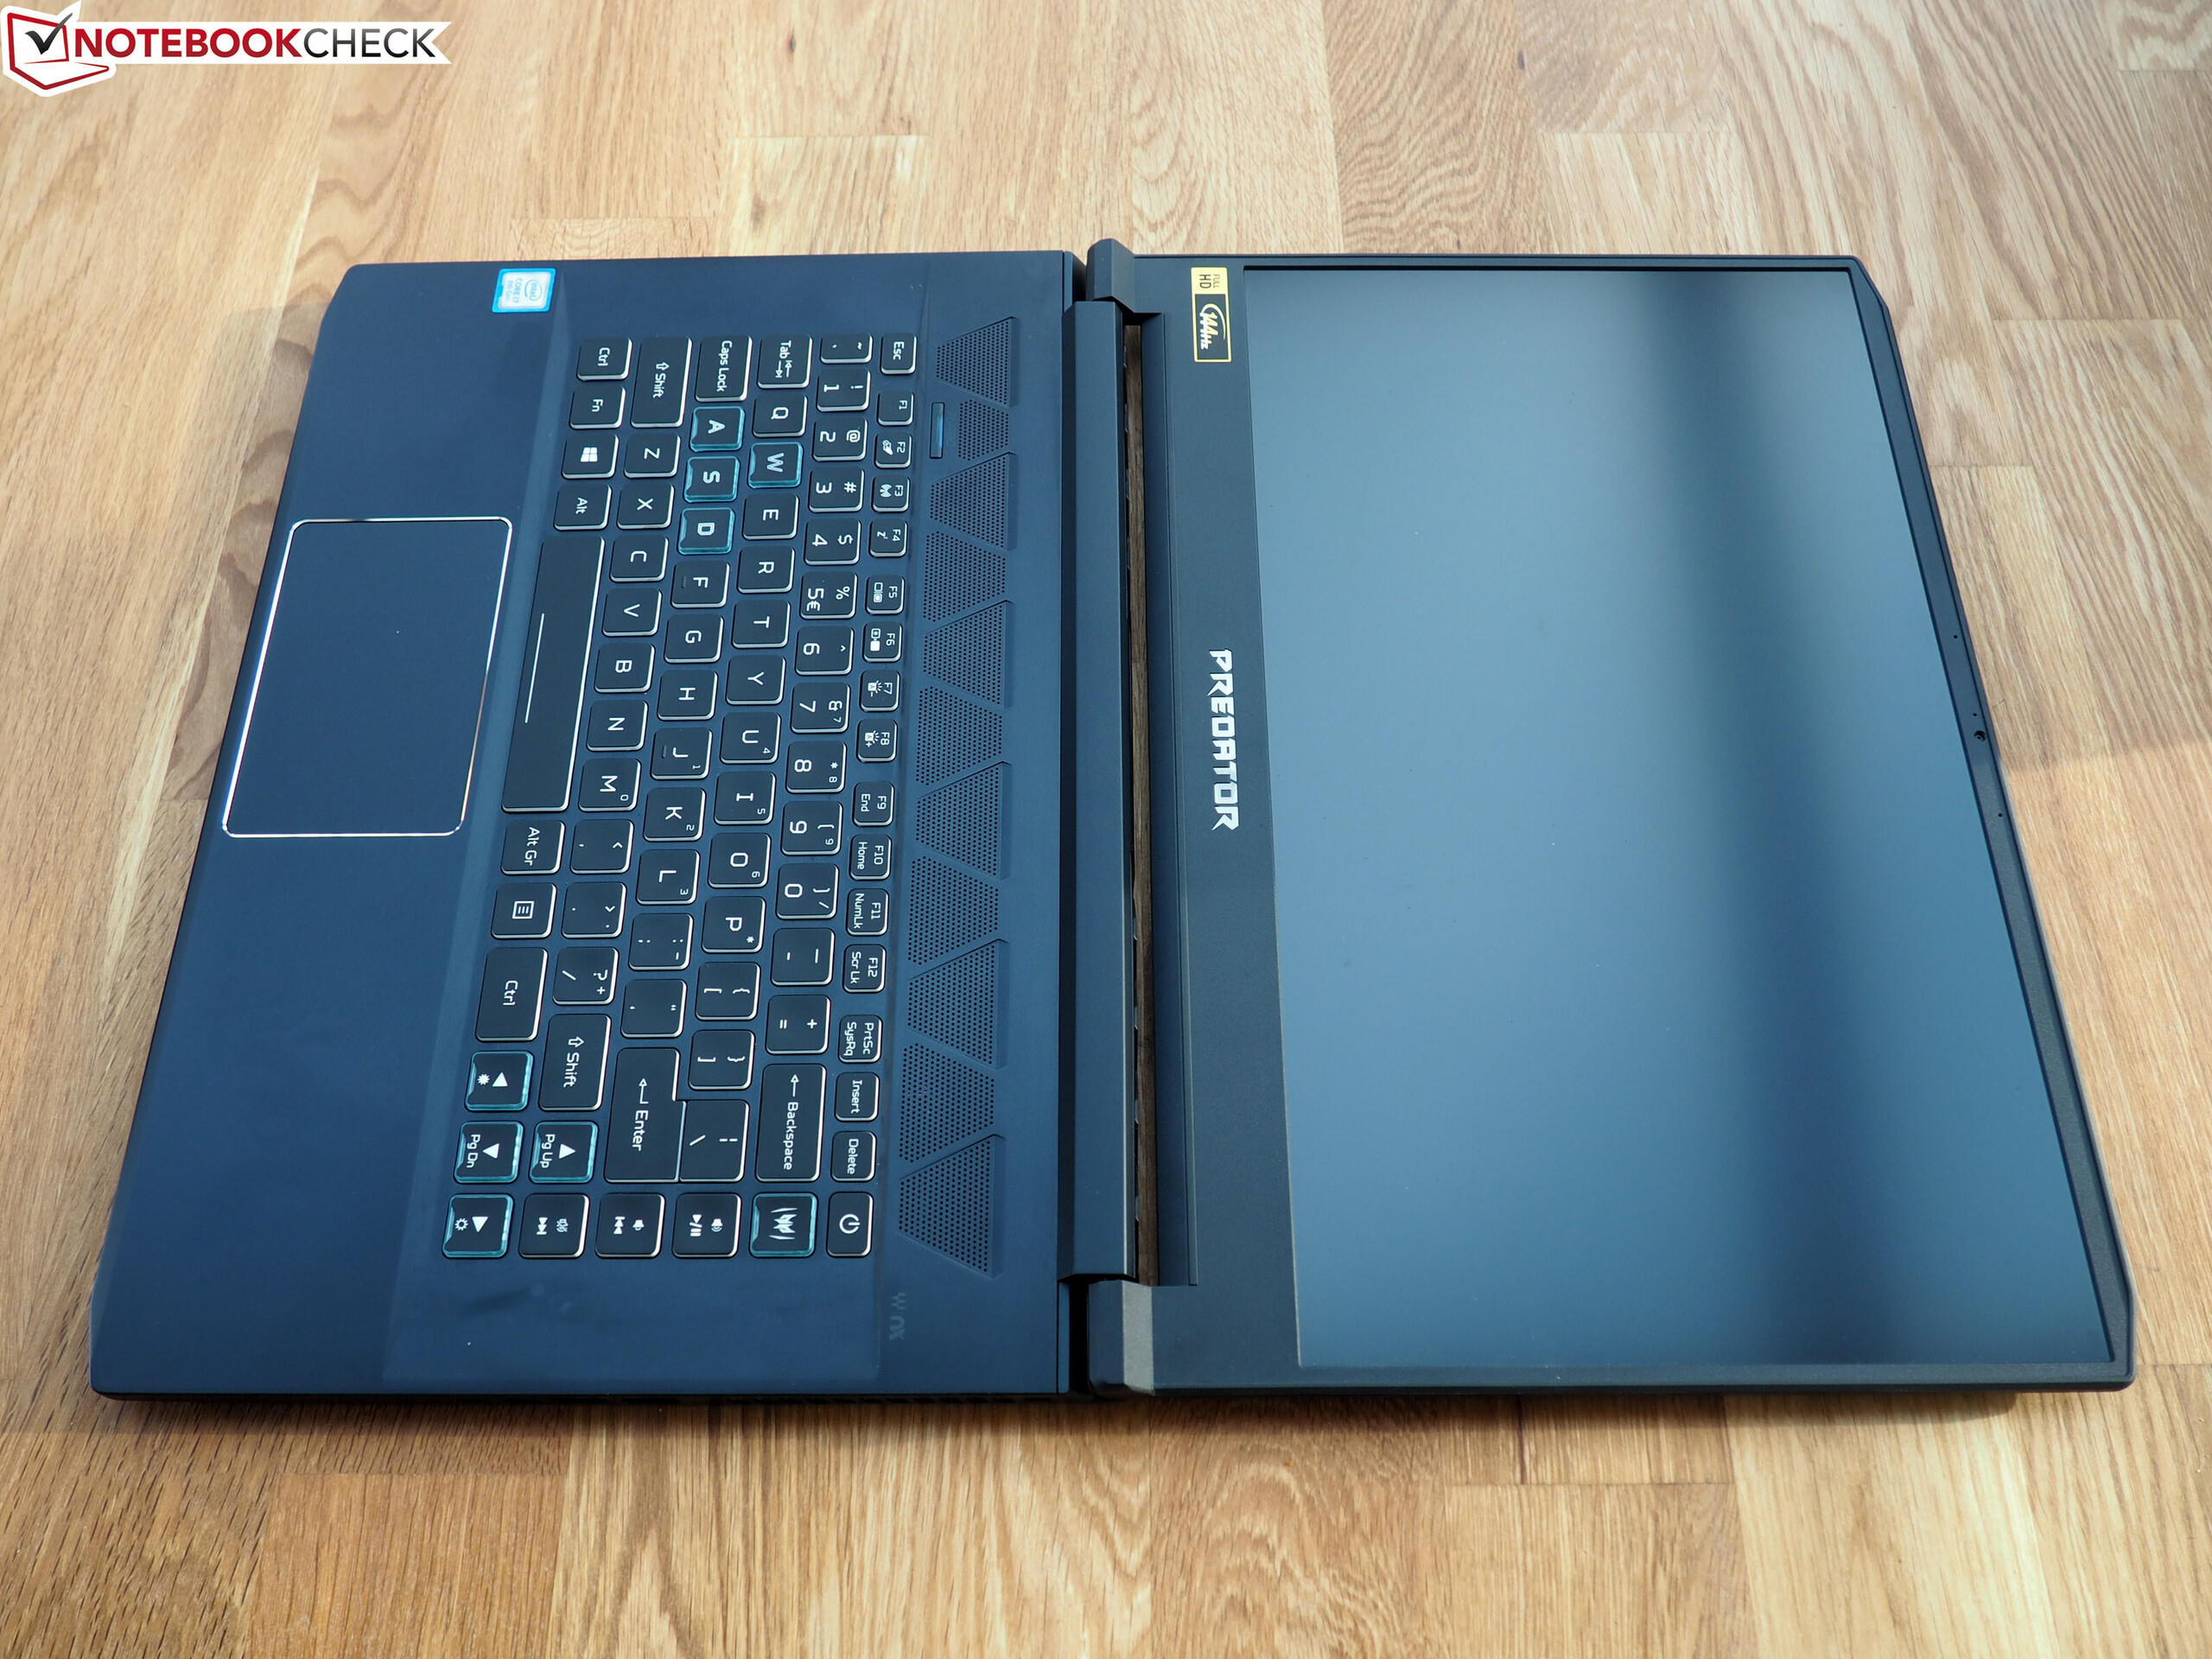
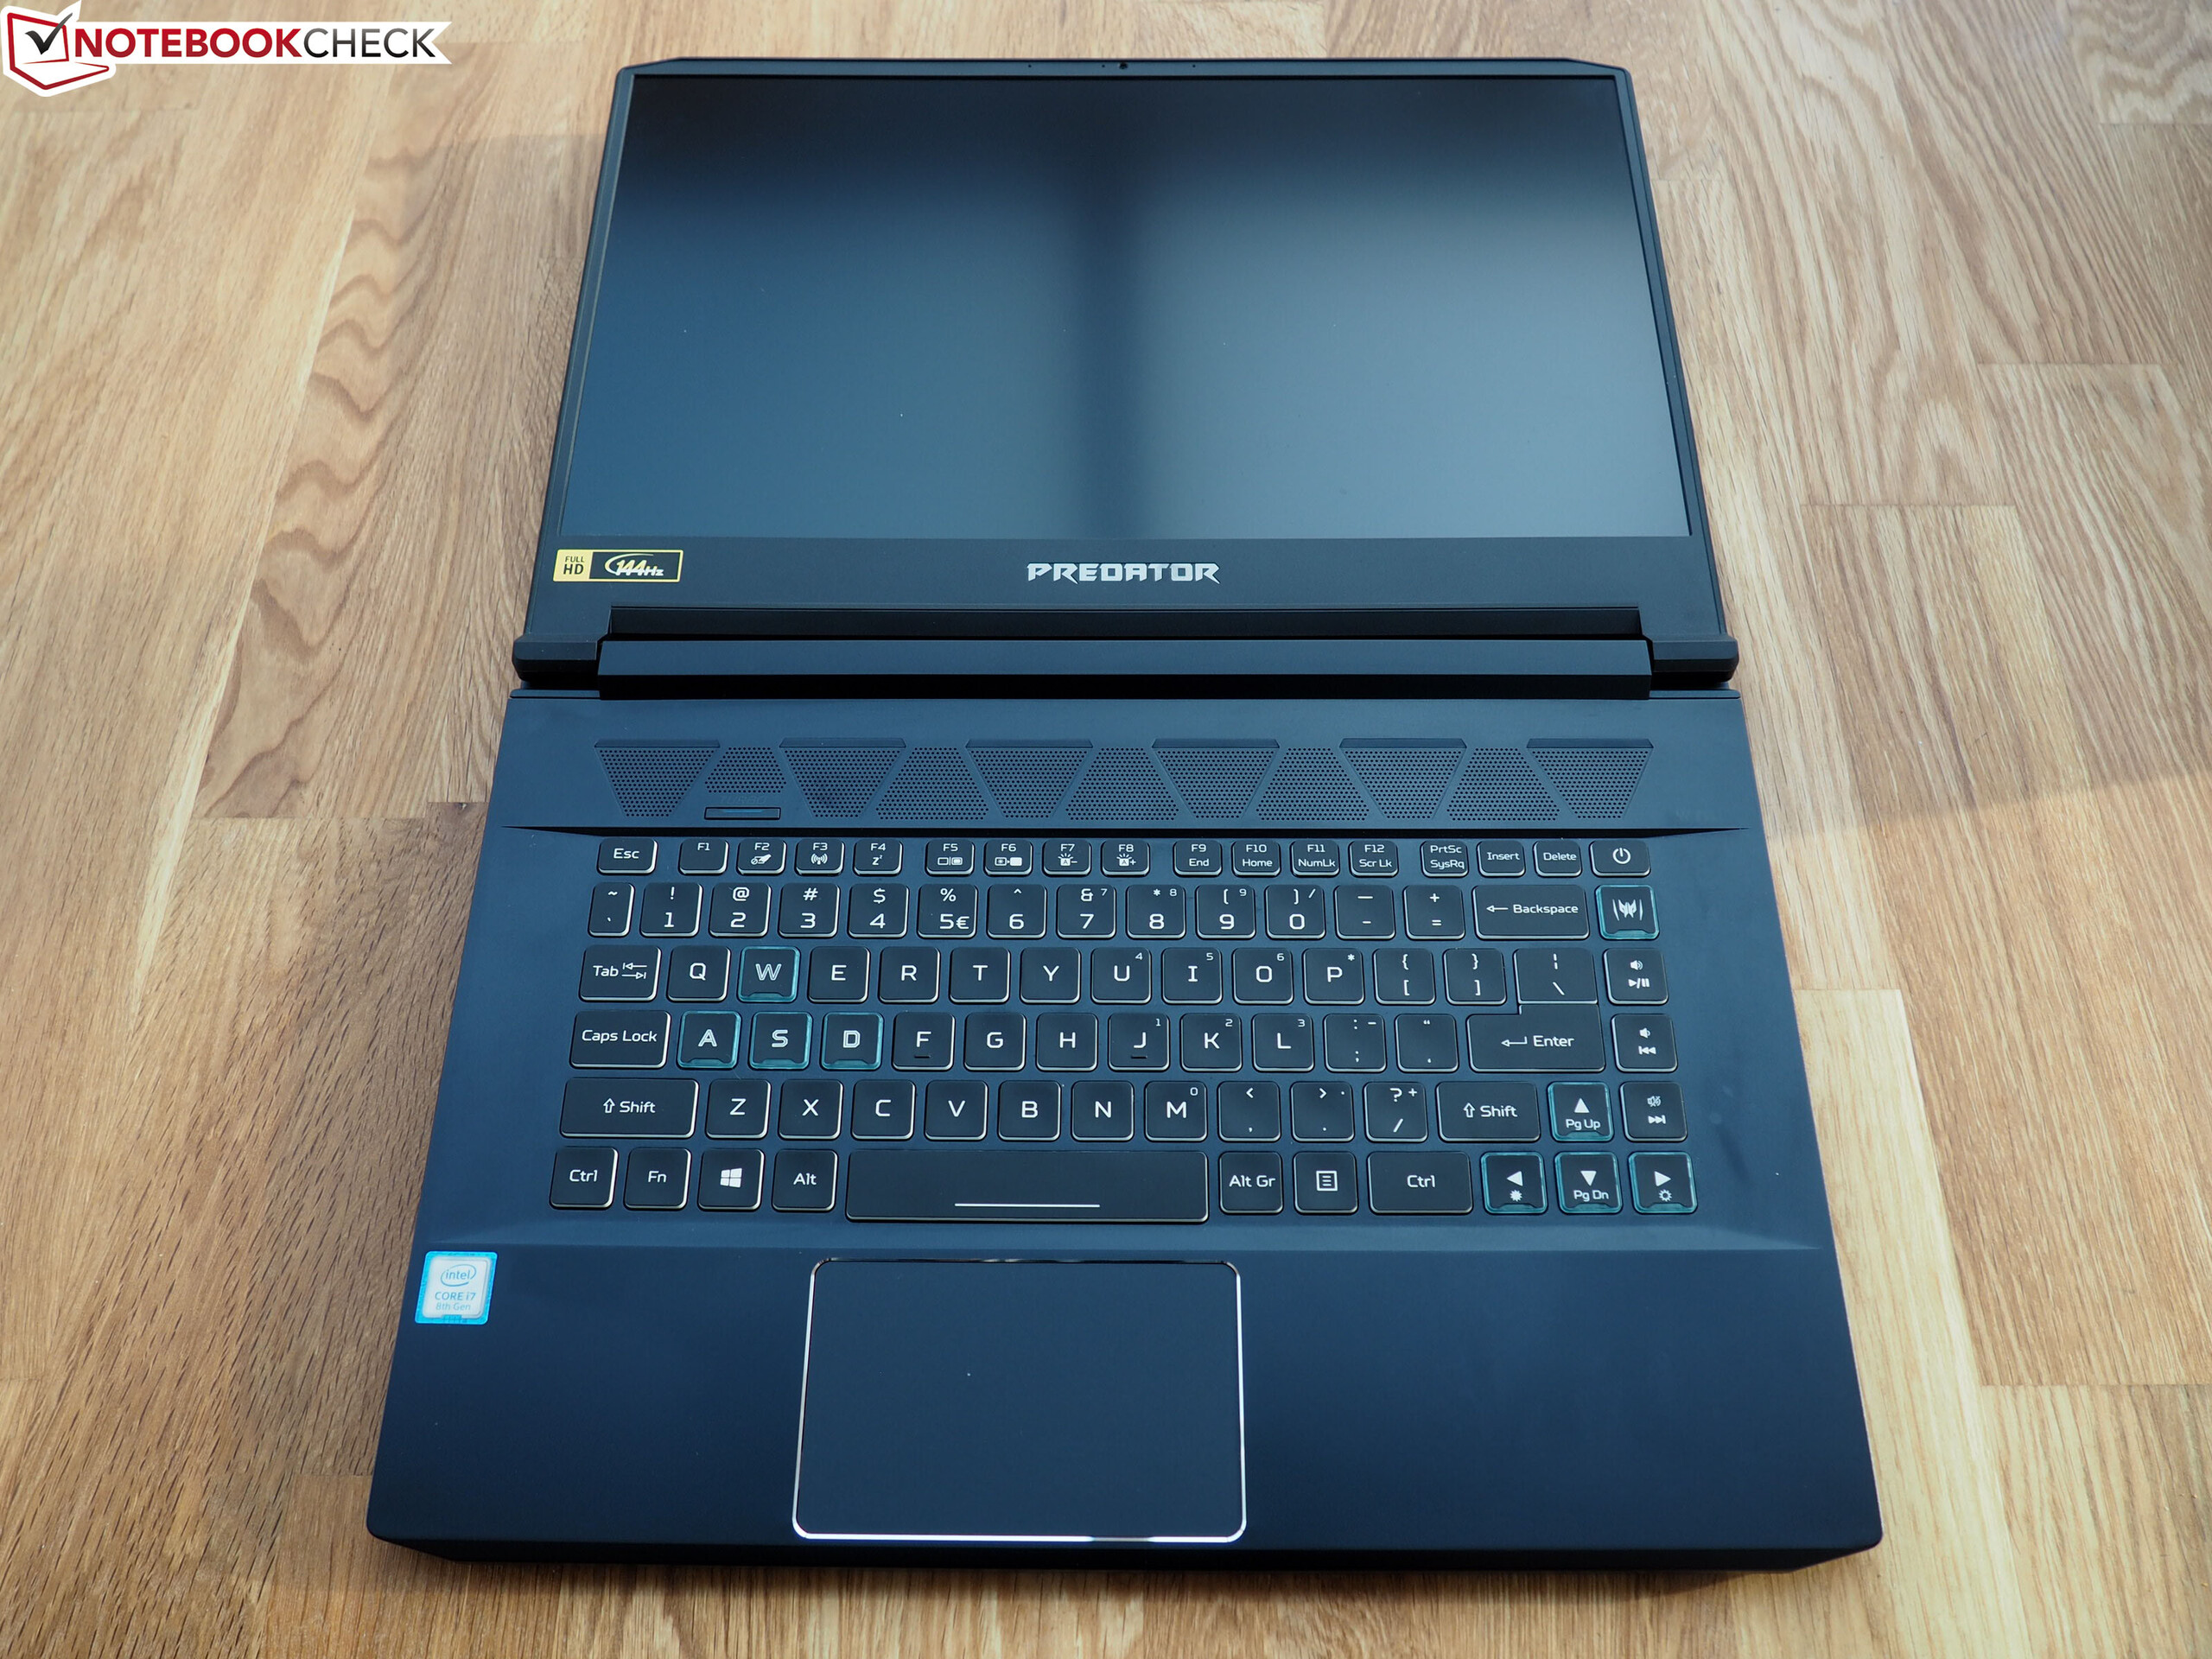
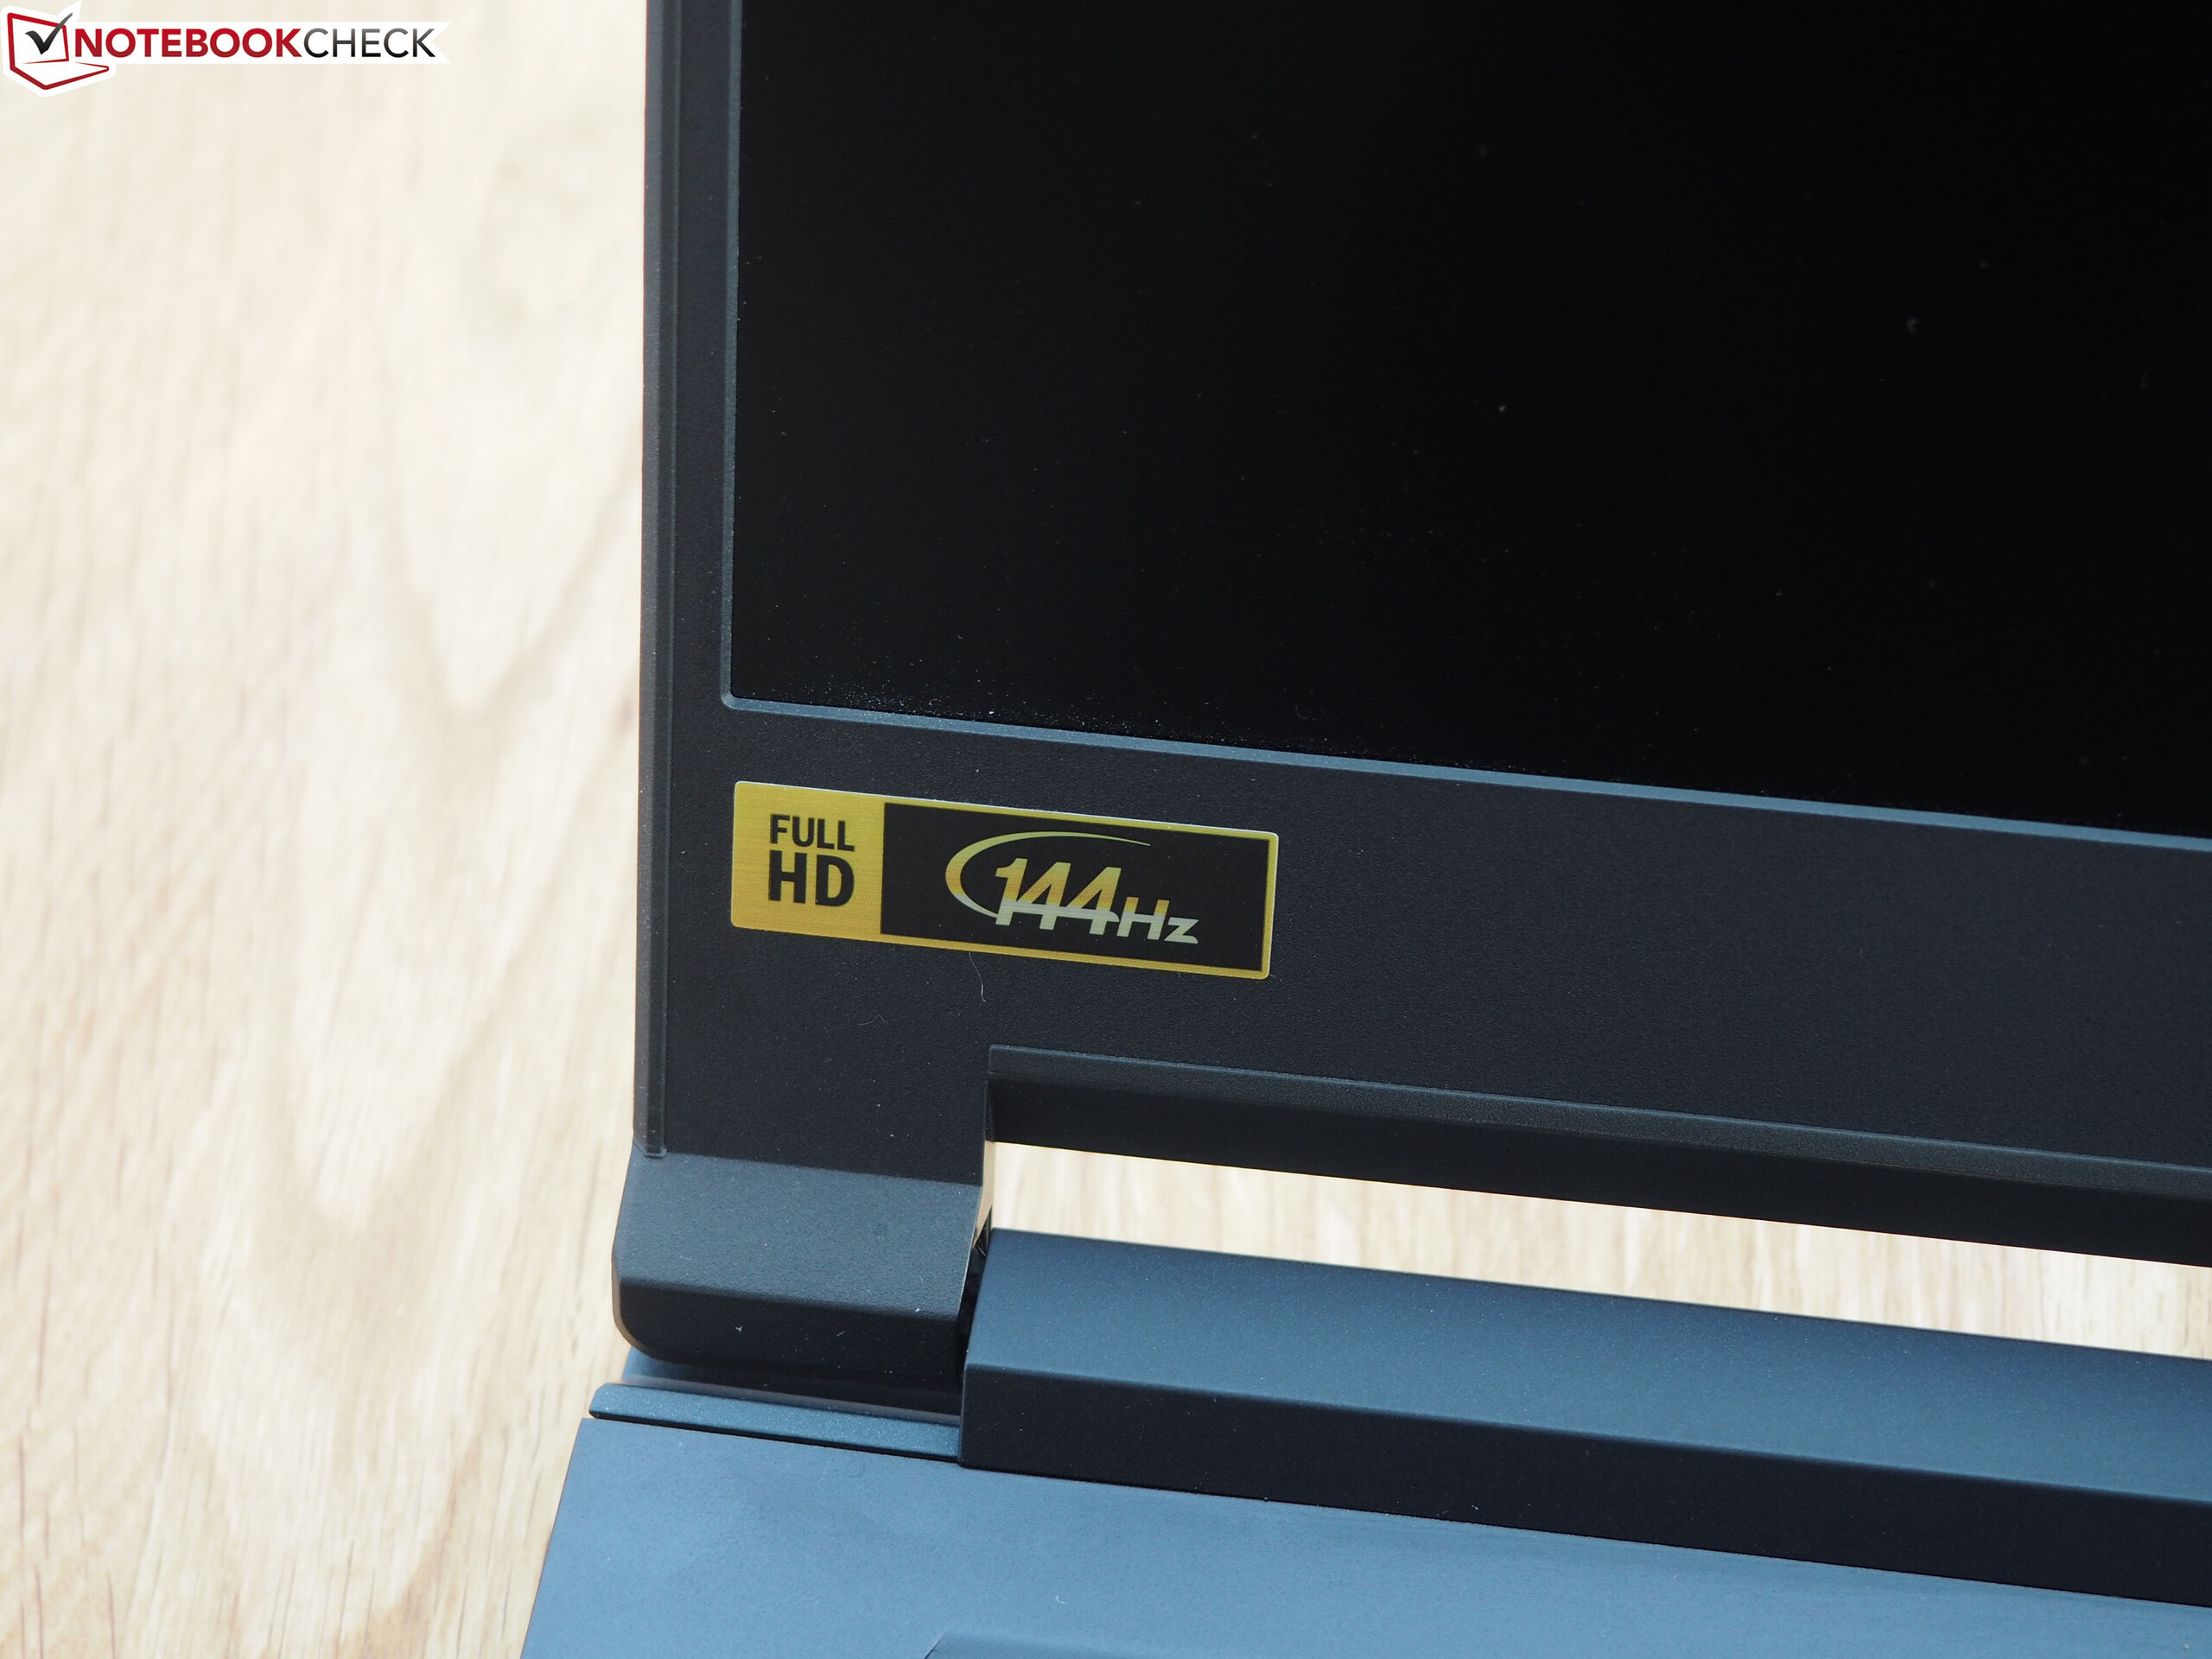
宏碁掠夺者Triton 500距离“非常好”的评价就差那么一点点了。这台15英寸笔记本电脑几乎满足了现代游戏笔记本的所有标准。除了纤薄的显示器边框和外壳之外,我们还应该提到这里的144-Hz搭载着G-Sync。
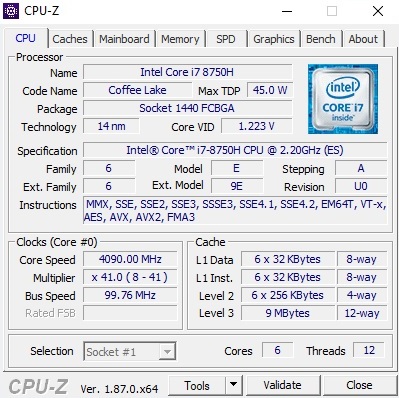
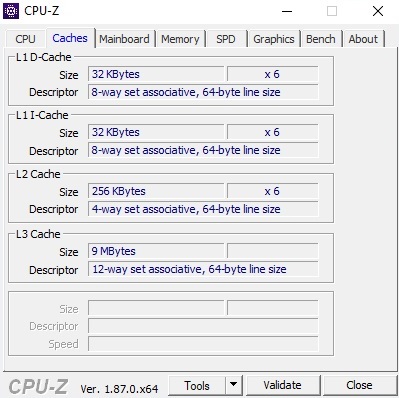
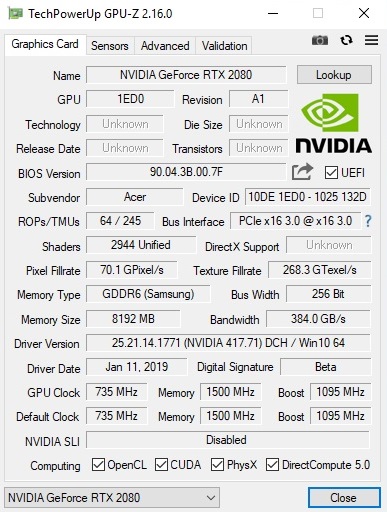
Triton 500也不缺乏性能。经过测试我们发现Core i7-8750H和GeForce RTX 2080 Max-Q的组合可以毫不费力地处理任何当前的全高清分辨率游戏。
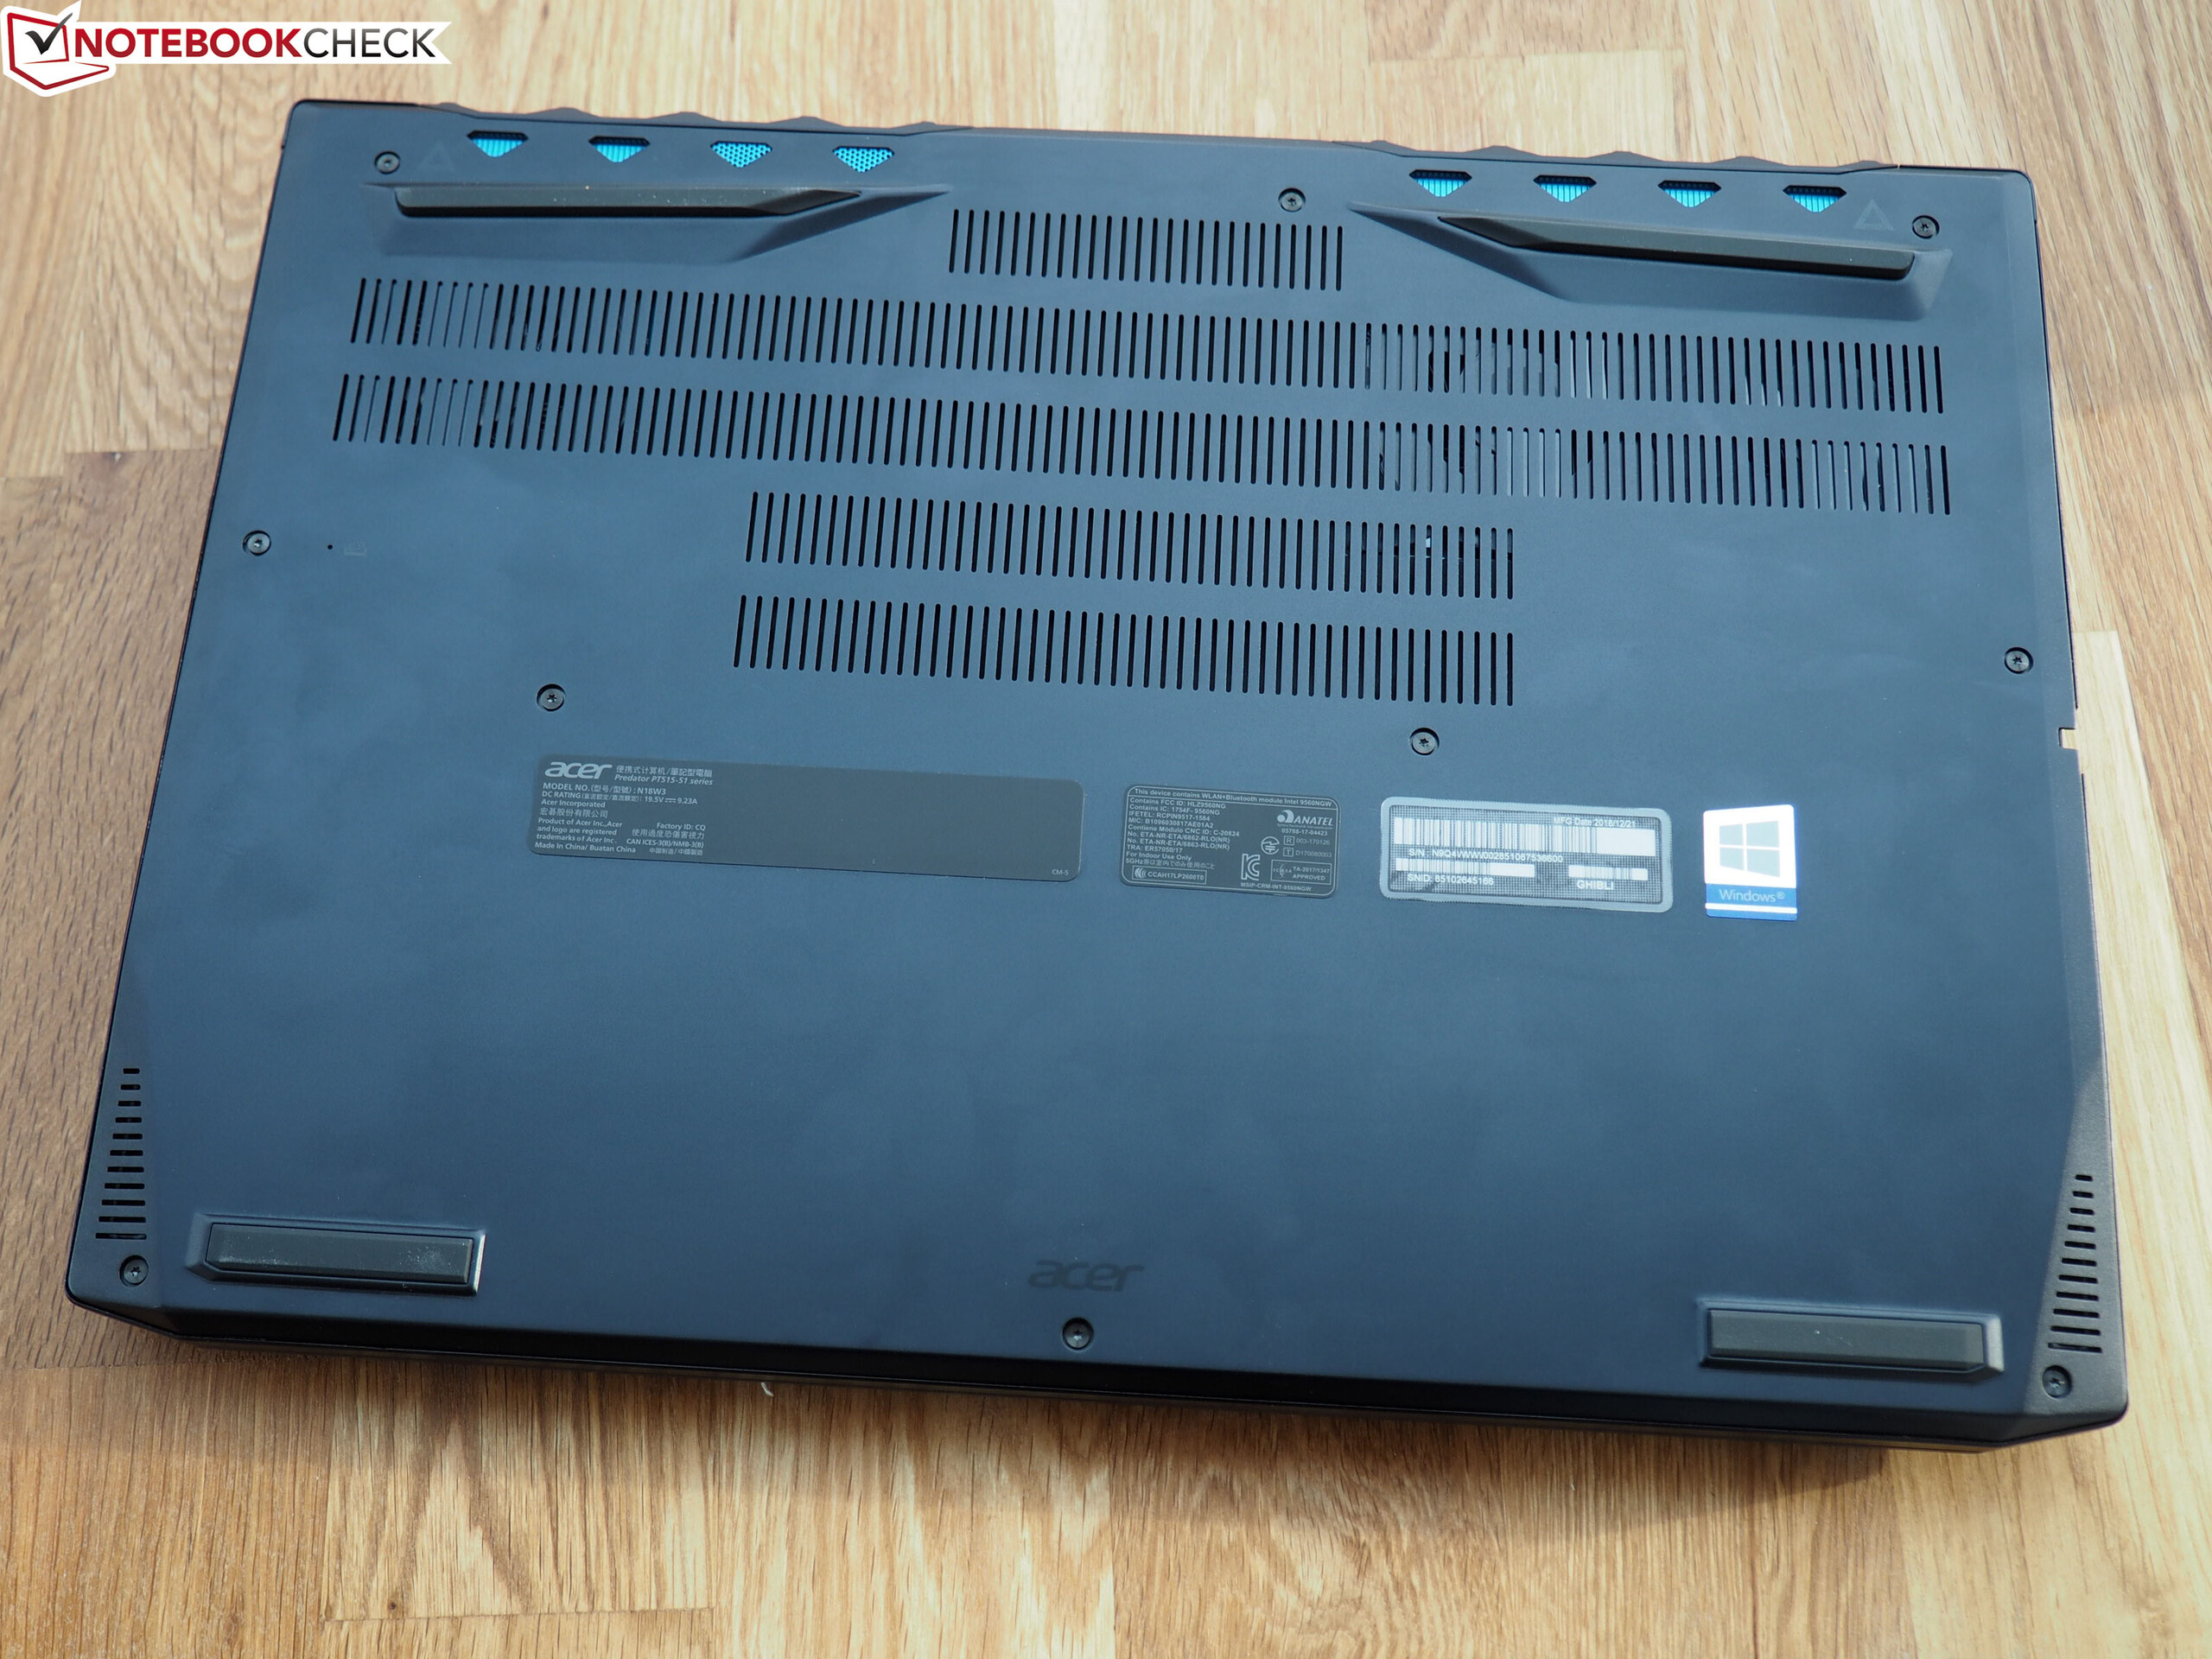
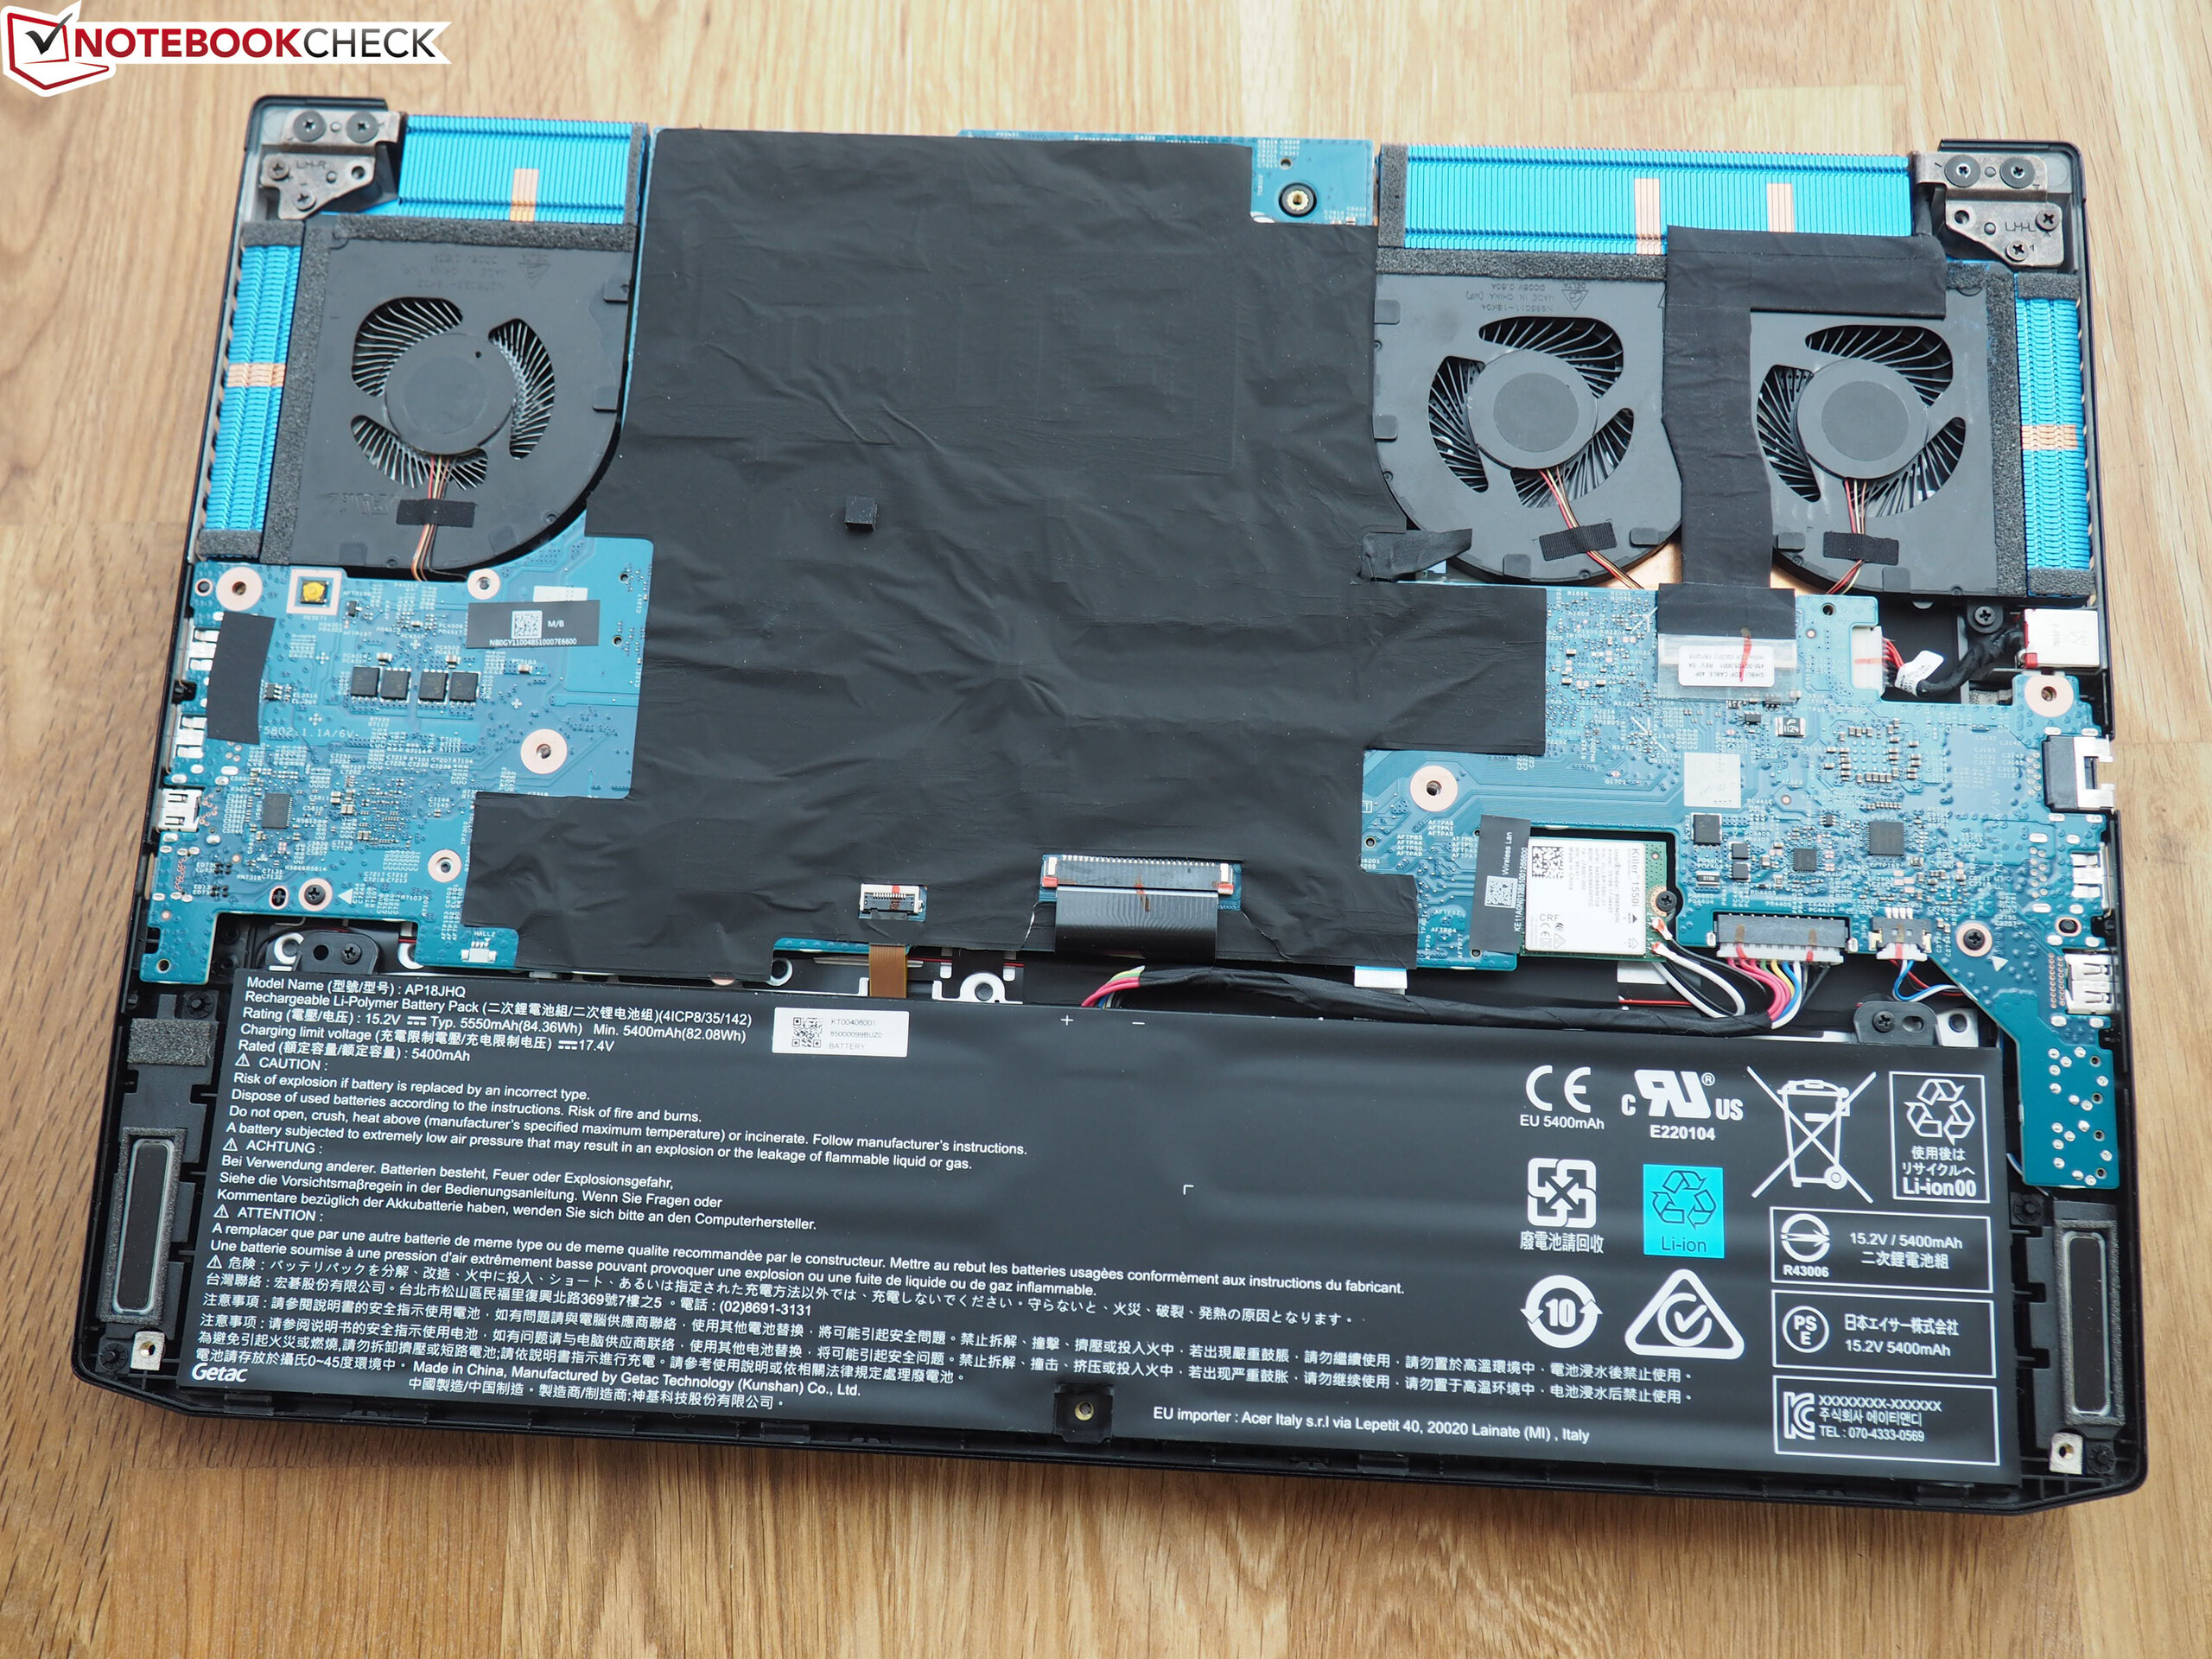
然而,对于我们来说,为什么宏碁不使用图形切换是不可理解的。在移动性方面,Optimus绝对会提供自己的优势。我们发现可维护性方面存在其他缺陷。内部设计使买家几乎无法改动任何组件(关键字:存储解决方案和RAM)。
“尽管如此,我们仍然认为Triton 500比旧的Triton 700更为成功。”
Acer Predator Triton 500
- 02/14/2019 v6 (old)
Florian Glaser
Price comparison