外星人m17 (i9-8950HK, RTX 2080 Max-Q, 4K UHD) 笔记本电脑评测
| |||||||||||||||||||||||||
Brightness Distribution: 94 %
Center on Battery: 357.9 cd/m²
Contrast: 1085:1 (Black: 0.33 cd/m²)
ΔE ColorChecker Calman: 6.57 | ∀{0.5-29.43 Ø4.72}
calibrated: 6.74
ΔE Greyscale Calman: 4.3 | ∀{0.09-98 Ø4.97}
100% sRGB (Argyll 1.6.3 3D)
88.4% AdobeRGB 1998 (Argyll 1.6.3 3D)
99.1% AdobeRGB 1998 (Argyll 3D)
99.9% sRGB (Argyll 3D)
86.4% Display P3 (Argyll 3D)
Gamma: 2.6
CCT: 6403 K
| Alienware m17 P37E AU Optronics B173ZAN01.0, IPS, 17.3", 3840x2160 | Alienware 17 R5 JYWWF_B173QTN (AUO1496), TN, 17.3", 2560x1440 | Asus ROG Strix Scar II GL704GW B173HAN04.0 (AUO409D), AHVA, 17.3", 1920x1080 | MSI GS75 8SG Stealth N173HCE-G33 (CMN175C), IPS, 17.3", 1920x1080 | Razer Blade Pro 2017 Sharp LQ173D1JW33 (SHP145A), IGZO, 17.3", 3840x2160 | Acer Predator Triton 700 AUO B156HAN04.2 (AUO42ED), IPS, 15.6", 1920x1080 | |
|---|---|---|---|---|---|---|
| Display | -26% | -25% | -22% | 1% | -25% | |
| Display P3 Coverage (%) | 86.4 | 63.4 -27% | 62.9 -27% | 63.6 -26% | 88.9 3% | 62.5 -28% |
| sRGB Coverage (%) | 99.9 | 86.1 -14% | 87.1 -13% | 95.4 -5% | 100 0% | 88.7 -11% |
| AdobeRGB 1998 Coverage (%) | 99.1 | 62.9 -37% | 63.7 -36% | 65.5 -34% | 99.7 1% | 63.5 -36% |
| Response Times | 61% | 56% | 73% | -54% | -16% | |
| Response Time Grey 50% / Grey 80% * (ms) | 35.6 ? | 20.8 ? 42% | 17.6 ? 51% | 7.6 ? 79% | 60.8 ? -71% | 44.8 ? -26% |
| Response Time Black / White * (ms) | 28 ? | 6 ? 79% | 11.2 ? 60% | 9.6 ? 66% | 38.4 ? -37% | 29.6 ? -6% |
| PWM Frequency (Hz) | 25510 ? | 204.9 ? | ||||
| Screen | -7% | 14% | 25% | -4% | -9% | |
| Brightness middle (cd/m²) | 357.9 | 398 11% | 295 -18% | 355 -1% | 230 -36% | 291 -19% |
| Brightness (cd/m²) | 347 | 367 6% | 291 -16% | 327 -6% | 207 -40% | 277 -20% |
| Brightness Distribution (%) | 94 | 86 -9% | 96 2% | 85 -10% | 83 -12% | 84 -11% |
| Black Level * (cd/m²) | 0.33 | 0.51 -55% | 0.24 27% | 0.26 21% | 0.2 39% | 0.22 33% |
| Contrast (:1) | 1085 | 780 -28% | 1229 13% | 1365 26% | 1150 6% | 1323 22% |
| Colorchecker dE 2000 * | 6.57 | 5.45 17% | 3.2 51% | 1.54 77% | 5.62 14% | 5.52 16% |
| Colorchecker dE 2000 max. * | 9.86 | 10.36 -5% | 6.64 33% | 3 70% | 10.24 -4% | 10.72 -9% |
| Colorchecker dE 2000 calibrated * | 6.74 | 2.56 62% | 2.52 63% | 0.77 89% | ||
| Greyscale dE 2000 * | 4.3 | 5.4 -26% | 2.16 50% | 2.19 49% | 4.54 -6% | 6.59 -53% |
| Gamma | 2.6 85% | 2.4 92% | 2.46 89% | 2.42 91% | 2.36 93% | 2.44 90% |
| CCT | 6403 102% | 7453 87% | 6872 95% | 6893 94% | 6625 98% | 7816 83% |
| Color Space (Percent of AdobeRGB 1998) (%) | 88.4 | 56 -37% | 57 -36% | 61 -31% | 88 0% | 58 -34% |
| Color Space (Percent of sRGB) (%) | 100 | 86 -14% | 87 -13% | 95 -5% | 100 0% | 89 -11% |
| Total Average (Program / Settings) | 9% /
-2% | 15% /
12% | 25% /
22% | -19% /
-10% | -17% /
-13% |
* ... smaller is better
Display Response Times
| ↔ Response Time Black to White | ||
|---|---|---|
| 28 ms ... rise ↗ and fall ↘ combined | ↗ 16 ms rise | 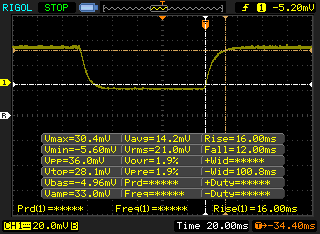 |
| ↘ 12 ms fall | ||
| The screen shows relatively slow response rates in our tests and may be too slow for gamers. In comparison, all tested devices range from 0.1 (minimum) to 240 (maximum) ms. » 71 % of all devices are better. This means that the measured response time is worse than the average of all tested devices (19.8 ms). | ||
| ↔ Response Time 50% Grey to 80% Grey | ||
| 35.6 ms ... rise ↗ and fall ↘ combined | ↗ 19.6 ms rise | 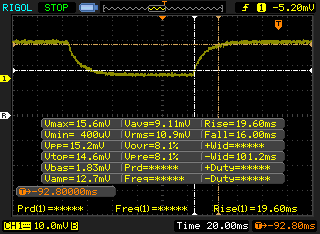 |
| ↘ 16 ms fall | ||
| The screen shows slow response rates in our tests and will be unsatisfactory for gamers. In comparison, all tested devices range from 0.165 (minimum) to 636 (maximum) ms. » 50 % of all devices are better. This means that the measured response time is worse than the average of all tested devices (31 ms). | ||
Screen Flickering / PWM (Pulse-Width Modulation)
| Screen flickering / PWM not detected | 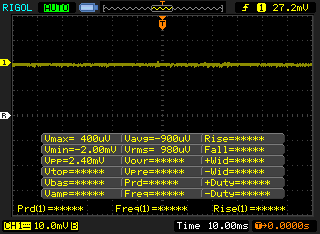 | ||
In comparison: 52 % of all tested devices do not use PWM to dim the display. If PWM was detected, an average of 7769 (minimum: 5 - maximum: 343500) Hz was measured. | |||
| PCMark 8 Home Score Accelerated v2 | 3812 points | |
| PCMark 8 Work Score Accelerated v2 | 4765 points | |
| PCMark 10 Score | 5632 points | |
Help | ||
| Alienware m17 P37E SK Hynix PC401 512GB M.2 (HFS512GD9TNG) | Alienware 17 R5 SK hynix PC401 HFS256GD9TNG | Asus ROG Strix Scar II GL704GW Intel SSD 660p SSDPEKNW512G8 | MSI GS75 8SG Stealth 2x Samsung SSD PM981 MZVLB512HAJQ (RAID 0) | Razer Blade Pro 2017 2x Samsung SSD PM951 MZVLV256HCHP (RAID 0) | Acer Predator Triton 700 2x SK Hynix Canvas SC300 512GB M.2 (HFS512G39MND) (RAID 0) | |
|---|---|---|---|---|---|---|
| AS SSD | -28% | -14% | 60% | 14% | 36% | |
| Seq Read (MB/s) | 1835 | 2203 20% | 1315 -28% | 3005 64% | 2599 42% | 2517 37% |
| Seq Write (MB/s) | 1121 | 559 -50% | 927 -17% | 2668 138% | 588 -48% | 2372 112% |
| 4K Read (MB/s) | 23.98 | 38.74 62% | 52.4 119% | 40.89 71% | 37.57 57% | 41.47 73% |
| 4K Write (MB/s) | 100 | 92.7 -7% | 122.8 23% | 94.4 -6% | 104.4 4% | 93 -7% |
| 4K-64 Read (MB/s) | 687 | 447.2 -35% | 326.5 -52% | 1366 99% | 1116 62% | 1057 54% |
| 4K-64 Write (MB/s) | 776 | 279.1 -64% | 727 -6% | 1197 54% | 513 -34% | 913 18% |
| Access Time Read * (ms) | 0.047 | 0.091 -94% | 0.11 -134% | 0.055 -17% | 0.051 -9% | 0.062 -32% |
| Access Time Write * (ms) | 0.053 | 0.065 -23% | 0.045 15% | 0.039 26% | 0.036 32% | 0.041 23% |
| Score Read (Points) | 895 | 706 -21% | 510 -43% | 1708 91% | 1414 58% | 1350 51% |
| Score Write (Points) | 988 | 428 -57% | 942 -5% | 1558 58% | 676 -32% | 1243 26% |
| Score Total (Points) | 2306 | 1424 -38% | 1715 -26% | 4123 79% | 2715 18% | 3282 42% |
| Copy ISO MB/s (MB/s) | 773 | |||||
| Copy Program MB/s (MB/s) | 493 | |||||
| Copy Game MB/s (MB/s) | 647 |
* ... smaller is better

| 3DMark 11 Performance | 21837 points | |
| 3DMark Cloud Gate Standard Score | 25513 points | |
| 3DMark Fire Strike Score | 17684 points | |
| 3DMark Time Spy Score | 7253 points | |
Help | ||
| low | med. | high | ultra | 4K | |
|---|---|---|---|---|---|
| BioShock Infinite (2013) | 312.6 | 271 | 252.1 | 164.7 | |
| The Witcher 3 (2015) | 277.6 | 221.1 | 138.2 | 75.7 | 53 |
| Rise of the Tomb Raider (2016) | 196.4 | 165.7 | 131.9 | 113.1 | 52.4 |
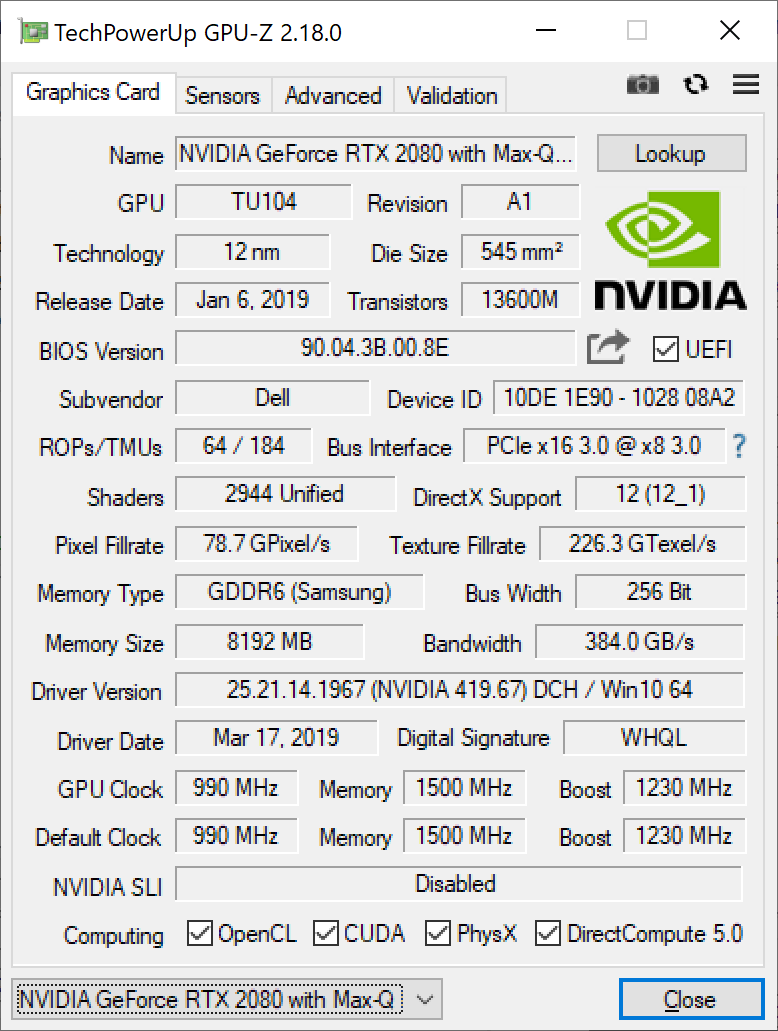
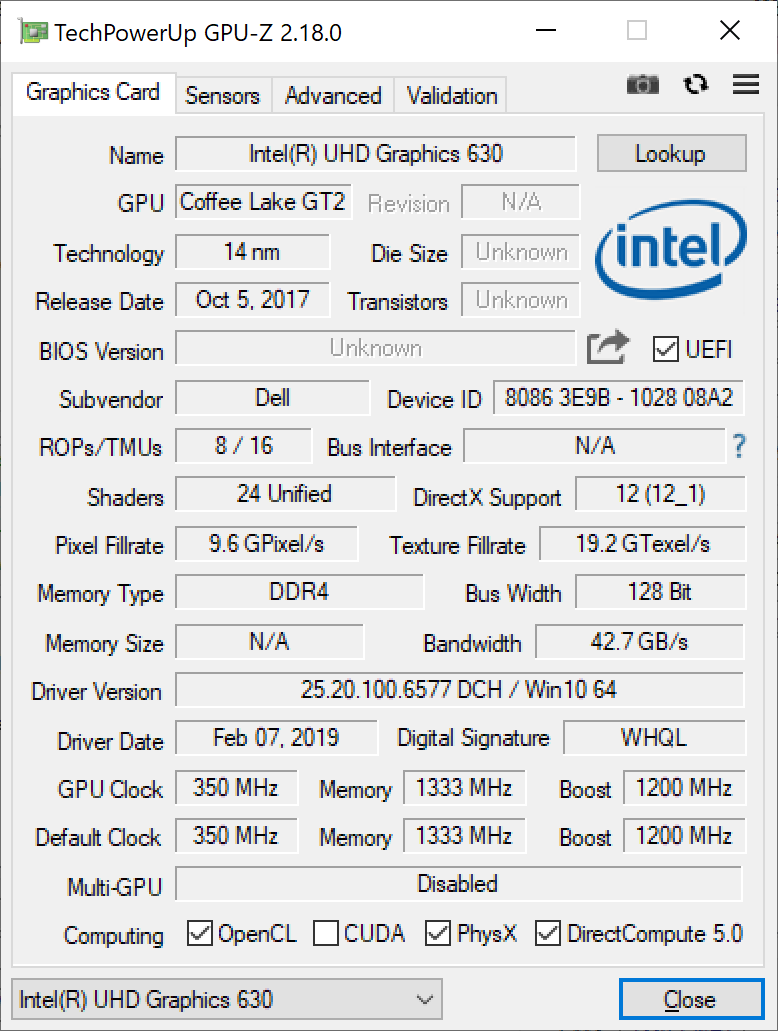
| Alienware m17 P37E GeForce RTX 2080 Max-Q, i9-8950HK, SK Hynix PC401 512GB M.2 (HFS512GD9TNG) | Alienware 17 R5 GeForce GTX 1070 Mobile, i7-8750H, SK hynix PC401 HFS256GD9TNG | Asus ROG Strix Scar II GL704GW GeForce RTX 2070 Mobile, i7-8750H, Intel SSD 660p SSDPEKNW512G8 | MSI GS75 8SG Stealth GeForce RTX 2080 Max-Q, i7-8750H, 2x Samsung SSD PM981 MZVLB512HAJQ (RAID 0) | Razer Blade Pro 2017 GeForce GTX 1080 Mobile, i7-7820HK, 2x Samsung SSD PM951 MZVLV256HCHP (RAID 0) | Acer Predator Triton 700 GeForce GTX 1080 Max-Q, i7-7700HQ, 2x SK Hynix Canvas SC300 512GB M.2 (HFS512G39MND) (RAID 0) | |
|---|---|---|---|---|---|---|
| Noise | -4% | -6% | -6% | -5% | -5% | |
| off / environment * (dB) | 28.2 | 30 -6% | 29 -3% | 30 -6% | 30 -6% | 31 -10% |
| Idle Minimum * (dB) | 28.2 | 32 -13% | 29 -3% | 31 -10% | 30 -6% | 33 -17% |
| Idle Average * (dB) | 28.2 | 33 -17% | 32 -13% | 32 -13% | 31 -10% | 34 -21% |
| Idle Maximum * (dB) | 31 | 34 -10% | 40 -29% | 41 -32% | 33 -6% | 40 -29% |
| Load Average * (dB) | 50.8 | 43 15% | 46 9% | 47 7% | 43 15% | 41 19% |
| Witcher 3 ultra * (dB) | 50.8 | 51 -0% | 51 -0% | 47 7% | 55 -8% | 43 15% |
| Load Maximum * (dB) | 50.8 | 51 -0% | 52 -2% | 48 6% | 58 -14% | 48 6% |
* ... smaller is better
Noise level
| Idle |
| 28.2 / 28.2 / 31 dB(A) |
| Load |
| 50.8 / 50.8 dB(A) |
 | ||
30 dB silent 40 dB(A) audible 50 dB(A) loud |
||
min: | ||
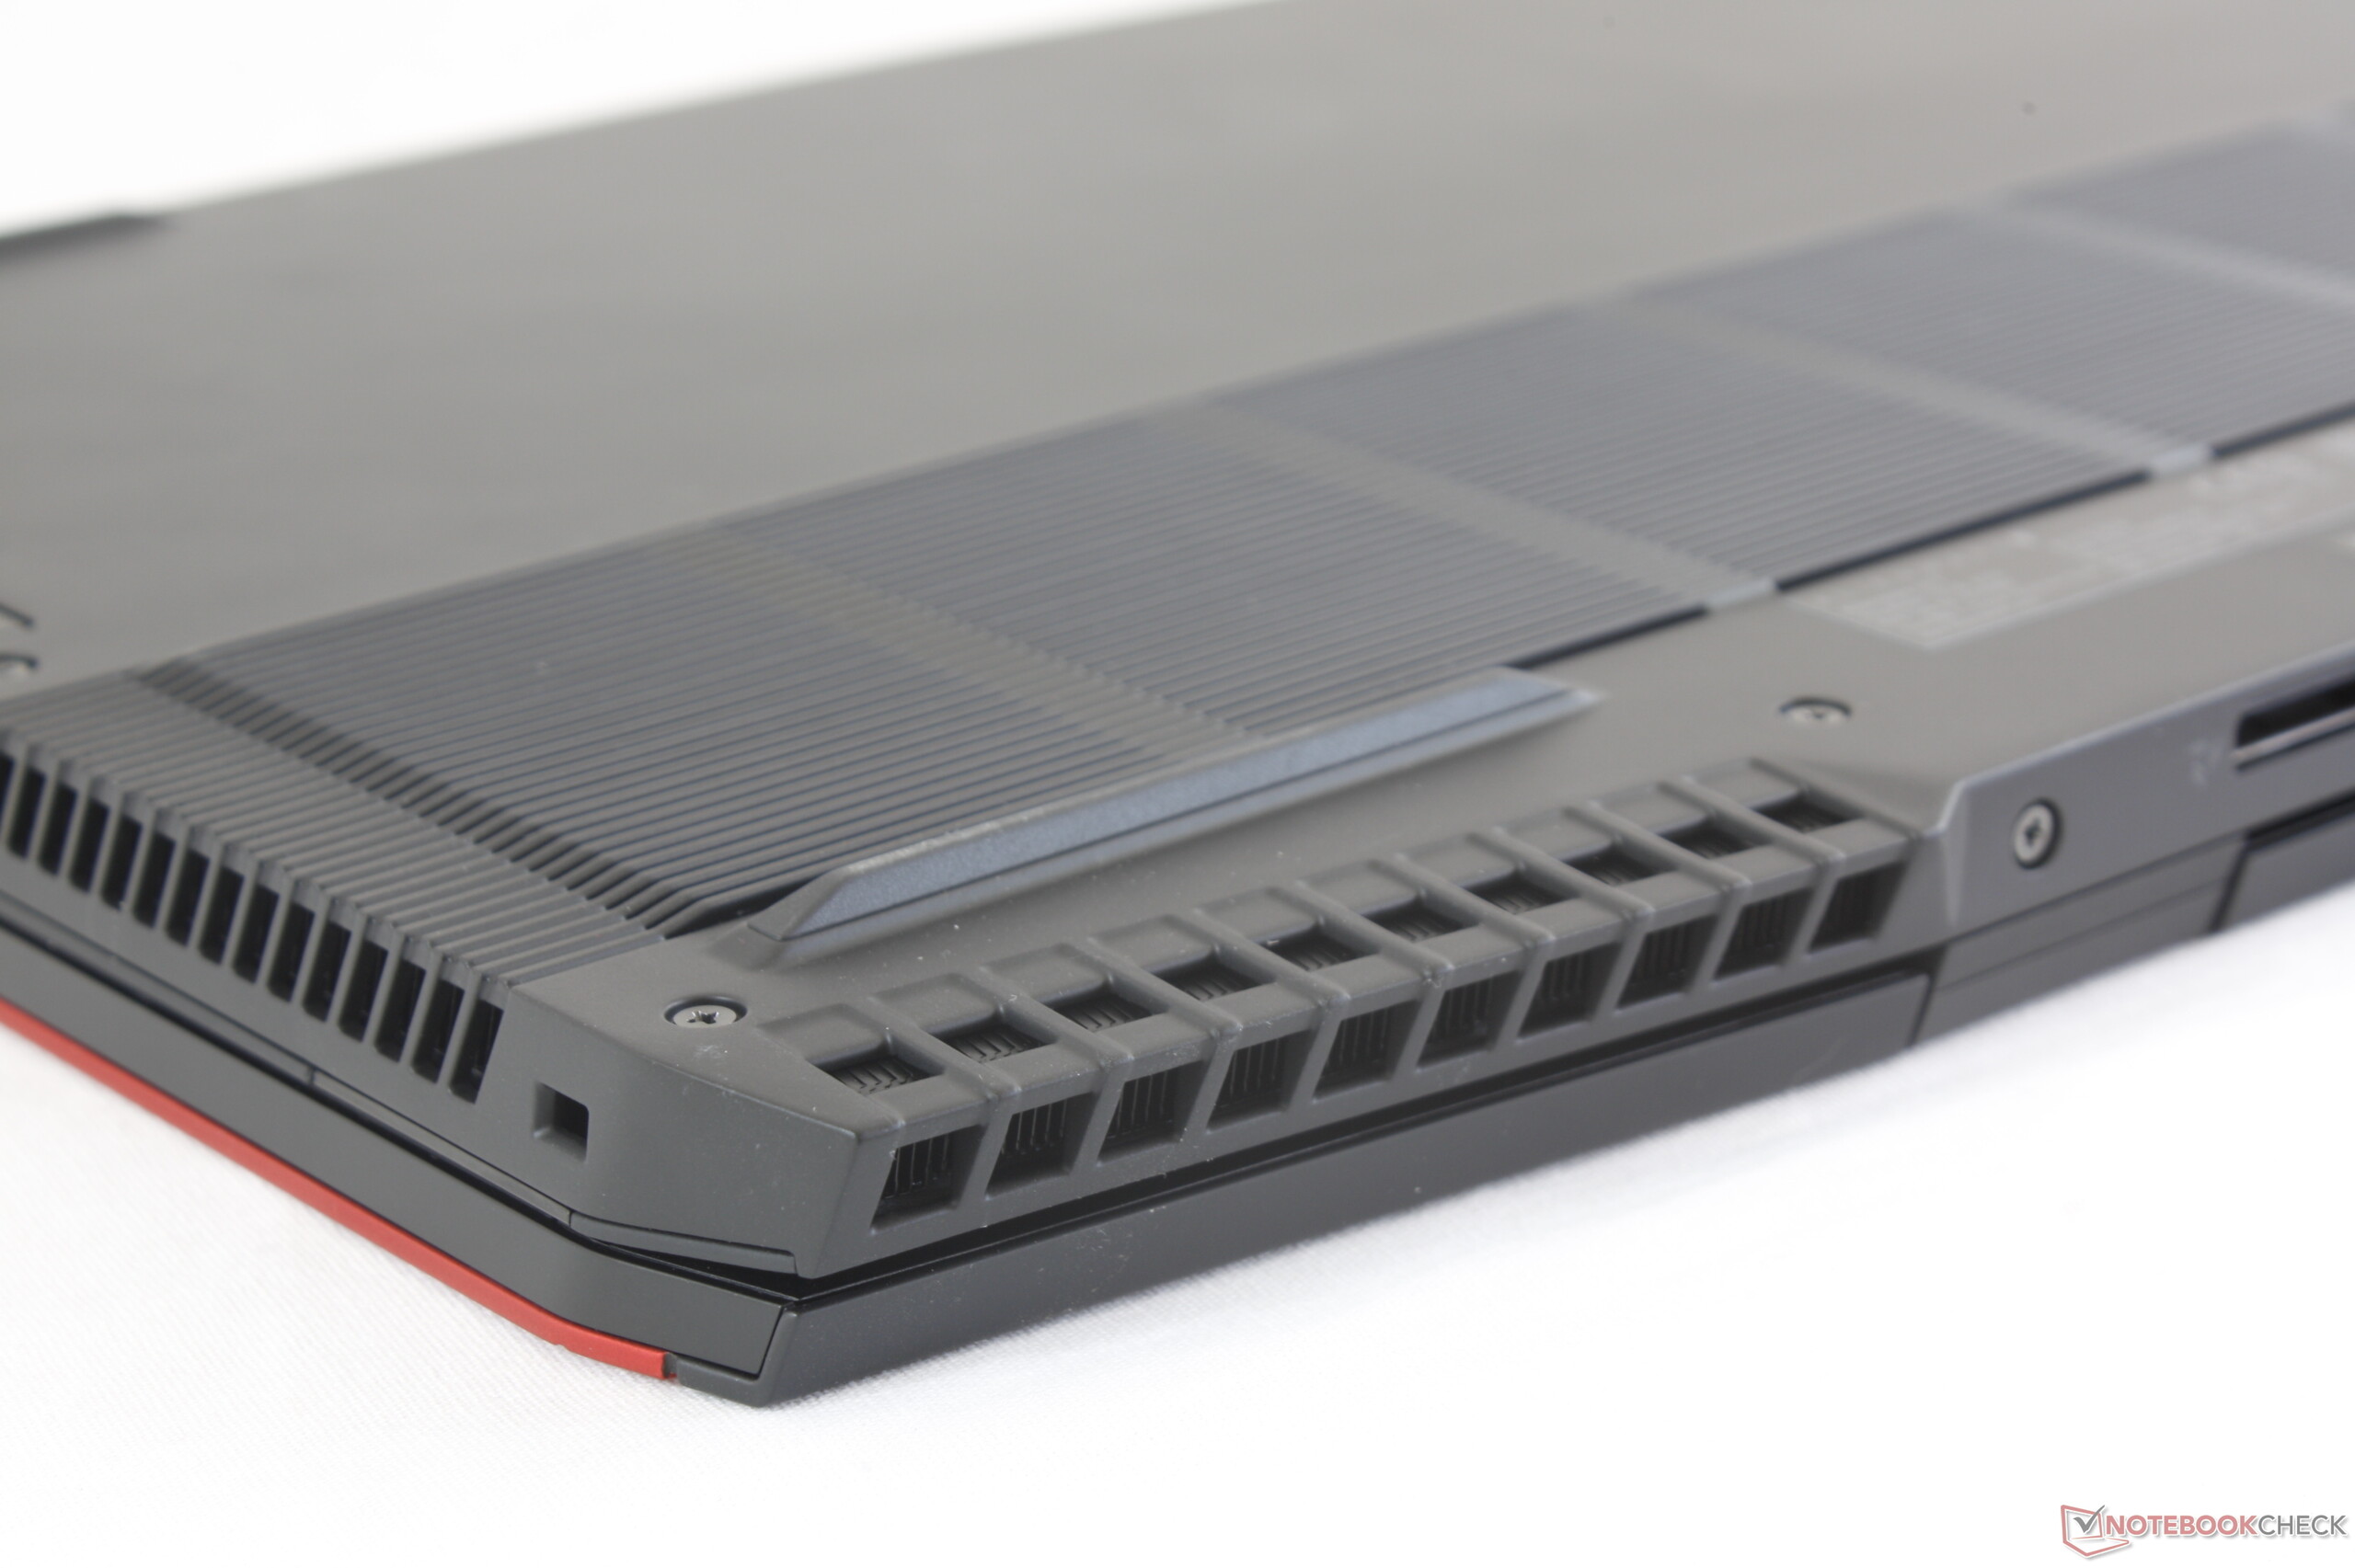
(-) The maximum temperature on the upper side is 55 °C / 131 F, compared to the average of 40.4 °C / 105 F, ranging from 21.2 to 68.8 °C for the class Gaming.
(-) The bottom heats up to a maximum of 60 °C / 140 F, compared to the average of 43.2 °C / 110 F
(+) In idle usage, the average temperature for the upper side is 27.3 °C / 81 F, compared to the device average of 33.9 °C / 93 F.
(±) Playing The Witcher 3, the average temperature for the upper side is 37.4 °C / 99 F, compared to the device average of 33.9 °C / 93 F.
(+) The palmrests and touchpad are reaching skin temperature as a maximum (32.2 °C / 90 F) and are therefore not hot.
(-) The average temperature of the palmrest area of similar devices was 28.8 °C / 83.8 F (-3.4 °C / -6.2 F).
Alienware m17 P37E audio analysis
(±) | speaker loudness is average but good (80.4 dB)
Bass 100 - 315 Hz
(±) | reduced bass - on average 11.4% lower than median
(±) | linearity of bass is average (12.4% delta to prev. frequency)
Mids 400 - 2000 Hz
(+) | balanced mids - only 3% away from median
(+) | mids are linear (6.1% delta to prev. frequency)
Highs 2 - 16 kHz
(+) | balanced highs - only 4.3% away from median
(+) | highs are linear (5.2% delta to prev. frequency)
Overall 100 - 16.000 Hz
(+) | overall sound is linear (13.8% difference to median)
Compared to same class
» 21% of all tested devices in this class were better, 7% similar, 72% worse
» The best had a delta of 6%, average was 18%, worst was 132%
Compared to all devices tested
» 15% of all tested devices were better, 4% similar, 81% worse
» The best had a delta of 4%, average was 24%, worst was 134%
Apple MacBook 12 (Early 2016) 1.1 GHz audio analysis
(+) | speakers can play relatively loud (83.6 dB)
Bass 100 - 315 Hz
(±) | reduced bass - on average 11.3% lower than median
(±) | linearity of bass is average (14.2% delta to prev. frequency)
Mids 400 - 2000 Hz
(+) | balanced mids - only 2.4% away from median
(+) | mids are linear (5.5% delta to prev. frequency)
Highs 2 - 16 kHz
(+) | balanced highs - only 2% away from median
(+) | highs are linear (4.5% delta to prev. frequency)
Overall 100 - 16.000 Hz
(+) | overall sound is linear (10.2% difference to median)
Compared to same class
» 7% of all tested devices in this class were better, 2% similar, 91% worse
» The best had a delta of 5%, average was 18%, worst was 53%
Compared to all devices tested
» 5% of all tested devices were better, 1% similar, 94% worse
» The best had a delta of 4%, average was 24%, worst was 134%
| Off / Standby | |
| Idle | |
| Load |
|
Key:
min: | |
| Alienware m17 P37E i9-8950HK, GeForce RTX 2080 Max-Q, SK Hynix PC401 512GB M.2 (HFS512GD9TNG), IPS, 3840x2160, 17.3" | Alienware 17 R5 i7-8750H, GeForce GTX 1070 Mobile, SK hynix PC401 HFS256GD9TNG, TN, 2560x1440, 17.3" | Asus ROG Strix Scar II GL704GW i7-8750H, GeForce RTX 2070 Mobile, Intel SSD 660p SSDPEKNW512G8, AHVA, 1920x1080, 17.3" | MSI GS75 8SG Stealth i7-8750H, GeForce RTX 2080 Max-Q, 2x Samsung SSD PM981 MZVLB512HAJQ (RAID 0), IPS, 1920x1080, 17.3" | Razer Blade Pro 2017 i7-7820HK, GeForce GTX 1080 Mobile, 2x Samsung SSD PM951 MZVLV256HCHP (RAID 0), IGZO, 3840x2160, 17.3" | Acer Predator Triton 700 i7-7700HQ, GeForce GTX 1080 Max-Q, 2x SK Hynix Canvas SC300 512GB M.2 (HFS512G39MND) (RAID 0), IPS, 1920x1080, 15.6" | |
|---|---|---|---|---|---|---|
| Power Consumption | -8% | 10% | 27% | -19% | -5% | |
| Idle Minimum * (Watt) | 21.2 | 28 -32% | 19 10% | 13 39% | 31 -46% | 28 -32% |
| Idle Average * (Watt) | 29.6 | 32 -8% | 22 26% | 17 43% | 36 -22% | 33 -11% |
| Idle Maximum * (Watt) | 34 | 37 -9% | 29 15% | 23 32% | 44 -29% | 41 -21% |
| Load Average * (Watt) | 130.9 | 112 14% | 102 22% | 90 31% | 107 18% | 94 28% |
| Witcher 3 ultra * (Watt) | 177.5 | 192 -8% | 190 -7% | 147 17% | 212 -19% | 160 10% |
| Load Maximum * (Watt) | 219.7 | 231 -5% | 231 -5% | 215 2% | 258 -17% | 222 -1% |
* ... smaller is better
| Alienware m17 P37E i9-8950HK, GeForce RTX 2080 Max-Q, 90 Wh | Alienware 17 R5 i7-8750H, GeForce GTX 1070 Mobile, 99 Wh | Asus ROG Strix Scar II GL704GW i7-8750H, GeForce RTX 2070 Mobile, 66 Wh | MSI GS75 8SG Stealth i7-8750H, GeForce RTX 2080 Max-Q, 80.25 Wh | Razer Blade Pro 2017 i7-7820HK, GeForce GTX 1080 Mobile, 99 Wh | Acer Predator Triton 700 i7-7700HQ, GeForce GTX 1080 Max-Q, 54 Wh | |
|---|---|---|---|---|---|---|
| Battery runtime | -13% | -5% | 2% | -4% | -25% | |
| Reader / Idle (h) | 9.1 | 4.5 -51% | 6.2 -32% | 7.7 -15% | 4.2 -54% | 2.5 -73% |
| WiFi v1.3 (h) | 4.9 | 3.6 -27% | 3.9 -20% | 5.3 8% | 3.3 -33% | 2.4 -51% |
| Load (h) | 0.8 | 1.1 38% | 1.1 38% | 0.9 13% | 1.4 75% | 1.2 50% |
| Witcher 3 ultra (h) | 0.9 |
Pros
Cons
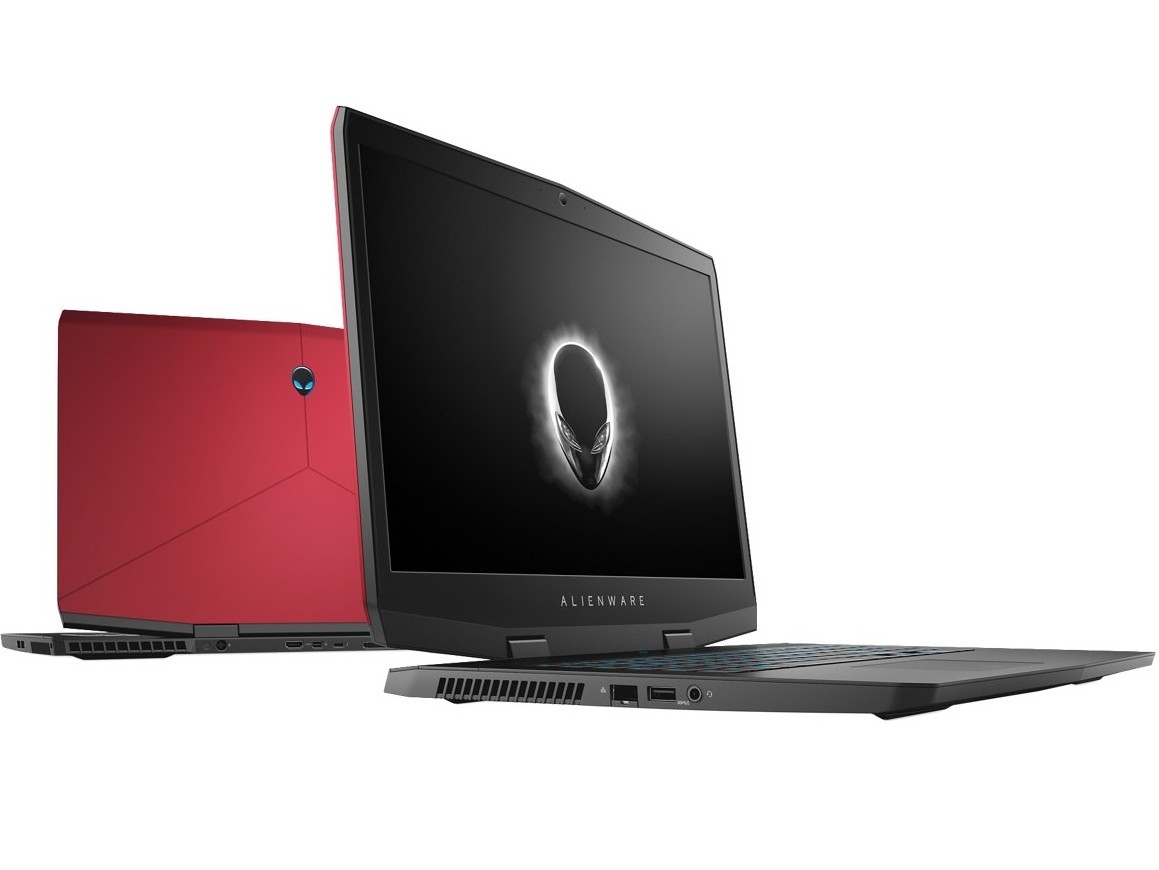
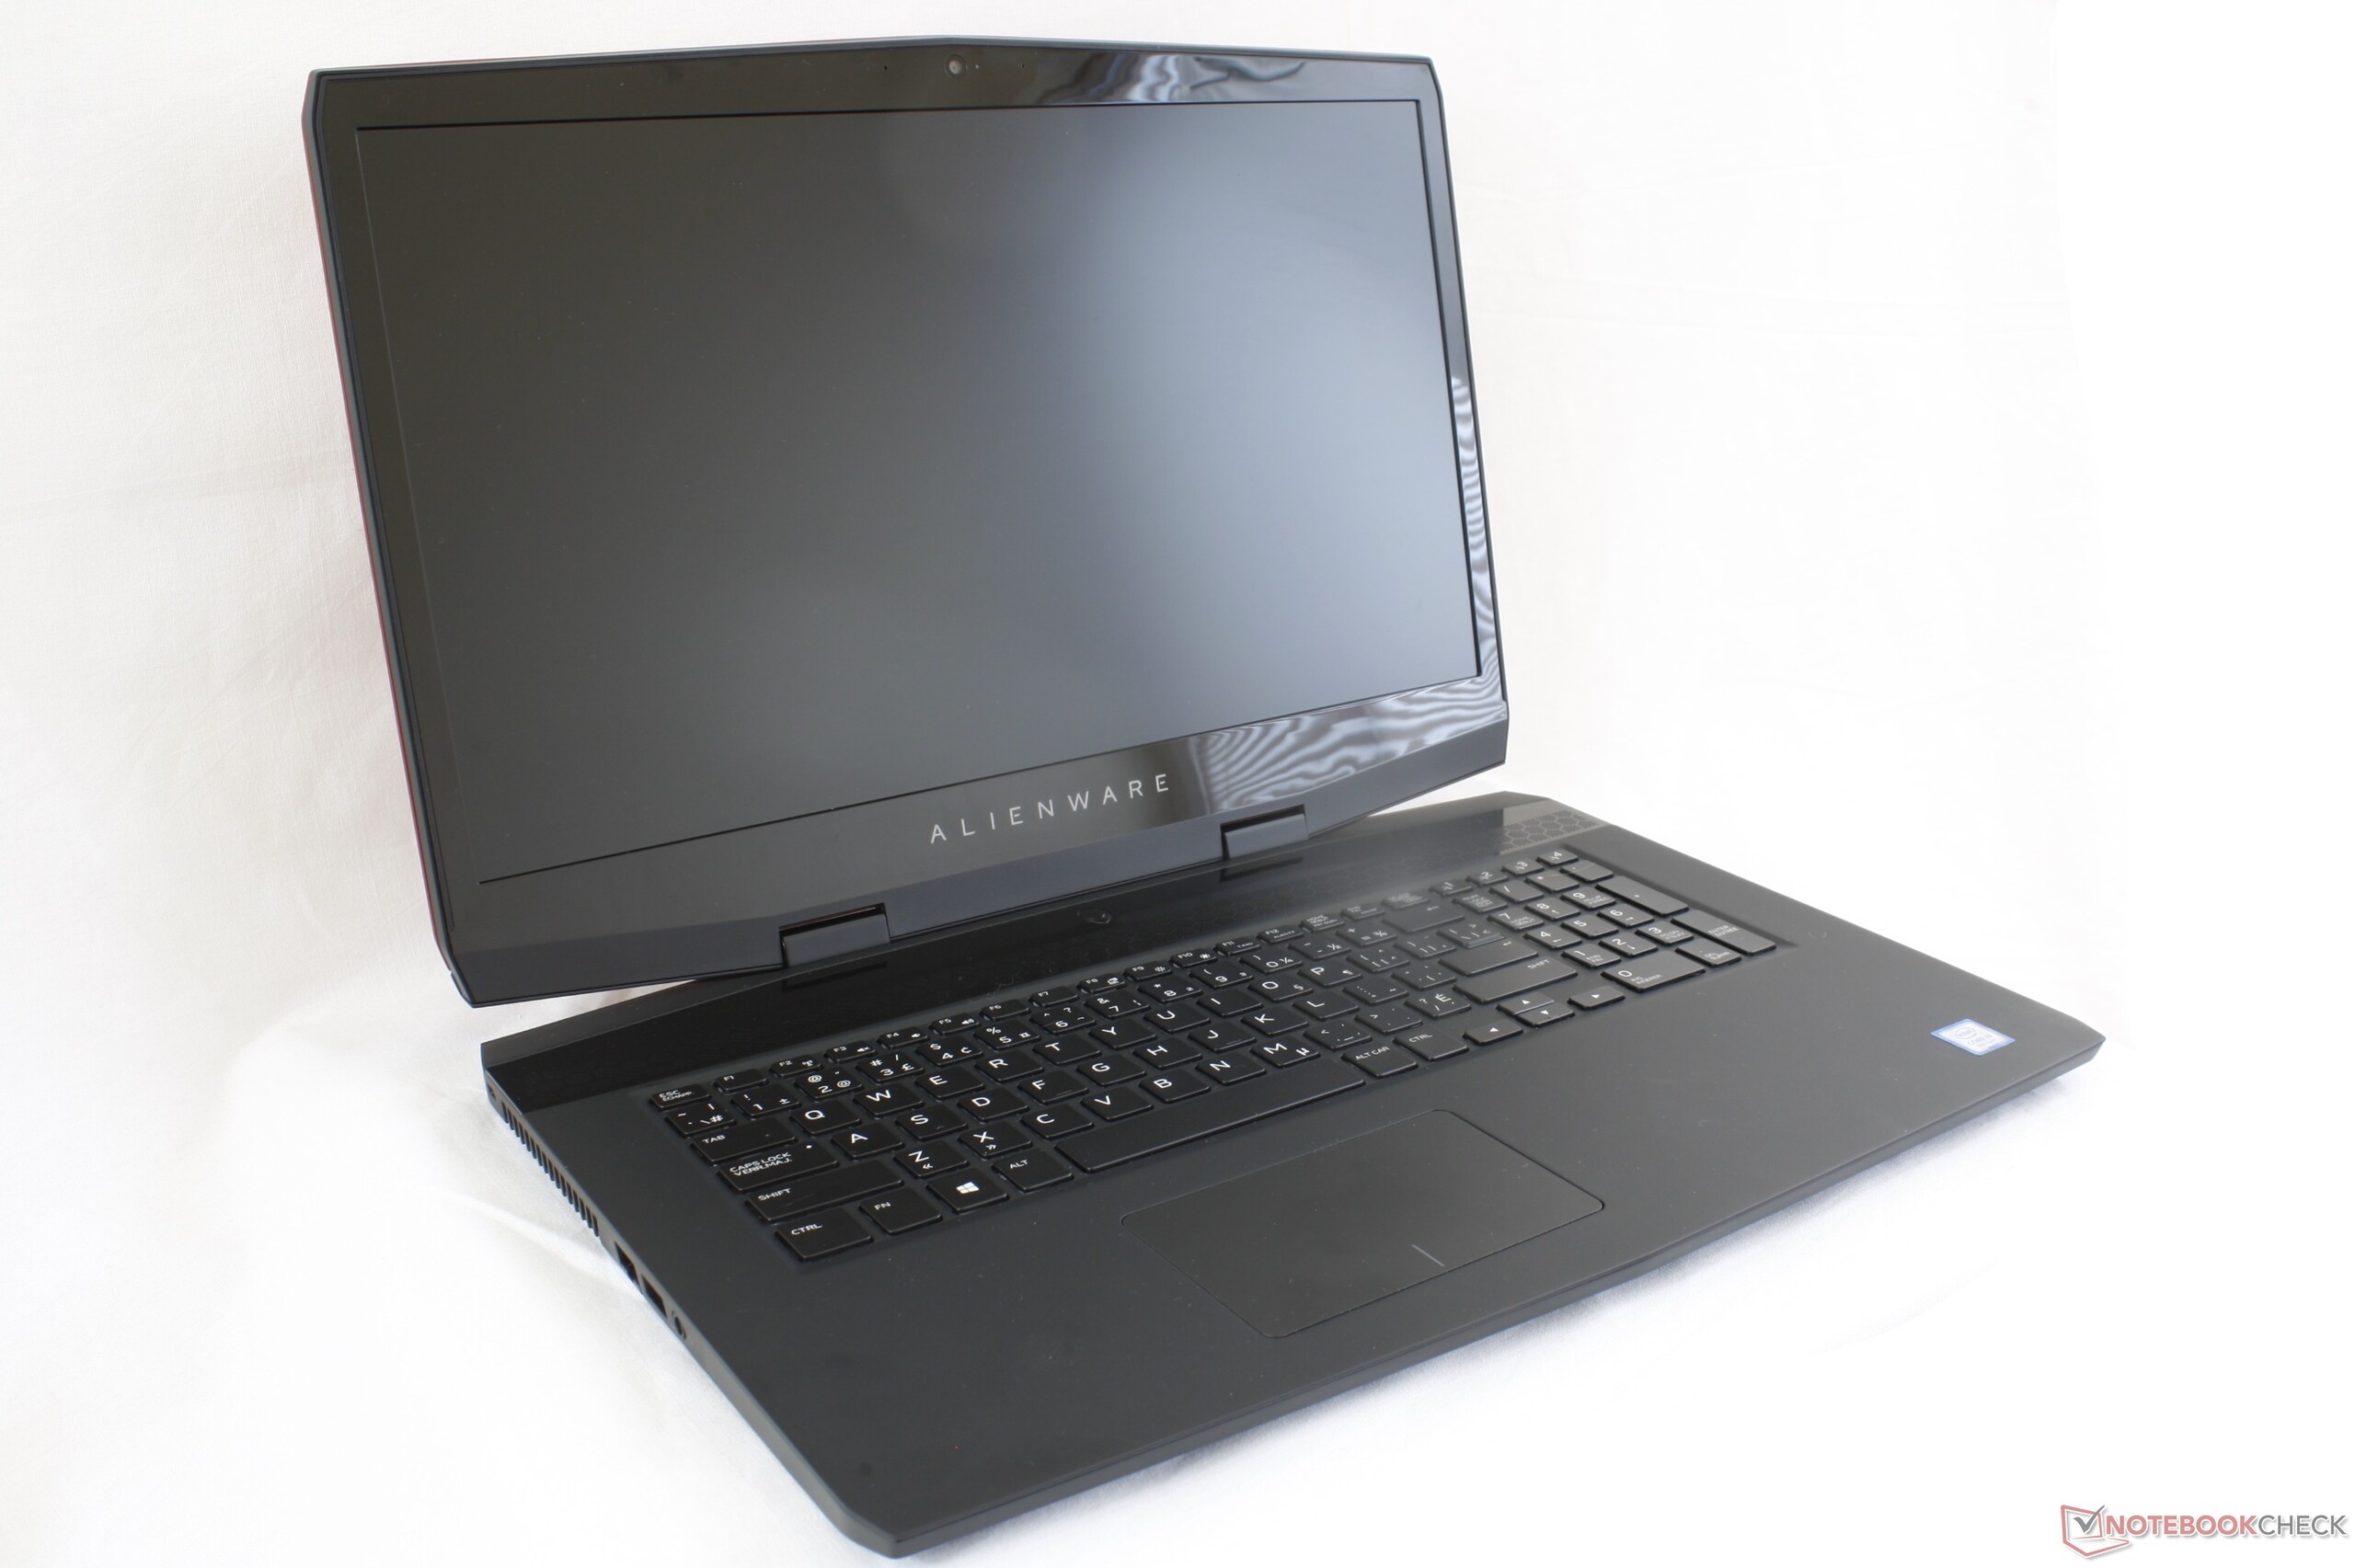
戴尔巧妙地将其Alienware 17系列分为两个截然不同的版本:Alienware m17和Alienware Area-51m。虽然较薄的m17与原来的17系列相比已没有什么相同点,但较大且满血的Area-51m接过了交接棒。曾经笨重的17英寸Alienware系列现在可以吸引喜欢更薄的笔记本电脑的游戏玩家,以及希望从轻薄外形中获得尽可能多的性能的游戏玩家。
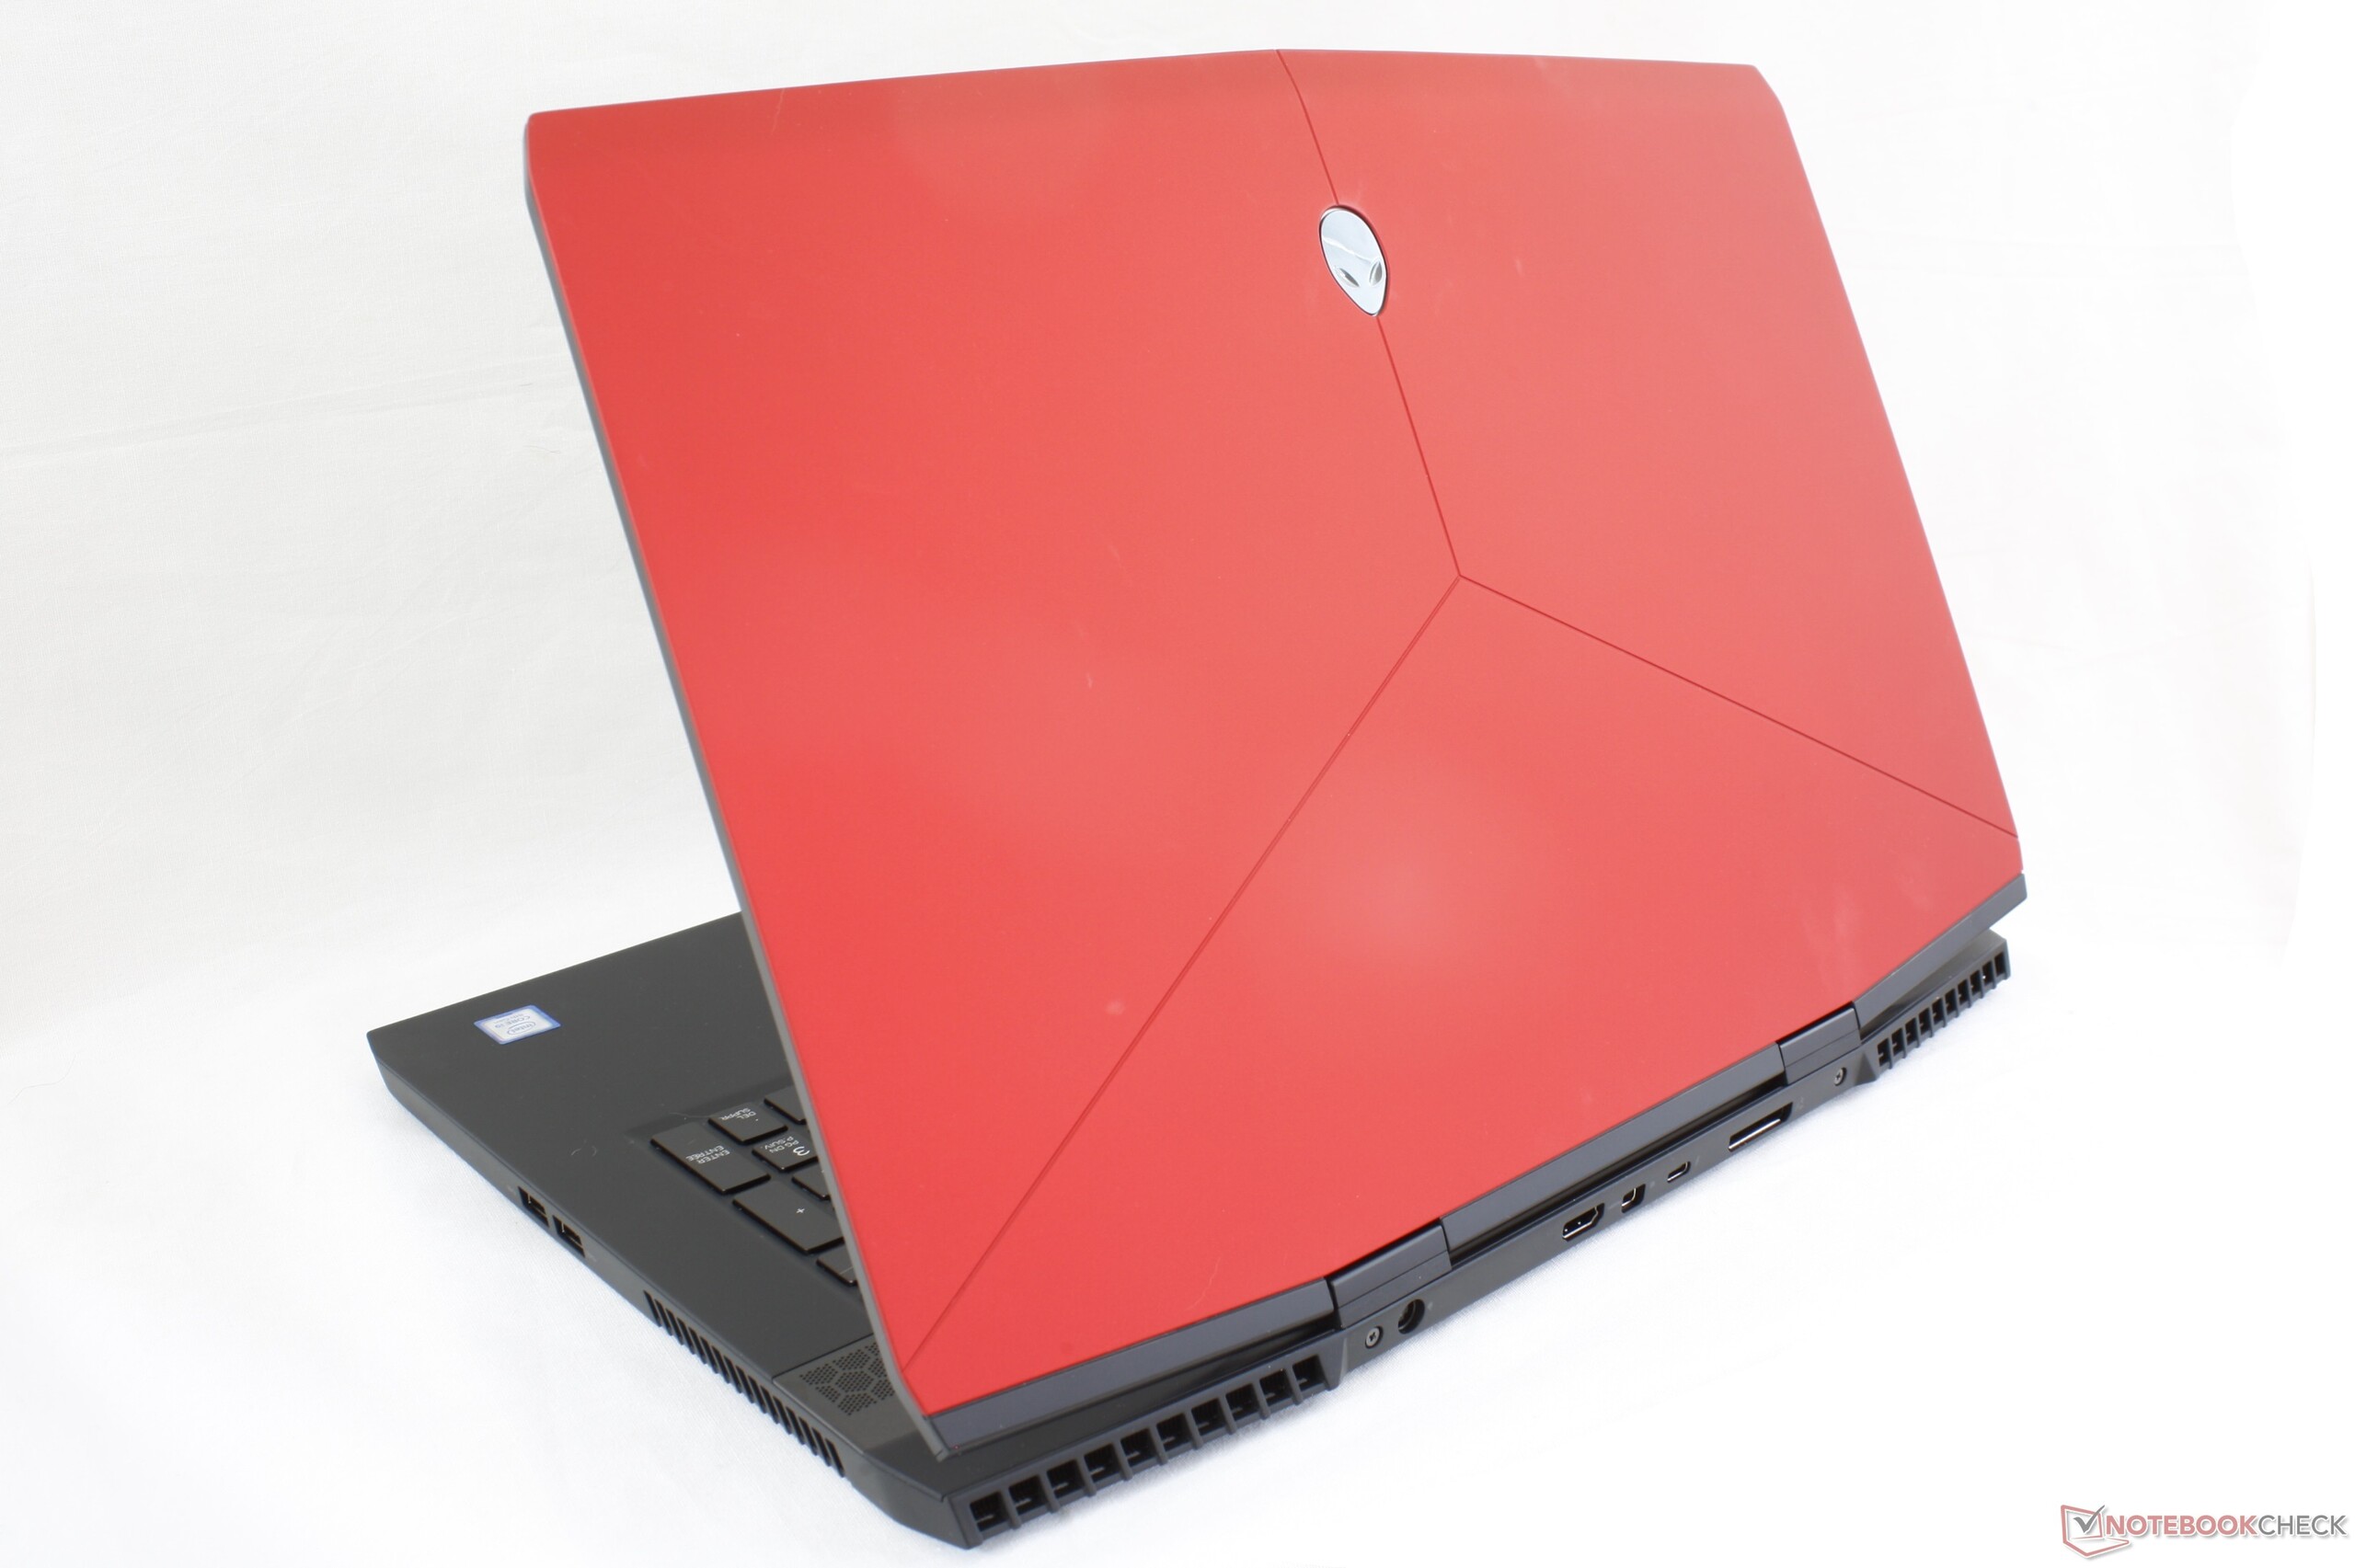
因为m17本质上是一个“Alienware 17轻薄版”,但是原版系列的粉丝们会为这样一个事实感到遗憾:它以更薄更轻的名义牺牲了一些经典的Alienware功能。它仍然没有MSI,华硕或宏基的最新型号那样轻薄,因此m17更像是超薄和厚重之间的中间解决方案。另一方面,额外的周长使得m17底盘比其许多超薄替代品更加坚固,尤其是特别A面。
我们最大的抱怨与核心温度,风扇噪音和键盘有关。即使风扇在最大声的情况下运行也能达到98摄氏度的核心温度,对于许多人来说游戏会很难运行。同时,软键反馈更适合于薄型超极本,而不是像m17这样的发烧级游戏笔记本电脑。 MSI和Clevo笔记本电脑上的SteelSeries键盘提供更坚实的关键反馈,以获得更紧凑的游戏体验。 Area-51m和旧版Alienware 17上的斜面键盘布局也让游戏感觉更好。
与Alienware 17相比,Alienware m17显着减轻了重量和尺寸。然而,缺点是显而易见的,包括省略了许多硬件功能以及换成Max-Q GPU。幸运的是,想要更经典的Alienware体验的用户可以选择Area-51m,而其他用户会更喜欢m17
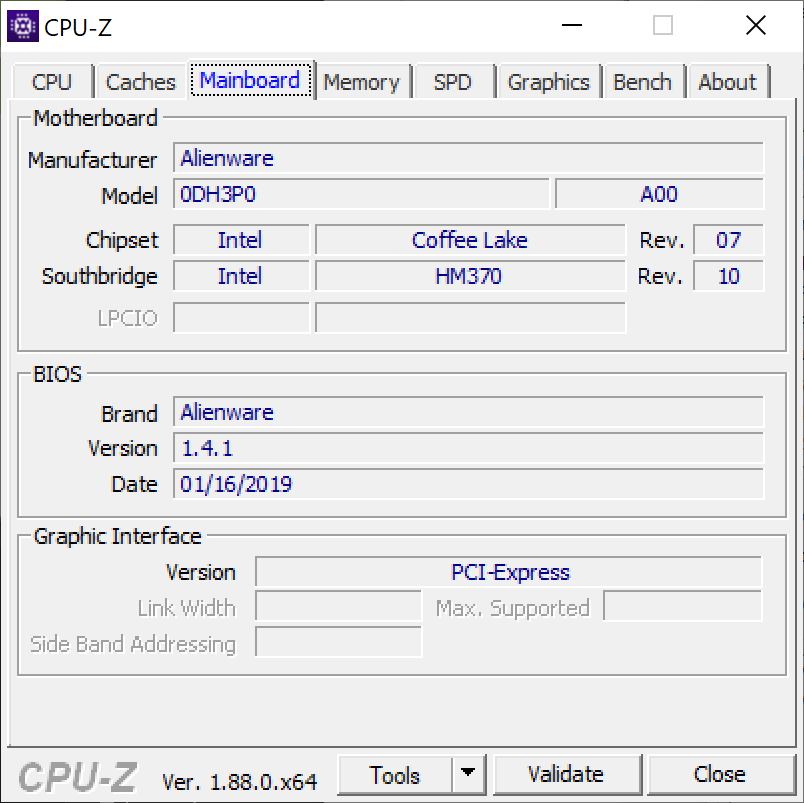
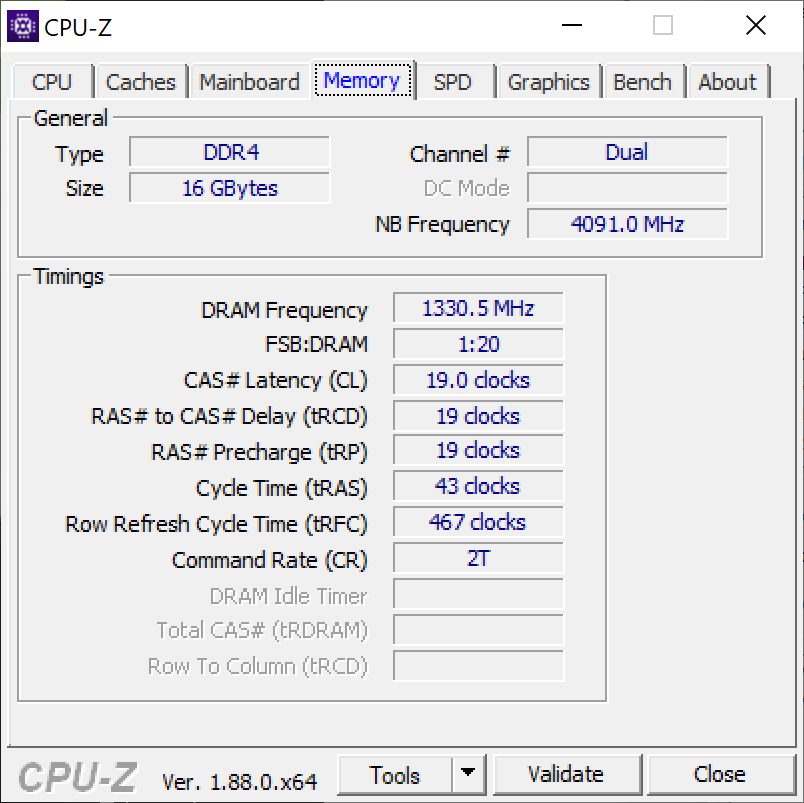
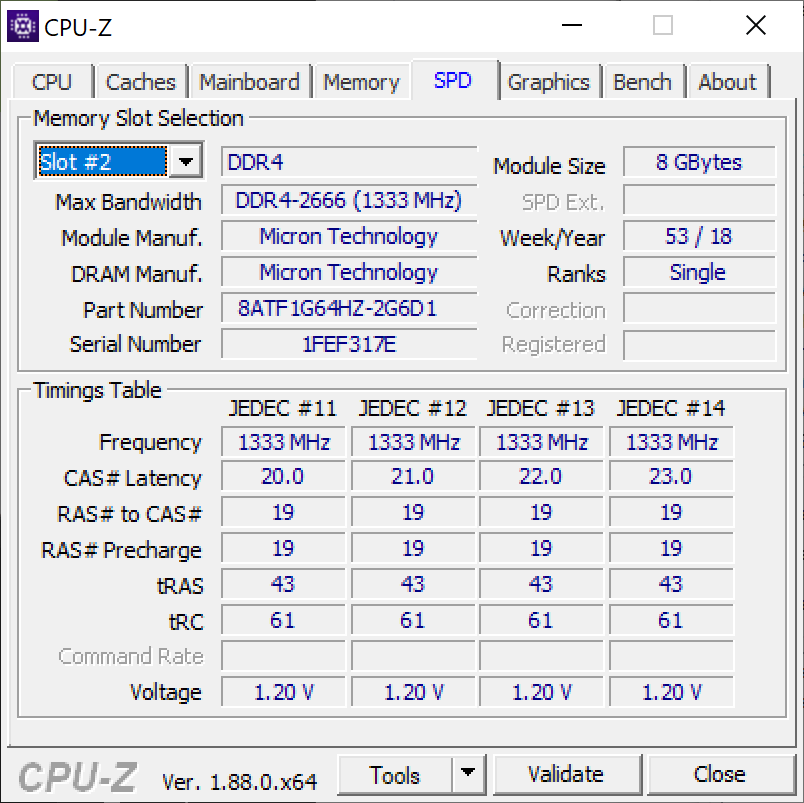
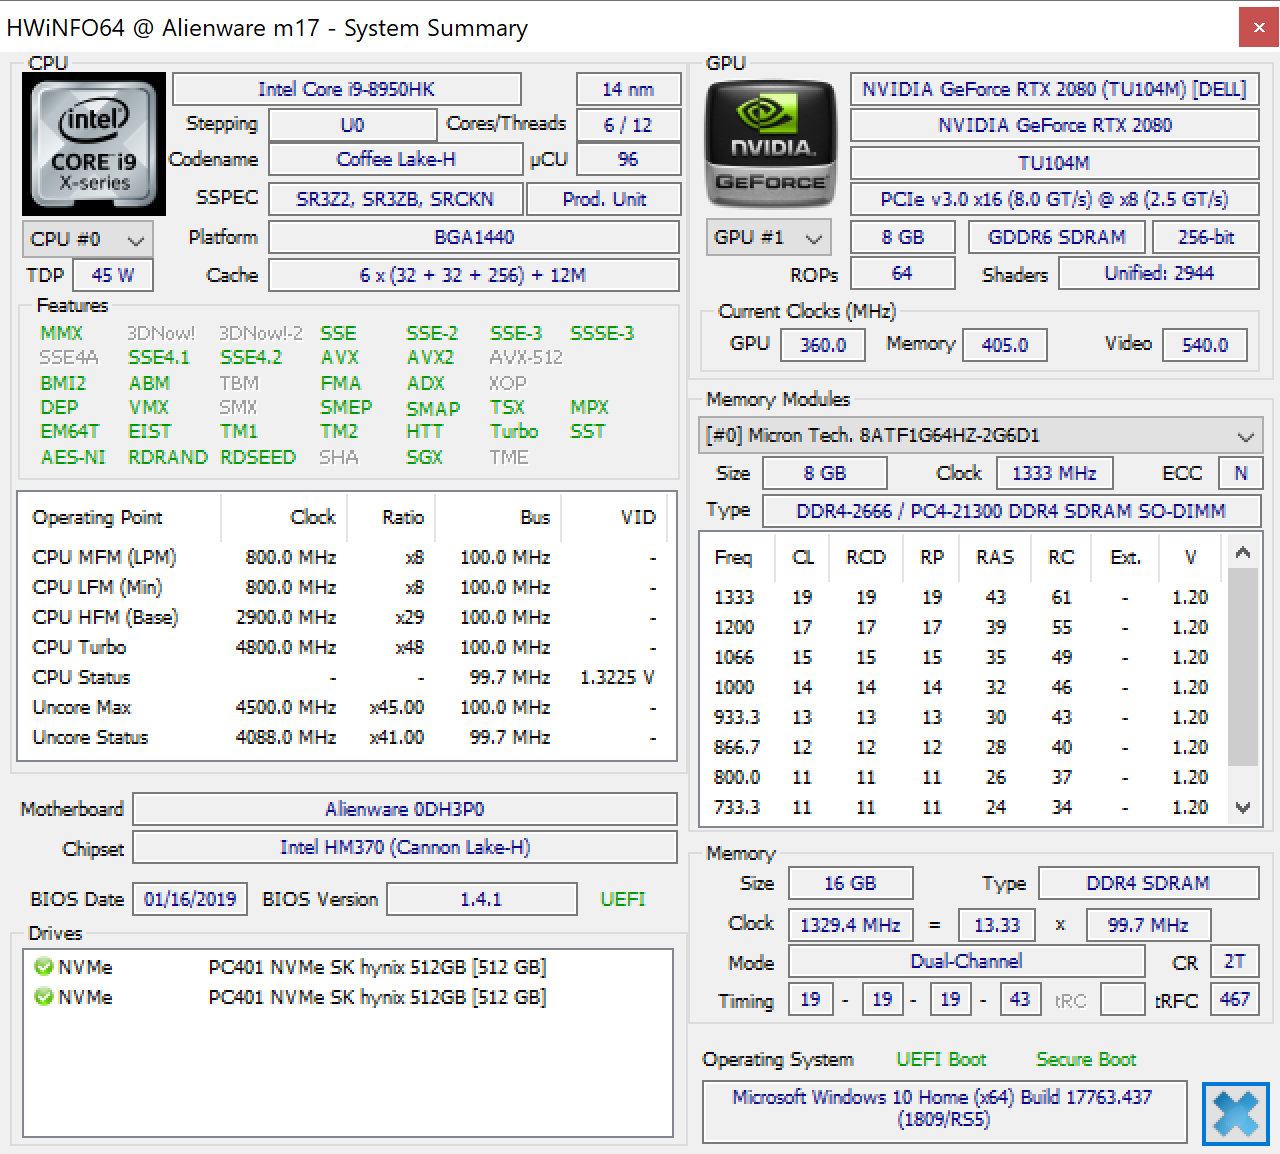
Alienware m17 P37E
- 04/14/2019 v6 (old)
Allen Ngo
Price comparison

