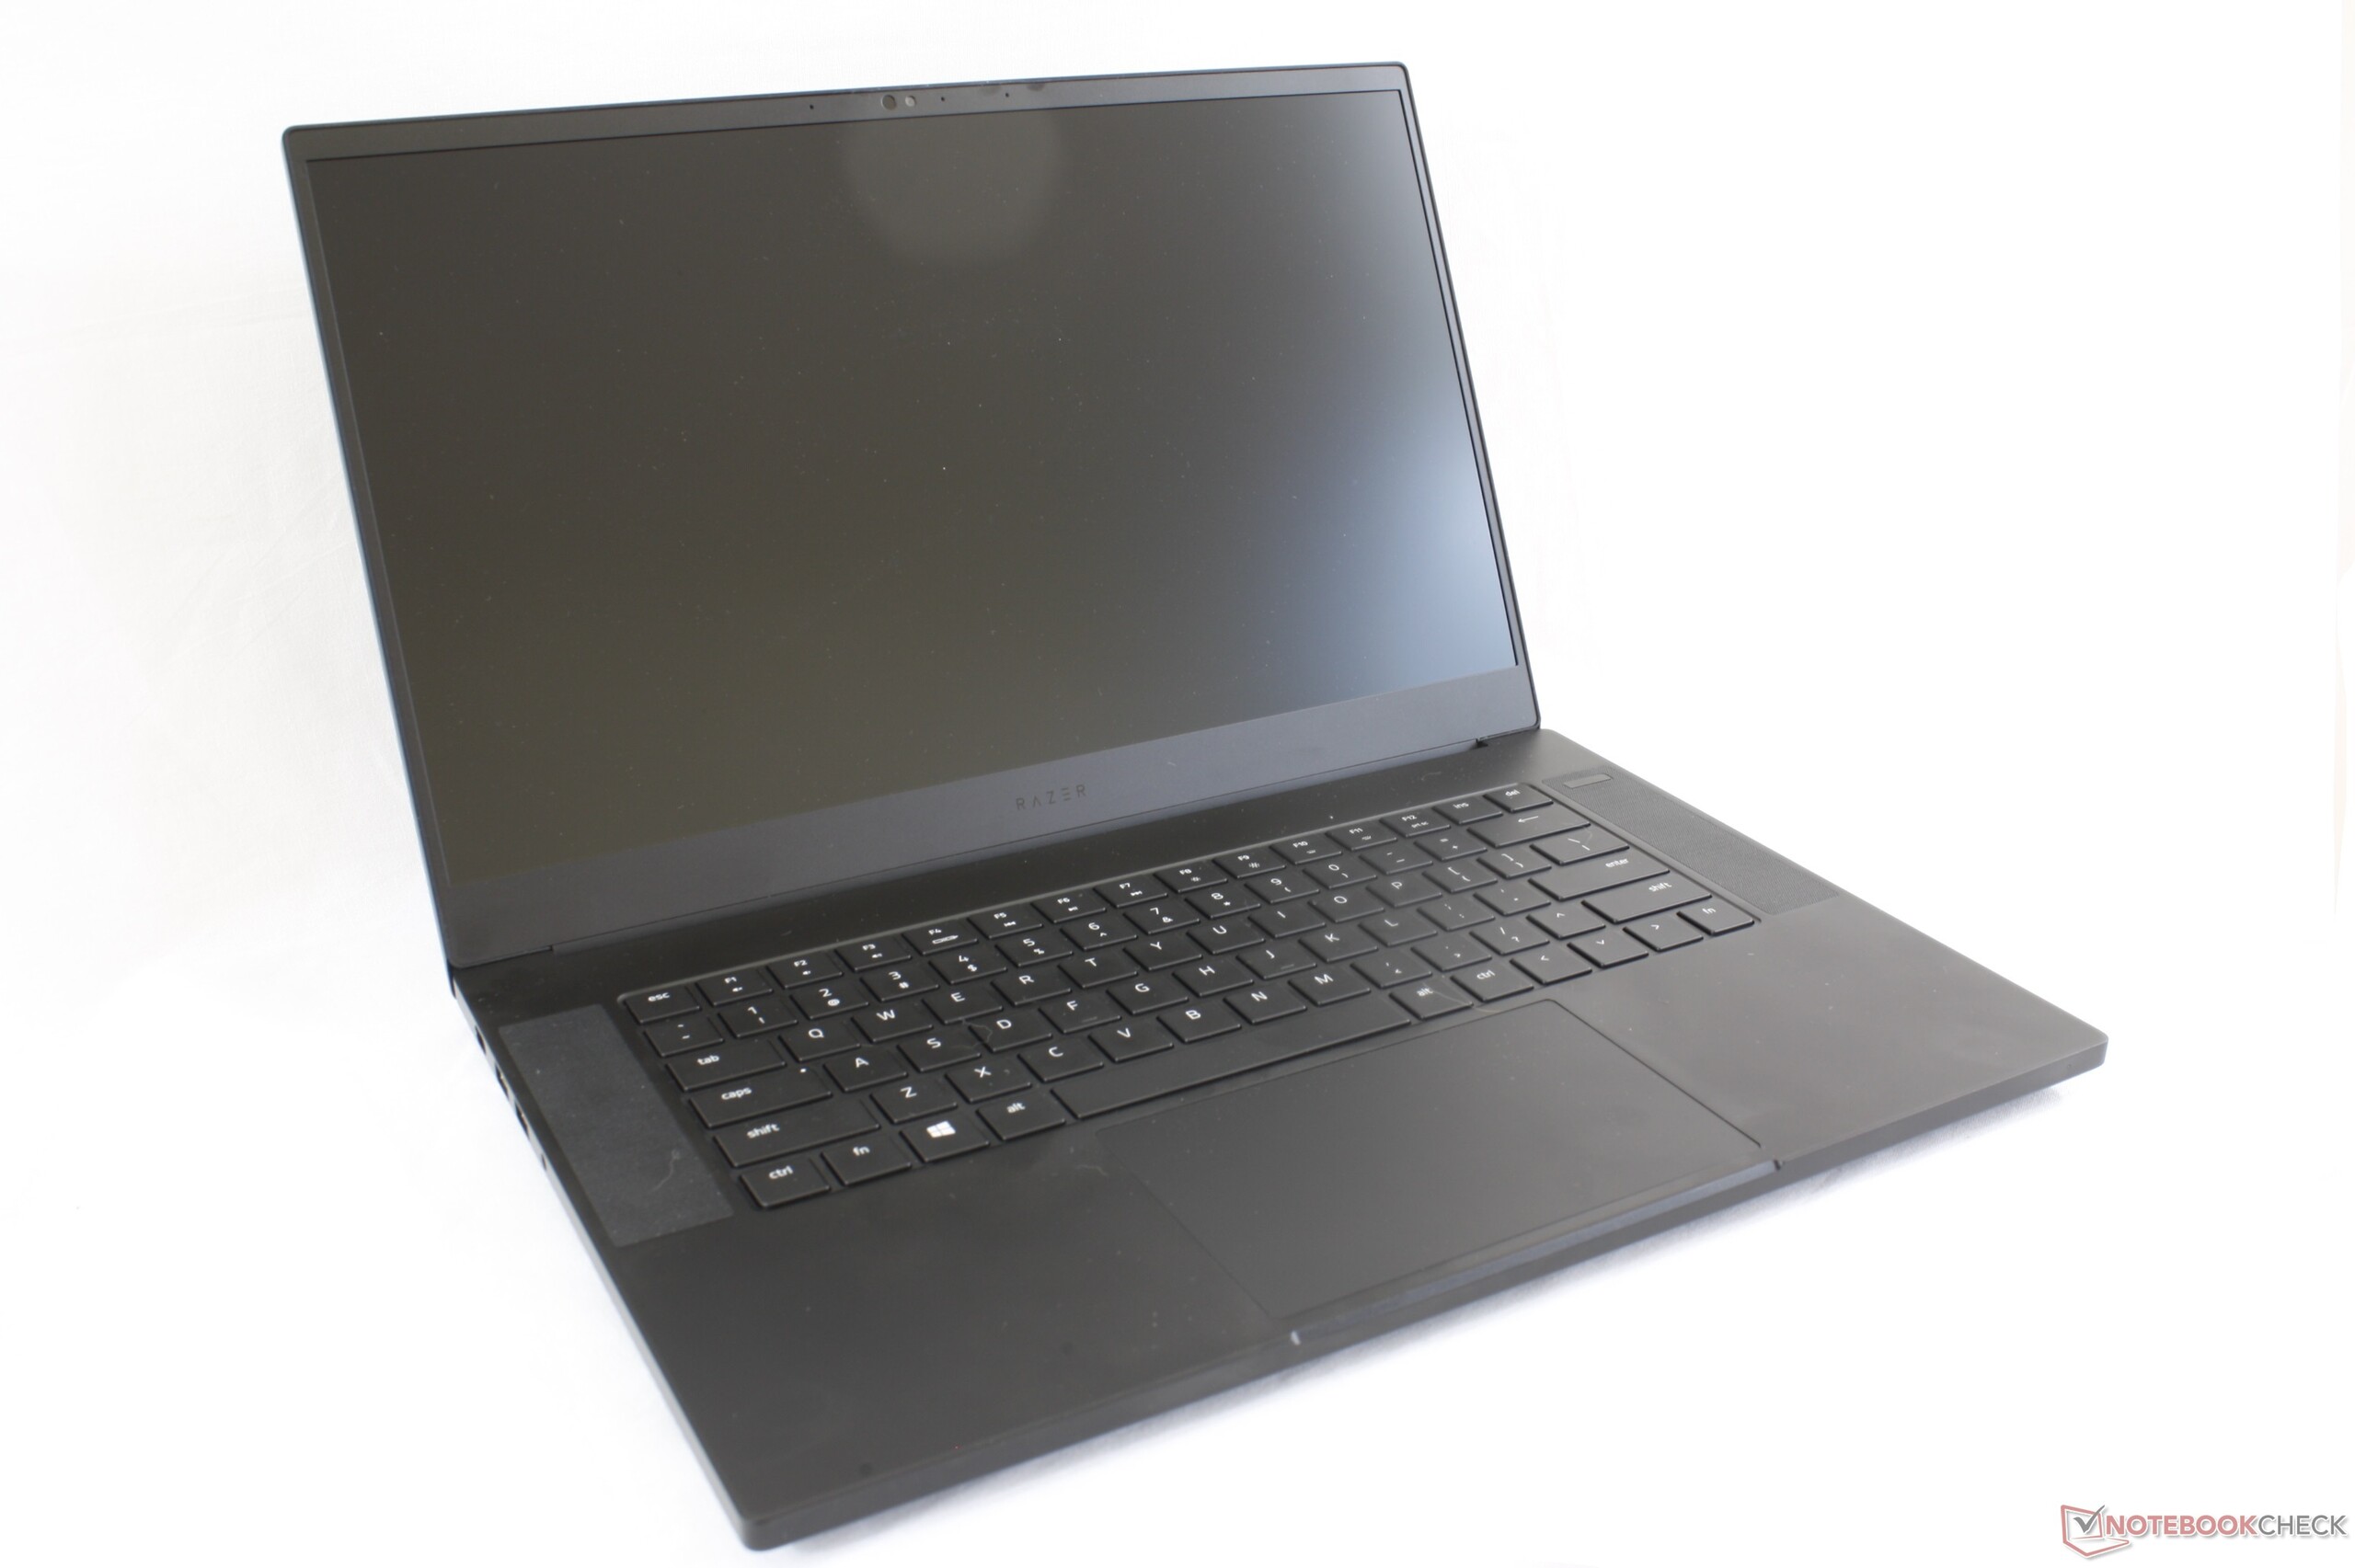
雷蛇灵刃15进阶版(i7-9750H,RTX 2080 Max-Q,FHD)笔记本电脑评测
| |||||||||||||||||||||||||
Brightness Distribution: 87 %
Center on Battery: 293 cd/m²
Contrast: 1010:1 (Black: 0.29 cd/m²)
ΔE ColorChecker Calman: 1.69 | ∀{0.5-29.43 Ø4.71}
calibrated: 1.24
ΔE Greyscale Calman: 2.3 | ∀{0.09-98 Ø4.96}
98.5% sRGB (Argyll 1.6.3 3D)
63% AdobeRGB 1998 (Argyll 1.6.3 3D)
68.5% AdobeRGB 1998 (Argyll 3D)
98.1% sRGB (Argyll 3D)
66.9% Display P3 (Argyll 3D)
Gamma: 2.3
CCT: 6758 K
| Razer Blade 15 RTX 2080 Max-Q Sharp LQ156M1JW03 (SHP14C5), IPS, 15.6", 1920x1080 | Razer Blade 15 RTX 2070 Max-Q LG Philips LGD05C0, IPS, 15.6", 1920x1080 | Alienware m15 GTX 1070 Max-Q AU Optronics B156HAN, IPS, 15.6", 1920x1080 | Asus Zephyrus S GX502GW AU Optronics B156HAN08.2 (AUO82ED), IPS, 15.6", 1920x1080 | Apple MacBook Pro 15 2018 (2.6 GHz, 560X) APPA040, IPS, 15.4", 2880x1800 | MSI GS65 Stealth Thin 8RE-051US AUO80ED, IPS, 15.6", 1920x1080 | |
|---|---|---|---|---|---|---|
| Display | -3% | -7% | -5% | 25% | -3% | |
| Display P3 Coverage (%) | 66.9 | 65.3 -2% | 63.5 -5% | 64.9 -3% | 98.7 48% | 65.8 -2% |
| sRGB Coverage (%) | 98.1 | 94.9 -3% | 89.4 -9% | 91 -7% | 99.9 2% | 92.1 -6% |
| AdobeRGB 1998 Coverage (%) | 68.5 | 66.3 -3% | 64.5 -6% | 65.9 -4% | 86.6 26% | 67 -2% |
| Response Times | -22% | -28% | 30% | -219% | -36% | |
| Response Time Grey 50% / Grey 80% * (ms) | 12.8 ? | 16.8 ? -31% | 18 ? -41% | 7.2 ? 44% | 43.2 ? -238% | 20 ? -56% |
| Response Time Black / White * (ms) | 10.4 ? | 11.6 ? -12% | 12 ? -15% | 8.8 ? 15% | 31.2 ? -200% | 12 ? -15% |
| PWM Frequency (Hz) | 23810 ? | 117000 ? | ||||
| Screen | -19% | -46% | -18% | 33% | -35% | |
| Brightness middle (cd/m²) | 293 | 314.7 7% | 353.6 21% | 286 -2% | 520 77% | 250.9 -14% |
| Brightness (cd/m²) | 270 | 312 16% | 346 28% | 275 2% | 492 82% | 257 -5% |
| Brightness Distribution (%) | 87 | 90 3% | 86 -1% | 90 3% | 88 1% | 83 -5% |
| Black Level * (cd/m²) | 0.29 | 0.38 -31% | 0.3 -3% | 0.37 -28% | 0.39 -34% | 0.32 -10% |
| Contrast (:1) | 1010 | 828 -18% | 1179 17% | 773 -23% | 1333 32% | 784 -22% |
| Colorchecker dE 2000 * | 1.69 | 2.56 -51% | 4.55 -169% | 2.19 -30% | 1.2 29% | 2.77 -64% |
| Colorchecker dE 2000 max. * | 3.37 | 4.89 -45% | 7.91 -135% | 4.4 -31% | 2.3 32% | 5.89 -75% |
| Colorchecker dE 2000 calibrated * | 1.24 | 1.71 -38% | 3.37 -172% | 2.27 -83% | 2.5 -102% | |
| Greyscale dE 2000 * | 2.3 | 3.4 -48% | 4.1 -78% | 2.2 4% | 1.3 43% | 4 -74% |
| Gamma | 2.3 96% | 2.3 96% | 2.27 97% | 2.41 91% | 2.18 101% | 2.27 97% |
| CCT | 6758 96% | 6435 101% | 7434 87% | 6405 101% | 6738 96% | 6901 94% |
| Color Space (Percent of AdobeRGB 1998) (%) | 63 | 60.7 -4% | 57.9 -8% | 59 -6% | 60 -5% | |
| Color Space (Percent of sRGB) (%) | 98.5 | 94.6 -4% | 88.9 -10% | 91 -8% | 92 -7% | |
| Total Average (Program / Settings) | -15% /
-17% | -27% /
-37% | 2% /
-10% | -54% /
-8% | -25% /
-29% |
* ... smaller is better
Display Response Times
| ↔ Response Time Black to White | ||
|---|---|---|
| 10.4 ms ... rise ↗ and fall ↘ combined | ↗ 6 ms rise | 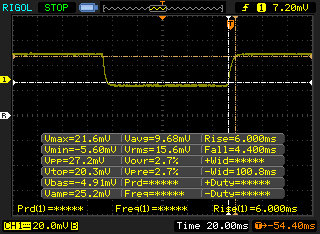 |
| ↘ 4.4 ms fall | ||
| The screen shows good response rates in our tests, but may be too slow for competitive gamers. In comparison, all tested devices range from 0.1 (minimum) to 240 (maximum) ms. » 28 % of all devices are better. This means that the measured response time is better than the average of all tested devices (19.8 ms). | ||
| ↔ Response Time 50% Grey to 80% Grey | ||
| 12.8 ms ... rise ↗ and fall ↘ combined | ↗ 6.8 ms rise | 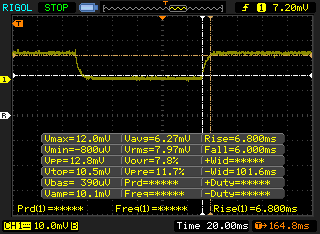 |
| ↘ 6 ms fall | ||
| The screen shows good response rates in our tests, but may be too slow for competitive gamers. In comparison, all tested devices range from 0.165 (minimum) to 636 (maximum) ms. » 26 % of all devices are better. This means that the measured response time is better than the average of all tested devices (30.9 ms). | ||
Screen Flickering / PWM (Pulse-Width Modulation)
| Screen flickering / PWM detected | 23810 Hz | ≤ 10 % brightness setting | 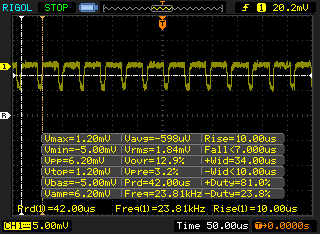 |
The display backlight flickers at 23810 Hz (worst case, e.g., utilizing PWM) Flickering detected at a brightness setting of 10 % and below. There should be no flickering or PWM above this brightness setting. The frequency of 23810 Hz is quite high, so most users sensitive to PWM should not notice any flickering. In comparison: 52 % of all tested devices do not use PWM to dim the display. If PWM was detected, an average of 7748 (minimum: 5 - maximum: 343500) Hz was measured. | |||
| PCMark 8 Home Score Accelerated v2 | 4380 points | |
| PCMark 8 Work Score Accelerated v2 | 5749 points | |
| PCMark 10 Score | 5839 points | |
Help | ||
| Razer Blade 15 RTX 2080 Max-Q Samsung SSD PM981 MZVLB512HAJQ | Razer Blade 15 RTX 2070 Max-Q Samsung SSD PM981 MZVLB512HAJQ | Alienware m15 GTX 1070 Max-Q Toshiba XG5 KXG50ZNV512G | Asus Zephyrus S GX502GW 2x Intel SSD 660p SSDPEKNW512G8 (RAID 0) | Apple MacBook Pro 15 2018 (2.6 GHz, 560X) Apple SSD AP0512 | |
|---|---|---|---|---|---|
| AS SSD | 1% | -43% | -21% | -76% | |
| Seq Read (MB/s) | 1832 | 1840 0% | 1967 7% | 2506 37% | 2239 22% |
| Seq Write (MB/s) | 1864 | 1822 -2% | 1135 -39% | 1712 -8% | 1644 -12% |
| 4K Read (MB/s) | 52.1 | 52.3 0% | 29.17 -44% | 48.32 -7% | 9.46 -82% |
| 4K Write (MB/s) | 108.3 | 110.7 2% | 93.4 -14% | 103.6 -4% | 18.78 -83% |
| 4K-64 Read (MB/s) | 1159 | 1126 -3% | 995 -14% | 624 -46% | 965 -17% |
| 4K-64 Write (MB/s) | 1807 | 1717 -5% | 656 -64% | 1253 -31% | 163.5 -91% |
| Access Time Read * (ms) | 0.05 | 0.047 6% | 0.116 -132% | 0.08 -60% | 0.225 -350% |
| Access Time Write * (ms) | 0.034 | 0.033 3% | 0.063 -85% | 0.04 -18% | |
| Score Read (Points) | 1394 | 1362 -2% | 1221 -12% | 923 -34% | 1199 -14% |
| Score Write (Points) | 2102 | 2010 -4% | 862 -59% | 1528 -27% | 347 -83% |
| Score Total (Points) | 4221 | 4079 -3% | 2667 -37% | 2896 -31% | 2119 -50% |
| Copy ISO MB/s (MB/s) | 2083 | 1975 -5% | 642 -69% | ||
| Copy Program MB/s (MB/s) | 496.5 | 526 6% | 431.5 -13% | ||
| Copy Game MB/s (MB/s) | 977 | 1200 23% | 706 -28% |
* ... smaller is better

| 3DMark 11 Performance | 21563 points | |
| 3DMark Cloud Gate Standard Score | 32108 points | |
| 3DMark Fire Strike Score | 17838 points | |
| 3DMark Time Spy Score | 7410 points | |
Help | ||
| The Witcher 3 - 1920x1080 Ultra Graphics & Postprocessing (HBAO+) | |
| MSI GE75 9SG | |
| Average NVIDIA GeForce RTX 2080 Max-Q (65.7 - 92.7, n=22) | |
| Razer Blade 15 RTX 2080 Max-Q | |
| Razer Blade 15 RTX 2070 Max-Q | |
| Alienware m15 GTX 1070 Max-Q | |
| Schenker Compact 15 | |
| MSI GS65 Stealth Thin 8RE-051US | |
| Acer Aspire Nitro 5 AN515-54-53Z2 | |
| Razer Blade Stealth i7-8565U | |
| low | med. | high | ultra | |
|---|---|---|---|---|
| BioShock Infinite (2013) | 323.8 | 280.2 | 262 | 170 |
| The Witcher 3 (2015) | 273.9 | 227.6 | 146.6 | 78.3 |
| Rise of the Tomb Raider (2016) | 239.5 | 174.7 | 143.8 | 126 |
| Razer Blade 15 RTX 2080 Max-Q GeForce RTX 2080 Max-Q, i7-9750H, Samsung SSD PM981 MZVLB512HAJQ | Razer Blade 15 RTX 2070 Max-Q GeForce RTX 2070 Max-Q, i7-8750H, Samsung SSD PM981 MZVLB512HAJQ | Alienware m15 GTX 1070 Max-Q GeForce GTX 1070 Max-Q, i7-8750H, Toshiba XG5 KXG50ZNV512G | Asus Zephyrus S GX502GW GeForce RTX 2070 Mobile, i7-9750H, 2x Intel SSD 660p SSDPEKNW512G8 (RAID 0) | Apple MacBook Pro 15 2018 (2.6 GHz, 560X) Radeon Pro 560X, i7-8850H, Apple SSD AP0512 | MSI GS65 Stealth Thin 8RE-051US GeForce GTX 1060 Mobile, i7-8750H, Samsung SSD PM981 MZVLB256HAHQ | Dell XPS 15 9570 Core i9 UHD GeForce GTX 1050 Ti Max-Q, i9-8950HK, Samsung SSD PM981 MZVLB1T0HALR | |
|---|---|---|---|---|---|---|---|
| Noise | -1% | -6% | -22% | -6% | -5% | -2% | |
| off / environment * (dB) | 28.3 | 28.8 -2% | 28.6 -1% | 30 -6% | 29.6 -5% | 28.4 -0% | 28.2 -0% |
| Idle Minimum * (dB) | 28.8 | 28.8 -0% | 28.6 1% | 31 -8% | 30.1 -5% | 28.4 1% | 28.5 1% |
| Idle Average * (dB) | 28.8 | 28.8 -0% | 28.6 1% | 33 -15% | 30.1 -5% | 28.4 1% | 28.6 1% |
| Idle Maximum * (dB) | 29 | 29.4 -1% | 28.6 1% | 38 -31% | 30.1 -4% | 29.6 -2% | 28.8 1% |
| Load Average * (dB) | 33.5 | 35.7 -7% | 40.8 -22% | 50 -49% | 46.8 -40% | 43.5 -30% | 36.2 -8% |
| Witcher 3 ultra * (dB) | 45 | 42.5 6% | 49.6 -10% | 53 -18% | 36 20% | 45.7 -2% | 47.6 -6% |
| Load Maximum * (dB) | 45.2 | 45 -0% | 49.6 -10% | 56 -24% | 46.8 -4% | 45.7 -1% | 47.6 -5% |
* ... smaller is better
Noise level
| Idle |
| 28.8 / 28.8 / 29 dB(A) |
| Load |
| 33.5 / 45.2 dB(A) |
 | ||
30 dB silent 40 dB(A) audible 50 dB(A) loud |
||
min: | ||
(-) The maximum temperature on the upper side is 47 °C / 117 F, compared to the average of 40.4 °C / 105 F, ranging from 21.2 to 68.8 °C for the class Gaming.
(-) The bottom heats up to a maximum of 49.2 °C / 121 F, compared to the average of 43.2 °C / 110 F
(+) In idle usage, the average temperature for the upper side is 27.5 °C / 82 F, compared to the device average of 33.9 °C / 93 F.
(±) Playing The Witcher 3, the average temperature for the upper side is 37.5 °C / 100 F, compared to the device average of 33.9 °C / 93 F.
(±) The palmrests and touchpad can get very hot to the touch with a maximum of 36 °C / 96.8 F.
(-) The average temperature of the palmrest area of similar devices was 28.8 °C / 83.8 F (-7.2 °C / -13 F).
Razer Blade 15 RTX 2080 Max-Q audio analysis
(+) | speakers can play relatively loud (83.8 dB)
Bass 100 - 315 Hz
(±) | reduced bass - on average 10.7% lower than median
(±) | linearity of bass is average (11.3% delta to prev. frequency)
Mids 400 - 2000 Hz
(±) | higher mids - on average 5.7% higher than median
(+) | mids are linear (5.4% delta to prev. frequency)
Highs 2 - 16 kHz
(±) | reduced highs - on average 6% lower than median
(±) | linearity of highs is average (9.1% delta to prev. frequency)
Overall 100 - 16.000 Hz
(±) | linearity of overall sound is average (21.7% difference to median)
Compared to same class
» 78% of all tested devices in this class were better, 5% similar, 17% worse
» The best had a delta of 6%, average was 18%, worst was 132%
Compared to all devices tested
» 62% of all tested devices were better, 7% similar, 31% worse
» The best had a delta of 4%, average was 23%, worst was 134%
Apple MacBook 12 (Early 2016) 1.1 GHz audio analysis
(+) | speakers can play relatively loud (83.6 dB)
Bass 100 - 315 Hz
(±) | reduced bass - on average 11.3% lower than median
(±) | linearity of bass is average (14.2% delta to prev. frequency)
Mids 400 - 2000 Hz
(+) | balanced mids - only 2.4% away from median
(+) | mids are linear (5.5% delta to prev. frequency)
Highs 2 - 16 kHz
(+) | balanced highs - only 2% away from median
(+) | highs are linear (4.5% delta to prev. frequency)
Overall 100 - 16.000 Hz
(+) | overall sound is linear (10.2% difference to median)
Compared to same class
» 7% of all tested devices in this class were better, 2% similar, 90% worse
» The best had a delta of 5%, average was 18%, worst was 53%
Compared to all devices tested
» 5% of all tested devices were better, 1% similar, 94% worse
» The best had a delta of 4%, average was 23%, worst was 134%
| Off / Standby | |
| Idle | |
| Load |
|
Key:
min: | |
| Razer Blade 15 RTX 2080 Max-Q i7-9750H, GeForce RTX 2080 Max-Q, Samsung SSD PM981 MZVLB512HAJQ, IPS, 1920x1080, 15.6" | Razer Blade 15 RTX 2070 Max-Q i7-8750H, GeForce RTX 2070 Max-Q, Samsung SSD PM981 MZVLB512HAJQ, IPS, 1920x1080, 15.6" | Alienware m15 GTX 1070 Max-Q i7-8750H, GeForce GTX 1070 Max-Q, Toshiba XG5 KXG50ZNV512G, IPS, 1920x1080, 15.6" | Asus Zephyrus S GX502GW i7-9750H, GeForce RTX 2070 Mobile, 2x Intel SSD 660p SSDPEKNW512G8 (RAID 0), IPS, 1920x1080, 15.6" | Apple MacBook Pro 15 2018 (2.6 GHz, 560X) i7-8850H, Radeon Pro 560X, Apple SSD AP0512, IPS, 2880x1800, 15.4" | MSI GS65 Stealth Thin 8RE-051US i7-8750H, GeForce GTX 1060 Mobile, Samsung SSD PM981 MZVLB256HAHQ, IPS, 1920x1080, 15.6" | Dell XPS 15 9570 Core i9 UHD i9-8950HK, GeForce GTX 1050 Ti Max-Q, Samsung SSD PM981 MZVLB1T0HALR, IPS, 3840x2160, 15.6" | |
|---|---|---|---|---|---|---|---|
| Power Consumption | 10% | 16% | -47% | 40% | 18% | 24% | |
| Idle Minimum * (Watt) | 12.5 | 10.4 17% | 7.6 39% | 24 -92% | 3.4 73% | 8.7 30% | 7.1 43% |
| Idle Average * (Watt) | 15.3 | 14.6 5% | 13.8 10% | 27 -76% | 11 28% | 13 15% | 13.6 11% |
| Idle Maximum * (Watt) | 20.7 | 16.3 21% | 14.6 29% | 33 -59% | 14.9 28% | 14.3 31% | 14.1 32% |
| Load Average * (Watt) | 90.2 | 88.5 2% | 97.6 -8% | 129 -43% | 78.9 13% | 107.4 -19% | 103.9 -15% |
| Witcher 3 ultra * (Watt) | 162 | 155.4 4% | 145.8 10% | 176 -9% | 129 20% | 103 36% | |
| Load Maximum * (Watt) | 209.3 | 182.4 13% | 172.5 18% | 216 -3% | 91.2 56% | 151.5 28% | 130.9 37% |
* ... smaller is better
| Razer Blade 15 RTX 2080 Max-Q i7-9750H, GeForce RTX 2080 Max-Q, 80 Wh | Razer Blade 15 RTX 2070 Max-Q i7-8750H, GeForce RTX 2070 Max-Q, 80 Wh | Alienware m15 GTX 1070 Max-Q i7-8750H, GeForce GTX 1070 Max-Q, 90 Wh | Asus Zephyrus S GX502GW i7-9750H, GeForce RTX 2070 Mobile, 76 Wh | Apple MacBook Pro 15 2018 (2.6 GHz, 560X) i7-8850H, Radeon Pro 560X, 83 Wh | MSI GS65 Stealth Thin 8RE-051US i7-8750H, GeForce GTX 1060 Mobile, 82 Wh | Dell XPS 15 9570 Core i9 UHD i9-8950HK, GeForce GTX 1050 Ti Max-Q, 97 Wh | |
|---|---|---|---|---|---|---|---|
| Battery runtime | -14% | -6% | -49% | 55% | -18% | -6% | |
| Reader / Idle (h) | 15.9 | 11.4 -28% | 10.5 -34% | 5.9 -63% | 15 -6% | ||
| WiFi v1.3 (h) | 6.6 | 6.5 -2% | 7.7 17% | 3.7 -44% | 10.2 55% | 6.2 -6% | 8.6 30% |
| Load (h) | 1.7 | 1.5 -12% | 1.7 0% | 1 -41% | 1.2 -29% | 1 -41% | |
| Witcher 3 ultra (h) | 1.5 |
Pros
Cons
与上一代SKU相比,最新Blade 15最吸引人的地方在于其240 Hz以及OLED的显示屏。虽然我们现在不能评测OLED的选项,但从60 Hz升级到240秒,远比从Wi-Fi 5升级到Wi-Fi 6或从8代U升级到9代U来的明显。在游戏和游戏之外,快速刷新率的平滑性,响应性的极致体验都是切实可见的。
同时,考虑到相比较RTX 2070 Max-Q,RTX 2080 Max-Q可以将游戏性能提高17%,而不会对风扇噪音,温度或续航时间产生实际影响。然而,2080 Max-Q选项的价格要贵500美元(约3500元人民币),因此购买最好的Blade 15需要承受一定的溢价。
对于超级发烧友之外的大多数用户来说,原来的144 Hz屏幕仍然绰绰有余,因为在现实中很难区分144 Hz和240 Hz之间的差异。任何一个选项都会使60 Hz刷新率在使用几天后看起来很不习惯。节省下来的钱可以用于升级一些更重要的功能,如额外的存储,RAM,配件,甚至是RazerCare延长保修计划。
雷蛇最全能的游戏笔记本电脑通过配备这些额外的高端SKU为爱好者带来了更好的效果。新升级巩固了雷蛇作为一个为游戏玩家打造的公司的地位。尽管如此,主流和中端游戏玩家也不会从已经很出色的144赫兹和8代U的Blade 15中获得任何巨大的性能提升。
Razer Blade 15 RTX 2080 Max-Q
- 05/20/2019 v6 (old)
Allen Ngo
Price comparison

