雷蛇灵刃17 Pro笔记本电脑评测
| SD Card Reader | |
| average JPG Copy Test (av. of 3 runs) | |
| Dell XPS 15 9570 Core i9 UHD (Toshiba Exceria Pro SDXC 64 GB UHS-II) | |
| Razer Blade Pro 17 RTX 2080 Max-Q (Toshiba Exceria Pro SDXC 64 GB UHS-II) | |
| Asus ROG Strix Scar II GL704GW (Toshiba Exceria Pro SDXC 64 GB UHS-II) | |
| Razer Blade Pro 2017 (Toshiba Exceria Pro SDXC 64 GB UHS-II) | |
| maximum AS SSD Seq Read Test (1GB) | |
| Dell XPS 15 9570 Core i9 UHD (Toshiba Exceria Pro SDXC 64 GB UHS-II) | |
| Razer Blade Pro 17 RTX 2080 Max-Q (Toshiba Exceria Pro SDXC 64 GB UHS-II) | |
| Asus ROG Strix Scar II GL704GW (Toshiba Exceria Pro SDXC 64 GB UHS-II) | |
| Razer Blade Pro 2017 (Toshiba Exceria Pro SDXC 64 GB UHS-II) | |
| |||||||||||||||||||||||||
Brightness Distribution: 94 %
Center on Battery: 299.3 cd/m²
Contrast: 1032:1 (Black: 0.29 cd/m²)
ΔE ColorChecker Calman: 2.55 | ∀{0.5-29.43 Ø4.73}
calibrated: 2.9
ΔE Greyscale Calman: 3.5 | ∀{0.09-98 Ø4.97}
88.7% sRGB (Argyll 1.6.3 3D)
57% AdobeRGB 1998 (Argyll 1.6.3 3D)
62.1% AdobeRGB 1998 (Argyll 3D)
89% sRGB (Argyll 3D)
60.6% Display P3 (Argyll 3D)
Gamma: 2.28
CCT: 7101 K
| Razer Blade Pro 17 RTX 2080 Max-Q AU Optronics B173HAN04.0, IPS, 17.3", 1920x1080 | Asus Zephyrus S GX701GX B173HAN04.0 (AUO409D), IPS, 17.3", 1920x1080 | Lenovo Legion Y740-17ICH AU Optronics B173HAN03.2, IPS, 17.3", 1920x1080 | Razer Blade Pro 2017 Sharp LQ173D1JW33 (SHP145A), IGZO, 17.3", 3840x2160 | MSI GS75 8SG Stealth N173HCE-G33 (CMN175C), IPS, 17.3", 1920x1080 | Alienware m17 P37E AU Optronics B173ZAN01.0, IPS, 17.3", 3840x2160 | |
|---|---|---|---|---|---|---|
| Display | 2% | 4% | 40% | 6% | 38% | |
| Display P3 Coverage (%) | 60.6 | 62.9 4% | 64 6% | 88.9 47% | 63.6 5% | 86.4 43% |
| sRGB Coverage (%) | 89 | 87.8 -1% | 90.4 2% | 100 12% | 95.4 7% | 99.9 12% |
| AdobeRGB 1998 Coverage (%) | 62.1 | 63.9 3% | 64.8 4% | 99.7 61% | 65.5 5% | 99.1 60% |
| Response Times | -3% | -81% | -547% | -6% | -308% | |
| Response Time Grey 50% / Grey 80% * (ms) | 6.8 ? | 7.2 ? -6% | 15.6 ? -129% | 60.8 ? -794% | 7.6 ? -12% | 35.6 ? -424% |
| Response Time Black / White * (ms) | 9.6 ? | 9.6 ? -0% | 12.8 ? -33% | 38.4 ? -300% | 9.6 ? -0% | 28 ? -192% |
| PWM Frequency (Hz) | 204.9 ? | 25510 ? | ||||
| Screen | 13% | -30% | -22% | 24% | -29% | |
| Brightness middle (cd/m²) | 299.3 | 288 -4% | 299.1 0% | 230 -23% | 355 19% | 357.9 20% |
| Brightness (cd/m²) | 294 | 287 -2% | 273 -7% | 207 -30% | 327 11% | 347 18% |
| Brightness Distribution (%) | 94 | 91 -3% | 81 -14% | 83 -12% | 85 -10% | 94 0% |
| Black Level * (cd/m²) | 0.29 | 0.2 31% | 0.27 7% | 0.2 31% | 0.26 10% | 0.33 -14% |
| Contrast (:1) | 1032 | 1440 40% | 1108 7% | 1150 11% | 1365 32% | 1085 5% |
| Colorchecker dE 2000 * | 2.55 | 2.33 9% | 5.07 -99% | 5.62 -120% | 1.54 40% | 6.57 -158% |
| Colorchecker dE 2000 max. * | 4.73 | 5.34 -13% | 10.55 -123% | 10.24 -116% | 3 37% | 9.86 -108% |
| Colorchecker dE 2000 calibrated * | 2.9 | 2.47 15% | 3.31 -14% | 0.77 73% | 6.74 -132% | |
| Greyscale dE 2000 * | 3.5 | 1.19 66% | 6.8 -94% | 4.54 -30% | 2.19 37% | 4.3 -23% |
| Gamma | 2.28 96% | 2.41 91% | 2.46 89% | 2.36 93% | 2.42 91% | 2.6 85% |
| CCT | 7101 92% | 6710 97% | 7805 83% | 6625 98% | 6893 94% | 6403 102% |
| Color Space (Percent of AdobeRGB 1998) (%) | 57 | 57 0% | 58.5 3% | 88 54% | 61 7% | 88.4 55% |
| Color Space (Percent of sRGB) (%) | 88.7 | 88 -1% | 89.9 1% | 100 13% | 95 7% | 100 13% |
| Total Average (Program / Settings) | 4% /
9% | -36% /
-30% | -176% /
-80% | 8% /
17% | -100% /
-52% |
* ... smaller is better
Display Response Times
| ↔ Response Time Black to White | ||
|---|---|---|
| 9.6 ms ... rise ↗ and fall ↘ combined | ↗ 5.2 ms rise | 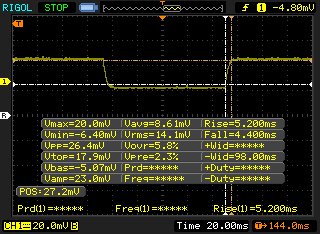 |
| ↘ 4.4 ms fall | ||
| The screen shows fast response rates in our tests and should be suited for gaming. In comparison, all tested devices range from 0.1 (minimum) to 240 (maximum) ms. » 26 % of all devices are better. This means that the measured response time is better than the average of all tested devices (19.9 ms). | ||
| ↔ Response Time 50% Grey to 80% Grey | ||
| 6.8 ms ... rise ↗ and fall ↘ combined | ↗ 3.4 ms rise | 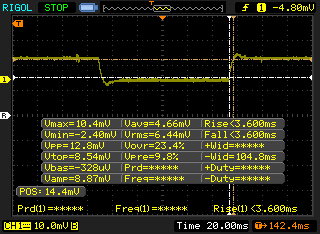 |
| ↘ 3.4 ms fall | ||
| The screen shows very fast response rates in our tests and should be very well suited for fast-paced gaming. In comparison, all tested devices range from 0.165 (minimum) to 636 (maximum) ms. » 19 % of all devices are better. This means that the measured response time is better than the average of all tested devices (31.1 ms). | ||
Screen Flickering / PWM (Pulse-Width Modulation)
| Screen flickering / PWM not detected | 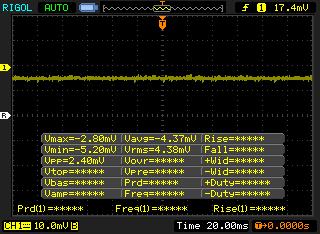 | ||
In comparison: 52 % of all tested devices do not use PWM to dim the display. If PWM was detected, an average of 7797 (minimum: 5 - maximum: 343500) Hz was measured. | |||
| Cinebench R11.5 | |
| CPU Single 64Bit | |
| MSI GE75 9SG | |
| Average Intel Core i7-9750H (1.96 - 2.19, n=10) | |
| Razer Blade Pro 2017 | |
| Asus ROG Zephyrus G15 GA502DU | |
| CPU Multi 64Bit | |
| MSI GE75 9SG | |
| Average Intel Core i7-9750H (11.3 - 14.1, n=10) | |
| Asus ROG Zephyrus G15 GA502DU | |
| Razer Blade Pro 2017 | |
| Cinebench R10 | |
| Rendering Multiple CPUs 32Bit | |
| MSI GE75 9SG | |
| Average Intel Core i7-9750H (28251 - 36304, n=13) | |
| Asus ROG Zephyrus G15 GA502DU | |
| Rendering Single 32Bit | |
| MSI GE75 9SG | |
| Average Intel Core i7-9750H (6659 - 7214, n=13) | |
| Asus ROG Zephyrus G15 GA502DU | |
| wPrime 2.10 - 1024m | |
| Asus ROG Zephyrus G15 GA502DU | |
| Average Intel Core i7-9750H (n=1) | |
| MSI GE75 9SG | |
* ... smaller is better
| PCMark 8 Home Score Accelerated v2 | 4412 points | |
| PCMark 8 Work Score Accelerated v2 | 5672 points | |
| PCMark 10 Score | 5734 points | |
Help | ||
| Razer Blade Pro 17 RTX 2080 Max-Q Samsung SSD PM981 MZVLB512HAJQ | Asus ROG Strix Scar II GL704GW Intel SSD 660p SSDPEKNW512G8 | Alienware m17 P37E SK Hynix PC401 512GB M.2 (HFS512GD9TNG) | Lenovo Legion Y740-17ICH Samsung SSD PM981 MZVLB256HAHQ | Razer Blade Pro 2017 2x Samsung SSD PM951 MZVLV256HCHP (RAID 0) | MSI GS75 8SG Stealth 2x Samsung SSD PM981 MZVLB512HAJQ (RAID 0) | |
|---|---|---|---|---|---|---|
| AS SSD | -40% | -26% | -10% | -19% | 7% | |
| Seq Read (MB/s) | 1831 | 1315 -28% | 1835 0% | 1153 -37% | 2599 42% | 3005 64% |
| Seq Write (MB/s) | 1744 | 927 -47% | 1121 -36% | 1328 -24% | 588 -66% | 2668 53% |
| 4K Read (MB/s) | 45.16 | 52.4 16% | 23.98 -47% | 35.05 -22% | 37.57 -17% | 40.89 -9% |
| 4K Write (MB/s) | 107.1 | 122.8 15% | 100 -7% | 96 -10% | 104.4 -3% | 94.4 -12% |
| 4K-64 Read (MB/s) | 1240 | 326.5 -74% | 687 -45% | 727 -41% | 1116 -10% | 1366 10% |
| 4K-64 Write (MB/s) | 1695 | 727 -57% | 776 -54% | 1212 -28% | 513 -70% | 1197 -29% |
| Access Time Read * (ms) | 0.064 | 0.11 -72% | 0.047 27% | 0.063 2% | 0.051 20% | 0.055 14% |
| Access Time Write * (ms) | 0.037 | 0.045 -22% | 0.053 -43% | 0.04 -8% | 0.036 3% | 0.039 -5% |
| Score Read (Points) | 1468 | 510 -65% | 895 -39% | 878 -40% | 1414 -4% | 1708 16% |
| Score Write (Points) | 1977 | 942 -52% | 988 -50% | 1441 -27% | 676 -66% | 1558 -21% |
| Score Total (Points) | 4197 | 1715 -59% | 2306 -45% | 2784 -34% | 2715 -35% | 4123 -2% |
| Copy ISO MB/s (MB/s) | 2086 | 773 -63% | 1487 -29% | |||
| Copy Program MB/s (MB/s) | 425.5 | 493 16% | 608 43% | |||
| Copy Game MB/s (MB/s) | 555 | 647 17% | 1162 109% |
* ... smaller is better

| 3DMark 11 Performance | 22693 points | |
| 3DMark Cloud Gate Standard Score | 38597 points | |
| 3DMark Fire Strike Score | 18887 points | |
| 3DMark Time Spy Score | 8460 points | |
Help | ||
| low | med. | high | ultra | |
|---|---|---|---|---|
| BioShock Infinite (2013) | 307.6 | 282.2 | 252.3 | 177.7 |
| The Witcher 3 (2015) | 287.9 | 237.3 | 152.2 | 87.4 |
| Rocket League (2017) | 249 | 247.7 | 248.4 |
| Razer Blade Pro 17 RTX 2080 Max-Q GeForce RTX 2080 Max-Q, i7-9750H, Samsung SSD PM981 MZVLB512HAJQ | Asus ROG Strix Scar II GL704GW GeForce RTX 2070 Mobile, i7-8750H, Intel SSD 660p SSDPEKNW512G8 | Alienware m17 P37E GeForce RTX 2080 Max-Q, i9-8950HK, SK Hynix PC401 512GB M.2 (HFS512GD9TNG) | Lenovo Legion Y740-17ICH GeForce RTX 2080 Max-Q, i7-8750H, Samsung SSD PM981 MZVLB256HAHQ | Razer Blade Pro 2017 GeForce GTX 1080 Mobile, i7-7820HK, 2x Samsung SSD PM951 MZVLV256HCHP (RAID 0) | MSI GS75 8SG Stealth GeForce RTX 2080 Max-Q, i7-8750H, 2x Samsung SSD PM981 MZVLB512HAJQ (RAID 0) | |
|---|---|---|---|---|---|---|
| Noise | -8% | -3% | 4% | -7% | -8% | |
| off / environment * (dB) | 28.2 | 29 -3% | 28.2 -0% | 28.3 -0% | 30 -6% | 30 -6% |
| Idle Minimum * (dB) | 28.2 | 29 -3% | 28.2 -0% | 31.5 -12% | 30 -6% | 31 -10% |
| Idle Average * (dB) | 28.2 | 32 -13% | 28.2 -0% | 31.6 -12% | 31 -10% | 32 -13% |
| Idle Maximum * (dB) | 30.8 | 40 -30% | 31 -1% | 31.6 -3% | 33 -7% | 41 -33% |
| Load Average * (dB) | 42 | 46 -10% | 50.8 -21% | 32.3 23% | 43 -2% | 47 -12% |
| Witcher 3 ultra * (dB) | 51 | 51 -0% | 50.8 -0% | 43 16% | 55 -8% | 47 8% |
| Load Maximum * (dB) | 53 | 52 2% | 50.8 4% | 45.5 14% | 58 -9% | 48 9% |
* ... smaller is better
Noise level
| Idle |
| 28.2 / 28.2 / 30.8 dB(A) |
| Load |
| 42 / 53 dB(A) |
 | ||
30 dB silent 40 dB(A) audible 50 dB(A) loud |
||
min: | ||
(±) The maximum temperature on the upper side is 43 °C / 109 F, compared to the average of 40.4 °C / 105 F, ranging from 21.2 to 68.8 °C for the class Gaming.
(-) The bottom heats up to a maximum of 47.2 °C / 117 F, compared to the average of 43.2 °C / 110 F
(+) In idle usage, the average temperature for the upper side is 25.5 °C / 78 F, compared to the device average of 33.9 °C / 93 F.
(±) Playing The Witcher 3, the average temperature for the upper side is 34.8 °C / 95 F, compared to the device average of 33.9 °C / 93 F.
(+) The palmrests and touchpad are reaching skin temperature as a maximum (32.8 °C / 91 F) and are therefore not hot.
(-) The average temperature of the palmrest area of similar devices was 28.8 °C / 83.8 F (-4 °C / -7.2 F).
Razer Blade Pro 17 RTX 2080 Max-Q audio analysis
(+) | speakers can play relatively loud (83.6 dB)
Bass 100 - 315 Hz
(±) | reduced bass - on average 10.5% lower than median
(±) | linearity of bass is average (14.4% delta to prev. frequency)
Mids 400 - 2000 Hz
(±) | higher mids - on average 5.3% higher than median
(+) | mids are linear (4.6% delta to prev. frequency)
Highs 2 - 16 kHz
(+) | balanced highs - only 3.5% away from median
(±) | linearity of highs is average (10% delta to prev. frequency)
Overall 100 - 16.000 Hz
(±) | linearity of overall sound is average (17.9% difference to median)
Compared to same class
» 54% of all tested devices in this class were better, 9% similar, 37% worse
» The best had a delta of 6%, average was 18%, worst was 132%
Compared to all devices tested
» 37% of all tested devices were better, 8% similar, 55% worse
» The best had a delta of 4%, average was 24%, worst was 134%
Apple MacBook 12 (Early 2016) 1.1 GHz audio analysis
(+) | speakers can play relatively loud (83.6 dB)
Bass 100 - 315 Hz
(±) | reduced bass - on average 11.3% lower than median
(±) | linearity of bass is average (14.2% delta to prev. frequency)
Mids 400 - 2000 Hz
(+) | balanced mids - only 2.4% away from median
(+) | mids are linear (5.5% delta to prev. frequency)
Highs 2 - 16 kHz
(+) | balanced highs - only 2% away from median
(+) | highs are linear (4.5% delta to prev. frequency)
Overall 100 - 16.000 Hz
(+) | overall sound is linear (10.2% difference to median)
Compared to same class
» 7% of all tested devices in this class were better, 2% similar, 91% worse
» The best had a delta of 5%, average was 18%, worst was 53%
Compared to all devices tested
» 5% of all tested devices were better, 1% similar, 94% worse
» The best had a delta of 4%, average was 24%, worst was 134%
| Off / Standby | |
| Idle | |
| Load |
|
Key:
min: | |
| Razer Blade Pro 17 RTX 2080 Max-Q i7-9750H, GeForce RTX 2080 Max-Q, Samsung SSD PM981 MZVLB512HAJQ, IPS, 1920x1080, 17.3" | Asus ROG Strix Scar II GL704GW i7-8750H, GeForce RTX 2070 Mobile, Intel SSD 660p SSDPEKNW512G8, AHVA, 1920x1080, 17.3" | Razer Blade Pro 2017 i7-7820HK, GeForce GTX 1080 Mobile, 2x Samsung SSD PM951 MZVLV256HCHP (RAID 0), IGZO, 3840x2160, 17.3" | MSI GS75 8SG Stealth i7-8750H, GeForce RTX 2080 Max-Q, 2x Samsung SSD PM981 MZVLB512HAJQ (RAID 0), IPS, 1920x1080, 17.3" | MSI GE75 9SG i9-9880H, GeForce RTX 2080 Mobile, Samsung SSD PM981 MZVLB1T0HALR, AHVA, 1920x1080, 17.3" | MSI GP75 Leopard 9SD i7-9750H, GeForce GTX 1660 Ti Mobile, Kingston RBUSNS8154P3256GJ1, IPS, 1920x1080, 17.3" | |
|---|---|---|---|---|---|---|
| Power Consumption | -9% | -47% | 13% | -8% | 17% | |
| Idle Minimum * (Watt) | 16.2 | 19 -17% | 31 -91% | 13 20% | 13.9 14% | 10 38% |
| Idle Average * (Watt) | 20.4 | 22 -8% | 36 -76% | 17 17% | 18.8 8% | 15 26% |
| Idle Maximum * (Watt) | 26.1 | 29 -11% | 44 -69% | 23 12% | 23.1 11% | 22 16% |
| Load Average * (Watt) | 96.5 | 102 -6% | 107 -11% | 90 7% | 112.3 -16% | 92 5% |
| Witcher 3 ultra * (Watt) | 182.9 | 190 -4% | 212 -16% | 147 20% | 231 -26% | 153 16% |
| Load Maximum * (Watt) | 214.3 | 231 -8% | 258 -20% | 215 -0% | 291.5 -36% | 216 -1% |
* ... smaller is better
| Razer Blade Pro 17 RTX 2080 Max-Q i7-9750H, GeForce RTX 2080 Max-Q, 70 Wh | Asus ROG Strix Scar II GL704GW i7-8750H, GeForce RTX 2070 Mobile, 66 Wh | Alienware m17 P37E i9-8950HK, GeForce RTX 2080 Max-Q, 90 Wh | Lenovo Legion Y740-17ICH i7-8750H, GeForce RTX 2080 Max-Q, 76 Wh | Razer Blade Pro 2017 i7-7820HK, GeForce GTX 1080 Mobile, 99 Wh | MSI GS75 8SG Stealth i7-8750H, GeForce RTX 2080 Max-Q, 80.25 Wh | MSI GE75 9SG i9-9880H, GeForce RTX 2080 Mobile, 65 Wh | |
|---|---|---|---|---|---|---|---|
| Battery runtime | -4% | 16% | -32% | -15% | 11% | 4% | |
| Reader / Idle (h) | 4.9 | 6.2 27% | 9.1 86% | 4.2 -14% | 7.7 57% | ||
| WiFi v1.3 (h) | 4.7 | 3.9 -17% | 4.9 4% | 3.2 -32% | 3.3 -30% | 5.3 13% | 4.9 4% |
| Load (h) | 1.4 | 1.1 -21% | 0.8 -43% | 1.4 0% | 0.9 -36% | ||
| Witcher 3 ultra (h) | 0.9 |
Pros
Cons

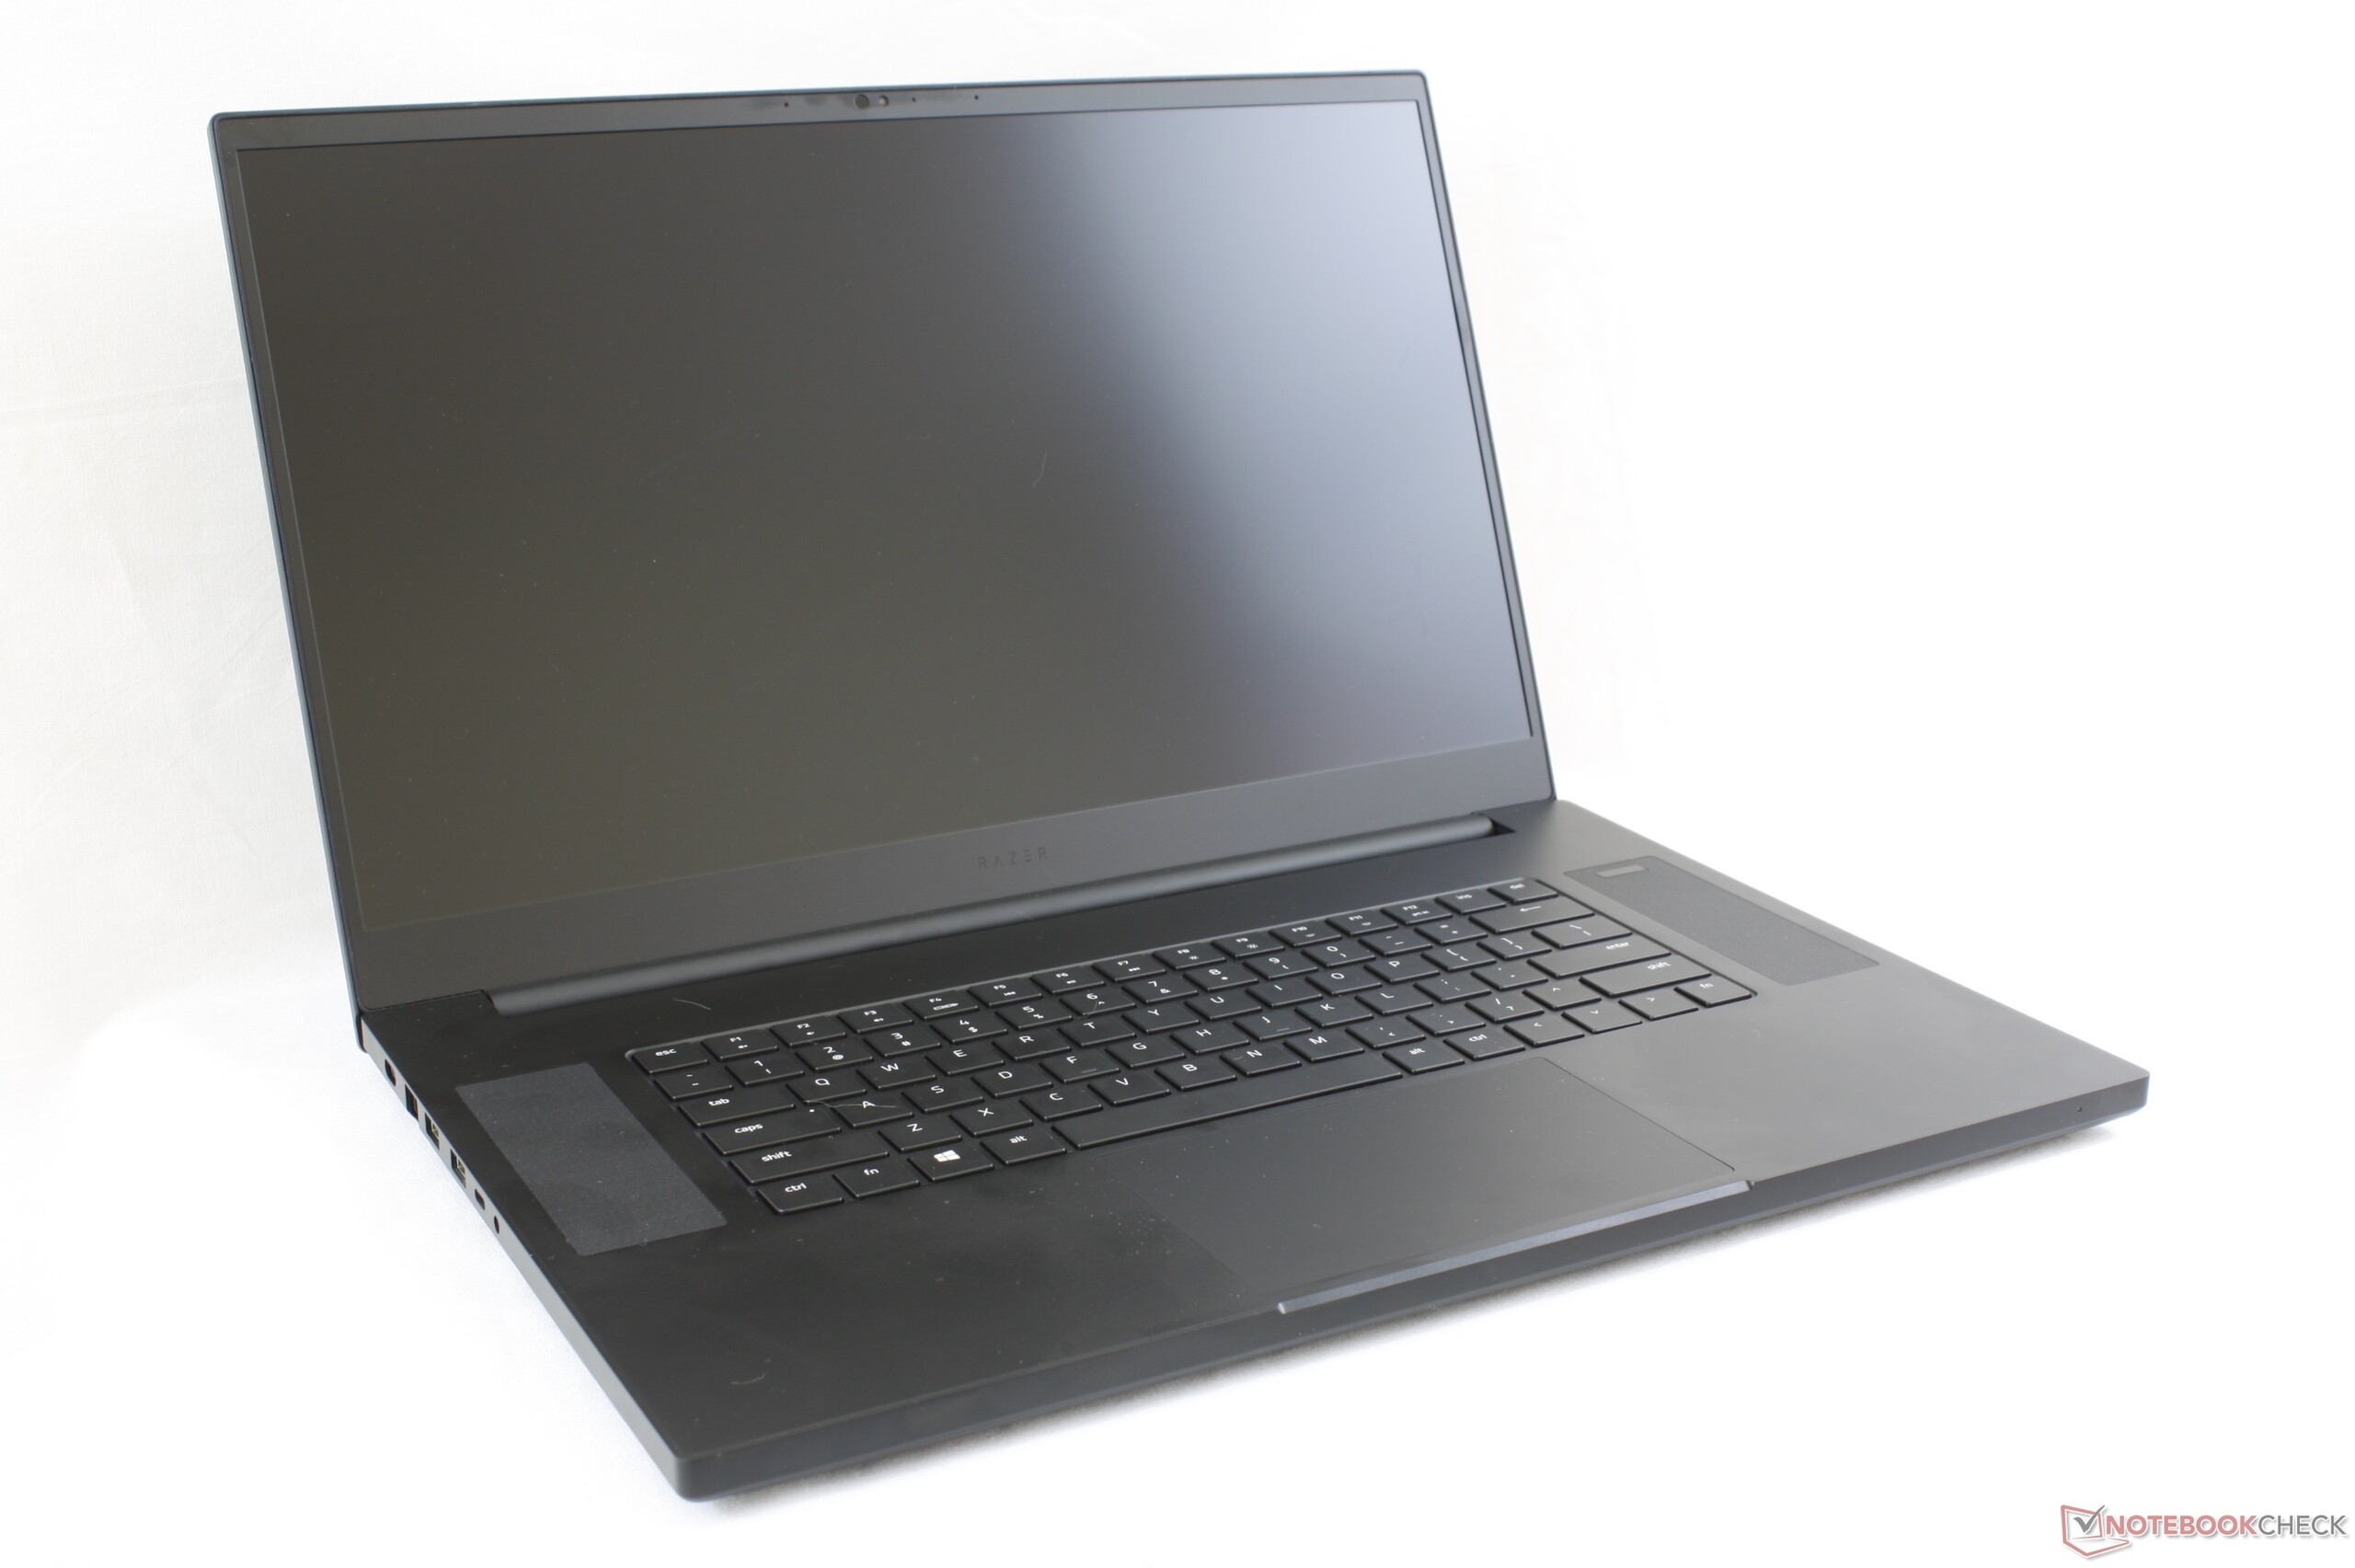
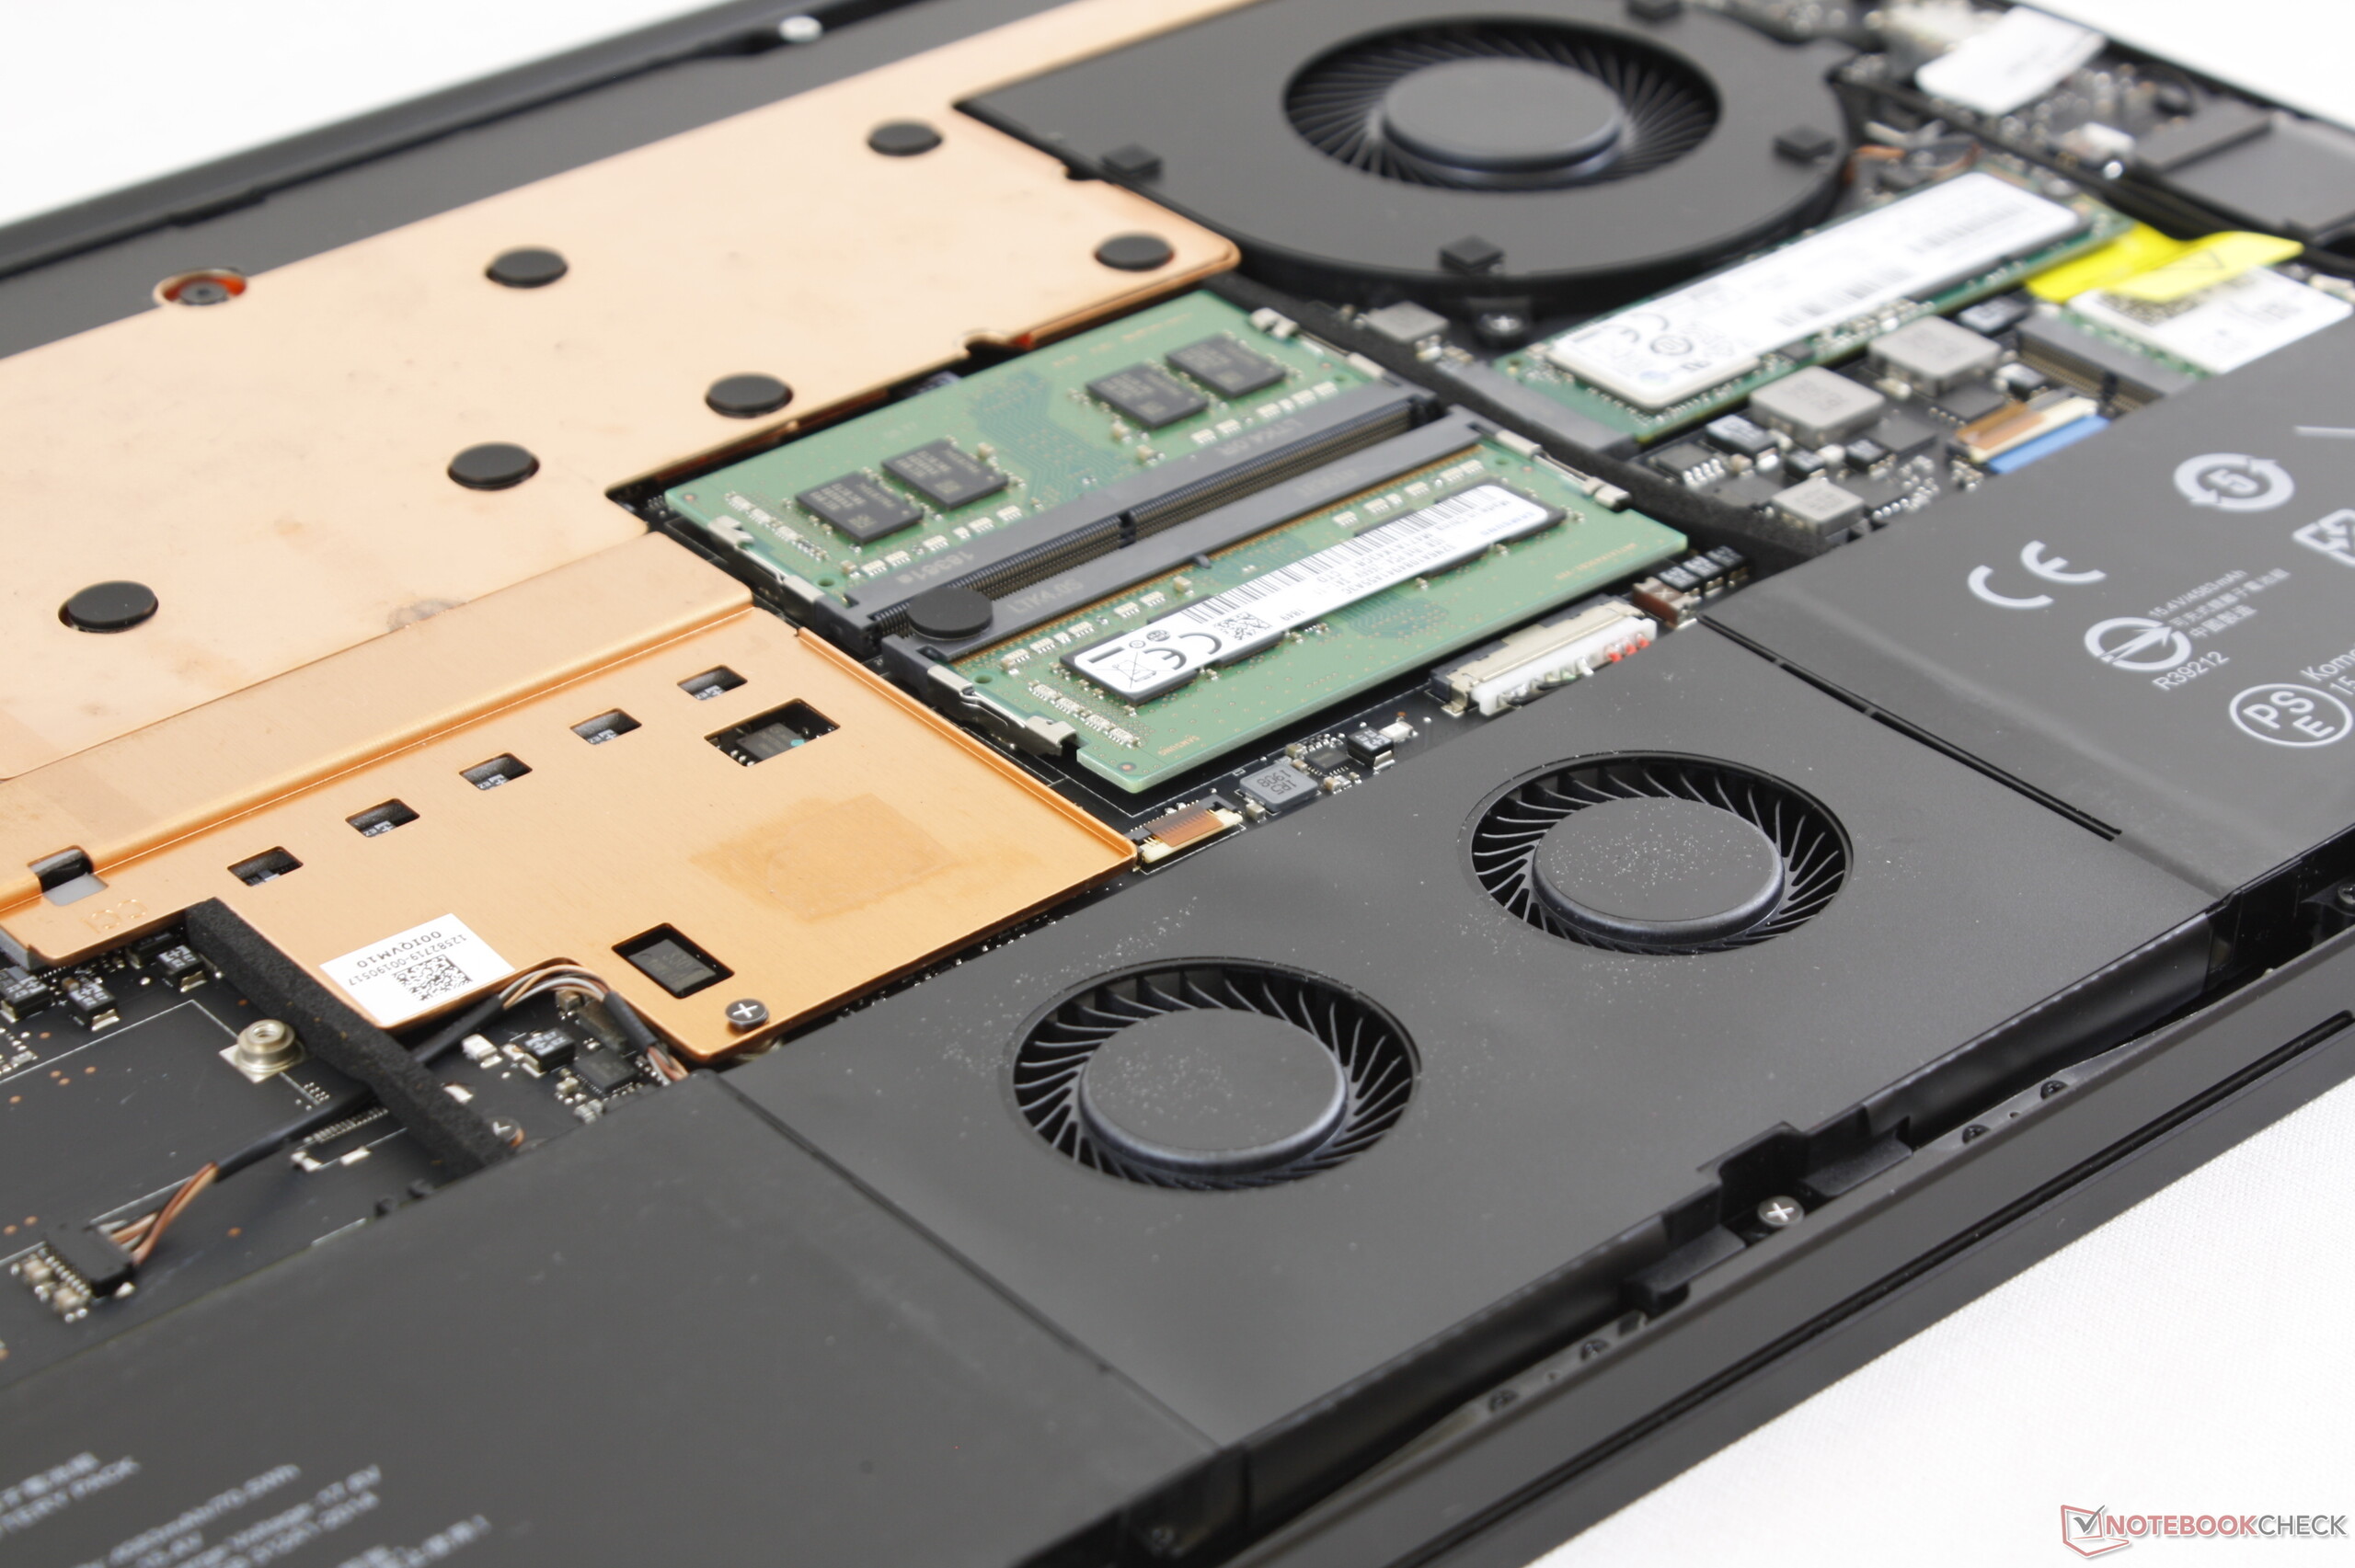
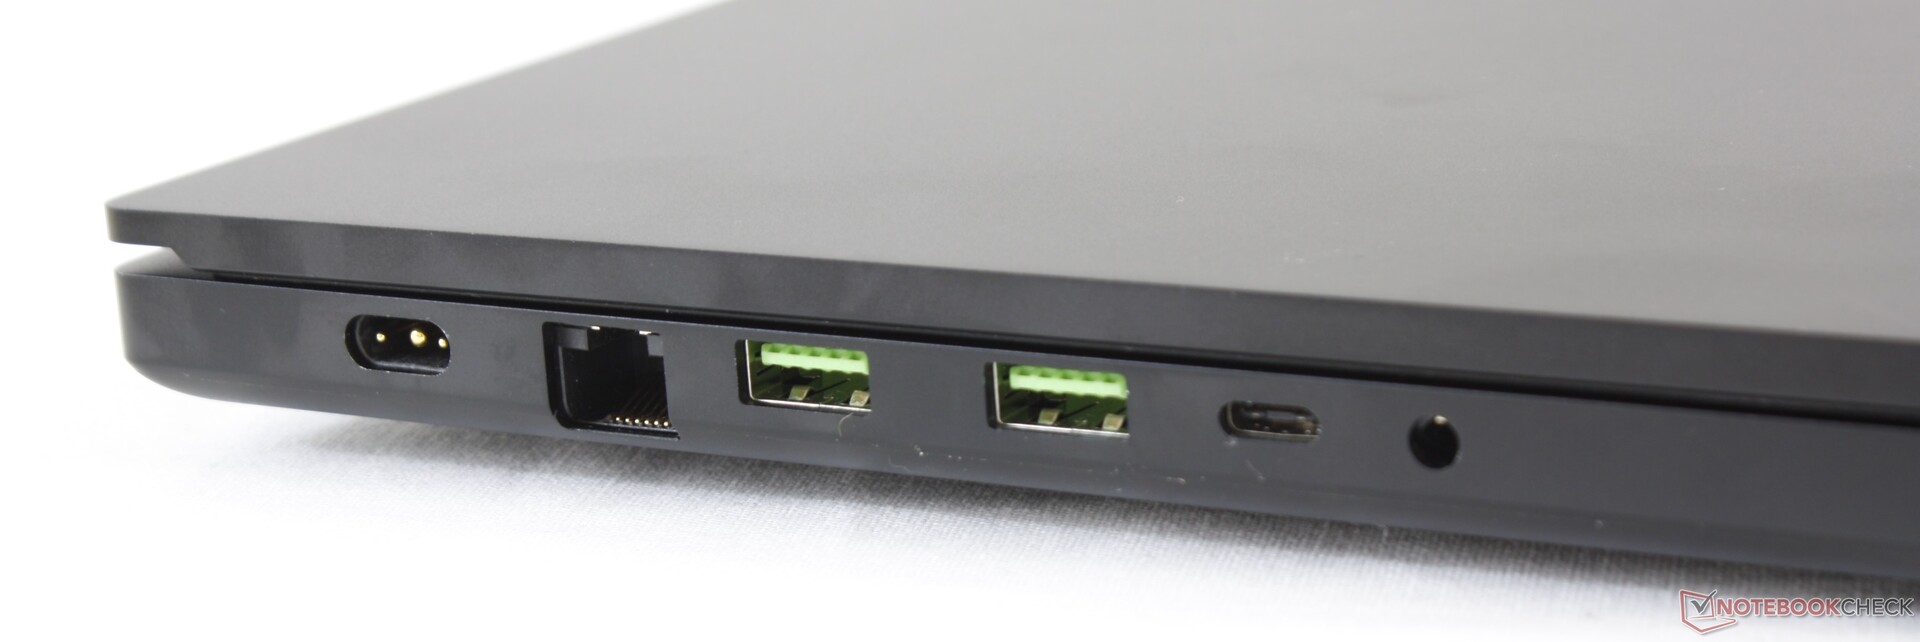
从历史上看,Razer Blade Pro笔记本电脑一直具有新颖的功能,可以将自己与竞争对手区分开来。例如,Blade Pro 2015具有独特的屏幕,而Blade Pro 2017则具有机械键盘,触控板灯,THX认证和音量滚轮。 2019年的Blade Pro 17删减了所有这些奇特的功能,专注于基础,结果是一台Razer最出色的Blade笔记本电脑。一代一代的改进实际上是有形的,而不仅仅是边缘的;与上一代Blade Pro 2017 GTX 1080相比,它在的重量减轻22%,体积减小24%,屏幕亮度增加30%,能效提高14%,同时提供高达39%的图形性能提升,和轻松升级的RAM,储存。
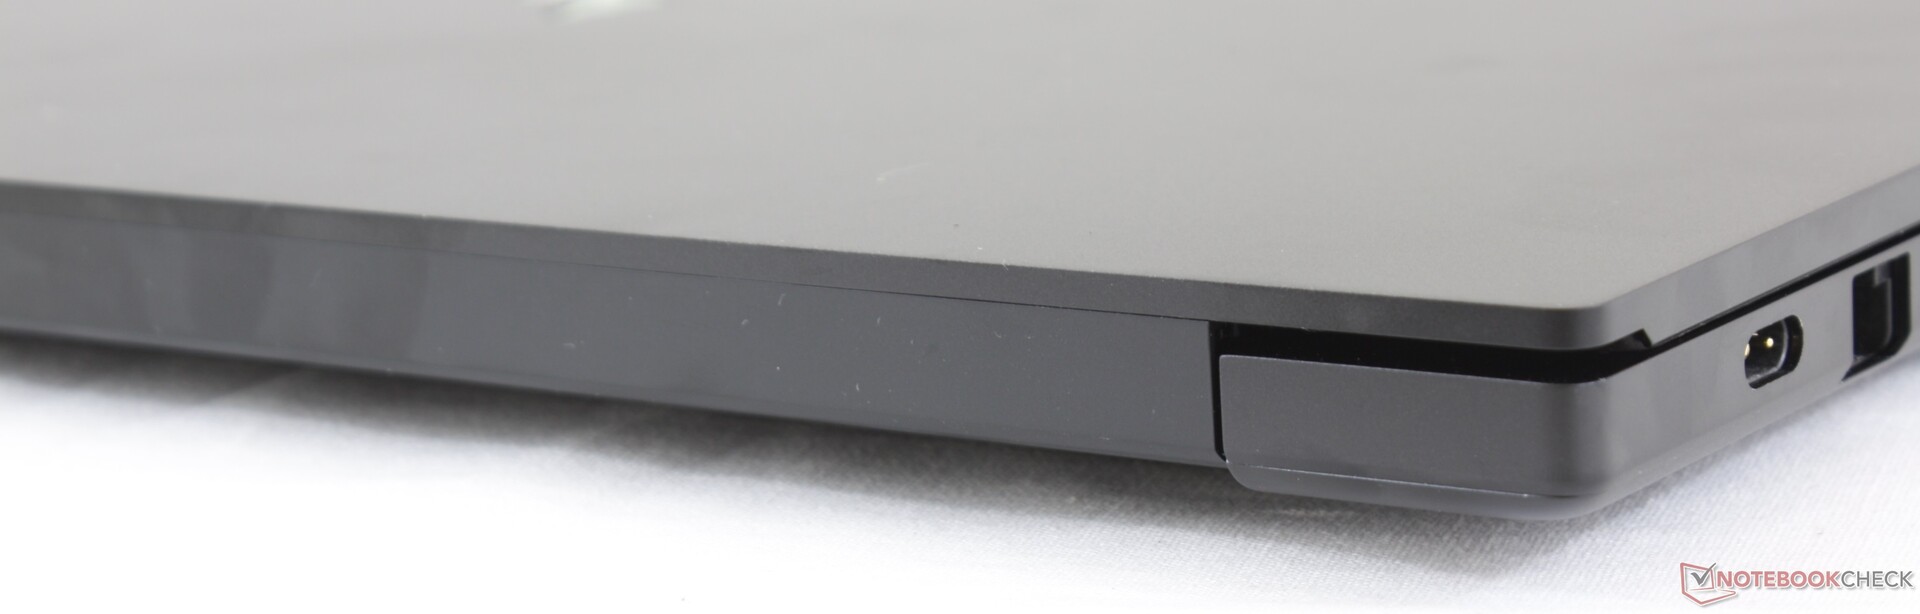
我们认为有几个方面可以使Blade Pro 17更好。 MSI笔记本电脑上的SteelSeries键盘更坚固,更深的键程可以提高触感,而软绵绵的触控板肯定可以从MacBook Pro中获取一些灵感。高性能的风扇噪音比Blade Pro 2017更安静,但它仍然超过50 dB(A)。用于在平衡模式和高性能模式之间切换的宏键将比每次打开Synapse更快更容易。集成专用的低音炮可以提高音频质量,而无需THX认证。同时,AC适配器电缆太绷紧,可以做得更薄,更灵活,便于携带。不过这些缺点不足以阻止其成为类别领先的游戏笔记本电脑。
价格可能会成为阻止游戏玩家大肆挥霍。只需2500美元,用户就可以购买具有相同i7-9750H CPU和RTX 2080 Max-Q GPU的Lenovo Legion Y740-17ICH,而同配置的Blade Pro 17售价则高达3200美元。更豪华的设计带来的溢价是否可以接受是您自己需要考量的问题。然而,对于我们来说,由于相对Blade Pro 2017的所有重大改进,现款现在比以往任何时候都更值得考虑。
Razer简化了Blade Pro系列,提升了整体游戏体验。如果你正在市场上选购一台17英寸的轻薄游戏笔记本电脑,请跳过臃肿的Blade Pro 2017并考虑更精简的Blade Pro 17.它会比一些竞争对手花费更多,但它感觉起来也更好。
Razer Blade Pro 17 RTX 2080 Max-Q
- 09/20/2019 v7 (old)
Allen Ngo
Price comparison

