华硕ExpertBook B6 Flip评测。带手写笔的强大的工作站可转换性
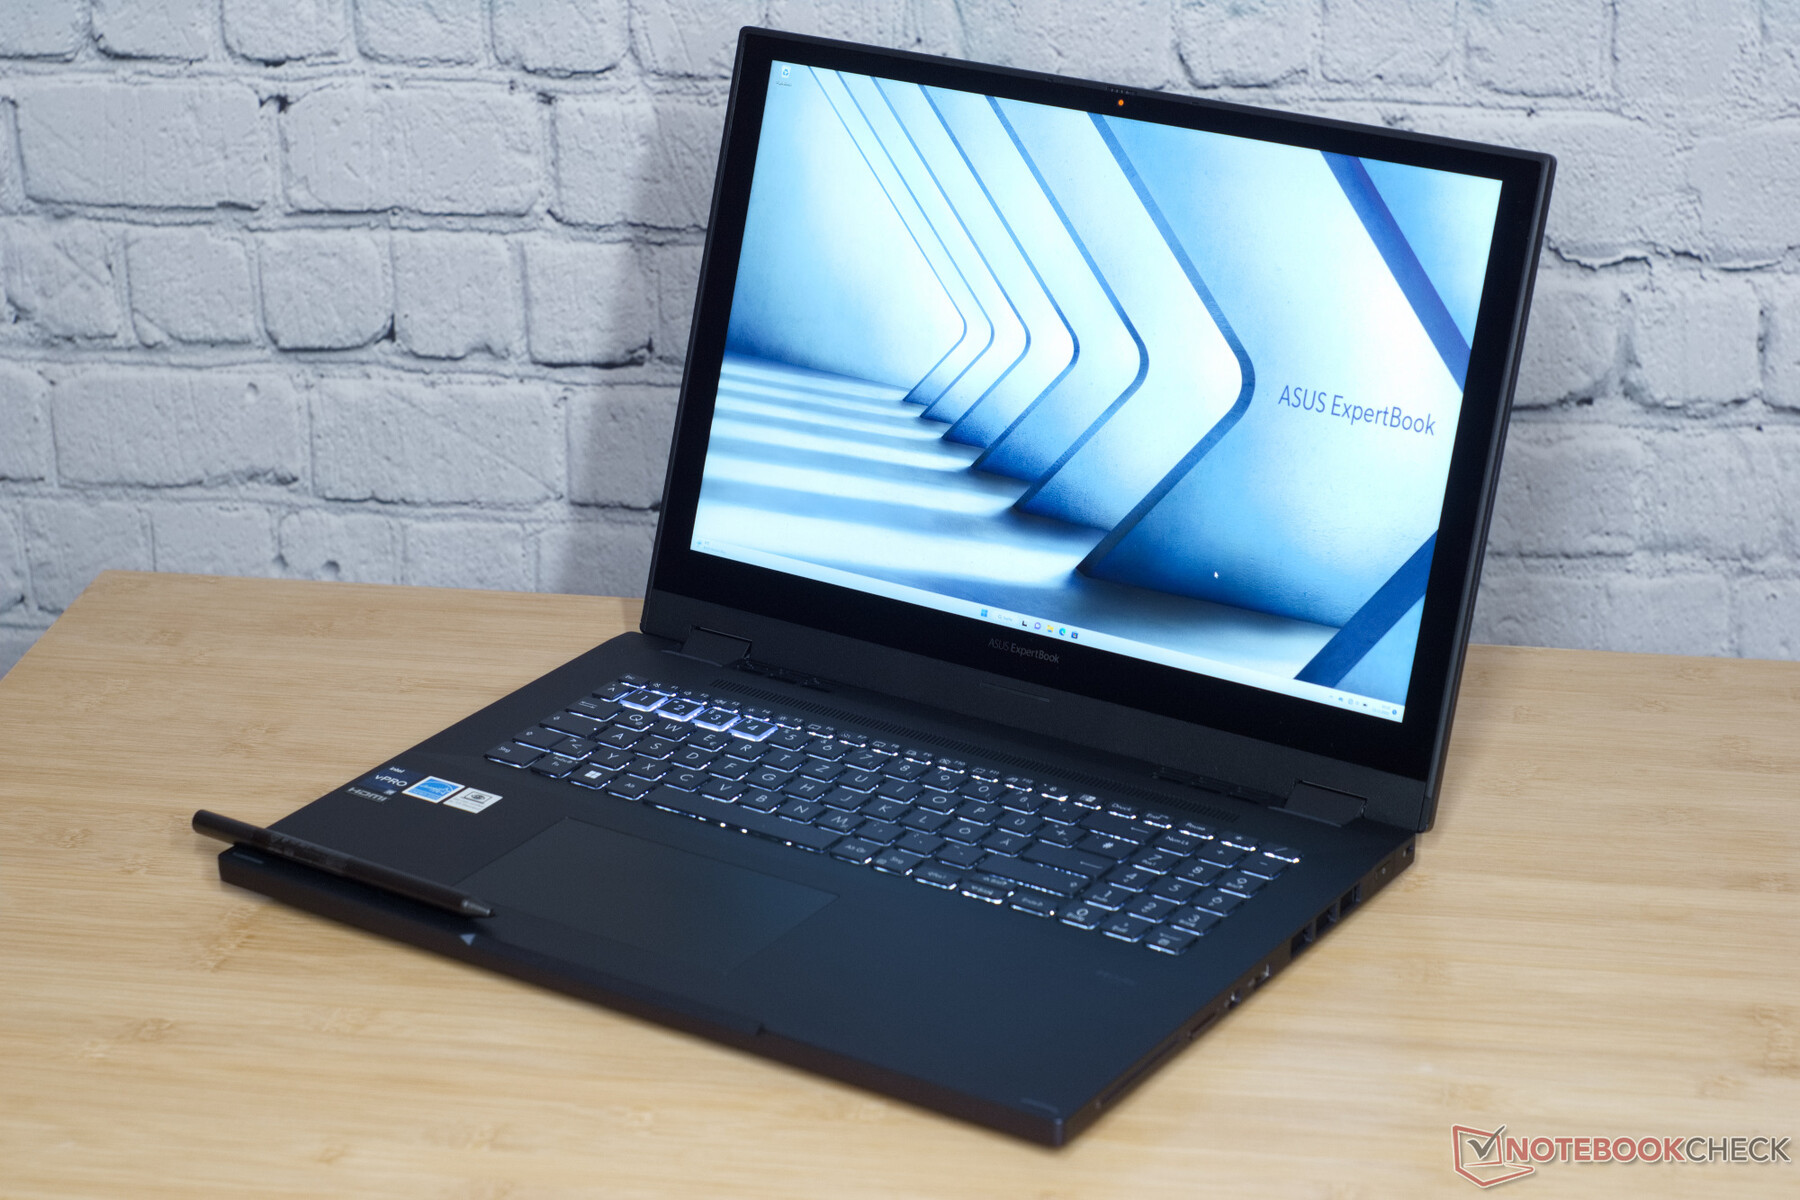
正如其名称所示,华硕的ExpertBooks清楚地表明了其创建的目的。这款功能强大的工作用笔记本电脑特别坚固,提供的屏幕很容易看清,并在英特尔vPro平台上运行。单从规格上看,华硕ExpertBook B6 Flip是一款强大的工作站。一台英特尔酷睿i9-12950HX和一个 Nvidia RTX A2000确保舒适的计算性能。360°铰链将笔记本电脑变成了一个可转换的设备,也显示了典型的设备功能。在ExpertBook上可以用触摸屏和数字笔进行输入。
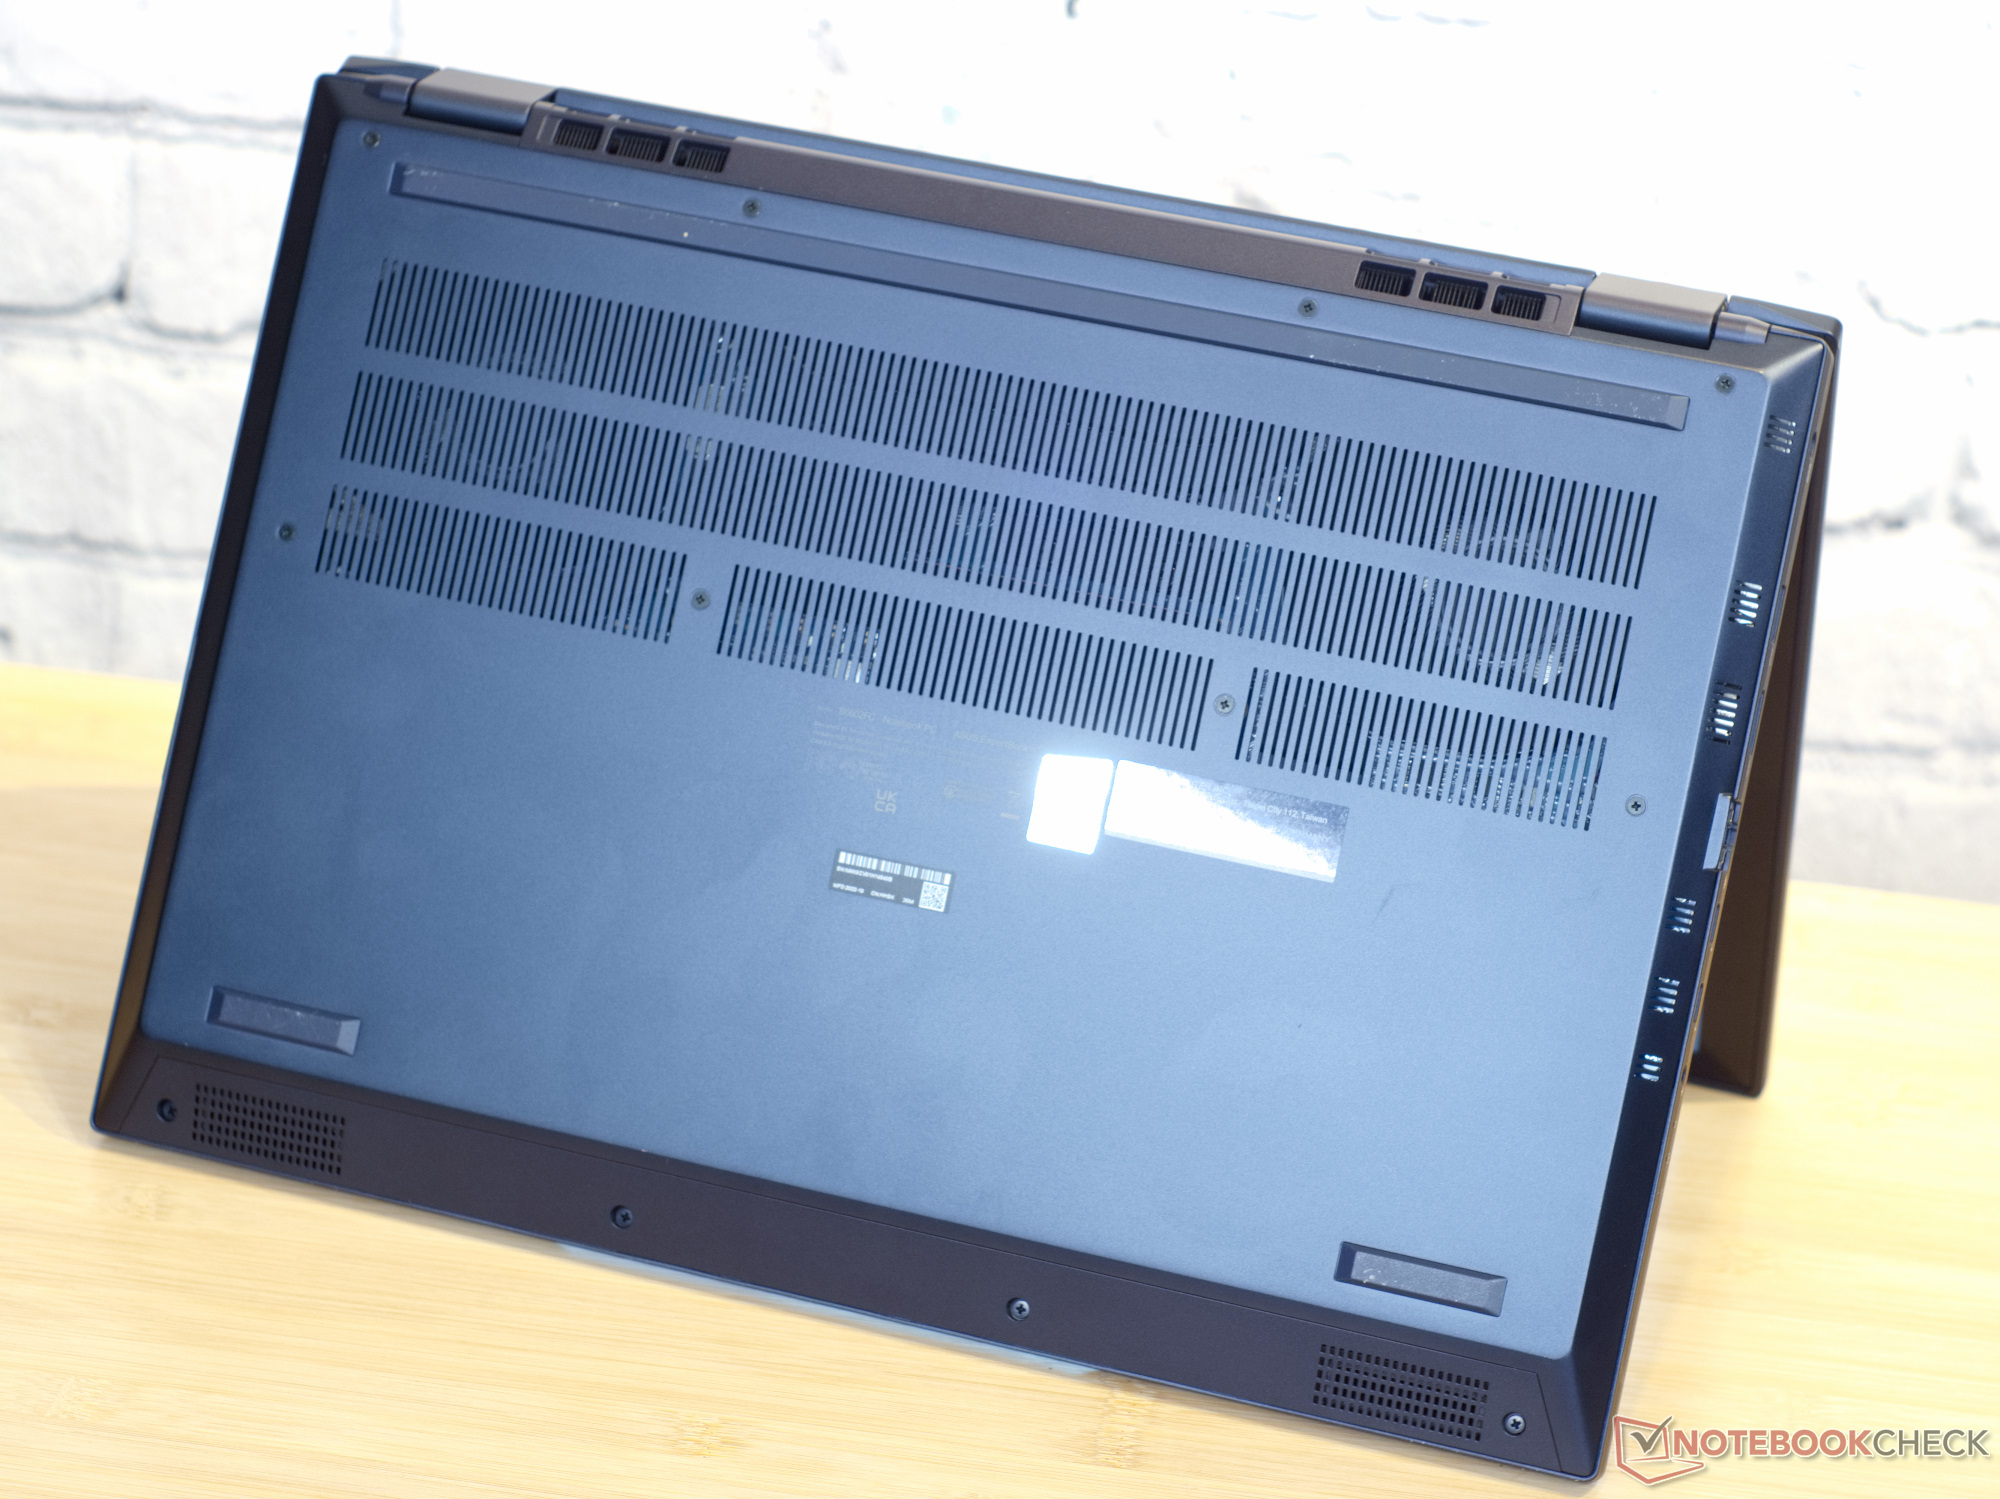
然而,这台拥有16英寸屏幕和宽大显示边缘的二合一笔记本电脑,作为一台工作站,其体积异常庞大,也相当沉重。 华硕将一个非常强大的冷却系统放置在这个有点笨重的箱子里,使其几乎能承受任何挑战。大型风扇和散热片确保内部组件保持冷却。
我们选择了来自一些制造商的、具有不同侧重点的各种工作站作为竞争设备。这台 华硕ProArt StudioBook 16,微星CreatorPro Z16P和惠普ZBook Studio 16 G9更加针对媒体设计师,而ExpertBook和 戴尔Precision 7670更加针对CAD设计师和工程师。为了进一步比较,我们还包括 联想Yoga Slim 7i Pro X作为竞争者列入名单,因为 Nvidia RTX A2000和 NvidiaGeForce RTX 3050最终都是基于相同的图形芯片。
注:联想ThinkPad P16 G1的完整评论目前不幸被推迟。
潜在的竞争对手比较
Rating | Date | Model | Weight | Height | Size | Resolution | Price |
|---|---|---|---|---|---|---|---|
| 89.6 % v7 (old) | 01 / 2023 | Asus ExpertBook B6 Flip B6602FC2 i9-12950HX, RTX A2000 Laptop GPU | 2.8 kg | 27.2 mm | 16.00" | 2560x1600 | |
| 88.2 % v7 (old) | 02 / 2023 | Lenovo ThinkPad P16 G1 21D6001DMB i7-12850HX, RTX A2000 Laptop GPU | 3 kg | 30.23 mm | 16.00" | 2560x1600 | |
| 90.1 % v7 (old) | 11 / 2022 | HP ZBook Studio 16 G9 62U04EA i7-12800H, RTX A2000 Laptop GPU | 1.8 kg | 19 mm | 16.00" | 3840x2400 | |
| 88.4 % v7 (old) | 10 / 2022 | Dell Precision 7670 i7-12850HX, RTX A2000 Laptop GPU | 2.7 kg | 24.7 mm | 16.00" | 3840x2400 | |
| 84.3 % v7 (old) | 11 / 2022 | MSI CreatorPro Z16P B12UKST i7-12700H, RTX A3000 Laptop GPU | 2.4 kg | 19 mm | 16.00" | 2560x1600 | |
v (old) | 12 / 2021 | Asus ProArt StudioBook 16 W7600H5A-2BL2 W-11955M, RTX A5000 Laptop GPU | 2.4 kg | 21.4 mm | 16.00" | 3840x2400 | |
| 87.7 % v7 (old) | 12 / 2022 | Lenovo Yoga Slim 7 Pro X 14IAH7 82TK006CGE i7-12700H, GeForce RTX 3050 4GB Laptop GPU | 1.5 kg | 18 mm | 14.50" | 3072x1920 |
案例 - 尽管是轻金属,但重量级的
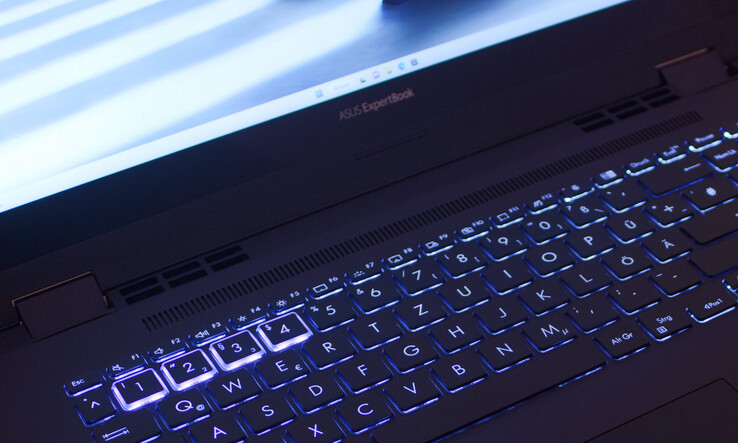
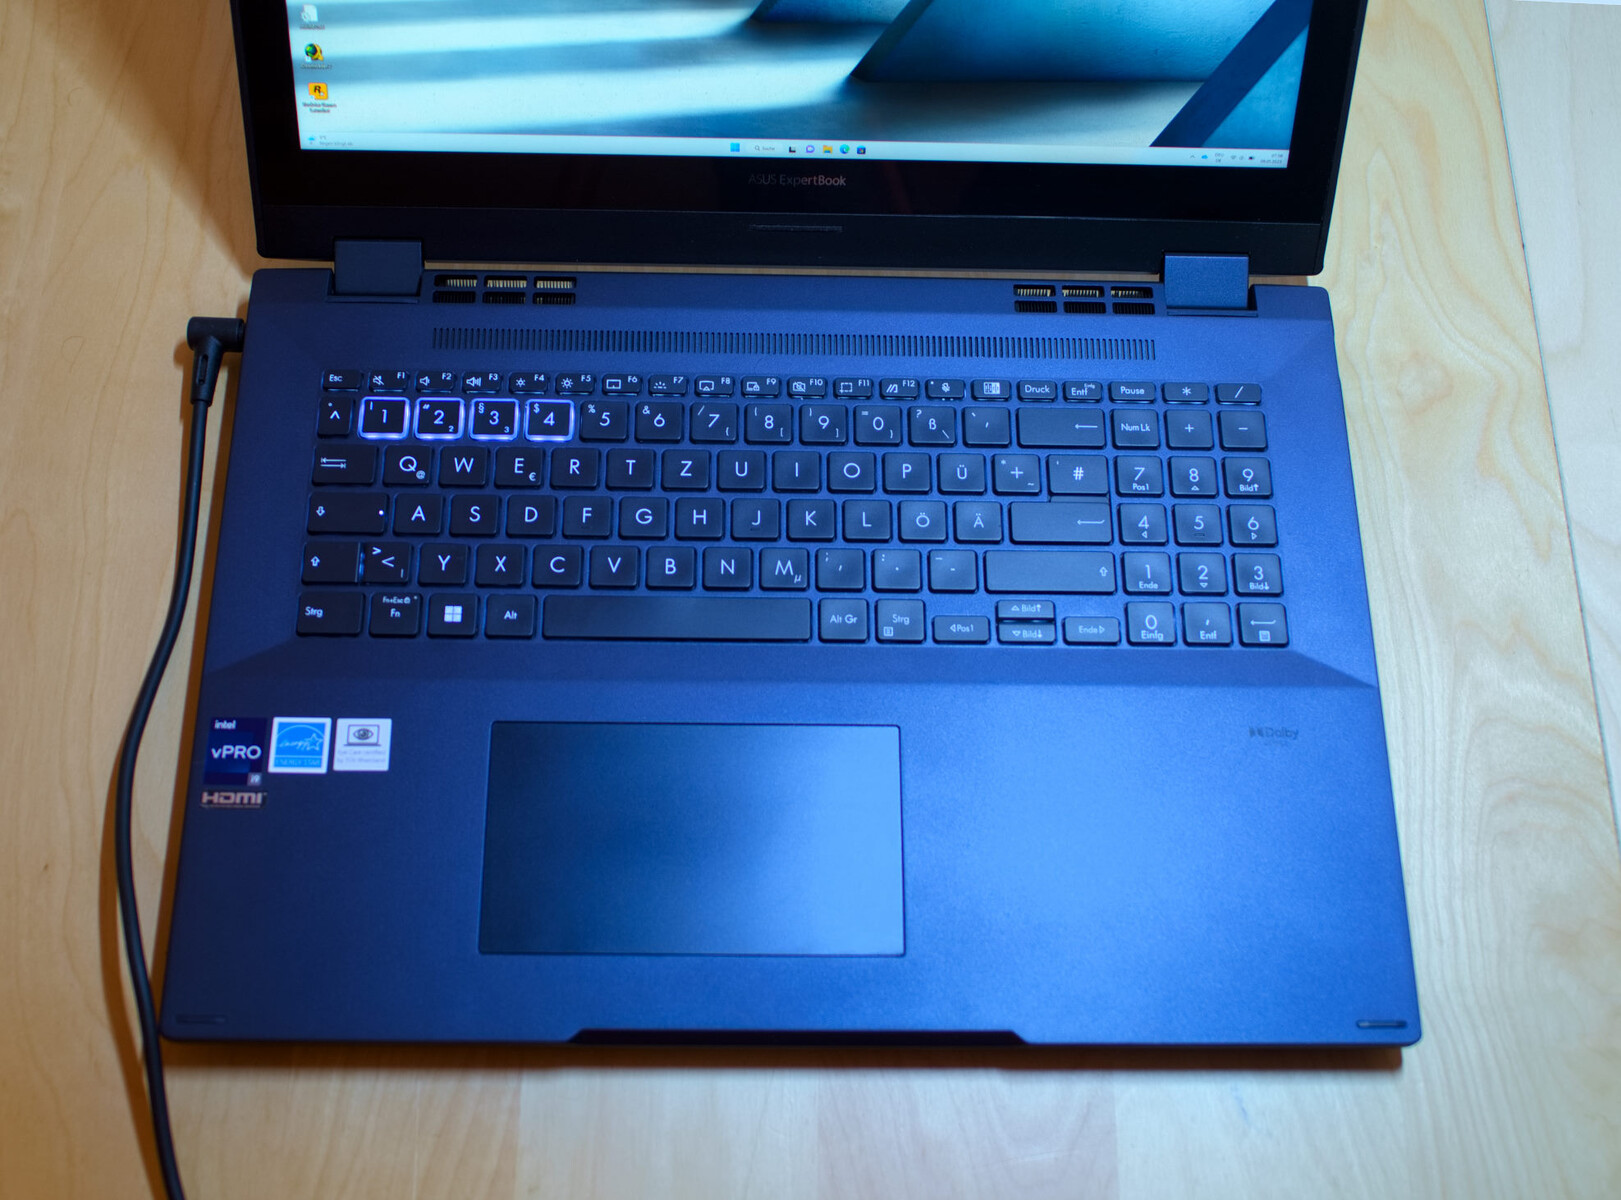
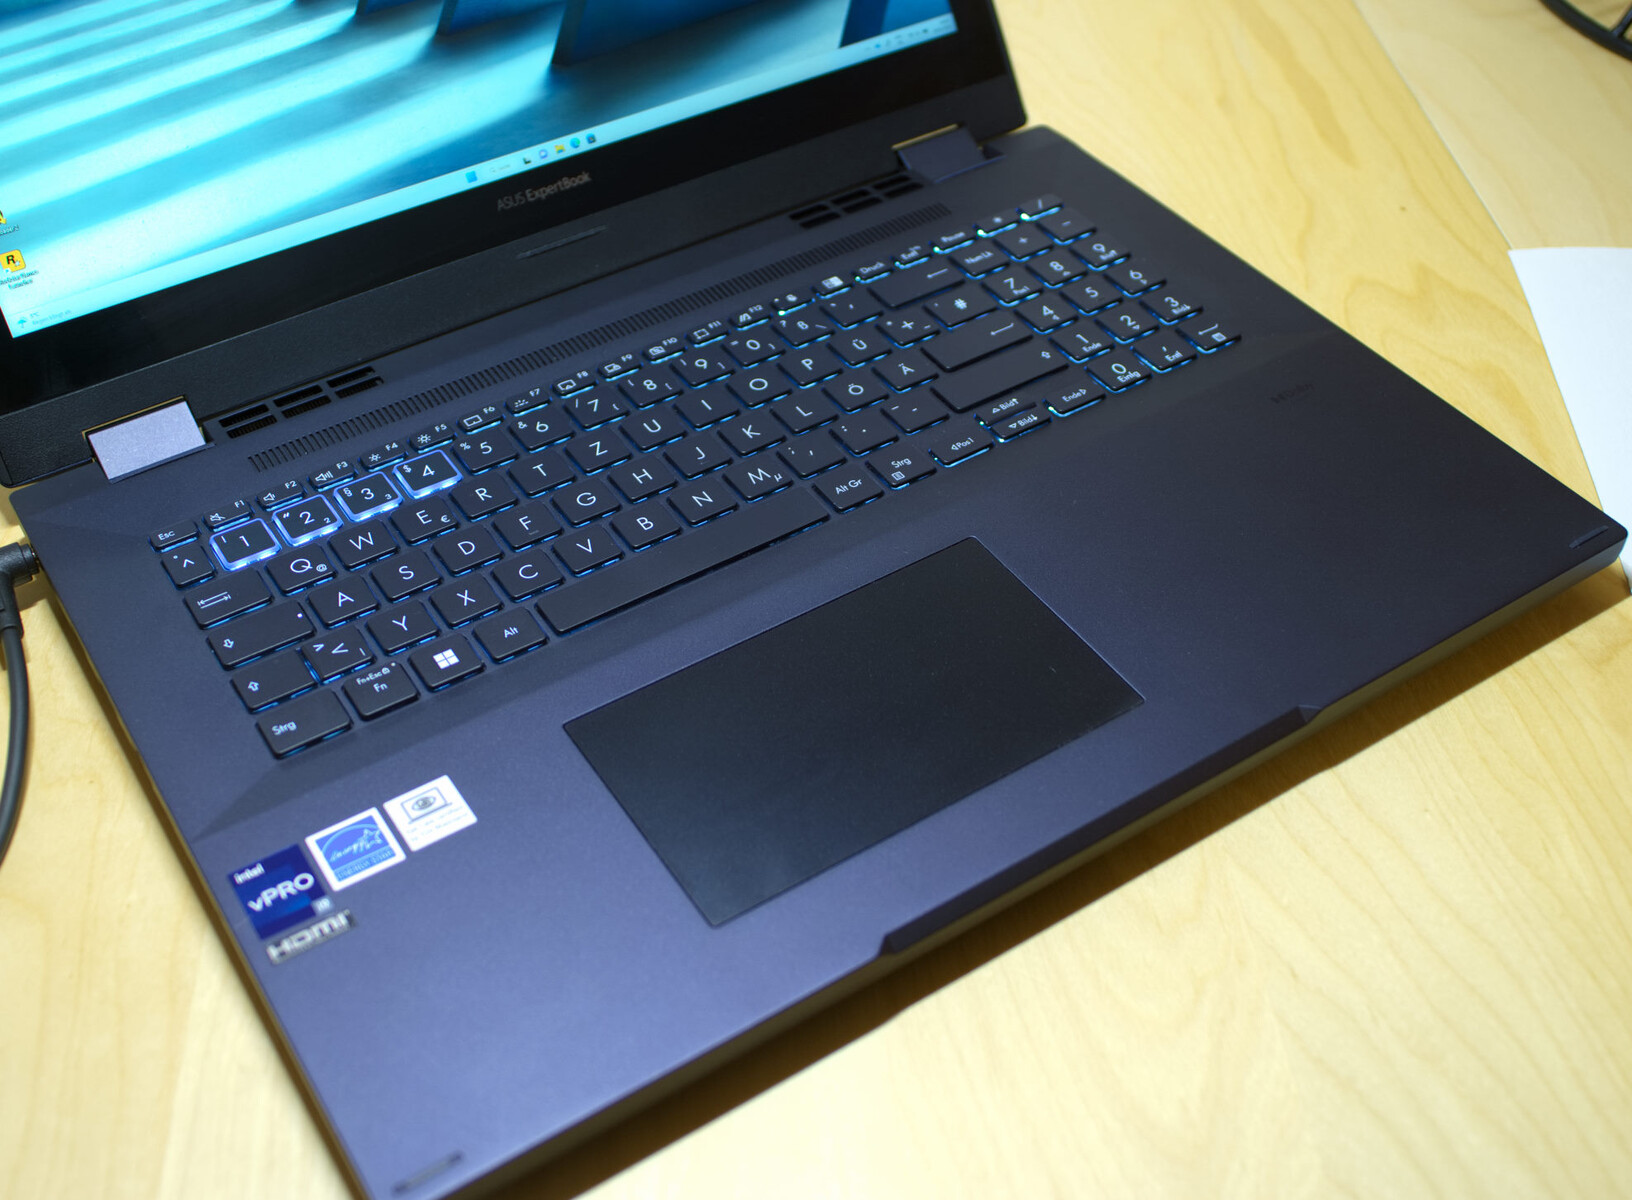
华硕的二合一工作站又大又厚又重。尽管采用了铝制外壳,但这台笔记本电脑的重量达到了2,675克。制造商没有在设计上做得太过火,给人以坚韧和高质量的印象。我们还在这台深蓝色的笔记本电脑上发现了华硕的典型设计元素。因此,这款笔记本电脑与某家芬兰制造商的老式手机有一定的相似之处,至少在触觉方面是这样。相对较大的显示屏边框在打开的工作站上看起来有些复古,而屏幕由质地细腻的玻璃面板保护,既耐用又防眩光,不会对笔记本电脑的图像质量产生负面影响。1、2、3、4键主要是作为设计元素而突出,当键盘背光打开时,其白色边缘会特别密集地亮起。
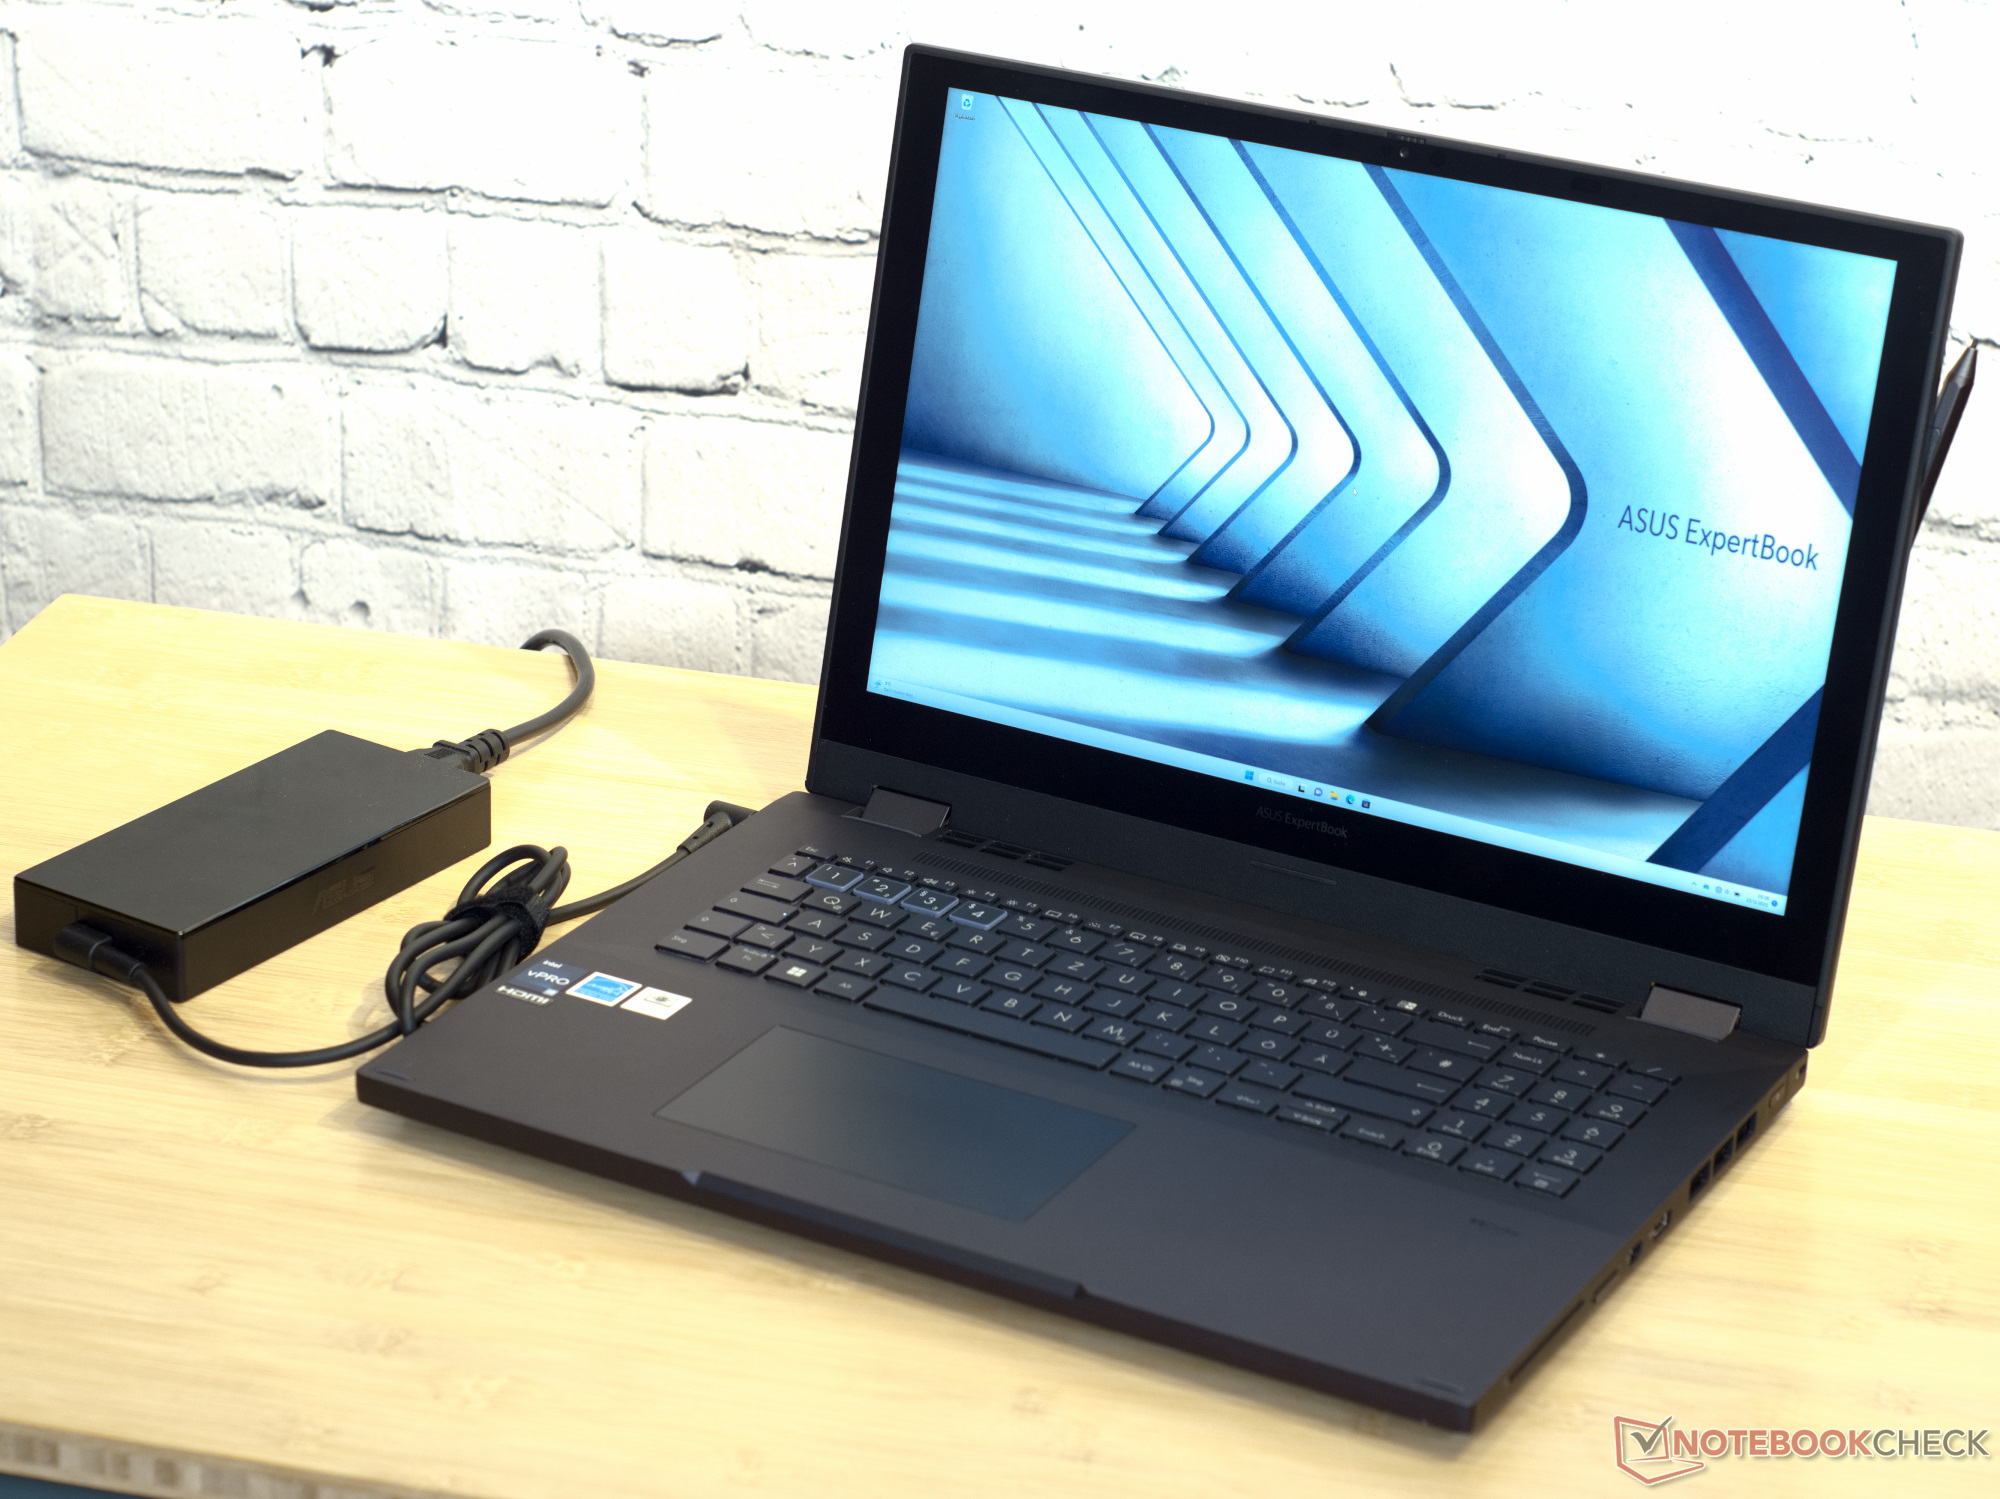
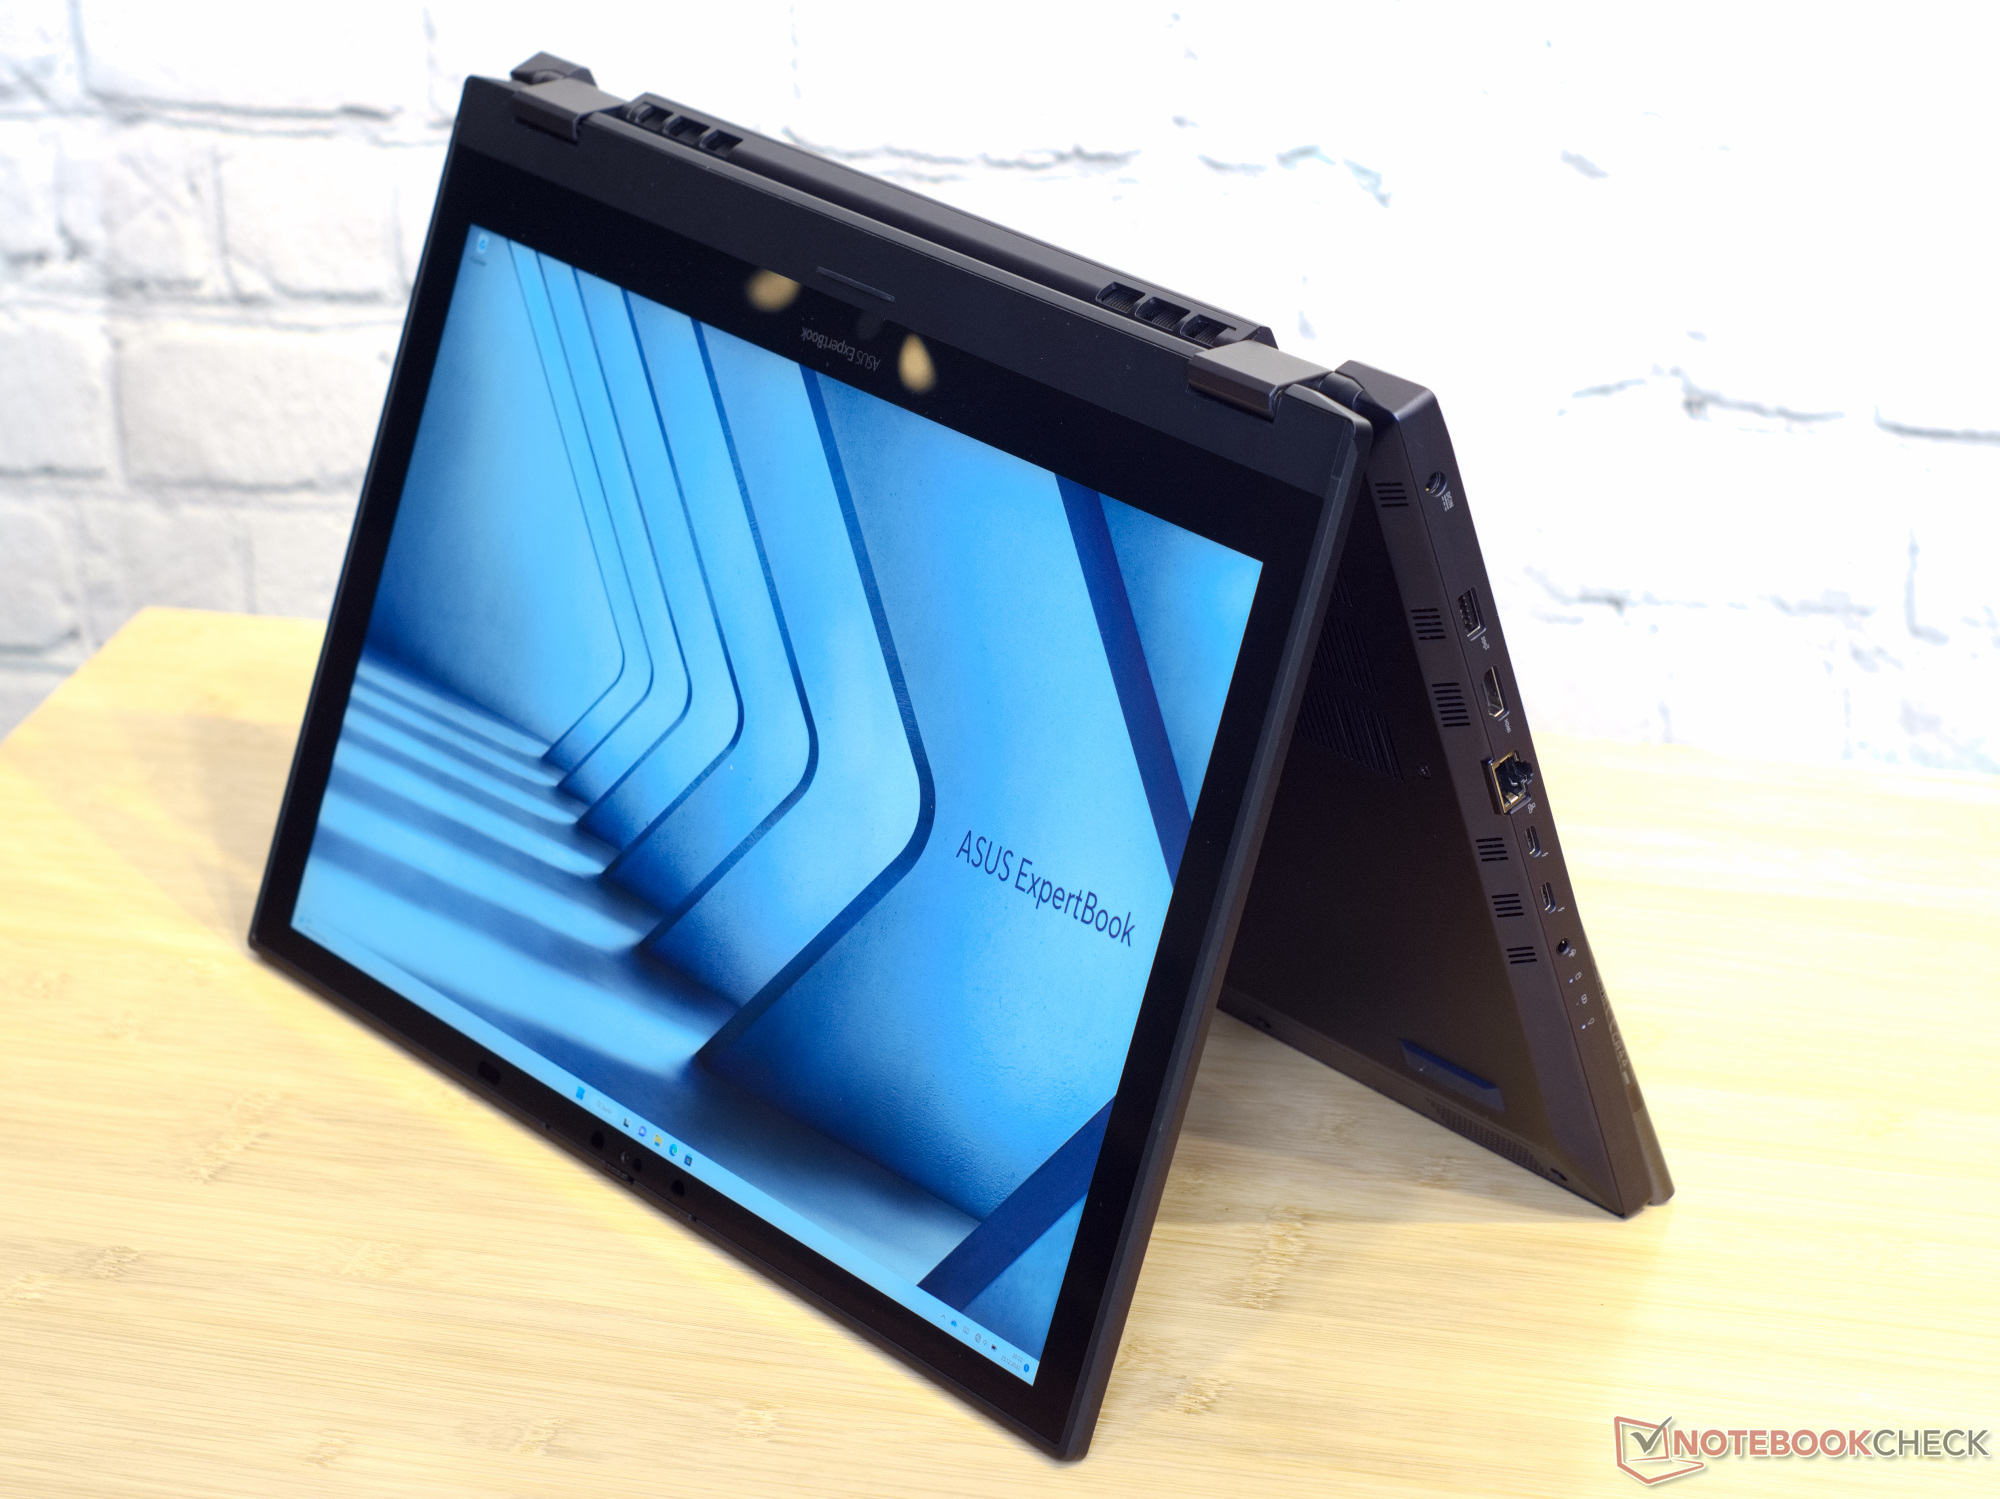

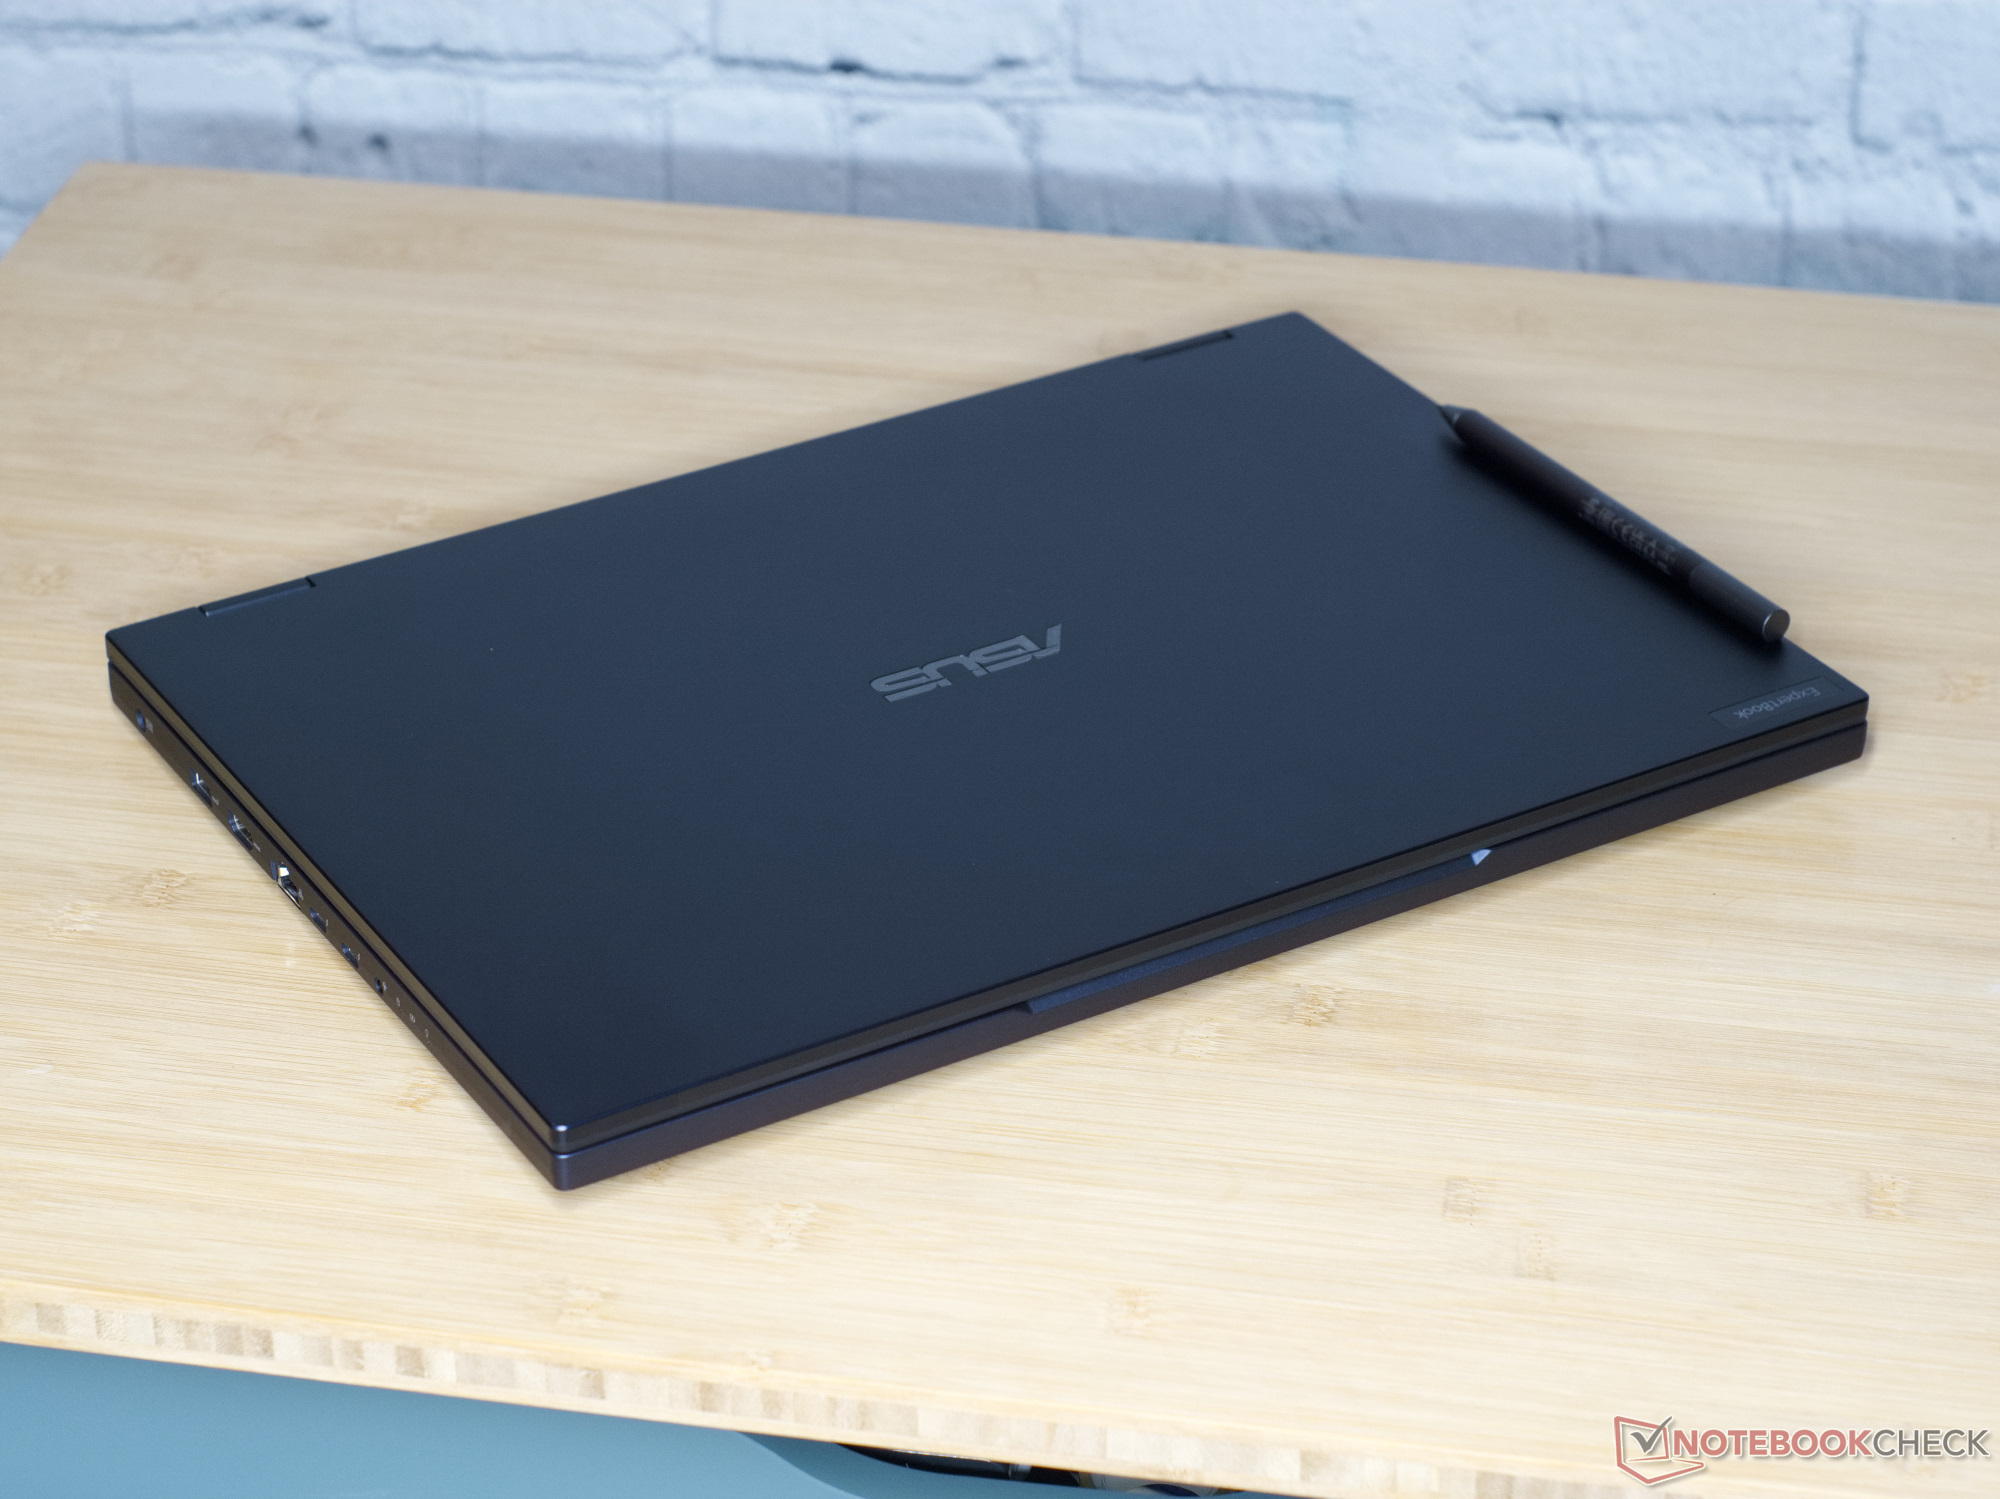
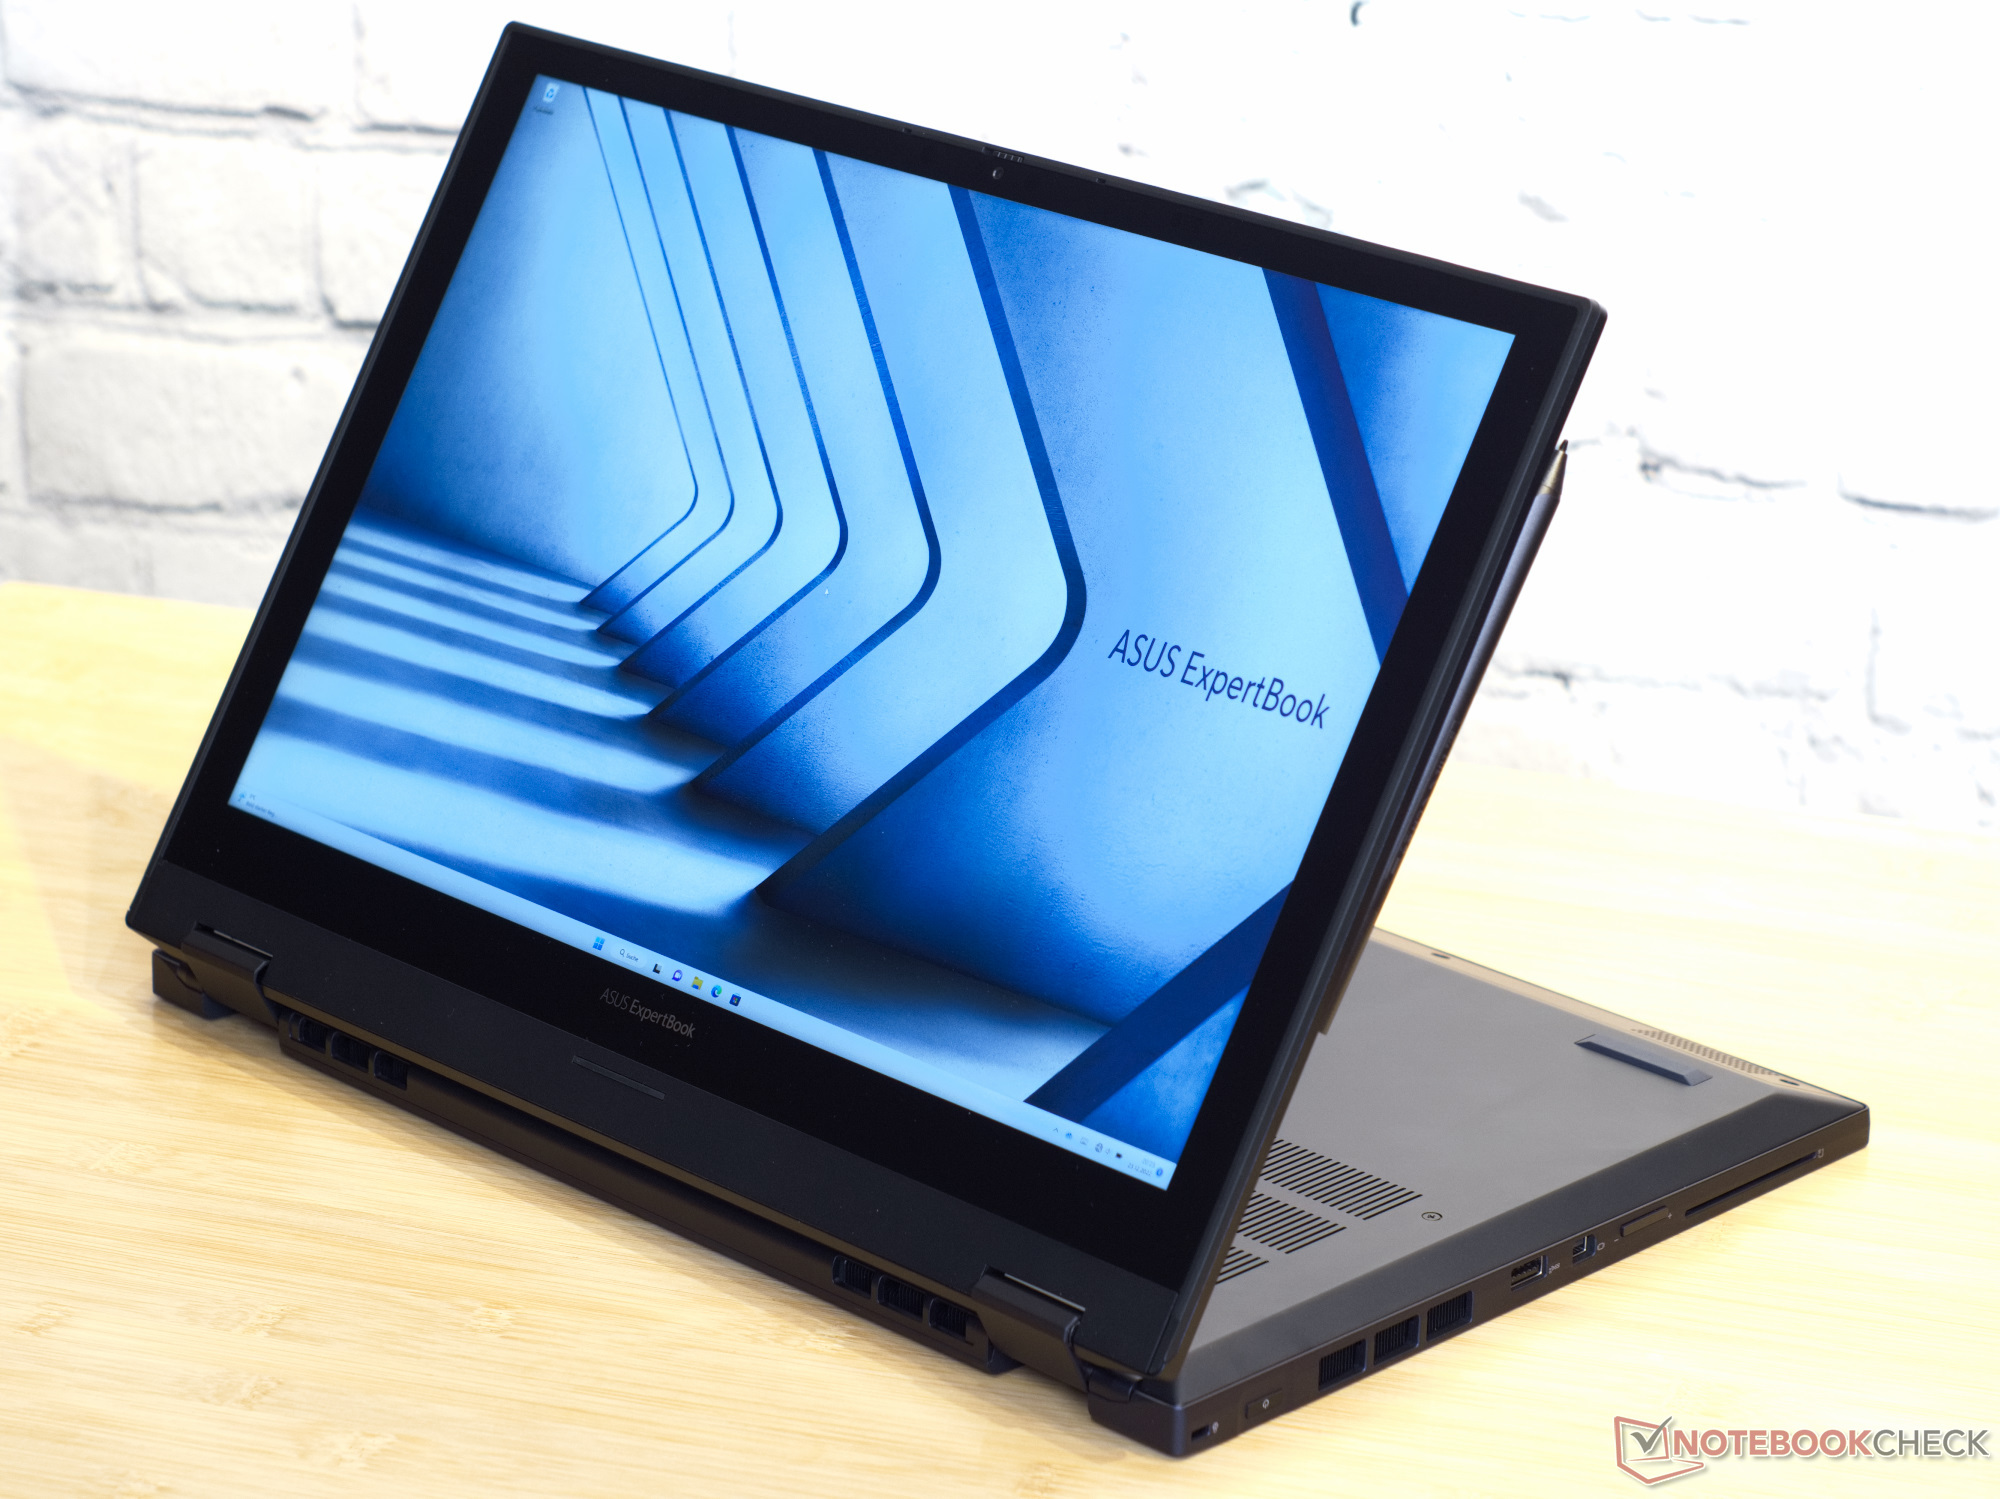
作为一个可转换的产品,ExpertBook B6 Flip相对较厚。所以把它作为平板电脑使用感觉有点不寻常。对于一个拥有16英寸屏幕的工作站来说,这款笔记本也是非常大的。
设备 - Thunderbolt 4和PowerDelivery
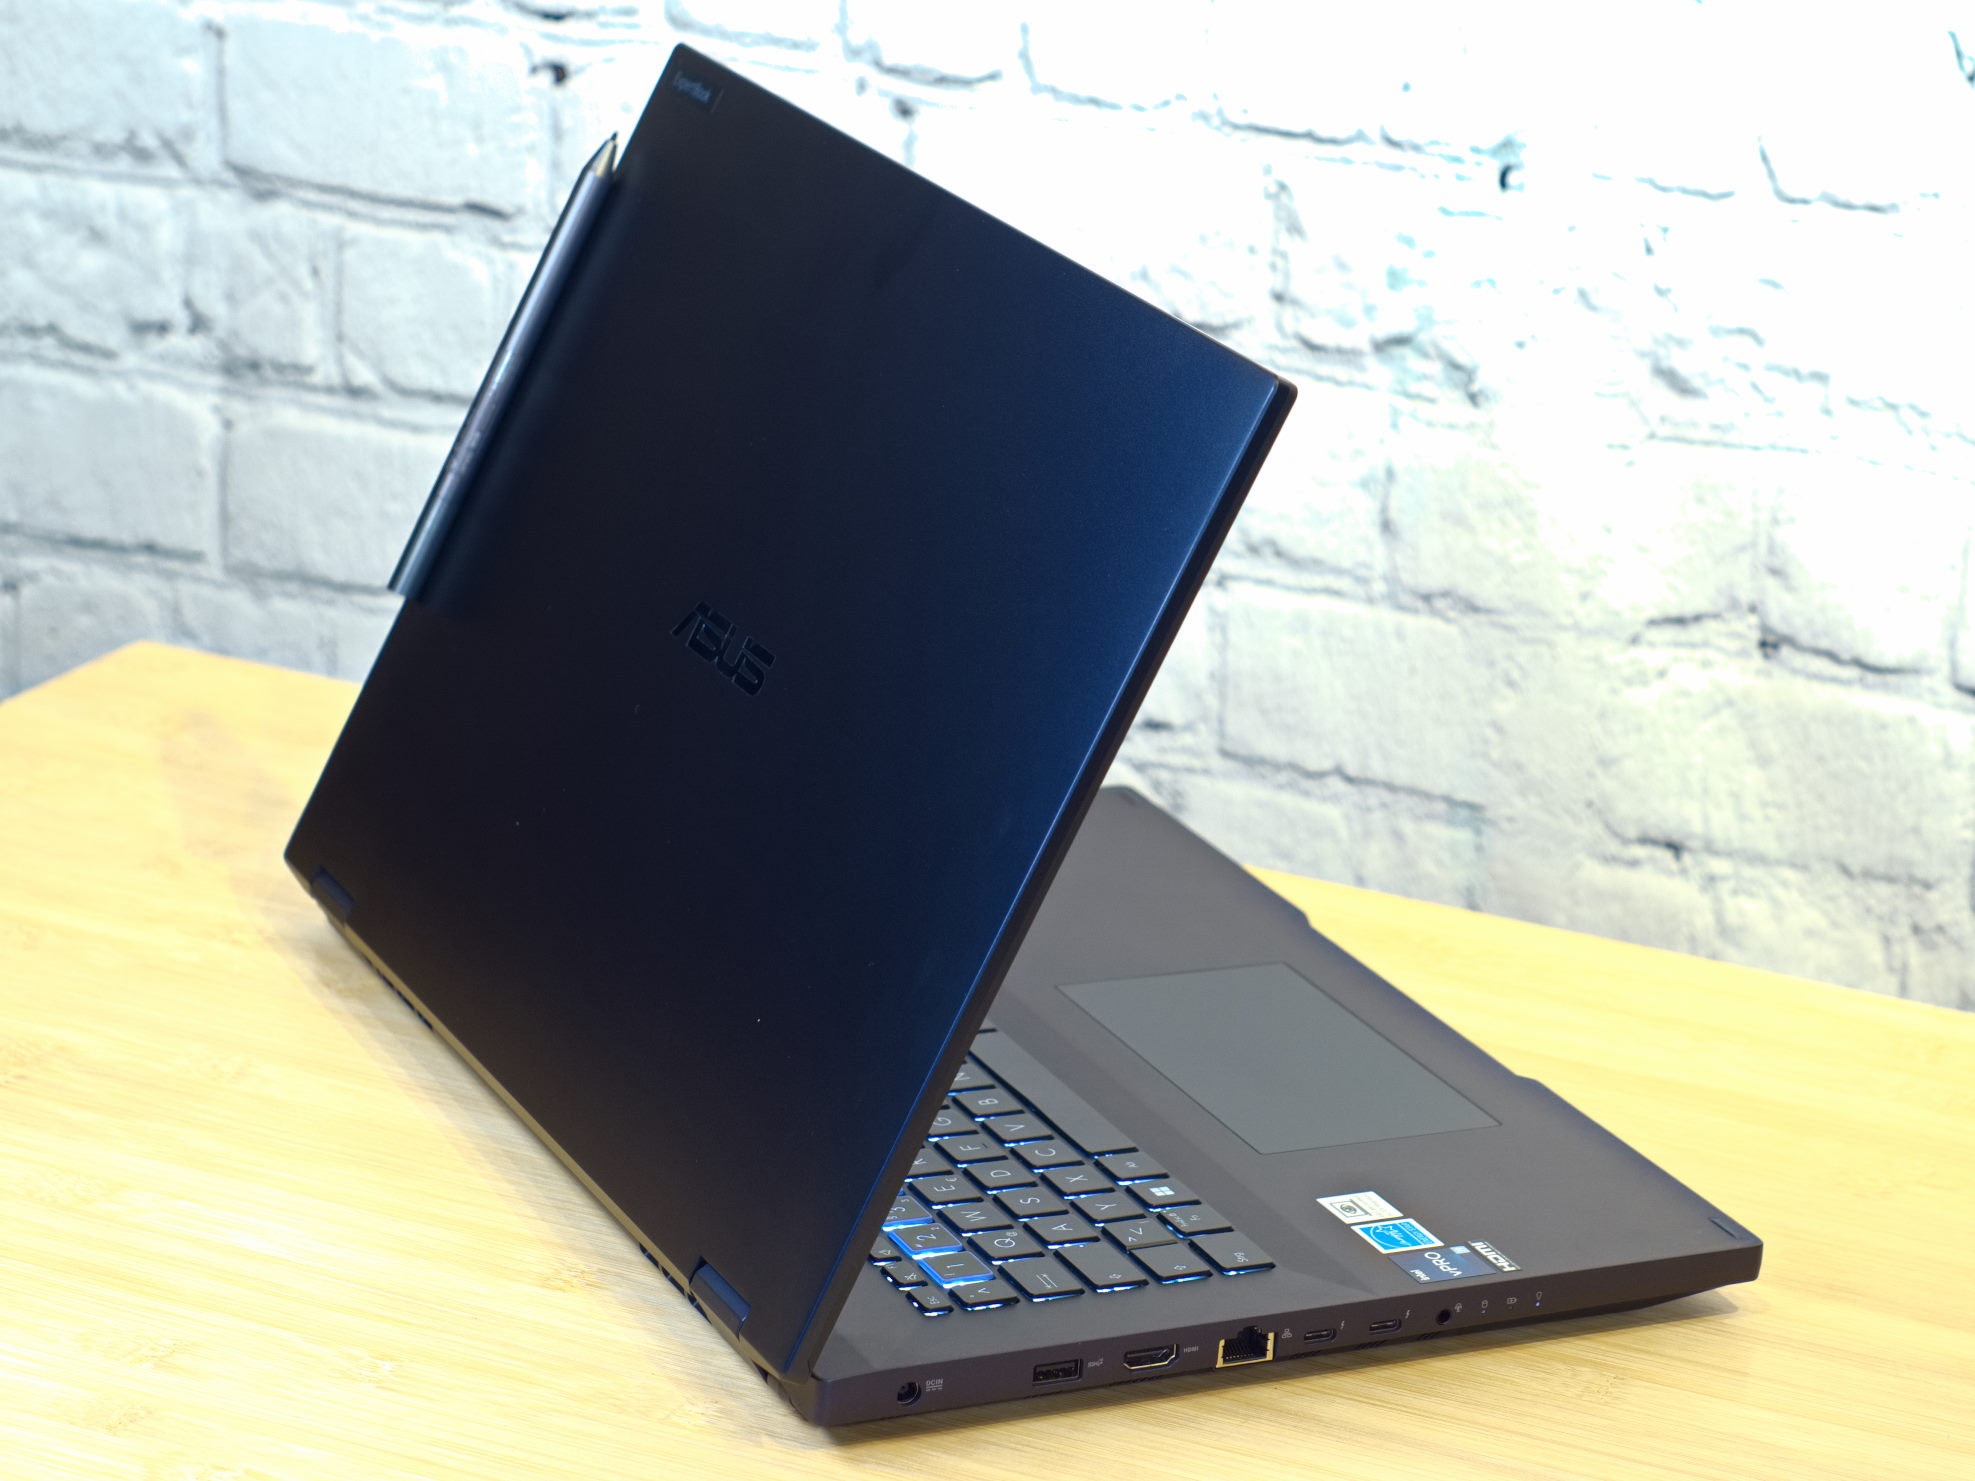
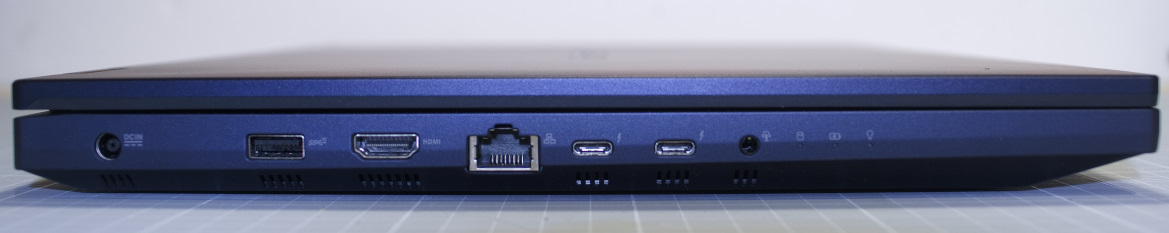
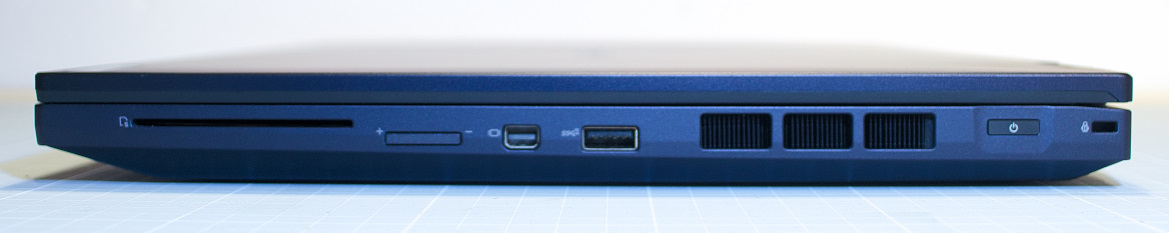
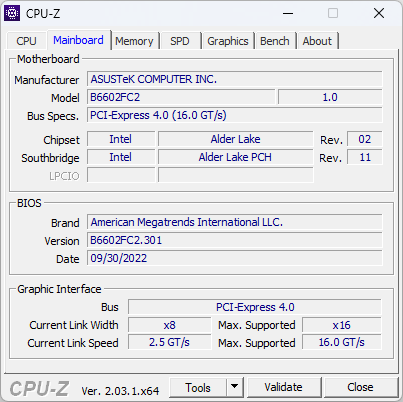
华硕Expertbook B6 Flip上的端口选择对传统工作站来说是比较标准的。最多,这里缺少一个SD读卡器。USB Type-C端口完全配备了Thunderbolt、DisplayPort和PowerDelivery。右侧USB-A端口旁边的大通风口有些尴尬。如果不小心,你可能会不小心用USB插头损坏散热片。
沟通
一个英特尔Wi-Fi 6E AX211模块负责WLAN连接,在ExpertBook中提供双向的高传输速度。
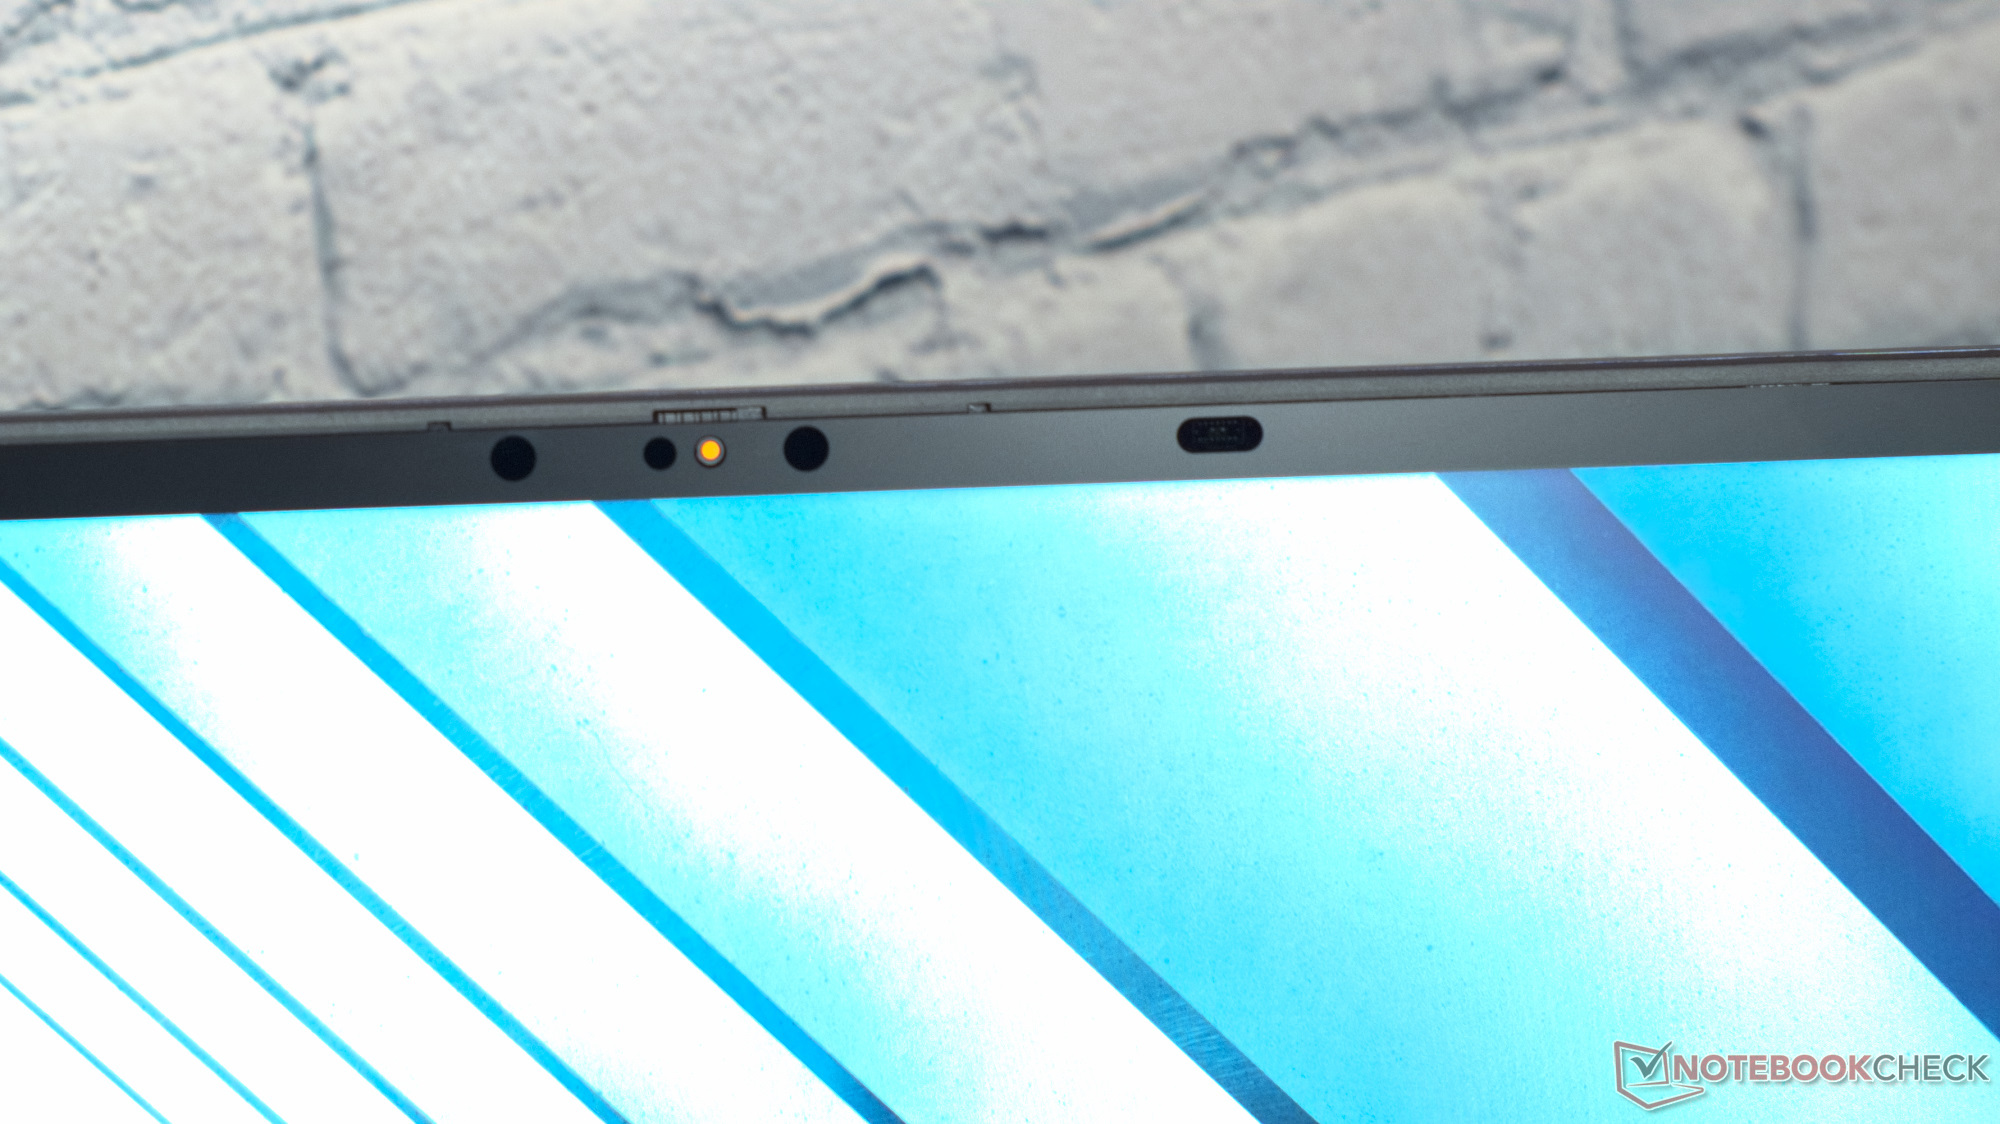
网络摄像头
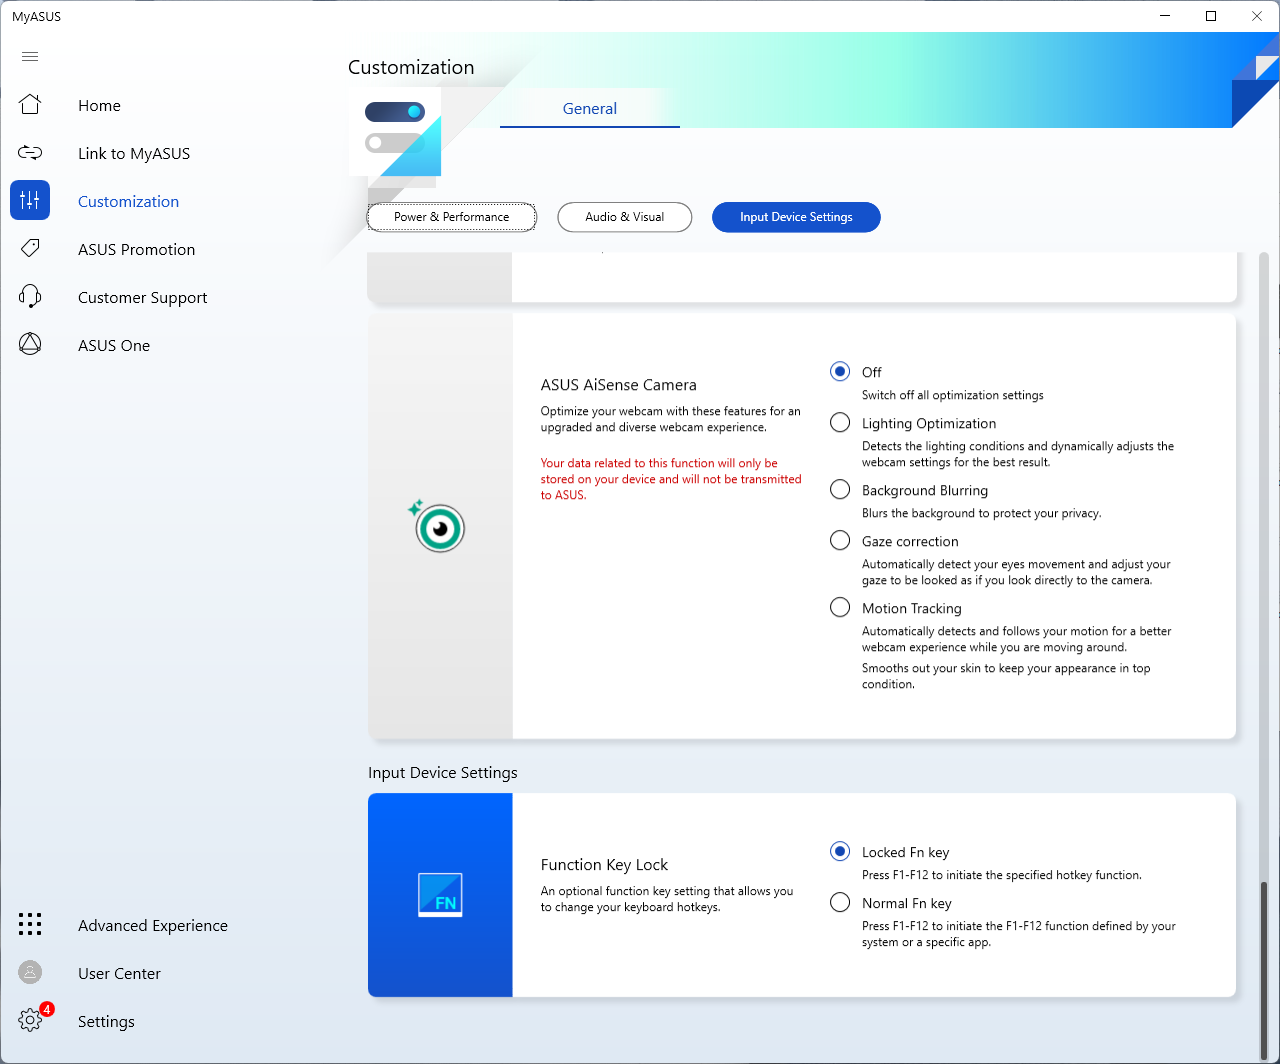
该工作站有一个全高清网络摄像头,它还能够通过Windows Hello进行人脸识别。网络摄像头的对比度和一般图像质量都很好,但色彩再现还有待改进。尤其是肤色,在我们的测试卡中显示得很差。然而,可以通过MyAsus应用程序对图像进行一些AI改进或调整。


安全问题
该工作站在安全方面有很强的定位。除了TPM 2.0等标准外,ExpertBook B6 Flip还有一个智能卡读卡器、一个指纹传感器、一个Kensington安全插槽和人脸识别选项。英特尔vPro也确保确保公司网络的安全性提高。
辅料
除了电源和文件,MPP 2.0华硕笔也包含在华硕ExpertBook B6 Flip的供货范围内。
维护
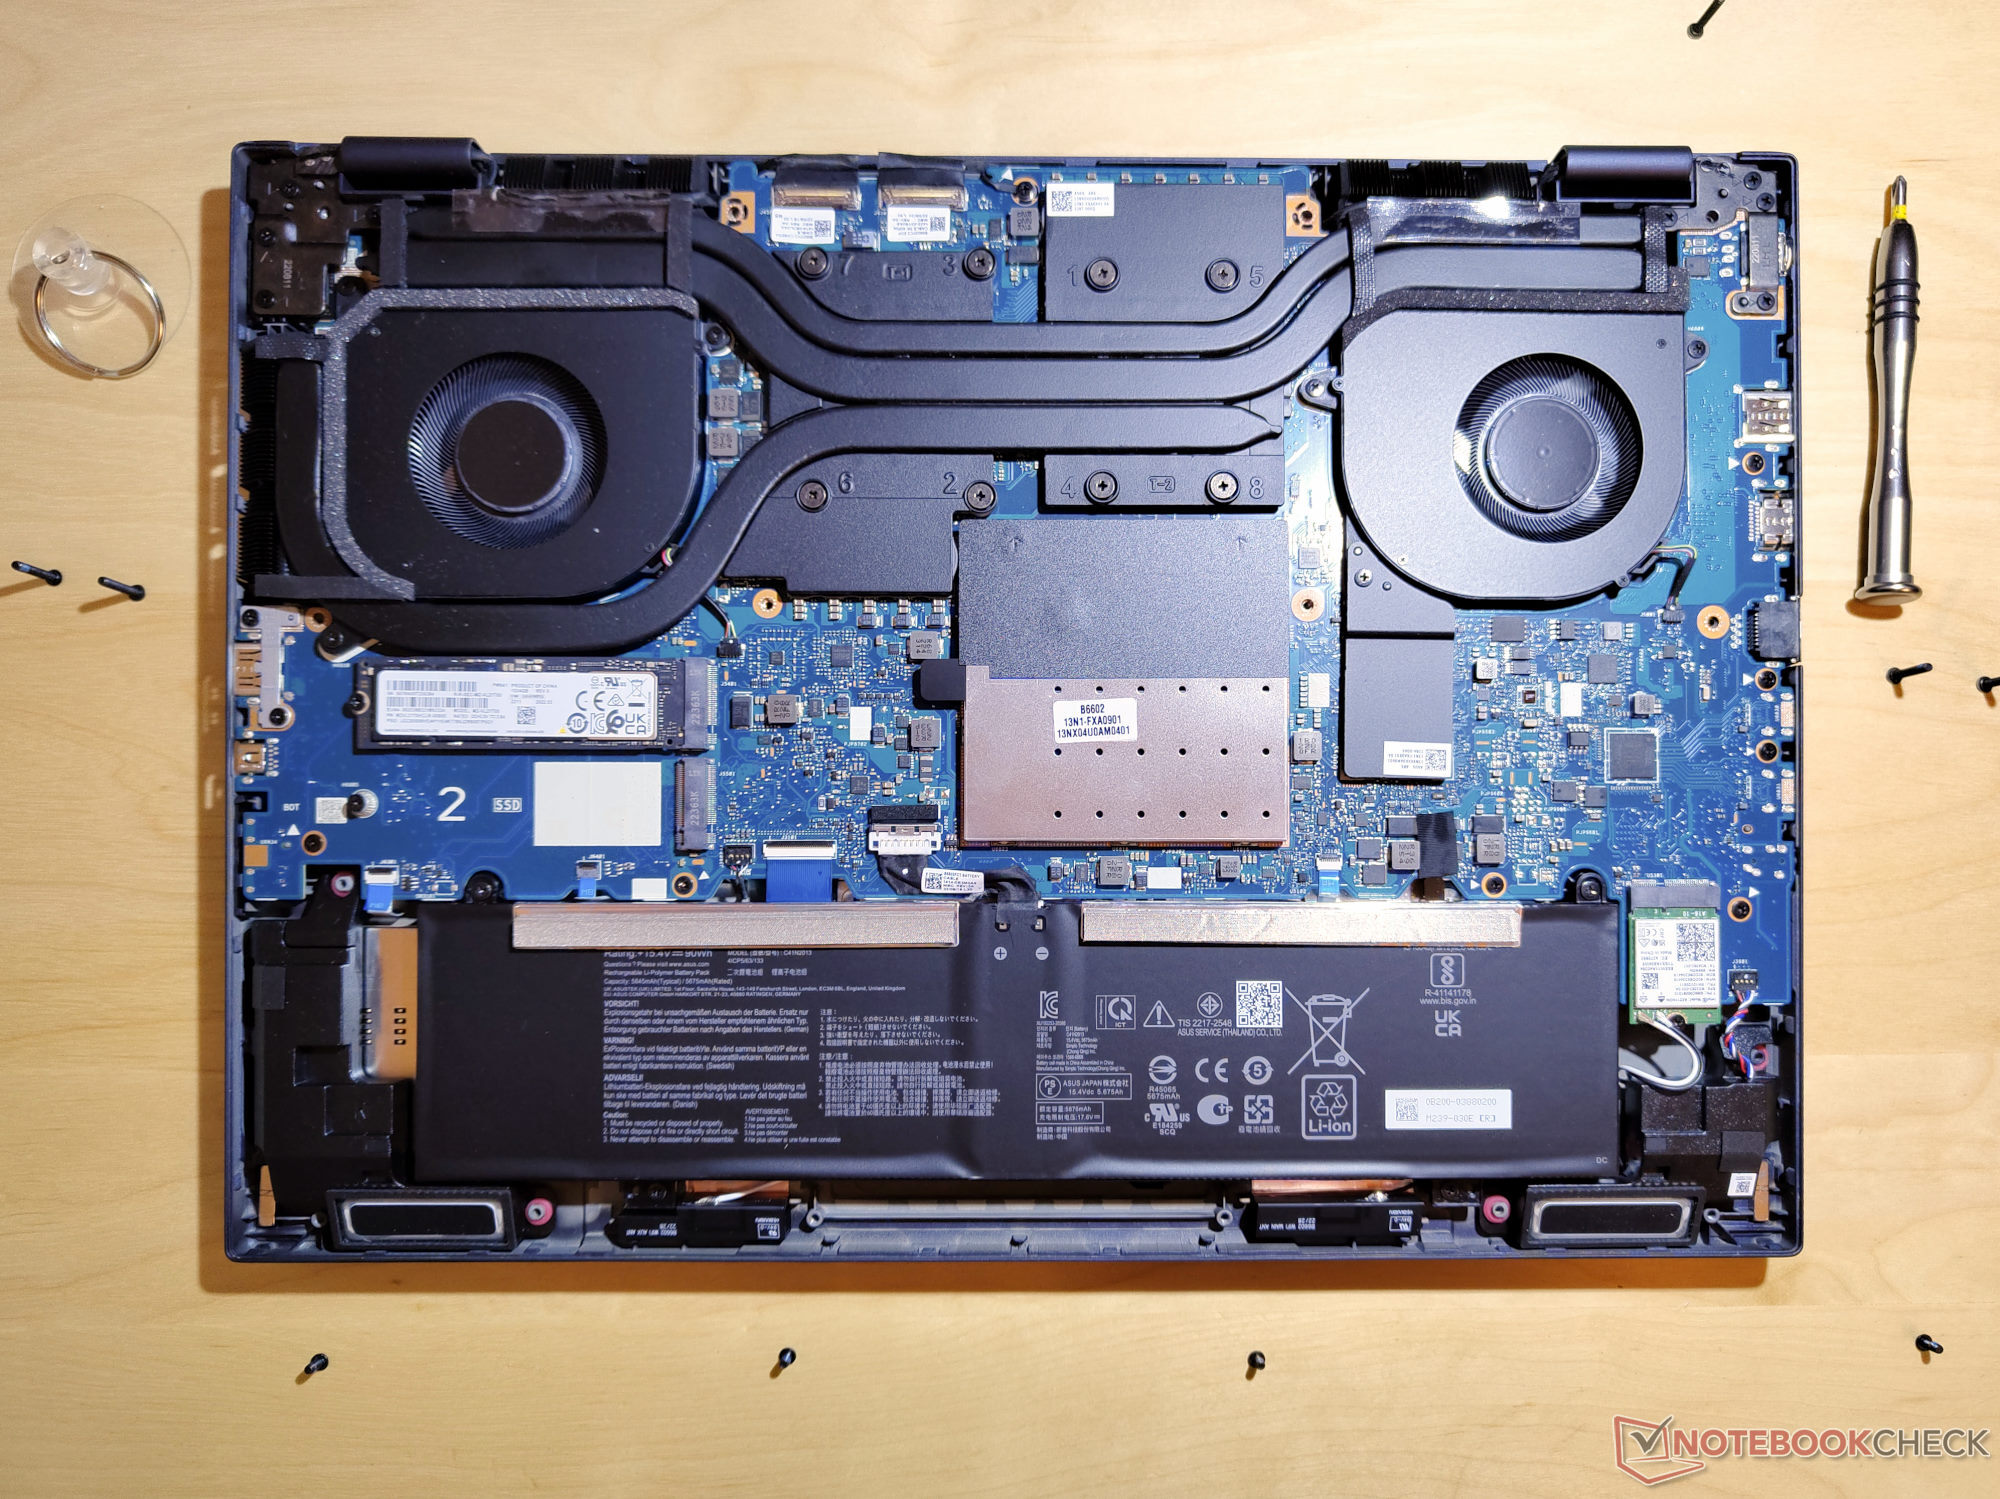
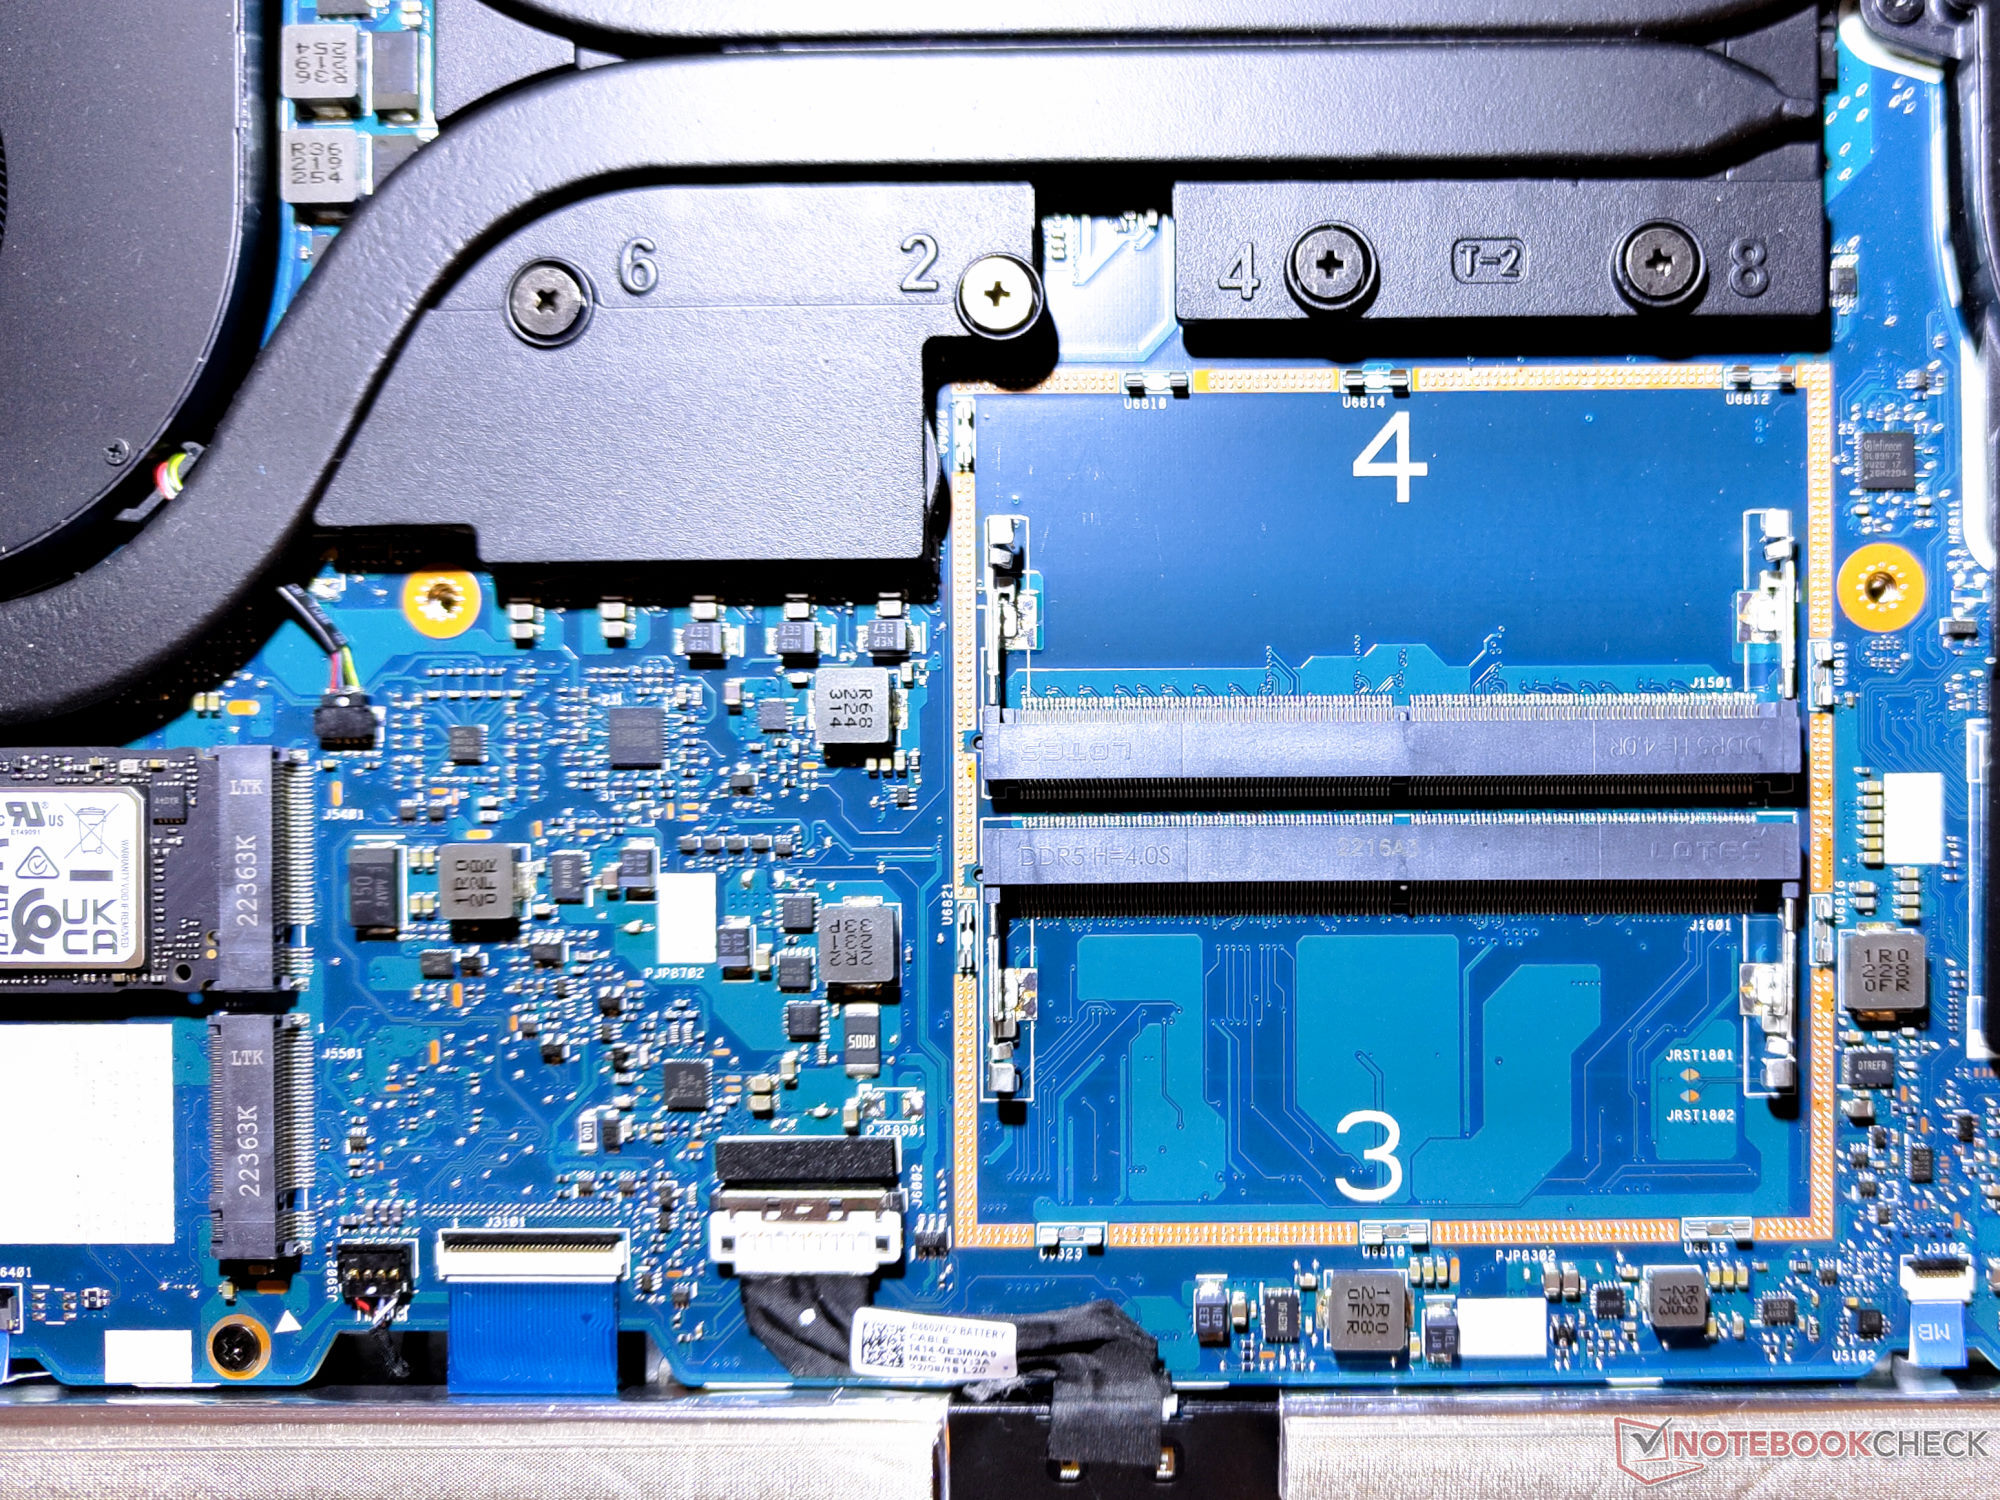
华硕为ExpertBook B6 Flip提供了一份英文服务手册。华硕为ExpertBook B6 Flip提供了一份英文服务手册,其中介绍了如何打开敞篷车以及如何更换电池、M.2-SSD、RAM模块、主板和屏幕。四个内存插槽中的两个和两个M.2插槽在卸下底板后很容易接触到。另外两个RAM插槽位于主板的上侧。那些想接触这些的人必须拆下整个主板。这在手册中分16个步骤描述。在这个过程中,屏幕和整个冷却系统也必须被拆除。
在我们的审查设备中,内存插槽3和4以及M.2插槽2没有被占用。因此,在这里升级将是可能的,不需要过多的修改。但是要更换RTC电池,例如,必须拆除主板。
担保
华硕ExpertBook B6 Flip在全球范围内提供三年的保修服务。根据不同的国家,提供的服务可能有所不同。
输入设备 - MPP 2.0手写笔和愉快的键盘
通过键盘、触摸屏、点击板和手写笔,这款敞篷车提供了多种输入可能性。
键盘
华硕ExpertBook B6 Flip的Chiclet键盘具有1.5毫米的键程和清晰的压力点,具有出色的触觉效果。键盘的背光灯也很悦目。然而,亮度无法调整。在任何情况下,上排数字的独立按键都很醒目。
华硕本可以更好地利用笔记本上的空间。这个大的工作站当然有足够的空间容纳一个标准的数字键盘和全尺寸的方向键。然后,键盘区域又被推到了一起,相当紧密。制造商表示,该键盘是防溅的。
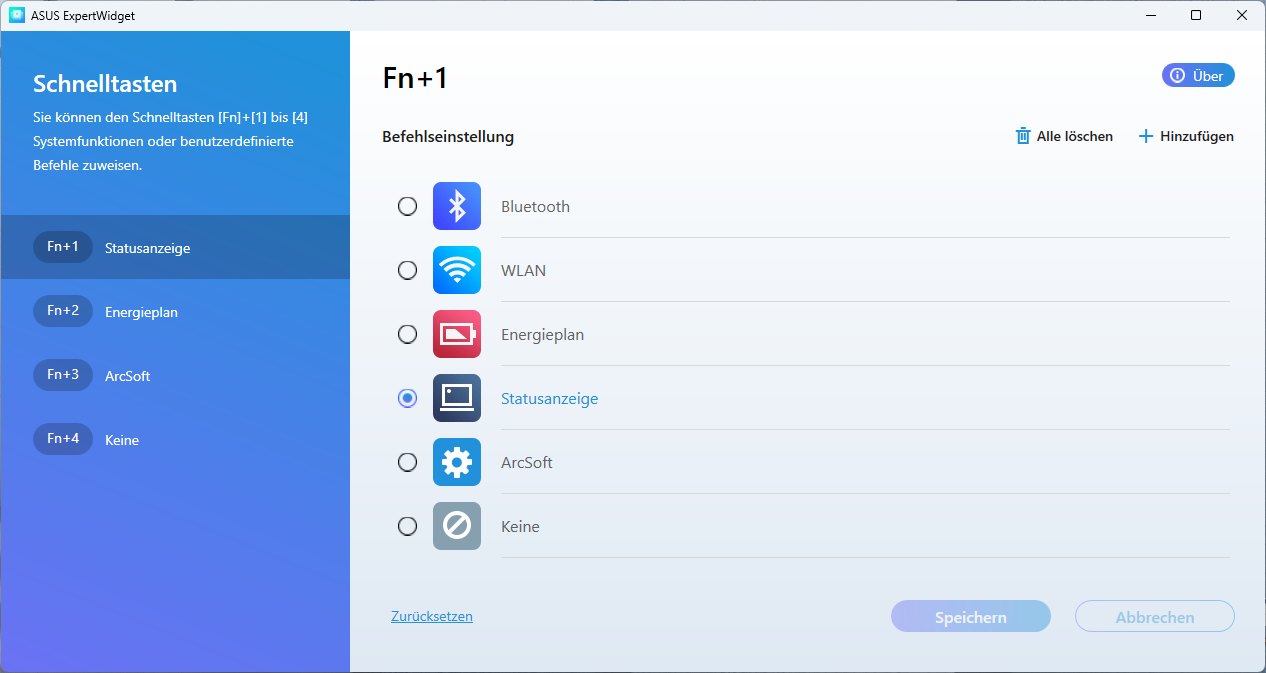
使用华硕ExpertWidget可以为显眼的1到4个键设置快速访问。除了一些预设的功能外,还可以创建自定义功能。
触摸板
ExpertBook上的ClickPad尺寸为7.5×13厘米。与许多更高端的华硕笔记本电脑一样,触摸板也配备了玻璃表面。因此,它提供了一种令人愉快的感觉,具有很高的精确度,而且还能防止磨损。各种各样的手势,Windows 11都能识别,最多可以用五个手指执行。
铅笔
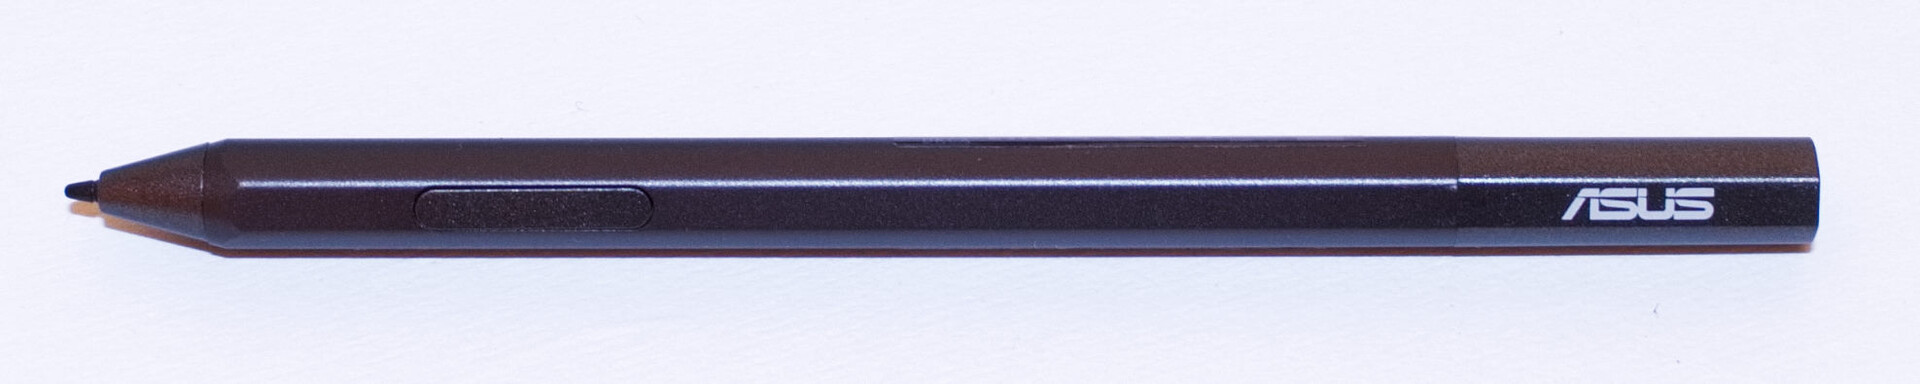
笔记本电脑的屏幕也支持笔输入。我们的评测样品中包括MPP 2.0华硕笔。这支手写笔提供两个功能键和4,096个压力级别,由一节AAAA电池供电。它的重量约为13克,直径为8毫米,长度为14.5厘米。ExpertBook B6 Flip上的输入是精确的。
工作站上没有笔座,但笔可以用磁铁吸附在笔记本上。不幸的是,手写笔中的强磁也会触发笔记本的锁定传感器。当MPP 2.0华硕笔不小心连接在一起时,这偶尔会导致屏幕关闭或笔记本电脑进入睡眠模式或关闭(取决于设置)。
显示屏 - TÜV-Rheinland认证的显示屏


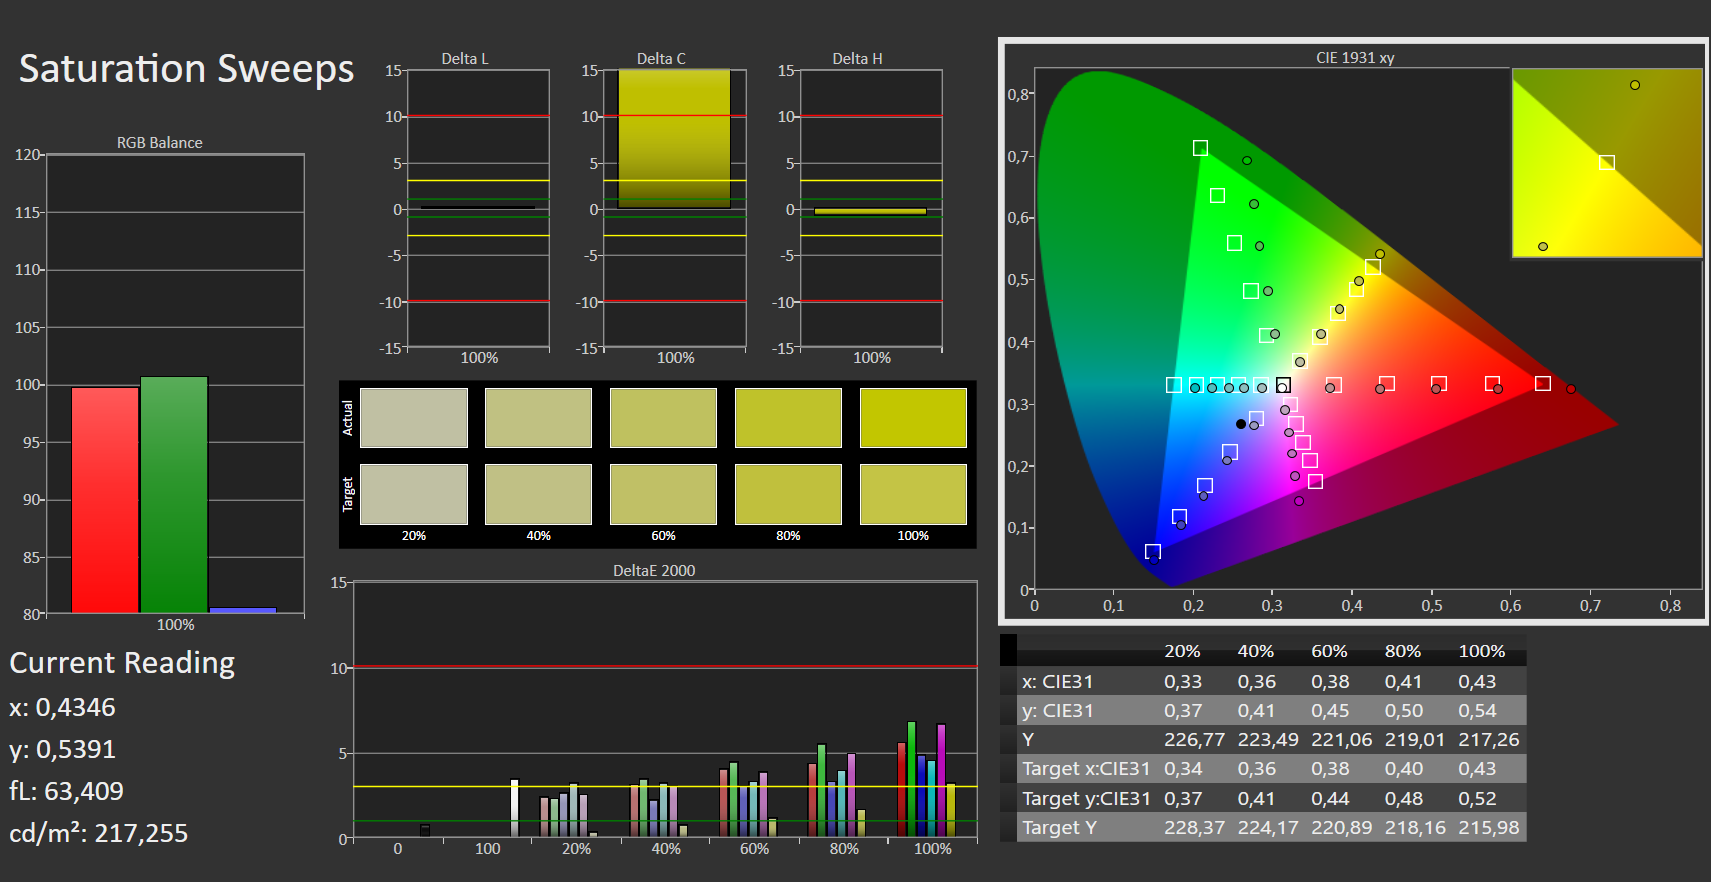
华硕ExpertBook B6 Flip的屏幕分辨率为2,560 × 1,660。因此,IPS面板是16:10的格式。看不到真正的屏幕出血,但面板使光线偏振,以至于相机图像中出现了亮点。根据规格表,该屏幕的亮度值为500cd/m²。我们测得的最大亮度为447 cd/m²。然而,在我们的测试中,我们无法确定屏幕的亮度在多大程度上受到屏幕上方的光线传感器的影响。在测量亮度时,光线传感器被照亮。这是否会刺激屏幕达到全亮度无法确定,而且传感器也无法停用。
再加上0.3cd/m²的黑值,这导致对比度为1,467:1。二合一工作站的触摸屏受到玻璃面板的保护。由于采用了磨砂表面,所以具有防眩光功能,使工作用笔记本电脑的屏幕易于观察。这也得到了TÜV-Rheinland的认证。
| |||||||||||||||||||||||||
Brightness Distribution: 82 %
Center on Battery: 447 cd/m²
Contrast: 1467:1 (Black: 0.3 cd/m²)
ΔE ColorChecker Calman: 2.81 | ∀{0.5-29.43 Ø4.71}
calibrated: 2.99
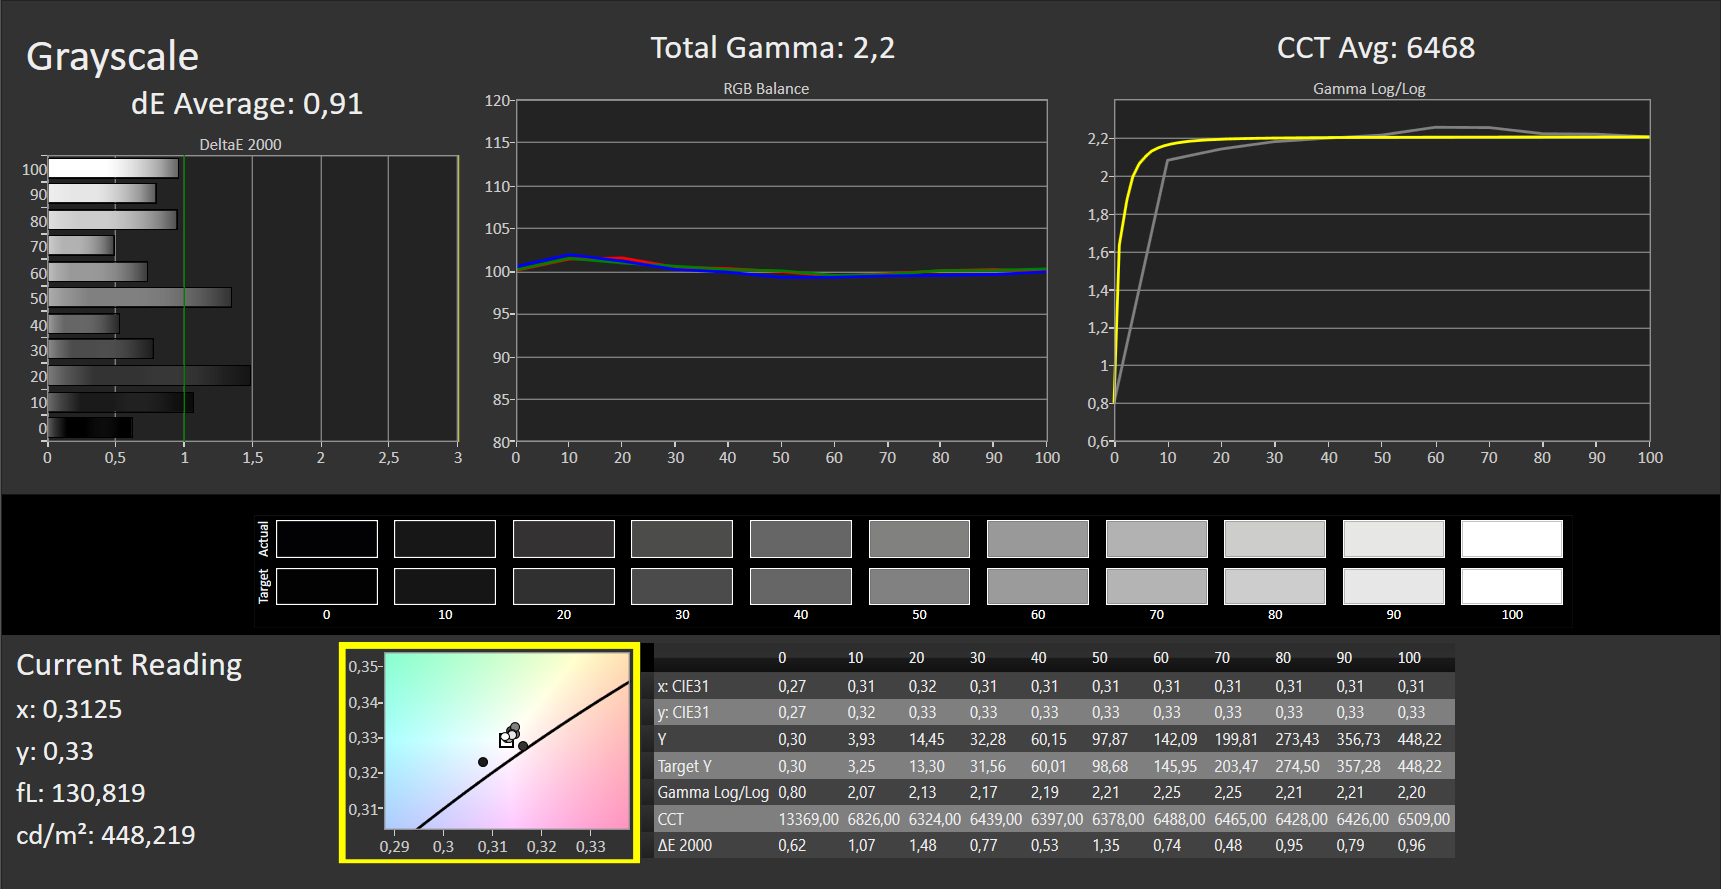
ΔE Greyscale Calman: 0.91 | ∀{0.09-98 Ø4.96}
85.52% AdobeRGB 1998 (Argyll 3D)
99.89% sRGB (Argyll 3D)
97.9% Display P3 (Argyll 3D)
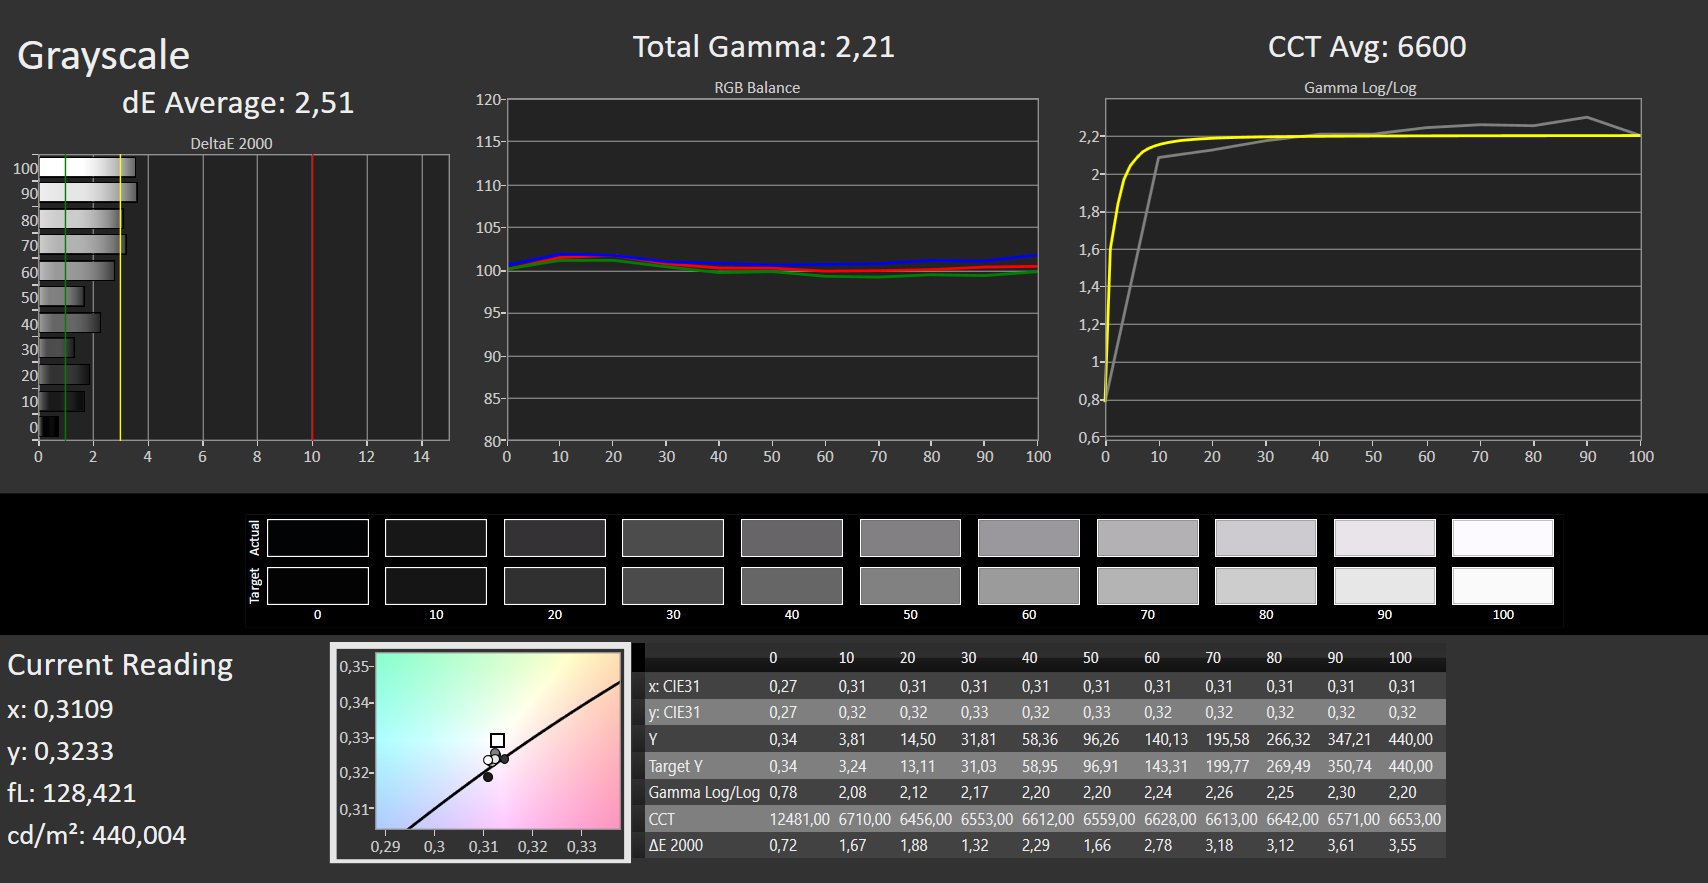
Gamma: 2.2
CCT: 6600 K
| Asus ExpertBook B6 Flip B6602FC2 AU Optronics Model: AUOE495, IPS, 2560x1600, 16" | Lenovo ThinkPad P16 G1 21D6001DMB NE160QDM-N63 , IPS LED, 2560x1600, 16" | HP ZBook Studio 16 G9 62U04EA BOE0A52, IPS, 3840x2400, 16" | Dell Precision 7670 Samsung 160YV03, OLED, 3840x2400, 16" | MSI CreatorPro Z16P B12UKST B160QAN02.N, IPS, 2560x1600, 16" | Asus ProArt StudioBook 16 W7600H5A-2BL2 ATNA60YV02-0, OLED, 3840x2400, 16" | Lenovo Yoga Slim 7 Pro X 14IAH7 82TK006CGE MNE507ZA1-1, IPS, 3072x1920, 14.5" | |
|---|---|---|---|---|---|---|---|
| Display | -14% | 0% | 5% | 1% | 6% | -21% | |
| Display P3 Coverage (%) | 97.9 | 71.5 -27% | 97.5 0% | 99.9 2% | 97.6 0% | 99.9 2% | 65.7 -33% |
| sRGB Coverage (%) | 99.89 | 100 0% | 99.9 0% | 100 0% | 99.9 0% | 100 0% | 92.1 -8% |
| AdobeRGB 1998 Coverage (%) | 85.52 | 73.3 -14% | 86.3 1% | 97.5 14% | 87.4 2% | 98.6 15% | 67.7 -21% |
| Response Times | -30% | 61% | 92% | 60% | 91% | -13% | |
| Response Time Grey 50% / Grey 80% * (ms) | 36 ? | 37.7 ? -5% | 15.3 ? 57% | 1.9 ? 95% | 12.8 ? 64% | 2 ? 94% | 35 ? 3% |
| Response Time Black / White * (ms) | 17 ? | 26.3 ? -55% | 6.1 ? 64% | 2 ? 88% | 7.4 ? 56% | 2 ? 88% | 22 ? -29% |
| PWM Frequency (Hz) | 59.5 ? | 240 ? | |||||
| Screen | -26% | 10% | -62% | -0% | -12% | 22% | |
| Brightness middle (cd/m²) | 440 | 424 -4% | 554 26% | 340.1 -23% | 407 -7% | 353 -20% | 430 -2% |
| Brightness (cd/m²) | 418 | 398 -5% | 516 23% | 342 -18% | 388 -7% | 360 -14% | 408 -2% |
| Brightness Distribution (%) | 82 | 90 10% | 84 2% | 98 20% | 88 7% | 96 17% | 85 4% |
| Black Level * (cd/m²) | 0.3 | 0.24 20% | 0.47 -57% | 0.36 -20% | 0.29 3% | ||
| Contrast (:1) | 1467 | 1767 20% | 1179 -20% | 1131 -23% | 1483 1% | ||
| Colorchecker dE 2000 * | 2.81 | 2.6 7% | 1 64% | 2.5 11% | 1.3 54% | 2.45 13% | 0.7 75% |
| Colorchecker dE 2000 max. * | 4.62 | 4.9 -6% | 2.4 48% | 8.19 -77% | 2.5 46% | 3.75 19% | 1.3 72% |
| Colorchecker dE 2000 calibrated * | 2.99 | 0.8 73% | 0.6 80% | 0.7 77% | 2.77 7% | 0.4 87% | |
| Greyscale dE 2000 * | 0.91 | 4.1 -351% | 1.6 -76% | 3.5 -285% | 2.1 -131% | 1.88 -107% | 1.3 -43% |
| Gamma | 2.2 100% | 2.13 103% | 2.29 96% | 2.12 104% | 2.26 97% | 2.31 95% | 2.22 99% |
| CCT | 6600 98% | 7252 90% | 6458 101% | 6704 97% | 6437 101% | 6441 101% | 6526 100% |
| Total Average (Program / Settings) | -23% /
-24% | 24% /
15% | 12% /
-16% | 20% /
8% | 28% /
10% | -4% /
8% |
* ... smaller is better
显示屏的P3色彩空间和sRGB色彩空间在工作站的可转换性中得到了充分的再现。ExpertBook能以85%左右的比例渲染Adobe RGB。由于Display P3色彩空间主要用于电影,ExpertBook更适合于视频而不是照片编辑。
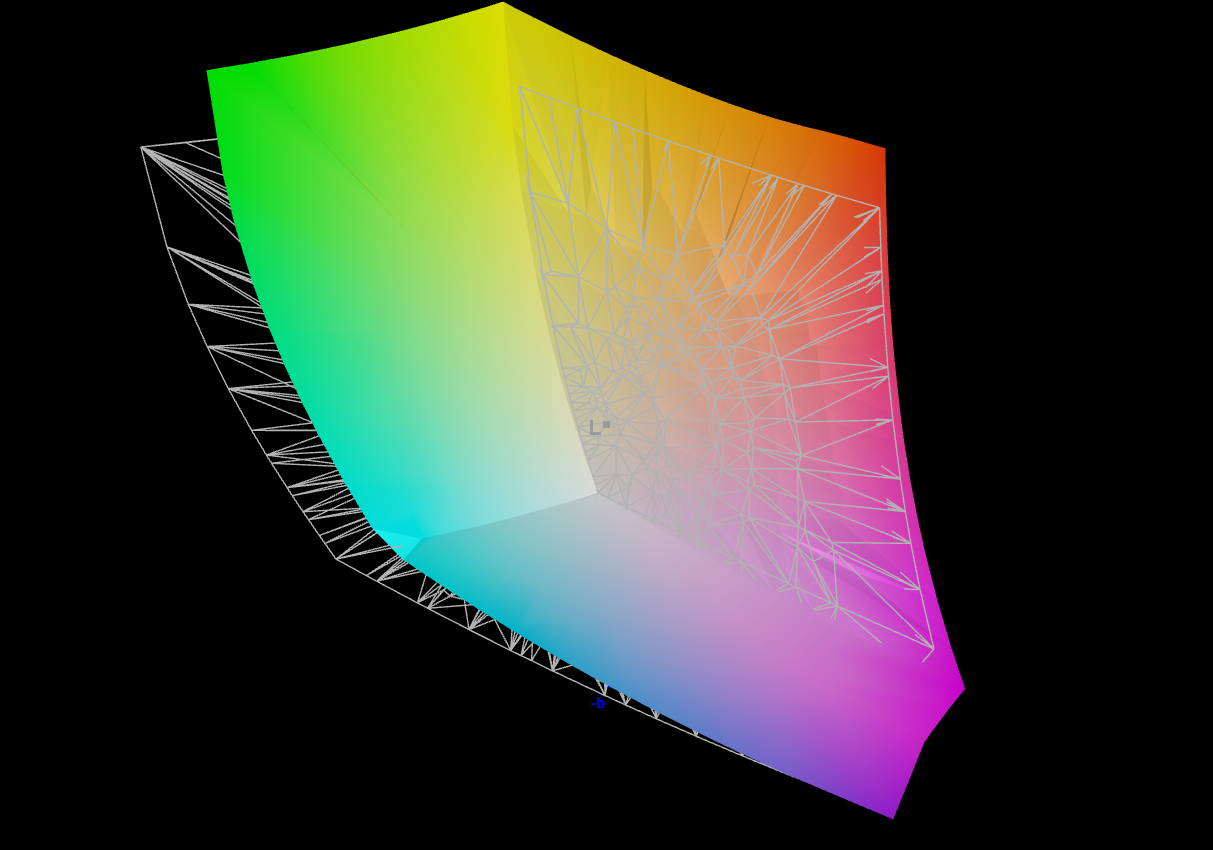

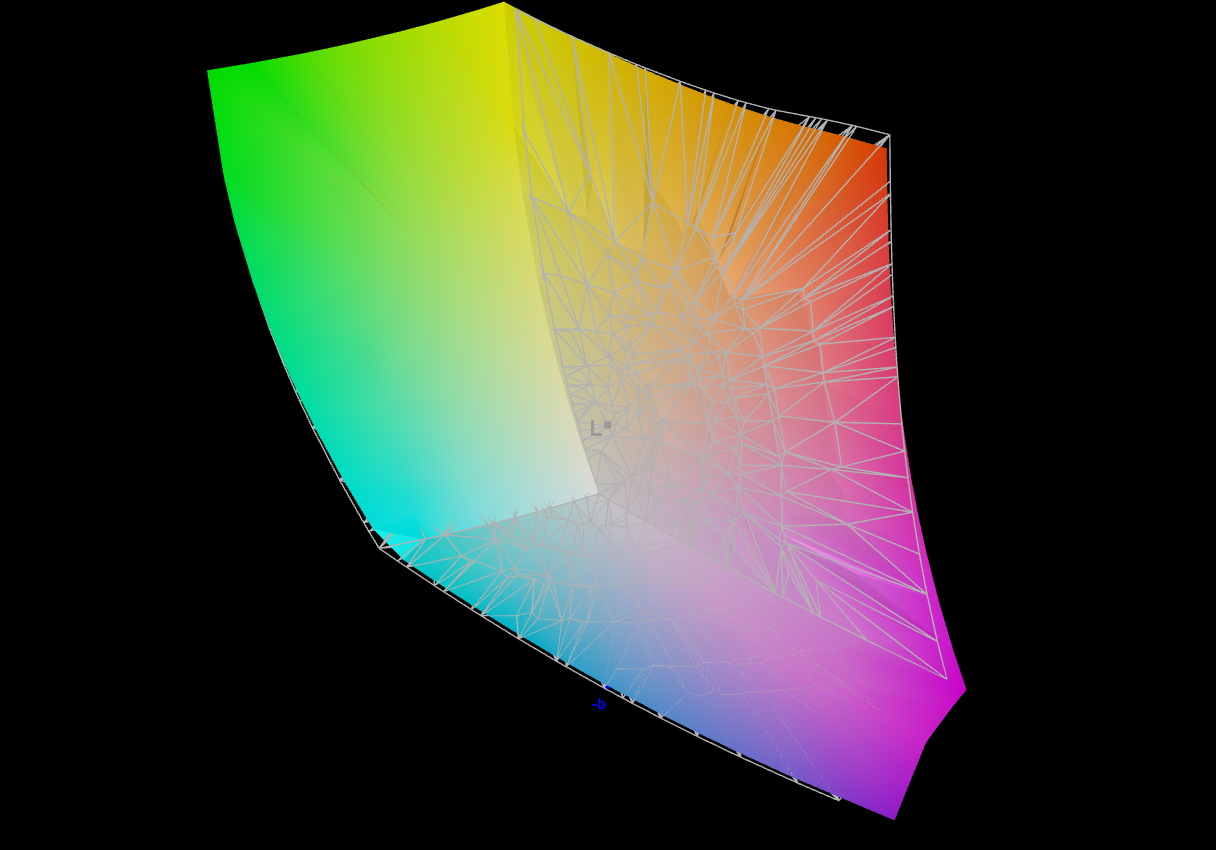
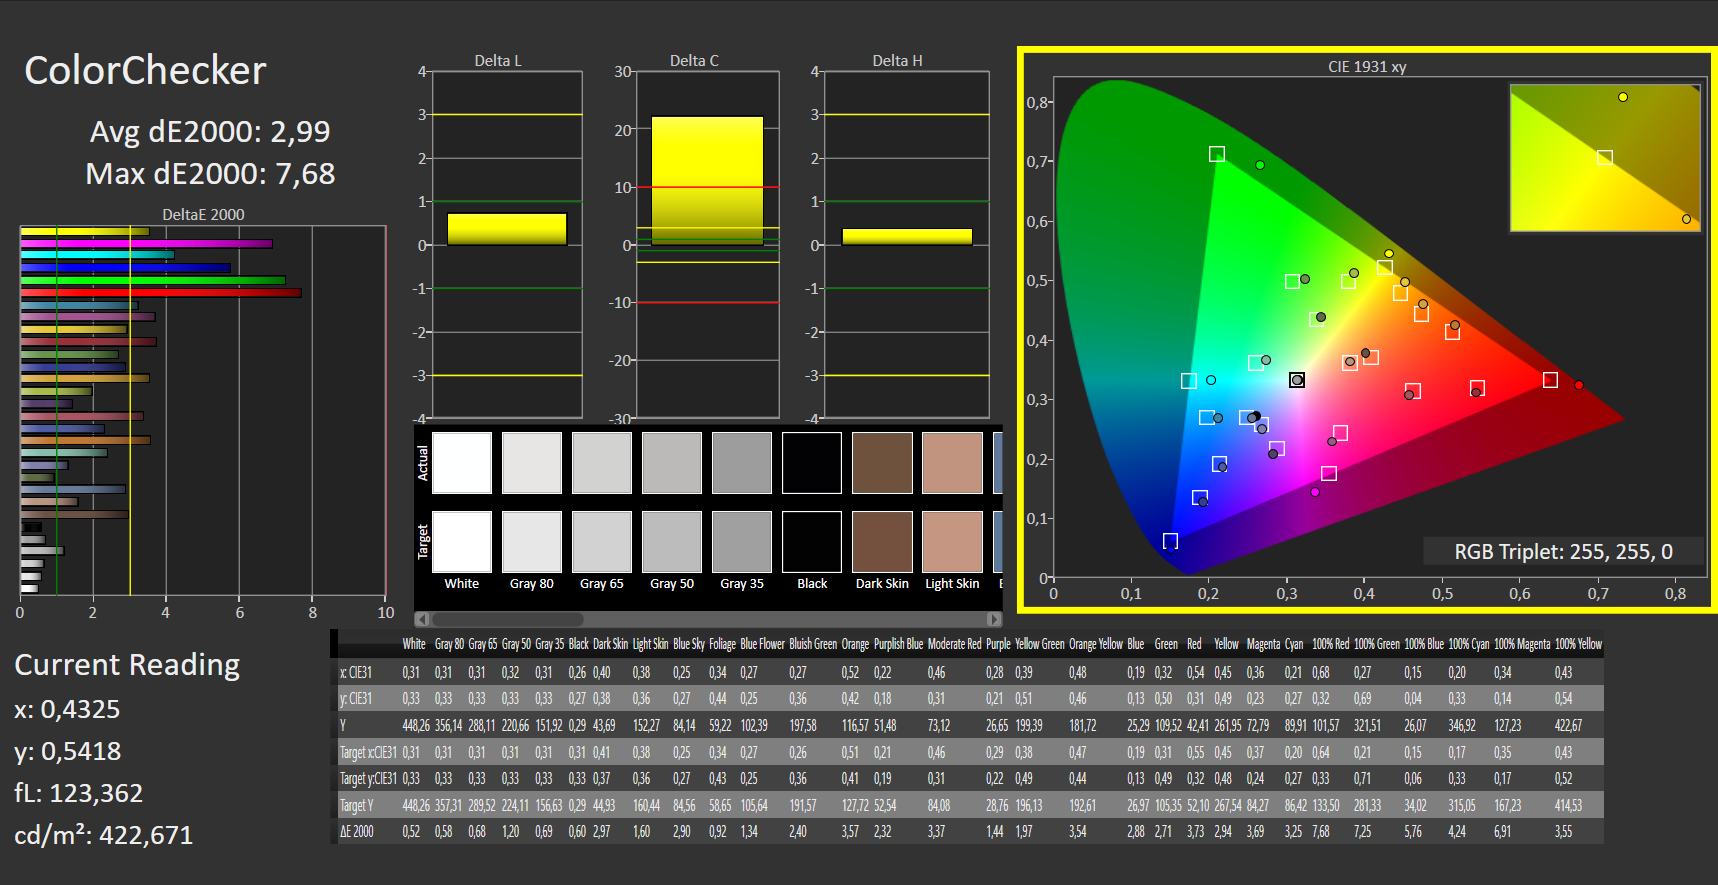
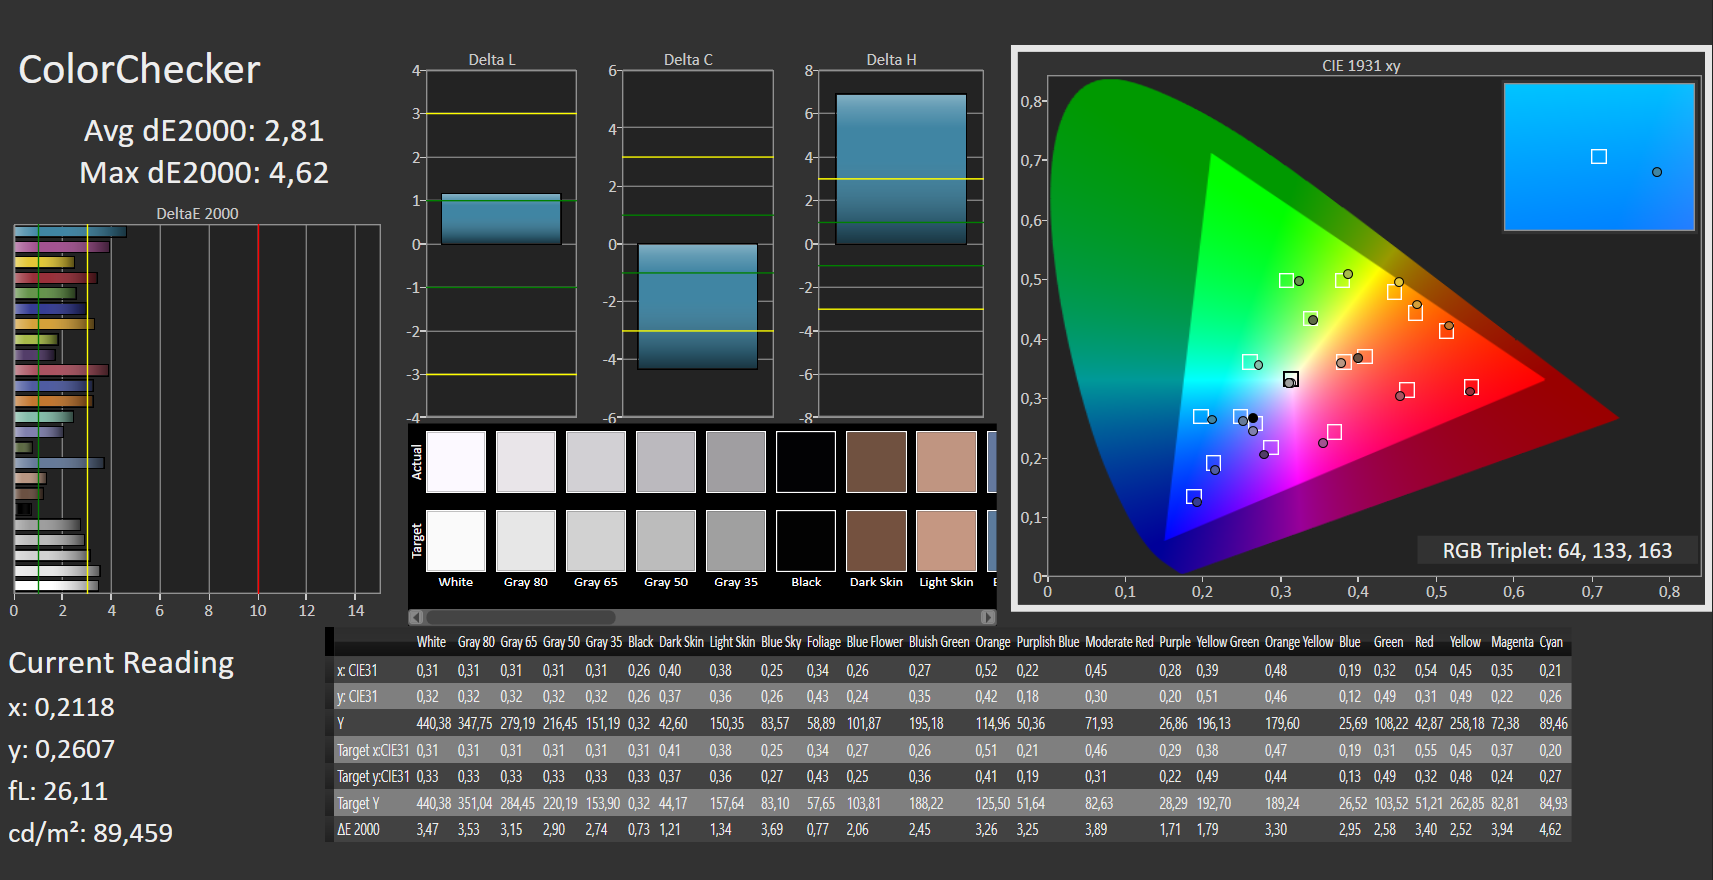
平均色彩偏差为ΔΕ2.99,华硕ExpertBook B6 Flip出厂时就配备了一个经过良好校准的屏幕。当使用信息框中的ICC配置文件时,平均值只略有下降,但绝对值从ΔΕ2000 7.68下降到ΔΕ2000 4.62。屏幕也能够准确地再现灰度和饱和度的颜色值。
Display Response Times
| ↔ Response Time Black to White | ||
|---|---|---|
| 17 ms ... rise ↗ and fall ↘ combined | ↗ 7 ms rise |  |
| ↘ 10 ms fall | ||
| The screen shows good response rates in our tests, but may be too slow for competitive gamers. In comparison, all tested devices range from 0.1 (minimum) to 240 (maximum) ms. » 39 % of all devices are better. This means that the measured response time is better than the average of all tested devices (19.8 ms). | ||
| ↔ Response Time 50% Grey to 80% Grey | ||
| 36 ms ... rise ↗ and fall ↘ combined | ↗ 16 ms rise |  |
| ↘ 20 ms fall | ||
| The screen shows slow response rates in our tests and will be unsatisfactory for gamers. In comparison, all tested devices range from 0.165 (minimum) to 636 (maximum) ms. » 51 % of all devices are better. This means that the measured response time is worse than the average of all tested devices (31 ms). | ||
Screen Flickering / PWM (Pulse-Width Modulation)
| Screen flickering / PWM not detected |  | ||
In comparison: 52 % of all tested devices do not use PWM to dim the display. If PWM was detected, an average of 7754 (minimum: 5 - maximum: 343500) Hz was measured. | |||
与我们数据库中的其他工作站相比,该屏幕的响应时间相当高。但对于不太可能用于游戏的笔记本电脑来说,这些数值仍然是合理的。
在户外,屏幕的略带哑光的表面确保了很少的反射。在你身后有太阳的情况下,显示屏的可读性仍有一定的限制。重新调整一下可视角度,就能在这方面有明显的改善。


ExpertBook有一个非常稳定的可视角度的显示屏。无论你从哪个角度看屏幕,肉眼都看不出颜色和亮度的偏差。即使是相机图像也很难发现显示屏的任何变化。

性能 - i9和A2000的功率为140瓦
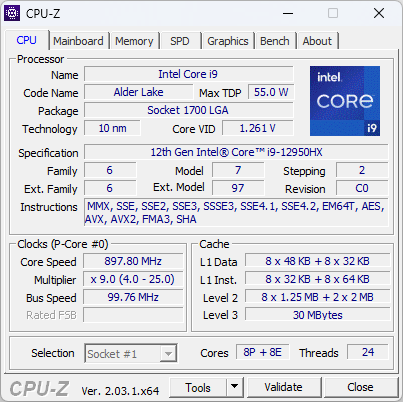
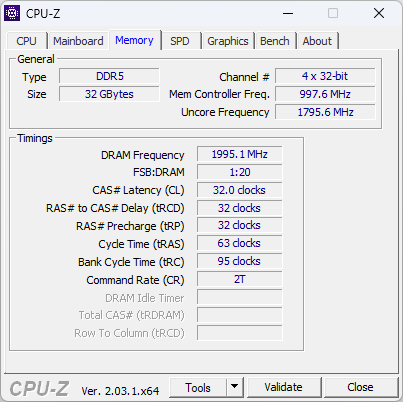
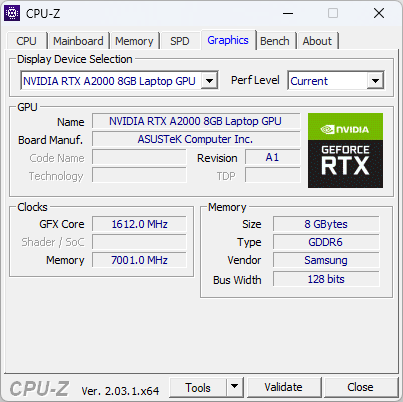
华硕ExpertBook B6 Flip的配置选项开始于英特尔酷睿i7-12850HX和8GB的内存。一个 英特尔酷睿i9-12950HX和32GB的DDR5内存代表了迄今为止的最大值。所有配置变体都配备了 NvidiaGeForce RTX A2000我们的评测样本也采用了最佳配置(英特尔酷睿i9和32GB内存)。
因此,ExpertBook应该满足工作站的许多要求。然而,内存可能是一个限制因素,这取决于项目范围。广泛的数据库或CAD程序中带有许多组件的3D图纸会很快耗尽32GB。但这是可以升级到128GB的。
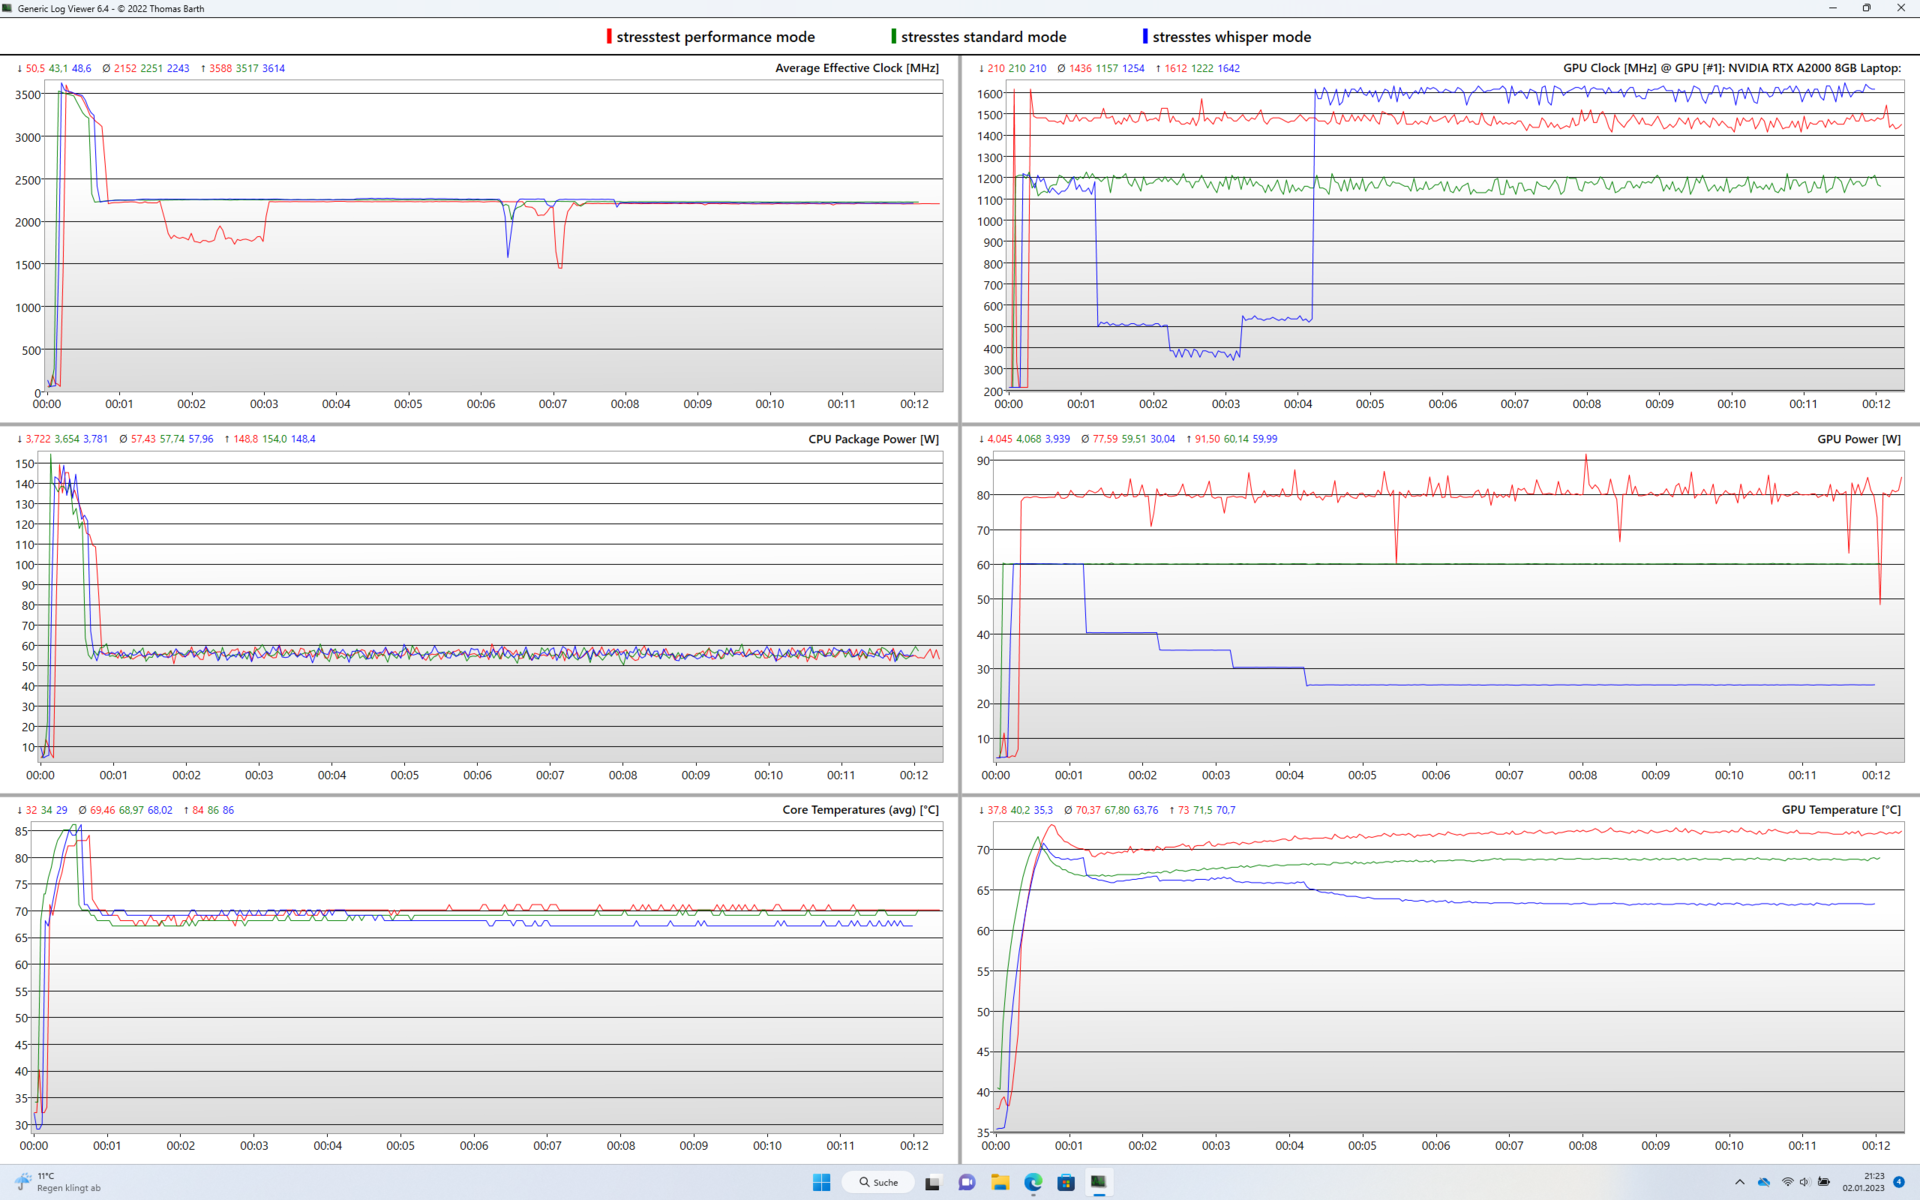
性能控制和测试条件
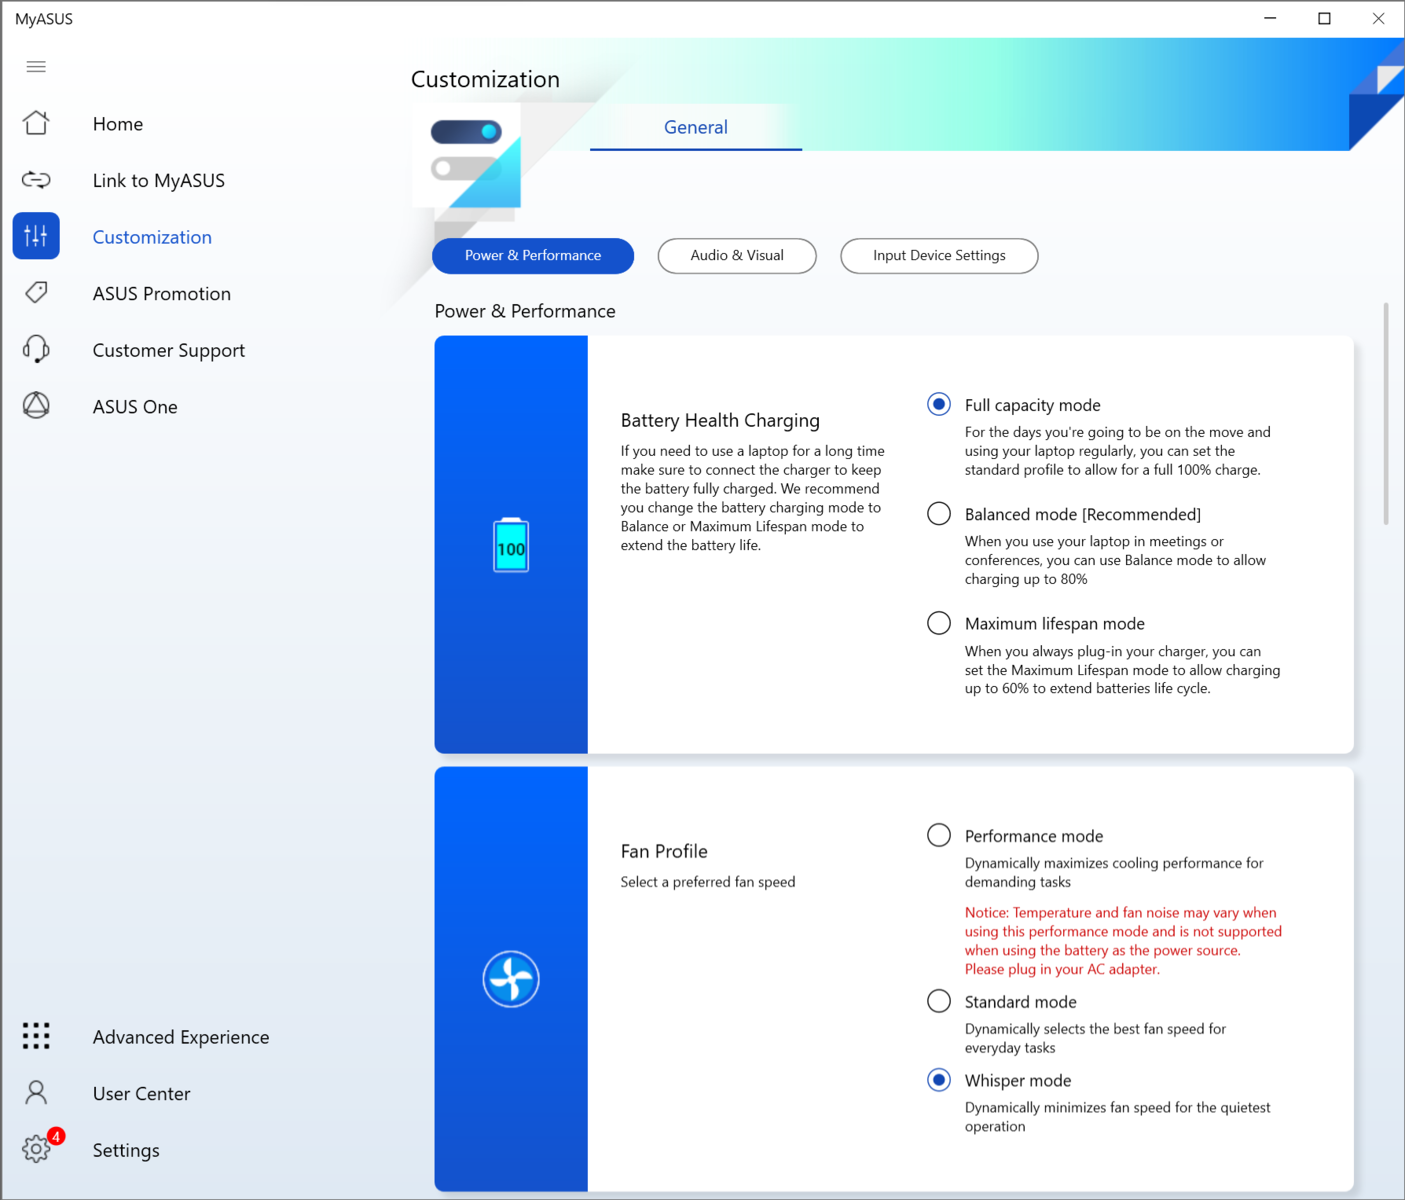
华硕ExpertBook B6 Flip的性能是通过MyAsus应用程序控制的。从性能 模式到低语 模式的三个不同的性能级别不会改变 英特尔酷睿19-12950HX。在所有的性能级别中,可折叠电脑可以在短时间内以160瓦的功率工作,在长时间内以55至60瓦的功率工作。这就使得只有 Nvidia RTX A2000,其性能受到不同阶段的影响。
在性能模式下,显卡的性能在80至90瓦之间。标准 模式将性能限制在60瓦。在Whisper 模式下,显卡的性能在5到10分钟内下降到25瓦左右,这取决于负载情况。
所有的基准测试都在性能 模式下运行。我们还在标准 和耳语 模式下进行了各种功耗和体积测量。
处理器
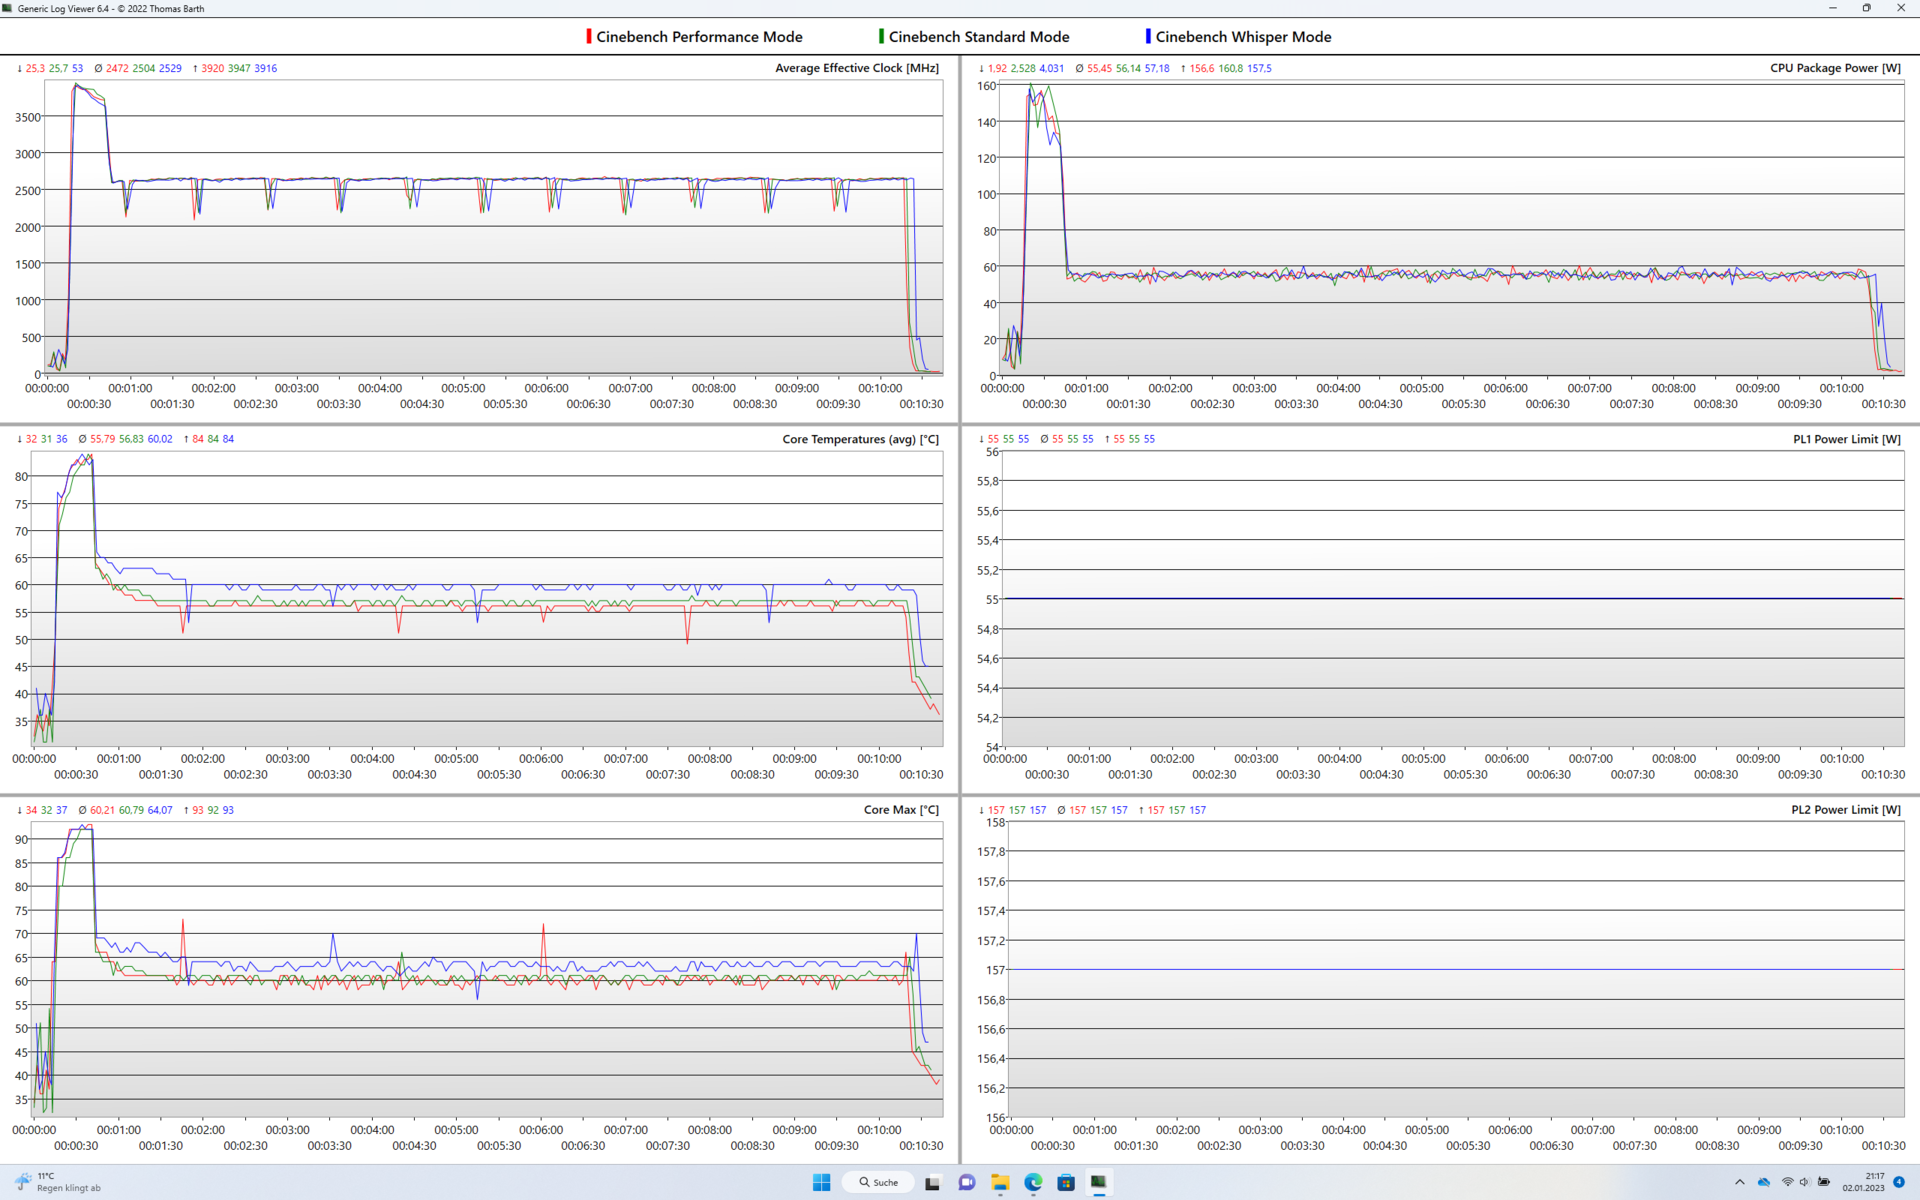
芯片 英特尔酷睿i9-12950HX是最强大的第12代英特尔酷睿处理器之一。i9有8个P核和8个E核,因此可以同时处理24个线程。 因此,该处理器能够在华硕ExpertBook B6 Flip中以全性能运行,至少是喷发式的。在许多基准测试中,我们审查样本中的处理器在工作站中创造了新的记录。然而,在与其他设备的比较中,很快就会发现华硕二合一笔记本电脑无法在长距离内保持如此高的性能。在Cinebench R15的第三次运行中,分数已经下降了1100分。
Cinebench R15 Multi Sustained Load
Cinebench R23: Multi Core | Single Core
Cinebench R20: CPU (Multi Core) | CPU (Single Core)
Cinebench R15: CPU Multi 64Bit | CPU Single 64Bit
Blender: v2.79 BMW27 CPU
7-Zip 18.03: 7z b 4 | 7z b 4 -mmt1
Geekbench 5.5: Multi-Core | Single-Core
HWBOT x265 Benchmark v2.2: 4k Preset
LibreOffice : 20 Documents To PDF
R Benchmark 2.5: Overall mean
| CPU Performance rating | |
| Average of class Workstation | |
| Asus ExpertBook B6 Flip B6602FC2 | |
| Average Intel Core i9-12950HX | |
| Lenovo ThinkPad P16 G1 21D6001DMB | |
| HP ZBook Studio 16 G9 62U04EA | |
| MSI CreatorPro Z16P B12UKST | |
| Dell Precision 7670 | |
| Lenovo Yoga Slim 7 Pro X 14IAH7 82TK006CGE | |
| Asus ProArt StudioBook 16 W7600H5A-2BL2 | |
| Cinebench R23 / Multi Core | |
| Average of class Workstation (14621 - 38520, n=23, last 2 years) | |
| Asus ExpertBook B6 Flip B6602FC2 | |
| Average Intel Core i9-12950HX (16277 - 23113, n=7) | |
| Lenovo ThinkPad P16 G1 21D6001DMB | |
| MSI CreatorPro Z16P B12UKST | |
| HP ZBook Studio 16 G9 62U04EA | |
| Dell Precision 7670 | |
| Lenovo Yoga Slim 7 Pro X 14IAH7 82TK006CGE | |
| Asus ProArt StudioBook 16 W7600H5A-2BL2 | |
| Cinebench R23 / Single Core | |
| Average of class Workstation (1712 - 2228, n=23, last 2 years) | |
| Asus ExpertBook B6 Flip B6602FC2 | |
| HP ZBook Studio 16 G9 62U04EA | |
| Lenovo ThinkPad P16 G1 21D6001DMB | |
| Average Intel Core i9-12950HX (1465 - 1922, n=7) | |
| MSI CreatorPro Z16P B12UKST | |
| Lenovo Yoga Slim 7 Pro X 14IAH7 82TK006CGE | |
| Dell Precision 7670 | |
| Asus ProArt StudioBook 16 W7600H5A-2BL2 | |
| Cinebench R20 / CPU (Multi Core) | |
| Average of class Workstation (5760 - 15043, n=23, last 2 years) | |
| Asus ExpertBook B6 Flip B6602FC2 | |
| Average Intel Core i9-12950HX (6625 - 8777, n=7) | |
| Lenovo ThinkPad P16 G1 21D6001DMB | |
| MSI CreatorPro Z16P B12UKST | |
| HP ZBook Studio 16 G9 62U04EA | |
| Dell Precision 7670 | |
| Lenovo Yoga Slim 7 Pro X 14IAH7 82TK006CGE | |
| Asus ProArt StudioBook 16 W7600H5A-2BL2 | |
| Cinebench R20 / CPU (Single Core) | |
| Average of class Workstation (671 - 857, n=23, last 2 years) | |
| Asus ExpertBook B6 Flip B6602FC2 | |
| Average Intel Core i9-12950HX (703 - 741, n=7) | |
| HP ZBook Studio 16 G9 62U04EA | |
| Lenovo ThinkPad P16 G1 21D6001DMB | |
| Dell Precision 7670 | |
| MSI CreatorPro Z16P B12UKST | |
| Lenovo Yoga Slim 7 Pro X 14IAH7 82TK006CGE | |
| Asus ProArt StudioBook 16 W7600H5A-2BL2 | |
| Cinebench R15 / CPU Multi 64Bit | |
| Average of class Workstation (2489 - 5810, n=23, last 2 years) | |
| Asus ExpertBook B6 Flip B6602FC2 | |
| Average Intel Core i9-12950HX (2464 - 3530, n=7) | |
| Lenovo ThinkPad P16 G1 21D6001DMB | |
| HP ZBook Studio 16 G9 62U04EA | |
| Dell Precision 7670 | |
| Lenovo Yoga Slim 7 Pro X 14IAH7 82TK006CGE | |
| MSI CreatorPro Z16P B12UKST | |
| Asus ProArt StudioBook 16 W7600H5A-2BL2 | |
| Cinebench R15 / CPU Single 64Bit | |
| Average of class Workstation (191.4 - 328, n=23, last 2 years) | |
| Asus ExpertBook B6 Flip B6602FC2 | |
| HP ZBook Studio 16 G9 62U04EA | |
| Lenovo ThinkPad P16 G1 21D6001DMB | |
| Average Intel Core i9-12950HX (167 - 276, n=7) | |
| Dell Precision 7670 | |
| Lenovo Yoga Slim 7 Pro X 14IAH7 82TK006CGE | |
| MSI CreatorPro Z16P B12UKST | |
| Asus ProArt StudioBook 16 W7600H5A-2BL2 | |
| Blender / v2.79 BMW27 CPU | |
| Asus ProArt StudioBook 16 W7600H5A-2BL2 | |
| Lenovo Yoga Slim 7 Pro X 14IAH7 82TK006CGE | |
| Dell Precision 7670 | |
| MSI CreatorPro Z16P B12UKST | |
| HP ZBook Studio 16 G9 62U04EA | |
| Asus ExpertBook B6 Flip B6602FC2 | |
| Lenovo ThinkPad P16 G1 21D6001DMB | |
| Average Intel Core i9-12950HX (138 - 193, n=7) | |
| Average of class Workstation (91 - 222, n=23, last 2 years) | |
| 7-Zip 18.03 / 7z b 4 | |
| Average of class Workstation (60489 - 116969, n=23, last 2 years) | |
| Average Intel Core i9-12950HX (65637 - 85019, n=7) | |
| Asus ExpertBook B6 Flip B6602FC2 | |
| Lenovo ThinkPad P16 G1 21D6001DMB | |
| HP ZBook Studio 16 G9 62U04EA | |
| MSI CreatorPro Z16P B12UKST | |
| Lenovo Yoga Slim 7 Pro X 14IAH7 82TK006CGE | |
| Dell Precision 7670 | |
| Asus ProArt StudioBook 16 W7600H5A-2BL2 | |
| 7-Zip 18.03 / 7z b 4 -mmt1 | |
| Average of class Workstation (5126 - 6960, n=23, last 2 years) | |
| Asus ExpertBook B6 Flip B6602FC2 | |
| Average Intel Core i9-12950HX (6022 - 6318, n=7) | |
| HP ZBook Studio 16 G9 62U04EA | |
| Lenovo ThinkPad P16 G1 21D6001DMB | |
| MSI CreatorPro Z16P B12UKST | |
| Lenovo Yoga Slim 7 Pro X 14IAH7 82TK006CGE | |
| Dell Precision 7670 | |
| Asus ProArt StudioBook 16 W7600H5A-2BL2 | |
| Geekbench 5.5 / Multi-Core | |
| Average of class Workstation (11542 - 25554, n=23, last 2 years) | |
| Asus ExpertBook B6 Flip B6602FC2 | |
| Average Intel Core i9-12950HX (14028 - 16009, n=7) | |
| Lenovo ThinkPad P16 G1 21D6001DMB | |
| HP ZBook Studio 16 G9 62U04EA | |
| Lenovo Yoga Slim 7 Pro X 14IAH7 82TK006CGE | |
| MSI CreatorPro Z16P B12UKST | |
| Dell Precision 7670 | |
| Asus ProArt StudioBook 16 W7600H5A-2BL2 | |
| Geekbench 5.5 / Single-Core | |
| Average of class Workstation (1783 - 2183, n=23, last 2 years) | |
| Average Intel Core i9-12950HX (1847 - 1945, n=7) | |
| Asus ExpertBook B6 Flip B6602FC2 | |
| HP ZBook Studio 16 G9 62U04EA | |
| MSI CreatorPro Z16P B12UKST | |
| Lenovo ThinkPad P16 G1 21D6001DMB | |
| Dell Precision 7670 | |
| Lenovo Yoga Slim 7 Pro X 14IAH7 82TK006CGE | |
| Asus ProArt StudioBook 16 W7600H5A-2BL2 | |
| HWBOT x265 Benchmark v2.2 / 4k Preset | |
| Average of class Workstation (17.8 - 40.5, n=23, last 2 years) | |
| Average Intel Core i9-12950HX (18.6 - 26.5, n=7) | |
| Asus ExpertBook B6 Flip B6602FC2 | |
| HP ZBook Studio 16 G9 62U04EA | |
| MSI CreatorPro Z16P B12UKST | |
| Dell Precision 7670 | |
| Lenovo ThinkPad P16 G1 21D6001DMB | |
| Lenovo Yoga Slim 7 Pro X 14IAH7 82TK006CGE | |
| Asus ProArt StudioBook 16 W7600H5A-2BL2 | |
| LibreOffice / 20 Documents To PDF | |
| Dell Precision 7670 | |
| Average of class Workstation (37.1 - 74.7, n=23, last 2 years) | |
| Lenovo ThinkPad P16 G1 21D6001DMB | |
| Lenovo Yoga Slim 7 Pro X 14IAH7 82TK006CGE | |
| HP ZBook Studio 16 G9 62U04EA | |
| Asus ExpertBook B6 Flip B6602FC2 | |
| Average Intel Core i9-12950HX (34.7 - 45.4, n=7) | |
| MSI CreatorPro Z16P B12UKST | |
| Asus ProArt StudioBook 16 W7600H5A-2BL2 | |
| R Benchmark 2.5 / Overall mean | |
| Asus ProArt StudioBook 16 W7600H5A-2BL2 | |
| Dell Precision 7670 | |
| Lenovo Yoga Slim 7 Pro X 14IAH7 82TK006CGE | |
| MSI CreatorPro Z16P B12UKST | |
| Asus ExpertBook B6 Flip B6602FC2 | |
| Lenovo ThinkPad P16 G1 21D6001DMB | |
| HP ZBook Studio 16 G9 62U04EA | |
| Average Intel Core i9-12950HX (0.4251 - 0.4515, n=7) | |
| Average of class Workstation (0.3825 - 0.603, n=23, last 2 years) | |
* ... smaller is better
AIDA64: FP32 Ray-Trace | FPU Julia | CPU SHA3 | CPU Queen | FPU SinJulia | FPU Mandel | CPU AES | CPU ZLib | FP64 Ray-Trace | CPU PhotoWorxx
| Performance rating | |
| Average of class Workstation | |
| Average Intel Core i9-12950HX | |
| MSI CreatorPro Z16P B12UKST | |
| Lenovo ThinkPad P16 G1 21D6001DMB | |
| Asus ExpertBook B6 Flip B6602FC2 | |
| HP ZBook Studio 16 G9 62U04EA | |
| Lenovo Yoga Slim 7 Pro X 14IAH7 82TK006CGE | |
| Dell Precision 7670 | |
| Asus ProArt StudioBook 16 W7600H5A-2BL2 -9! | |
| AIDA64 / FP32 Ray-Trace | |
| Average of class Workstation (16730 - 61611, n=23, last 2 years) | |
| Average Intel Core i9-12950HX (15499 - 22868, n=7) | |
| Lenovo ThinkPad P16 G1 21D6001DMB | |
| Asus ExpertBook B6 Flip B6602FC2 | |
| HP ZBook Studio 16 G9 62U04EA | |
| MSI CreatorPro Z16P B12UKST | |
| Lenovo Yoga Slim 7 Pro X 14IAH7 82TK006CGE | |
| Dell Precision 7670 | |
| AIDA64 / FPU Julia | |
| Average of class Workstation (89597 - 186971, n=23, last 2 years) | |
| Average Intel Core i9-12950HX (77846 - 115907, n=7) | |
| Lenovo ThinkPad P16 G1 21D6001DMB | |
| Asus ExpertBook B6 Flip B6602FC2 | |
| HP ZBook Studio 16 G9 62U04EA | |
| MSI CreatorPro Z16P B12UKST | |
| Dell Precision 7670 | |
| Lenovo Yoga Slim 7 Pro X 14IAH7 82TK006CGE | |
| AIDA64 / CPU SHA3 | |
| Average of class Workstation (4178 - 8975, n=23, last 2 years) | |
| Average Intel Core i9-12950HX (3426 - 5069, n=7) | |
| Lenovo ThinkPad P16 G1 21D6001DMB | |
| HP ZBook Studio 16 G9 62U04EA | |
| MSI CreatorPro Z16P B12UKST | |
| Asus ExpertBook B6 Flip B6602FC2 | |
| Lenovo Yoga Slim 7 Pro X 14IAH7 82TK006CGE | |
| Dell Precision 7670 | |
| AIDA64 / CPU Queen | |
| Average of class Workstation (60778 - 144411, n=23, last 2 years) | |
| HP ZBook Studio 16 G9 62U04EA | |
| Average Intel Core i9-12950HX (102752 - 104726, n=7) | |
| Asus ExpertBook B6 Flip B6602FC2 | |
| Lenovo Yoga Slim 7 Pro X 14IAH7 82TK006CGE | |
| MSI CreatorPro Z16P B12UKST | |
| Lenovo ThinkPad P16 G1 21D6001DMB | |
| Dell Precision 7670 | |
| AIDA64 / FPU SinJulia | |
| Average of class Workstation (8165 - 29343, n=23, last 2 years) | |
| Average Intel Core i9-12950HX (10134 - 12823, n=7) | |
| Lenovo ThinkPad P16 G1 21D6001DMB | |
| Asus ExpertBook B6 Flip B6602FC2 | |
| Dell Precision 7670 | |
| HP ZBook Studio 16 G9 62U04EA | |
| MSI CreatorPro Z16P B12UKST | |
| Lenovo Yoga Slim 7 Pro X 14IAH7 82TK006CGE | |
| AIDA64 / FPU Mandel | |
| Average of class Workstation (44497 - 98153, n=23, last 2 years) | |
| Average Intel Core i9-12950HX (37146 - 57340, n=7) | |
| Lenovo ThinkPad P16 G1 21D6001DMB | |
| Asus ExpertBook B6 Flip B6602FC2 | |
| HP ZBook Studio 16 G9 62U04EA | |
| MSI CreatorPro Z16P B12UKST | |
| Dell Precision 7670 | |
| Lenovo Yoga Slim 7 Pro X 14IAH7 82TK006CGE | |
| AIDA64 / CPU AES | |
| MSI CreatorPro Z16P B12UKST | |
| Average Intel Core i9-12950HX (72599 - 181128, n=7) | |
| Average of class Workstation (73133 - 187841, n=23, last 2 years) | |
| Lenovo ThinkPad P16 G1 21D6001DMB | |
| Asus ExpertBook B6 Flip B6602FC2 | |
| HP ZBook Studio 16 G9 62U04EA | |
| Dell Precision 7670 | |
| Lenovo Yoga Slim 7 Pro X 14IAH7 82TK006CGE | |
| AIDA64 / CPU ZLib | |
| Average of class Workstation (929 - 2148, n=23, last 2 years) | |
| Average Intel Core i9-12950HX (996 - 1417, n=7) | |
| Lenovo ThinkPad P16 G1 21D6001DMB | |
| HP ZBook Studio 16 G9 62U04EA | |
| Asus ExpertBook B6 Flip B6602FC2 | |
| MSI CreatorPro Z16P B12UKST | |
| Lenovo Yoga Slim 7 Pro X 14IAH7 82TK006CGE | |
| Dell Precision 7670 | |
| Asus ProArt StudioBook 16 W7600H5A-2BL2 | |
| Asus ProArt StudioBook 16 W7600H5A-2BL2 | |
| AIDA64 / FP64 Ray-Trace | |
| Average of class Workstation (8545 - 32891, n=23, last 2 years) | |
| Average Intel Core i9-12950HX (8455 - 12432, n=7) | |
| Lenovo ThinkPad P16 G1 21D6001DMB | |
| Asus ExpertBook B6 Flip B6602FC2 | |
| HP ZBook Studio 16 G9 62U04EA | |
| MSI CreatorPro Z16P B12UKST | |
| Dell Precision 7670 | |
| Lenovo Yoga Slim 7 Pro X 14IAH7 82TK006CGE | |
| AIDA64 / CPU PhotoWorxx | |
| Lenovo Yoga Slim 7 Pro X 14IAH7 82TK006CGE | |
| Average of class Workstation (37151 - 93684, n=23, last 2 years) | |
| MSI CreatorPro Z16P B12UKST | |
| Dell Precision 7670 | |
| Average Intel Core i9-12950HX (35479 - 42655, n=7) | |
| HP ZBook Studio 16 G9 62U04EA | |
| Asus ExpertBook B6 Flip B6602FC2 | |
| Lenovo ThinkPad P16 G1 21D6001DMB | |
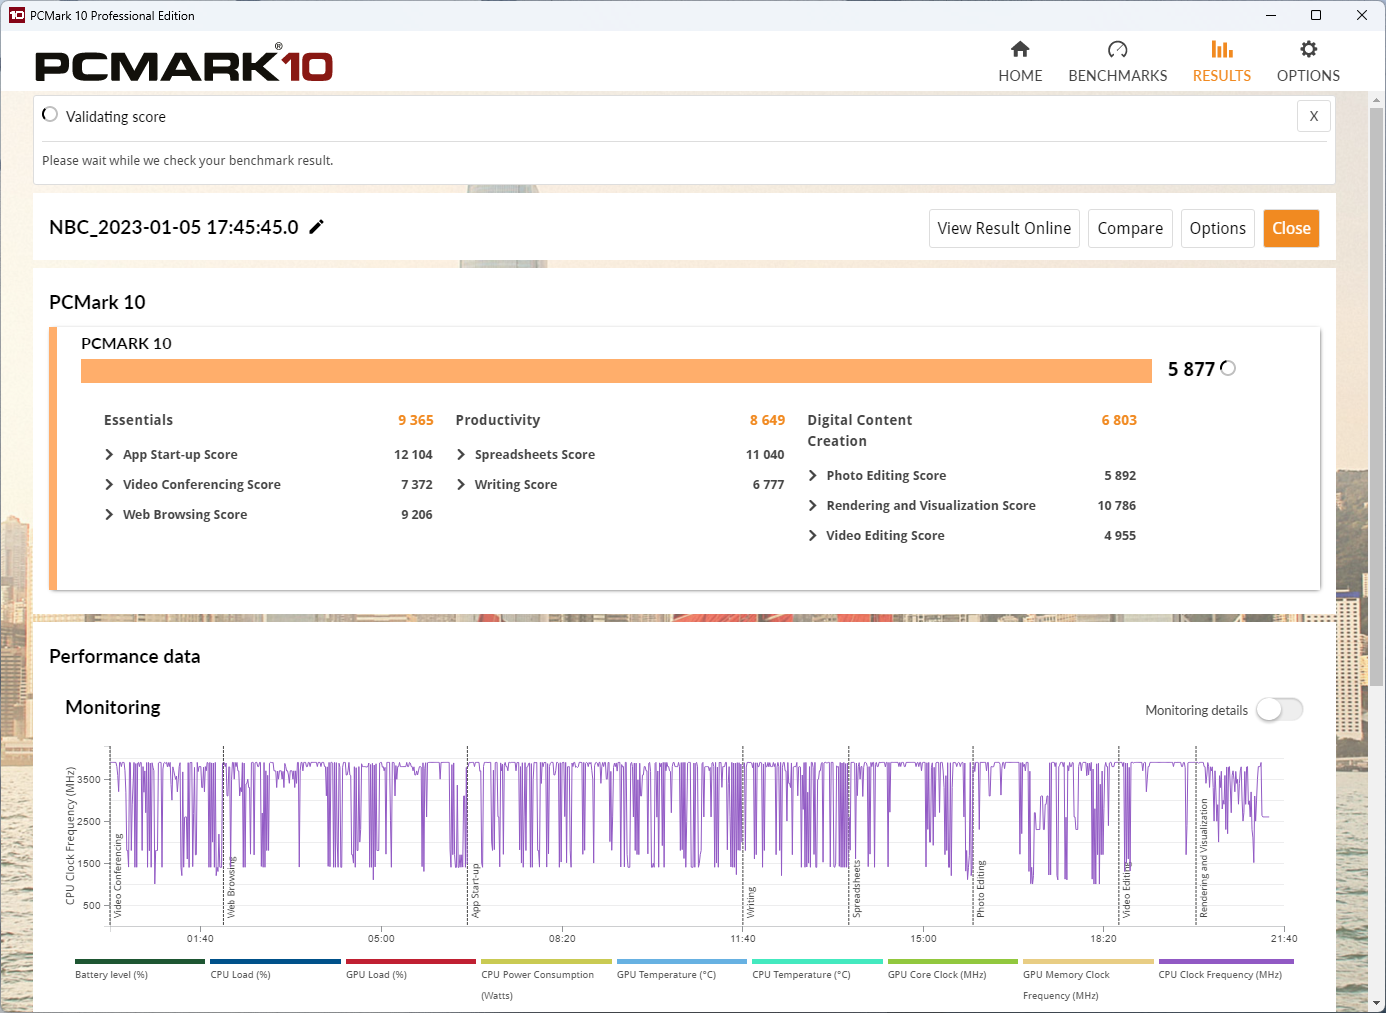
系统性能
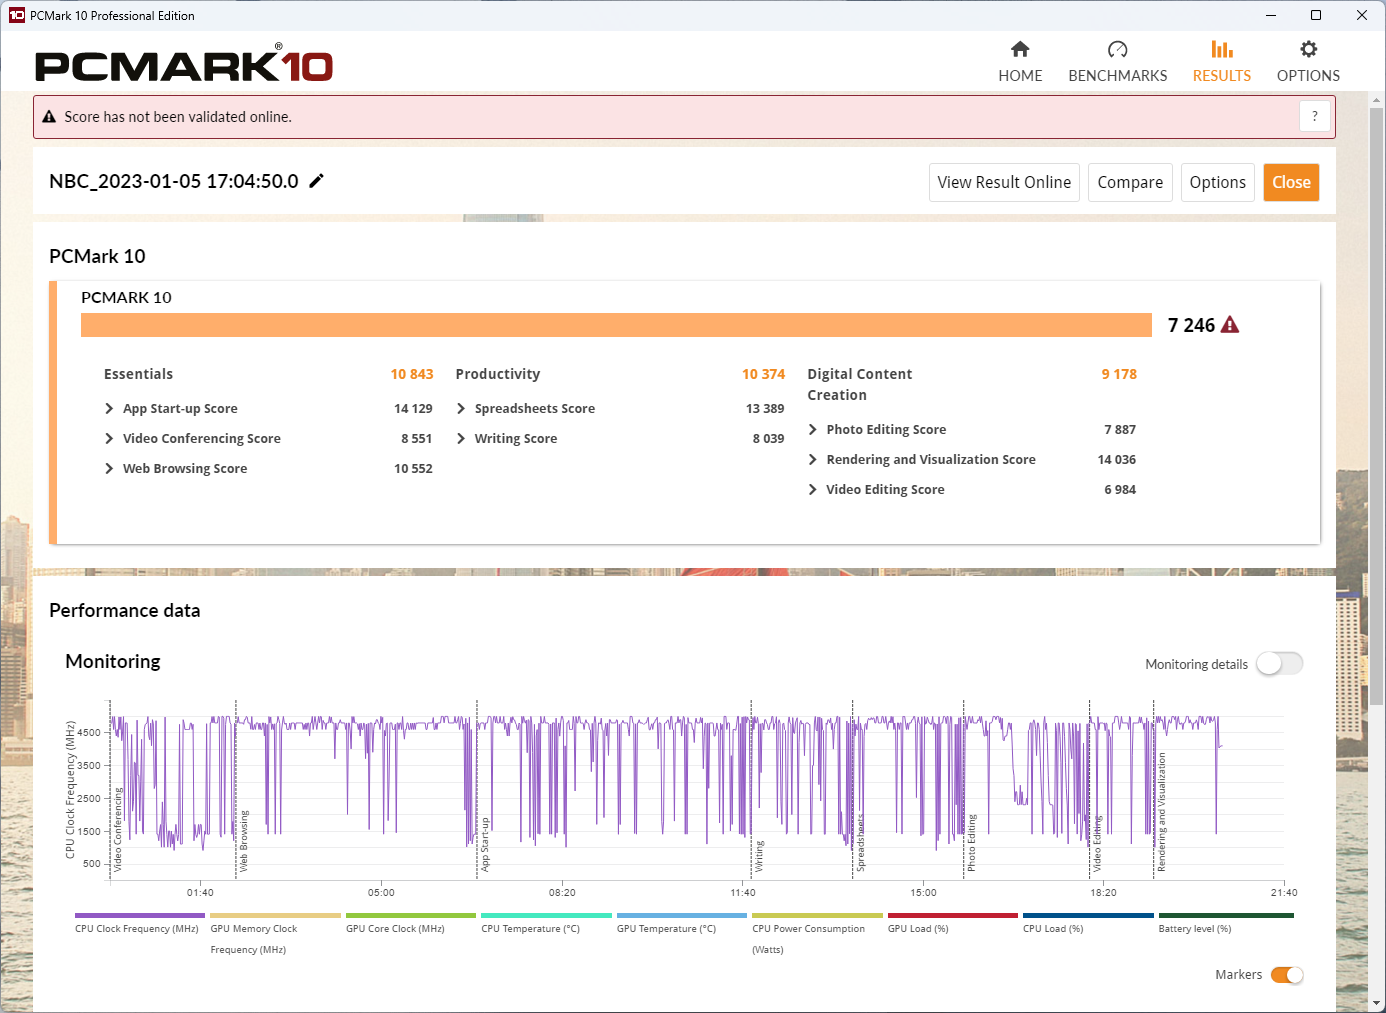
强大的处理器基准测试也反映在PCMark10和Crossmark的系统性能基准测试中。华硕ExpertBook B6 Flip是一款异常强大的笔记本电脑,这两个基准测试程序都证明了其高性能能力。ExpertBook还超过了MSI CreatorPro Z16P 和华硕ProArt StudioBook 16 。这两台笔记本电脑都采用了据称更强大的 A3000 和A5000 ,图形芯片,和ExpertBook一样,都是用90瓦供电。因此,A2000在内容创作方面能够超过所谓更强的芯片。
即使在电池模式下,华硕的工作站的性能仍然相当高。这款笔记本总是以其高水平的响应能力给人留下深刻印象。从Fusion 360到Solid Edge,再到各种图像或视频编辑器,没有一个测试的应用程序能够让笔记本超负荷运行,以至于系统停滞。
CrossMark: Overall | Productivity | Creativity | Responsiveness
| PCMark 10 / Score | |
| Average of class Workstation (6563 - 10409, n=19, last 2 years) | |
| Asus ExpertBook B6 Flip B6602FC2 | |
| Average Intel Core i9-12950HX, NVIDIA RTX A2000 Laptop GPU (n=1) | |
| MSI CreatorPro Z16P B12UKST | |
| Asus ProArt StudioBook 16 W7600H5A-2BL2 | |
| Lenovo Yoga Slim 7 Pro X 14IAH7 82TK006CGE | |
| Dell Precision 7670 | |
| HP ZBook Studio 16 G9 62U04EA | |
| Lenovo ThinkPad P16 G1 21D6001DMB | |
| PCMark 10 / Essentials | |
| Asus ExpertBook B6 Flip B6602FC2 | |
| Average Intel Core i9-12950HX, NVIDIA RTX A2000 Laptop GPU (n=1) | |
| MSI CreatorPro Z16P B12UKST | |
| Dell Precision 7670 | |
| Average of class Workstation (9622 - 11157, n=19, last 2 years) | |
| Lenovo Yoga Slim 7 Pro X 14IAH7 82TK006CGE | |
| Asus ProArt StudioBook 16 W7600H5A-2BL2 | |
| Lenovo ThinkPad P16 G1 21D6001DMB | |
| HP ZBook Studio 16 G9 62U04EA | |
| PCMark 10 / Productivity | |
| Average of class Workstation (8789 - 20616, n=19, last 2 years) | |
| Asus ExpertBook B6 Flip B6602FC2 | |
| Average Intel Core i9-12950HX, NVIDIA RTX A2000 Laptop GPU (n=1) | |
| Lenovo Yoga Slim 7 Pro X 14IAH7 82TK006CGE | |
| MSI CreatorPro Z16P B12UKST | |
| Lenovo ThinkPad P16 G1 21D6001DMB | |
| Dell Precision 7670 | |
| Asus ProArt StudioBook 16 W7600H5A-2BL2 | |
| HP ZBook Studio 16 G9 62U04EA | |
| PCMark 10 / Digital Content Creation | |
| Average of class Workstation (8108 - 15631, n=19, last 2 years) | |
| Asus ProArt StudioBook 16 W7600H5A-2BL2 | |
| MSI CreatorPro Z16P B12UKST | |
| HP ZBook Studio 16 G9 62U04EA | |
| Asus ExpertBook B6 Flip B6602FC2 | |
| Average Intel Core i9-12950HX, NVIDIA RTX A2000 Laptop GPU (n=1) | |
| Lenovo Yoga Slim 7 Pro X 14IAH7 82TK006CGE | |
| Dell Precision 7670 | |
| Lenovo ThinkPad P16 G1 21D6001DMB | |
| CrossMark / Overall | |
| Asus ExpertBook B6 Flip B6602FC2 | |
| Average Intel Core i9-12950HX, NVIDIA RTX A2000 Laptop GPU (n=1) | |
| MSI CreatorPro Z16P B12UKST | |
| Average of class Workstation (1307 - 2267, n=22, last 2 years) | |
| HP ZBook Studio 16 G9 62U04EA | |
| Lenovo Yoga Slim 7 Pro X 14IAH7 82TK006CGE | |
| Lenovo ThinkPad P16 G1 21D6001DMB | |
| Dell Precision 7670 | |
| CrossMark / Productivity | |
| Asus ExpertBook B6 Flip B6602FC2 | |
| Average Intel Core i9-12950HX, NVIDIA RTX A2000 Laptop GPU (n=1) | |
| MSI CreatorPro Z16P B12UKST | |
| Average of class Workstation (1130 - 2122, n=22, last 2 years) | |
| HP ZBook Studio 16 G9 62U04EA | |
| Lenovo Yoga Slim 7 Pro X 14IAH7 82TK006CGE | |
| Lenovo ThinkPad P16 G1 21D6001DMB | |
| Dell Precision 7670 | |
| CrossMark / Creativity | |
| Average of class Workstation (1657 - 2725, n=22, last 2 years) | |
| Asus ExpertBook B6 Flip B6602FC2 | |
| Average Intel Core i9-12950HX, NVIDIA RTX A2000 Laptop GPU (n=1) | |
| HP ZBook Studio 16 G9 62U04EA | |
| MSI CreatorPro Z16P B12UKST | |
| Lenovo Yoga Slim 7 Pro X 14IAH7 82TK006CGE | |
| Lenovo ThinkPad P16 G1 21D6001DMB | |
| Dell Precision 7670 | |
| CrossMark / Responsiveness | |
| MSI CreatorPro Z16P B12UKST | |
| Asus ExpertBook B6 Flip B6602FC2 | |
| Average Intel Core i9-12950HX, NVIDIA RTX A2000 Laptop GPU (n=1) | |
| Average of class Workstation (993 - 2096, n=22, last 2 years) | |
| HP ZBook Studio 16 G9 62U04EA | |
| Lenovo Yoga Slim 7 Pro X 14IAH7 82TK006CGE | |
| Lenovo ThinkPad P16 G1 21D6001DMB | |
| Dell Precision 7670 | |
| PCMark 10 Score | 7246 points | |
Help | ||
| AIDA64 / Memory Copy | |
| Average of class Workstation (56003 - 164795, n=23, last 2 years) | |
| Lenovo Yoga Slim 7 Pro X 14IAH7 82TK006CGE | |
| Average Intel Core i9-12950HX (59731 - 64732, n=7) | |
| Dell Precision 7670 | |
| MSI CreatorPro Z16P B12UKST | |
| HP ZBook Studio 16 G9 62U04EA | |
| Asus ExpertBook B6 Flip B6602FC2 | |
| Lenovo ThinkPad P16 G1 21D6001DMB | |
| AIDA64 / Memory Read | |
| Lenovo Yoga Slim 7 Pro X 14IAH7 82TK006CGE | |
| Average of class Workstation (55795 - 121563, n=23, last 2 years) | |
| Dell Precision 7670 | |
| Average Intel Core i9-12950HX (59744 - 70359, n=7) | |
| MSI CreatorPro Z16P B12UKST | |
| HP ZBook Studio 16 G9 62U04EA | |
| Asus ExpertBook B6 Flip B6602FC2 | |
| Lenovo ThinkPad P16 G1 21D6001DMB | |
| AIDA64 / Memory Write | |
| Lenovo Yoga Slim 7 Pro X 14IAH7 82TK006CGE | |
| Average of class Workstation (55663 - 214520, n=23, last 2 years) | |
| MSI CreatorPro Z16P B12UKST | |
| HP ZBook Studio 16 G9 62U04EA | |
| Dell Precision 7670 | |
| Average Intel Core i9-12950HX (57750 - 67899, n=7) | |
| Asus ExpertBook B6 Flip B6602FC2 | |
| Lenovo ThinkPad P16 G1 21D6001DMB | |
| AIDA64 / Memory Latency | |
| Average of class Workstation (84.5 - 165.2, n=23, last 2 years) | |
| Lenovo Yoga Slim 7 Pro X 14IAH7 82TK006CGE | |
| Lenovo ThinkPad P16 G1 21D6001DMB | |
| MSI CreatorPro Z16P B12UKST | |
| Asus ExpertBook B6 Flip B6602FC2 | |
| HP ZBook Studio 16 G9 62U04EA | |
| Dell Precision 7670 | |
| Average Intel Core i9-12950HX (84.5 - 92.2, n=7) | |
* ... smaller is better
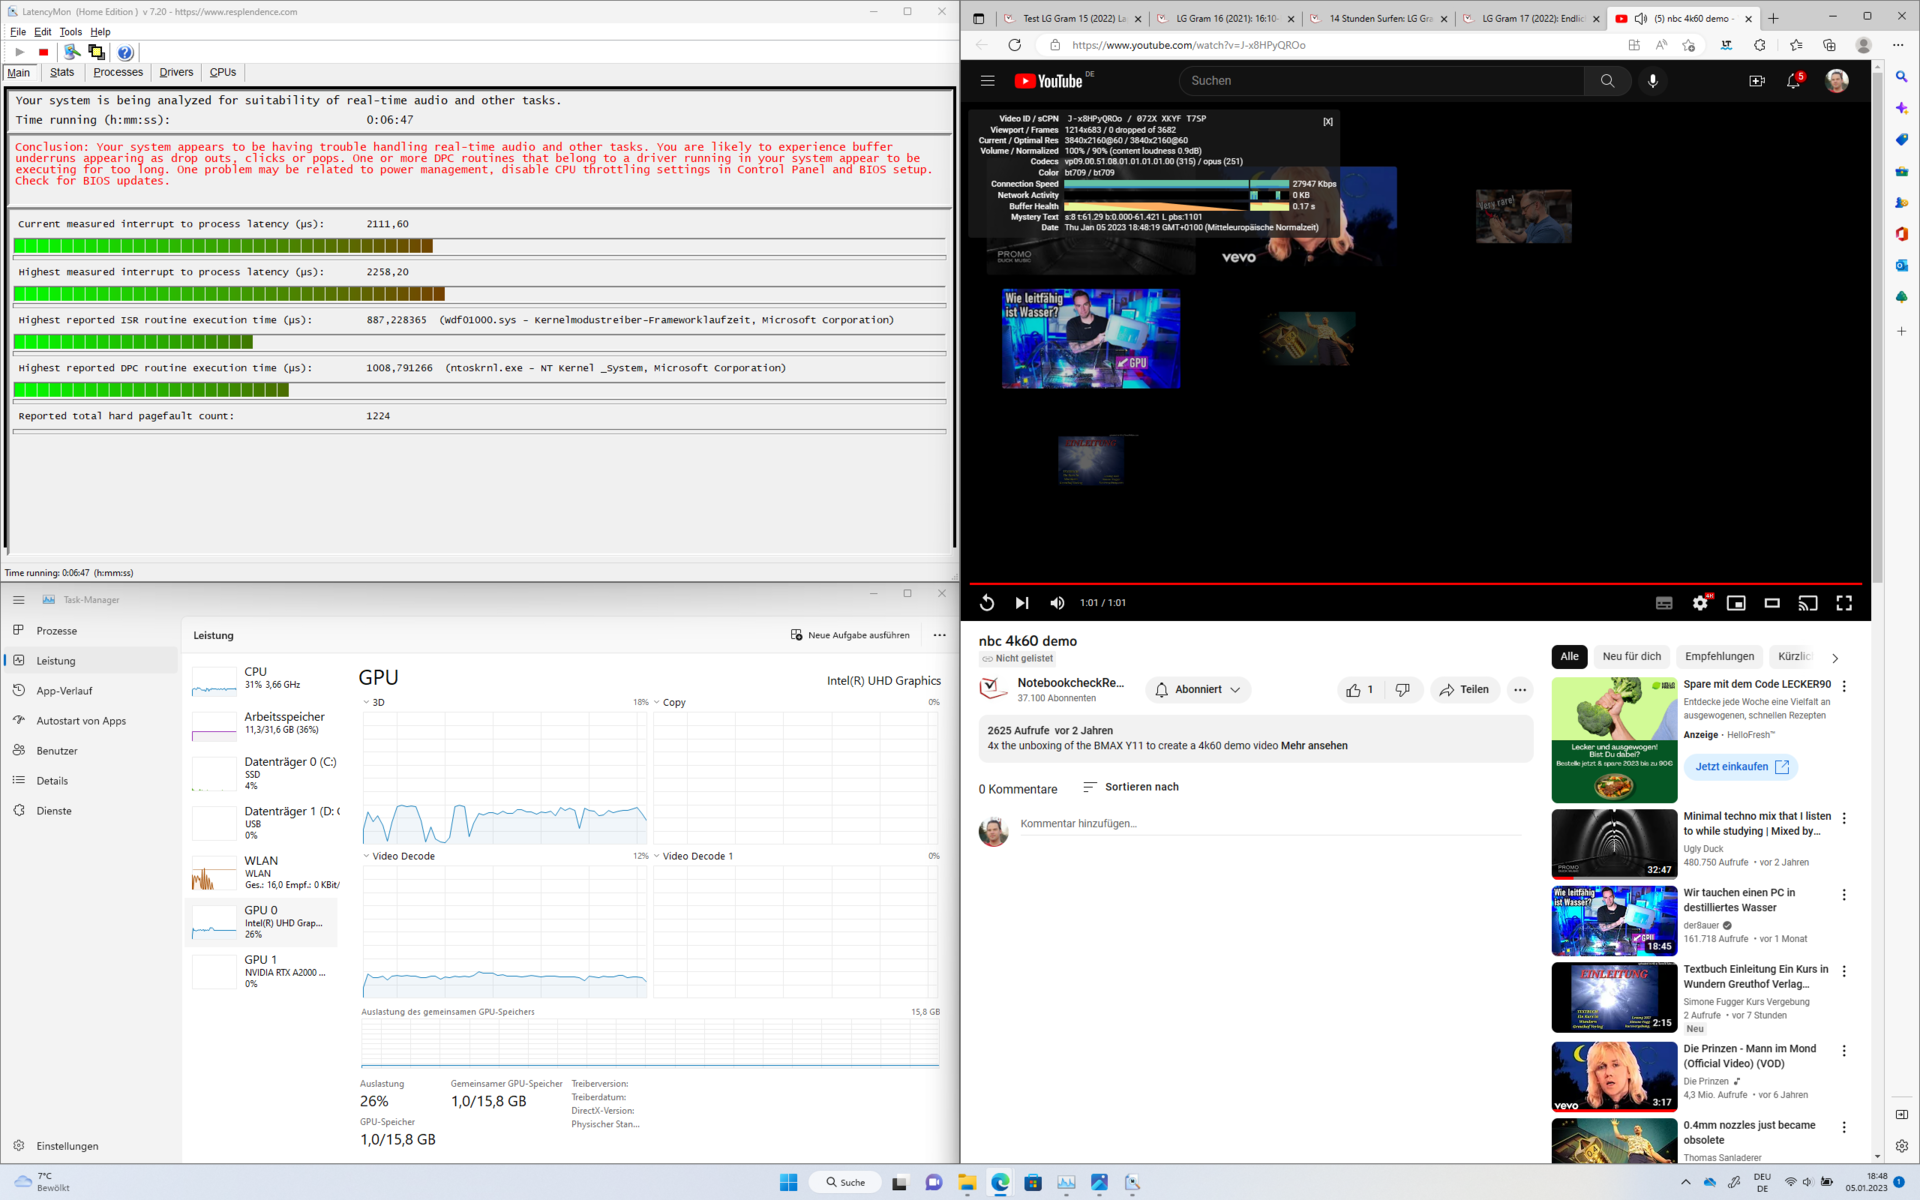
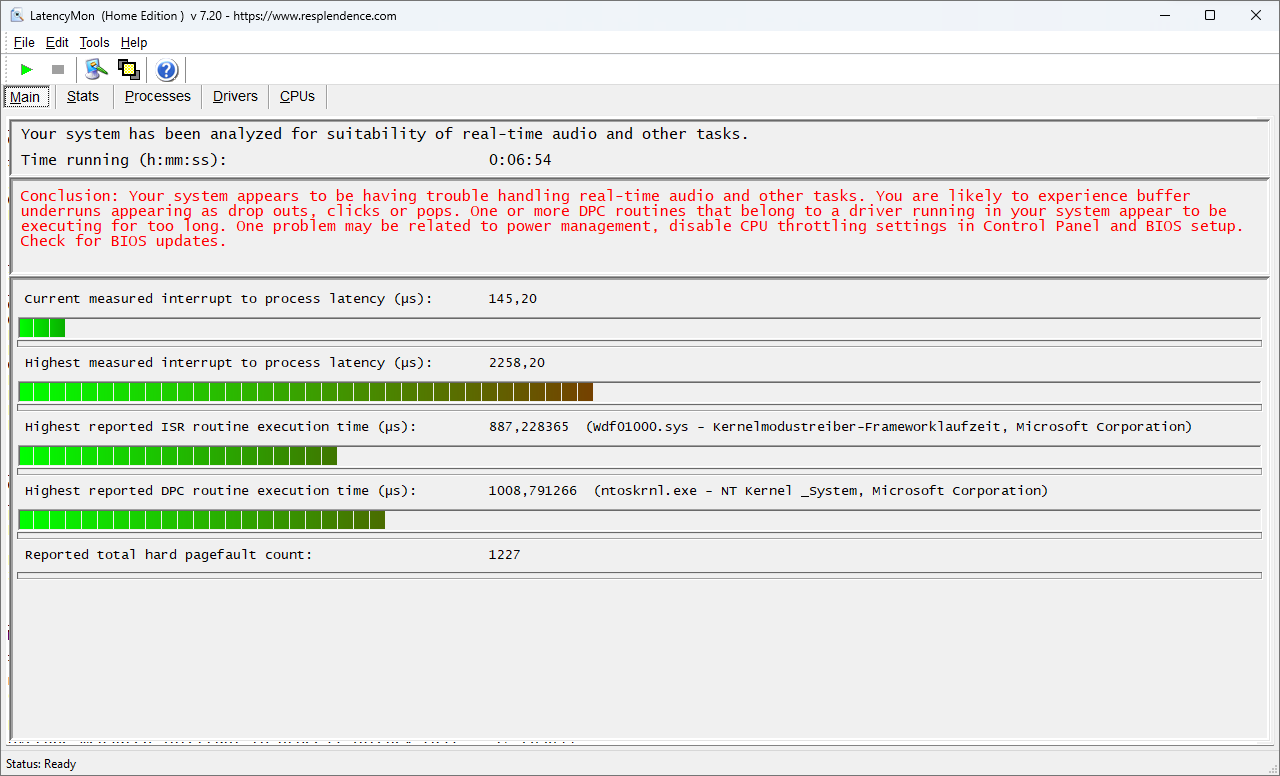
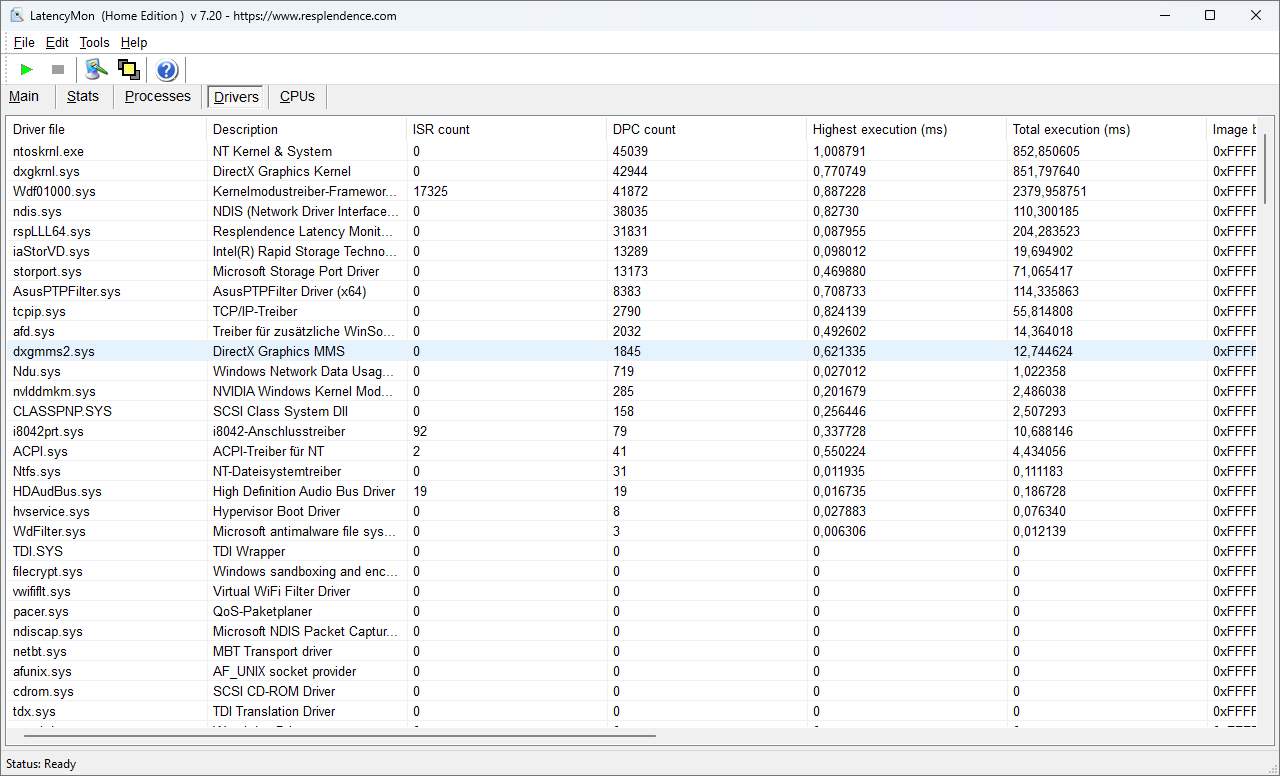
DPC延时
尽管在审查时有最新的驱动程序,我们观察到DPC延迟增加。实时应用程序在执行时偶尔会出现超过2毫秒的延迟。如果要用ExpertBook控制生产机械,应该考虑到这一点,并应使用具有最大缓冲区的程序。
另一方面,在播放4K60 Hz的YouTube测试视频时,没有出现丢帧。
| DPC Latencies / LatencyMon - interrupt to process latency (max), Web, Youtube, Prime95 | |
| Asus ExpertBook B6 Flip B6602FC2 | |
| Asus ProArt StudioBook 16 W7600H5A-2BL2 | |
| Dell Precision 7670 | |
| HP ZBook Studio 16 G9 62U04EA | |
| Lenovo Yoga Slim 7 Pro X 14IAH7 82TK006CGE | |
| MSI CreatorPro Z16P B12UKST | |
* ... smaller is better
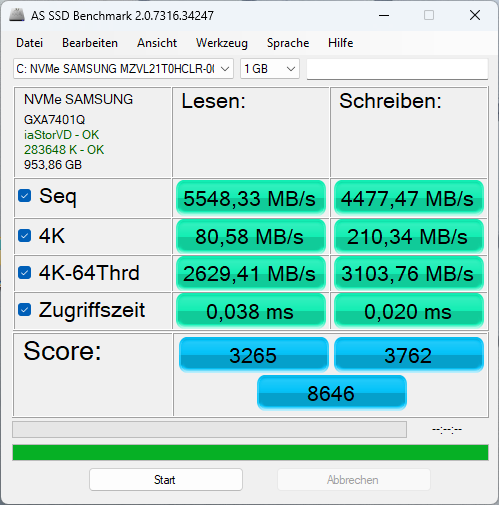
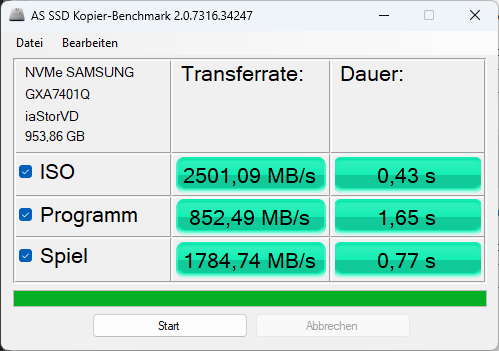
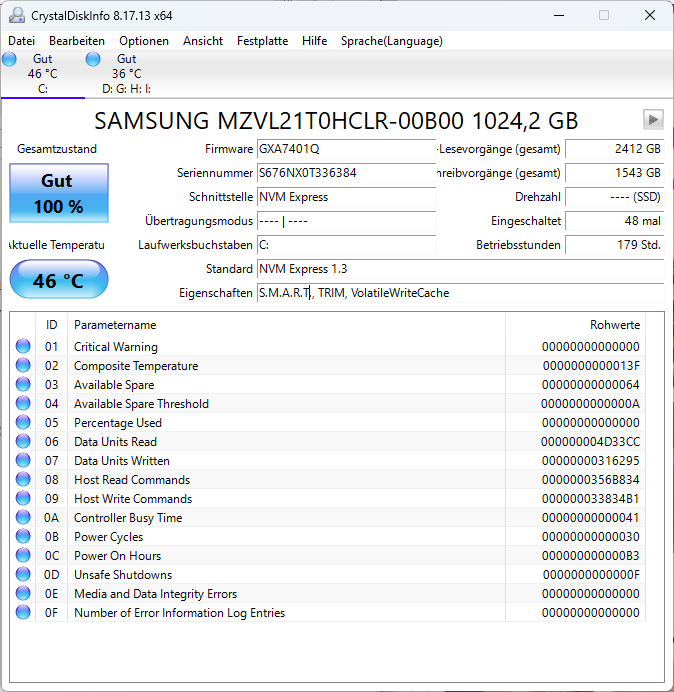
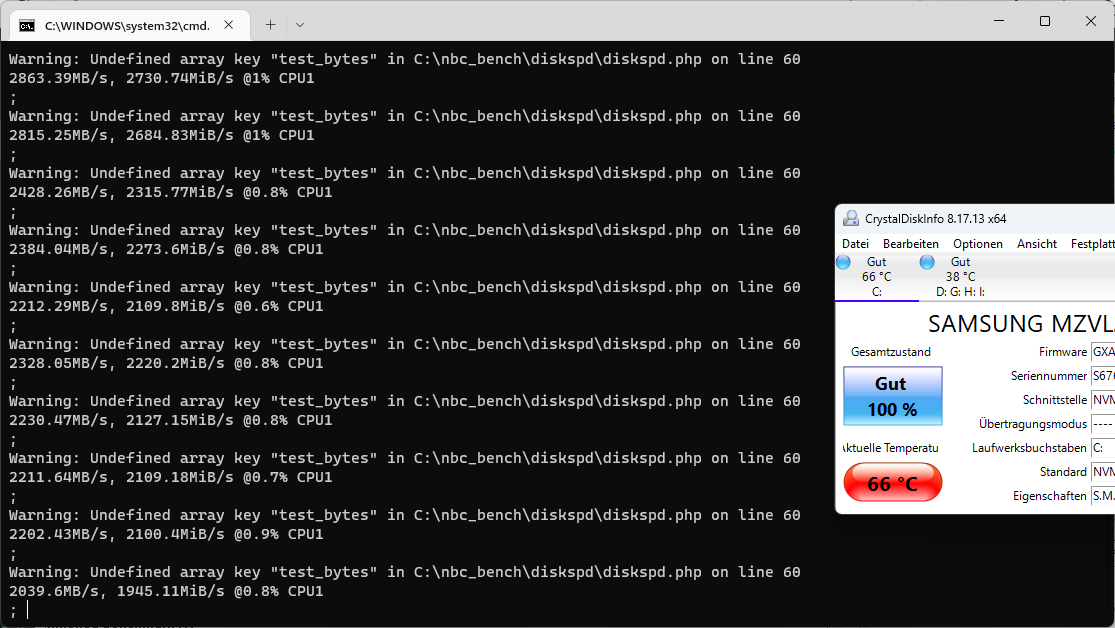
存储设备
华硕ExpertBook B6 Flip有一个温度问题。三星PM9A1 MZVL21T0HCLR在运行过程中变得非常热,以至于在短时间内不得不降低其功率。因此,DiskSpd循环中的M.2 SSD的性能下降了一半。随后的测试表明,这种情况会变得更加糟糕,固态硬盘的性能在连续读取时下降到800MB/s以下。当现代NVMe固态硬盘在没有冷却的情况下安装时,这样的温度上升会一再发生,这里就是这样的情况。通常情况下,制造商在固态硬盘下安装散热垫,将M.2固态硬盘的小电路板上的废热散发到下面的大主板上就可以了。在YouTube上,创作者der8auer 最近研究了SDD的各种冷却方法的影响。该视频显示,即使是小的变化也会产生大的影响。

* ... smaller is better
Sustained Read Performance: DiskSpd Read Loop, Queue Depth 8
图形卡
的 Nvidia RTX A2000是一款面向专业用户的显卡。与 GeForce RTX 3050。它是基于GA107芯片的。这里安装的是带有8GB GDDR6内存的较新版本的显卡。由于ExpertBook B6 Flip的图形芯片可以在高达90瓦的情况下工作,这里的图形单元高于平均水平。因此,ExpertBook的图形性能几乎与 微星CreatorPro Z16P的水平,尽管有一个更强大的 A3000虽然后者安装了更强大的A3000,也是以90瓦的功率运行。只有在需要大量图形内存的应用中,它才能显示出其性能优势。
我们用3DMark、Blender和其他程序的基准测试显示了ExpertBook的优势,工作站的显卡显示了高于平均水平的性能。
| 3DMark Ice Storm Standard Score | 88954 points | |
| 3DMark Cloud Gate Standard Score | 52450 points | |
| 3DMark Fire Strike Score | 15042 points | |
| 3DMark Time Spy Score | 6692 points | |
Help | ||
| V-Ray 5 Benchmark | |
| GPU CUDA | |
| MSI CreatorPro Z16P B12UKST | |
| Asus ExpertBook B6 Flip B6602FC2 | |
| GPU RTX | |
| MSI CreatorPro Z16P B12UKST | |
| Asus ExpertBook B6 Flip B6602FC2 | |
| GPUScore: Sacred Path | |
| 2560x1440 Official | |
| Asus ExpertBook B6 Flip B6602FC2 | |
| Lenovo ThinkPad P16 G1 21D6001DMB | |
| 2560x1440 Official VRS | |
| Asus ExpertBook B6 Flip B6602FC2 | |
* ... smaller is better
游戏性能
尽管ExpertBook不太可能被用作游戏笔记本,但它在这方面也有潜力。总之,在所有测试的游戏中都取得了相对较高的FPS,从而使ExpertBook B6与拥有更强的显卡的笔记本相差无几。
| The Witcher 3 - 1920x1080 Ultra Graphics & Postprocessing (HBAO+) | |
| Average of class Workstation (n=1last 2 years) | |
| Asus ProArt StudioBook 16 W7600H5A-2BL2 | |
| Asus ExpertBook B6 Flip B6602FC2 | |
| MSI CreatorPro Z16P B12UKST | |
| Dell Precision 7670 | |
| HP ZBook Studio 16 G9 62U04EA | |
| Lenovo Yoga Slim 7 Pro X 14IAH7 82TK006CGE | |
Witcher 3 FPS chart
| low | med. | high | ultra | QHD | 4K | |
|---|---|---|---|---|---|---|
| GTA V (2015) | 183.4 | 163.5 | 84 | |||
| The Witcher 3 (2015) | 291 | 220 | 96.2 | 65.2 | ||
| Dota 2 Reborn (2015) | 181.2 | 165.6 | 154.3 | 142.5 | 83.2 | |
| Final Fantasy XV Benchmark (2018) | 164.3 | 90.5 | 64 | 47.1 | ||
| X-Plane 11.11 (2018) | 155.3 | 131.1 | 105.1 | 93.8 | ||
| Far Cry 5 (2018) | 111 | 103 | 96 | |||
| Strange Brigade (2018) | 347 | 159.4 | 125.9 | 108.8 | ||
| God of War (2022) | 89 | 94 | 62 | 42 | 35 | |
| Rainbow Six Extraction (2022) | 152 | 126 | 104 | 43 | ||
| Dying Light 2 (2022) | 81 | 67.7 | 55.47 | 41 | ||
| GRID Legends (2022) | 173 | 141 | 123 | 89 | ||
| Elden Ring (2022) | 58.8 | 59.3 | 57.4 | 55.8 | 47.5 | |
| Tiny Tina's Wonderlands (2022) | 137.23 | 111 | 74 | 57 | 38.83 | |
| Vampire Bloodhunt (2022) | 166 | 154 | 148 | 80 | 81 | |
| F1 22 (2022) | 126.5 | 121.2 | 123.2 | 39.4 | ||
| FIFA 23 (2022) | 114 | 107.8 | 92.7 | 90 | 66 | |
| A Plague Tale Requiem (2022) | 66 | 42 | 35.6 | 31 | ||
| Uncharted Legacy of Thieves Collection (2022) | 69.2 | 56 | 53 | 50 | 37 | |
| Call of Duty Modern Warfare 2 2022 (2022) | 81 | 73 | 53 | 50 | 38 | |
| Spider-Man Miles Morales (2022) | 87 | 83 | 82 | 74 | 55 | |
| The Callisto Protocol (2022) | 92 | 69 | 42 | 32 | ||
| Need for Speed Unbound (2022) | 97.9 | 76 | 64 | 62 | 34 | |
| The Witcher 3 v4 (2023) | 122.8 | 107 | 85.8 | 66.7 |
排放 - 高效的低声模式
噪声
为了使ExpertBook B6 Flip的风扇达到全速,需要将CPU和GPU置于相当大的压力之下。在52 dB(A)的情况下,笔记本不再像正常运行时那样安静。大多数应用很难将工作站带入冷却系统真正发挥作用的范围。如果这种情况确实发生了,我们可以确认,笔记本的风扇没有发出令人不快的高噪音。
在Whisper 模式下,仍然为CPU留有很大的性能空间,风扇的转速明显低于性能 模式。在这里,ExpertBook成为一个极其安静的笔记本,大约为32 dB(A),但仍然具有很高的性能。这种组合在冷却良好的台式电脑中更为常见。
Noise level
| Idle |
| 32.4 / 32.4 / 32.4 dB(A) |
| Load |
| 51.9 / 52.1 dB(A) |
 | ||
30 dB silent 40 dB(A) audible 50 dB(A) loud |
||
min: | ||
| Asus ExpertBook B6 Flip B6602FC2 RTX A2000 Laptop GPU, i9-12950HX, Samsung PM9A1 MZVL21T0HCLR | HP ZBook Studio 16 G9 62U04EA RTX A2000 Laptop GPU, i7-12800H, Micron 3400 1TB MTFDKBA1T0TFH | Dell Precision 7670 RTX A2000 Laptop GPU, i7-12850HX, SK Hynix HFS001TEJ9X115N | MSI CreatorPro Z16P B12UKST RTX A3000 Laptop GPU, i7-12700H, Samsung PM9A1 MZVL21T0HCLR | Asus ProArt StudioBook 16 W7600H5A-2BL2 RTX A5000 Laptop GPU, W-11955M, 2x Micron 2300 2TB MTFDHBA2T0TDV (RAID 0) | Lenovo Yoga Slim 7 Pro X 14IAH7 82TK006CGE GeForce RTX 3050 4GB Laptop GPU, i7-12700H, Micron 3400 1TB MTFDKBA1T0TFH | |
|---|---|---|---|---|---|---|
| Noise | 16% | 17% | 14% | 16% | 16% | |
| off / environment * (dB) | 26 | 24 8% | 22.7 13% | 24.1 7% | 26 -0% | 24.6 5% |
| Idle Minimum * (dB) | 32.4 | 24 26% | 22.9 29% | 27.1 16% | 26 20% | 24.6 24% |
| Idle Average * (dB) | 32.4 | 27.7 15% | 22.9 29% | 27.1 16% | 26 20% | 24.6 24% |
| Idle Maximum * (dB) | 32.4 | 27.7 15% | 24.5 24% | 27.1 16% | 26.5 18% | 24.6 24% |
| Load Average * (dB) | 51.9 | 39.8 23% | 48.7 6% | 42.9 17% | 42 19% | 45.1 13% |
| Load Maximum * (dB) | 52.1 | 47.7 8% | 52.1 -0% | 47 10% | 43 17% | 50.4 3% |
| Witcher 3 ultra * (dB) | 44.3 | 45.2 | 44 | 49.1 |
* ... smaller is better
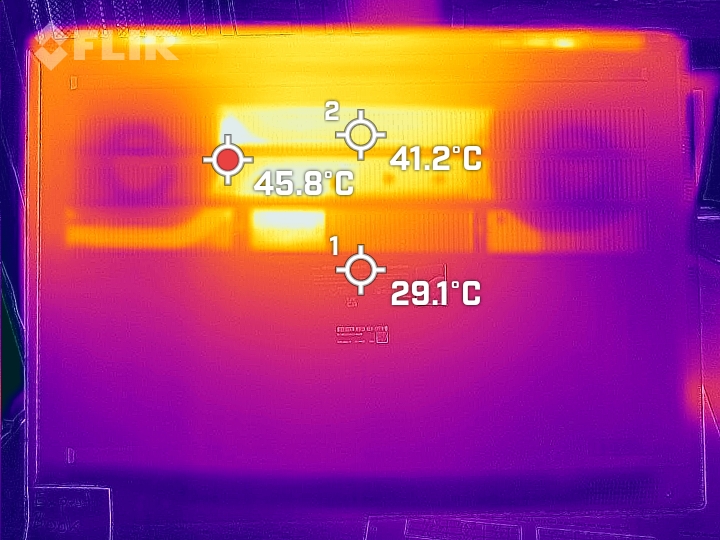
温度
ExpertBook B6 Flip将其废热向上吹出。铰链之间有两个通风口,会变得非常热。尽管有强大的硬件,但工作站的键盘和掌托区域仍然非常凉爽。这也适用于笔记本的底部。与室温相比,笔记本上通常接触到的任何部分都不会发热超过10℃。
(-) The maximum temperature on the upper side is 48.4 °C / 119 F, compared to the average of 38.2 °C / 101 F, ranging from 22.2 to 69.8 °C for the class Workstation.
(-) The bottom heats up to a maximum of 52.3 °C / 126 F, compared to the average of 41.1 °C / 106 F
(+) In idle usage, the average temperature for the upper side is 25.3 °C / 78 F, compared to the device average of 32 °C / 90 F.
(±) Playing The Witcher 3, the average temperature for the upper side is 32.3 °C / 90 F, compared to the device average of 32 °C / 90 F.
(+) The palmrests and touchpad are cooler than skin temperature with a maximum of 25 °C / 77 F and are therefore cool to the touch.
(+) The average temperature of the palmrest area of similar devices was 27.8 °C / 82 F (+2.8 °C / 5 F).
| Asus ExpertBook B6 Flip B6602FC2 Intel Core i9-12950HX, NVIDIA RTX A2000 Laptop GPU | HP ZBook Studio 16 G9 62U04EA Intel Core i7-12800H, NVIDIA RTX A2000 Laptop GPU | Dell Precision 7670 Intel Core i7-12850HX, NVIDIA RTX A2000 Laptop GPU | MSI CreatorPro Z16P B12UKST Intel Core i7-12700H, NVIDIA RTX A3000 Laptop GPU | Asus ProArt StudioBook 16 W7600H5A-2BL2 Intel Xeon W-11955M, NVIDIA RTX A5000 Laptop GPU | Lenovo Yoga Slim 7 Pro X 14IAH7 82TK006CGE Intel Core i7-12700H, NVIDIA GeForce RTX 3050 4GB Laptop GPU | |
|---|---|---|---|---|---|---|
| Heat | 4% | -4% | -6% | -7% | 2% | |
| Maximum Upper Side * (°C) | 48.4 | 38.7 20% | 51 -5% | 56.3 -16% | 45.7 6% | 48 1% |
| Maximum Bottom * (°C) | 52.3 | 53.4 -2% | 45.8 12% | 68.3 -31% | 48.3 8% | 50.2 4% |
| Idle Upper Side * (°C) | 27.8 | 27.3 2% | 31.8 -14% | 25.2 9% | 35.3 -27% | 27.7 -0% |
| Idle Bottom * (°C) | 30.3 | 31.6 -4% | 32.6 -8% | 25.9 15% | 34.4 -14% | 30.1 1% |
* ... smaller is better
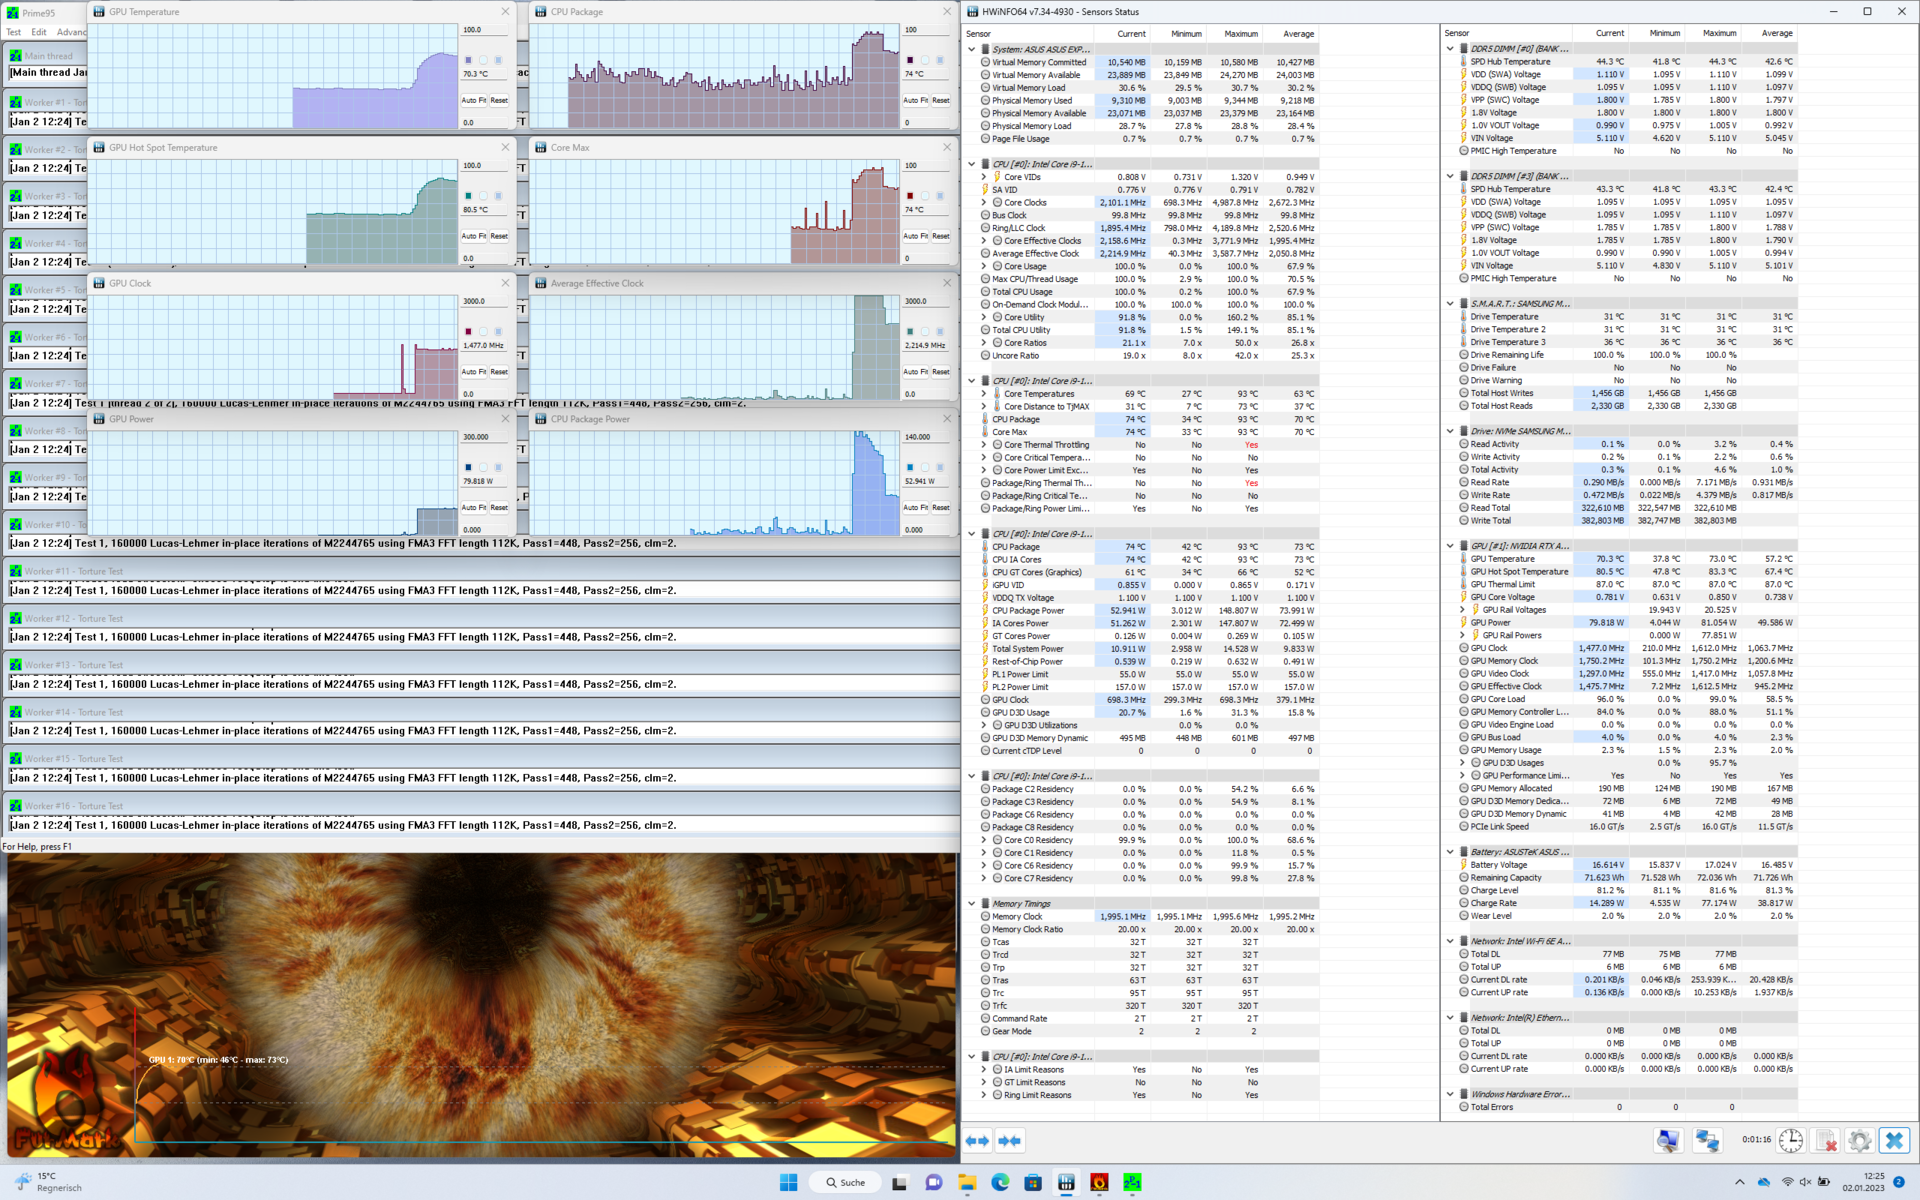
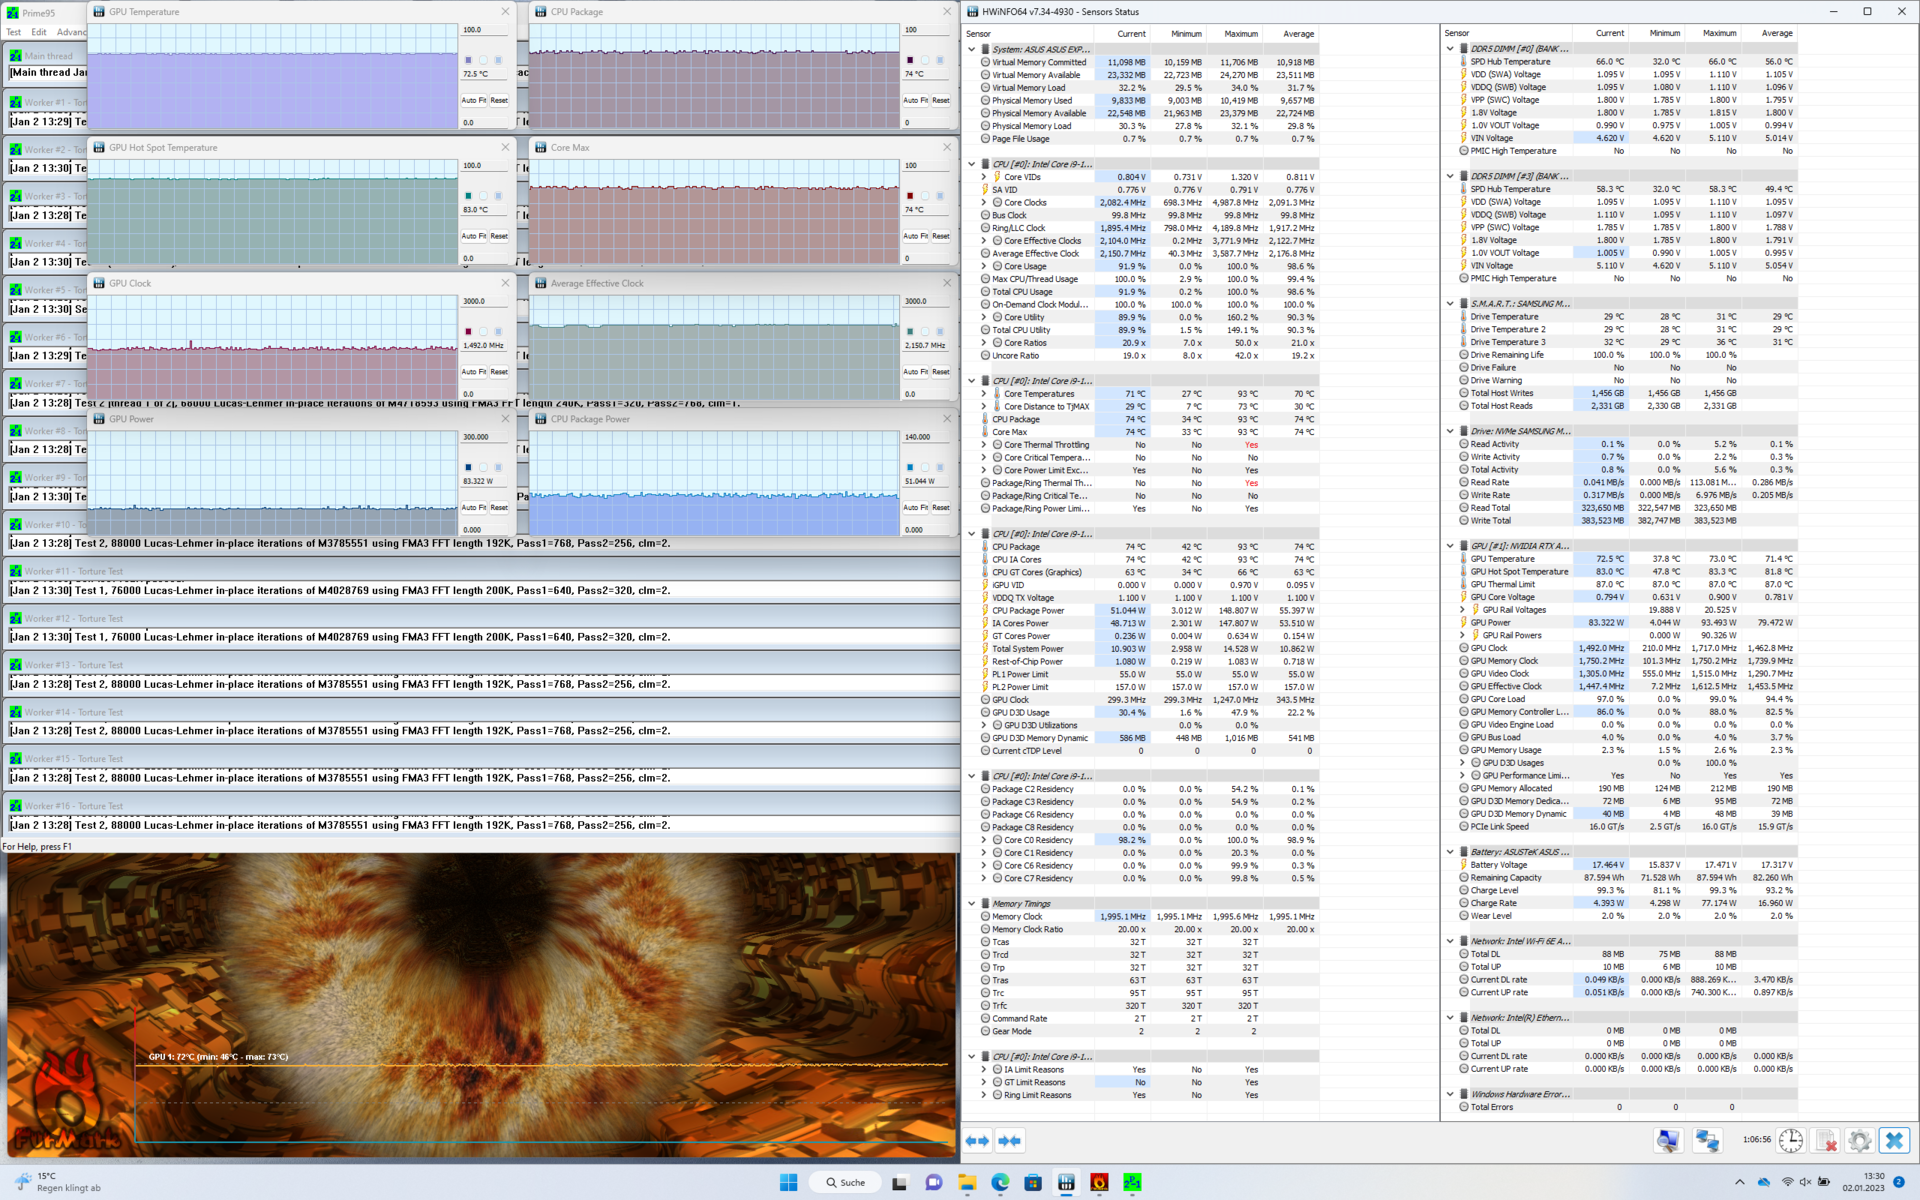
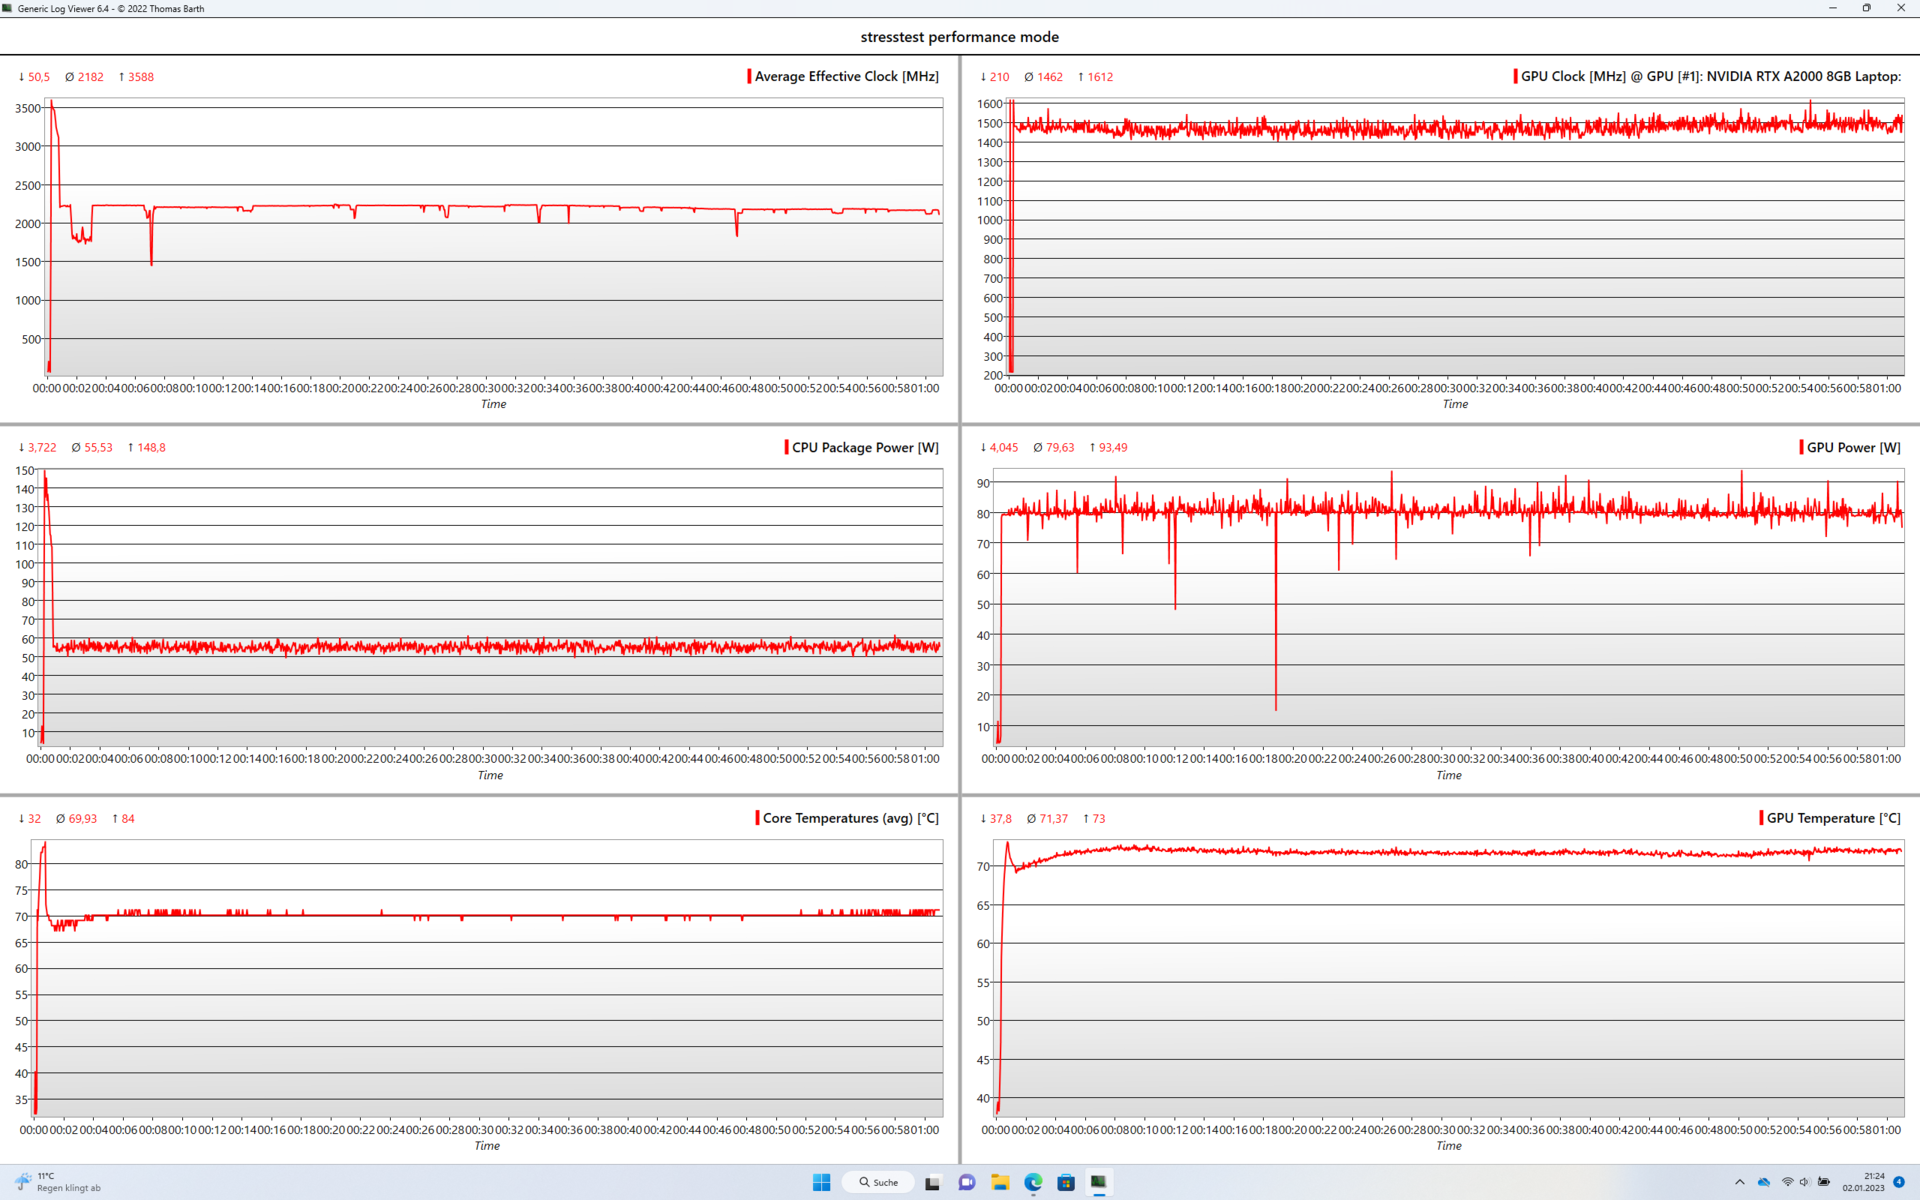
压力测试
压力测试还显示,该工作站的CPU和GPU没有受到温度问题的困扰。在Prime95和Furmark的一小时负载中,温度和性能值保持不变。在CPU和GPU分别为70℃和73℃的情况下,人们甚至会认为这两块芯片没有被充分利用起来。
发言人
ExpertBook中的两个朝下的扬声器产生了相当好的声音。平衡的中音和高音与不太弱的低音在这里相遇。测量的最大音量为81dB(A),仍然处于良好的范围。
Asus ExpertBook B6 Flip B6602FC2 audio analysis
(±) | speaker loudness is average but good (81 dB)
Bass 100 - 315 Hz
(±) | reduced bass - on average 13.6% lower than median
(±) | linearity of bass is average (7.8% delta to prev. frequency)
Mids 400 - 2000 Hz
(+) | balanced mids - only 3.4% away from median
(+) | mids are linear (4.2% delta to prev. frequency)
Highs 2 - 16 kHz
(+) | balanced highs - only 3.6% away from median
(+) | highs are linear (4% delta to prev. frequency)
Overall 100 - 16.000 Hz
(+) | overall sound is linear (13.2% difference to median)
Compared to same class
» 23% of all tested devices in this class were better, 6% similar, 71% worse
» The best had a delta of 7%, average was 17%, worst was 35%
Compared to all devices tested
» 14% of all tested devices were better, 3% similar, 84% worse
» The best had a delta of 4%, average was 23%, worst was 134%
HP ZBook Studio 16 G9 62U04EA audio analysis
(±) | speaker loudness is average but good (81.6 dB)
Bass 100 - 315 Hz
(±) | reduced bass - on average 8.7% lower than median
(±) | linearity of bass is average (10.4% delta to prev. frequency)
Mids 400 - 2000 Hz
(+) | balanced mids - only 3.7% away from median
(+) | mids are linear (4.6% delta to prev. frequency)
Highs 2 - 16 kHz
(+) | balanced highs - only 2.7% away from median
(+) | highs are linear (3.5% delta to prev. frequency)
Overall 100 - 16.000 Hz
(+) | overall sound is linear (10.6% difference to median)
Compared to same class
» 9% of all tested devices in this class were better, 5% similar, 87% worse
» The best had a delta of 7%, average was 17%, worst was 35%
Compared to all devices tested
» 6% of all tested devices were better, 1% similar, 93% worse
» The best had a delta of 4%, average was 23%, worst was 134%
电源管理--90Wh电池确保适度的运行时间
消耗功率
华硕在ExpertBook中包括一个240瓦的电源。虽然这并没有被完全利用,但带dGPU的敞篷车在较长的时间内消耗的功率可以远远超过200瓦。如果工作站的硬件只受到最小的压力,那么功耗是适中的,在10到20瓦之间。
| Off / Standby | |
| Idle | |
| Load |
|
Key:
min: | |
| Asus ExpertBook B6 Flip B6602FC2 i9-12950HX, RTX A2000 Laptop GPU, Samsung PM9A1 MZVL21T0HCLR, IPS, 2560x1600, 16" | HP ZBook Studio 16 G9 62U04EA i7-12800H, RTX A2000 Laptop GPU, Micron 3400 1TB MTFDKBA1T0TFH, IPS, 3840x2400, 16" | Dell Precision 7670 i7-12850HX, RTX A2000 Laptop GPU, SK Hynix HFS001TEJ9X115N, OLED, 3840x2400, 16" | MSI CreatorPro Z16P B12UKST i7-12700H, RTX A3000 Laptop GPU, Samsung PM9A1 MZVL21T0HCLR, IPS, 2560x1600, 16" | Asus ProArt StudioBook 16 W7600H5A-2BL2 W-11955M, RTX A5000 Laptop GPU, 2x Micron 2300 2TB MTFDHBA2T0TDV (RAID 0), OLED, 3840x2400, 16" | Lenovo Yoga Slim 7 Pro X 14IAH7 82TK006CGE i7-12700H, GeForce RTX 3050 4GB Laptop GPU, Micron 3400 1TB MTFDKBA1T0TFH, IPS, 3072x1920, 14.5" | Average NVIDIA RTX A2000 Laptop GPU | Average of class Workstation | |
|---|---|---|---|---|---|---|---|---|
| Power Consumption | 12% | 7% | 7% | -0% | 39% | 21% | 13% | |
| Idle Minimum * (Watt) | 10.5 | 7.2 31% | 7.5 29% | 10.8 -3% | 12.4 -18% | 7.1 32% | 6.6 ? 37% | 9.11 ? 13% |
| Idle Average * (Watt) | 11.9 | 18.1 -52% | 9.5 20% | 16.3 -37% | 16.5 -39% | 10.8 9% | 11.8 ? 1% | 13.8 ? -16% |
| Idle Maximum * (Watt) | 18 | 18.5 -3% | 28.4 -58% | 16.9 6% | 25 -39% | 11.6 36% | 16.7 ? 7% | 17.9 ? 1% |
| Load Average * (Watt) | 182 | 112.8 38% | 139.1 24% | 111.7 39% | 132 27% | 84.8 53% | 116.3 ? 36% | 96 ? 47% |
| Witcher 3 ultra * (Watt) | 177.5 | 106.7 40% | 134 25% | 152.1 14% | 132 26% | 91.3 49% | ||
| Load Maximum * (Watt) | 229 | 186 19% | 220.8 4% | 177.4 23% | 134 41% | 100.8 56% | 171.2 ? 25% | 180.3 ? 21% |
* ... smaller is better
Power consumption Witcher 3 / Stress testing
Power consumption with an external monitor
电池寿命
ExpertBook B6 Flip拥有90Wh的电池,可以在没有插座供电的情况下长时间运行。在Wi-Fi网上冲浪测试中,达到了8小时以上。即使在负载情况下,尽管有强大的硬件,该笔记本电脑也可以在没有电源适配器的情况下持续一个多小时。
| Asus ExpertBook B6 Flip B6602FC2 i9-12950HX, RTX A2000 Laptop GPU, 90 Wh | HP ZBook Studio 16 G9 62U04EA i7-12800H, RTX A2000 Laptop GPU, 86 Wh | Dell Precision 7670 i7-12850HX, RTX A2000 Laptop GPU, 83 Wh | MSI CreatorPro Z16P B12UKST i7-12700H, RTX A3000 Laptop GPU, 90 Wh | Asus ProArt StudioBook 16 W7600H5A-2BL2 W-11955M, RTX A5000 Laptop GPU, 90 Wh | Lenovo Yoga Slim 7 Pro X 14IAH7 82TK006CGE i7-12700H, GeForce RTX 3050 4GB Laptop GPU, 70 Wh | Average of class Workstation | |
|---|---|---|---|---|---|---|---|
| Battery runtime | -5% | -31% | -33% | -56% | 8% | 42% | |
| Reader / Idle (h) | 12.5 | 7.9 -37% | 26.1 ? 109% | ||||
| H.264 (h) | 5.8 | 8.5 47% | 1.8 -69% | 8.9 53% | 10.1 ? 74% | ||
| WiFi v1.3 (h) | 8.7 | 6.3 -28% | 5.9 -32% | 5.8 -33% | 5 -43% | 7.2 -17% | 8.55 ? -2% |
| Load (h) | 1.7 | 1.1 -35% | 1.3 -24% | 1.5 -12% | 1.441 ? -15% | ||
| Witcher 3 ultra (h) | 1.6 |
Pros
Cons
评语。非常令人印象深刻的表现
华硕ExpertBook B6 Flip很大、很厚、很重,即使对于工作站来说也是如此。但在这种情况下,制造商避免了许多经常困扰当前笔记本电脑的问题。在不产生噪音或过热的情况下,这款笔记本电脑的性能和耐力都很好。只有固态硬盘有温度问题。如果你不需要最高的帧率,你可以简单地激活标准模式。这给了你一个安静的笔记本电脑,继续以115瓦的CPU和GPU综合功率运行。那些不使用3D应用程序的人甚至可以利用Whisper模式,因为英特尔酷睿i9-129500HX在这种模式下也可以释放其全部性能潜力。 二合一工作站在个别基准测试中的表现是绝对的好。
就设计而言,这款笔记本电脑毕竟有些复古。这台大型工作站的显示屏边缘很宽,有棱有角,在很多方面都让人想起2010年的笔记本电脑。但仔细观察后就会发现,我们手上的是一台现代设备。它的连接性几乎没有任何问题,显示屏质量很好,带有人脸识别功能的网络摄像头很稳固,还包括一个指纹传感器和其他安全功能。除了外形因素外,华硕ExpertBook B6 Flip总体上非常有说服力。
作为二合一工作站,这款笔记本电脑是独一无二的。 华硕ExperBook B6 Flip可能是最强大的可转换产品之一。
在与其他工作站进行比较时,你经常会发现,尽管尺寸不同,但这个设备的功能非常强大。这台 微星CreatorPro Z16P提供了一个更强大的 A3000,但它不能在所有领域持续利用这一优势。只有 华硕ProArt StudioBook 16有着 Nvidia RTX A5000在几乎所有的图形基准测试中都比ExpertBook的性能好很多。笔记本电脑 戴尔Precision 7670和 惠普ZBook Studio 16拥有更好的屏幕和更薄的外壳。然而,在系统性能方面几乎没有任何值得注意的差异。即使华硕ExpertBook在这里的大多数基准列表中名列前茅,但对比领域的所有工作站仍有明显的优势。
价格和可用性
华硕已经为ExpertBook B6 Flip建立了一个完整的产品页面。,但到目前为止(14.01.2023),还没有商店列出二合一工作站。
Asus ExpertBook B6 Flip B6602FC2
- 01/11/2023 v7 (old)
Marc Herter
Price comparison

