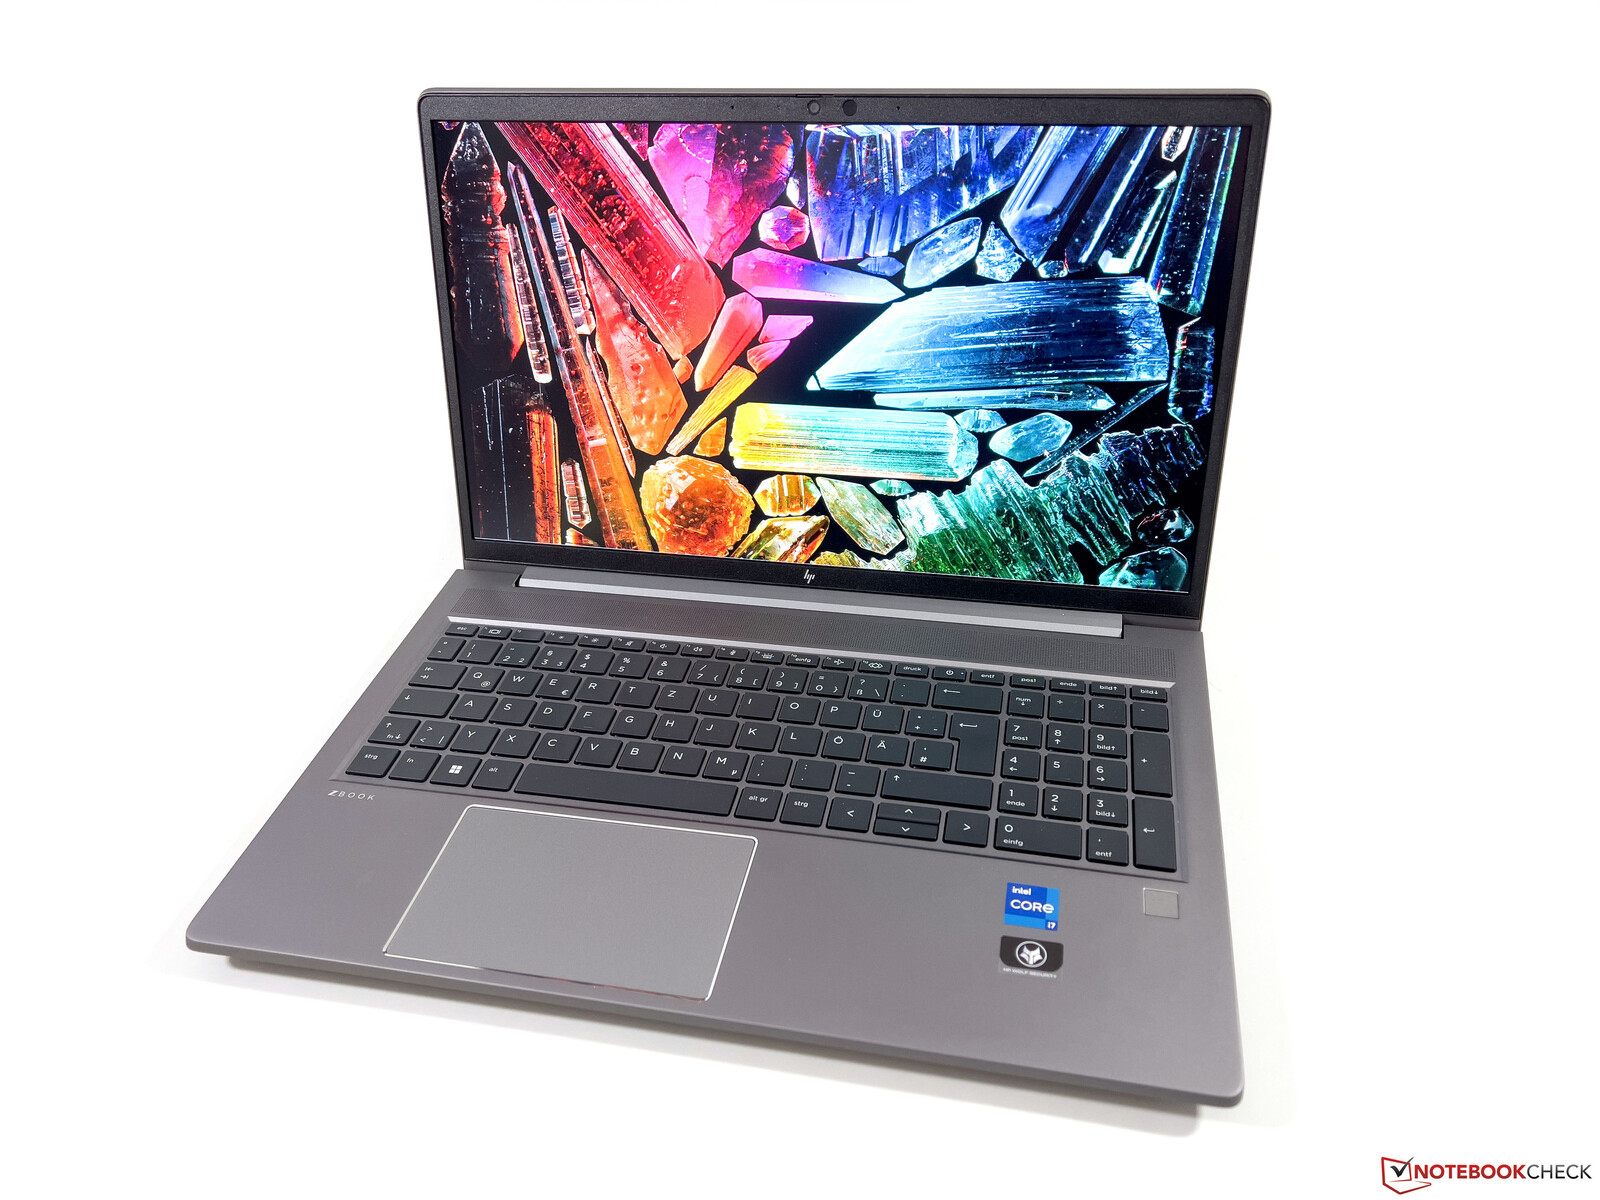
惠普ZBook Power 15 G9笔记本电脑评测--带哑光4K显示屏的移动工作站
惠普公司提供各种移动工作站模型系列,首先是薄的 ZBook Firefly入门级设备,其次是ZBook Studio,以及 ZBook Fury高端机型,以及ZBook Power,它应该是价格和性能的良好结合。虽然外壳不是特别纤薄,但这也带来了足够数量的端口。我们测试了ZBook Power 15 G9 6B8C4EA版本,价格约为2800欧元(约2981美元),它配备了非常好的 酷睿i7-12700H,以及RTX A2000,32GB内存,1TB固态硬盘,以及哑光4K显示屏。与ZBook Power 15 G8的前辈相比(在我们的测试中),外壳和输入设备没有变化,所以我们在这里将保持这些部分的简短,而将重点放在性能部分。
潜在的竞争对手比较
Rating | Date | Model | Weight | Height | Size | Resolution | Price |
|---|---|---|---|---|---|---|---|
| 87.4 % v7 (old) | 01 / 2023 | HP ZBook Power 15 G9 6B8C4EA i7-12700H, RTX A2000 Laptop GPU | 2 kg | 22.8 mm | 15.60" | 3840x2160 | |
| 90.1 % v7 (old) | 11 / 2022 | HP ZBook Studio 16 G9 62U04EA i7-12800H, RTX A2000 Laptop GPU | 1.8 kg | 19 mm | 16.00" | 3840x2400 | |
| 88.3 % v7 (old) | 10 / 2021 | Dell Precision 5000 5560 i7-11850H, RTX A2000 Laptop GPU | 2 kg | 18 mm | 15.60" | 3840x2400 | |
| 86.2 % v7 (old) | 06 / 2022 | Lenovo ThinkPad P15v G2 21A9000XGE i7-11800H, T1200 Laptop GPU | 2.3 kg | 22.7 mm | 15.60" | 1920x1080 | |
| 87.7 % v7 (old) | 07 / 2022 | HP ZBook Power 15 G8 313S5EA i7-11800H, T600 Laptop GPU | 2 kg | 22.8 mm | 15.60" | 1920x1080 |
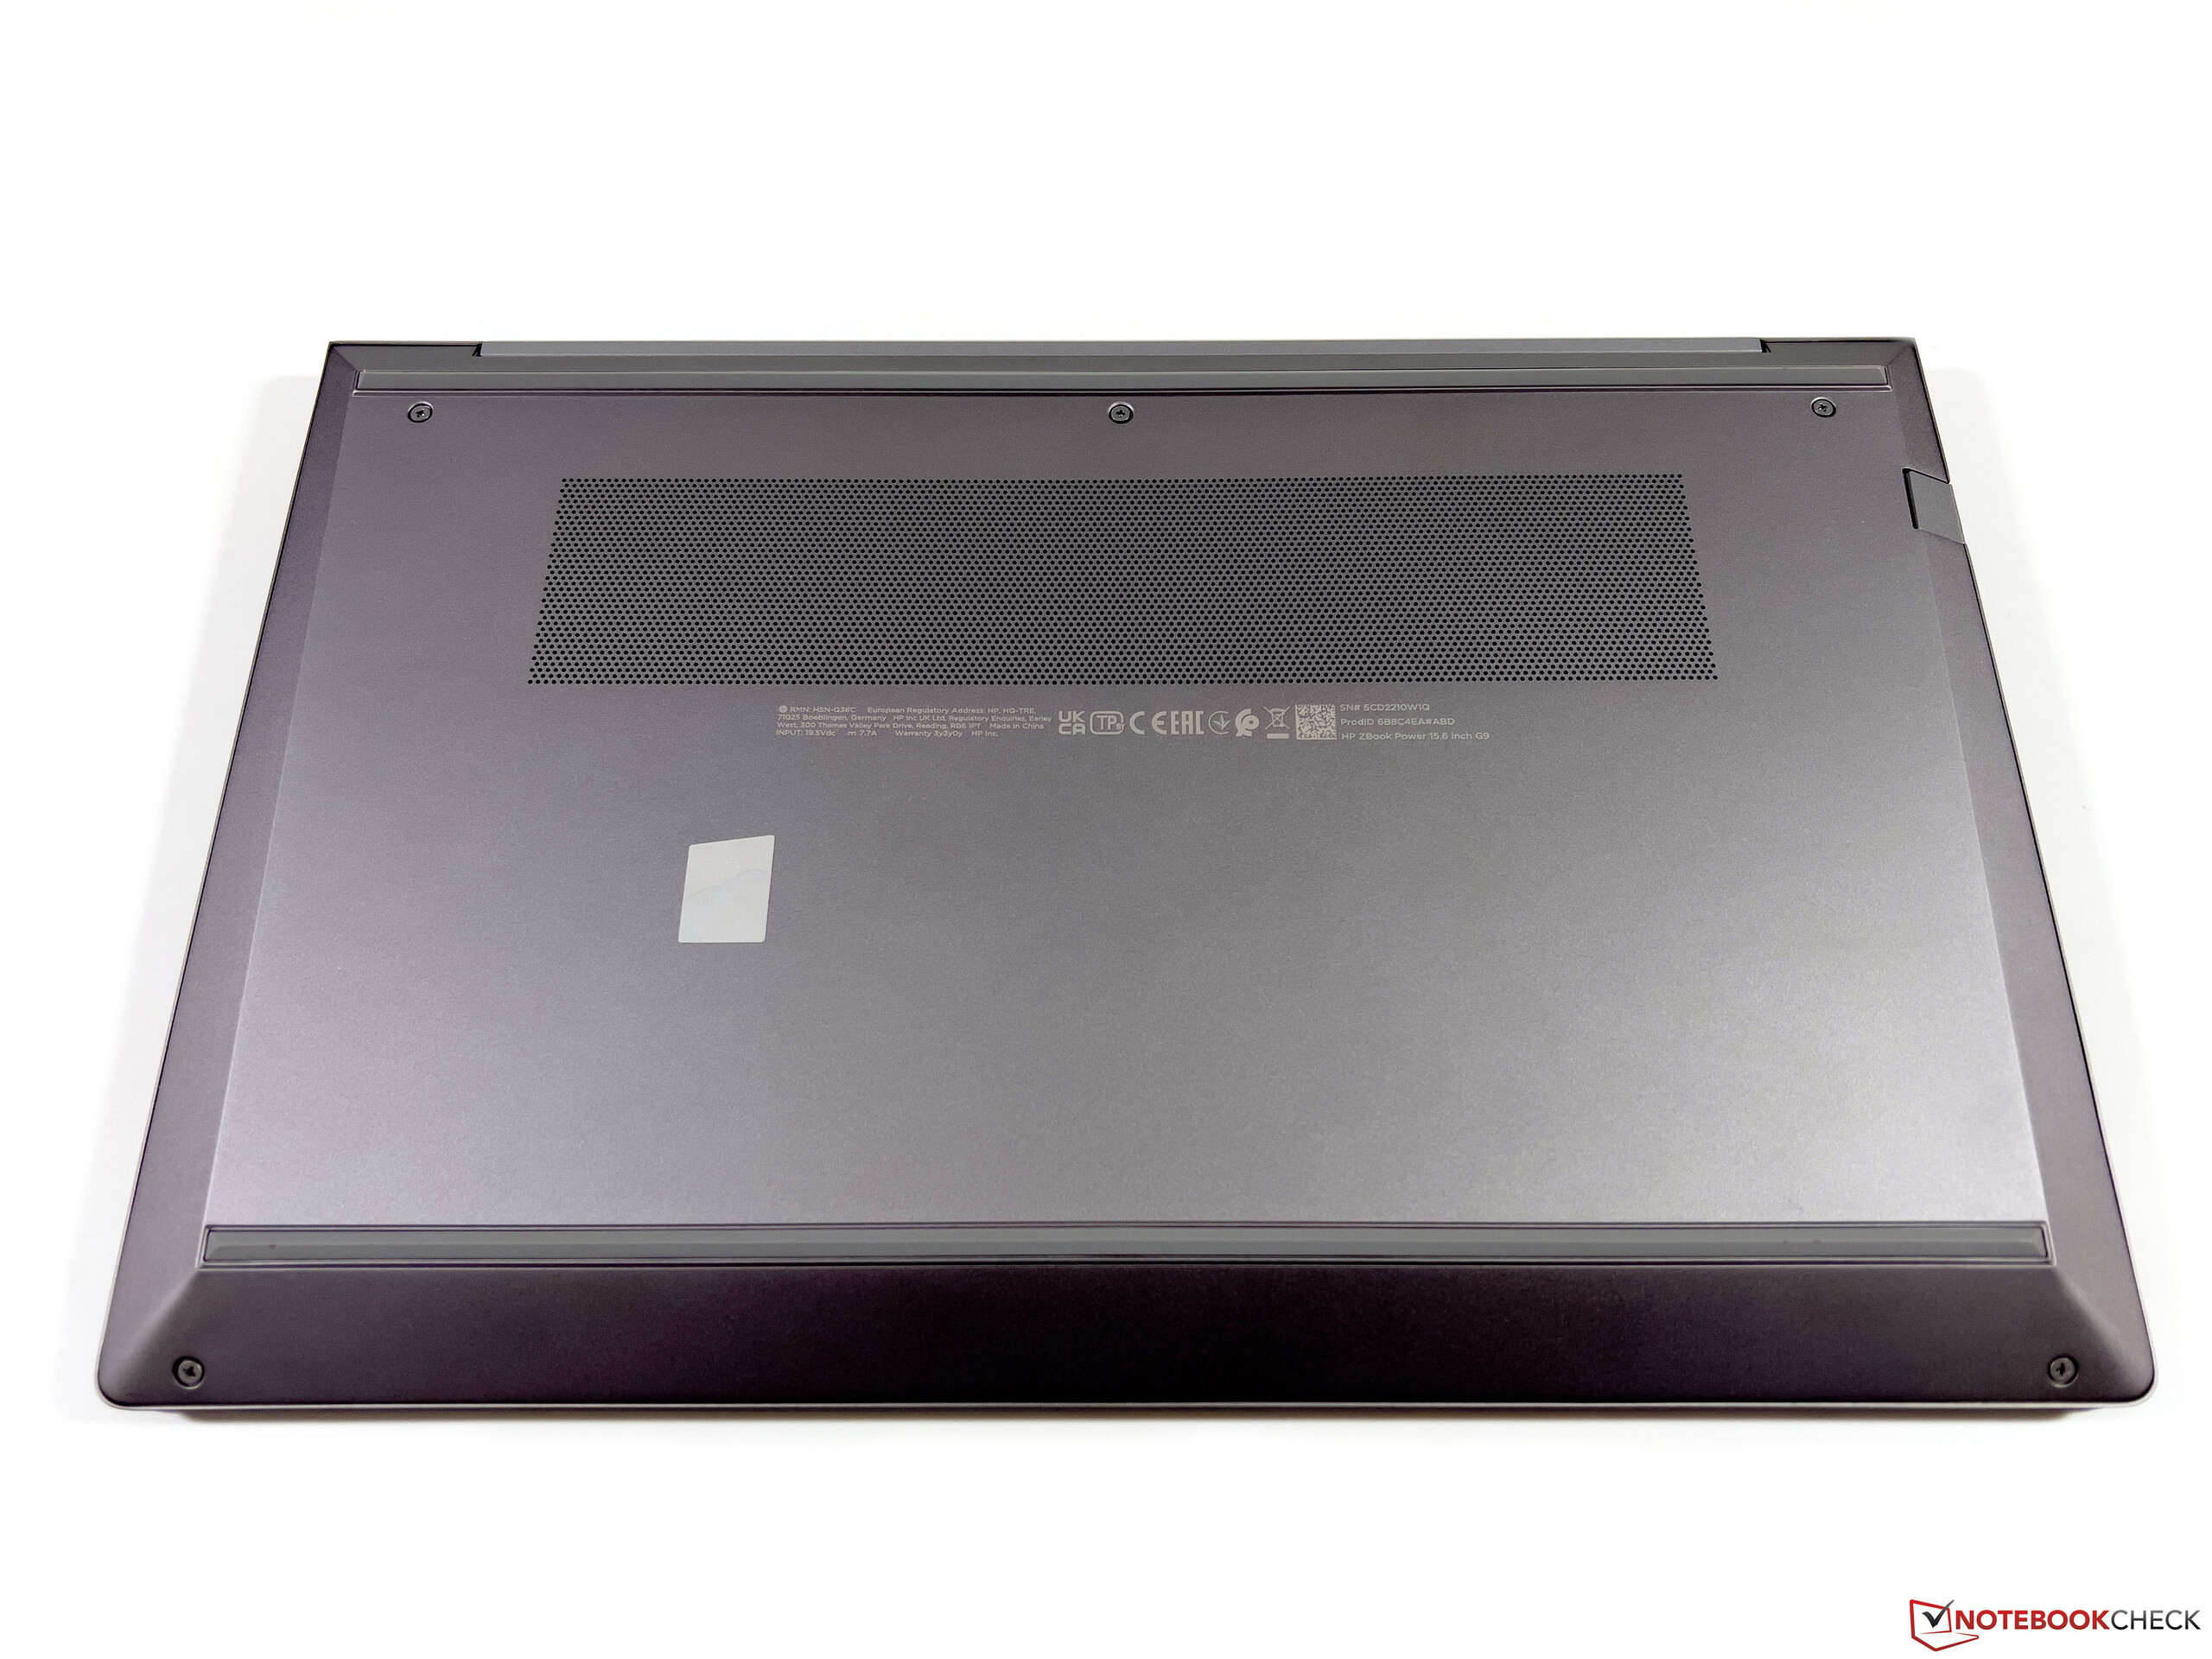
案件和设备
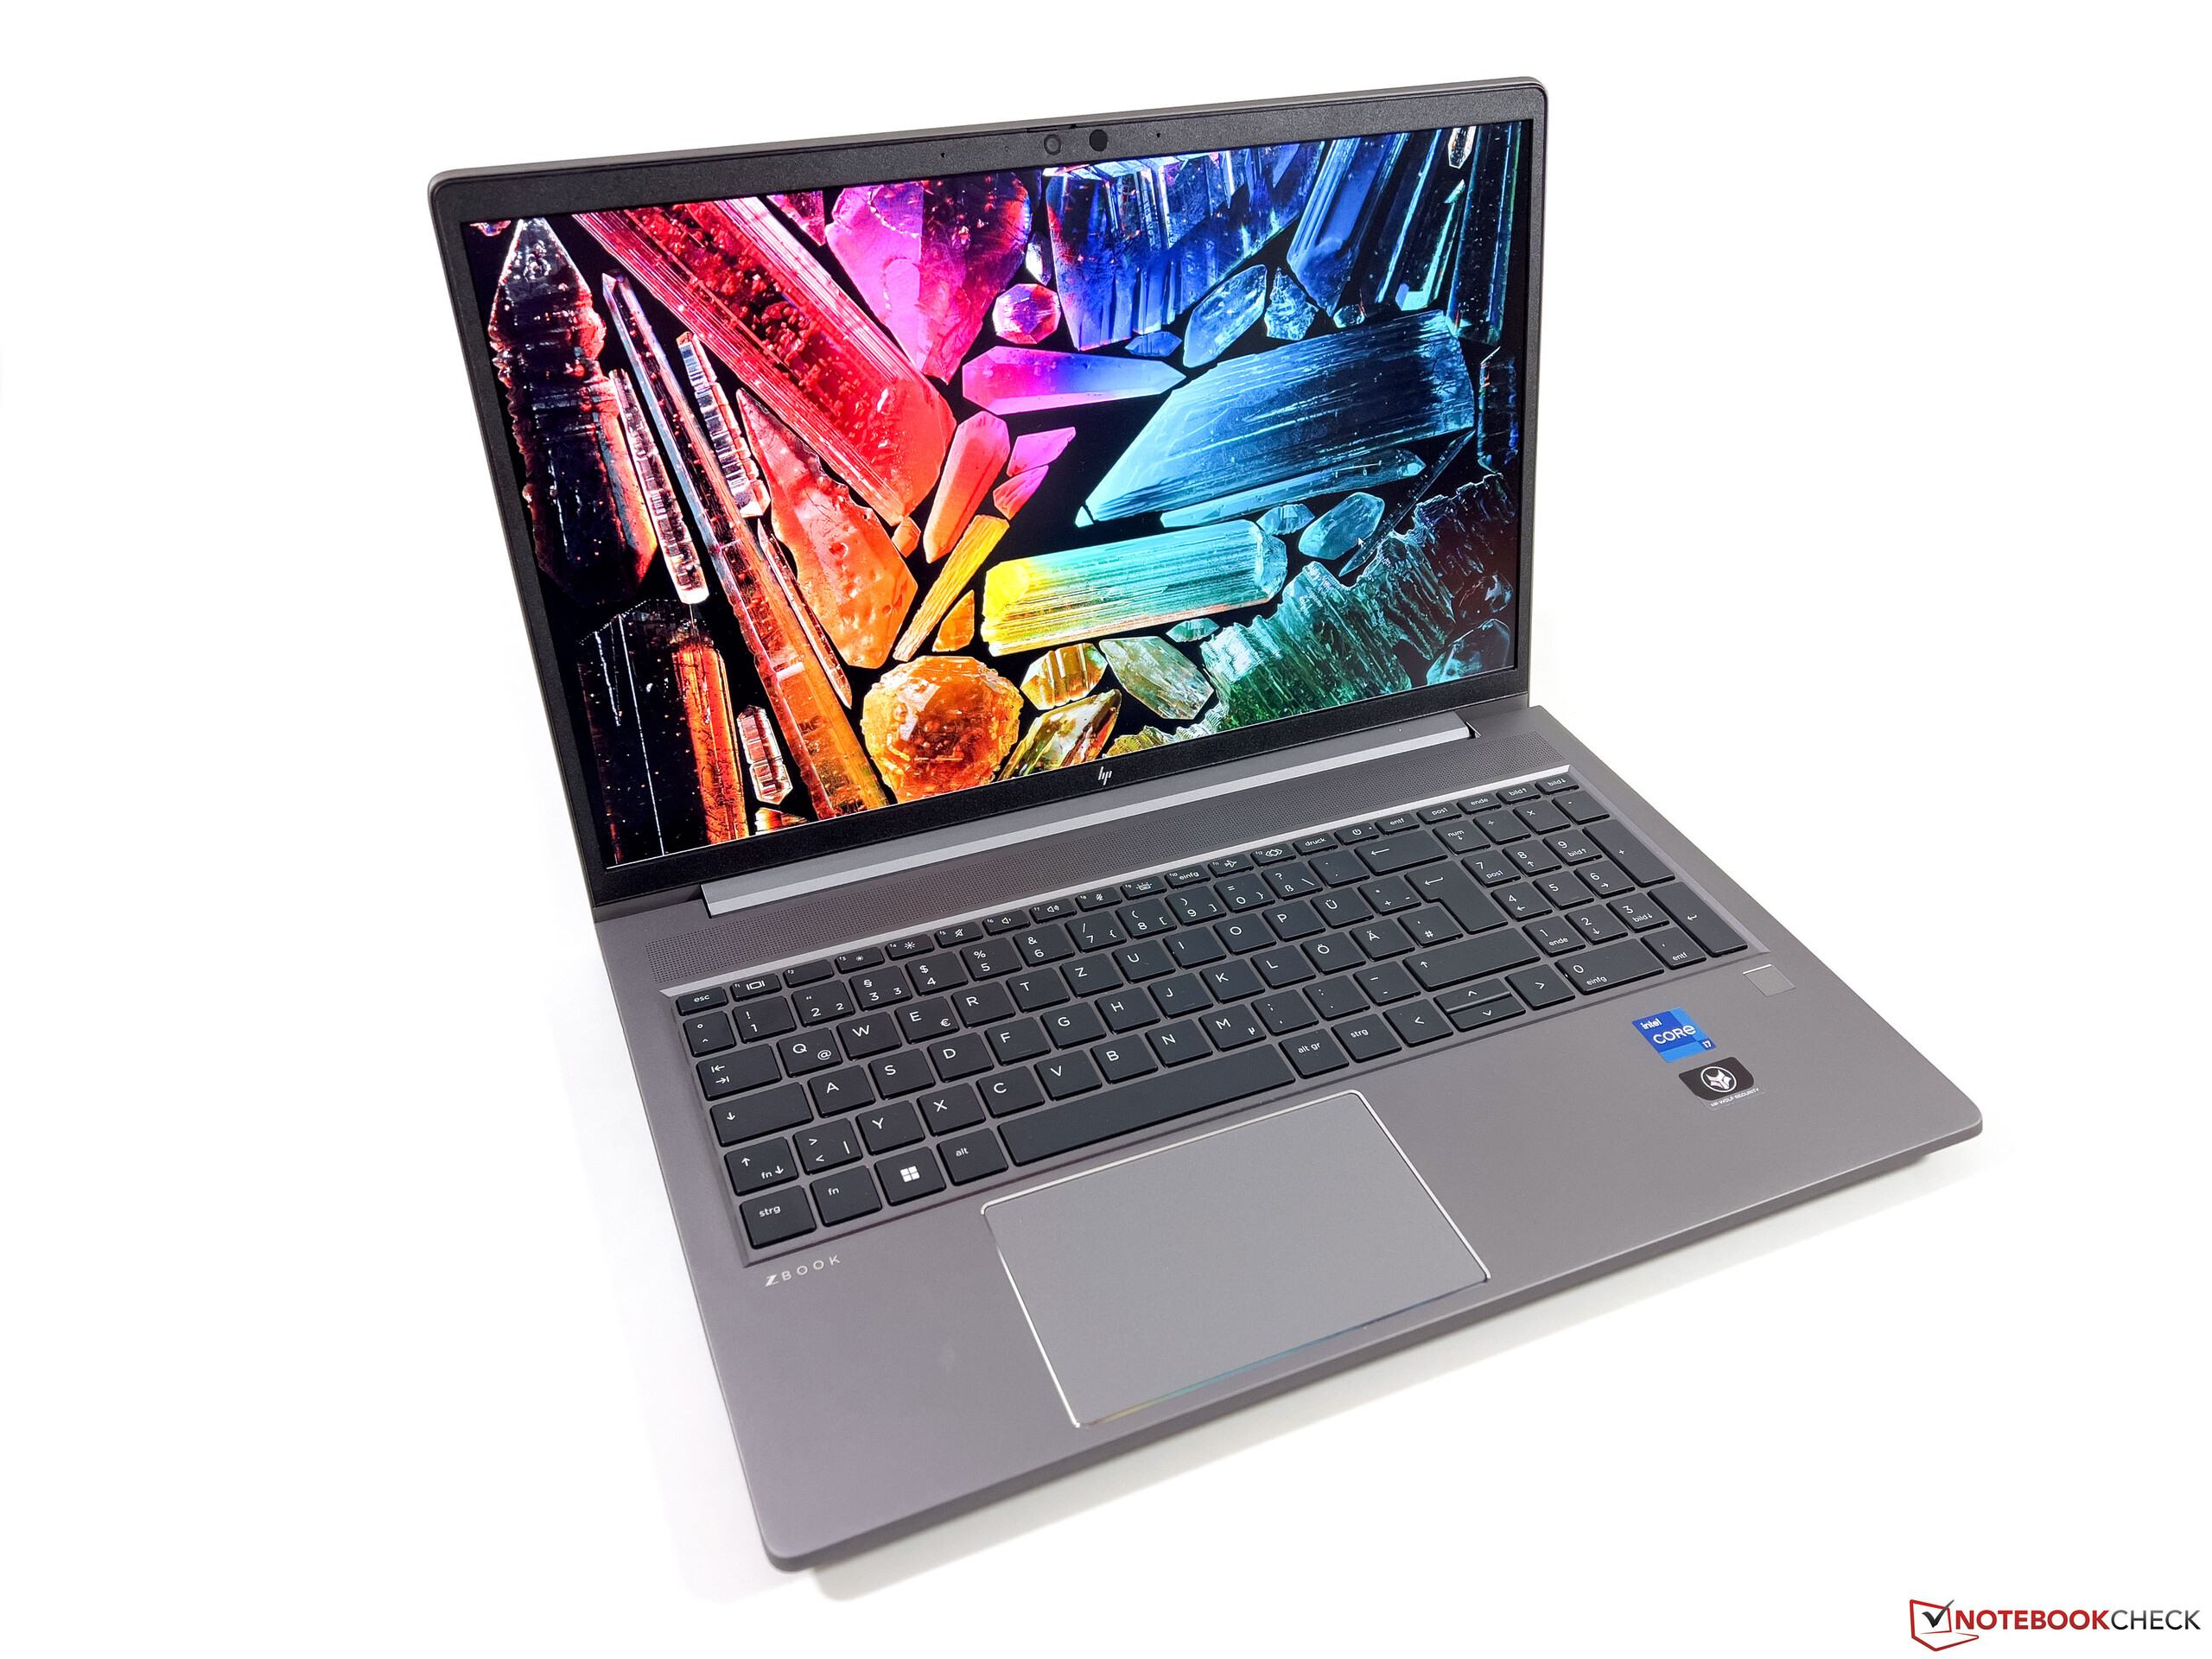
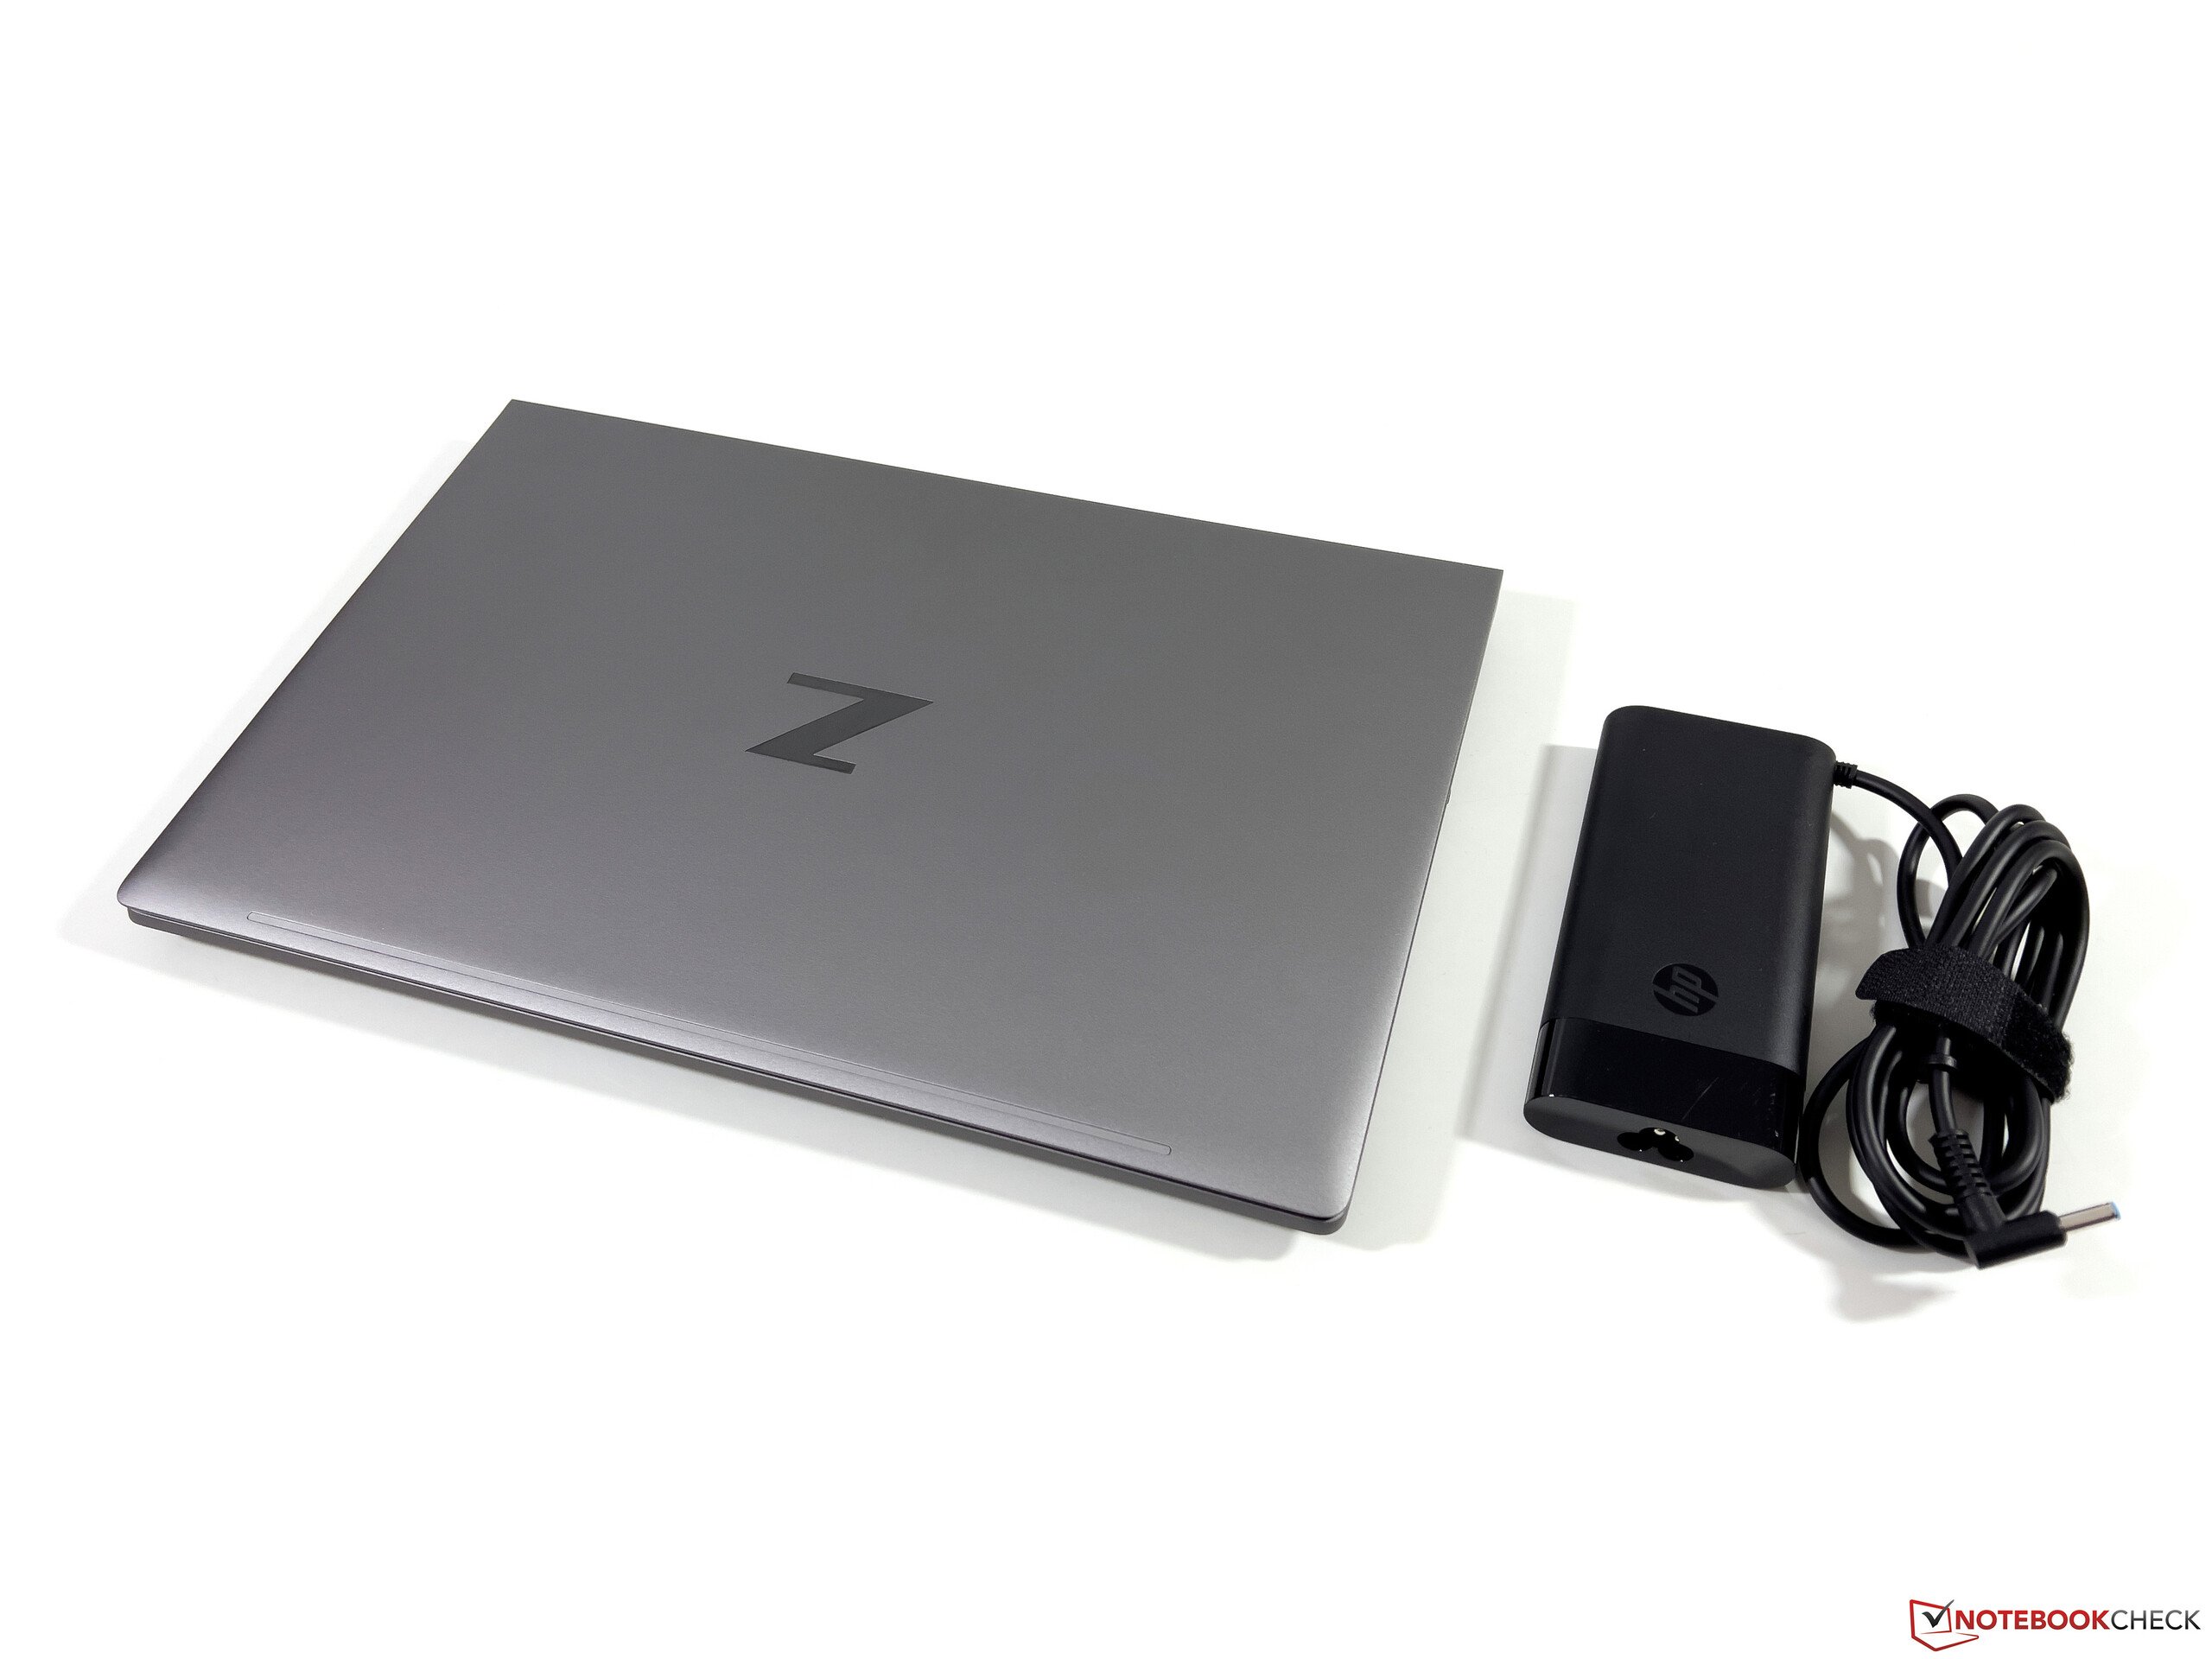
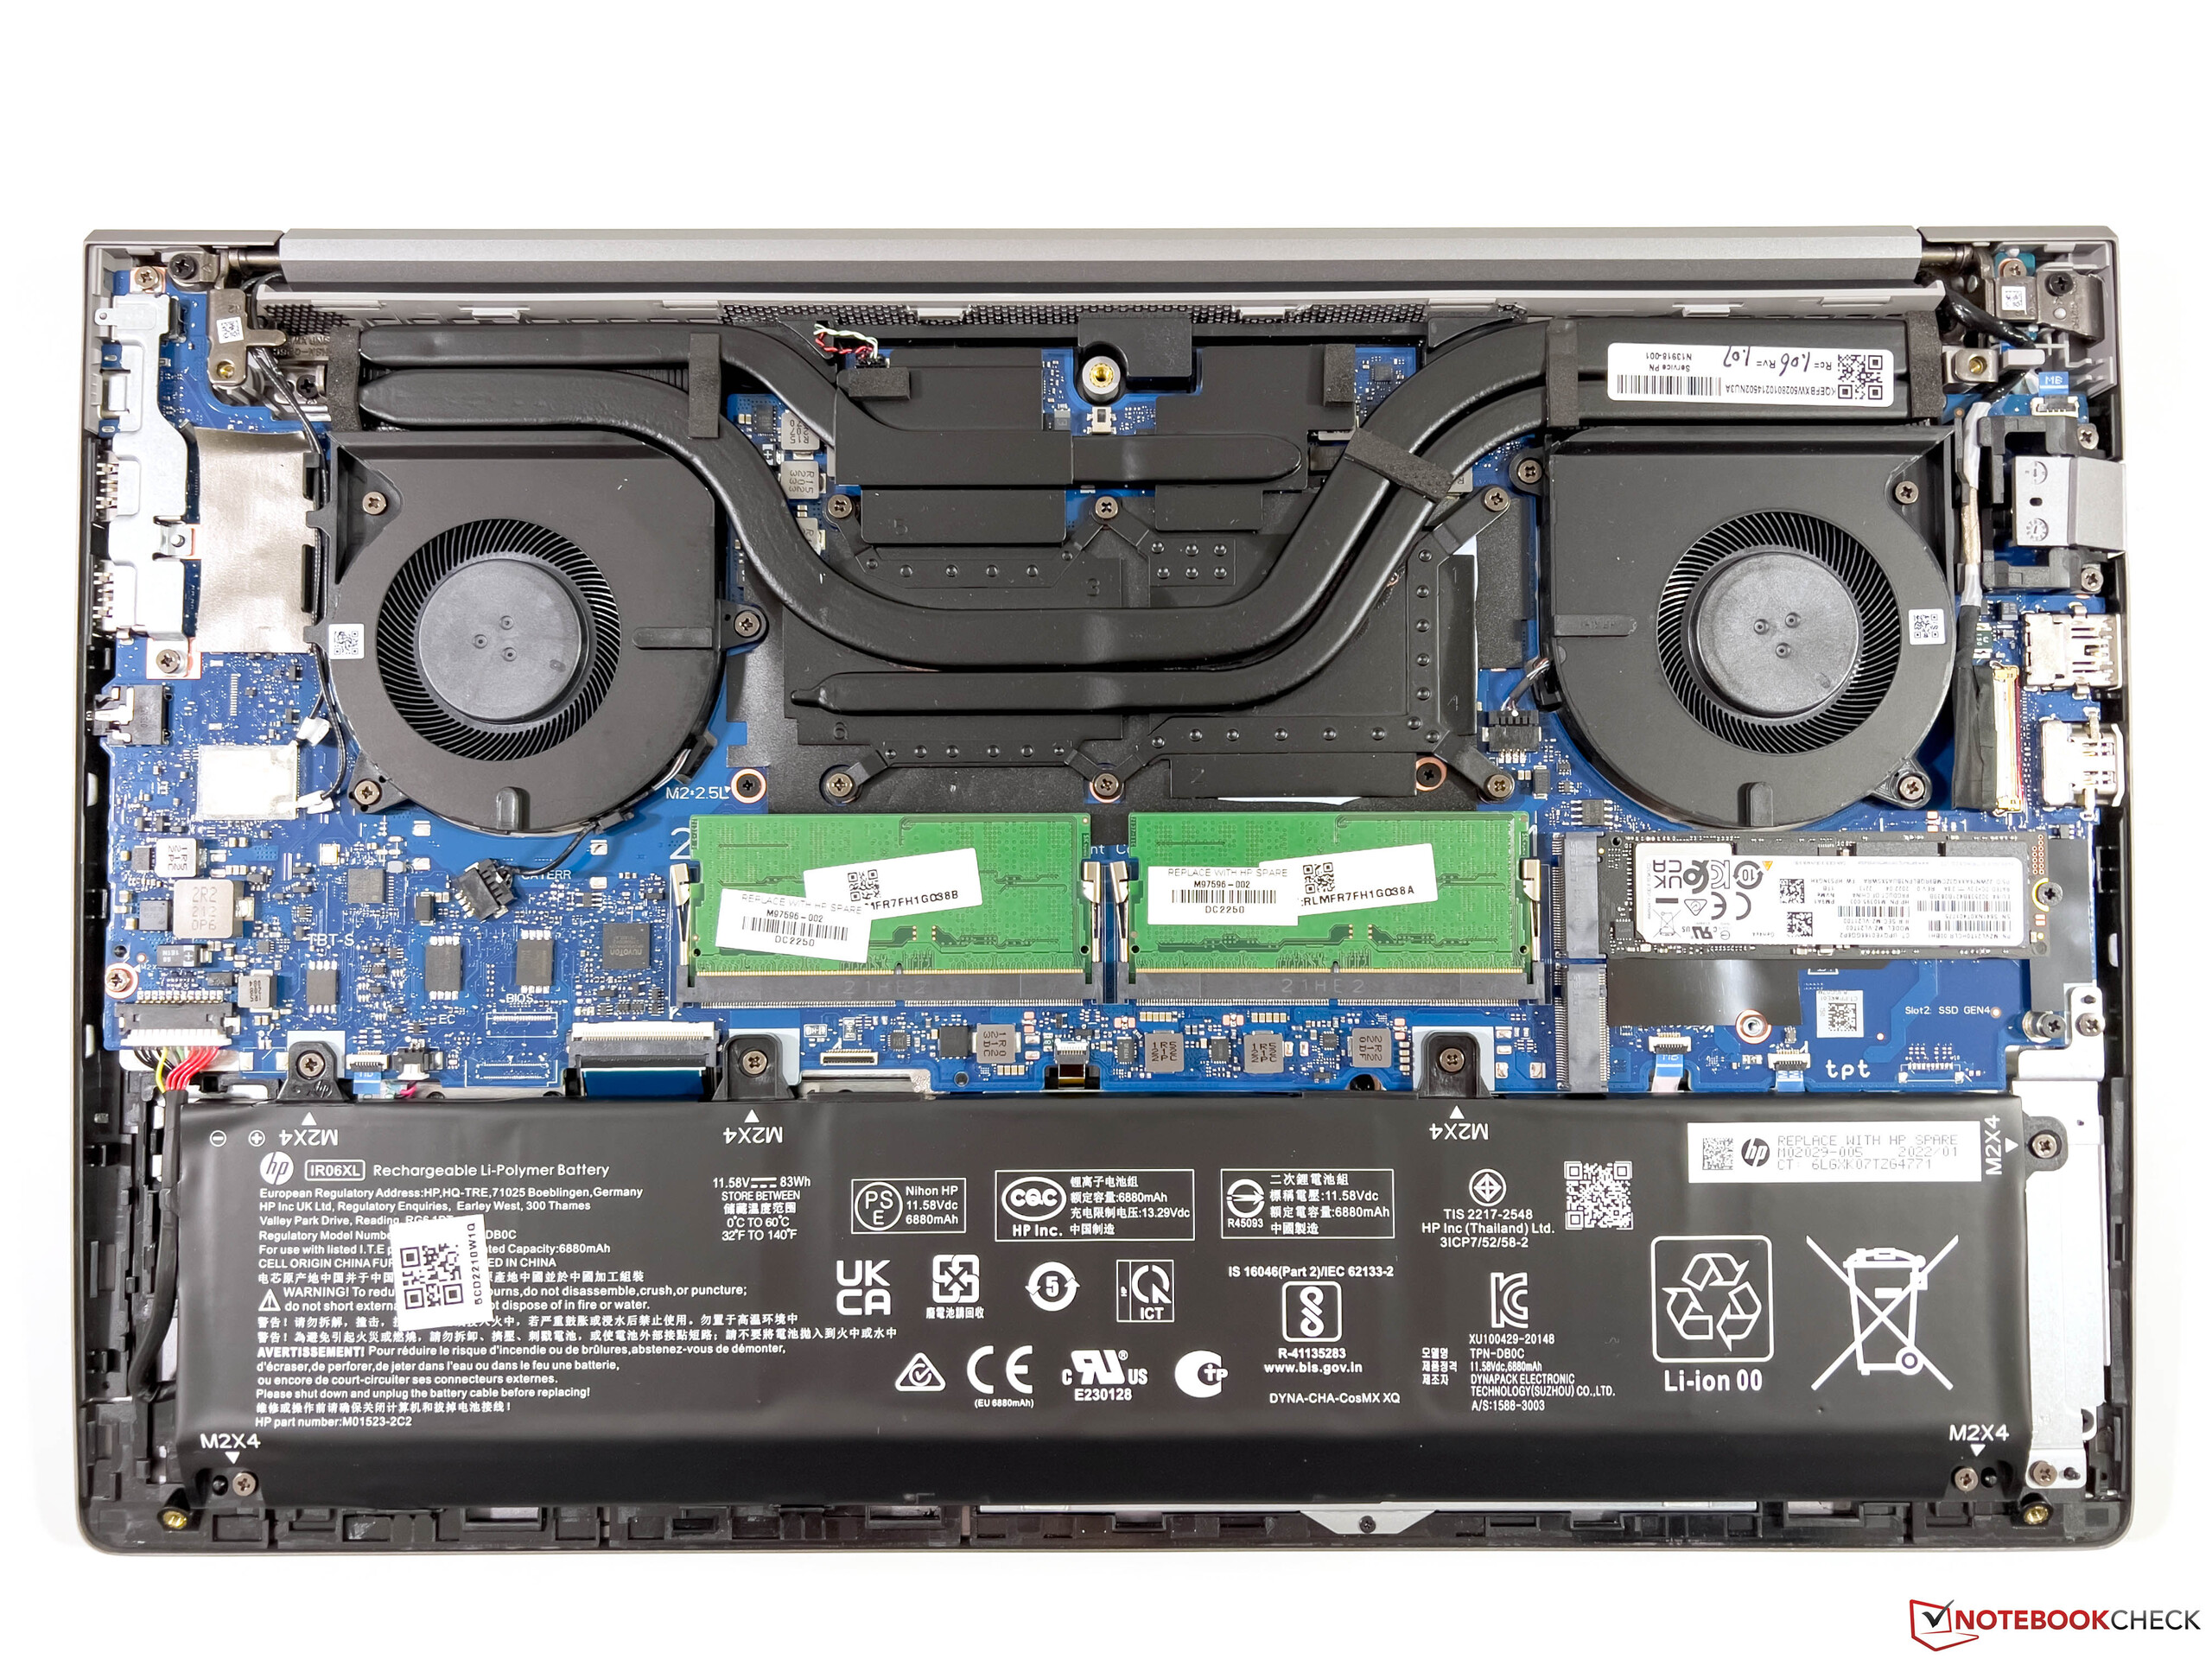
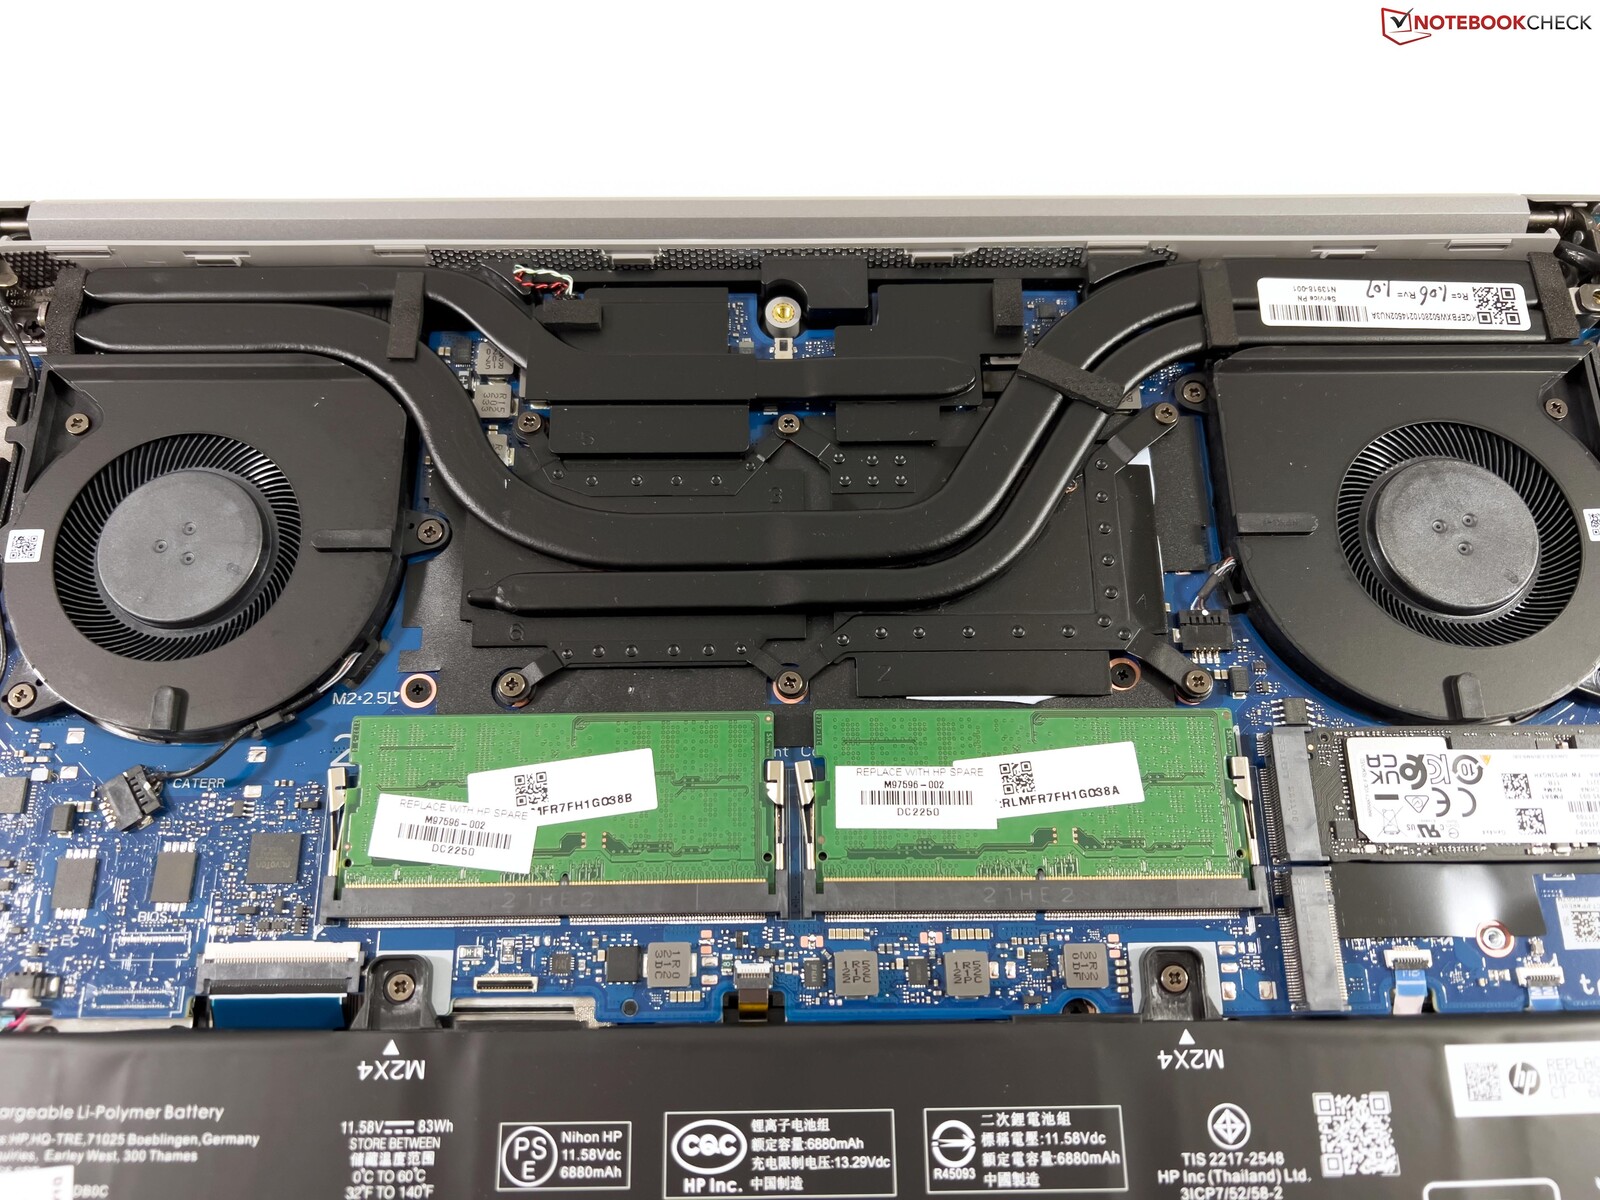
铝制外壳与之前的G8型号相比没有变化。 之前的G8型号.虽然整体质量不错,但稳定性还没有达到更昂贵的工作站型号,如ZBook Studio或ZBook Fury。此外,显示器在改变开启角度后会轻微晃动。从外观上看,ZBook Power 15 G9的深灰色看起来不大,也不引人注目。机箱底部只用螺丝固定,可以很容易地取出来。除了工作存储器,你还可以访问两个M.2固态硬盘插槽,但WLAN模块是焊接的。
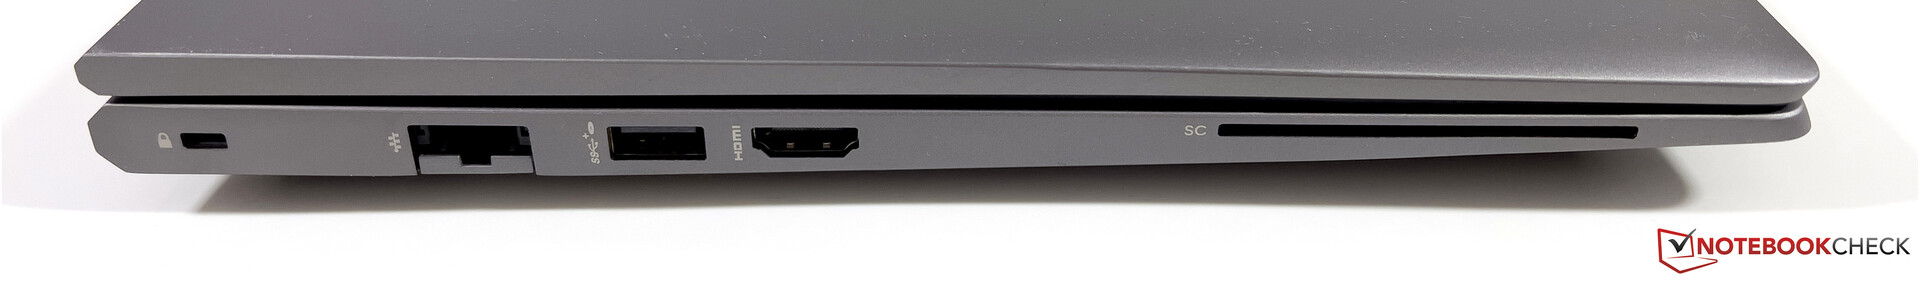
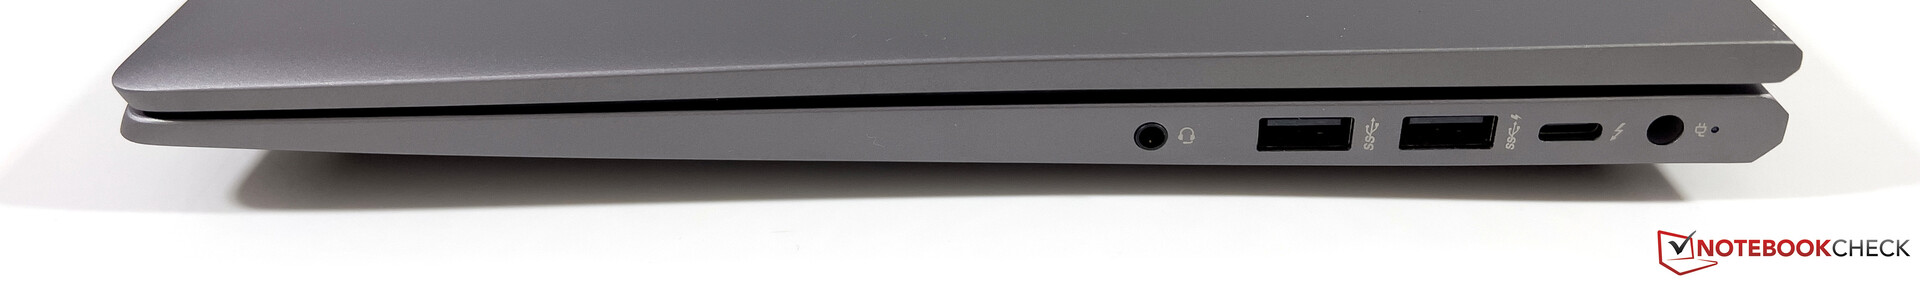
在连接设备方面,仍然有许多USB-A端口,以及带有Thunderbolt 4的USB-C,以太网和一个HDMI端口。然而,它缺少一个读卡器。WLAN模块进行了升级,英特尔的AX211卡现在也支持Wi-Fi 6E标准。我们能够从我们的华硕参考路由器连接到6-GHz的网络,没有任何问题。我们测量的传输速率非常高,也很稳定。ZBook Power没有提供LTE/5G模块。
作为网络摄像头,仍然有一个720p的传感器,包括一个用于面部识别的红外摄像头。网络摄像头完成了它的工作,但即使在良好的光线条件下,图像质量也不是很好。

| Networking | |
| HP ZBook Power 15 G9 6B8C4EA | |
| iperf3 receive AXE11000 6GHz | |
| iperf3 transmit AXE11000 6GHz | |
| HP ZBook Studio 16 G9 62U04EA | |
| iperf3 receive AXE11000 6GHz | |
| iperf3 transmit AXE11000 6GHz | |
| Dell Precision 5000 5560 | |
| iperf3 transmit AX12 | |
| iperf3 receive AX12 | |
| Lenovo ThinkPad P15v G2 21A9000XGE | |
| iperf3 transmit AX12 | |
| iperf3 receive AX12 | |
| HP ZBook Power 15 G8 313S5EA | |
| iperf3 transmit AX12 | |
| iperf3 receive AX12 | |


输入设备 - 带有良好键盘的ZBook Power
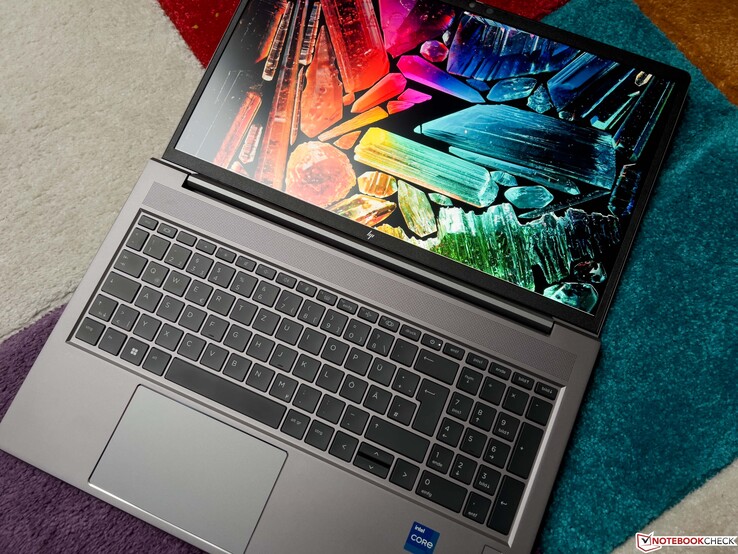
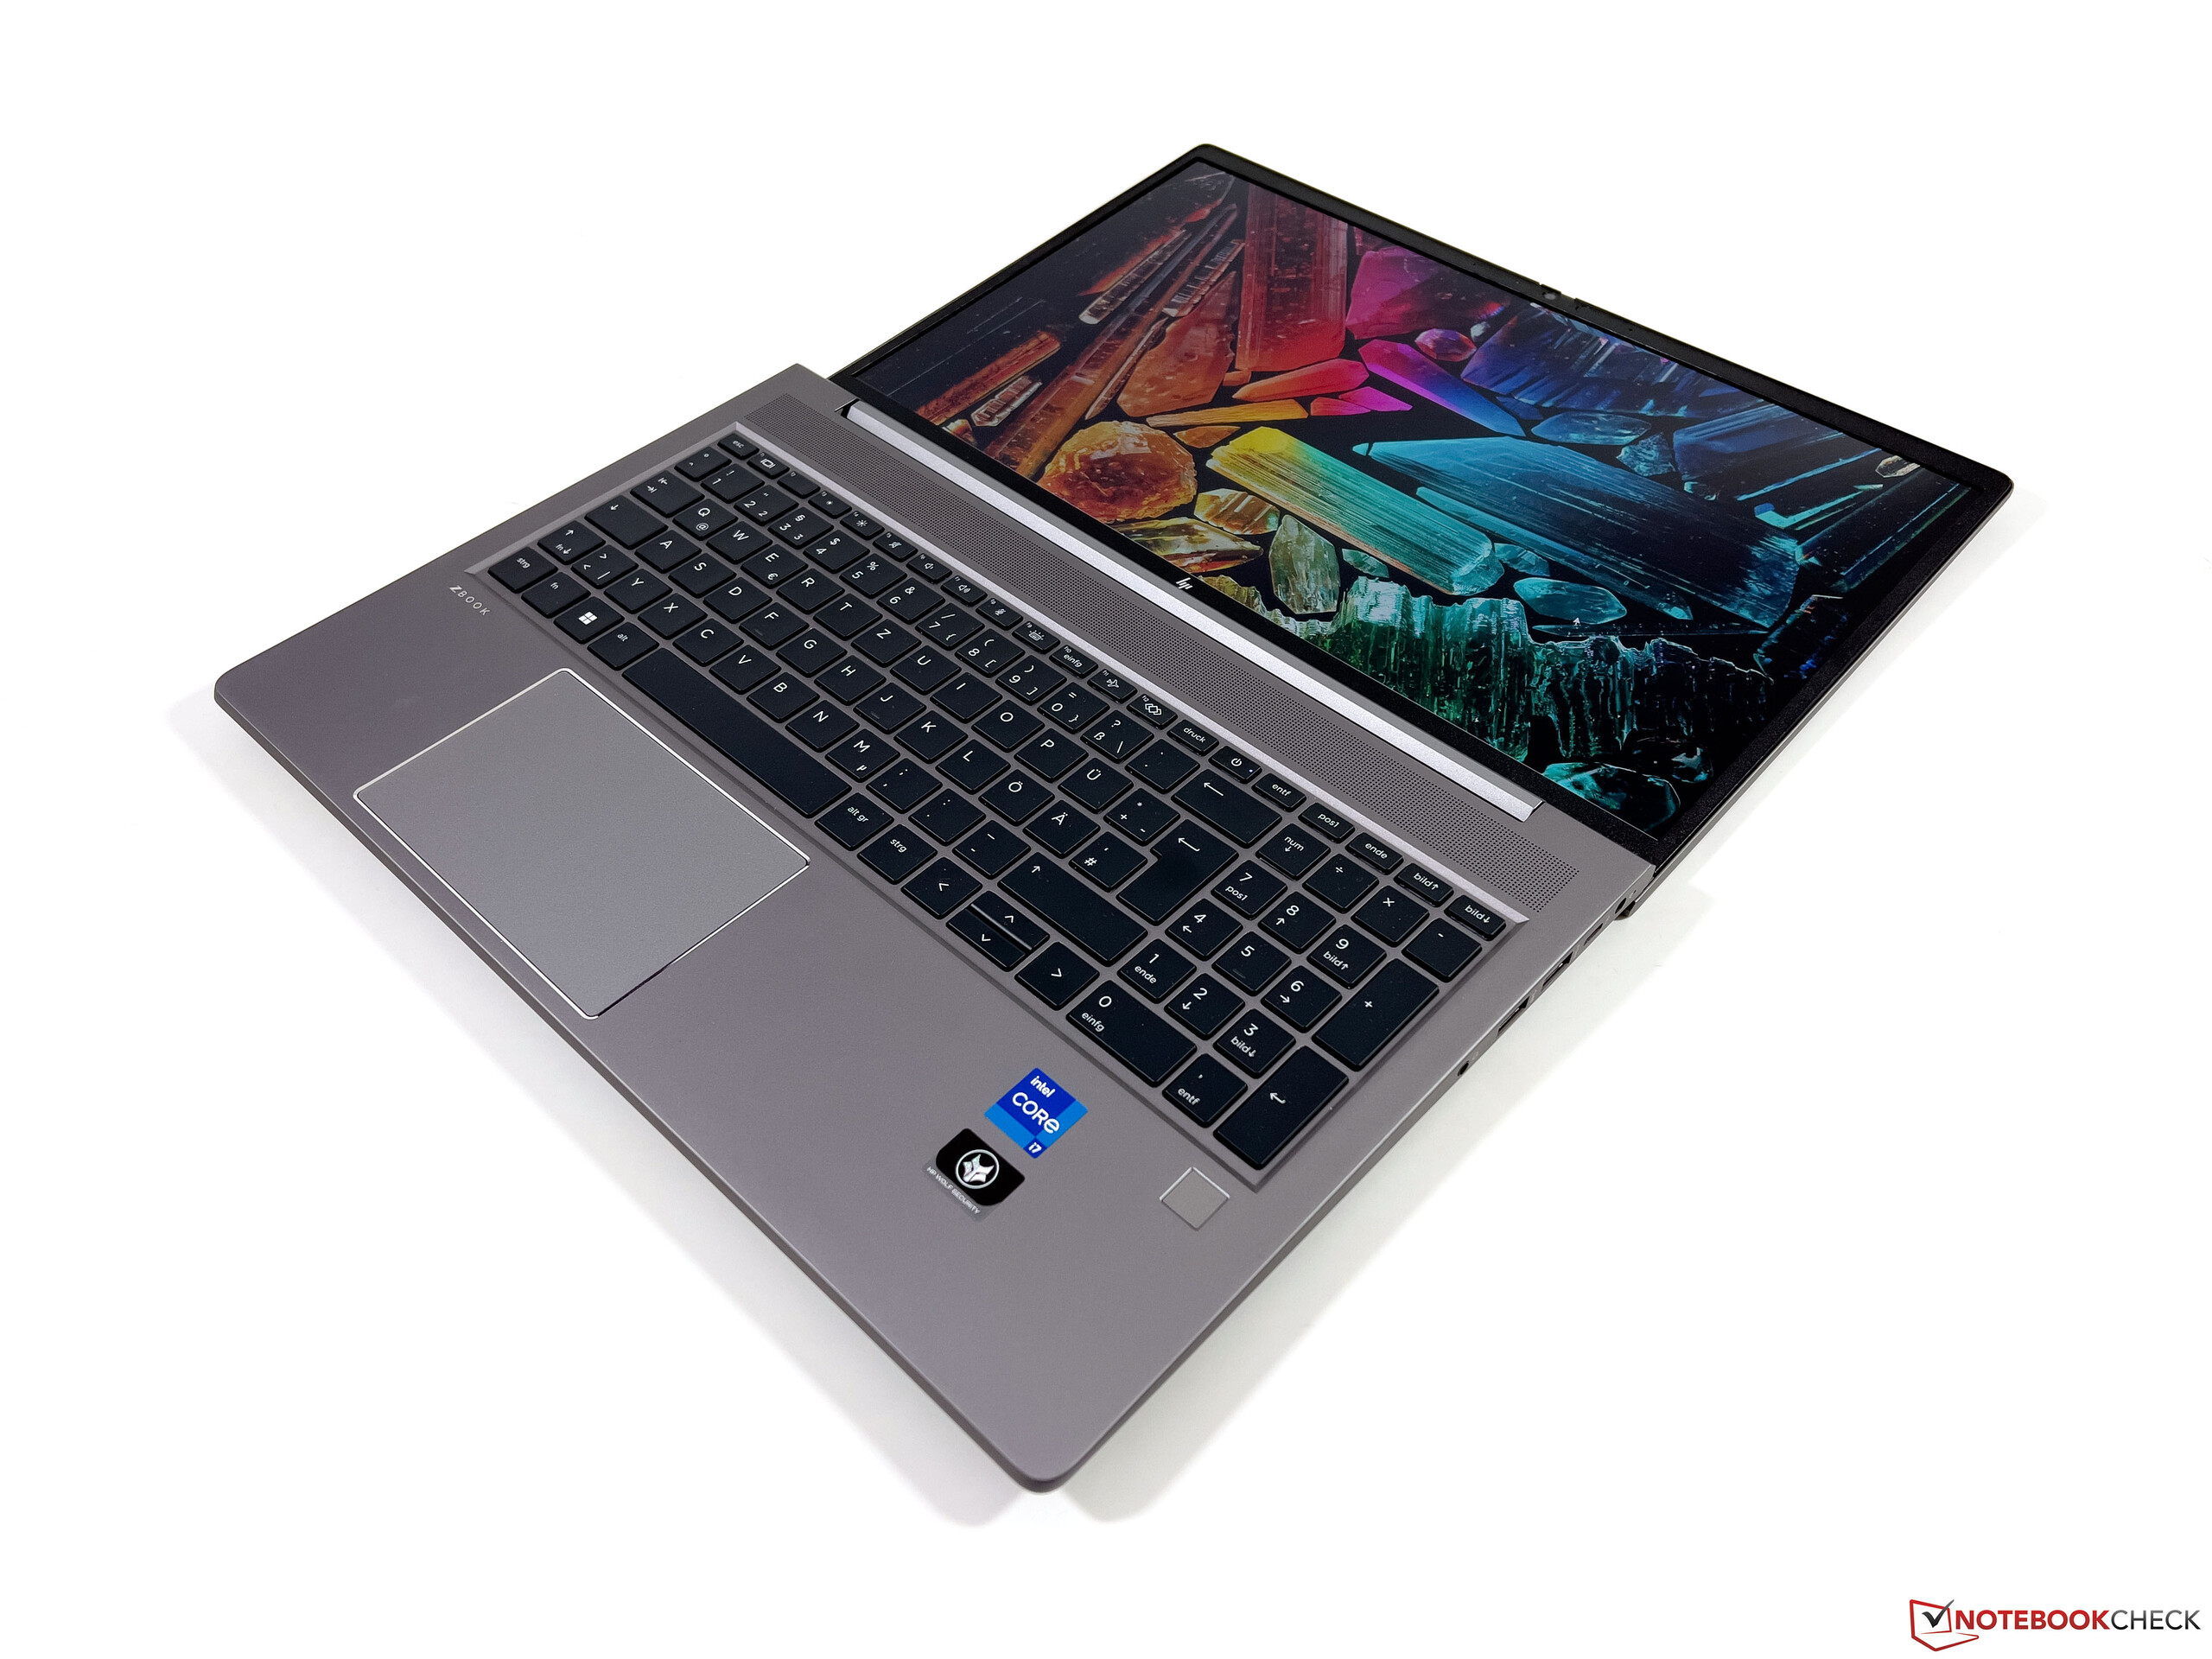
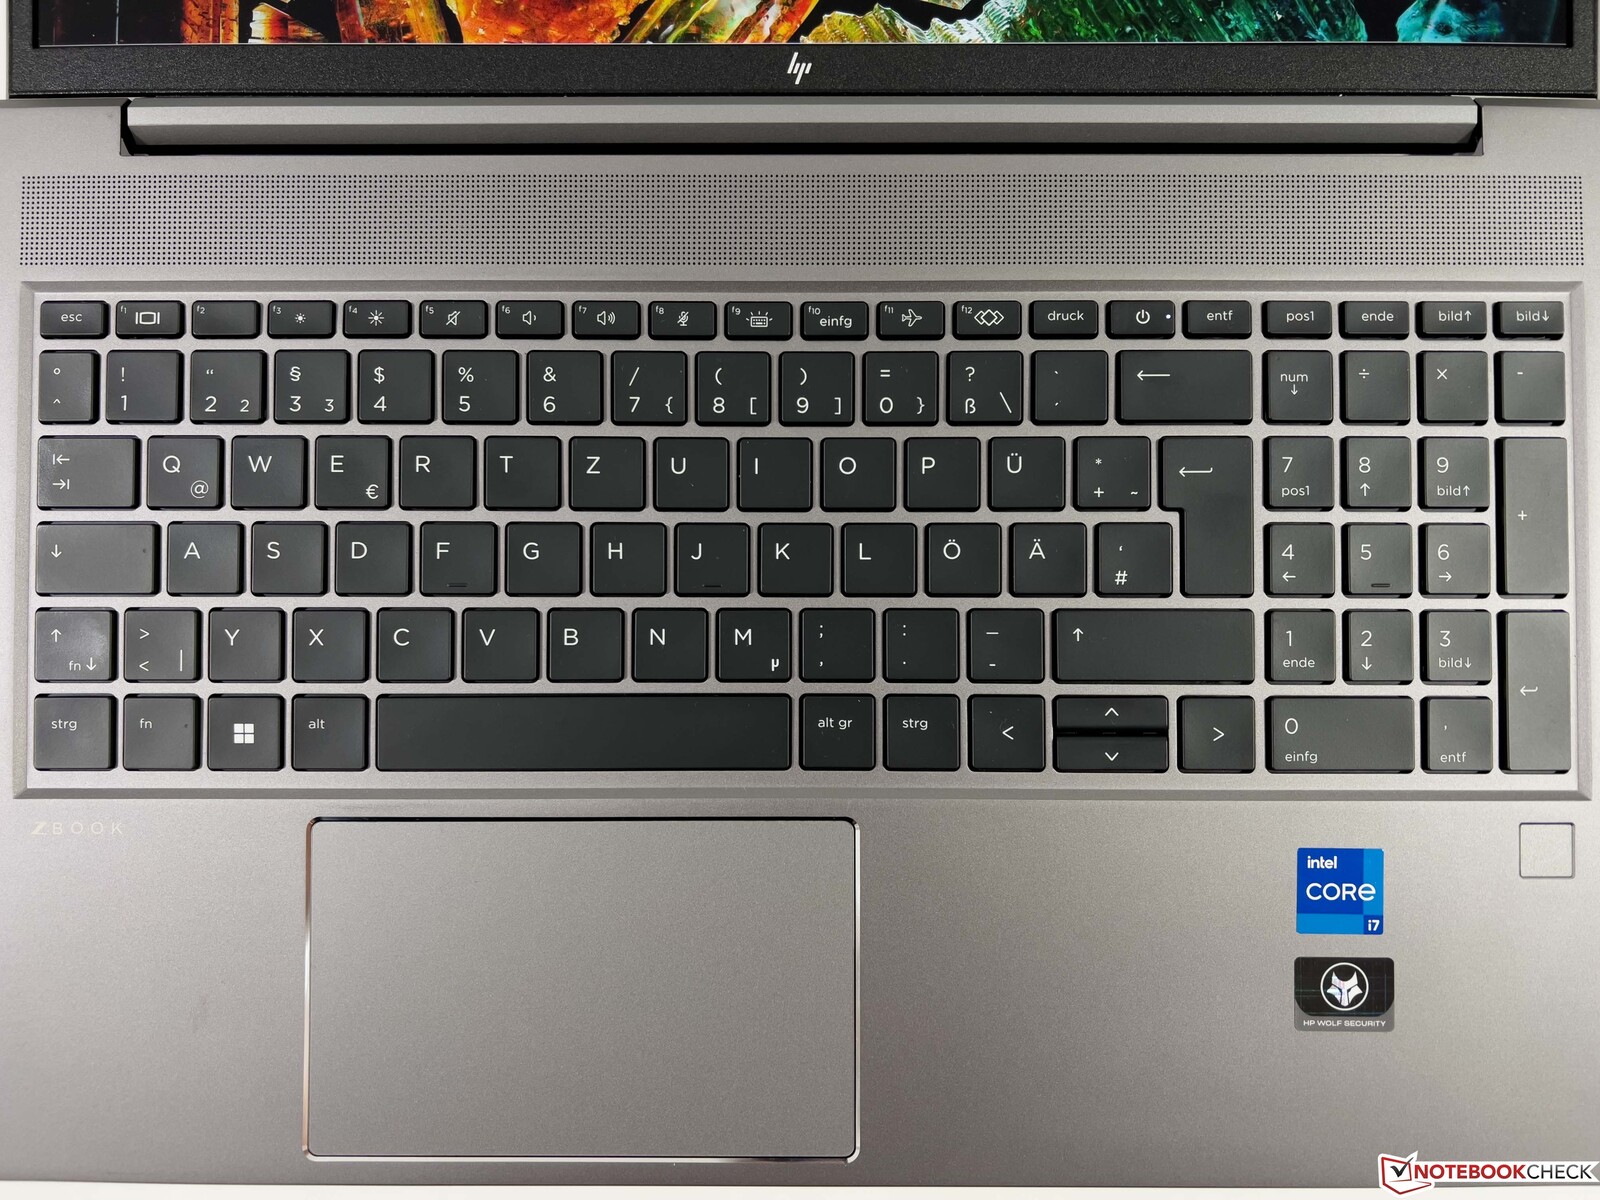
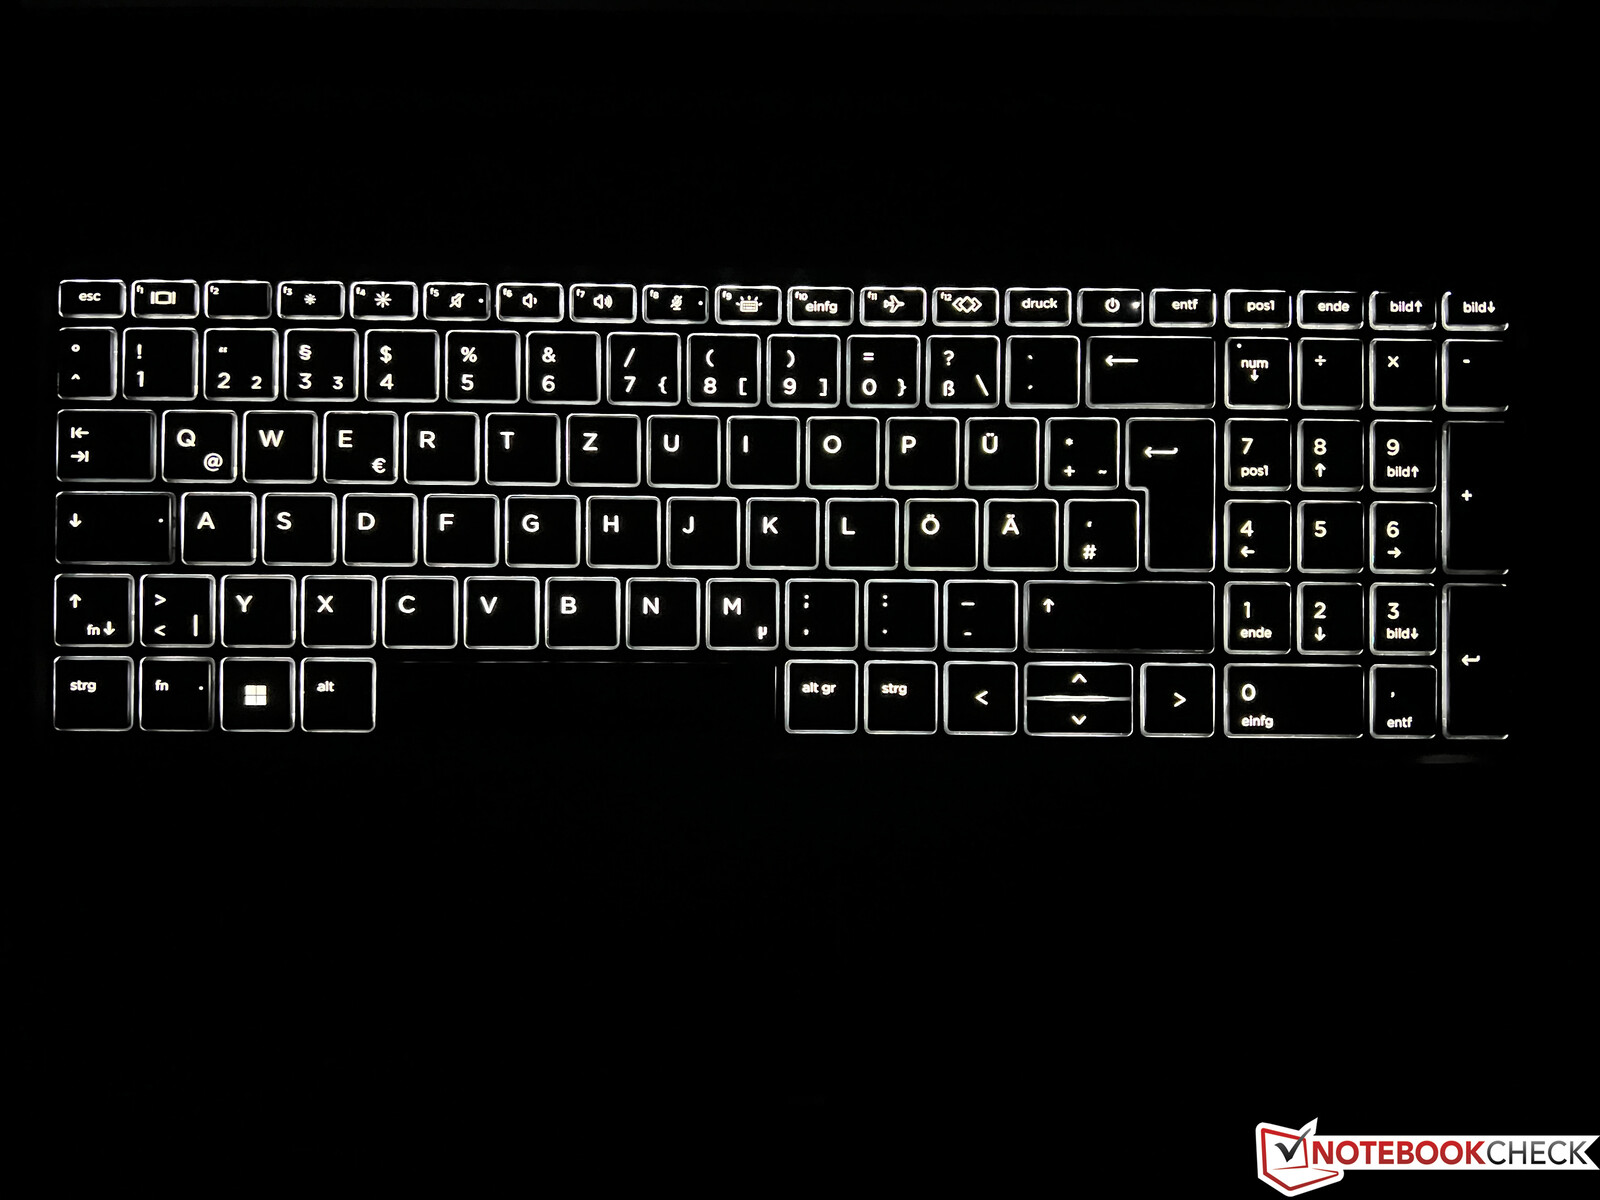
与之相比 ZBook Power 15 G8,在输入设备方面也没有变化。带背景照明的键盘提供了非常好的打字体验,右侧有一个专门的数字块。在布局方面,你必须习惯稍小的方向键和顶部按键行中的电源按钮。指纹扫描仪被放置在右侧,在键盘下方。在我们的测试中,ClickPad工作可靠,但点击的声音有点大。
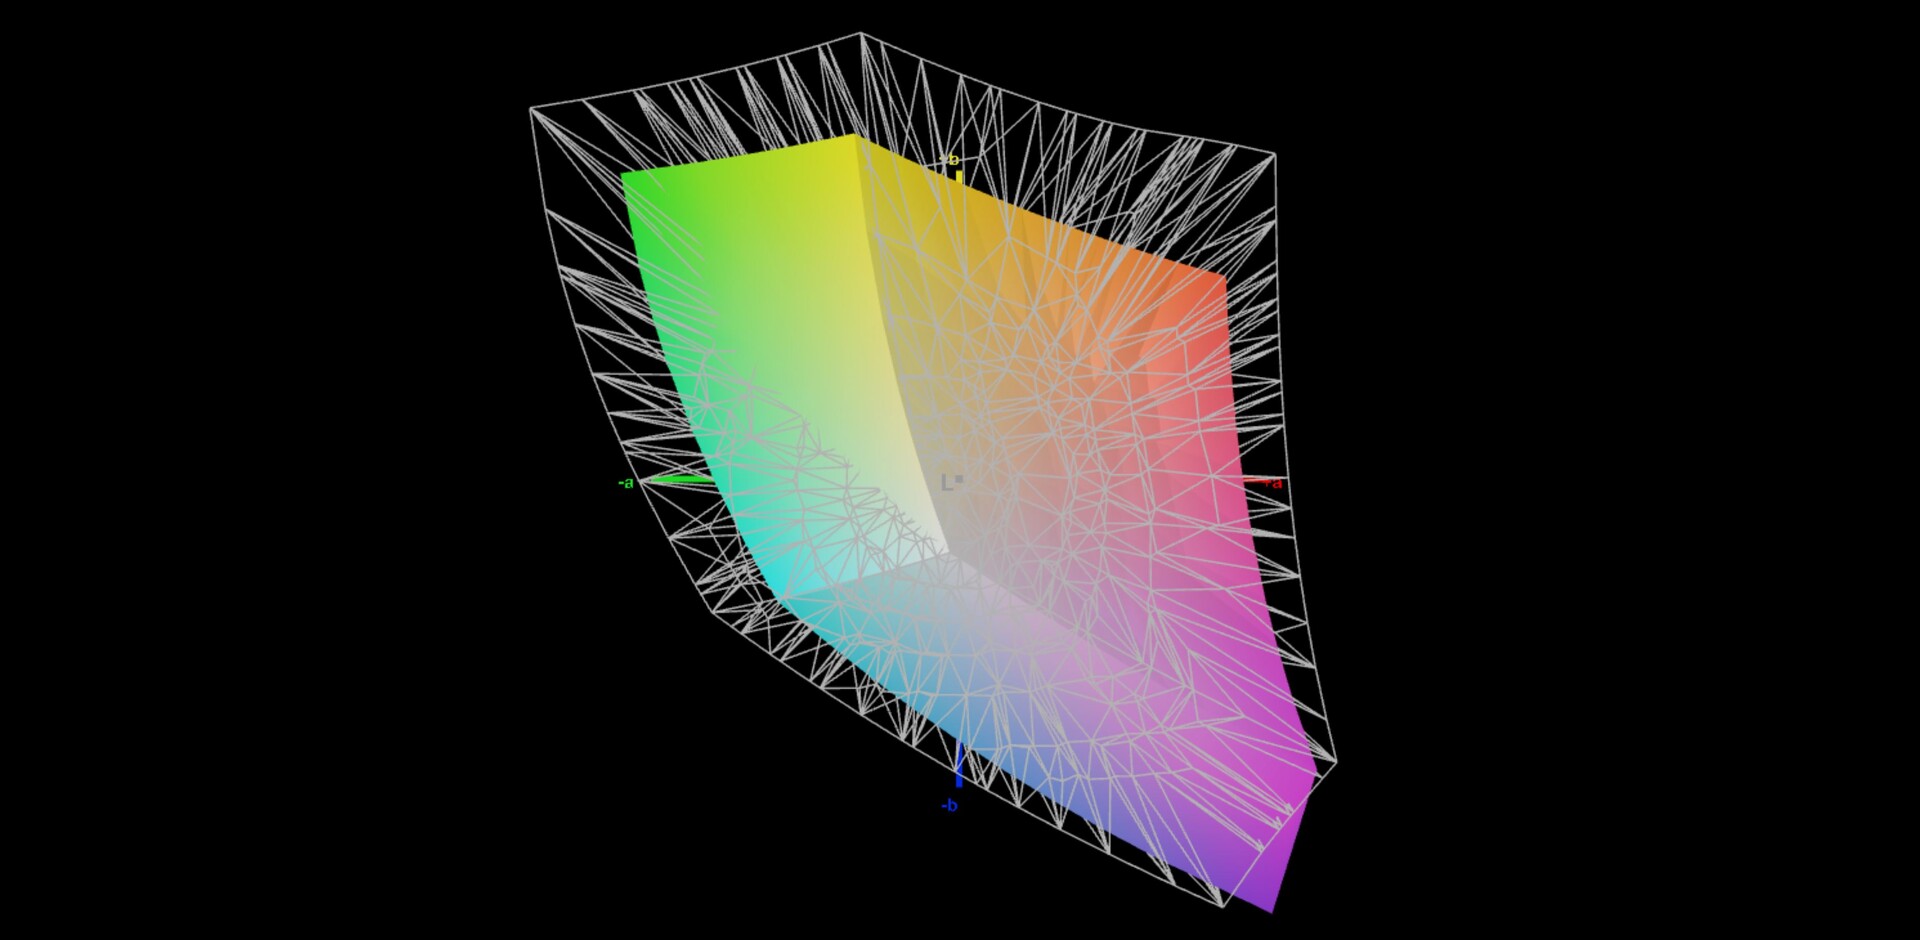
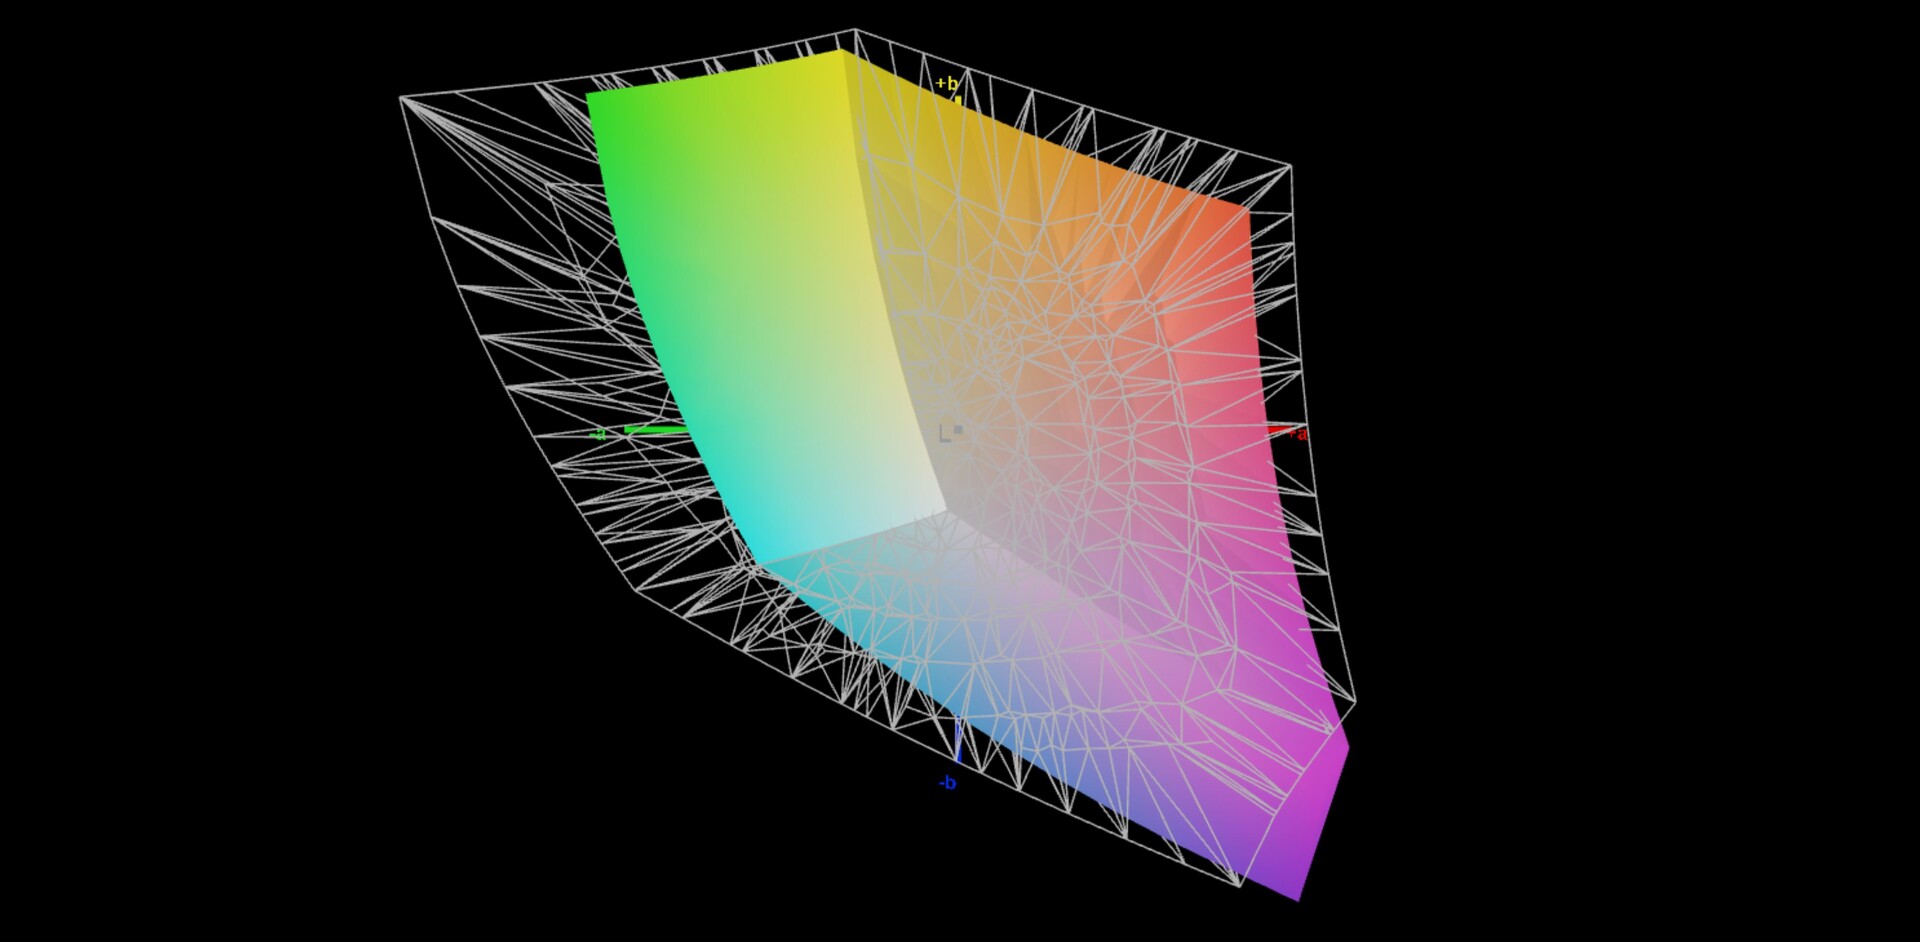
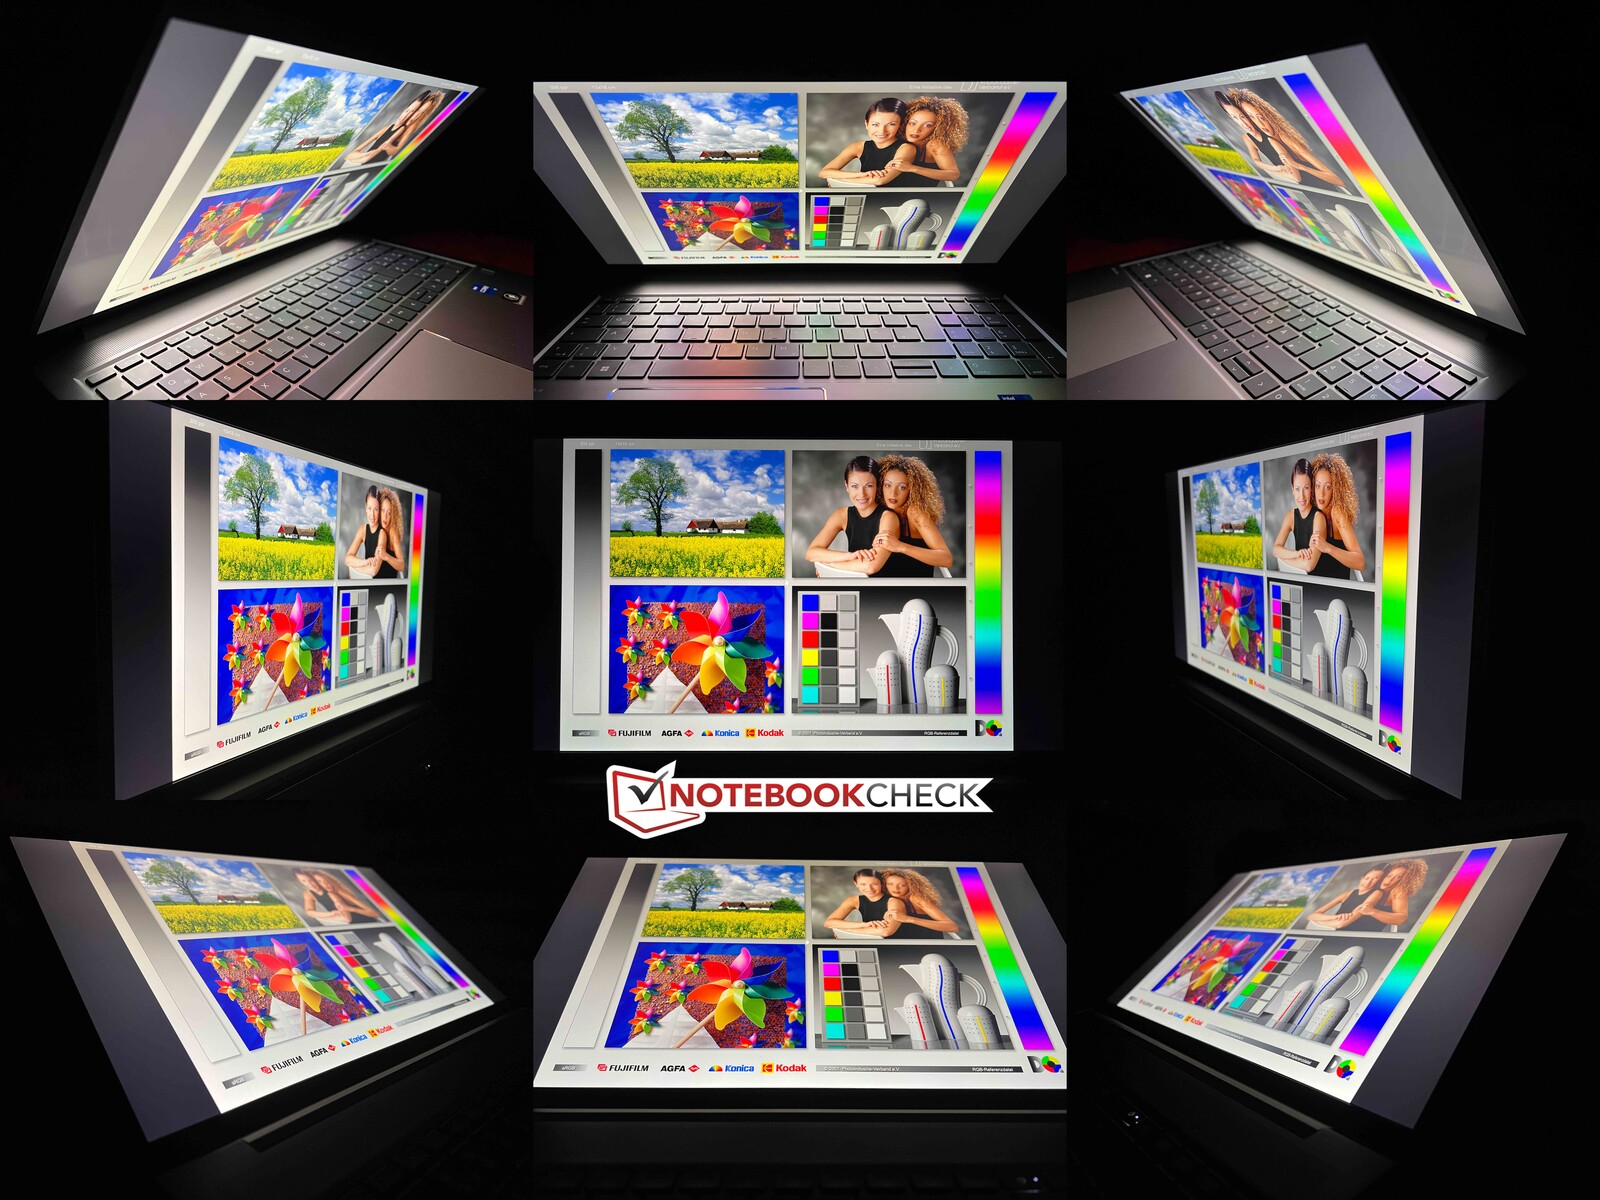
显示器 - 4K IPS,100% sRGB覆盖率
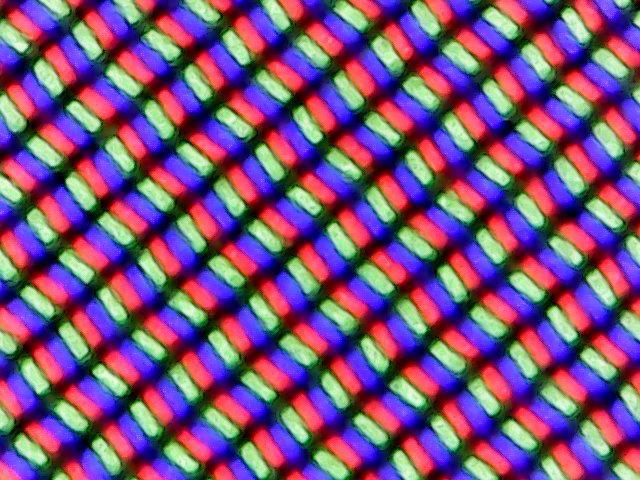
我们已经用普通的全高清面板测试了 前身而我们目前测试的ZBook Power G9配置的是可选的低功耗4K IPS显示屏。与前代产品一样,这款产品仍然采用16:9格式(3840 x 2160像素)。主观上,LG-Philips面板产生了良好的图像质量,但明亮的内容在哑光显示表面上显得略有颗粒感。此外,响应时间不是特别快,在实践中我们还看到一些明显的重影效果,例如在鼠标指针上。
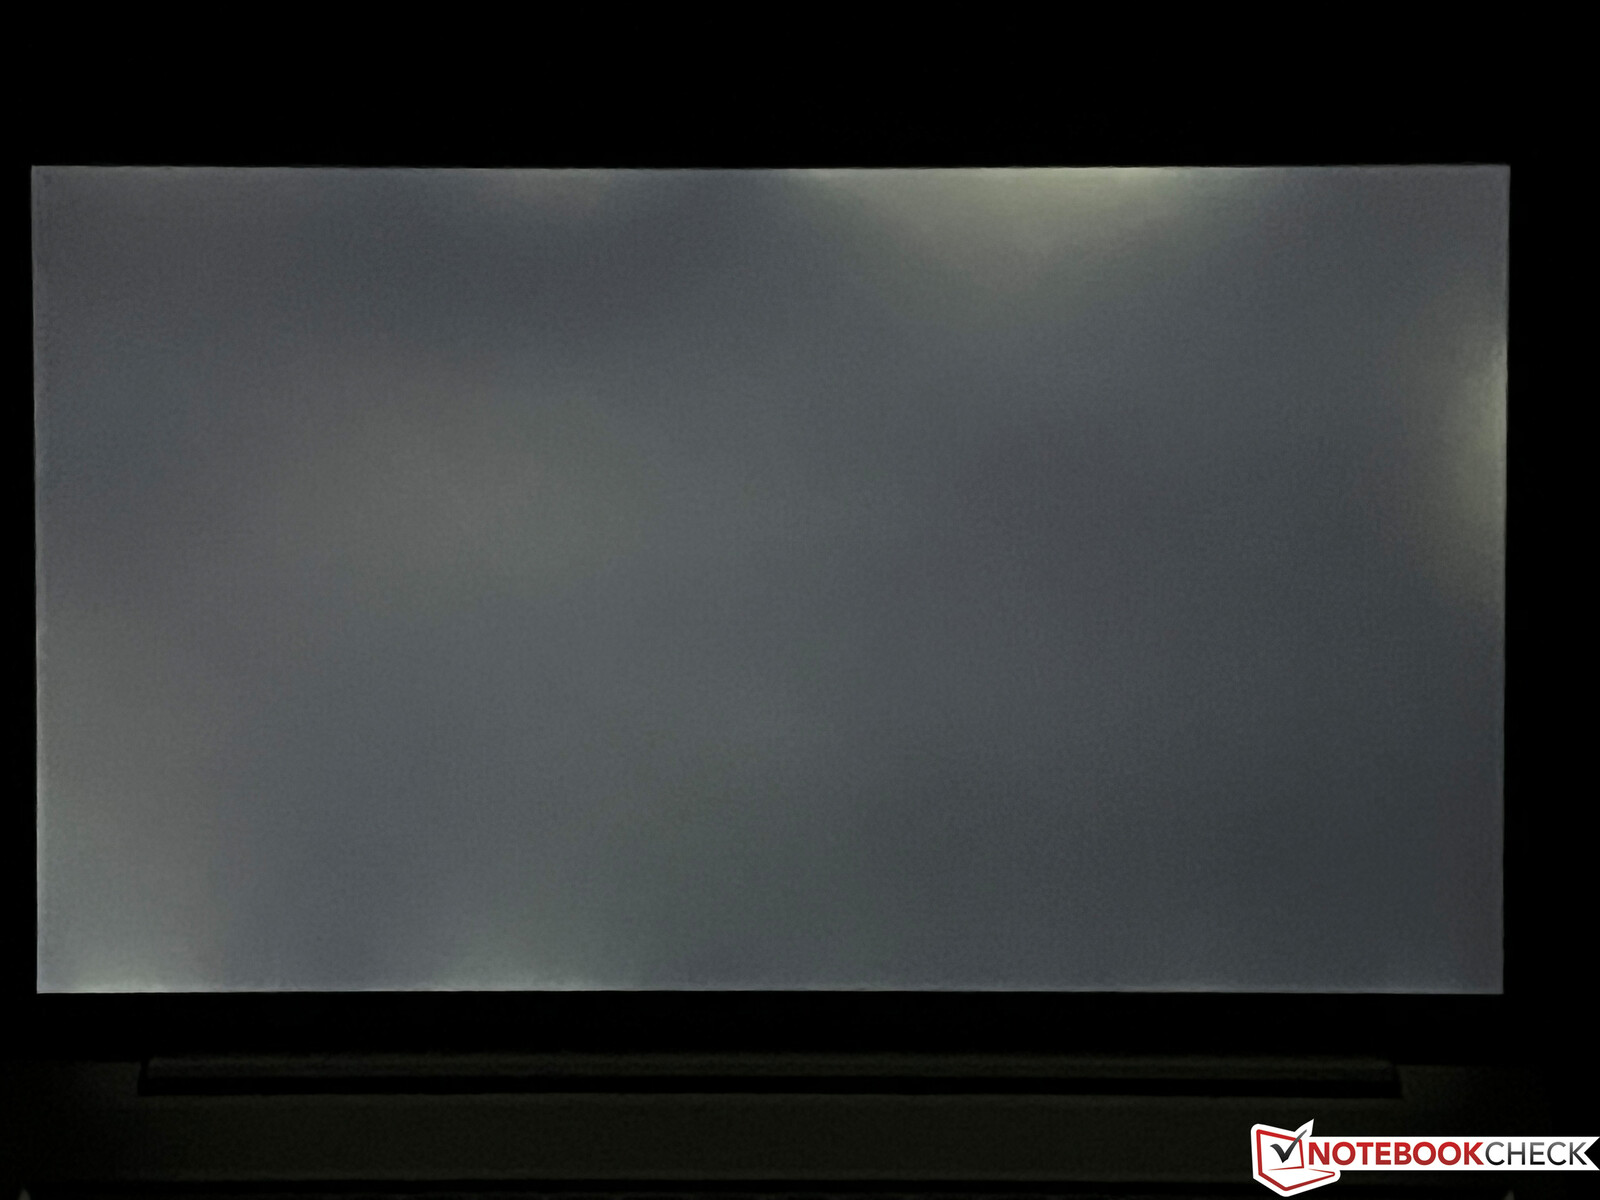
惠普宣传的亮度为400cd/m²,而我们的测试设备也达到了这个最高范围。同时,黑值非常低,为0.15,导致了一个非常好的对比度,超过2500:1。在全亮度和黑暗背景下,有一些明显的光晕。没有使用PWM。
| |||||||||||||||||||||||||
Brightness Distribution: 88 %
Center on Battery: 391 cd/m²
Contrast: 2613:1 (Black: 0.15 cd/m²)
ΔE ColorChecker Calman: 3.2 | ∀{0.5-29.43 Ø4.71}
calibrated: 1.2
ΔE Greyscale Calman: 4.9 | ∀{0.09-98 Ø4.96}
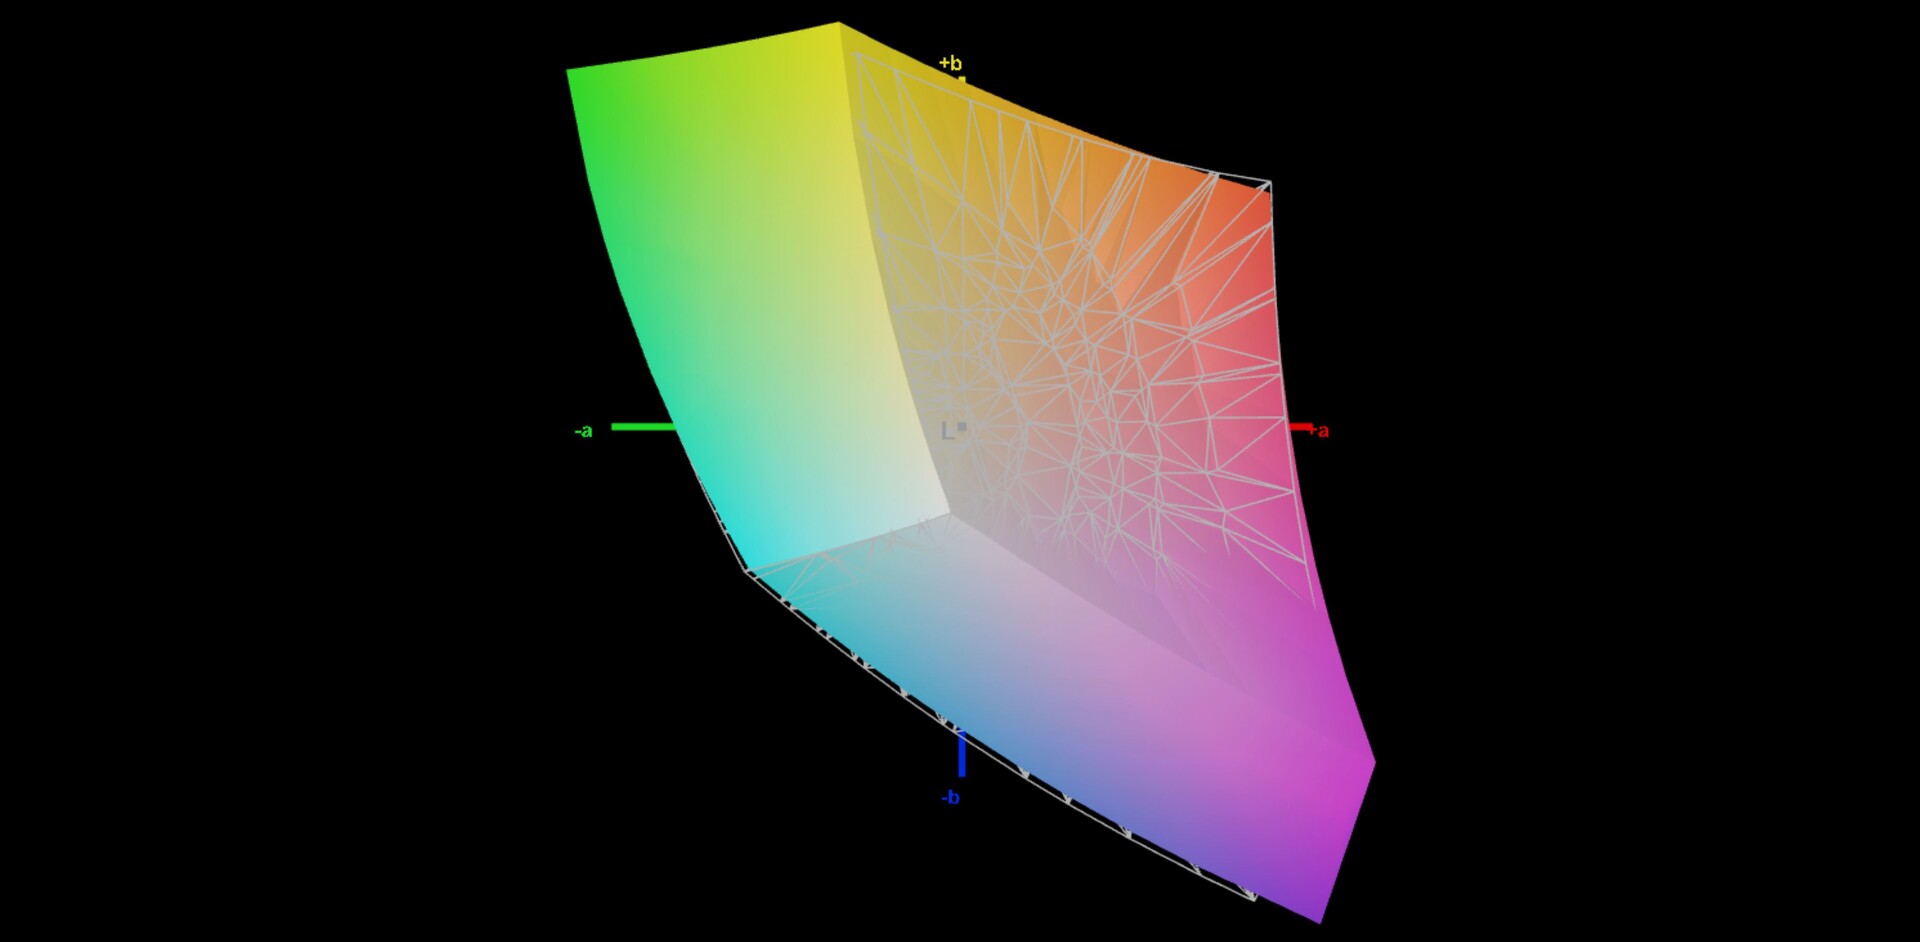
69.6% AdobeRGB 1998 (Argyll 3D)
97.7% sRGB (Argyll 3D)
69.1% Display P3 (Argyll 3D)
Gamma: 2.13
CCT: 5982 K
| HP ZBook Power 15 G9 6B8C4EA LGD073F, IPS, 3840x2160, 15.6" | HP ZBook Studio 16 G9 62U04EA BOE0A52, IPS, 3840x2400, 16" | Dell Precision 5000 5560 Sharp LQ156R1, IPS, 3840x2400, 15.6" | Lenovo ThinkPad P15v G2 21A9000XGE N156HCA-EAC, IPS LED, 1920x1080, 15.6" | HP ZBook Power 15 G8 313S5EA AUOA08B, IPS LED, 1920x1080, 15.6" | |
|---|---|---|---|---|---|
| Display | 22% | 28% | -35% | 2% | |
| Display P3 Coverage (%) | 69.1 | 97.5 41% | 94.9 37% | 43.7 -37% | 70.5 2% |
| sRGB Coverage (%) | 97.7 | 99.9 2% | 100 2% | 65.1 -33% | 99 1% |
| AdobeRGB 1998 Coverage (%) | 69.6 | 86.3 24% | 100 44% | 45.3 -35% | 71.3 2% |
| Response Times | 73% | -5% | -2% | -33% | |
| Response Time Grey 50% / Grey 80% * (ms) | 45.8 ? | 15.3 ? 67% | 47.2 ? -3% | 48 ? -5% | 61 -33% |
| Response Time Black / White * (ms) | 28.6 ? | 6.1 ? 79% | 30.4 ? -6% | 28 ? 2% | 38 ? -33% |
| PWM Frequency (Hz) | |||||
| Screen | 6% | -21% | -87% | 3% | |
| Brightness middle (cd/m²) | 392 | 554 41% | 501.5 28% | 305 -22% | 393 0% |
| Brightness (cd/m²) | 388 | 516 33% | 467 20% | 281 -28% | 385 -1% |
| Brightness Distribution (%) | 88 | 84 -5% | 83 -6% | 88 0% | 78 -11% |
| Black Level * (cd/m²) | 0.15 | 0.47 -213% | 0.44 -193% | 0.32 -113% | 0.25 -67% |
| Contrast (:1) | 2613 | 1179 -55% | 1140 -56% | 953 -64% | 1572 -40% |
| Colorchecker dE 2000 * | 3.2 | 1 69% | 4.73 -48% | 5.9 -84% | 1.5 53% |
| Colorchecker dE 2000 max. * | 7 | 2.4 66% | 8.45 -21% | 20.1 -187% | 4.3 39% |
| Colorchecker dE 2000 calibrated * | 1.2 | 0.6 50% | 0.51 57% | 4.5 -275% | 1.4 -17% |
| Greyscale dE 2000 * | 4.9 | 1.6 67% | 3.6 27% | 5.3 -8% | 1.3 73% |
| Gamma | 2.13 103% | 2.29 96% | 2.08 106% | 2.1 105% | 2.26 97% |
| CCT | 5982 109% | 6458 101% | 6447 101% | 6307 103% | 6435 101% |
| Total Average (Program / Settings) | 34% /
19% | 1% /
-8% | -41% /
-64% | -9% /
-2% |
* ... smaller is better
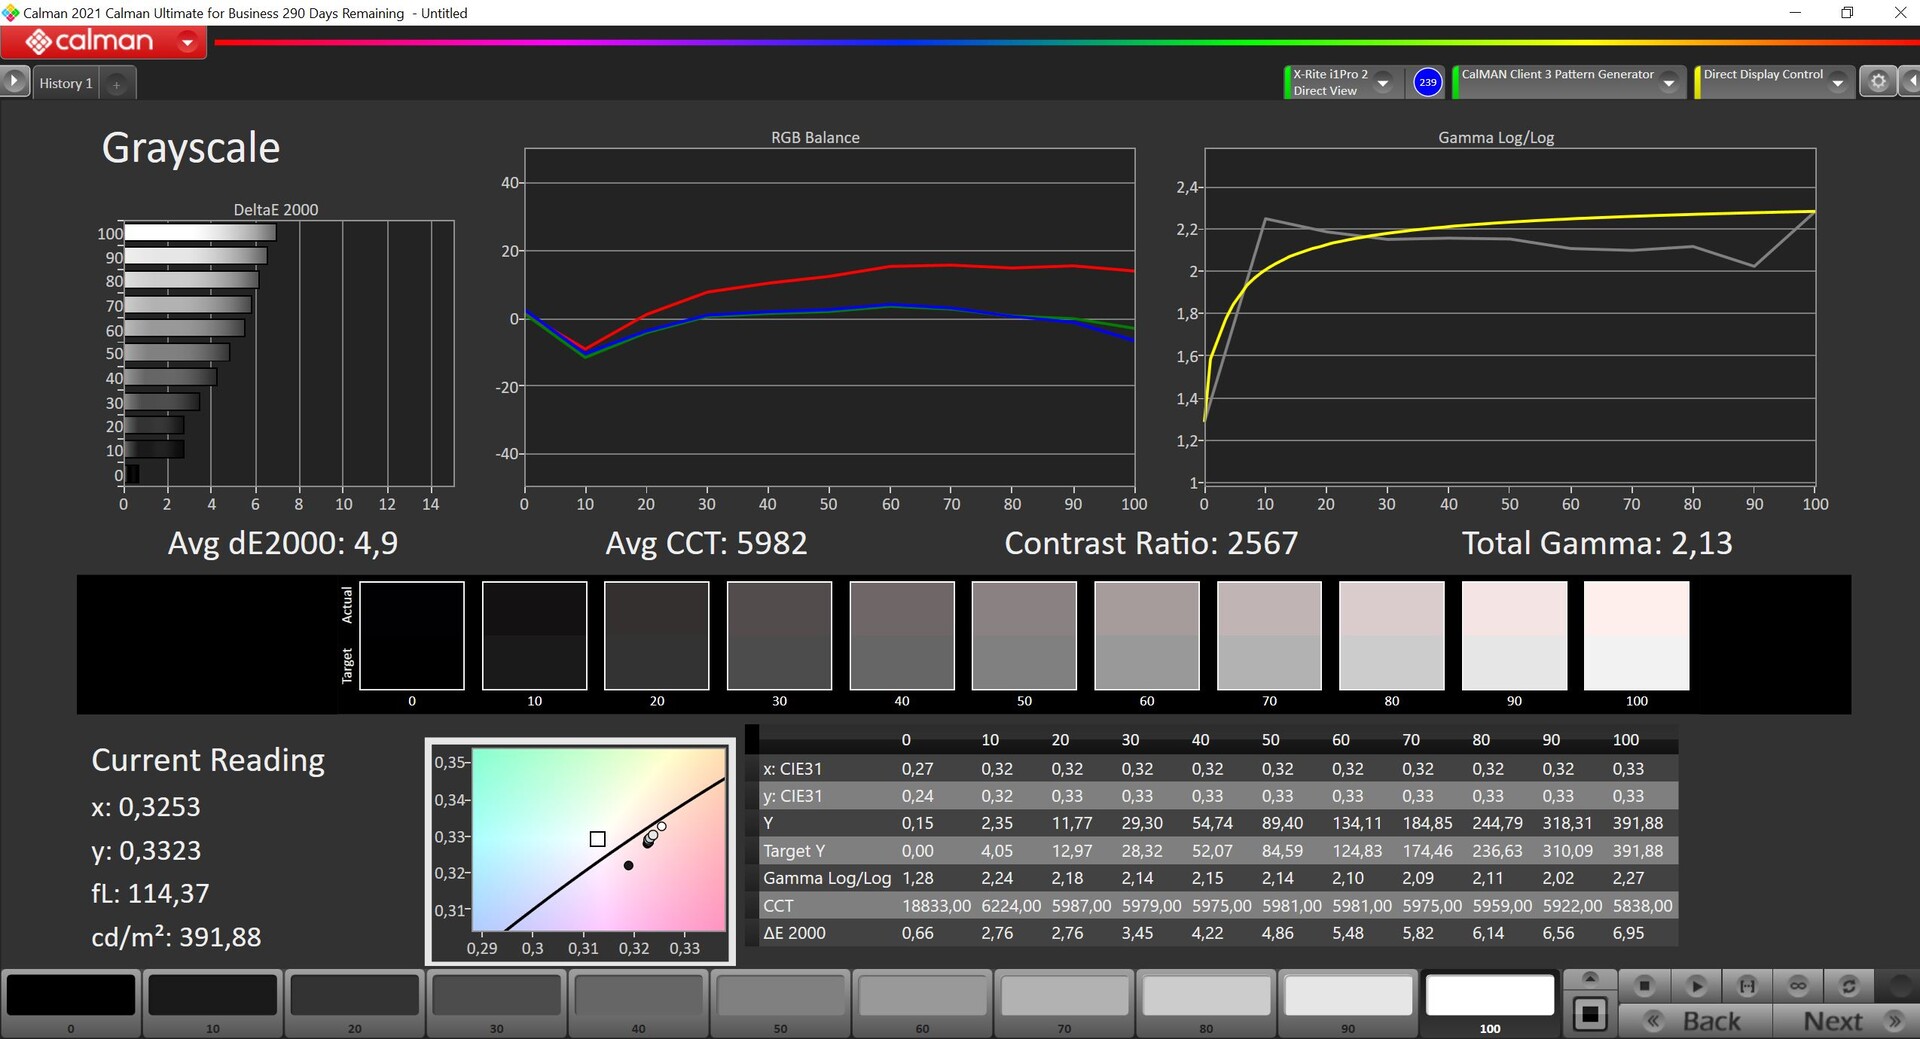
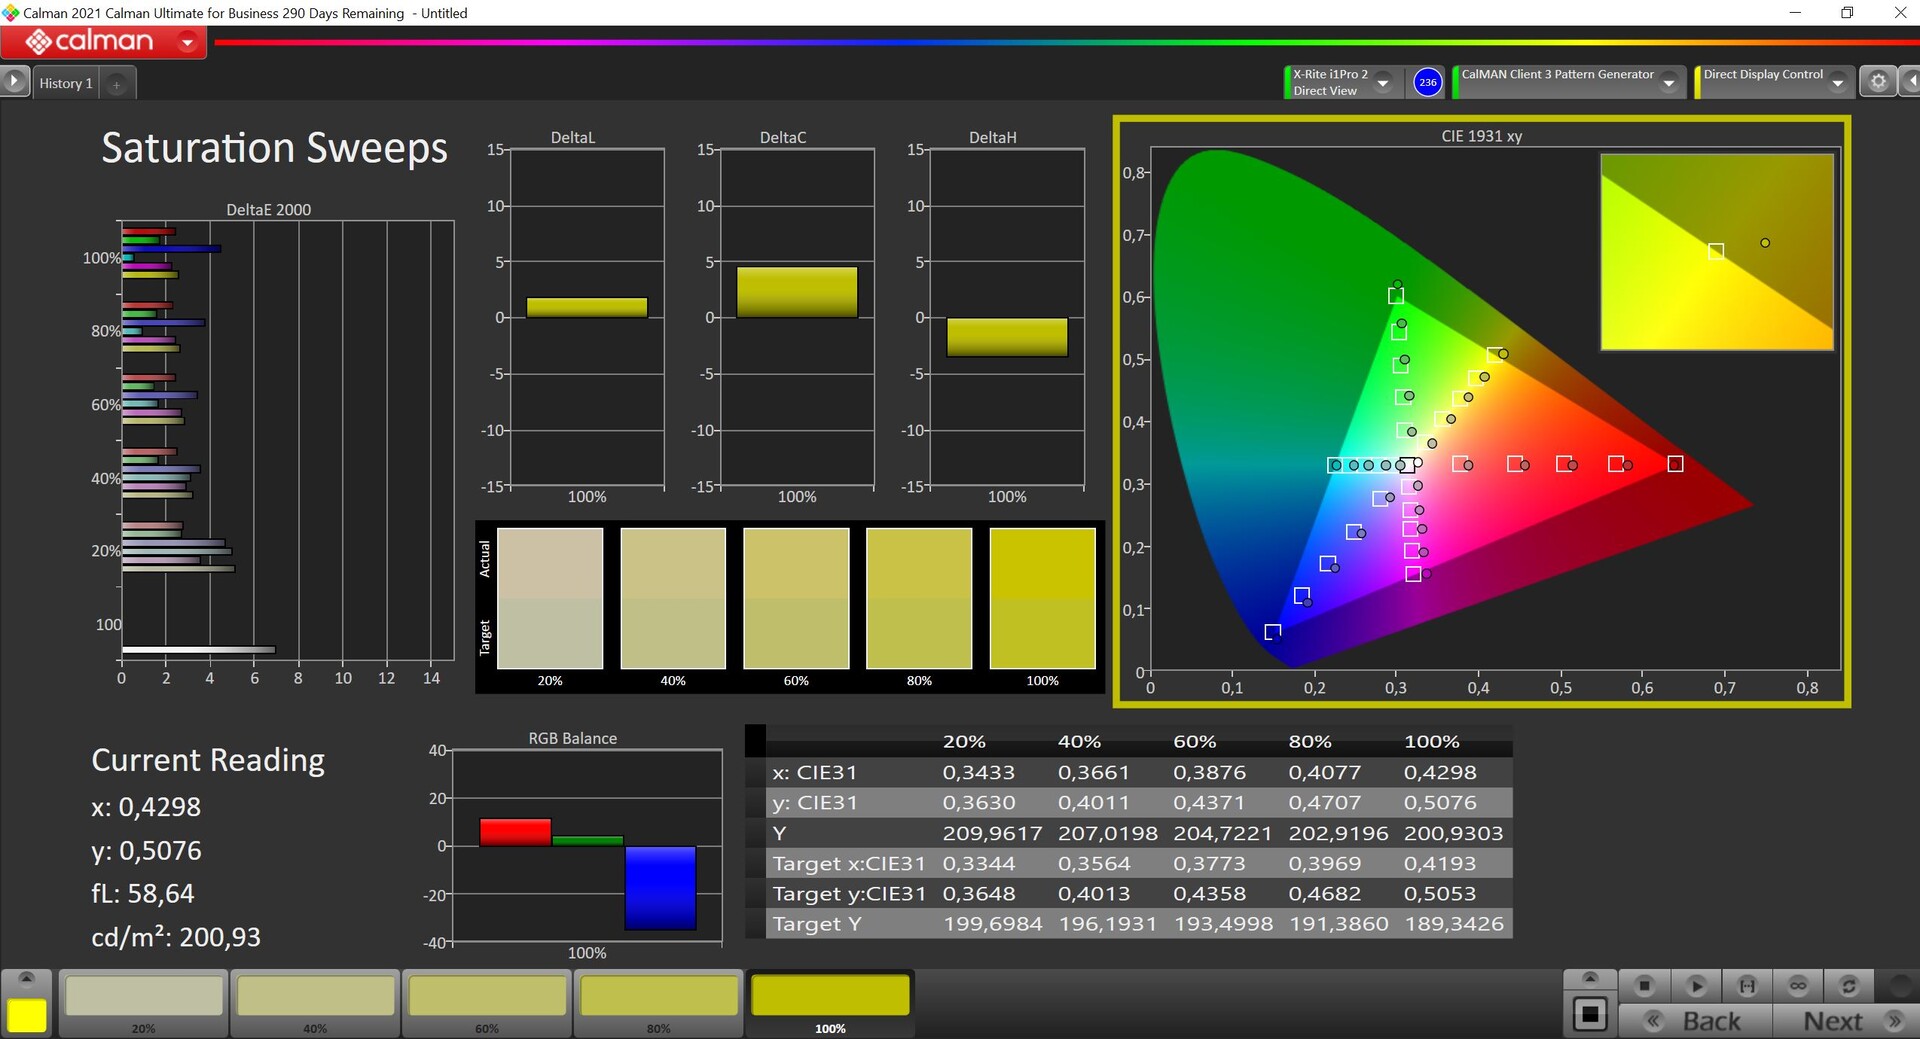
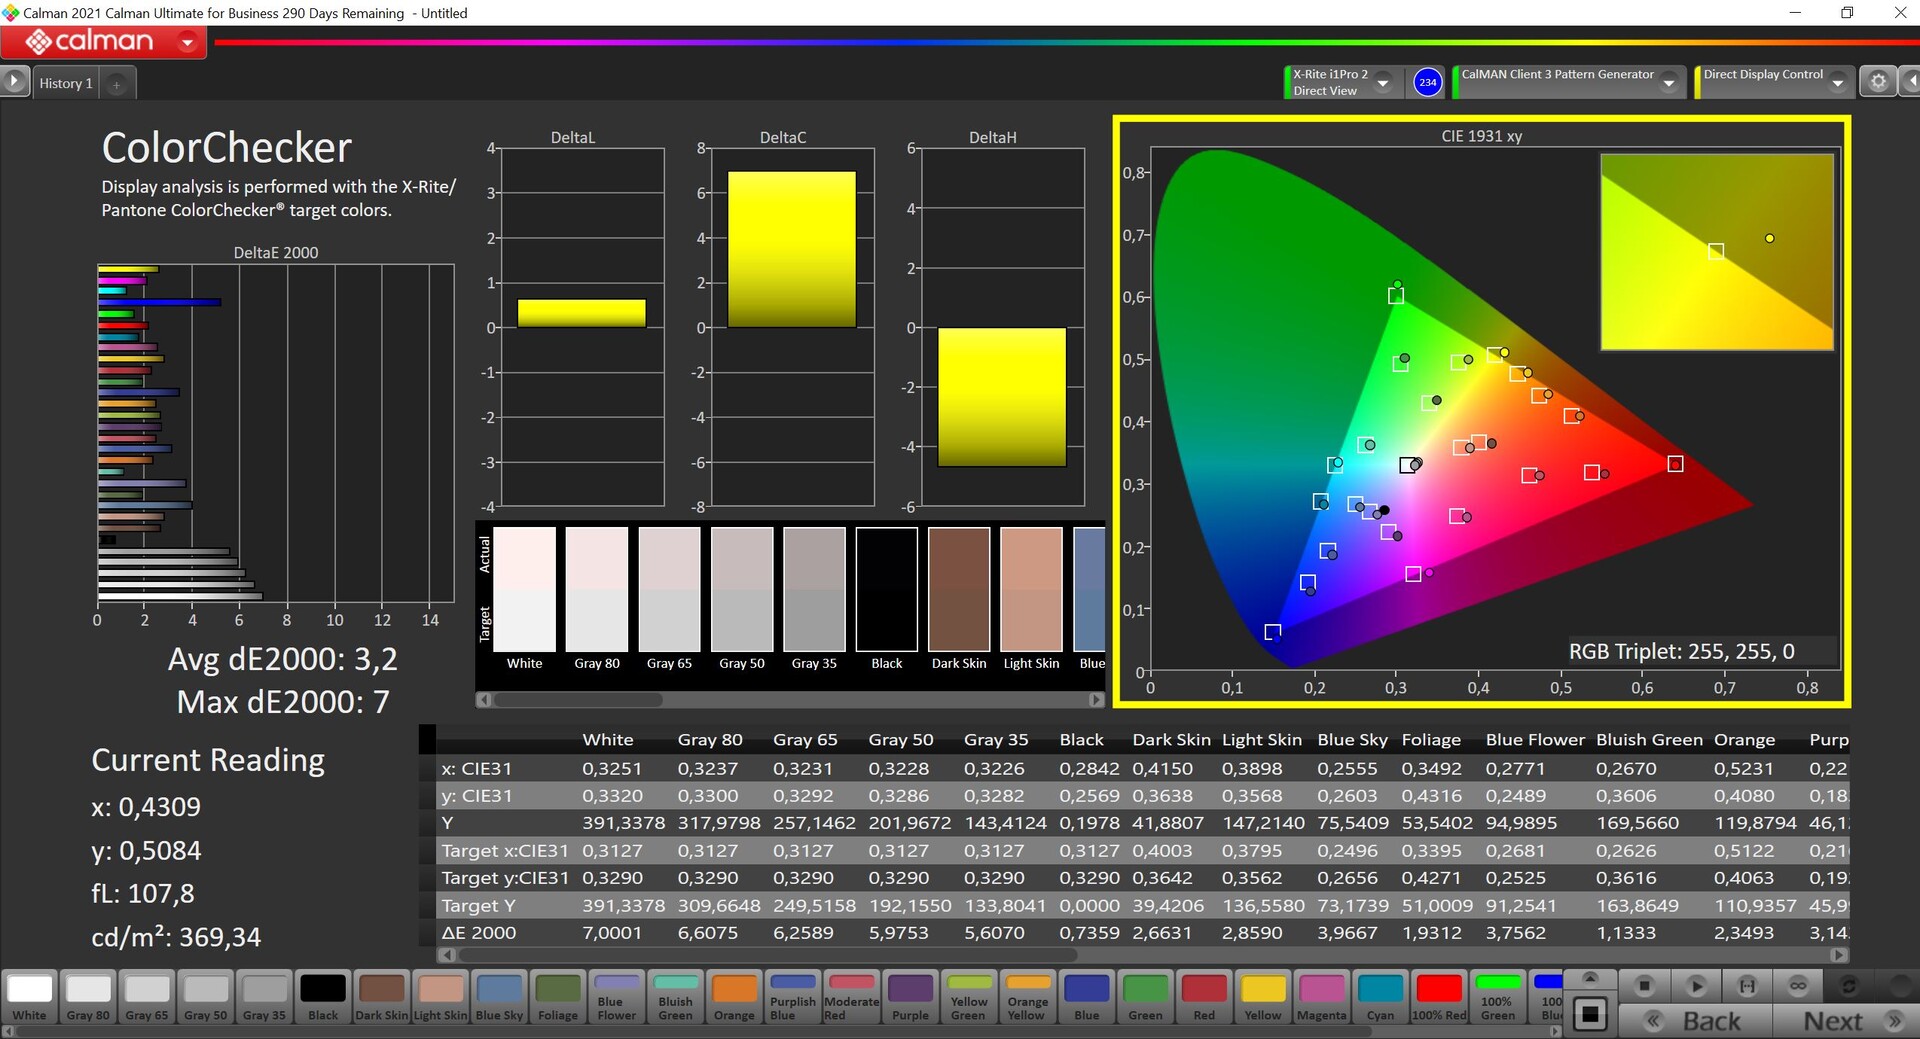
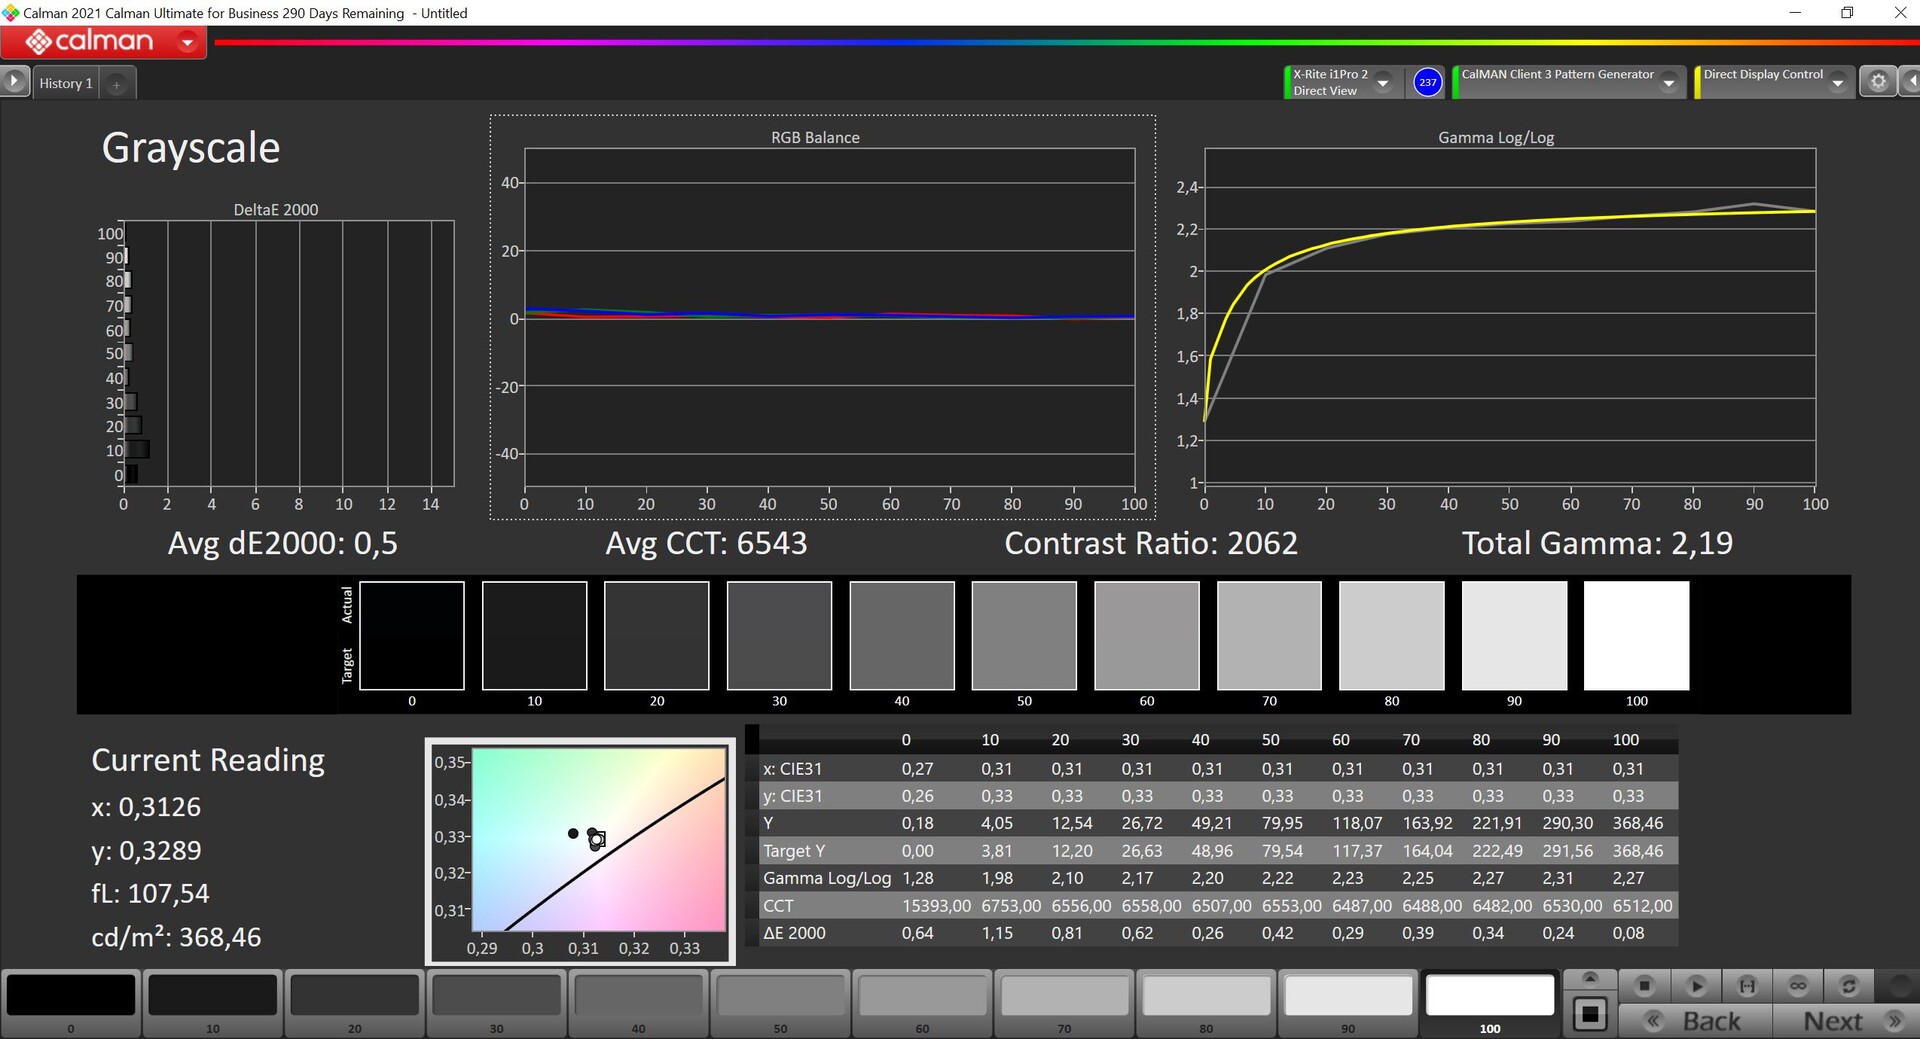
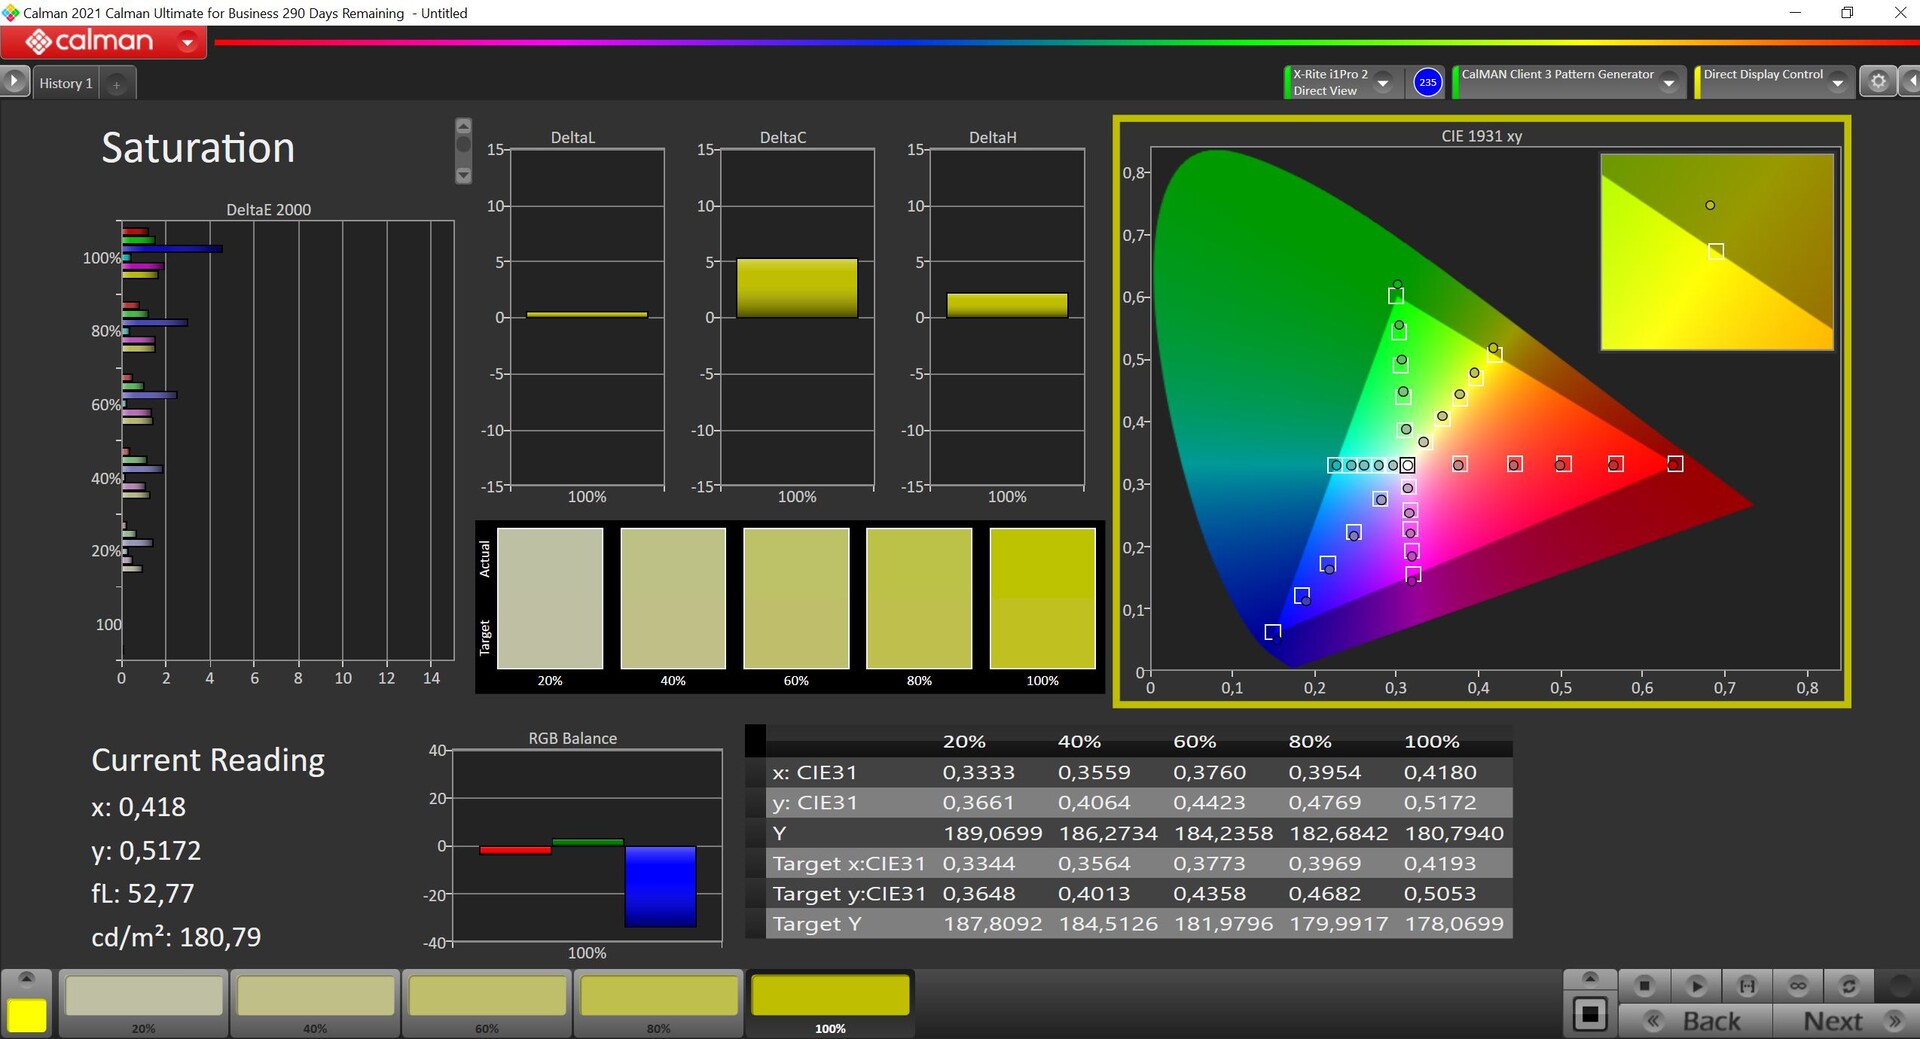
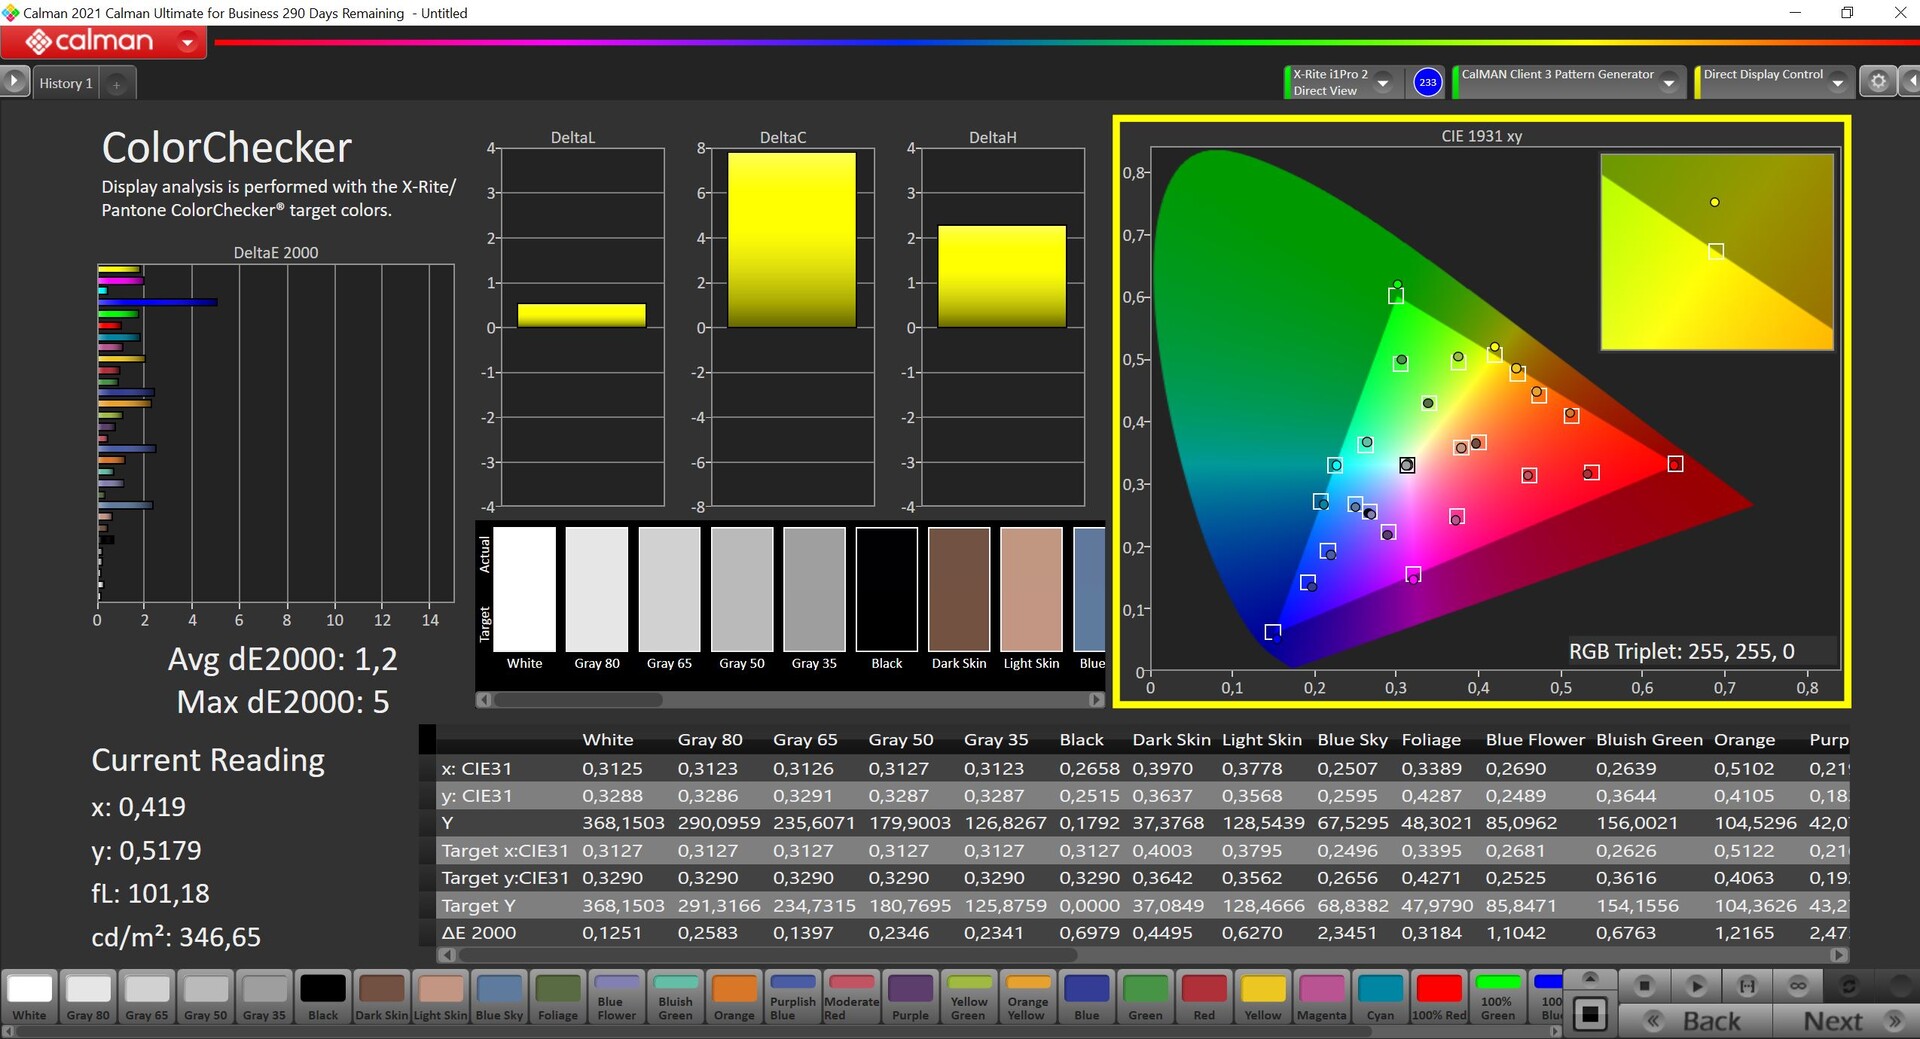
我们用专业的CalMAN软件测量面板。在交付状态下,有一个明显可见的红色色调,而且色温也过暖。这是不幸的,因为我们能够通过自己的校准(可从上面的链接免费下载颜色配置文件)显著改善显示效果,特别是在灰度方面导致出色的结果,并完全摆脱了颜色色调。与参考的sRGB色彩空间(已完全覆盖)相比,色彩偏差也略低,只剩下100%的蓝色作为异常值。然而,经过校准的面板仍然适合用于图像处理。
Display Response Times
| ↔ Response Time Black to White | ||
|---|---|---|
| 28.6 ms ... rise ↗ and fall ↘ combined | ↗ 14.5 ms rise | 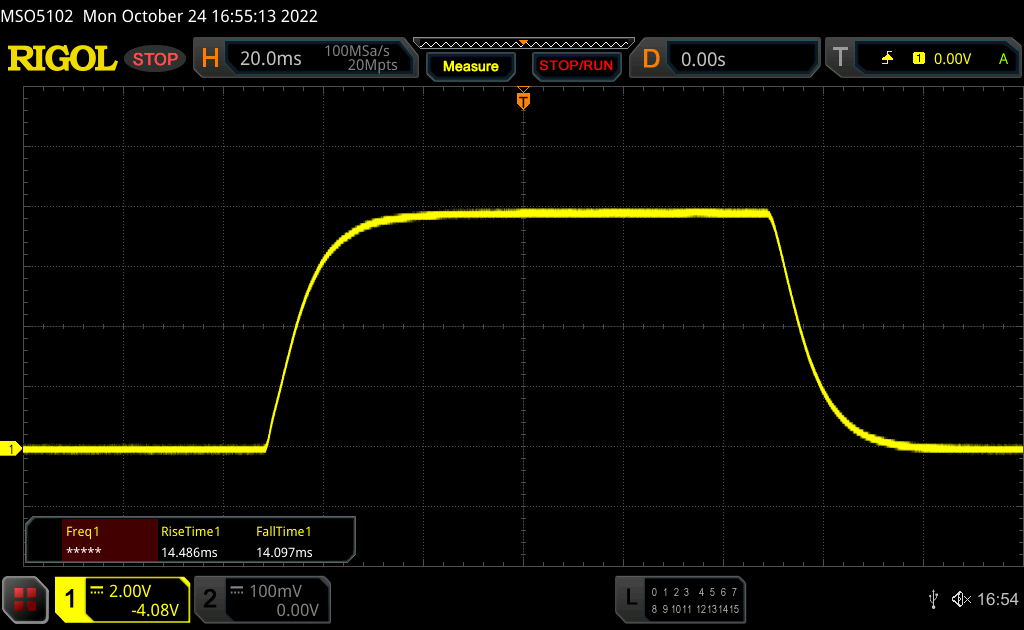 |
| ↘ 14.1 ms fall | ||
| The screen shows relatively slow response rates in our tests and may be too slow for gamers. In comparison, all tested devices range from 0.1 (minimum) to 240 (maximum) ms. » 76 % of all devices are better. This means that the measured response time is worse than the average of all tested devices (19.8 ms). | ||
| ↔ Response Time 50% Grey to 80% Grey | ||
| 45.8 ms ... rise ↗ and fall ↘ combined | ↗ 21.2 ms rise | 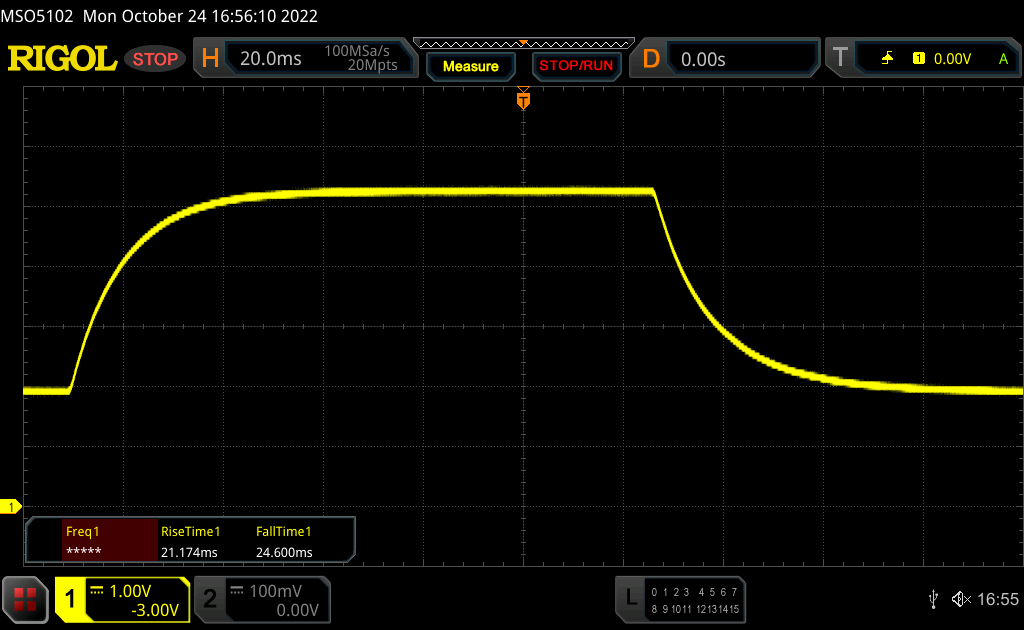 |
| ↘ 24.6 ms fall | ||
| The screen shows slow response rates in our tests and will be unsatisfactory for gamers. In comparison, all tested devices range from 0.165 (minimum) to 636 (maximum) ms. » 79 % of all devices are better. This means that the measured response time is worse than the average of all tested devices (31 ms). | ||
Screen Flickering / PWM (Pulse-Width Modulation)
| Screen flickering / PWM not detected |  | ||
In comparison: 52 % of all tested devices do not use PWM to dim the display. If PWM was detected, an average of 7754 (minimum: 5 - maximum: 343500) Hz was measured. | |||
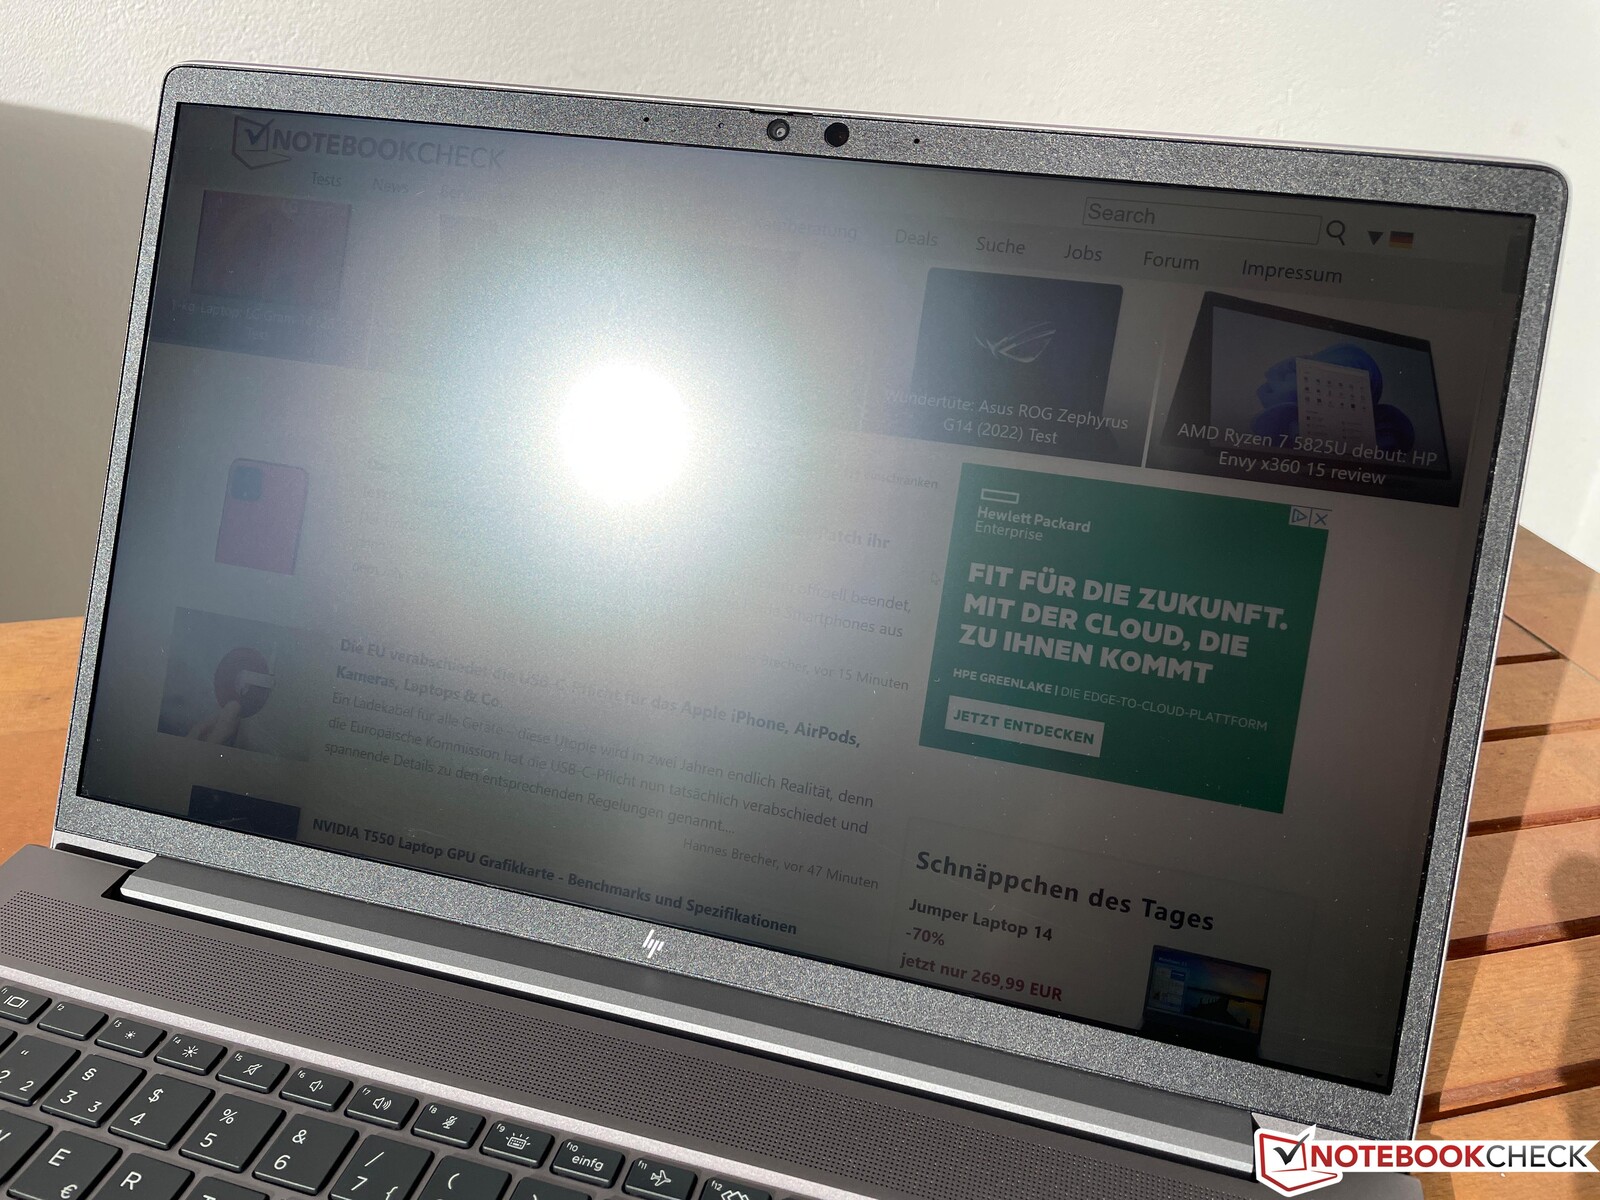
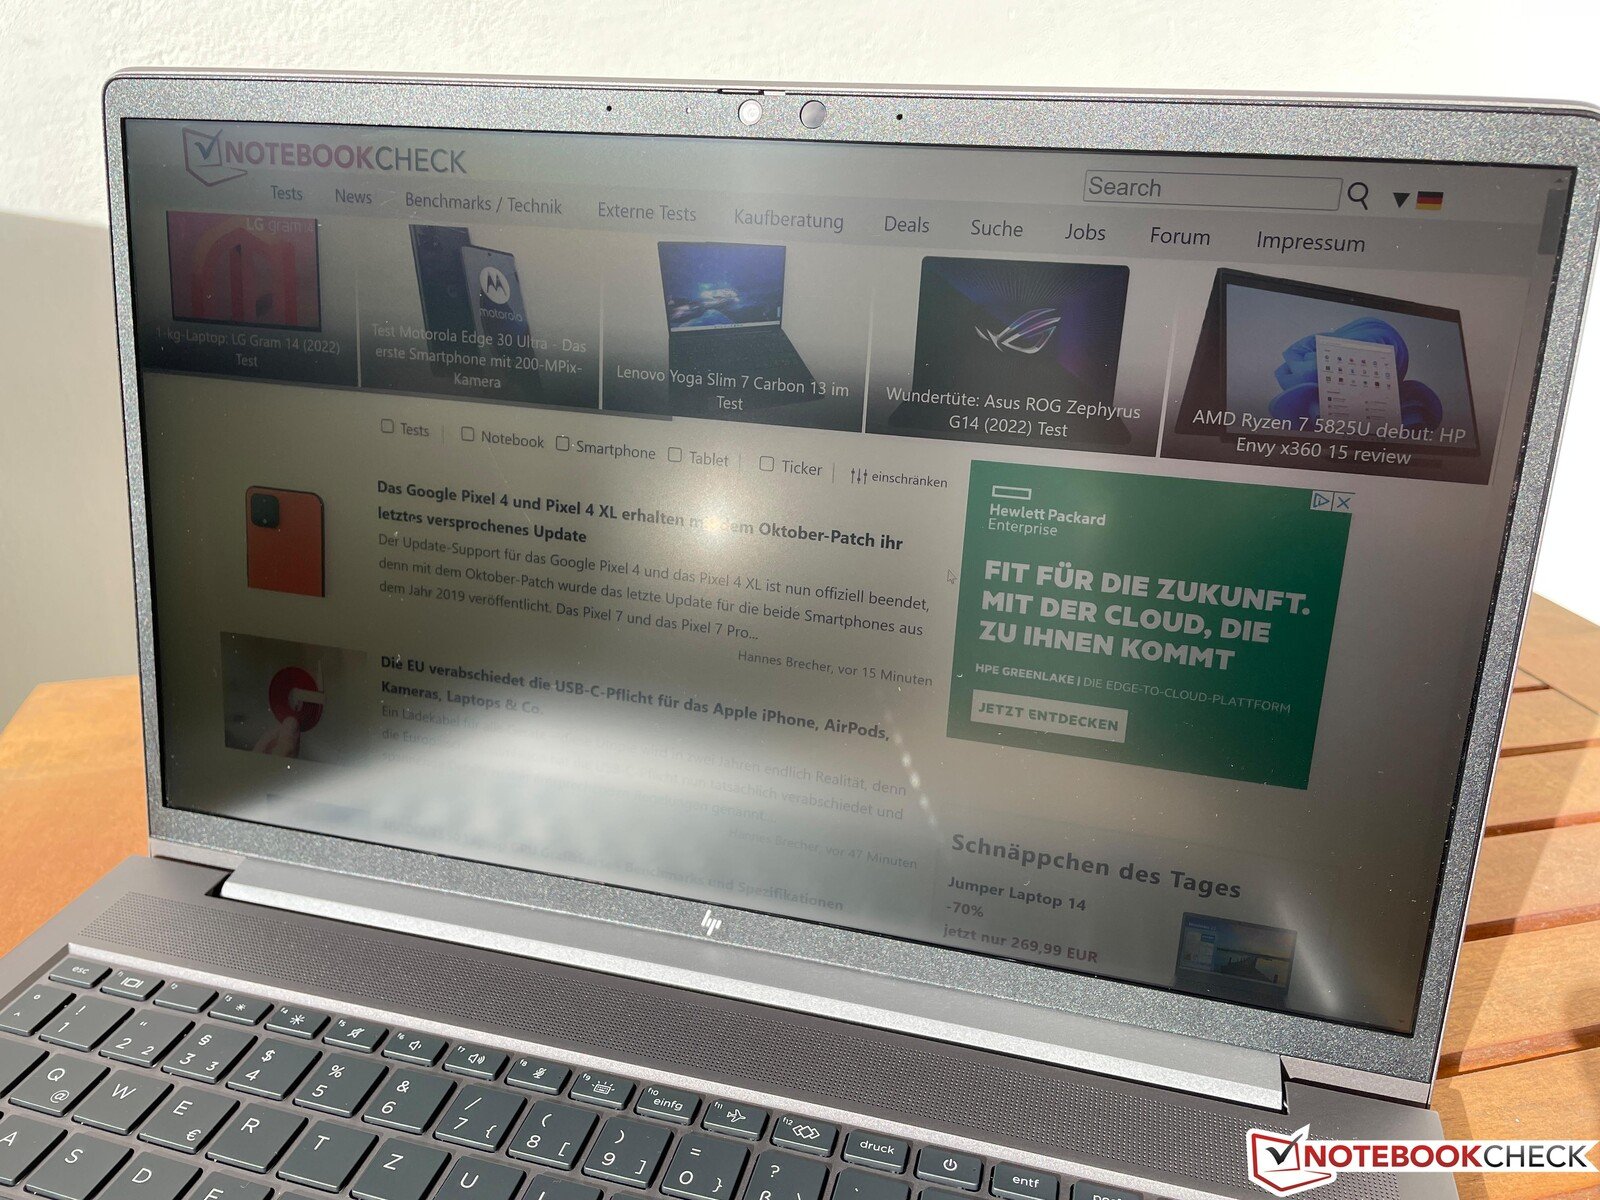
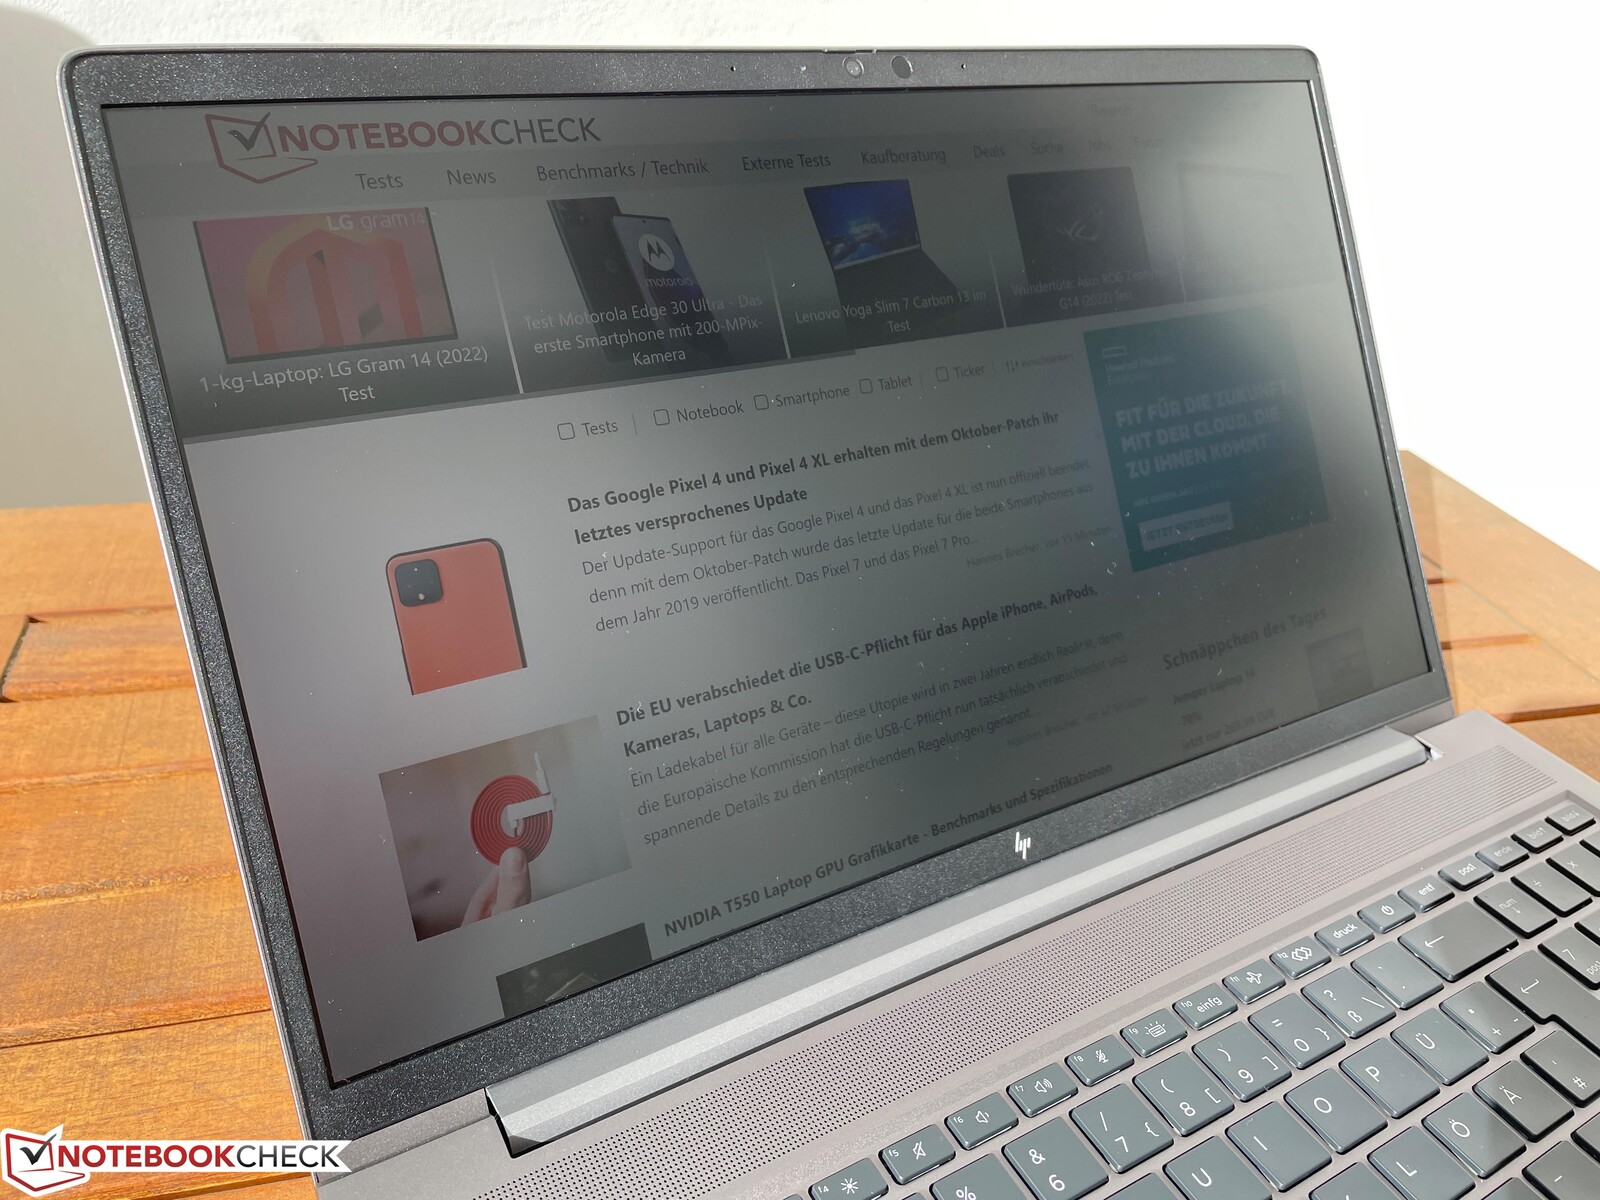
在户外,显示屏得益于磨砂表面,只要避免光源的直接反射,即使在明亮的日子里,你仍然可以轻松地识别显示内容。IPS面板的可视角度稳定性非常好。
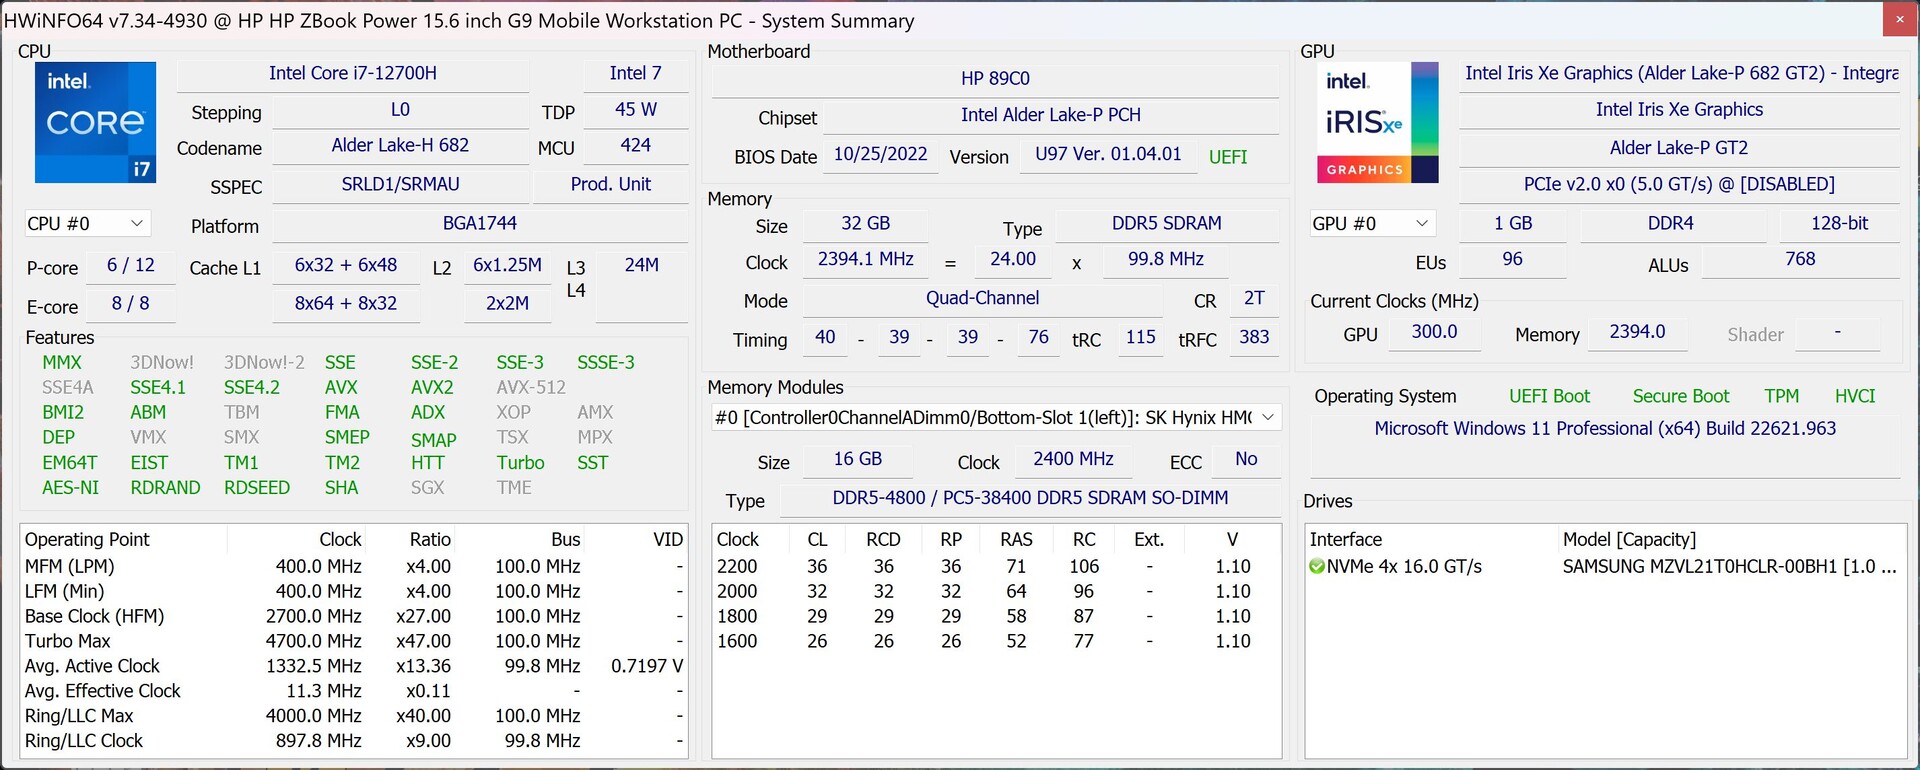
性能 - 配备英特尔Alder Lake的ZBook
测试条件
惠普并没有提供任何额外的电源配置选项。在测试中,我们能够观察到一些强烈变化的性能值。虽然通过一些BIOS的更新,情况略有改善,但仍不完全稳定。在105/75瓦的情况下,TDP值基本上被配置得很高,但是处理器最多只能在一秒钟内使用到90瓦,然后迅速平移到55瓦左右。有时,处理器甚至一开始就有这个数值(在以前的BIOS版本中,它甚至低于40瓦)。
处理器
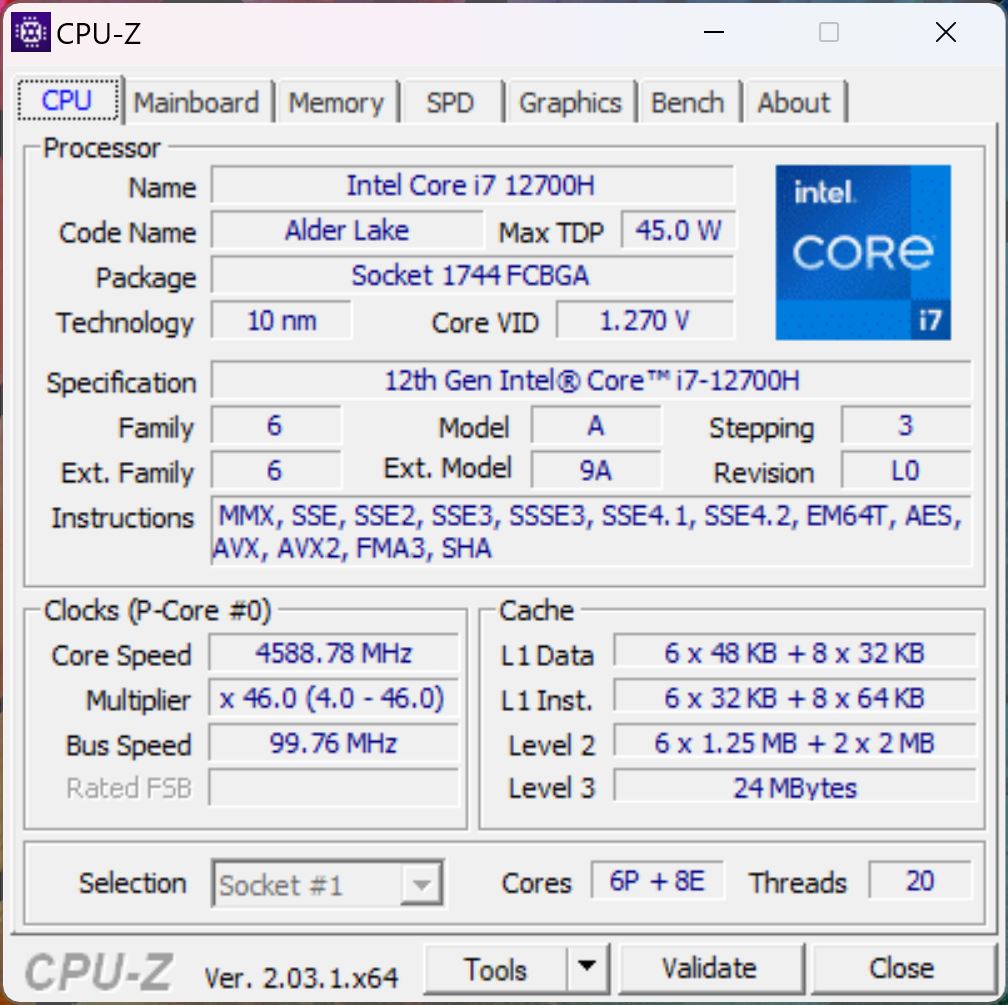
芯片酷睿i7-12700H来自英特尔目前的Alder Lake一代,结合了6个快速性能核心和8个效率核心。单核性能非常好,比上一代的酷睿i7-11800H快约15-20%。然而,在多核基准测试中,考虑到大机箱,性能略微令人失望,很多潜力仍未被利用。 例如,在ZBook Studio 16 G9在多核测试中,采用相同处理器的ZBook Studio 16 G9要快20%左右。我们还尝试手动提高TDP值,但冷却系统无法处理超过60-65瓦的功率,因为此时CPU温度将上升到95℃(203°F)以上。
在电池运行时,CPU的功耗被限制在30瓦。这对单核性能没有影响,但在多核测试中导致了约30%的性能下降(9926分CB R23 Multi)。你可以在我们的技术部分找到更多的CPU基准测试 我们的技术部分.
Cinebench R15 Multi Constant Load Test
Cinebench R23: Multi Core | Single Core
Cinebench R20: CPU (Multi Core) | CPU (Single Core)
Cinebench R15: CPU Multi 64Bit | CPU Single 64Bit
Blender: v2.79 BMW27 CPU
7-Zip 18.03: 7z b 4 | 7z b 4 -mmt1
Geekbench 5.5: Multi-Core | Single-Core
HWBOT x265 Benchmark v2.2: 4k Preset
LibreOffice : 20 Documents To PDF
R Benchmark 2.5: Overall mean
| CPU Performance rating | |
| Average of class Workstation | |
| HP ZBook Studio 16 G9 62U04EA | |
| Average Intel Core i7-12700H | |
| HP ZBook Power 15 G9 6B8C4EA | |
| HP ZBook Power 15 G8 313S5EA | |
| Dell Precision 5000 5560 -2! | |
| Lenovo ThinkPad P15v G2 21A9000XGE -1! | |
| Cinebench R23 / Multi Core | |
| Average of class Workstation (14621 - 38520, n=23, last 2 years) | |
| HP ZBook Studio 16 G9 62U04EA | |
| Average Intel Core i7-12700H (4032 - 19330, n=64) | |
| HP ZBook Power 15 G9 6B8C4EA | |
| HP ZBook Power 15 G8 313S5EA | |
| Lenovo ThinkPad P15v G2 21A9000XGE | |
| Dell Precision 5000 5560 | |
| Cinebench R23 / Single Core | |
| Average of class Workstation (1712 - 2228, n=23, last 2 years) | |
| HP ZBook Studio 16 G9 62U04EA | |
| HP ZBook Power 15 G9 6B8C4EA | |
| Average Intel Core i7-12700H (778 - 1826, n=63) | |
| HP ZBook Power 15 G8 313S5EA | |
| Dell Precision 5000 5560 | |
| Cinebench R20 / CPU (Multi Core) | |
| Average of class Workstation (5760 - 15043, n=23, last 2 years) | |
| HP ZBook Studio 16 G9 62U04EA | |
| Average Intel Core i7-12700H (1576 - 7407, n=64) | |
| HP ZBook Power 15 G9 6B8C4EA | |
| HP ZBook Power 15 G8 313S5EA | |
| Dell Precision 5000 5560 | |
| Lenovo ThinkPad P15v G2 21A9000XGE | |
| Cinebench R20 / CPU (Single Core) | |
| Average of class Workstation (671 - 857, n=23, last 2 years) | |
| HP ZBook Studio 16 G9 62U04EA | |
| HP ZBook Power 15 G9 6B8C4EA | |
| Average Intel Core i7-12700H (300 - 704, n=64) | |
| HP ZBook Power 15 G8 313S5EA | |
| Dell Precision 5000 5560 | |
| Lenovo ThinkPad P15v G2 21A9000XGE | |
| Cinebench R15 / CPU Multi 64Bit | |
| Average of class Workstation (2489 - 5810, n=23, last 2 years) | |
| HP ZBook Studio 16 G9 62U04EA | |
| Average Intel Core i7-12700H (1379 - 2916, n=70) | |
| HP ZBook Power 15 G8 313S5EA | |
| HP ZBook Power 15 G8 313S5EA | |
| HP ZBook Power 15 G9 6B8C4EA | |
| Lenovo ThinkPad P15v G2 21A9000XGE | |
| Dell Precision 5000 5560 | |
| Cinebench R15 / CPU Single 64Bit | |
| Average of class Workstation (191.4 - 328, n=23, last 2 years) | |
| HP ZBook Studio 16 G9 62U04EA | |
| Average Intel Core i7-12700H (113 - 263, n=65) | |
| HP ZBook Power 15 G9 6B8C4EA | |
| Dell Precision 5000 5560 | |
| HP ZBook Power 15 G8 313S5EA | |
| Lenovo ThinkPad P15v G2 21A9000XGE | |
| Blender / v2.79 BMW27 CPU | |
| Lenovo ThinkPad P15v G2 21A9000XGE | |
| Dell Precision 5000 5560 | |
| HP ZBook Power 15 G8 313S5EA | |
| HP ZBook Power 15 G9 6B8C4EA | |
| Average Intel Core i7-12700H (168 - 732, n=63) | |
| HP ZBook Studio 16 G9 62U04EA | |
| Average of class Workstation (91 - 222, n=23, last 2 years) | |
| 7-Zip 18.03 / 7z b 4 | |
| Average of class Workstation (60489 - 116969, n=23, last 2 years) | |
| HP ZBook Studio 16 G9 62U04EA | |
| Average Intel Core i7-12700H (22844 - 73067, n=63) | |
| HP ZBook Power 15 G9 6B8C4EA | |
| HP ZBook Power 15 G8 313S5EA | |
| Dell Precision 5000 5560 | |
| Lenovo ThinkPad P15v G2 21A9000XGE | |
| 7-Zip 18.03 / 7z b 4 -mmt1 | |
| Average of class Workstation (5126 - 6960, n=23, last 2 years) | |
| HP ZBook Studio 16 G9 62U04EA | |
| HP ZBook Power 15 G9 6B8C4EA | |
| Dell Precision 5000 5560 | |
| HP ZBook Power 15 G8 313S5EA | |
| Average Intel Core i7-12700H (2743 - 5972, n=63) | |
| Lenovo ThinkPad P15v G2 21A9000XGE | |
| Geekbench 5.5 / Multi-Core | |
| Average of class Workstation (11542 - 25554, n=23, last 2 years) | |
| HP ZBook Studio 16 G9 62U04EA | |
| HP ZBook Power 15 G9 6B8C4EA | |
| Average Intel Core i7-12700H (5144 - 13745, n=64) | |
| HP ZBook Power 15 G8 313S5EA | |
| Lenovo ThinkPad P15v G2 21A9000XGE | |
| Geekbench 5.5 / Single-Core | |
| Average of class Workstation (1783 - 2183, n=23, last 2 years) | |
| HP ZBook Studio 16 G9 62U04EA | |
| Average Intel Core i7-12700H (803 - 1851, n=64) | |
| HP ZBook Power 15 G9 6B8C4EA | |
| HP ZBook Power 15 G8 313S5EA | |
| Lenovo ThinkPad P15v G2 21A9000XGE | |
| HWBOT x265 Benchmark v2.2 / 4k Preset | |
| Average of class Workstation (17.8 - 40.5, n=23, last 2 years) | |
| HP ZBook Studio 16 G9 62U04EA | |
| Average Intel Core i7-12700H (4.67 - 21.8, n=64) | |
| HP ZBook Power 15 G9 6B8C4EA | |
| HP ZBook Power 15 G8 313S5EA | |
| Dell Precision 5000 5560 | |
| Lenovo ThinkPad P15v G2 21A9000XGE | |
| LibreOffice / 20 Documents To PDF | |
| Lenovo ThinkPad P15v G2 21A9000XGE | |
| Dell Precision 5000 5560 | |
| Average of class Workstation (37.1 - 74.7, n=23, last 2 years) | |
| Average Intel Core i7-12700H (34.2 - 95.3, n=63) | |
| HP ZBook Power 15 G9 6B8C4EA | |
| HP ZBook Studio 16 G9 62U04EA | |
| HP ZBook Power 15 G8 313S5EA | |
| R Benchmark 2.5 / Overall mean | |
| HP ZBook Power 15 G8 313S5EA | |
| Lenovo ThinkPad P15v G2 21A9000XGE | |
| Dell Precision 5000 5560 | |
| HP ZBook Power 15 G9 6B8C4EA | |
| Average Intel Core i7-12700H (0.4441 - 1.052, n=63) | |
| HP ZBook Studio 16 G9 62U04EA | |
| Average of class Workstation (0.3825 - 0.603, n=23, last 2 years) | |
* ... smaller is better
AIDA64: FP32 Ray-Trace | FPU Julia | CPU SHA3 | CPU Queen | FPU SinJulia | FPU Mandel | CPU AES | CPU ZLib | FP64 Ray-Trace | CPU PhotoWorxx
| Performance rating | |
| Average of class Workstation | |
| HP ZBook Studio 16 G9 62U04EA | |
| HP ZBook Power 15 G9 6B8C4EA | |
| HP ZBook Power 15 G8 313S5EA | |
| Average Intel Core i7-12700H | |
| Lenovo ThinkPad P15v G2 21A9000XGE | |
| Dell Precision 5000 5560 -9! | |
| AIDA64 / FP32 Ray-Trace | |
| Average of class Workstation (16730 - 61611, n=23, last 2 years) | |
| HP ZBook Studio 16 G9 62U04EA | |
| HP ZBook Power 15 G8 313S5EA | |
| HP ZBook Power 15 G9 6B8C4EA | |
| Lenovo ThinkPad P15v G2 21A9000XGE | |
| Average Intel Core i7-12700H (2585 - 17957, n=64) | |
| AIDA64 / FPU Julia | |
| Average of class Workstation (89597 - 186971, n=23, last 2 years) | |
| HP ZBook Studio 16 G9 62U04EA | |
| HP ZBook Power 15 G9 6B8C4EA | |
| HP ZBook Power 15 G8 313S5EA | |
| Average Intel Core i7-12700H (12439 - 90760, n=64) | |
| Lenovo ThinkPad P15v G2 21A9000XGE | |
| AIDA64 / CPU SHA3 | |
| Average of class Workstation (4178 - 8975, n=23, last 2 years) | |
| HP ZBook Power 15 G8 313S5EA | |
| HP ZBook Studio 16 G9 62U04EA | |
| Lenovo ThinkPad P15v G2 21A9000XGE | |
| HP ZBook Power 15 G9 6B8C4EA | |
| Average Intel Core i7-12700H (833 - 4242, n=64) | |
| AIDA64 / CPU Queen | |
| Average of class Workstation (60778 - 144411, n=23, last 2 years) | |
| HP ZBook Studio 16 G9 62U04EA | |
| HP ZBook Power 15 G9 6B8C4EA | |
| Average Intel Core i7-12700H (57923 - 103202, n=63) | |
| HP ZBook Power 15 G8 313S5EA | |
| Lenovo ThinkPad P15v G2 21A9000XGE | |
| AIDA64 / FPU SinJulia | |
| Average of class Workstation (8165 - 29343, n=23, last 2 years) | |
| HP ZBook Power 15 G8 313S5EA | |
| HP ZBook Studio 16 G9 62U04EA | |
| Average Intel Core i7-12700H (3249 - 9939, n=64) | |
| Lenovo ThinkPad P15v G2 21A9000XGE | |
| HP ZBook Power 15 G9 6B8C4EA | |
| AIDA64 / FPU Mandel | |
| Average of class Workstation (44497 - 98153, n=23, last 2 years) | |
| HP ZBook Studio 16 G9 62U04EA | |
| HP ZBook Power 15 G8 313S5EA | |
| HP ZBook Power 15 G9 6B8C4EA | |
| Lenovo ThinkPad P15v G2 21A9000XGE | |
| Average Intel Core i7-12700H (7135 - 44760, n=64) | |
| AIDA64 / CPU AES | |
| Average of class Workstation (73133 - 187841, n=23, last 2 years) | |
| Average Intel Core i7-12700H (31839 - 144360, n=64) | |
| HP ZBook Power 15 G8 313S5EA | |
| Lenovo ThinkPad P15v G2 21A9000XGE | |
| HP ZBook Studio 16 G9 62U04EA | |
| HP ZBook Power 15 G9 6B8C4EA | |
| AIDA64 / CPU ZLib | |
| Average of class Workstation (929 - 2148, n=23, last 2 years) | |
| HP ZBook Studio 16 G9 62U04EA | |
| Average Intel Core i7-12700H (305 - 1171, n=64) | |
| HP ZBook Power 15 G9 6B8C4EA | |
| HP ZBook Power 15 G8 313S5EA | |
| Lenovo ThinkPad P15v G2 21A9000XGE | |
| Dell Precision 5000 5560 | |
| AIDA64 / FP64 Ray-Trace | |
| Average of class Workstation (8545 - 32891, n=23, last 2 years) | |
| HP ZBook Studio 16 G9 62U04EA | |
| HP ZBook Power 15 G8 313S5EA | |
| HP ZBook Power 15 G9 6B8C4EA | |
| Lenovo ThinkPad P15v G2 21A9000XGE | |
| Average Intel Core i7-12700H (1437 - 9692, n=64) | |
| AIDA64 / CPU PhotoWorxx | |
| Average of class Workstation (37151 - 93684, n=23, last 2 years) | |
| HP ZBook Power 15 G9 6B8C4EA | |
| HP ZBook Studio 16 G9 62U04EA | |
| Average Intel Core i7-12700H (12863 - 52207, n=64) | |
| HP ZBook Power 15 G8 313S5EA | |
| Lenovo ThinkPad P15v G2 21A9000XGE | |
系统性能
ZBook Power 15 G9是一个反应非常快的设备,我们在测试中没有遇到任何问题。合成基准测试结果也非常好,证实了我们对其性能的主观印象。
CrossMark: Overall | Productivity | Creativity | Responsiveness
| PCMark 10 / Score | |
| Average of class Workstation (6563 - 10409, n=19, last 2 years) | |
| Dell Precision 5000 5560 | |
| HP ZBook Studio 16 G9 62U04EA | |
| HP ZBook Power 15 G9 6B8C4EA | |
| Average Intel Core i7-12700H, NVIDIA RTX A2000 Laptop GPU (n=1) | |
| Lenovo ThinkPad P15v G2 21A9000XGE | |
| HP ZBook Power 15 G8 313S5EA | |
| PCMark 10 / Essentials | |
| Dell Precision 5000 5560 | |
| Average of class Workstation (9622 - 11157, n=19, last 2 years) | |
| HP ZBook Power 15 G9 6B8C4EA | |
| Average Intel Core i7-12700H, NVIDIA RTX A2000 Laptop GPU (n=1) | |
| Lenovo ThinkPad P15v G2 21A9000XGE | |
| HP ZBook Studio 16 G9 62U04EA | |
| HP ZBook Power 15 G8 313S5EA | |
| PCMark 10 / Productivity | |
| Average of class Workstation (8789 - 20616, n=19, last 2 years) | |
| Dell Precision 5000 5560 | |
| Lenovo ThinkPad P15v G2 21A9000XGE | |
| HP ZBook Studio 16 G9 62U04EA | |
| HP ZBook Power 15 G9 6B8C4EA | |
| Average Intel Core i7-12700H, NVIDIA RTX A2000 Laptop GPU (n=1) | |
| HP ZBook Power 15 G8 313S5EA | |
| PCMark 10 / Digital Content Creation | |
| Average of class Workstation (8108 - 15631, n=19, last 2 years) | |
| HP ZBook Studio 16 G9 62U04EA | |
| HP ZBook Power 15 G9 6B8C4EA | |
| Average Intel Core i7-12700H, NVIDIA RTX A2000 Laptop GPU (n=1) | |
| Dell Precision 5000 5560 | |
| Lenovo ThinkPad P15v G2 21A9000XGE | |
| HP ZBook Power 15 G8 313S5EA | |
| CrossMark / Overall | |
| Average of class Workstation (1307 - 2267, n=22, last 2 years) | |
| HP ZBook Studio 16 G9 62U04EA | |
| HP ZBook Power 15 G9 6B8C4EA | |
| Average Intel Core i7-12700H, NVIDIA RTX A2000 Laptop GPU (n=1) | |
| HP ZBook Power 15 G8 313S5EA | |
| Lenovo ThinkPad P15v G2 21A9000XGE | |
| CrossMark / Productivity | |
| Average of class Workstation (1130 - 2122, n=22, last 2 years) | |
| HP ZBook Studio 16 G9 62U04EA | |
| HP ZBook Power 15 G9 6B8C4EA | |
| Average Intel Core i7-12700H, NVIDIA RTX A2000 Laptop GPU (n=1) | |
| HP ZBook Power 15 G8 313S5EA | |
| Lenovo ThinkPad P15v G2 21A9000XGE | |
| CrossMark / Creativity | |
| Average of class Workstation (1657 - 2725, n=22, last 2 years) | |
| HP ZBook Studio 16 G9 62U04EA | |
| HP ZBook Power 15 G9 6B8C4EA | |
| Average Intel Core i7-12700H, NVIDIA RTX A2000 Laptop GPU (n=1) | |
| HP ZBook Power 15 G8 313S5EA | |
| Lenovo ThinkPad P15v G2 21A9000XGE | |
| CrossMark / Responsiveness | |
| Average of class Workstation (993 - 2096, n=22, last 2 years) | |
| HP ZBook Studio 16 G9 62U04EA | |
| HP ZBook Power 15 G9 6B8C4EA | |
| Average Intel Core i7-12700H, NVIDIA RTX A2000 Laptop GPU (n=1) | |
| HP ZBook Power 15 G8 313S5EA | |
| Lenovo ThinkPad P15v G2 21A9000XGE | |
| PCMark 10 Score | 6232 points | |
Help | ||
| AIDA64 / Memory Copy | |
| Average of class Workstation (56003 - 164795, n=23, last 2 years) | |
| HP ZBook Power 15 G9 6B8C4EA | |
| HP ZBook Studio 16 G9 62U04EA | |
| Average Intel Core i7-12700H (25615 - 80511, n=64) | |
| HP ZBook Power 15 G8 313S5EA | |
| Lenovo ThinkPad P15v G2 21A9000XGE | |
| AIDA64 / Memory Read | |
| Average of class Workstation (55795 - 121563, n=23, last 2 years) | |
| HP ZBook Power 15 G9 6B8C4EA | |
| HP ZBook Studio 16 G9 62U04EA | |
| Average Intel Core i7-12700H (25586 - 79442, n=64) | |
| HP ZBook Power 15 G8 313S5EA | |
| Lenovo ThinkPad P15v G2 21A9000XGE | |
| AIDA64 / Memory Write | |
| Average of class Workstation (55663 - 214520, n=23, last 2 years) | |
| HP ZBook Power 15 G9 6B8C4EA | |
| HP ZBook Studio 16 G9 62U04EA | |
| Average Intel Core i7-12700H (23679 - 88660, n=64) | |
| HP ZBook Power 15 G8 313S5EA | |
| Lenovo ThinkPad P15v G2 21A9000XGE | |
| AIDA64 / Memory Latency | |
| Average of class Workstation (84.5 - 165.2, n=23, last 2 years) | |
| Lenovo ThinkPad P15v G2 21A9000XGE | |
| HP ZBook Power 15 G9 6B8C4EA | |
| HP ZBook Studio 16 G9 62U04EA | |
| Average Intel Core i7-12700H (76.2 - 133.9, n=62) | |
| HP ZBook Power 15 G8 313S5EA | |
* ... smaller is better
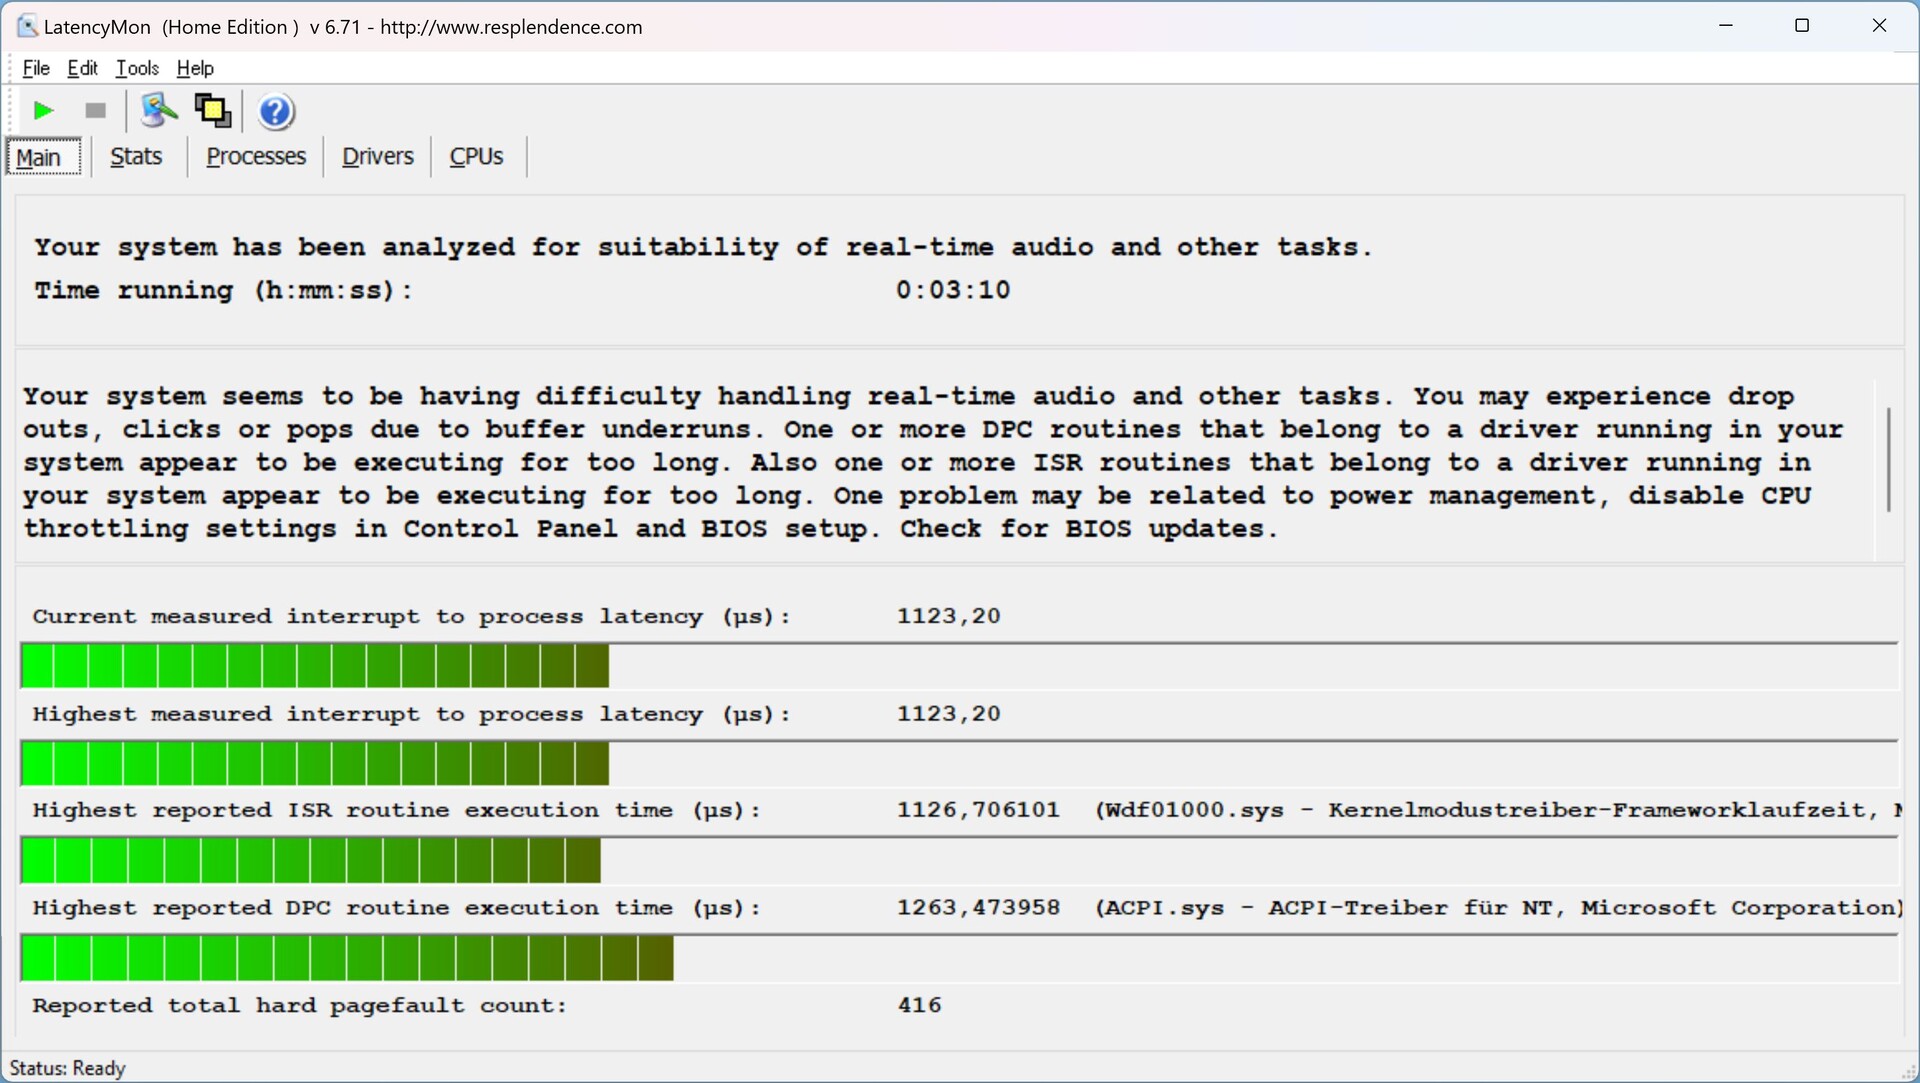
DPC延迟
在我们的标准化延迟测试中(上网冲浪、4K YouTube视频再现、CPU负载),有一些轻微的限制。因此,采用当前BIOS版本的设备并不适合使用实时音频应用程序。
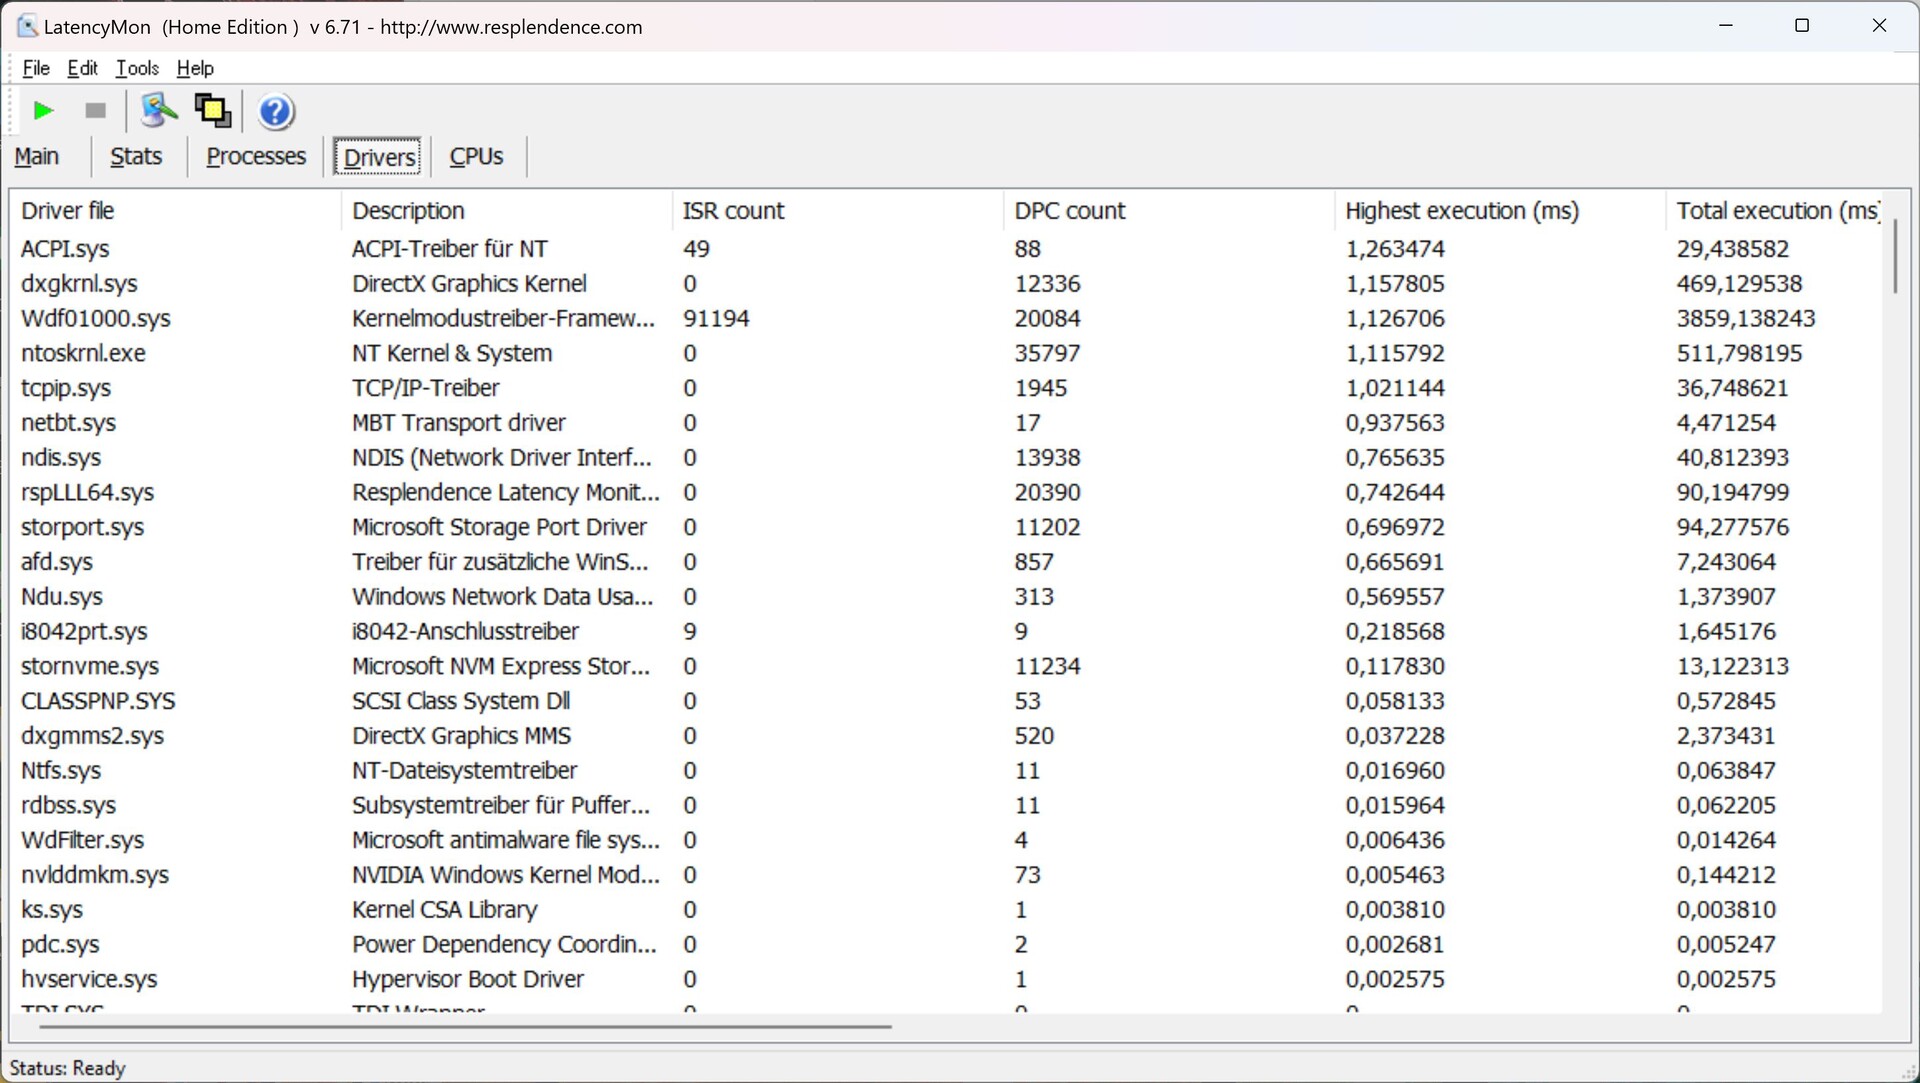
| DPC Latencies / LatencyMon - interrupt to process latency (max), Web, Youtube, Prime95 | |
| Lenovo ThinkPad P15v G2 21A9000XGE | |
| HP ZBook Studio 16 G9 62U04EA | |
| HP ZBook Power 15 G9 6B8C4EA | |
| Dell Precision 5000 5560 | |
| HP ZBook Power 15 G8 313S5EA | |
* ... smaller is better
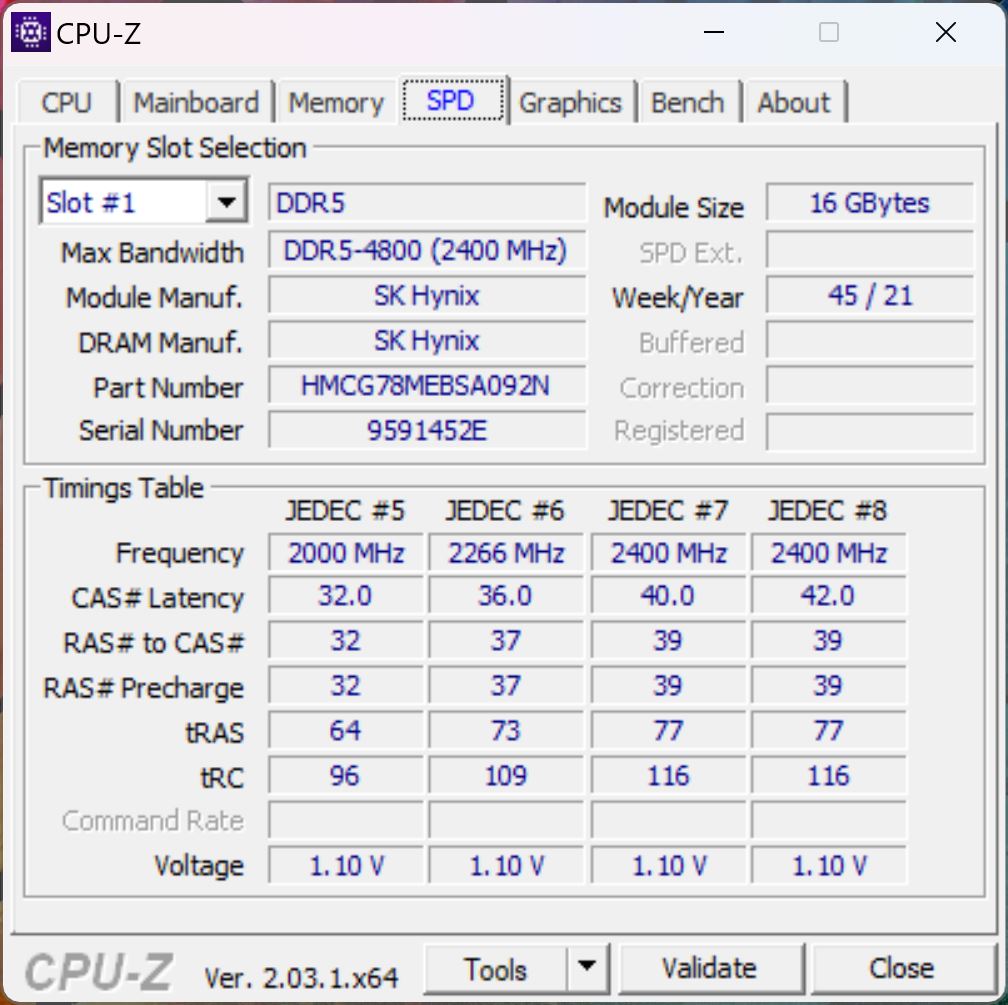
存储解决方案
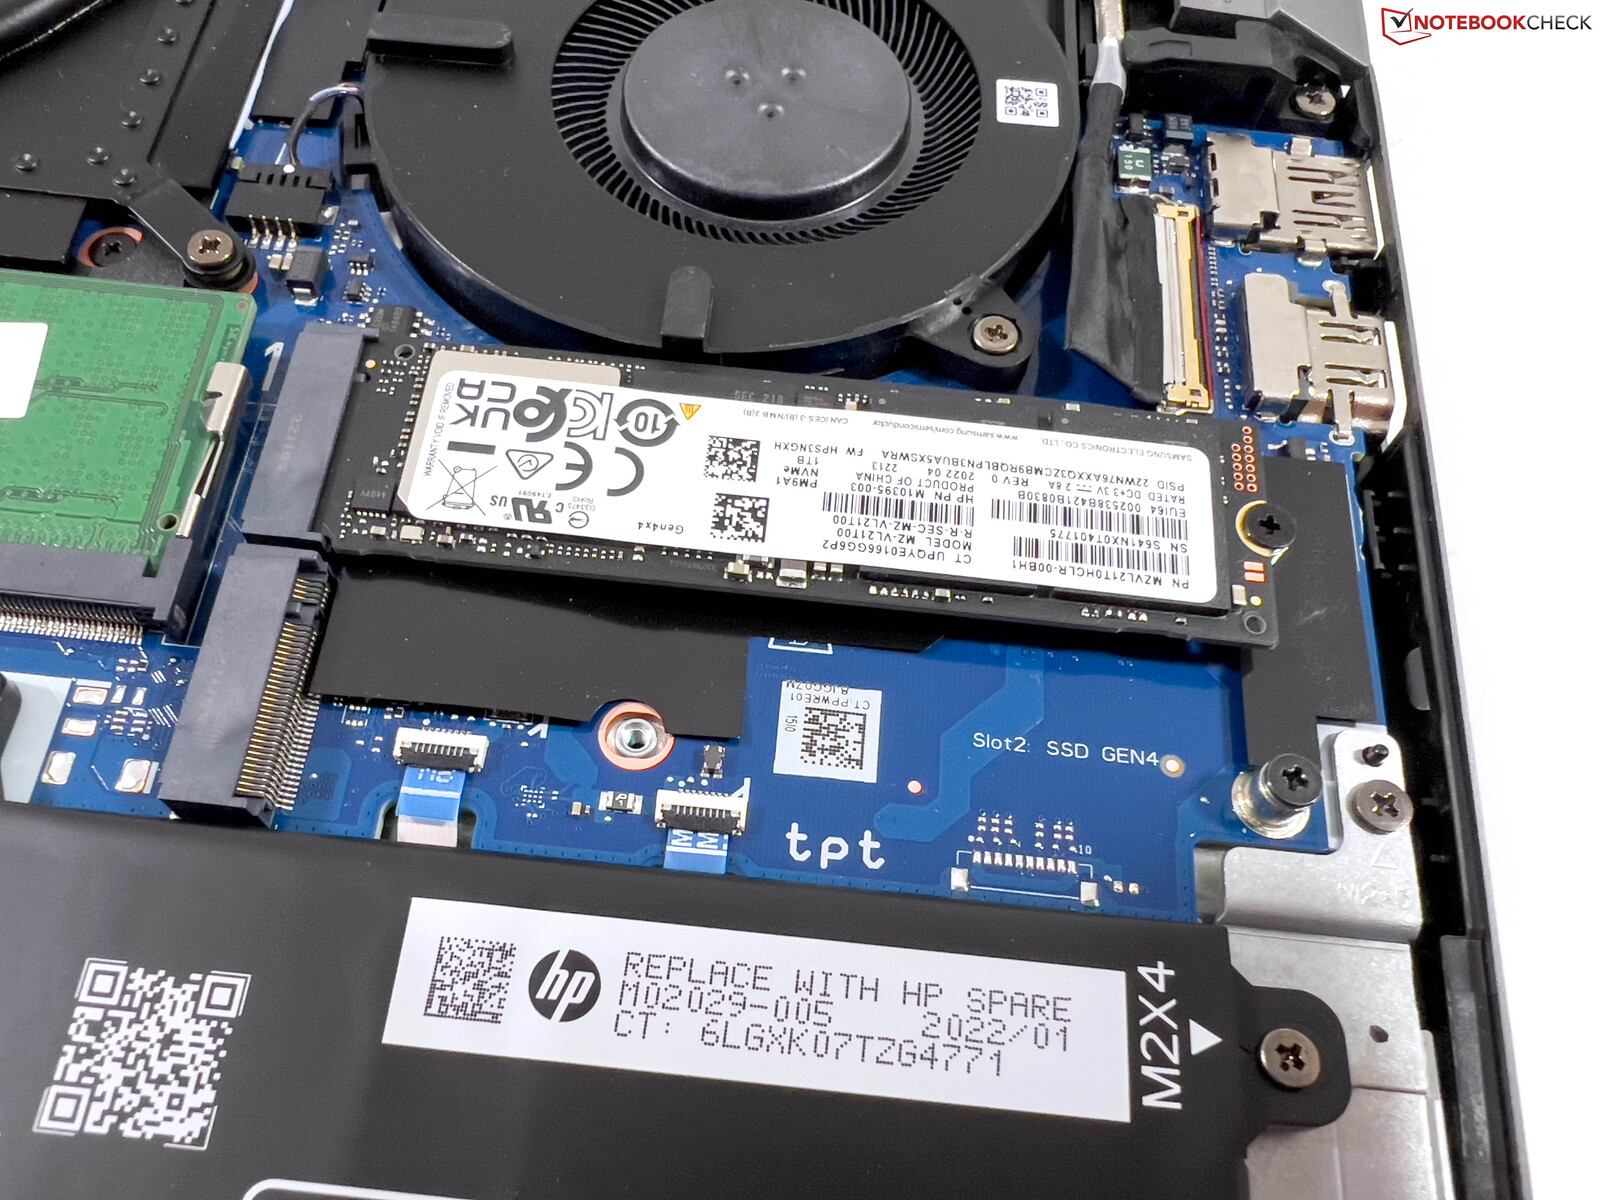
ZBook Power 15 G9为M.2固态硬盘提供两个快速PCIe 4.0插槽。我们的测试装置使用了三星的大型1TB PM9A1(980 Pro的OEM版本)。第一次打开后,用户可以使用890GB的这个。固态硬盘的传输率非常好,即使在较长时间的负载后,性能也几乎完全保持稳定。你可以找到更多的SSD基准测试 这里.

* ... smaller is better
Disk Throttling: DiskSpd Read Loop, Queue Depth 8
图形卡
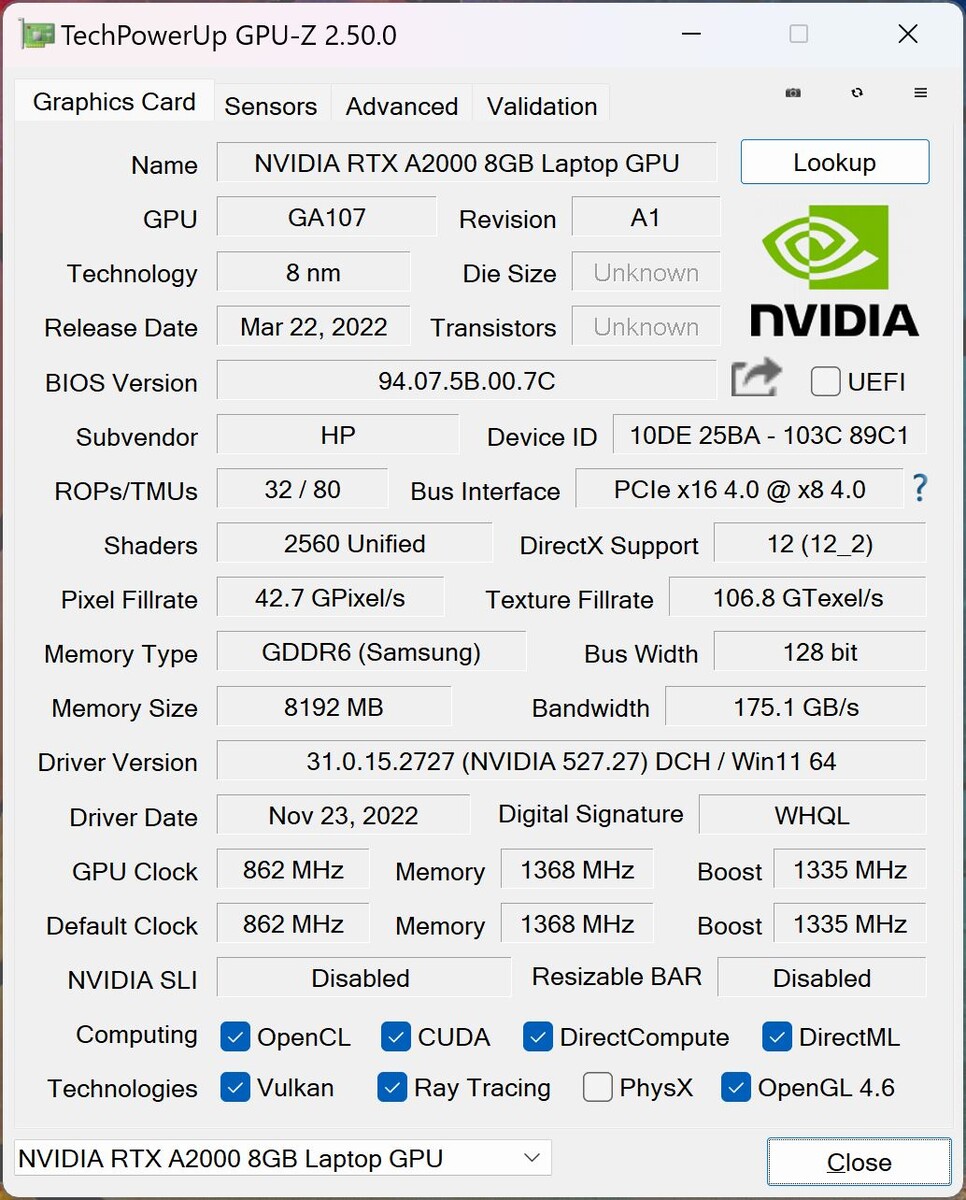
的Nvidia RTX A2000是惠普为ZBook Power 15 G9提供的最快GPU。这是更新的版本,有8GB的GDDR6-VRAM。然而,该GPU最多只能消耗45瓦(包括5瓦的动态提升),这使得它成为最慢的版本之一。在我们的基准测试中,该GPU因此也低于我们迄今为止为RTX A2000测量的平均结果。游戏性能可与 GeForce RTX 3050 Ti消费级GPU但由于经过认证的驱动程序,在专业应用程序中的性能也可以显著提高。
在持续的负载下,GPU的性能保持完全稳定。如同在处理器中一样,显卡在电池运行时的功耗也被限制在30瓦,导致性能降低近25%(3589分Time Spy Graphics)。你可以在这里找到额外的GPU基准测试移动显示芯片——基准测试成绩列表 。
| 3DMark 11 Performance | 16503 points | |
| 3DMark Fire Strike Score | 11074 points | |
| 3DMark Time Spy Score | 5106 points | |
Help | ||
| Blender / v3.3 Classroom OPTIX/RTX | |
| HP ZBook Studio 16 G9 62U04EA | |
| HP ZBook Power 15 G9 6B8C4EA | |
| Average NVIDIA RTX A2000 Laptop GPU (42 - 54, n=7) | |
| Average of class Workstation (10 - 43, n=17, last 2 years) | |
| Blender / v3.3 Classroom CUDA | |
| HP ZBook Studio 16 G9 62U04EA | |
| HP ZBook Power 15 G9 6B8C4EA | |
| Average NVIDIA RTX A2000 Laptop GPU (78 - 98, n=7) | |
| Average of class Workstation (16 - 74, n=17, last 2 years) | |
| Blender / v3.3 Classroom CPU | |
| HP ZBook Power 15 G9 6B8C4EA | |
| Average NVIDIA RTX A2000 Laptop GPU (312 - 414, n=7) | |
| HP ZBook Studio 16 G9 62U04EA | |
| Average of class Workstation (148 - 364, n=23, last 2 years) | |
* ... smaller is better
| The Witcher 3 - 1920x1080 Ultra Graphics & Postprocessing (HBAO+) | |
| Average of class Workstation (n=1last 2 years) | |
| Dell Precision 5000 5560 | |
| HP ZBook Studio 16 G9 62U04EA | |
| HP ZBook Power 15 G9 6B8C4EA | |
| Lenovo ThinkPad P15v G2 21A9000XGE | |
| HP ZBook Power 15 G8 313S5EA | |
| GTA V - 1920x1080 Highest AA:4xMSAA + FX AF:16x | |
| Average of class Workstation (18.1 - 156.1, n=23, last 2 years) | |
| HP ZBook Studio 16 G9 62U04EA | |
| HP ZBook Power 15 G9 6B8C4EA | |
| Dell Precision 5000 5560 | |
| Lenovo ThinkPad P15v G2 21A9000XGE | |
| HP ZBook Power 15 G8 313S5EA | |
| Final Fantasy XV Benchmark - 1920x1080 High Quality | |
| Average of class Workstation (26.4 - 197.6, n=23, last 2 years) | |
| HP ZBook Studio 16 G9 62U04EA | |
| HP ZBook Power 15 G9 6B8C4EA | |
| Dell Precision 5000 5560 | |
| Lenovo ThinkPad P15v G2 21A9000XGE | |
| HP ZBook Power 15 G8 313S5EA | |
| Strange Brigade - 1920x1080 ultra AA:ultra AF:16 | |
| Average of class Workstation (93.2 - 418, n=17, last 2 years) | |
| HP ZBook Studio 16 G9 62U04EA | |
| HP ZBook Power 15 G9 6B8C4EA | |
| Lenovo ThinkPad P15v G2 21A9000XGE | |
| HP ZBook Power 15 G8 313S5EA | |
| Dota 2 Reborn - 1920x1080 ultra (3/3) best looking | |
| HP ZBook Studio 16 G9 62U04EA | |
| Average of class Workstation (50.7 - 178.4, n=23, last 2 years) | |
| Dell Precision 5000 5560 | |
| HP ZBook Power 15 G9 6B8C4EA | |
| HP ZBook Power 15 G8 313S5EA | |
| Lenovo ThinkPad P15v G2 21A9000XGE | |
The Witcher 3 FPS Chart
| low | med. | high | ultra | QHD | 4K | |
|---|---|---|---|---|---|---|
| GTA V (2015) | 182.9 | 177.1 | 134.7 | 65.4 | 47.3 | 45 |
| The Witcher 3 (2015) | 264 | 171 | 45 | 44.5 | ||
| Dota 2 Reborn (2015) | 179.3 | 133.5 | 126.1 | 118.6 | 68.9 | |
| Final Fantasy XV Benchmark (2018) | 121.9 | 68.2 | 48.6 | 34.9 | 20.6 | |
| X-Plane 11.11 (2018) | 122.6 | 103.6 | 87.6 | 73.1 | ||
| Strange Brigade (2018) | 266 | 126 | 100 | 86 | 36 | |
| F1 2021 (2021) | 287 | 153.1 | 124.4 | 62.7 | 44.4 | 23.9 |
| F1 22 (2022) | 147.1 | 137.9 | 100.6 | 30.8 | 19.1 | 9.05 |
排放和电源管理
噪声水平
通常情况下,ZBook Power 15 G9的两个风扇在执行简单任务时经常保持不启动状态。只有当你把处理器或专用显卡放在负载下时,风扇才会迅速打开,通常产生的噪音水平在42至45 dB(A)之间,风扇的速度并不总是保持稳定,而是有时波动。在对两个组件进行最大负荷的压力测试中,我们测得的最大噪音为47.9 dB(A)。因此,目前的G9代仍然比前代产品略微安静。没有其他电子噪音。
Noise level
| Idle |
| 23.8 / 23.8 / 23.8 dB(A) |
| Load |
| 42.9 / 47.9 dB(A) |
 | ||
30 dB silent 40 dB(A) audible 50 dB(A) loud |
||
min: | ||
| HP ZBook Power 15 G9 6B8C4EA RTX A2000 Laptop GPU, i7-12700H, Samsung PM9A1 MZVL21T0HCLR | HP ZBook Studio 16 G9 62U04EA RTX A2000 Laptop GPU, i7-12800H, Micron 3400 1TB MTFDKBA1T0TFH | Dell Precision 5000 5560 RTX A2000 Laptop GPU, i7-11850H, Samsung PM9A1 MZVL22T0HBLB | Lenovo ThinkPad P15v G2 21A9000XGE T1200 Laptop GPU, i7-11800H, Toshiba XG6 KXG6AZNV512G | HP ZBook Power 15 G8 313S5EA T600 Laptop GPU, i7-11800H, Samsung PM9A1 MZVL2512HCJQ | |
|---|---|---|---|---|---|
| Noise | -4% | 10% | 2% | -8% | |
| off / environment * (dB) | 23.8 | 24 -1% | 23.4 2% | 25.21 -6% | 25.54 -7% |
| Idle Minimum * (dB) | 23.8 | 24 -1% | 23.6 1% | 25.21 -6% | 25.54 -7% |
| Idle Average * (dB) | 23.8 | 27.7 -16% | 23.6 1% | 25.21 -6% | 25.54 -7% |
| Idle Maximum * (dB) | 23.8 | 27.7 -16% | 23.6 1% | 25.21 -6% | 25.54 -7% |
| Load Average * (dB) | 42.9 | 39.8 7% | 25.8 40% | 39.09 9% | 48.85 -14% |
| Witcher 3 ultra * (dB) | 44.5 | 44.3 -0% | 40.1 10% | 36.6 18% | 46.58 -5% |
| Load Maximum * (dB) | 47.9 | 47.7 -0% | 41.4 14% | 43.53 9% | 50.98 -6% |
* ... smaller is better
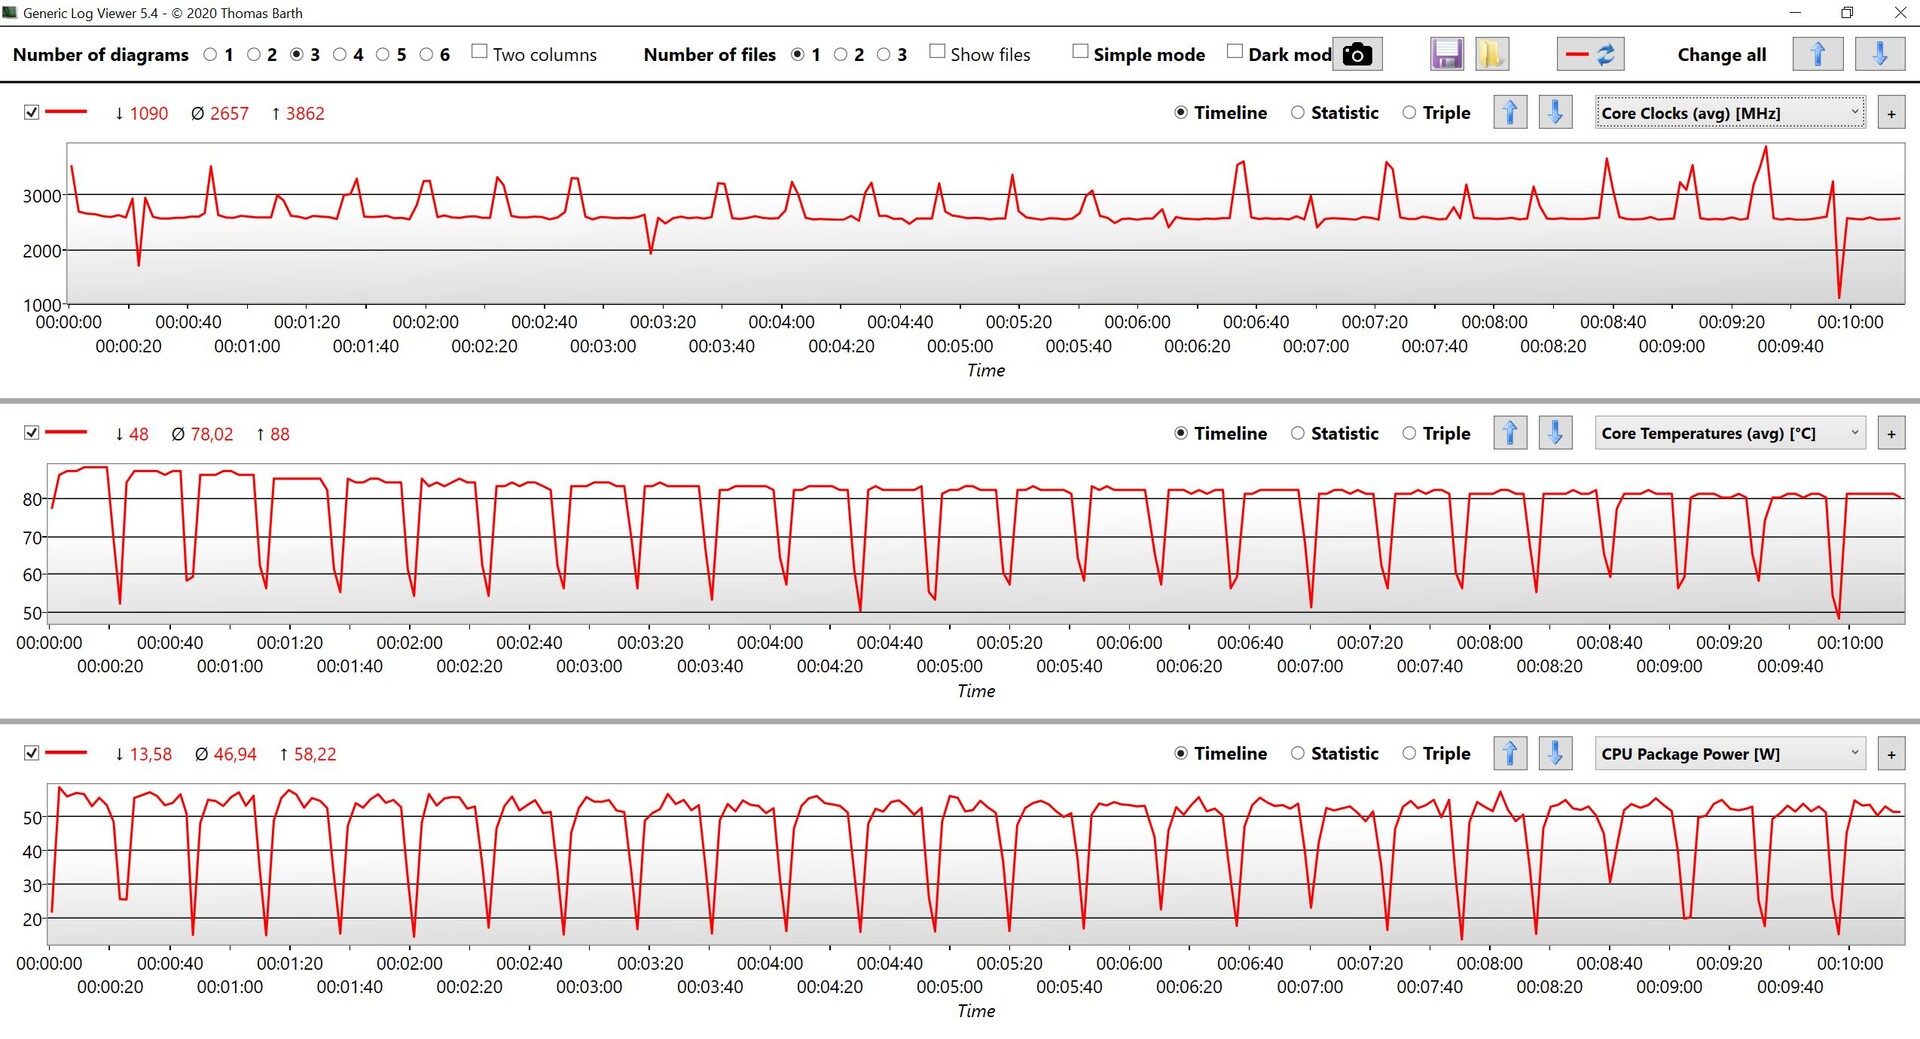
温度
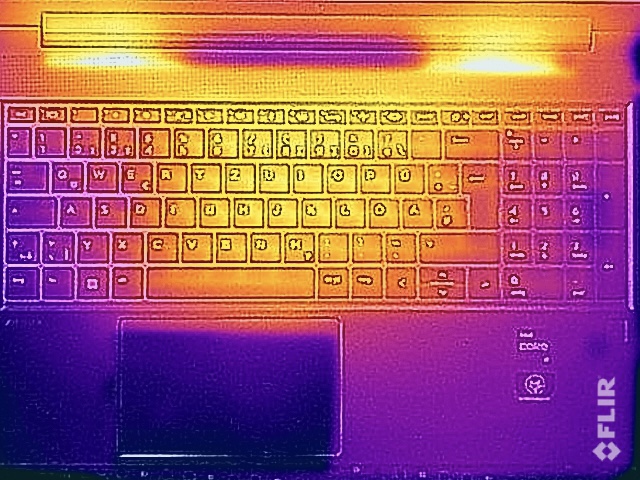
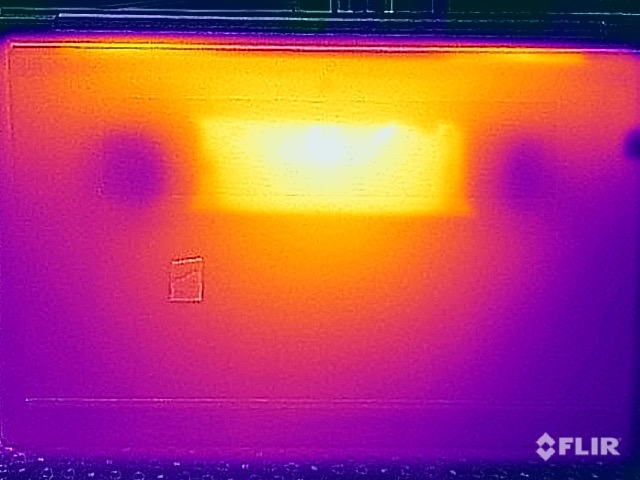
在日常操作中,移动工作站的表面温度通常保持很低,即使在负载下也完全没有理由担心。在48 °C (118 °F)时,唯一的热点是在向后的中央区域的底部,但由于其位置,你仍然可以将设备放在你的腿上。然而,基本单元的顶部,包括键盘,仍然明显较冷,最高温度为40℃(104℉)。
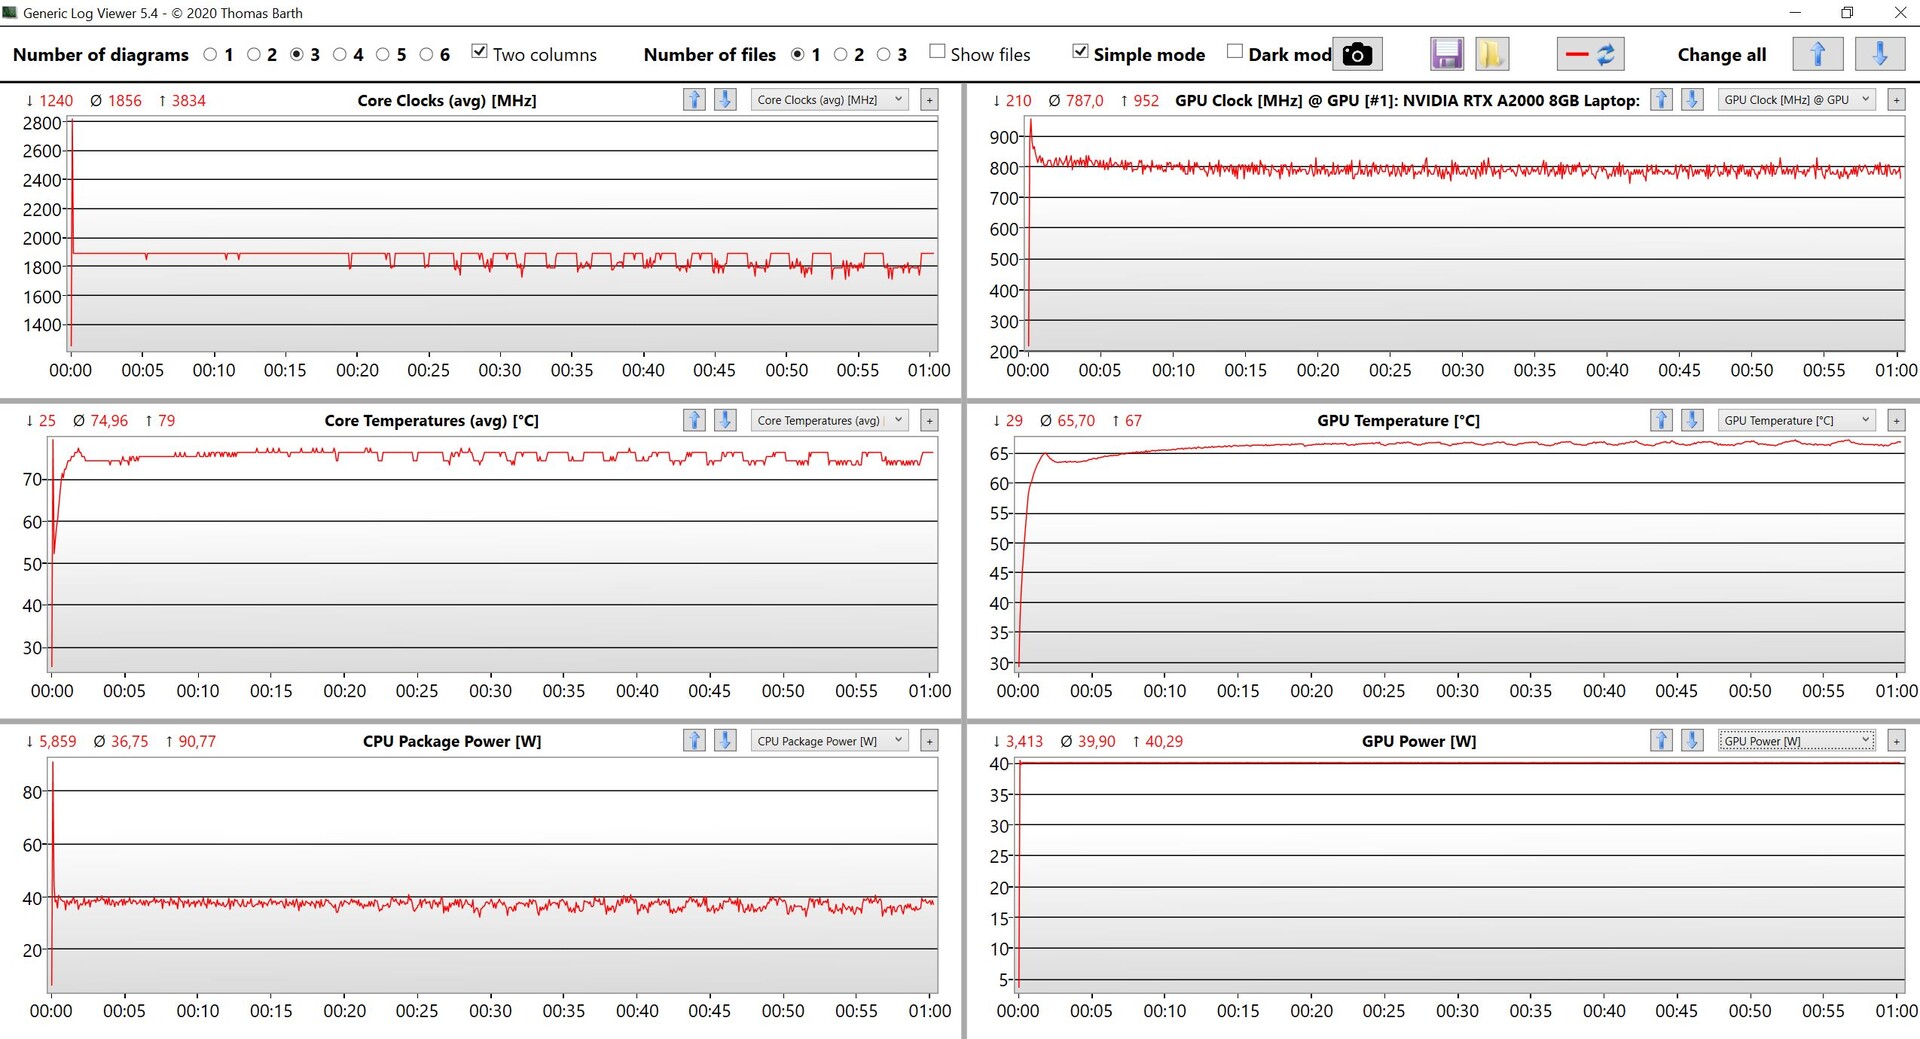
在压力测试期间,处理器在经历了90瓦的短暂峰值后,达到了35-39瓦的水平,而显卡则稳定在40瓦。在压力测试之后,性能并没有降低。在电池运行中,这些数值略有下降,CPU仍被允许消耗25瓦,而GPU在综合负载下则为30瓦。
(±) The maximum temperature on the upper side is 40.3 °C / 105 F, compared to the average of 38.2 °C / 101 F, ranging from 22.2 to 69.8 °C for the class Workstation.
(-) The bottom heats up to a maximum of 48.3 °C / 119 F, compared to the average of 41.1 °C / 106 F
(+) In idle usage, the average temperature for the upper side is 23.1 °C / 74 F, compared to the device average of 32 °C / 90 F.
(±) Playing The Witcher 3, the average temperature for the upper side is 33.5 °C / 92 F, compared to the device average of 32 °C / 90 F.
(+) The palmrests and touchpad are cooler than skin temperature with a maximum of 28.6 °C / 83.5 F and are therefore cool to the touch.
(±) The average temperature of the palmrest area of similar devices was 27.8 °C / 82 F (-0.8 °C / -1.5 F).
| HP ZBook Power 15 G9 6B8C4EA Intel Core i7-12700H, NVIDIA RTX A2000 Laptop GPU | HP ZBook Studio 16 G9 62U04EA Intel Core i7-12800H, NVIDIA RTX A2000 Laptop GPU | Dell Precision 5000 5560 Intel Core i7-11850H, NVIDIA RTX A2000 Laptop GPU | Lenovo ThinkPad P15v G2 21A9000XGE Intel Core i7-11800H, NVIDIA T1200 Laptop GPU | HP ZBook Power 15 G8 313S5EA Intel Core i7-11800H, NVIDIA T600 Laptop GPU | |
|---|---|---|---|---|---|
| Heat | -14% | -26% | -18% | 2% | |
| Maximum Upper Side * (°C) | 40.3 | 38.7 4% | 48.2 -20% | 53.8 -33% | 41.4 -3% |
| Maximum Bottom * (°C) | 48.3 | 53.4 -11% | 42.6 12% | 52.1 -8% | 41.5 14% |
| Idle Upper Side * (°C) | 23.7 | 27.3 -15% | 34.8 -47% | 27.6 -16% | 23.8 -0% |
| Idle Bottom * (°C) | 23.8 | 31.6 -33% | 35.2 -48% | 27.7 -16% | 25 -5% |
* ... smaller is better
发言人
两个立体声扬声器是该移动工作站的弱点之一,因为它们的声音非常单薄,难以令人信服。虽然它们在视频会议或语音通话中发挥了作用,但我们绝对建议使用耳机或外部扬声器来再现音乐或电影。
HP ZBook Power 15 G9 6B8C4EA audio analysis
(±) | speaker loudness is average but good (77.9 dB)
Bass 100 - 315 Hz
(-) | nearly no bass - on average 28.5% lower than median
(±) | linearity of bass is average (9.4% delta to prev. frequency)
Mids 400 - 2000 Hz
(+) | balanced mids - only 3.9% away from median
(+) | mids are linear (5.1% delta to prev. frequency)
Highs 2 - 16 kHz
(±) | higher highs - on average 5.1% higher than median
(+) | highs are linear (4.1% delta to prev. frequency)
Overall 100 - 16.000 Hz
(±) | linearity of overall sound is average (22.9% difference to median)
Compared to same class
» 82% of all tested devices in this class were better, 3% similar, 15% worse
» The best had a delta of 7%, average was 17%, worst was 35%
Compared to all devices tested
» 68% of all tested devices were better, 6% similar, 26% worse
» The best had a delta of 4%, average was 23%, worst was 134%
Dell Precision 5000 5560 audio analysis
(±) | speaker loudness is average but good (75.2 dB)
Bass 100 - 315 Hz
(±) | reduced bass - on average 9.8% lower than median
(±) | linearity of bass is average (8.8% delta to prev. frequency)
Mids 400 - 2000 Hz
(±) | higher mids - on average 5.7% higher than median
(+) | mids are linear (3.7% delta to prev. frequency)
Highs 2 - 16 kHz
(+) | balanced highs - only 2.7% away from median
(+) | highs are linear (6.4% delta to prev. frequency)
Overall 100 - 16.000 Hz
(+) | overall sound is linear (14.8% difference to median)
Compared to same class
» 33% of all tested devices in this class were better, 6% similar, 61% worse
» The best had a delta of 7%, average was 17%, worst was 35%
Compared to all devices tested
» 20% of all tested devices were better, 4% similar, 76% worse
» The best had a delta of 4%, average was 23%, worst was 134%
消耗功率
尽管有4K显示屏,ZBook Power 15 G9是一个非常高效的设备,空闲运行时最大功率为8.5瓦。在负载情况下,你可以期待大约85-100瓦,在经历了139瓦的短暂消费高峰后,在压力测试中,几分钟后也会平息在这个范围内。因此,附带的150瓦电源是完全足够的。
| Off / Standby | |
| Idle | |
| Load |
|
Key:
min: | |
Power Consumption The Witcher 3 / Stress Test
Power Consumption With External Monitor
电池寿命
83瓦时的大电池保持不变,允许良好的电池寿命,即使是采用全高清面板的前代产品仍然持续时间更长。考虑到4K面板,在我们的WLAN测试中,在150cd/m²(相当于我们测试设备最大亮度的65%)下,大约有10个小时,在最大亮度下仍然有9个小时,结果非常好。 低功耗显示在这里变得绝对引人注目。
当设备开机时,我需要大约2.5小时才能完全充电,34分钟后已经有50%的电量,70分钟后有80%。
Pros
Cons
结论 - HP ZBook Power 15 G9将受益于更强大的冷却功能
ZBook Power 15 G9是一款入门级工作站,针对需要可靠性能和专业显卡的用户。除了处理器之外,我们的测试配置已经相当于最大配置的4K显示屏、Nvidia RTX A2000和丰富的存储空间,当然这也推高了价格。与它的前辈 ,ZBook Power G9在许多方面也提供了坚实的性能。但特别是在CPU性能方面,结果又不总是稳定的。随着一些BIOS的更新,情况稍微稳定下来,但是工作站仍然无法充分利用 酷睿i7-12700H.
特别是在性能发展方面,ZBook Power 15 G9无法达到最高值,但由于一些BIOS的更新,CPU的性能在很大程度上已经稳定下来。 经过校准,低功耗的4K显示器提供了良好的图像质量,并使电池寿命更长。
然而,为了公平起见,我们还必须提到,竞争对手的入门级工作站,如 联想ThinkPad P15v或 戴尔Precision 5560也没有提供更多的性能,这三款机型的整体表现与眼下持平。4K面板基本上是一个非常好的选择,因为它的运行效率非常高,不会推高功耗,但如果可能的话,你应该对其进行校准。
价格和可用性
ZBook Power 15 G9目前可直接从惠普购买,起价约为1455美元,一些配置也可从亚马逊等购买。
HP ZBook Power 15 G9 6B8C4EA
- 01/05/2023 v7 (old)
Andreas Osthoff
Price comparison

