联想ThinkPad P16 G1笔记本电脑评测。一个强大的、新设计的HX55工作站
自2015年以来,联想在经典的移动工作站领域有两款机型,其重点主要是性能。最近,这些型号的名称是联想ThinkPad P15第二代和联想ThinkPad P17第二代.顾名思义,每台设备都有15英寸和17英寸的显示屏。2022年,联想决定结束这种工作站的双重性,现在他们提供一个全脂移动工作站:联想ThinkPad P16 Gen 1,它取代了之前的两个型号。特别是,与它的直接竞争对手戴尔和华硕的比较将显示它在移动性能优先的类似设备中的表现如何。
潜在的竞争对手比较
Rating | Date | Model | Weight | Height | Size | Resolution | Price |
|---|---|---|---|---|---|---|---|
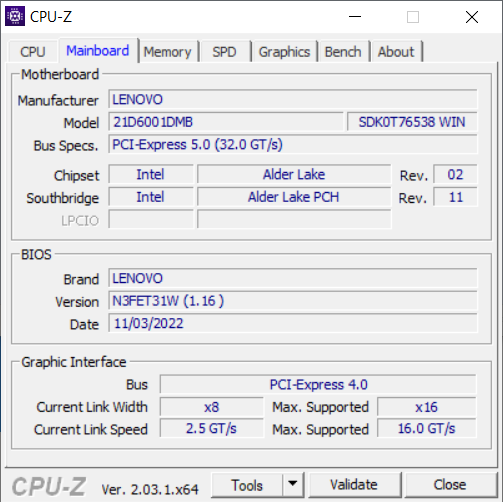
| 88.2 % v7 (old) | 02 / 2023 | Lenovo ThinkPad P16 G1 21D6001DMB i7-12850HX, RTX A2000 Laptop GPU | 3 kg | 30.23 mm | 16.00" | 2560x1600 | |
| 87.2 % v7 (old) | 10 / 2021 | Lenovo ThinkPad P15 G2-20YQ001JGE i7-11800H, RTX A3000 Laptop GPU | 2.9 kg | 31.5 mm | 15.60" | 1920x1080 | |
| 87.8 % v7 (old) | 10 / 2021 | Lenovo ThinkPad P17 G2-20YU0025G i7-11800H, RTX A2000 Laptop GPU | 3.6 kg | 28.38 mm | 17.30" | 1920x1080 | |
| 89.7 % v7 (old) | 02 / 2022 | HP ZBook Fury 17 G8-4A6A9EA i9-11950H, RTX A3000 Laptop GPU | 2.9 kg | 27 mm | 17.30" | 3840x2160 | |
| 88.4 % v7 (old) | 10 / 2022 | Dell Precision 7670 i7-12850HX, RTX A2000 Laptop GPU | 2.7 kg | 24.7 mm | 16.00" | 3840x2400 | |
| 89.6 % v7 (old) | 01 / 2023 | Asus ExpertBook B6 Flip B6602FC2 i9-12950HX, RTX A2000 Laptop GPU | 2.8 kg | 27.2 mm | 16.00" | 2560x1600 |
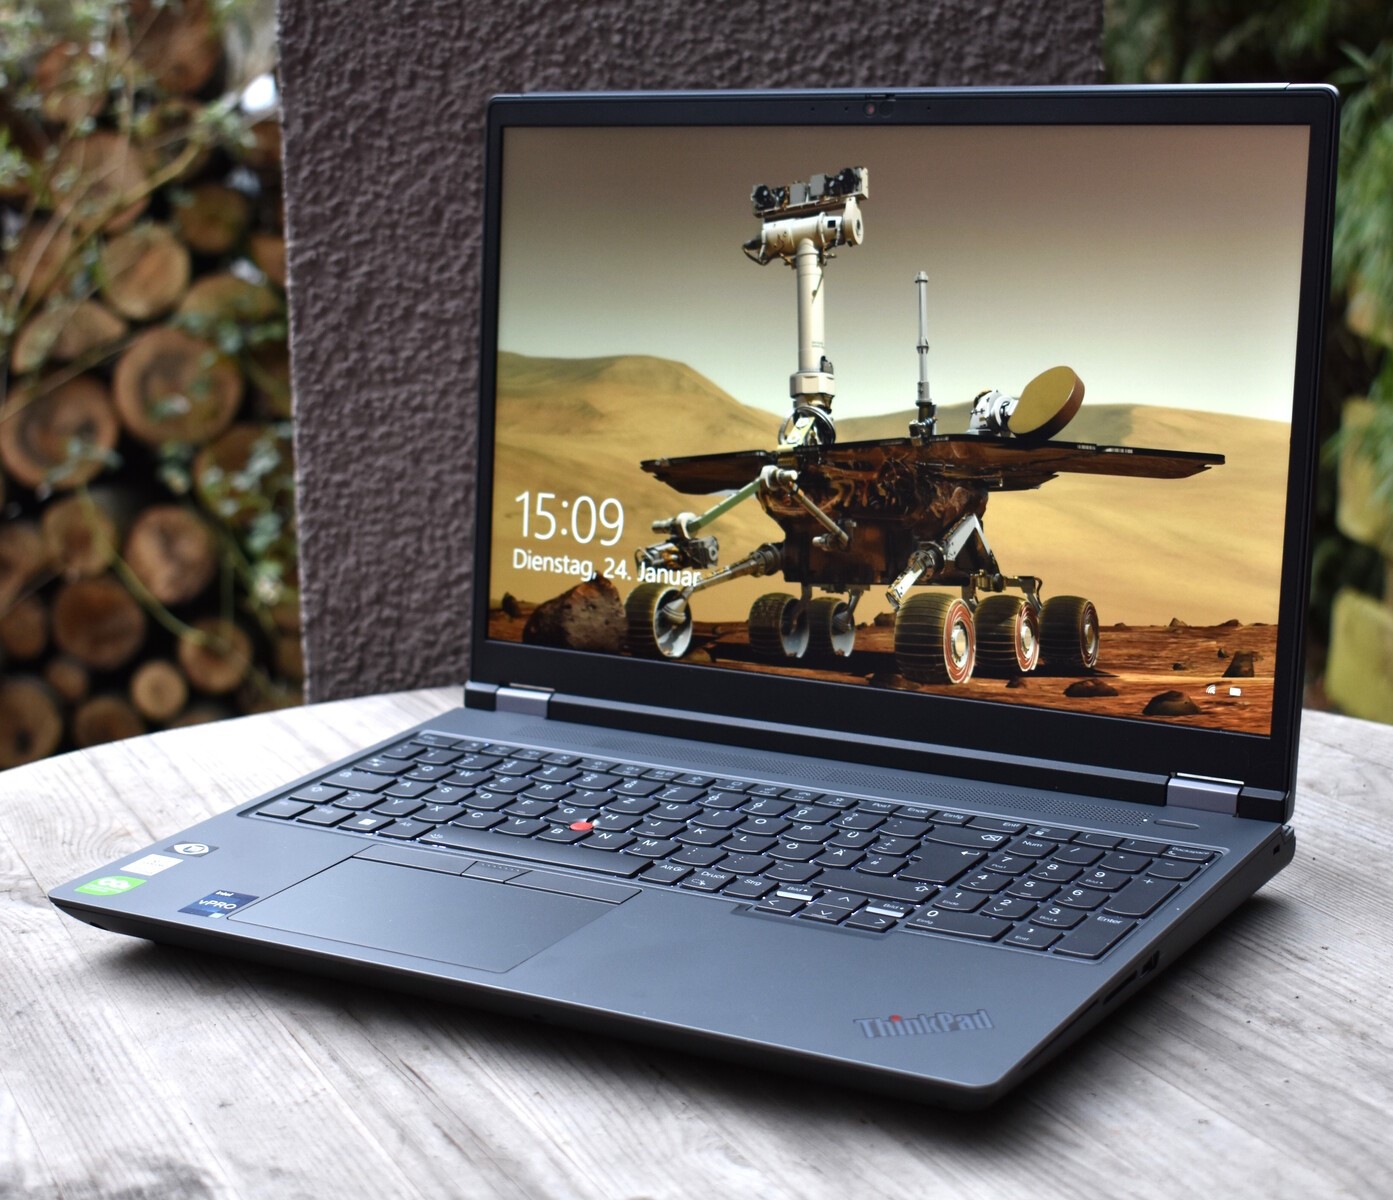
外壳。灰色的铝制盖子,镁制框架
自ThinkPad P系列问世以来,其P15和 P17是ThinkPad设计的最经典代表。它们拥有方方正正的镁合金框架塑料外壳和底座上的经典铰链机制,是最接近经典的ThinkPad笔记本电脑,例如联想ThinkPad T60.对于ThinkPad的粉丝来说,这当然是一个积极的特征,但这种设计也可以被认为是已经过了销售期限--特别是关于大的显示屏边框。
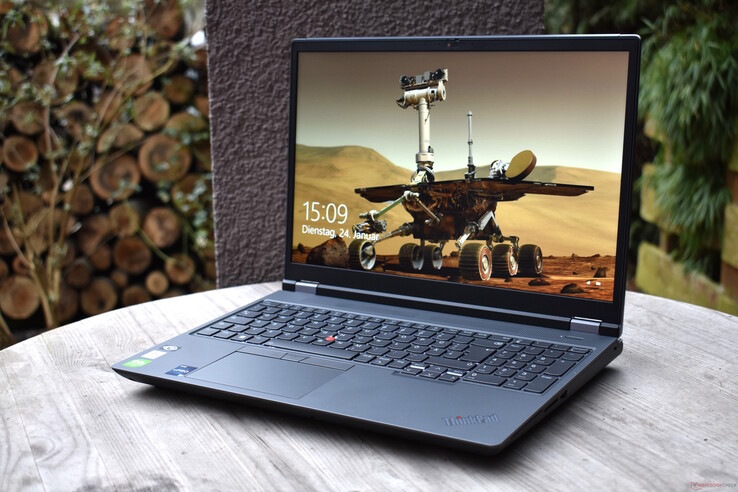
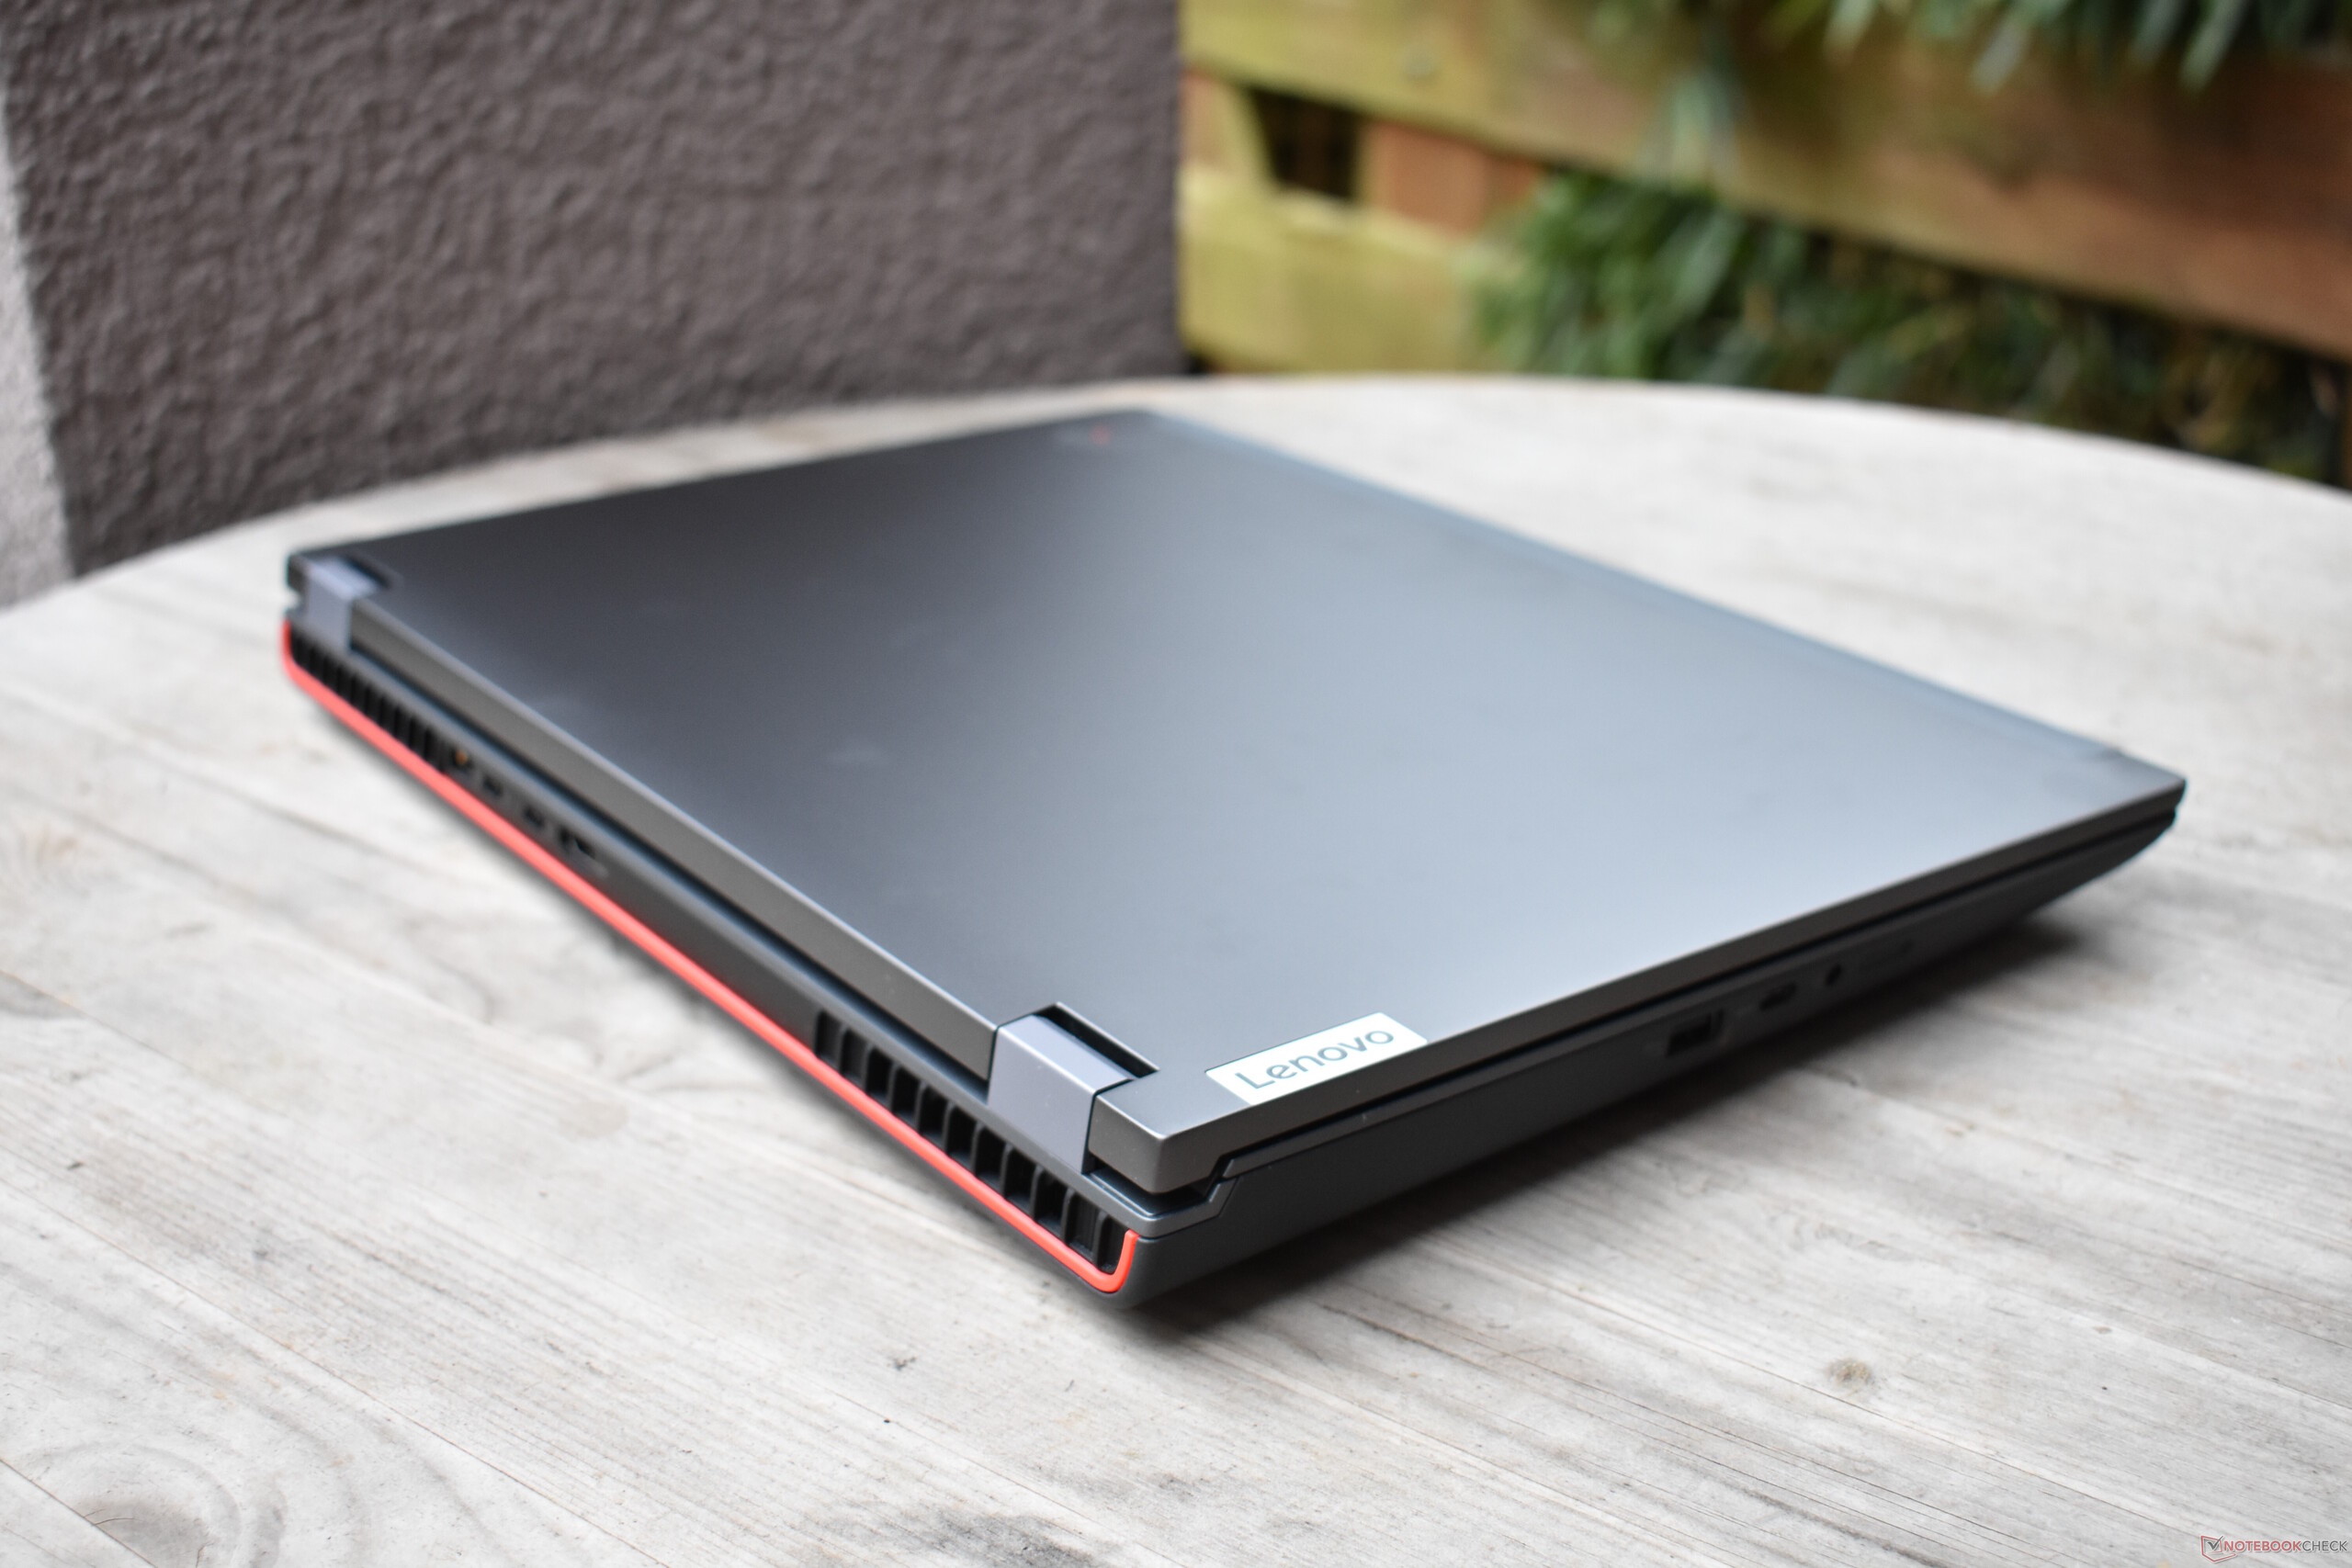
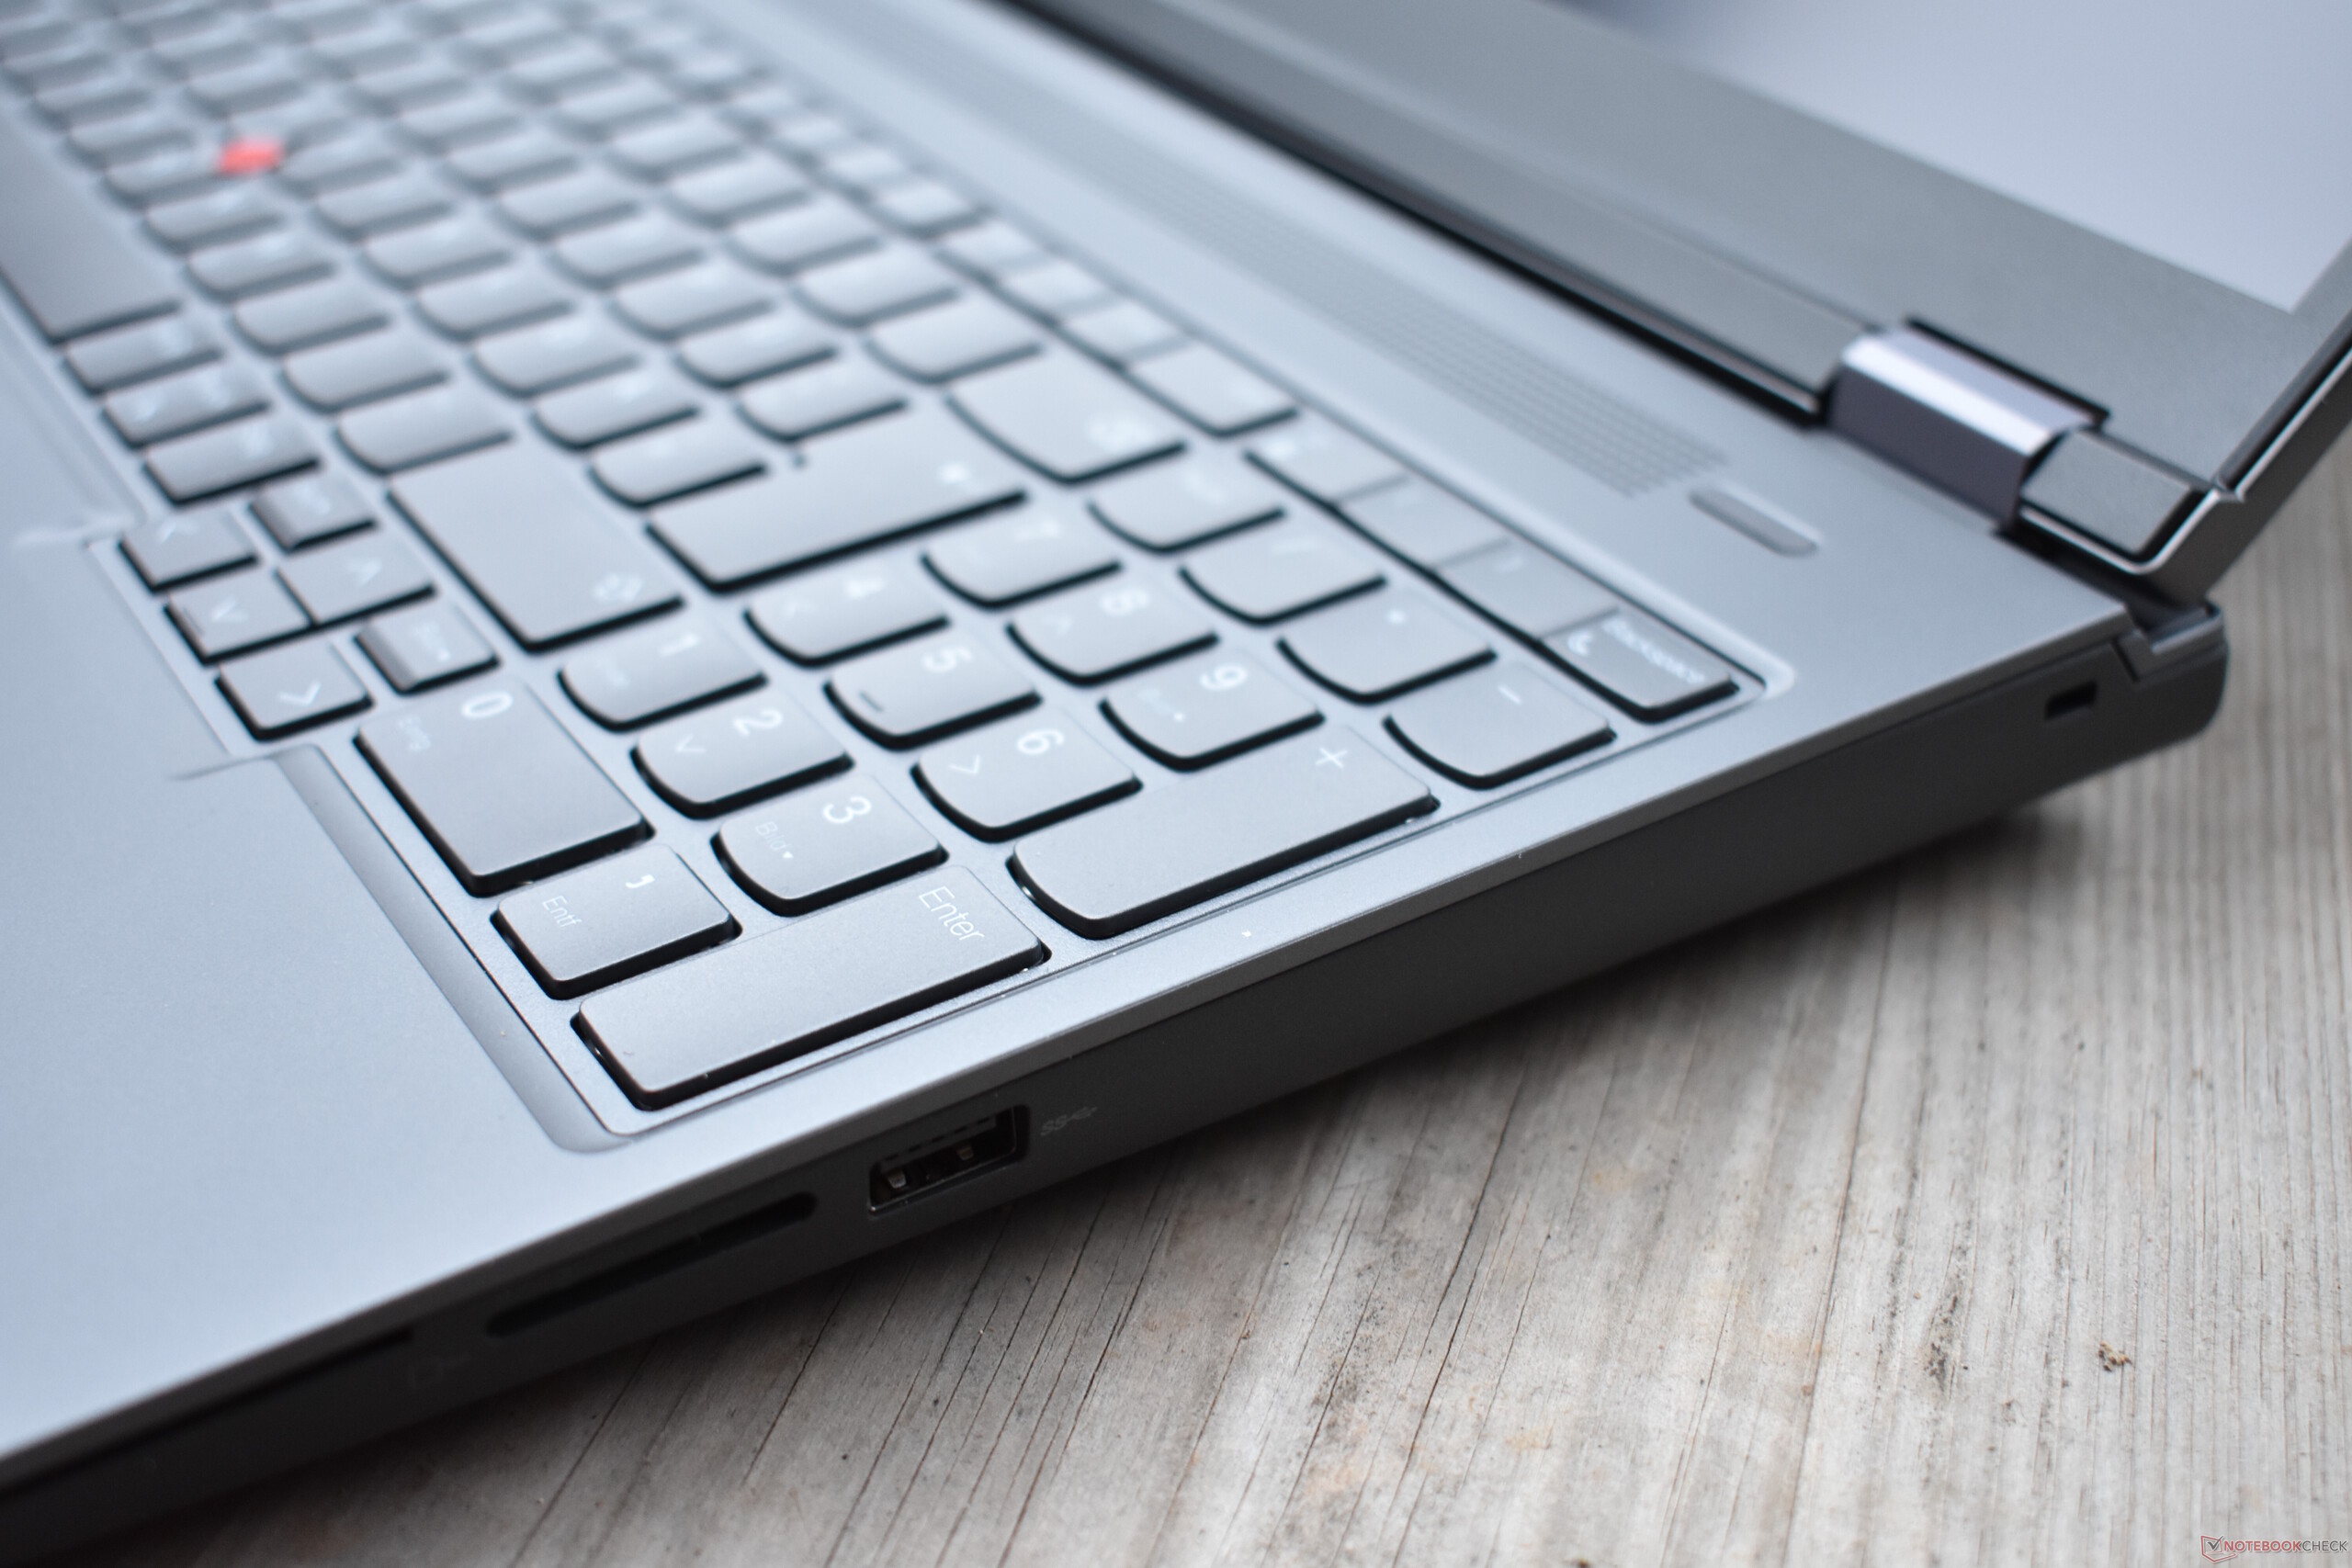
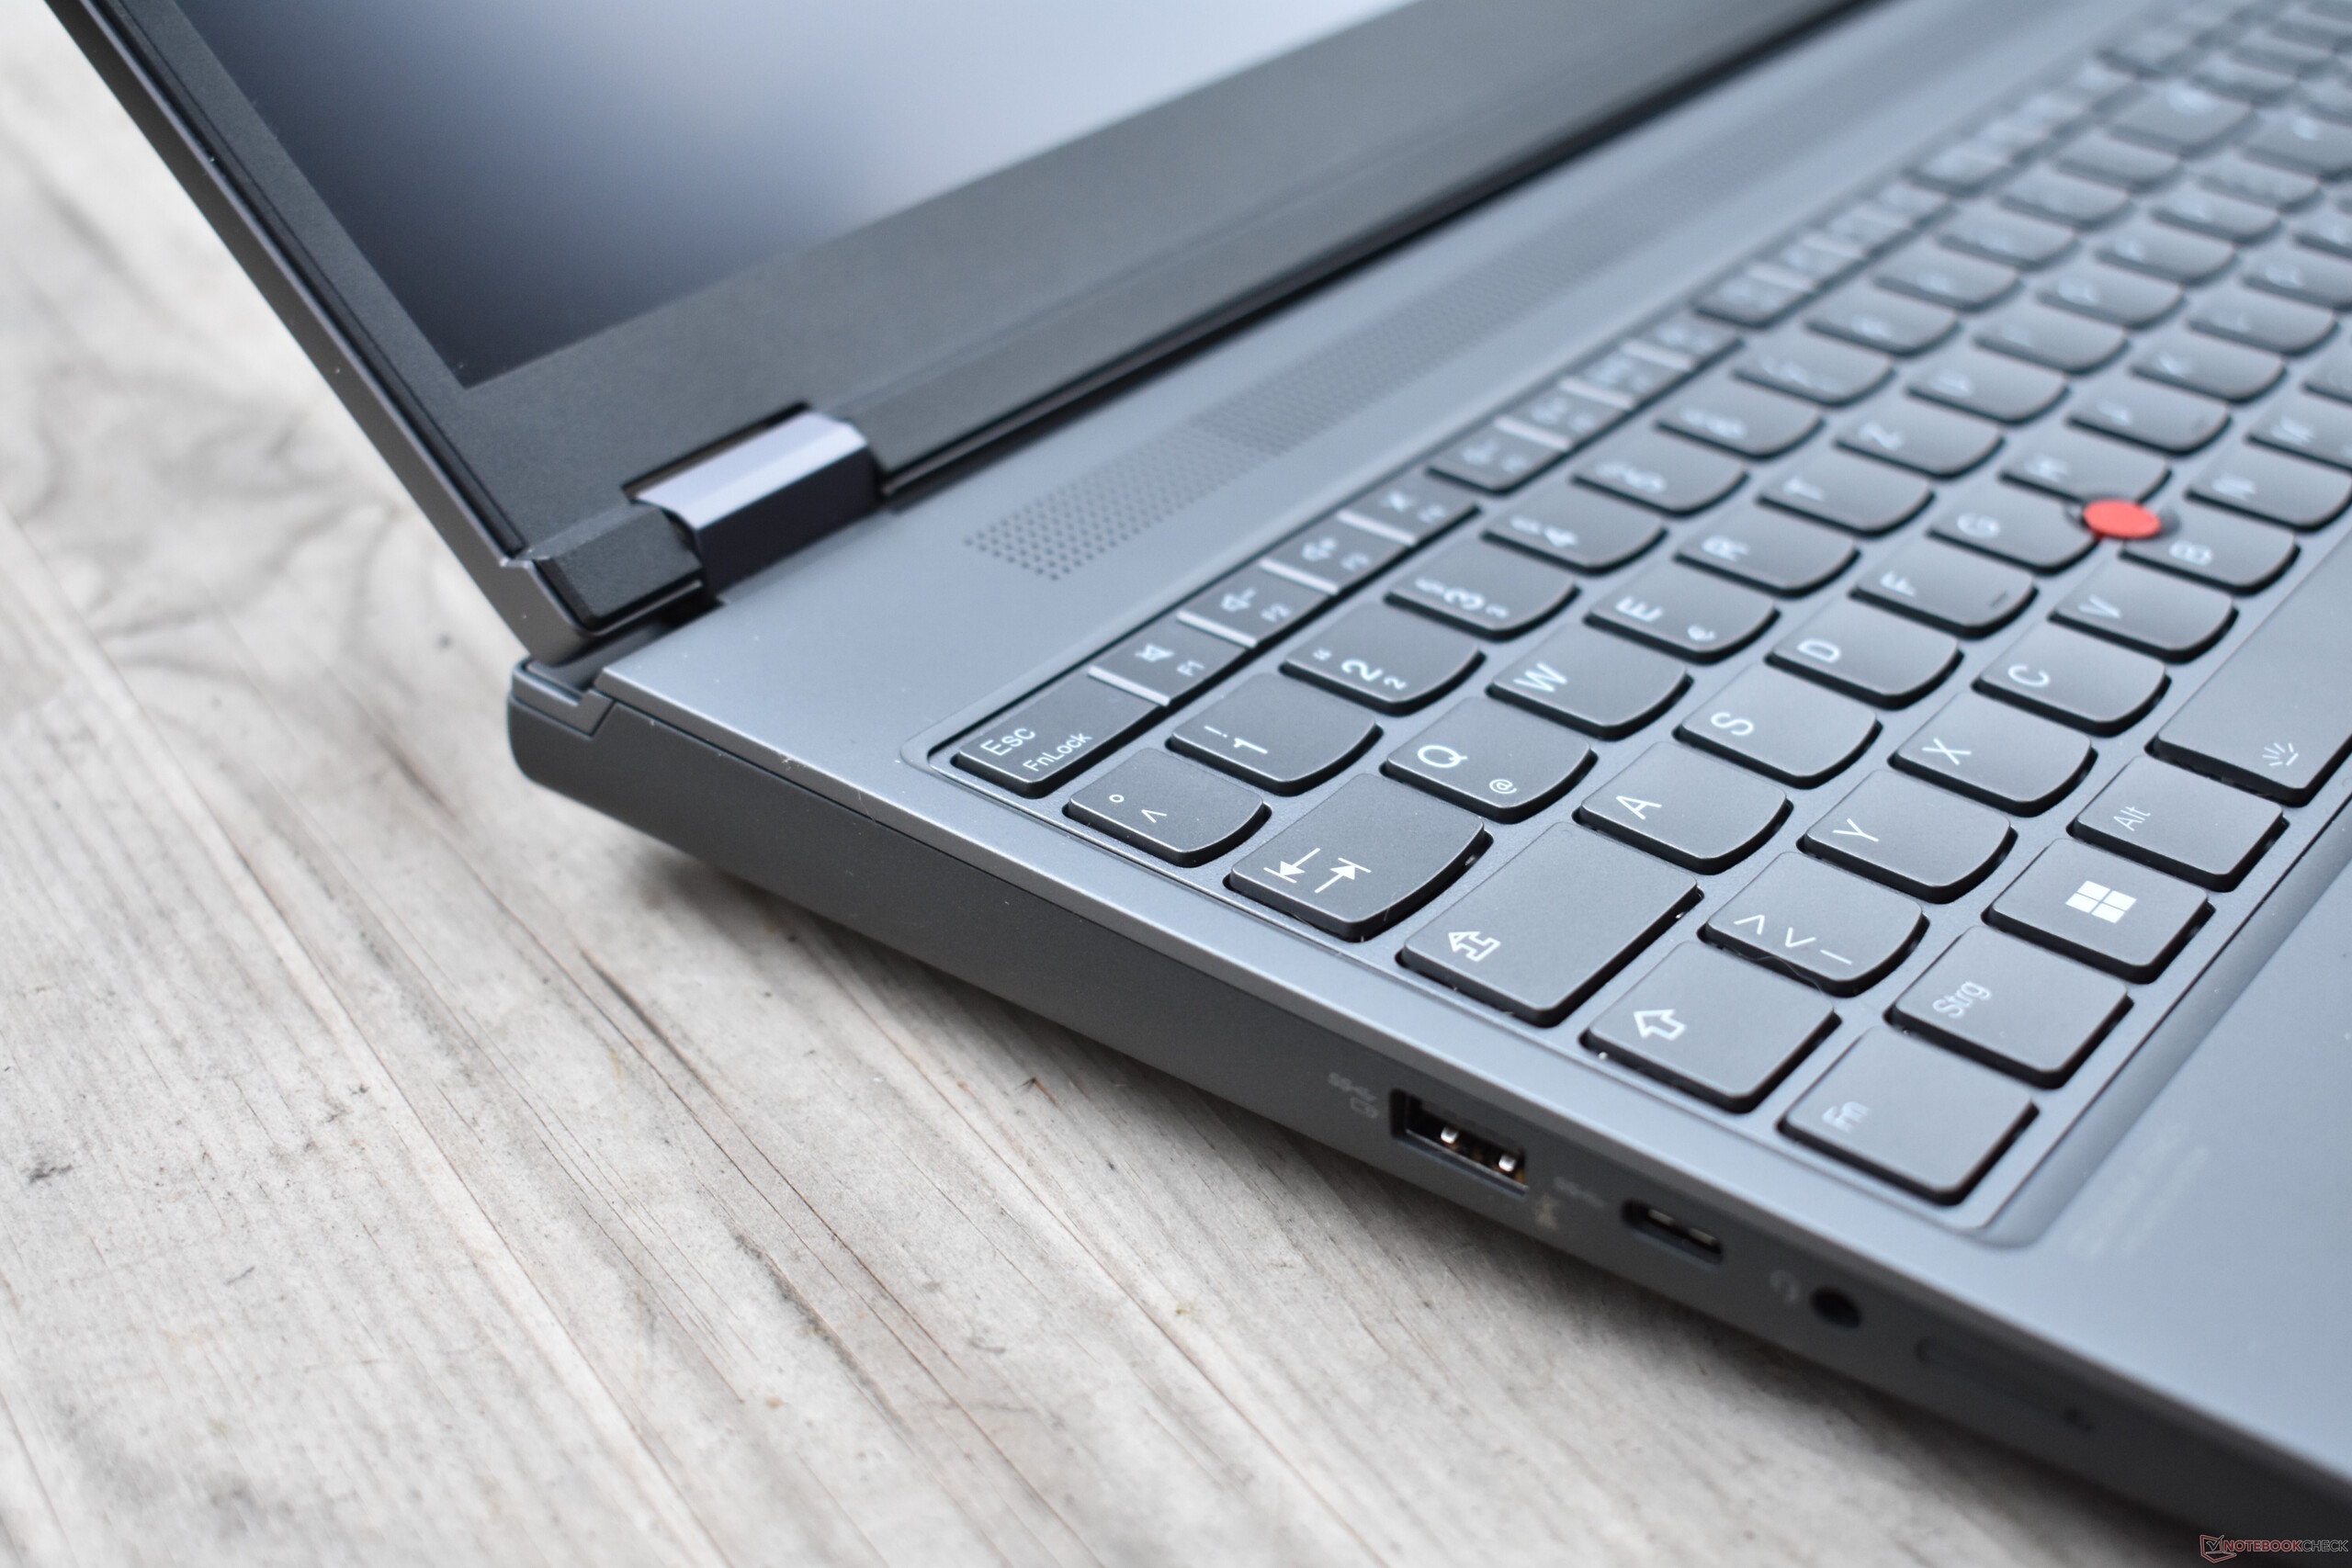
ThinkPad P16改变了很多东西。掌托、键盘和显示屏盖完全采用 "风暴灰"。圆润的边缘确保了一个略微不那么方正的形状。关于设备的后部,联想表明自己热衷于试验,因为这个区域被印上了红色亮点。P16看起来也比它的前辈更现代,因为它的显示屏边框更纤细。然而,对于一个现代设备来说,它们仍然比较大,特别是在显示屏的底部。
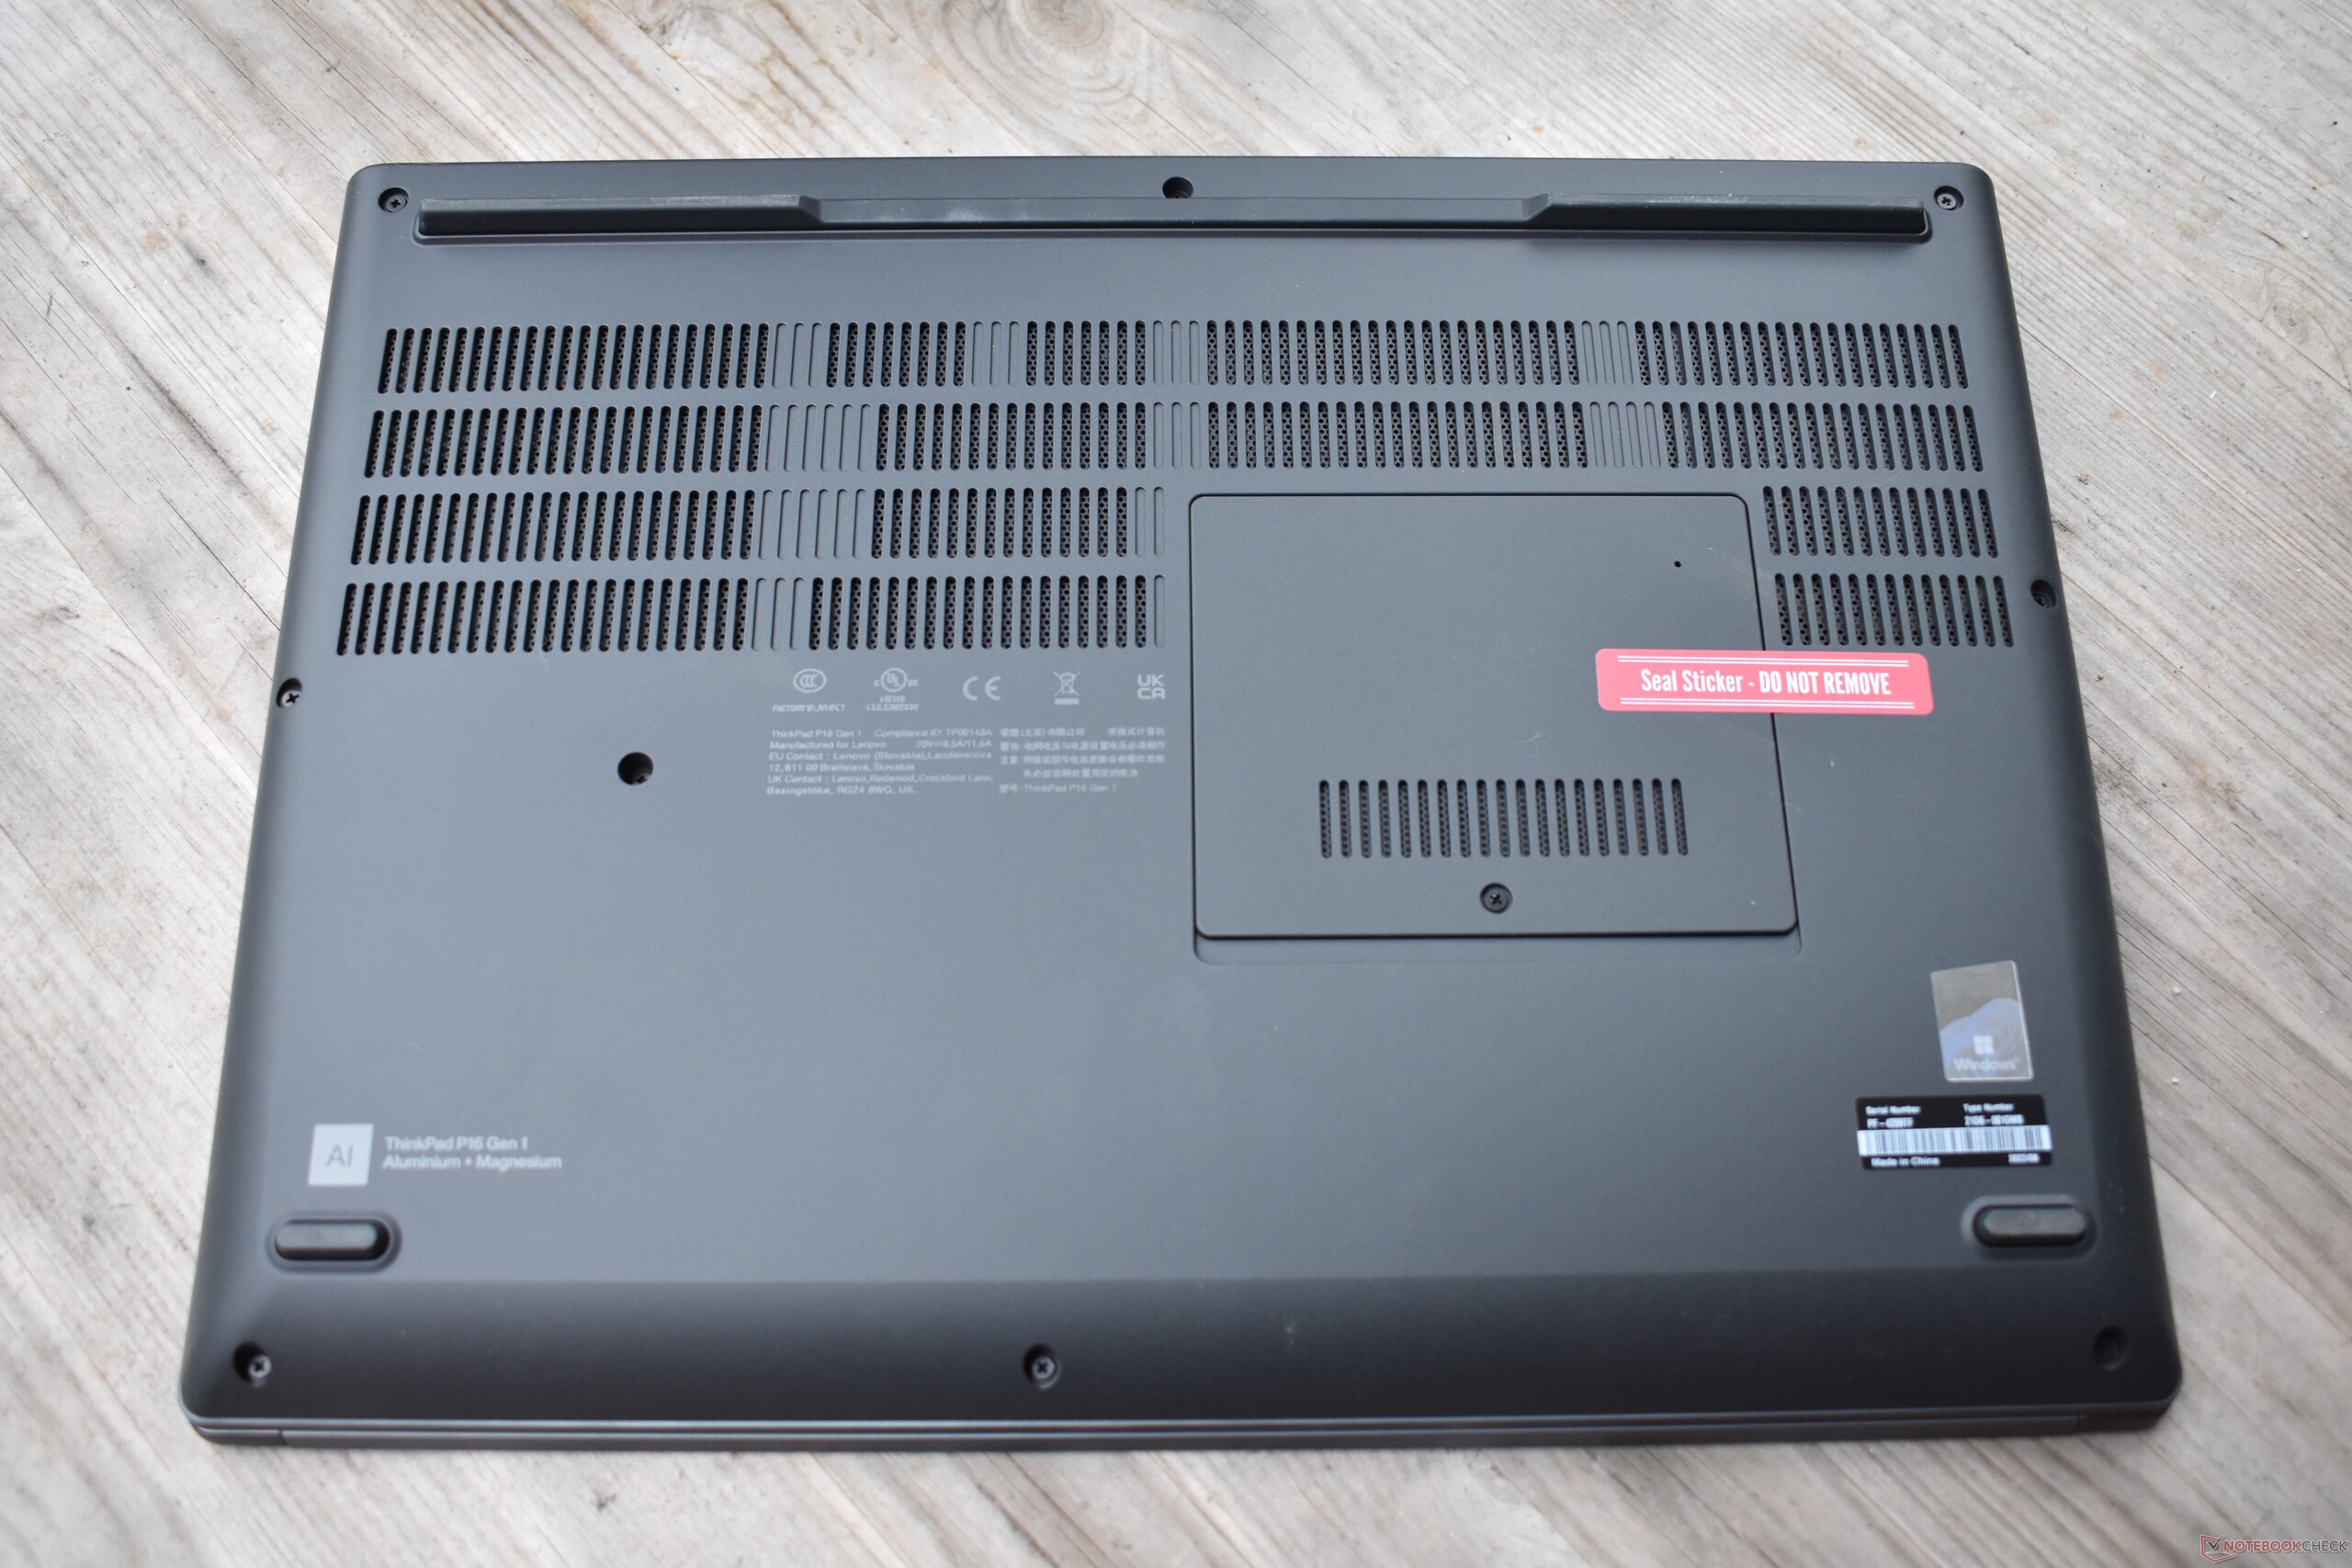
底部装置由玻璃纤维塑料制成,并以镁质框架加固;就像以前的产品一样。表面有天鹅绒般的涂层,灰色塑料比早期ThinkPad型号中的黑色塑料更不容易留下指纹。底座不能扭曲,唯一薄弱的地方是智能卡读卡器,那里的掌托会轻微弯曲。联想选择使用铝制的液晶显示屏盖,同样,它也得到了镁制防滚架的额外加固。与P15和P17相比,显示屏盖的稳定性有了很大提高。
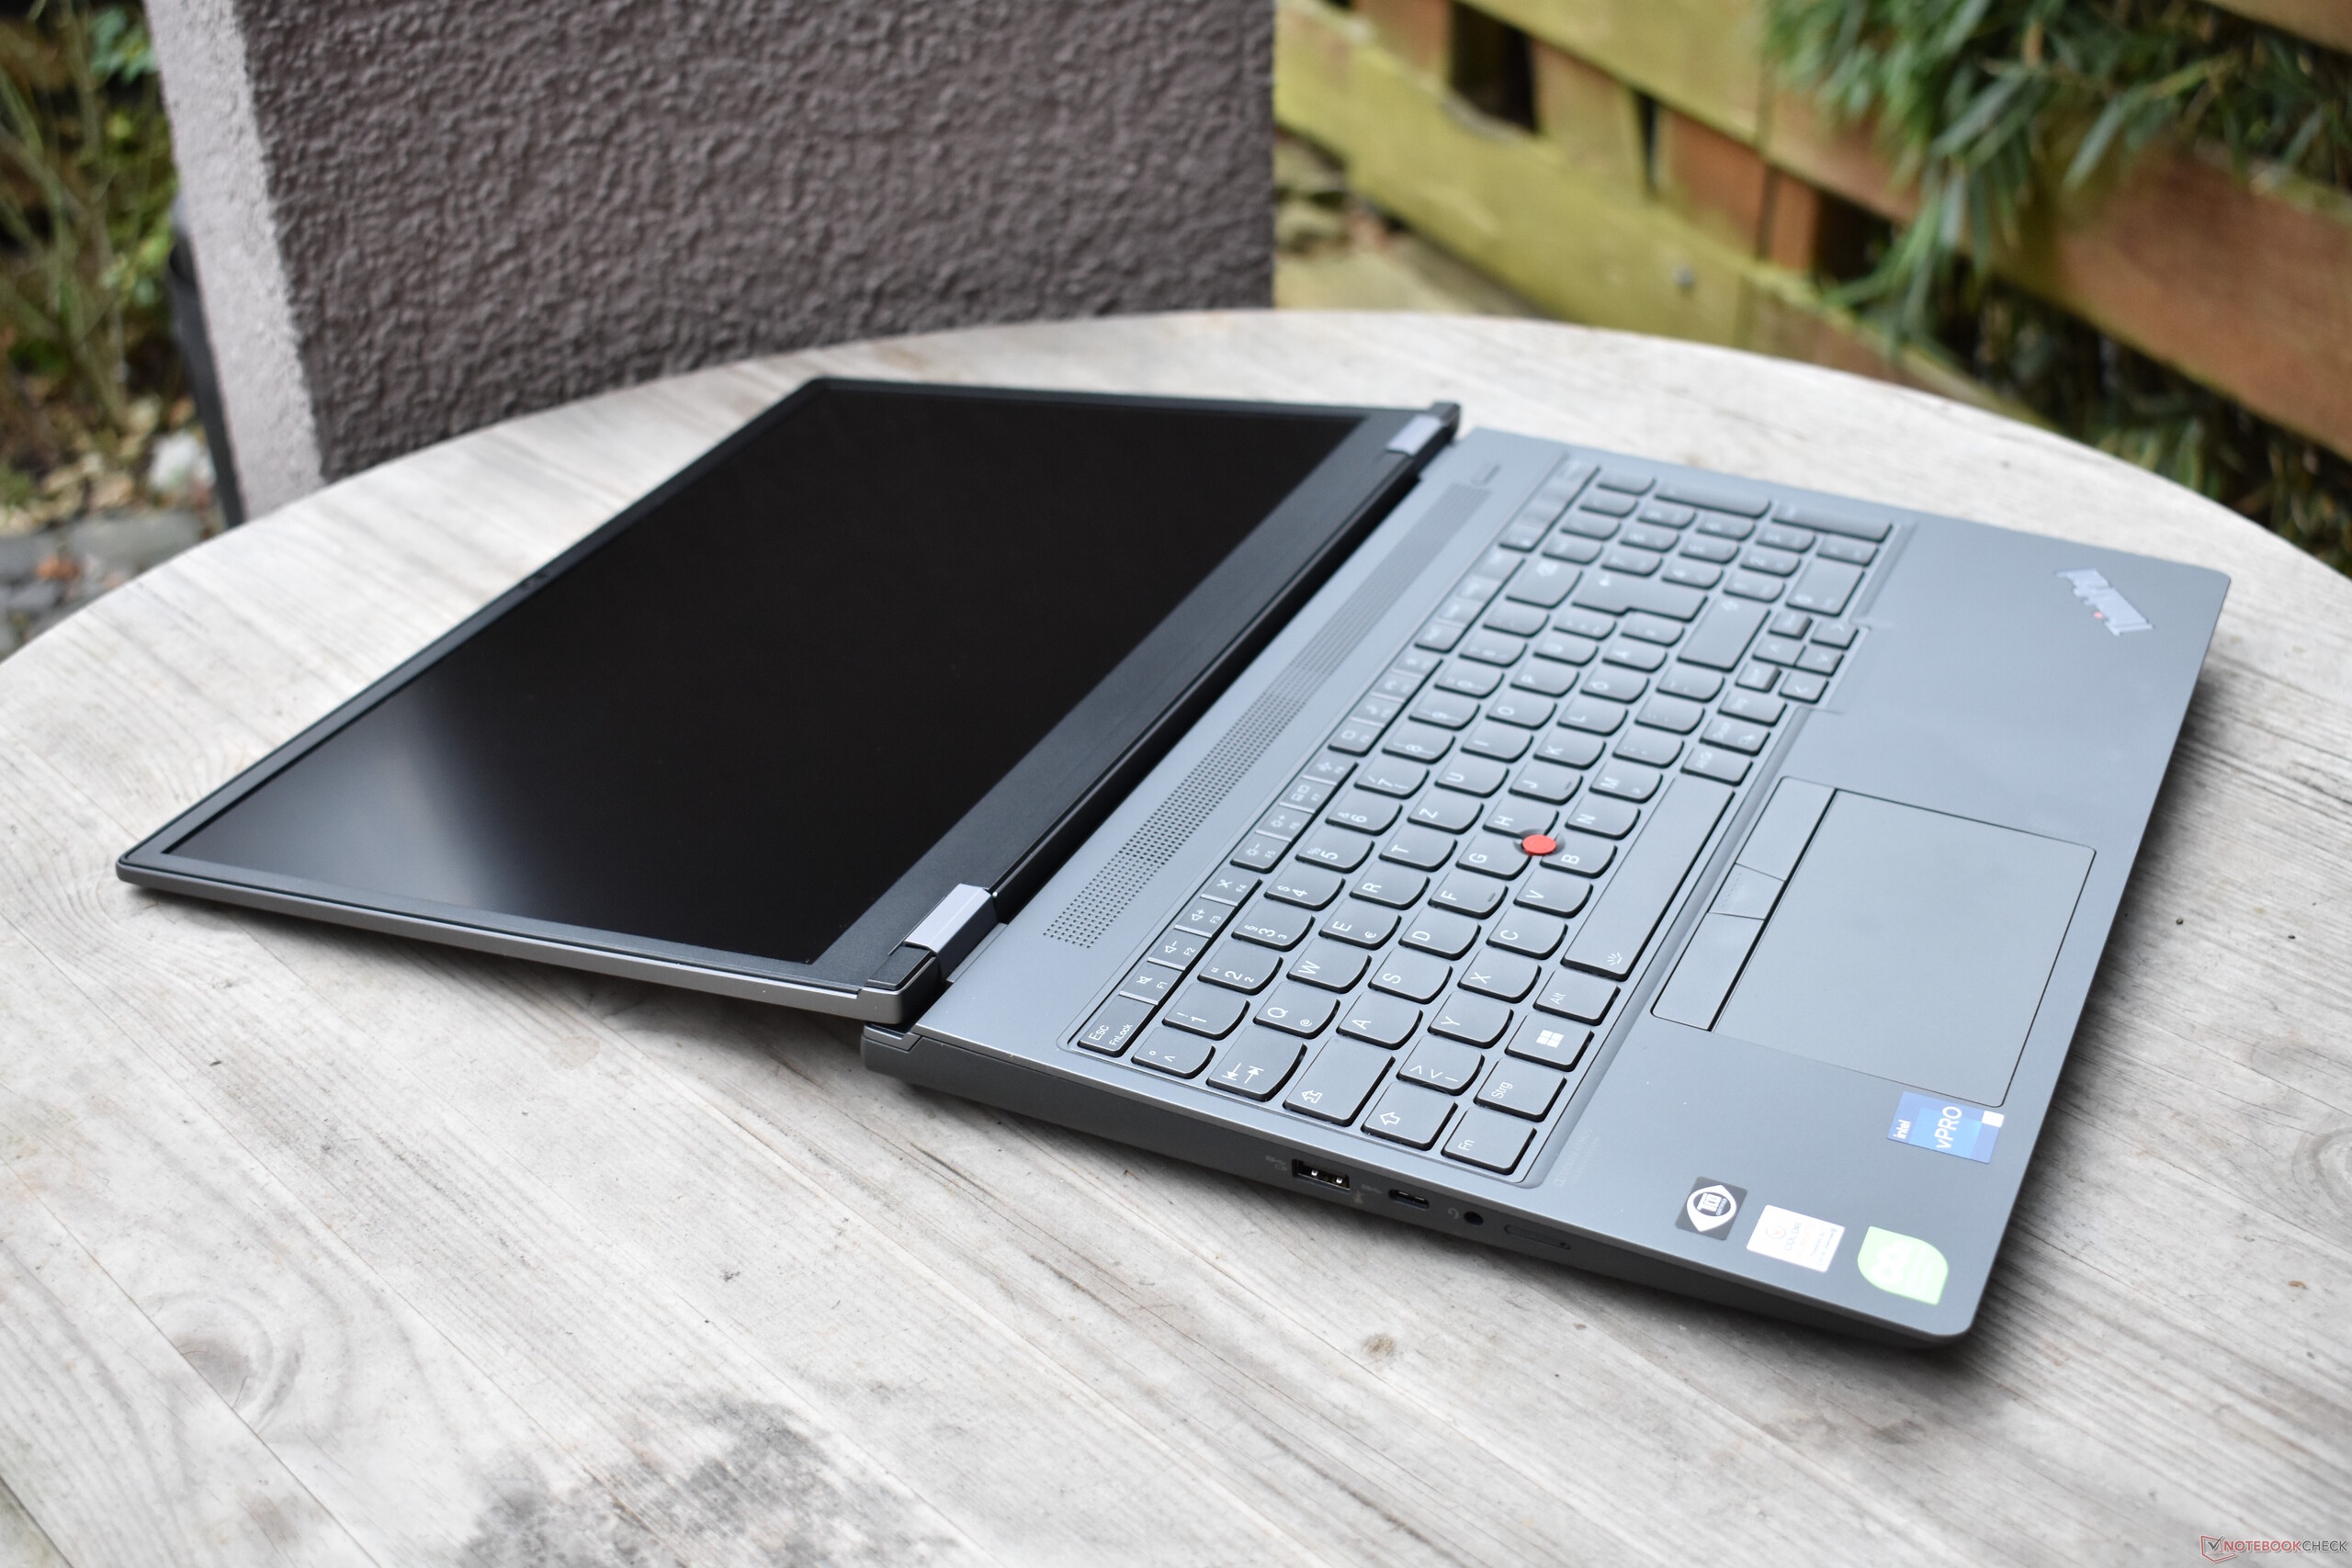
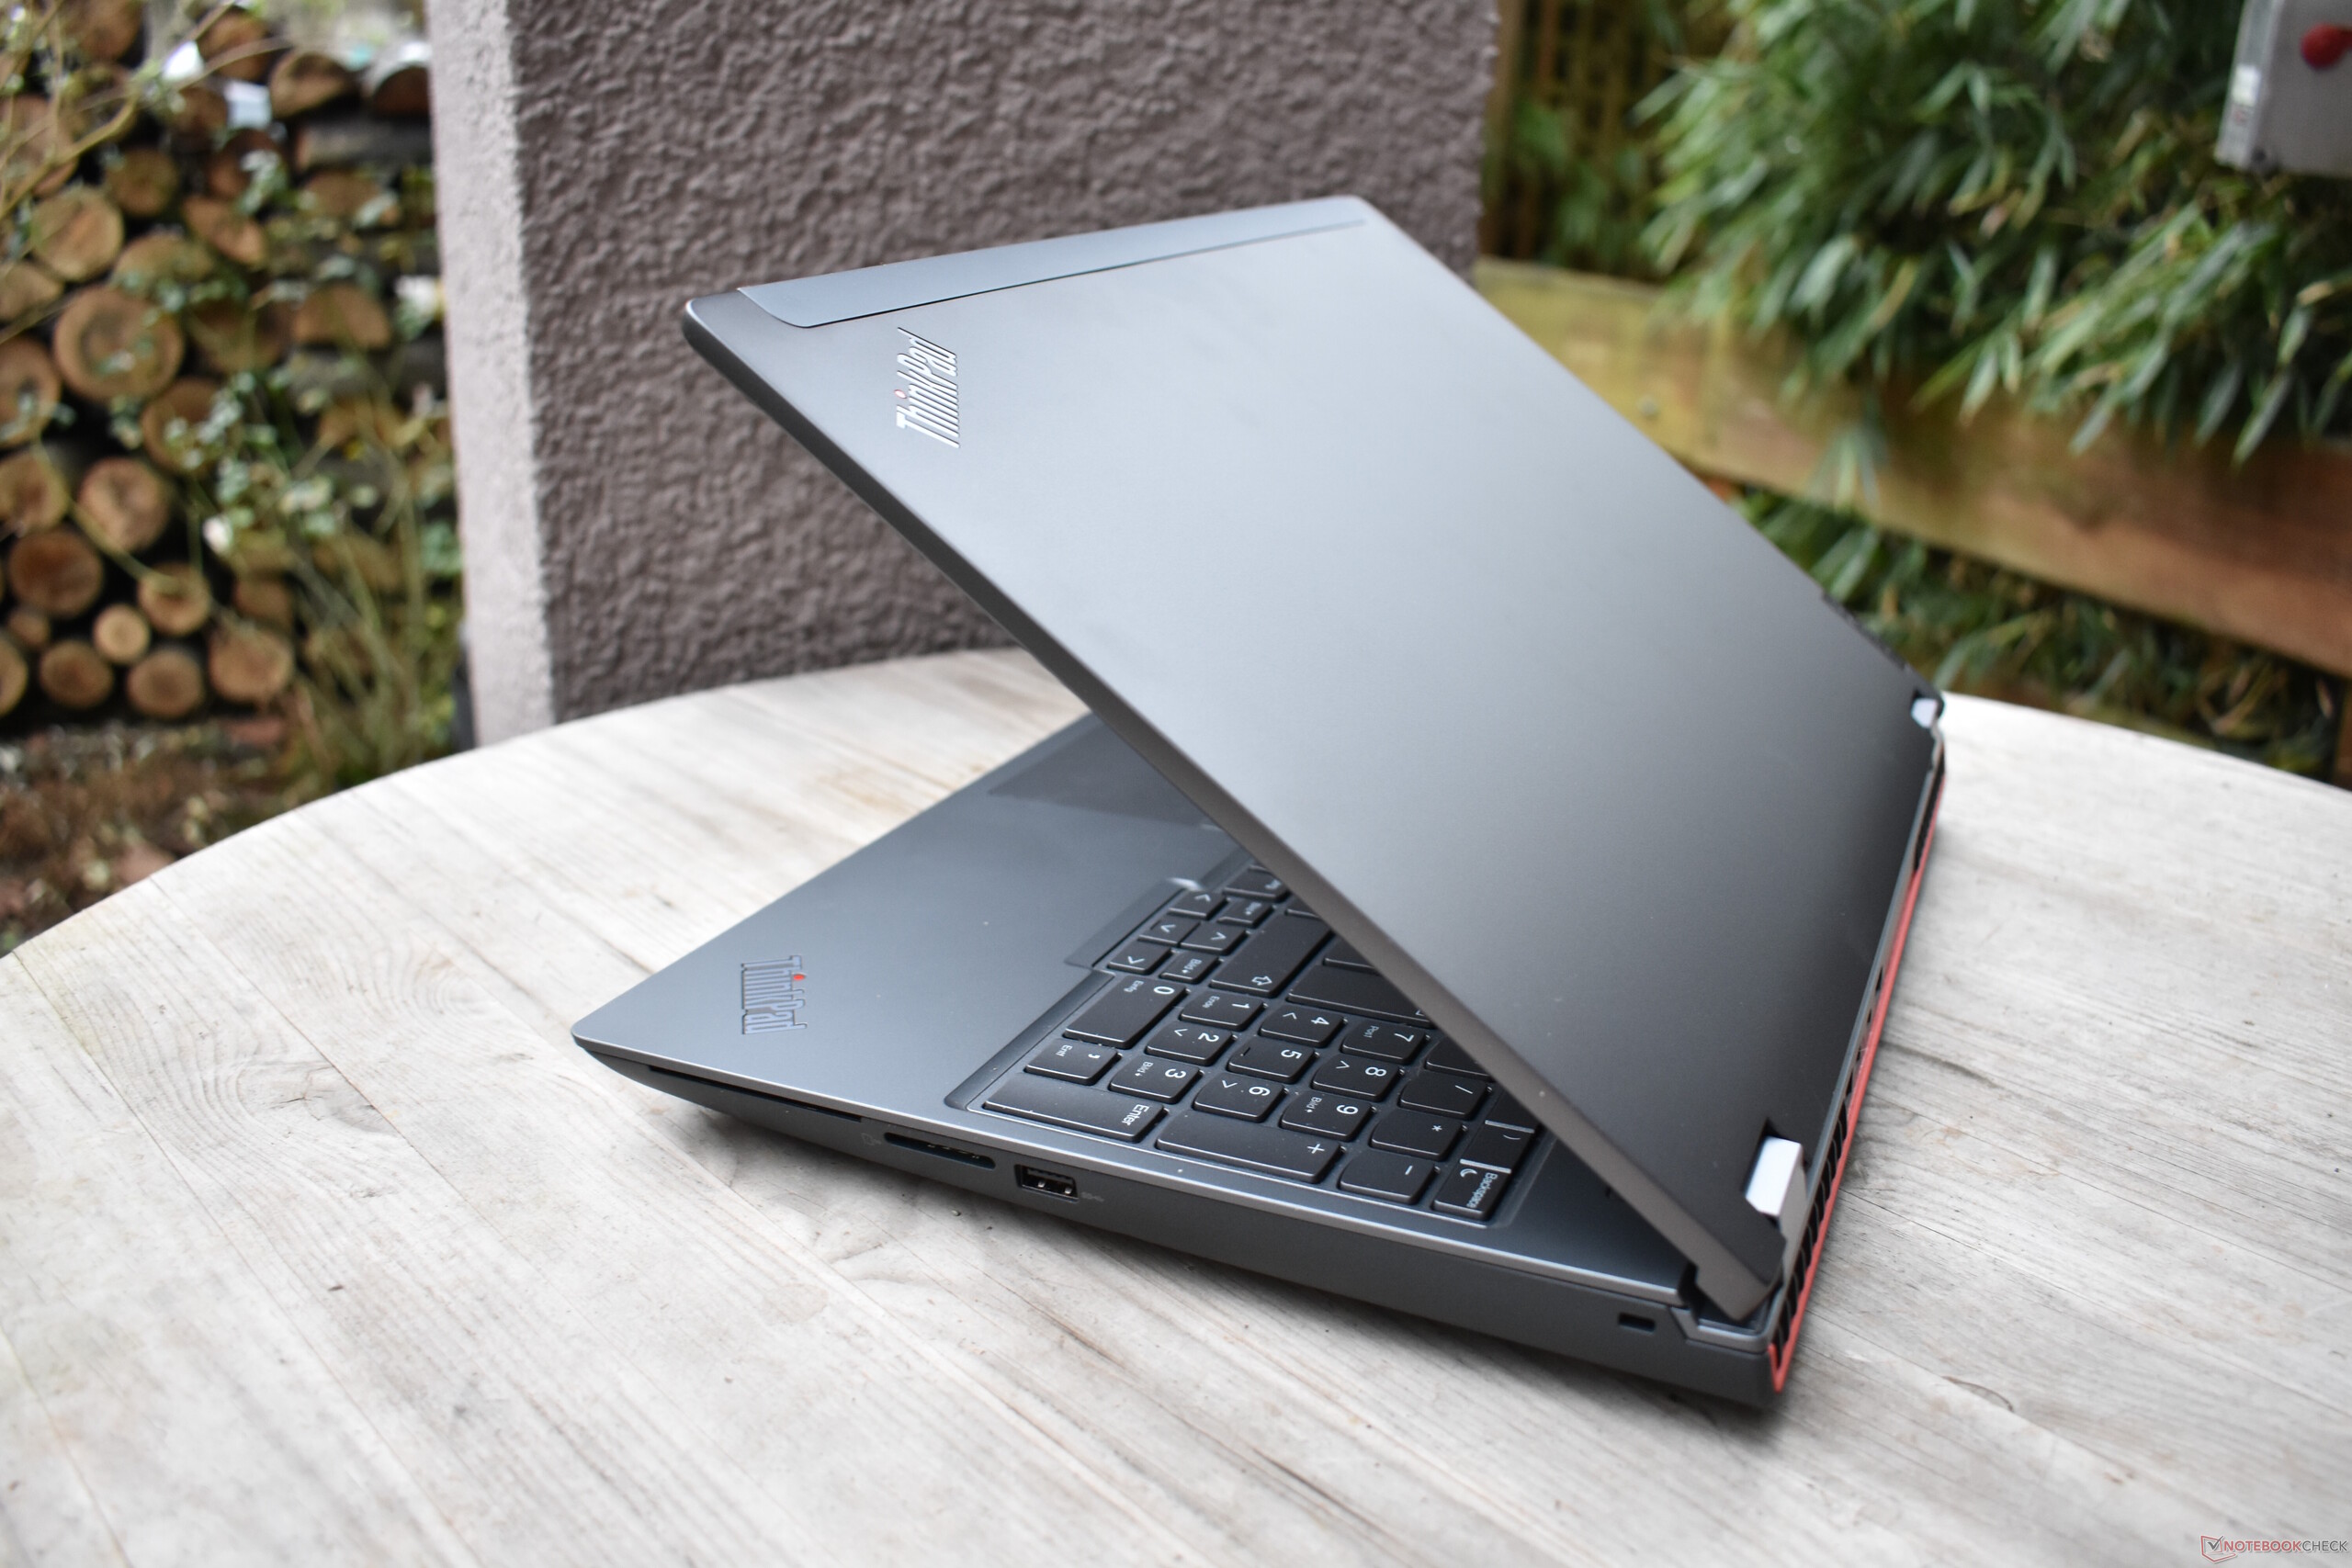
大型的顶部和底部铰链,及其突出的银色盖子,实际上与这些型号相同,并使显示器牢固地保持在原位,没有任何摇晃的迹象。显示器可以用一只手打开,角度超过180度。
与其说是P17 G3,不如说是ThinkPad P15 G3:就尺寸和重量而言,联想ThinkPad P16 G1更接近于其较小的前辈,而不是较大的前辈。
与戴尔Precision 7670 的比较也很有意思。16英寸的戴尔工作站在各方面都更具移动性,因为它不仅更小,而且更纤细、更轻。通过Precision 7770,戴尔继续提供更大、更强大的17英寸LCD变体。
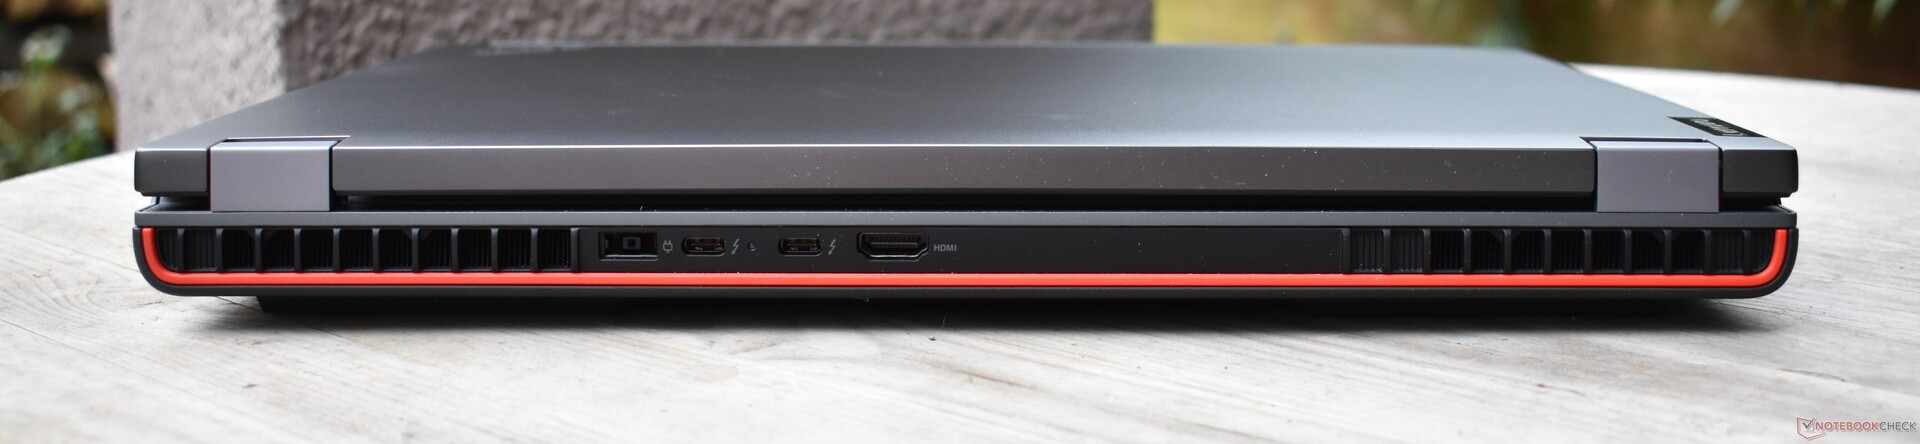
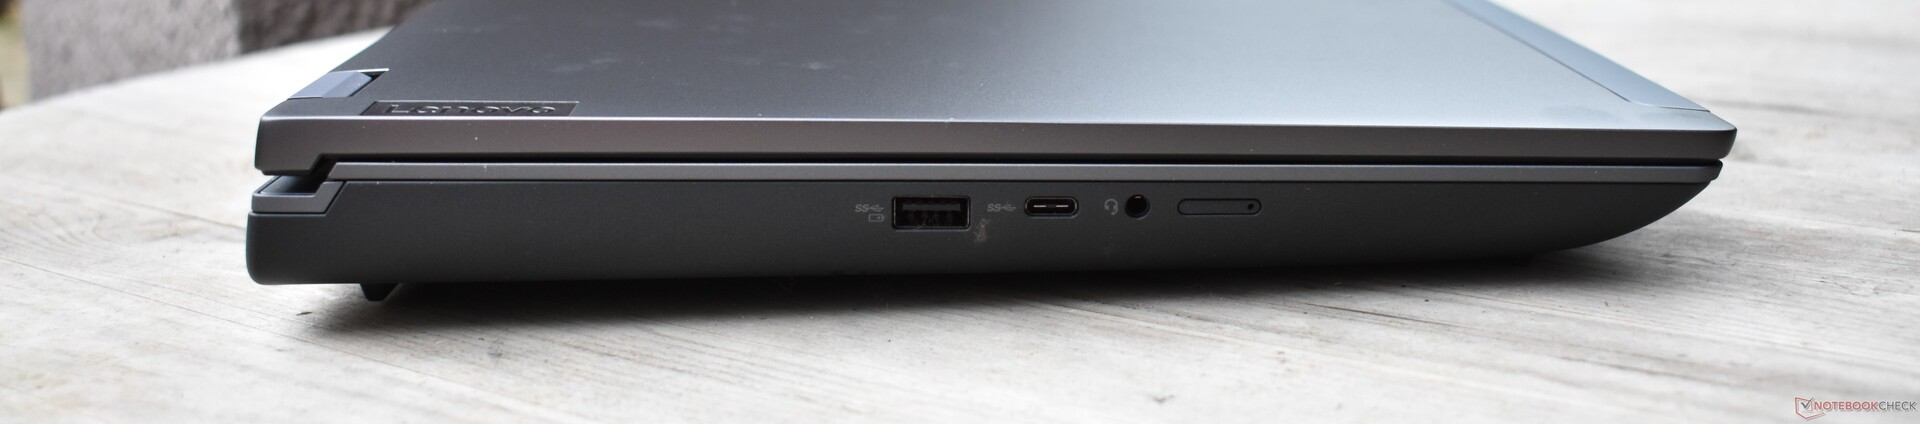
特点。一个没有RJ45的ThinkPad P16
联想更新了设计,但没有大幅改变连接选项。除了端口位置之外,只有一个变化。RJ45以太网功能已被放弃。有线互联网的使用由一个底座或一个Thunderbolt端口提供。
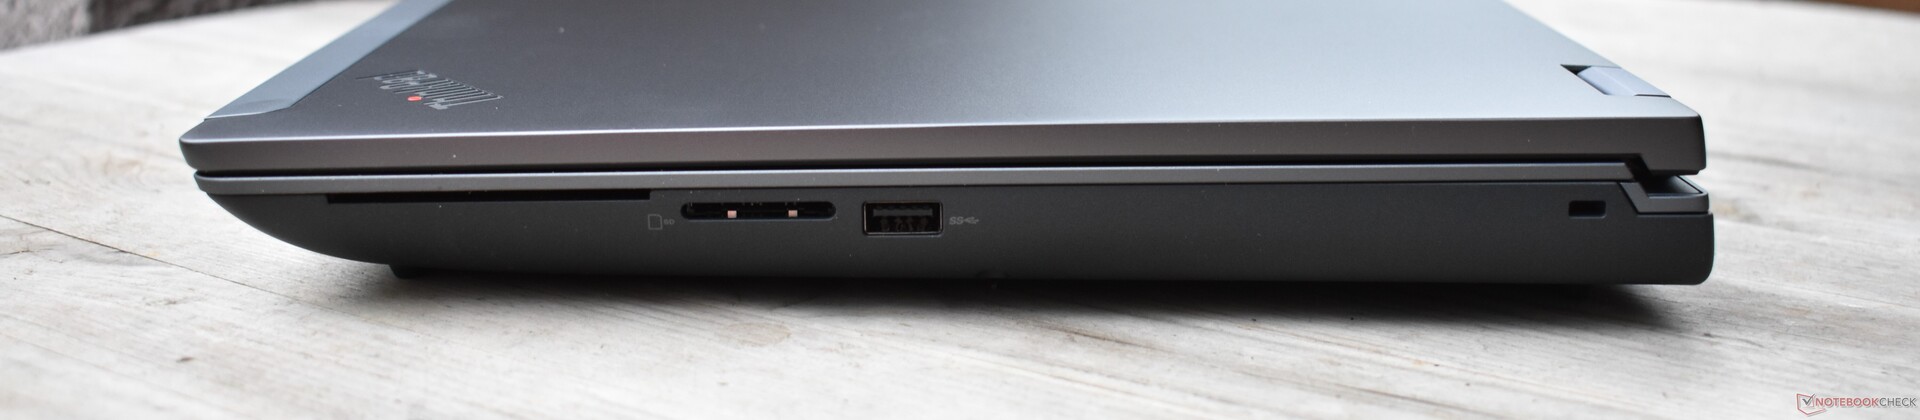
SD卡阅读器
这款SD读卡器的基准测试结果--我们用参考的AV Pro microSD 128 GB卡进行了测试--出乎意料地糟糕。对于一个工作站级别的设备以及它自己的前辈来说,分数远远低于平均水平。
| SD Card Reader | |
| average JPG Copy Test (av. of 3 runs) | |
| Lenovo ThinkPad P15 G2-20YQ001JGE (AV Pro V60) | |
| Dell Precision 7670 (Toshiba Exceria Pro SDXC 64 GB UHS-II) | |
| Lenovo ThinkPad P17 G2-20YU0025G (Toshiba Exceria Pro SDXC 64 GB UHS-II) | |
| Average of class Workstation (49.6 - 681, n=14, last 2 years) | |
| HP ZBook Fury 17 G8-4A6A9EA (Angelbird AV Pro V60) | |
| Lenovo ThinkPad P16 G1 21D6001DMB (AV Pro V60) | |
| maximum AS SSD Seq Read Test (1GB) | |
| Average of class Workstation (87.6 - 1455, n=14, last 2 years) | |
| Lenovo ThinkPad P15 G2-20YQ001JGE (AV Pro V60) | |
| Lenovo ThinkPad P17 G2-20YU0025G (Toshiba Exceria Pro SDXC 64 GB UHS-II) | |
| Dell Precision 7670 (Toshiba Exceria Pro SDXC 64 GB UHS-II) | |
| HP ZBook Fury 17 G8-4A6A9EA (Angelbird AV Pro V60) | |
| Lenovo ThinkPad P16 G1 21D6001DMB (AV Pro V60) | |
沟通
英特尔AX211WiFi-6E卡的性能比ThinkPad P15和P17的前代机型中的AX210要好。最重要的是,它在接收方面表现良好,但发送数据的速度稍慢且不稳定。
我们的评测机型没有WWAN模块(4G LTE),但可以安装一个。
| Networking | |
| Lenovo ThinkPad P16 G1 21D6001DMB | |
| iperf3 transmit AXE11000 | |
| iperf3 receive AXE11000 | |
| Lenovo ThinkPad P15 G2-20YQ001JGE | |
| iperf3 transmit AX12 | |
| iperf3 receive AX12 | |
| Lenovo ThinkPad P17 G2-20YU0025G | |
| iperf3 transmit AX12 | |
| iperf3 receive AX12 | |
| HP ZBook Fury 17 G8-4A6A9EA | |
| iperf3 transmit AX12 | |
| iperf3 receive AX12 | |
| Dell Precision 7670 | |
| iperf3 transmit AXE11000 6GHz | |
| iperf3 receive AXE11000 6GHz | |
| Asus ExpertBook B6 Flip B6602FC2 | |
| iperf3 transmit AXE11000 6GHz | |
| iperf3 receive AXE11000 6GHz | |
| iperf3 transmit AXE11000 | |
| iperf3 receive AXE11000 | |
网络摄像头
总的来说,1080p网络摄像头产生的图像是冲淡的、模糊的、有噪音的。


安全问题
除了电源按钮中内置的指纹识别器,联想ThinkPad P16 2022还有一个兼容Windows Hello的红外摄像头。Kensington锁可以提供保护,还有一个可选的智能卡读卡器。联想ThinkPad P16有一个专用的TPM芯片,网络摄像头拥有一个机械相机快门。
辅料
除了170瓦的电源,以及一个Slim Tip连接器外,该笔记本电脑没有其他配件。最重要的可选配件应该是一个底座,如ThinkPad Thunderbolt 4工作站底座。
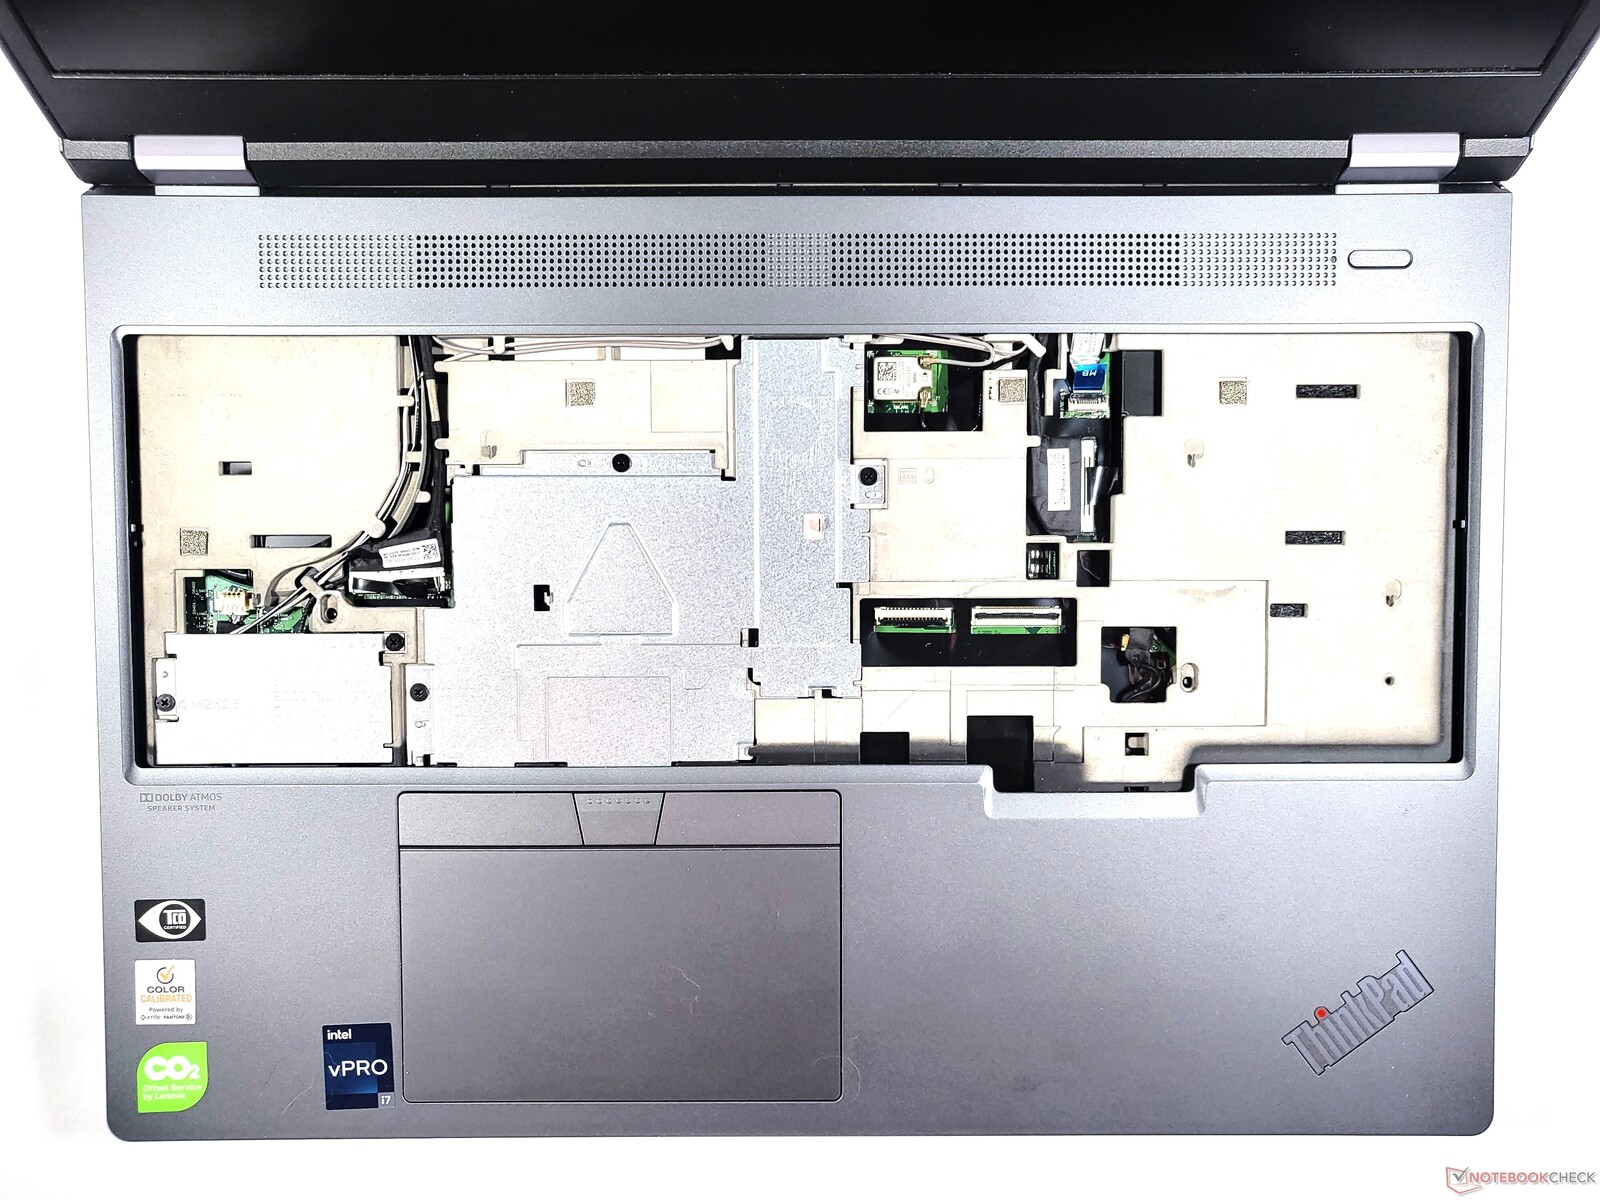
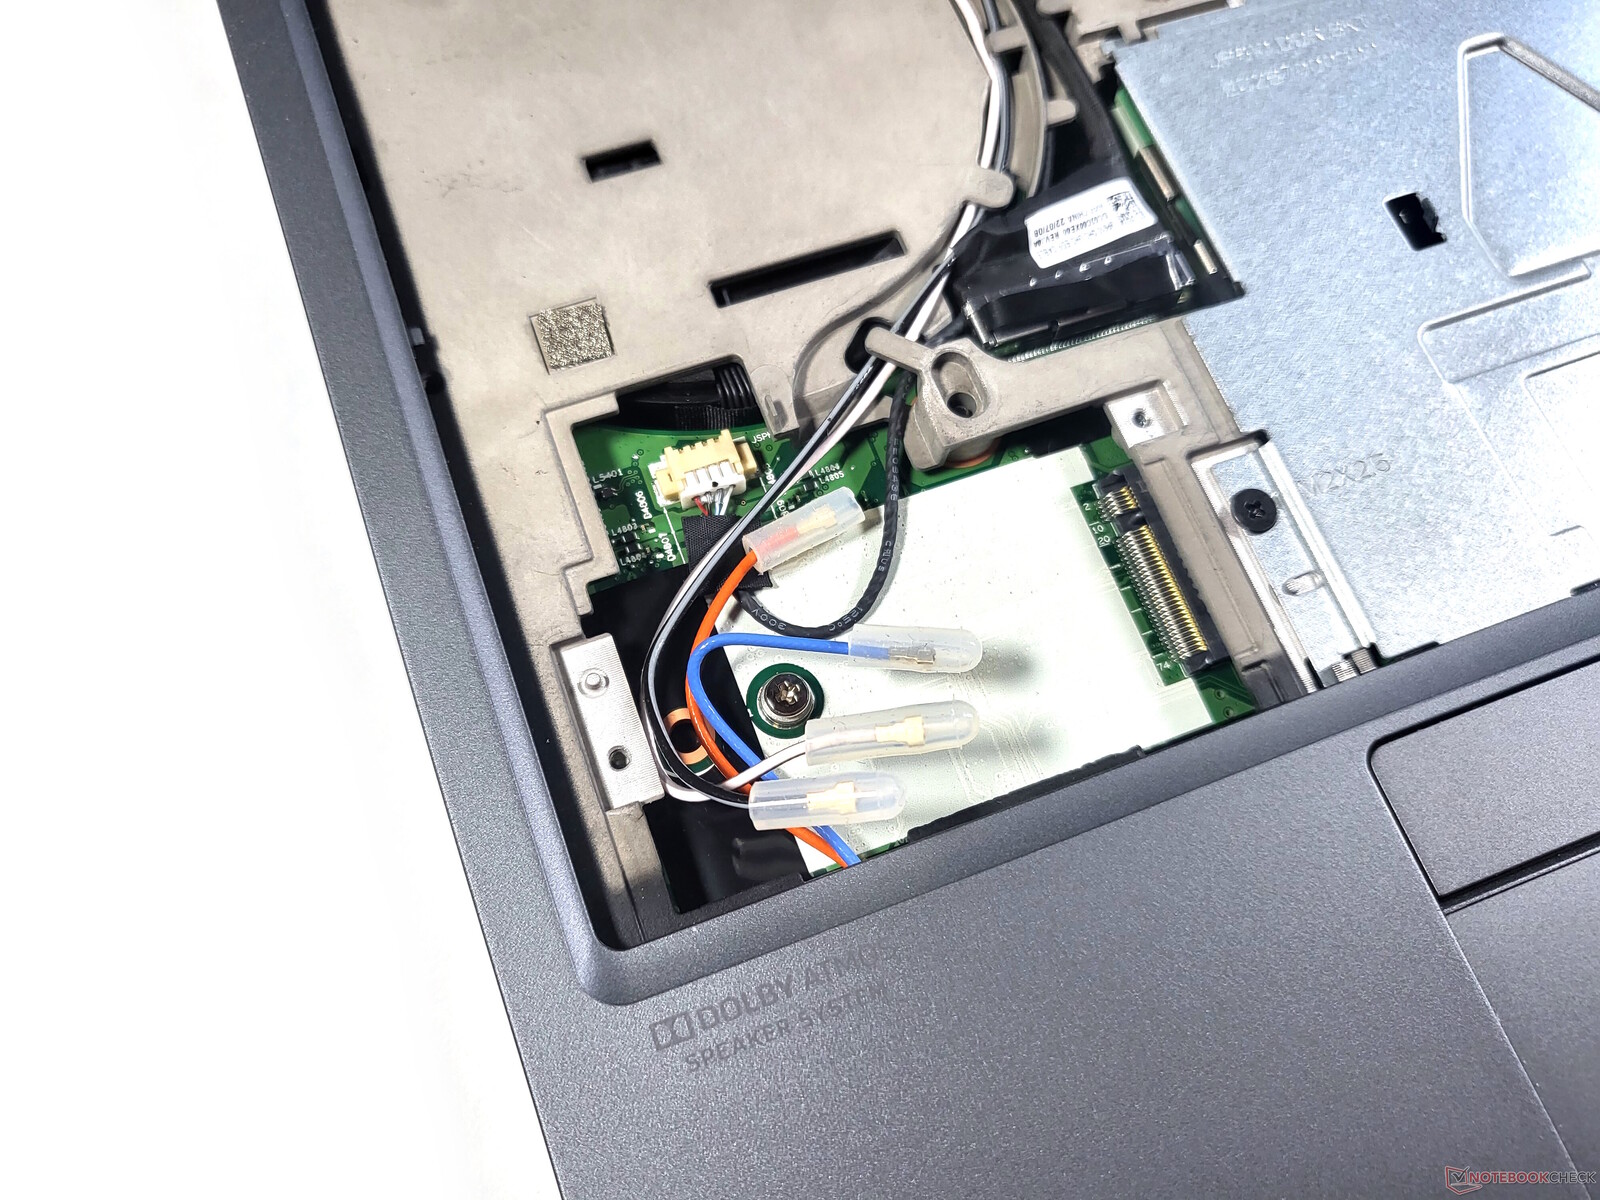
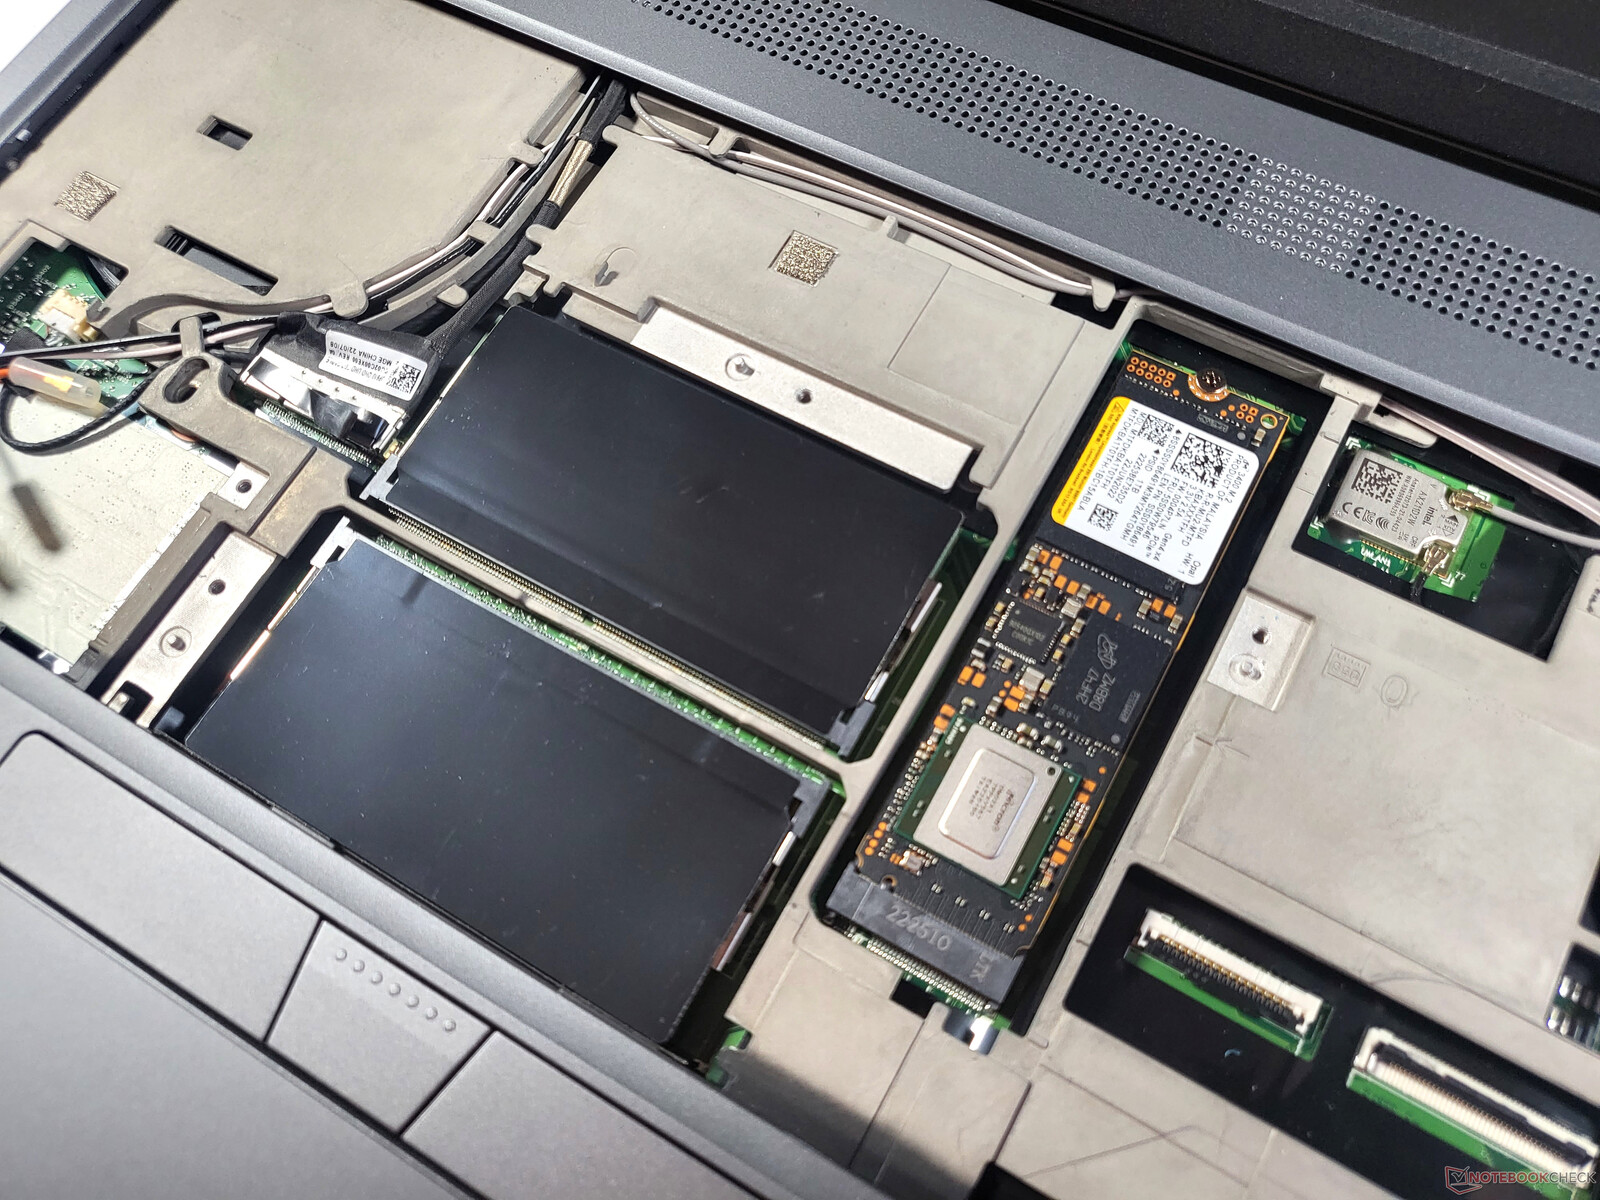
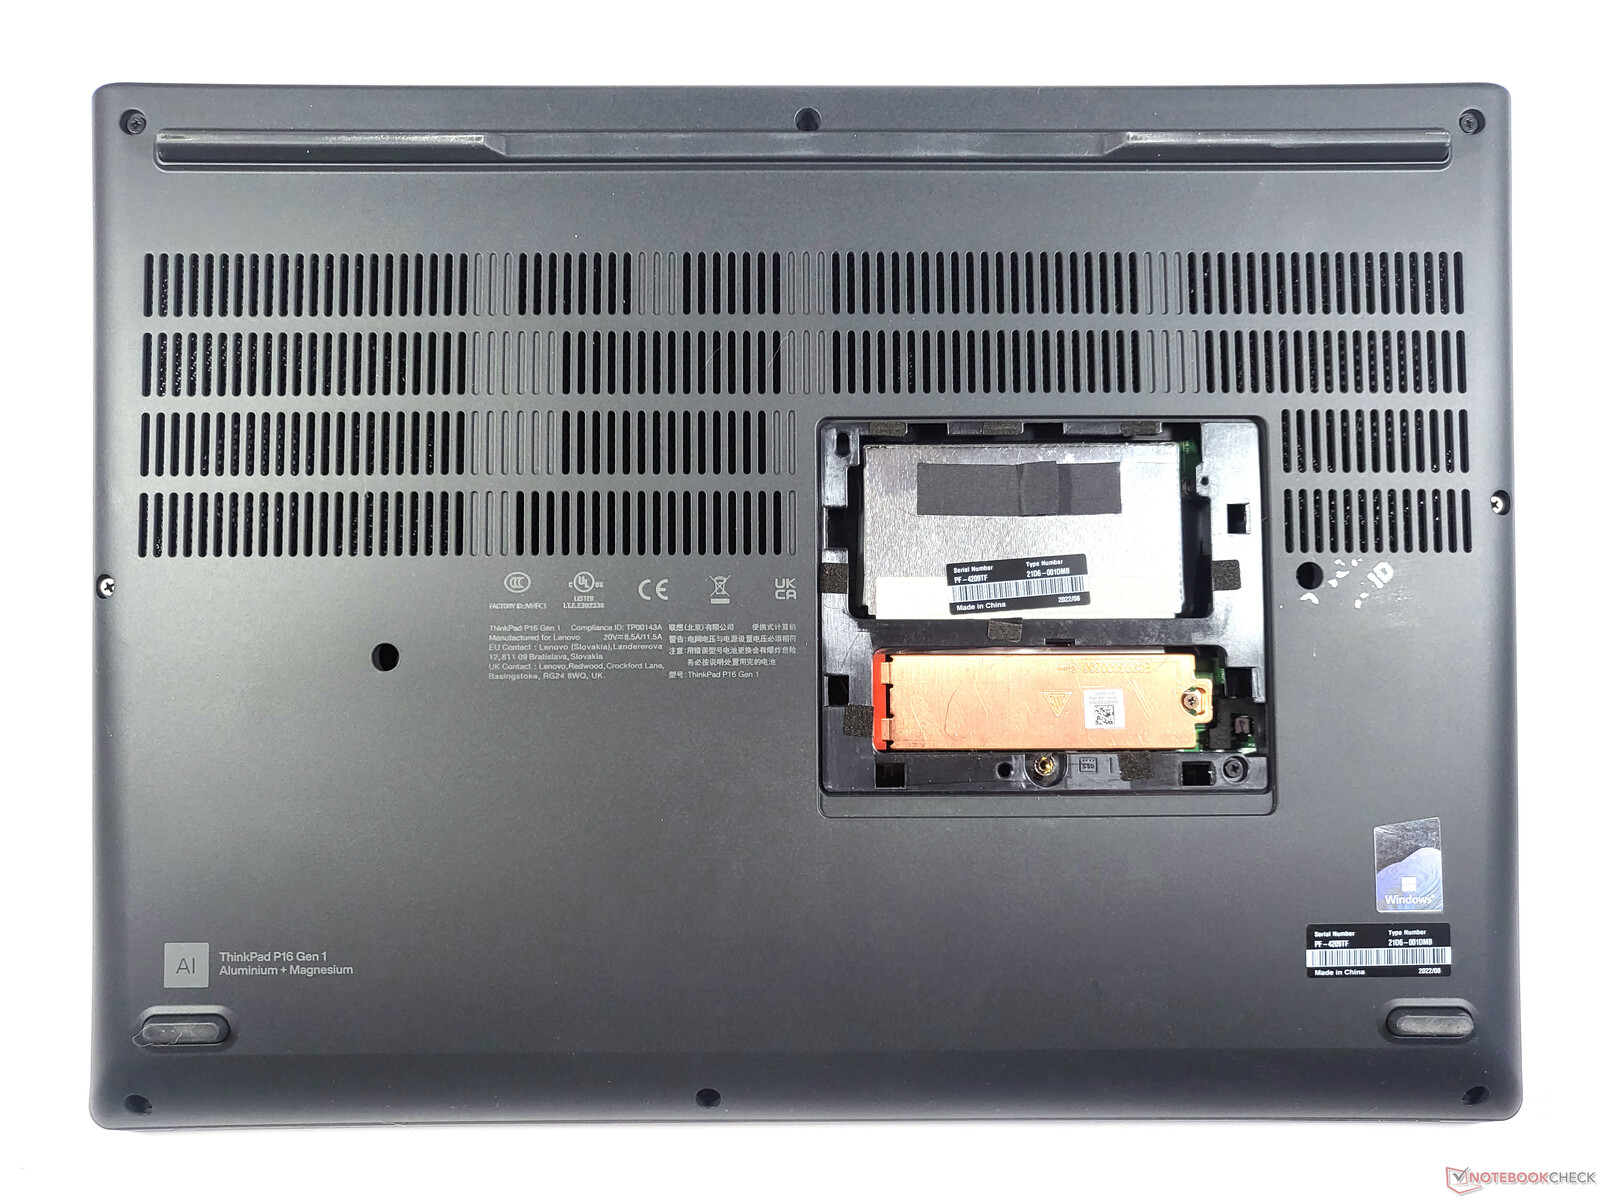
维护
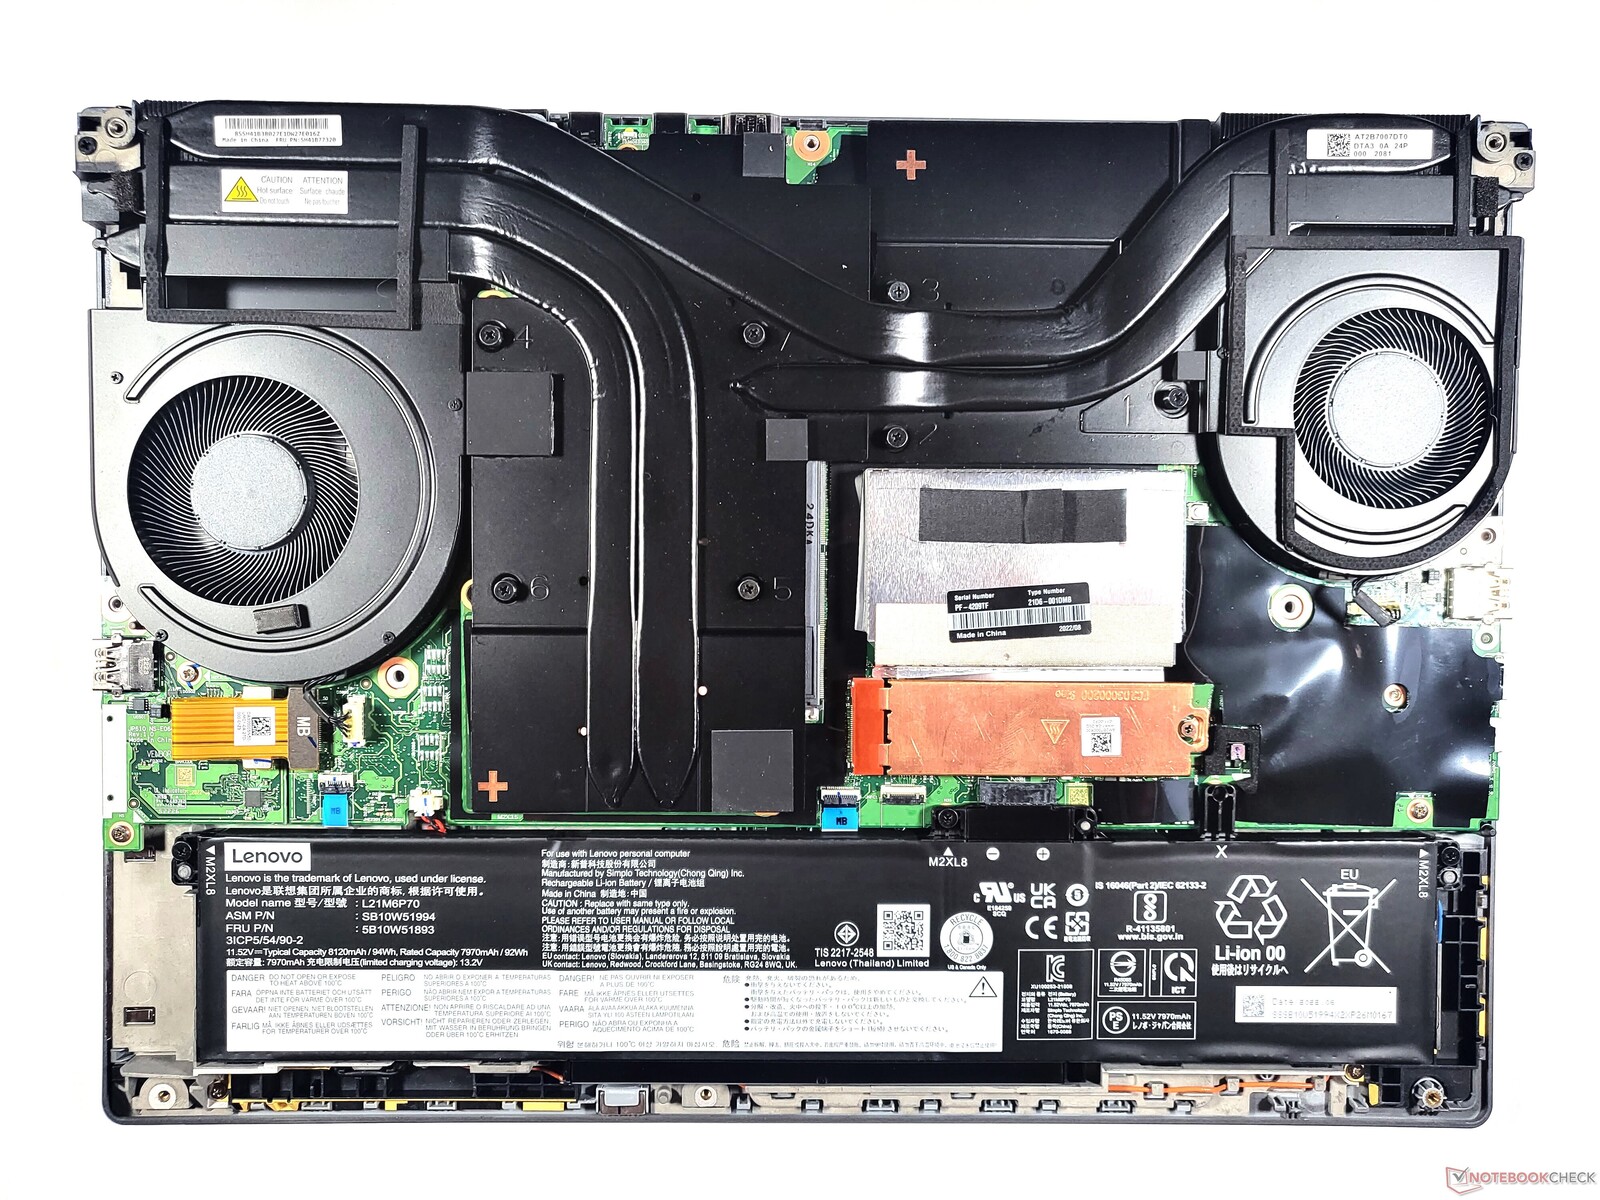
联想使其非常容易接触到四个内存插槽中的两个,因为只需要移除设备底部的小盖子。在这里你还可以找到一个免费的M.2 2280插槽。要接近其他内存插槽、第二个M.2插槽、焊接的WiFi模块以及WWAN插槽则稍显困难:键盘必须为其让路。最后一个障碍是两个金属盖子。笔记本电脑的底部还有另外十个用塑料钩子固定的十字头螺钉。卸下这部分,你可以清楚地看到大型冷却系统,总共有两个风扇和内部电池。
所有这些步骤都可以进行,而不会使保修失效。通过《硬件维护手册》 ,联想已经提供了一套合适的说明。
担保
开箱后,联想ThinkPad P16第一代商务笔记本电脑有3年保修期。如果再加钱,还可以延长到5年。我们的评测设备有现场服务的高级支持。然而,大多数ThinkPad P16的配置需要额外的附加费用才能享受这一功能。客户只在德国有权享受这些扩展服务选项。在国际上,可以享受带入保证。
输入设备。ThinkPad P现在也有1.5毫米的键程。
键盘
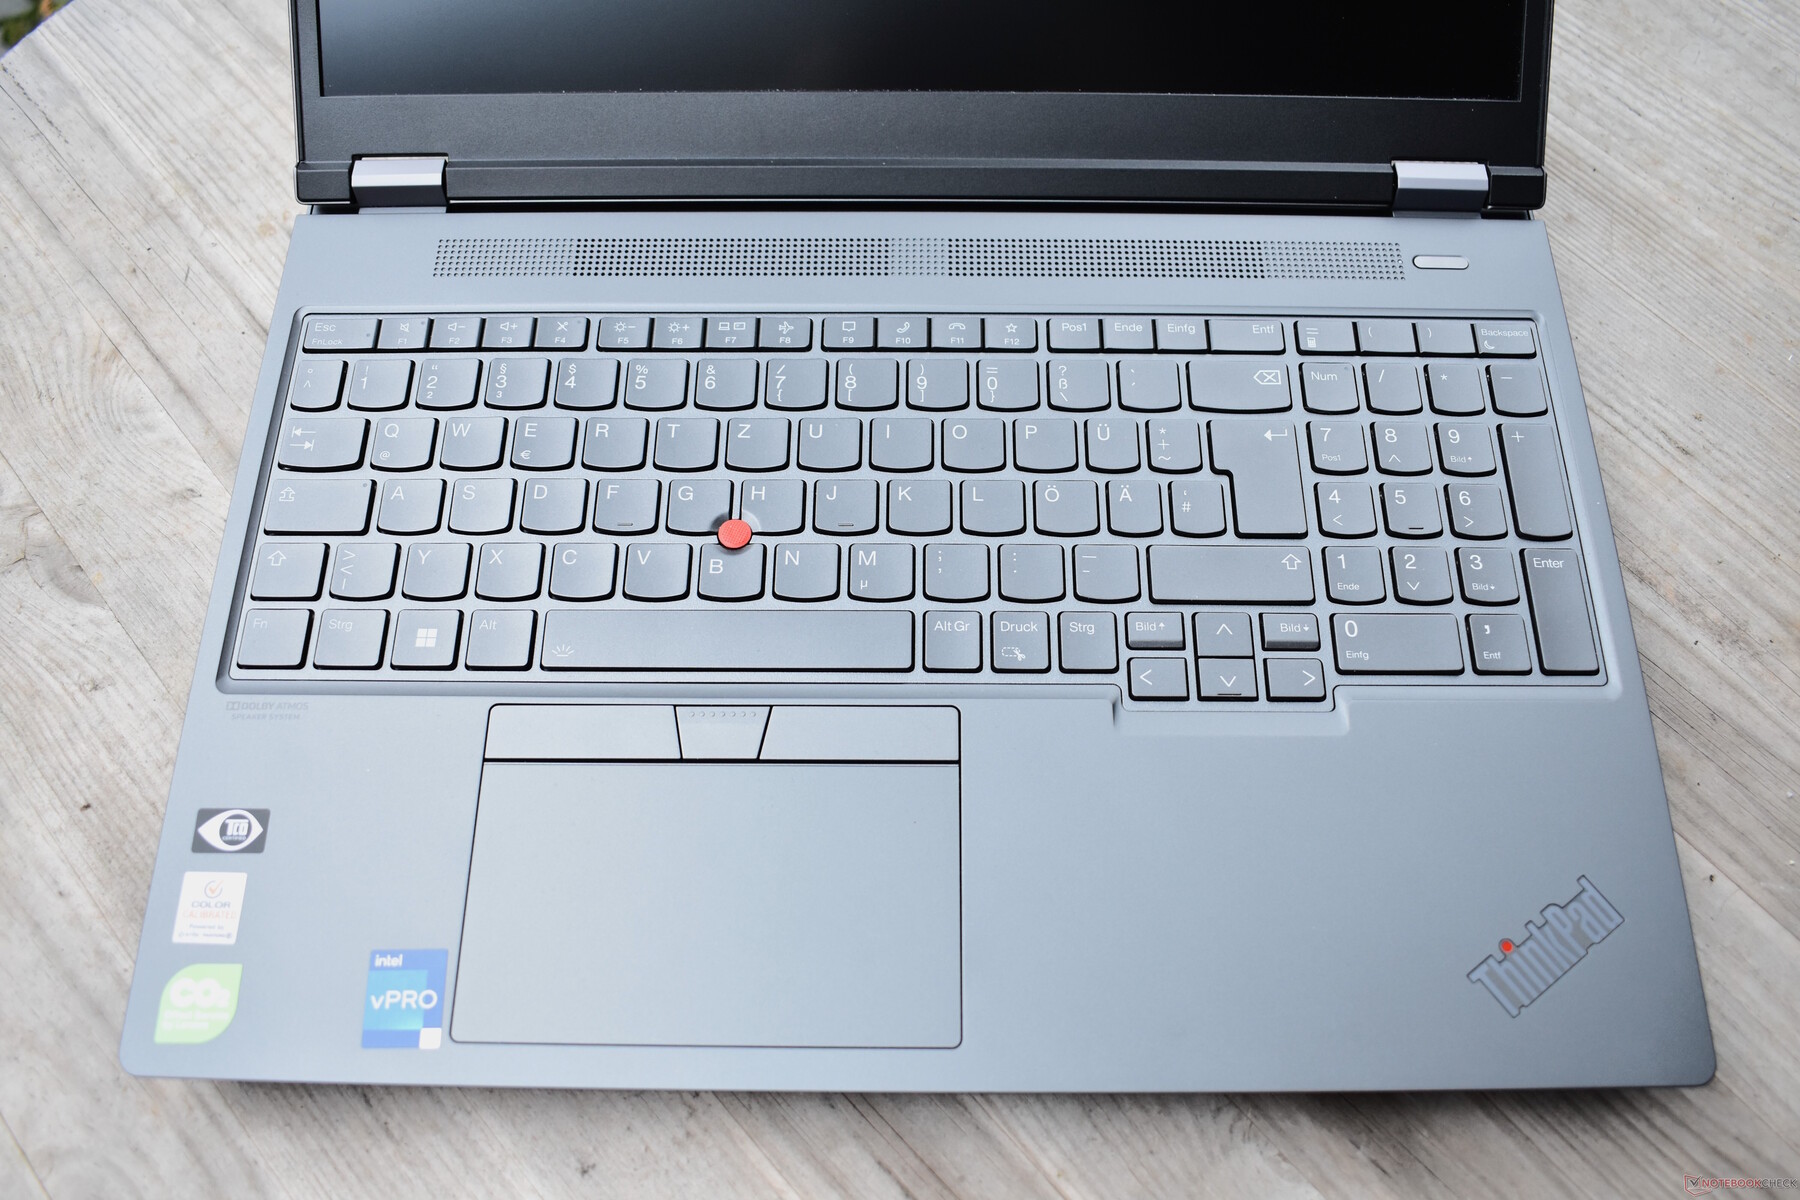
从颜色开始,联想对ThinkPad P16的键盘进行了完全的改造。键盘现在整体为灰色,在我们看来,这看起来并不那么高级。虽然这是一个相对不重要的批评点,但将背光键盘的键程从1.8毫米减少到现在的1.5毫米以及减少的按键高度的决定是非常重要的。因此,ThinkPad键盘失去了一点以前的特殊魅力。尽管如此,我们仍然面对着一个非常好的键盘,提供了一个美妙的愉快的打字体验--尽管现在没有多少东西能将联想的设备与惠普和戴尔的竞争对手区分开来。这是一个谜,为什么联想自己会选择缩短这样一个大而厚的工作站的键程。
联想没有对布局做任何改变,一切如旧。一个变化是光学性质的,因为外键现在是方形的,而不是圆形的。由于这些不是字母键,它没有对打字体验造成负面影响。与圆形键类似,方形键在形状上有些凹陷。
触摸板和TrackPoint
联想ThinkPad P16 G1的触摸板比前代机型显得更宽,从宽度上看,它现在已经增长了11.5厘米。其表面由塑料制成,感觉比前代产品更加光滑。在操作方面,触摸板非常好,可以出色地翻译多点触摸手势。然而,触觉反馈与玻璃材质的触控板相比有差距。由于我们面对的是一个机械触控板,所以只能在触控板的下部进行点击。点击机制相当沉闷,但不会发出响声或晃动。
如果在打字时需要快速移动鼠标指针,TrackPoint仍然是触摸板的良好替代品。与前代产品相比,红色的、有橡胶帽的指点杆保持不变。相比之下,联想重新设计了TrackPoint的专用按键,现在看起来更加现代,但在可用性方面没有任何损失。
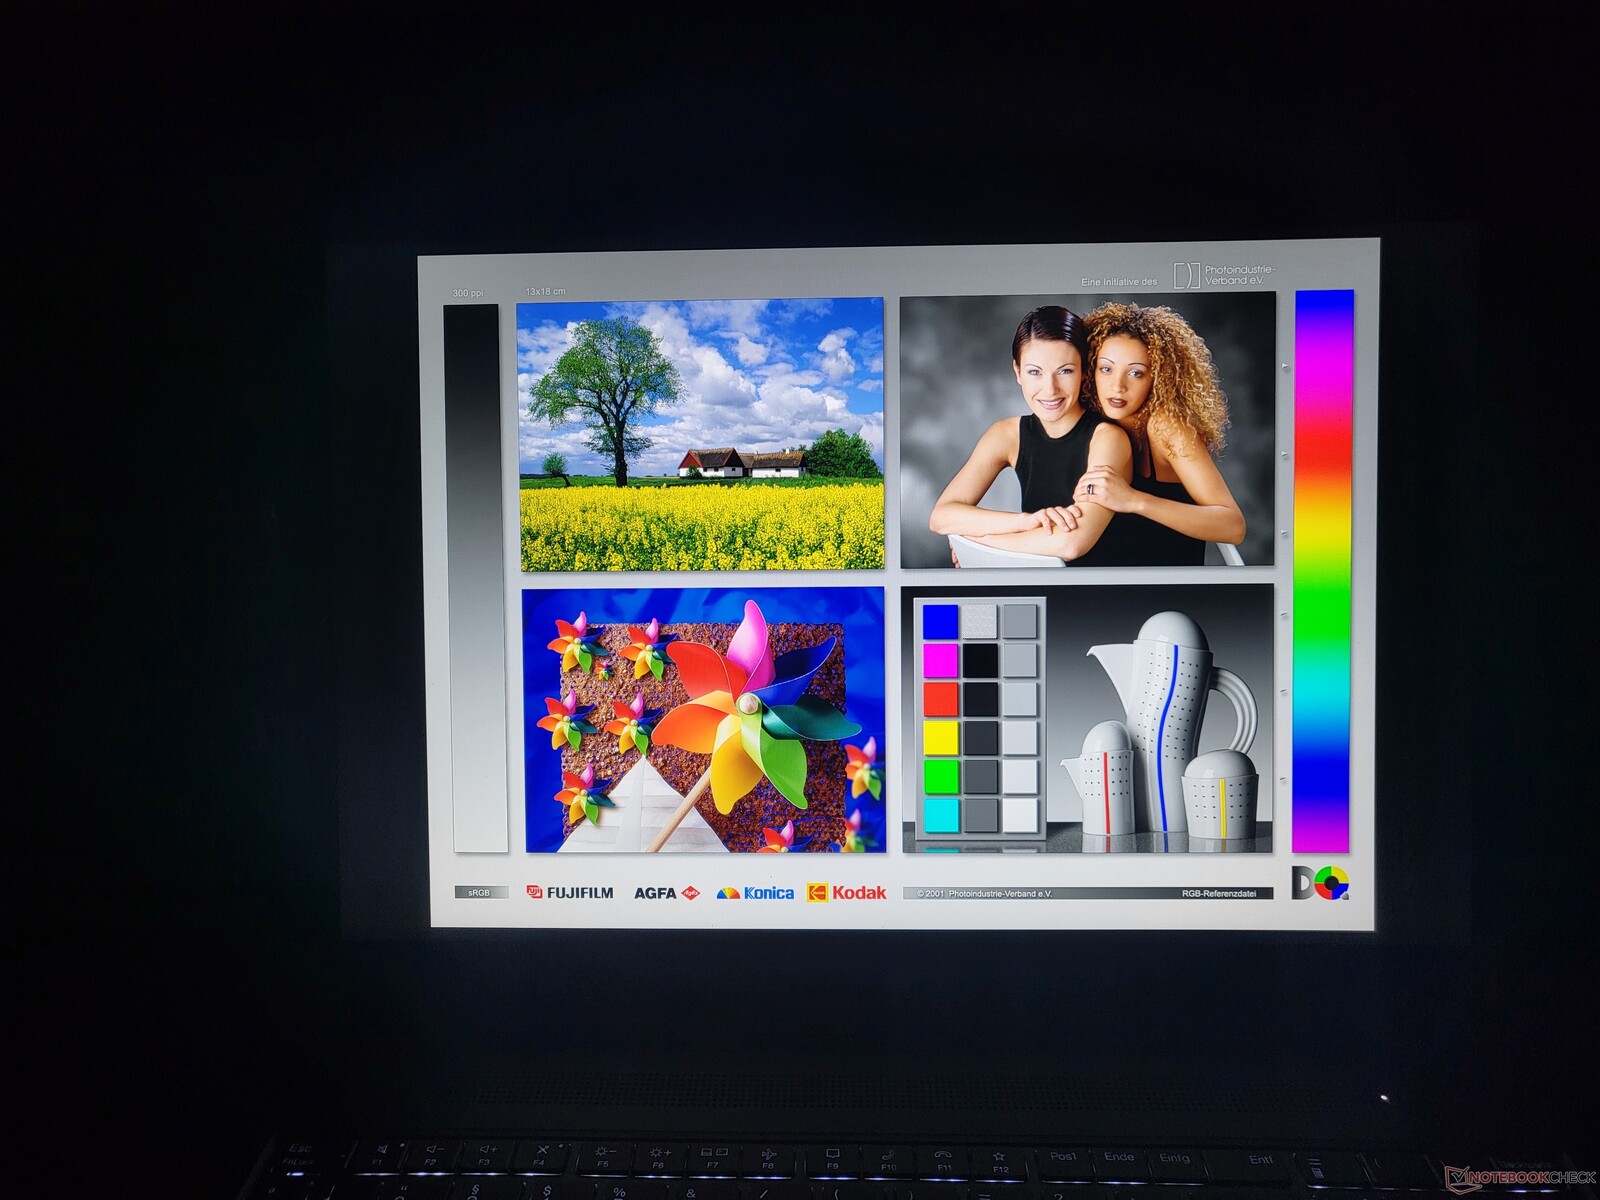
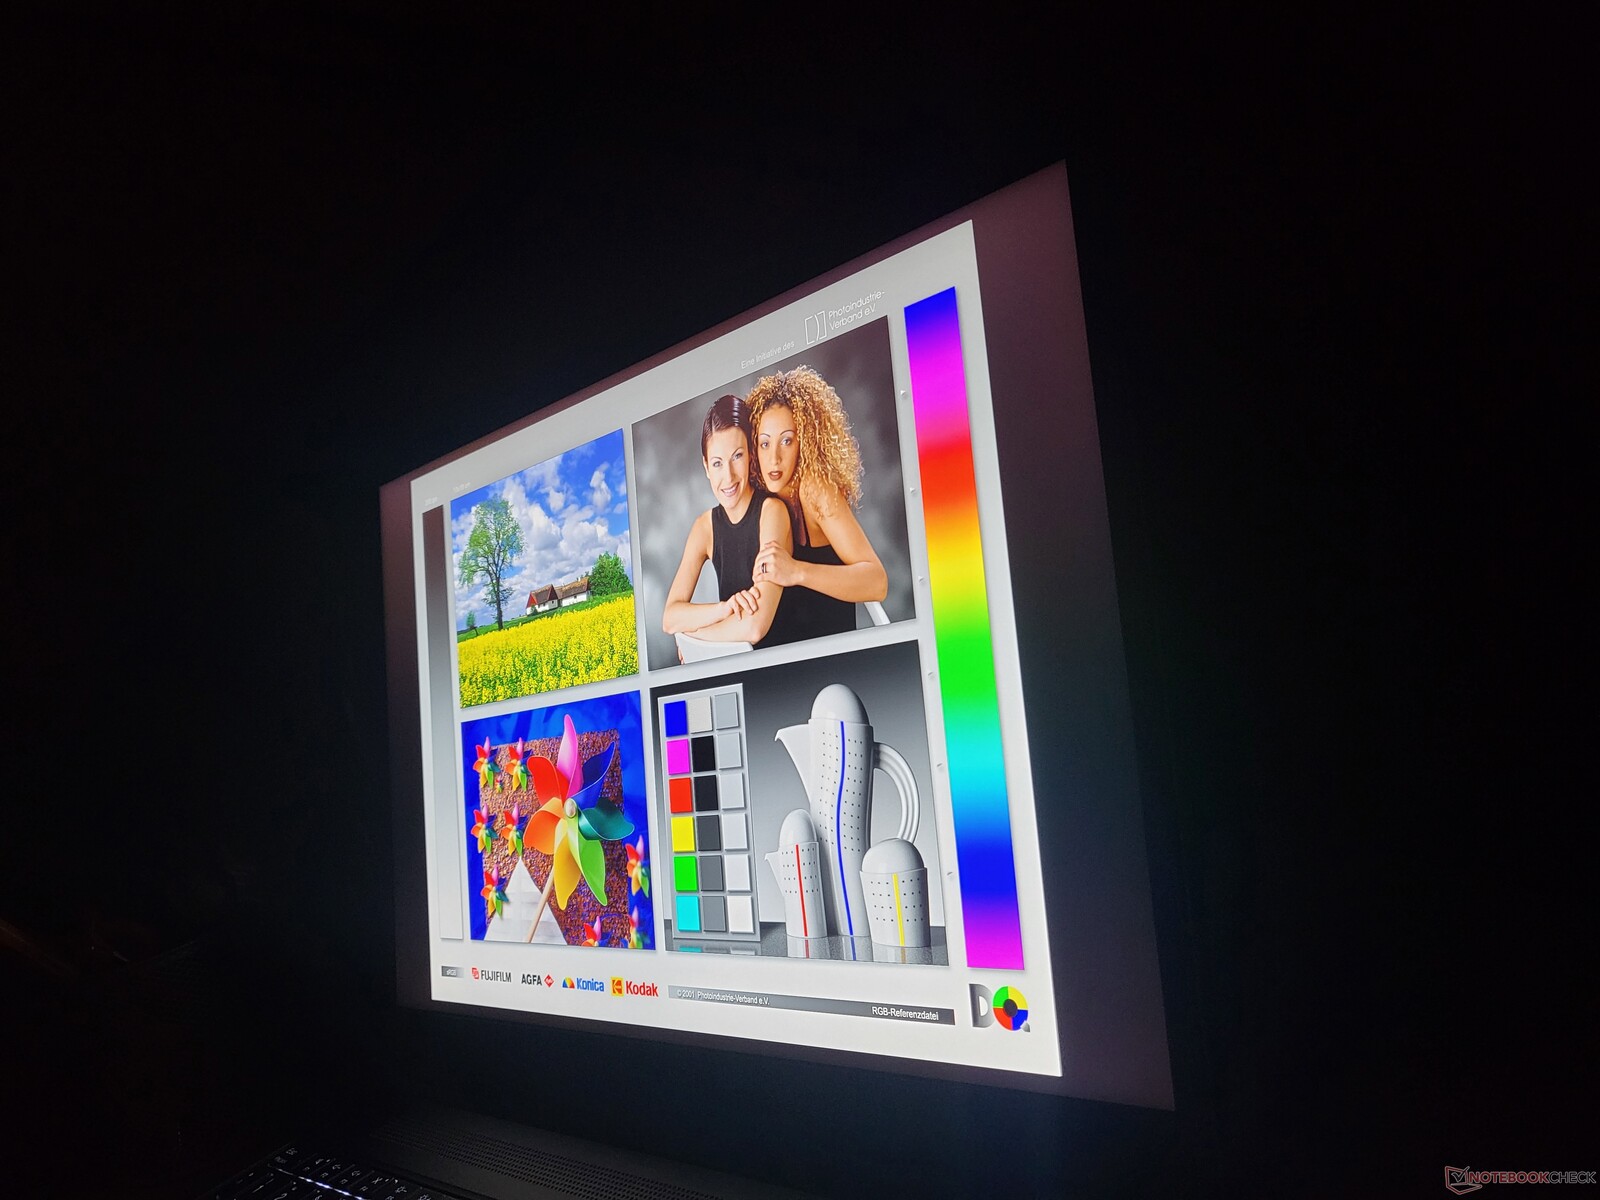
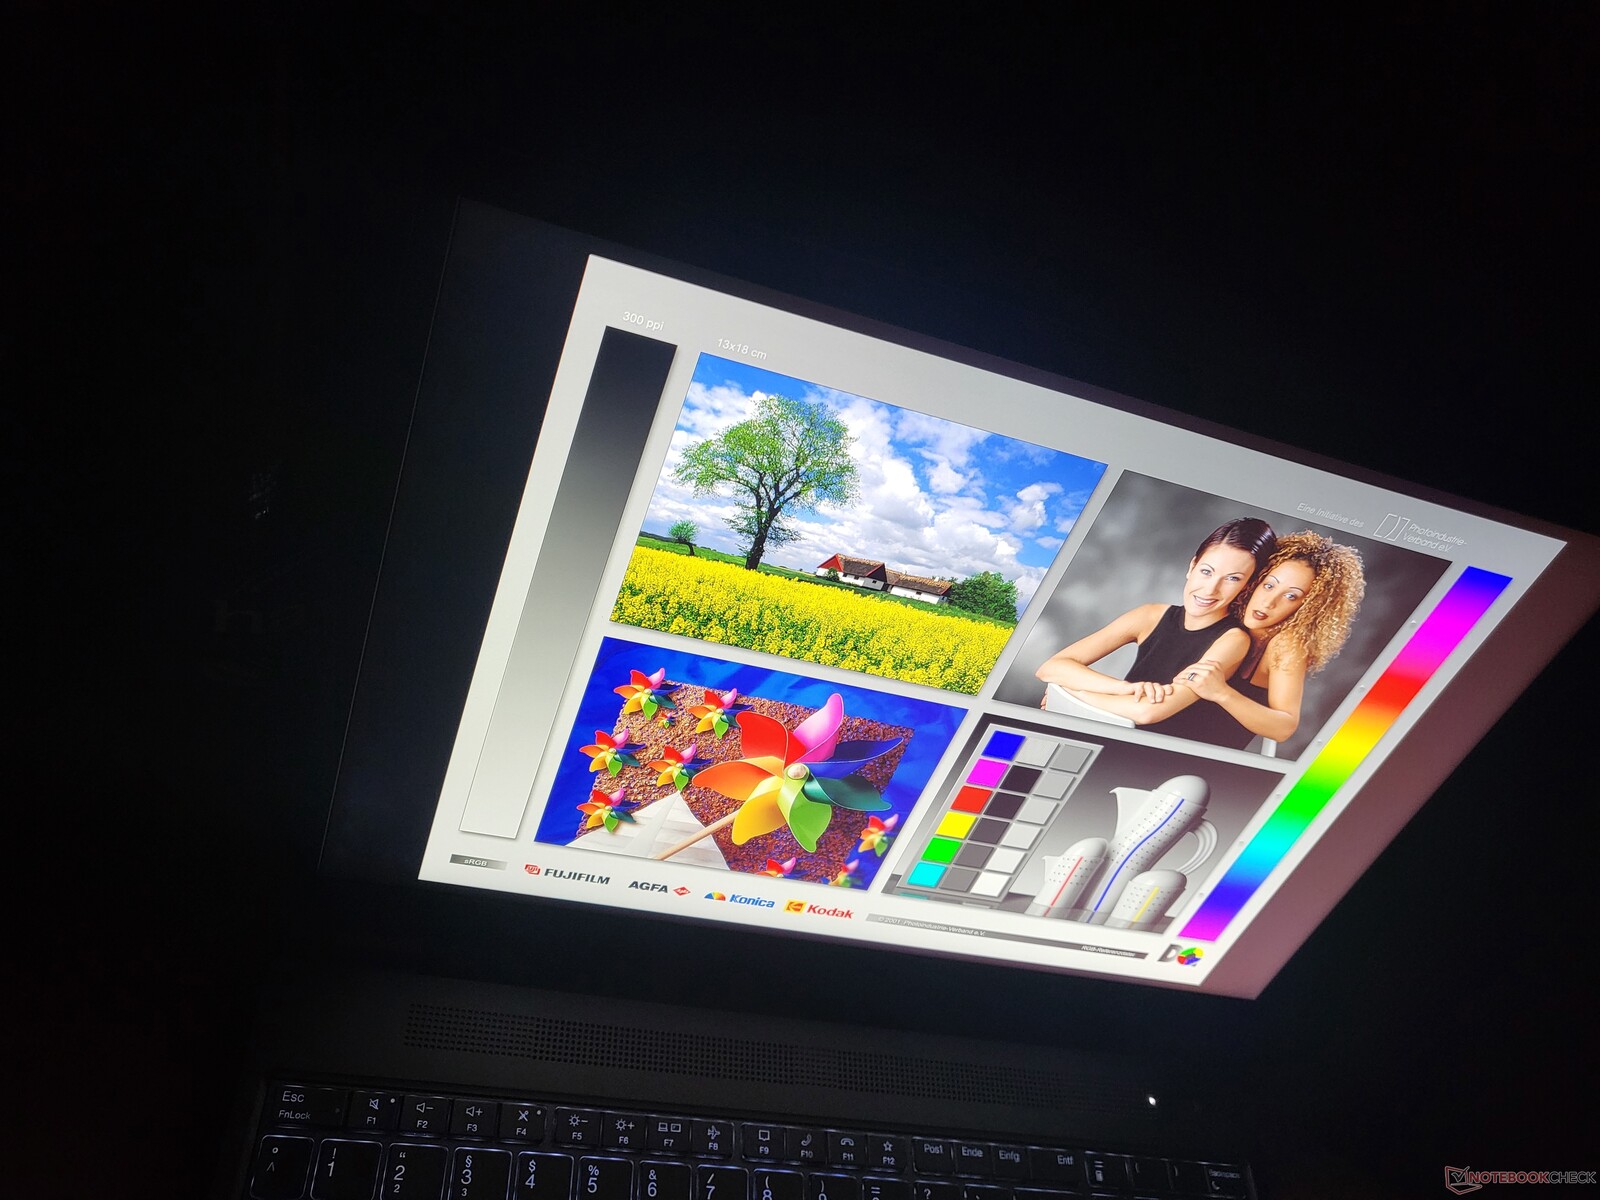
显示屏。用于Thinkpad工作站的新WQXGA液晶显示器选项
与ThinkPad笔记本电脑的惯例一样,联想ThinkPad P16 2022提供了各种显示屏选择,涵盖了各种应用和价格类别。它们的共同点是16:10的长宽比以及16英寸面板。
- WUXGA (1920 x 1200), IPS, 300 cd/m², 100 % sRGB, 亚光
- WQXGA (2560 x 1600), IPS, 400 cd/m², 100 % sRGB, 亚光
- WQUXGA (3840 x 2400), IPS, 600 cd/m², 100 % AdobeRGB, 亚光
- WQUXGA (3840 x 2400), OLED, 400 cd/m², 100 % DCI-P3, anti-glare, multi-touch
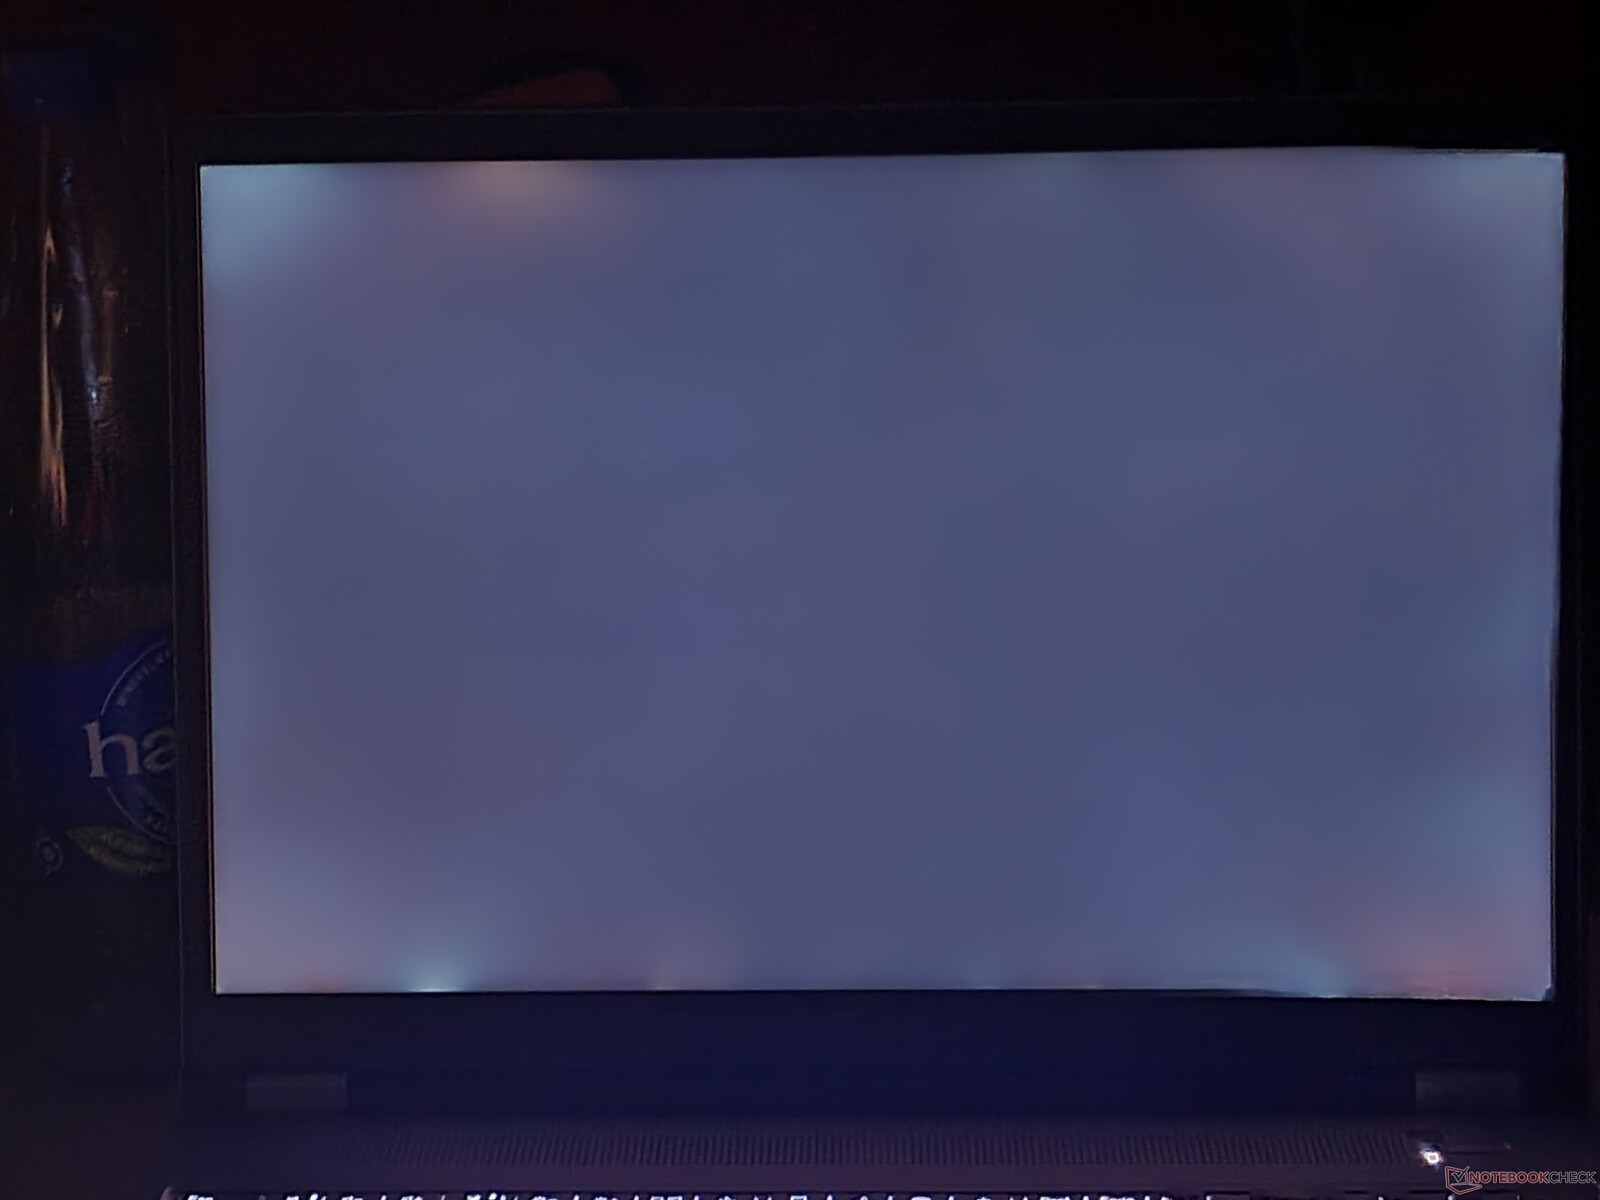
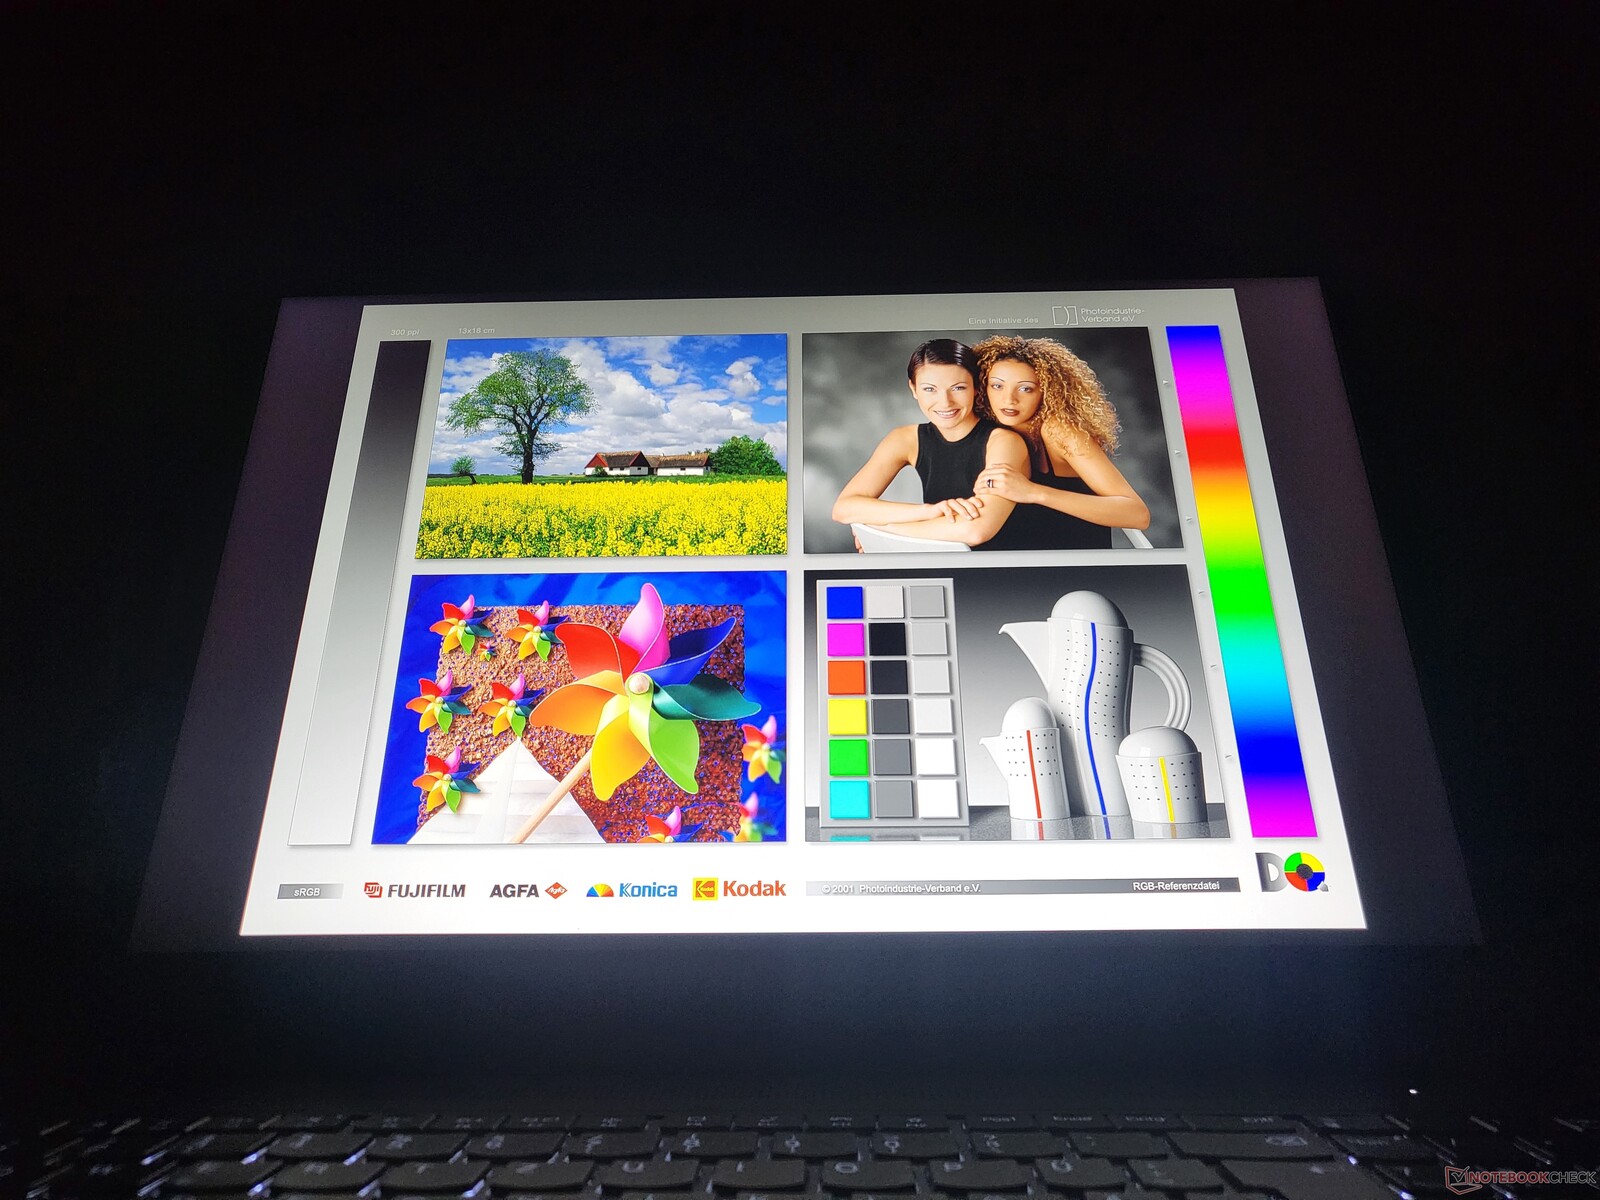
P16中发现的2.5K的中等分辨率水平是新的,因为P15和P17只有16:9的全高清(1920 x 1080)或4K UHD(3840 x 2160)。内置的WQXGA显示屏几乎在按钮上就能提供宣传的400 cd/m²,平均为398 cd/m²。与其直接对应的产品相比,这使它处于中间位置。华硕ExpertBook B6 Flip的显示屏亮度略高。
| |||||||||||||||||||||||||
Brightness Distribution: 90 %
Center on Battery: 424 cd/m²
Contrast: 1767:1 (Black: 0.24 cd/m²)
ΔE ColorChecker Calman: 2.6 | ∀{0.5-29.43 Ø4.71}
calibrated: 0.8
ΔE Greyscale Calman: 4.1 | ∀{0.09-98 Ø4.96}
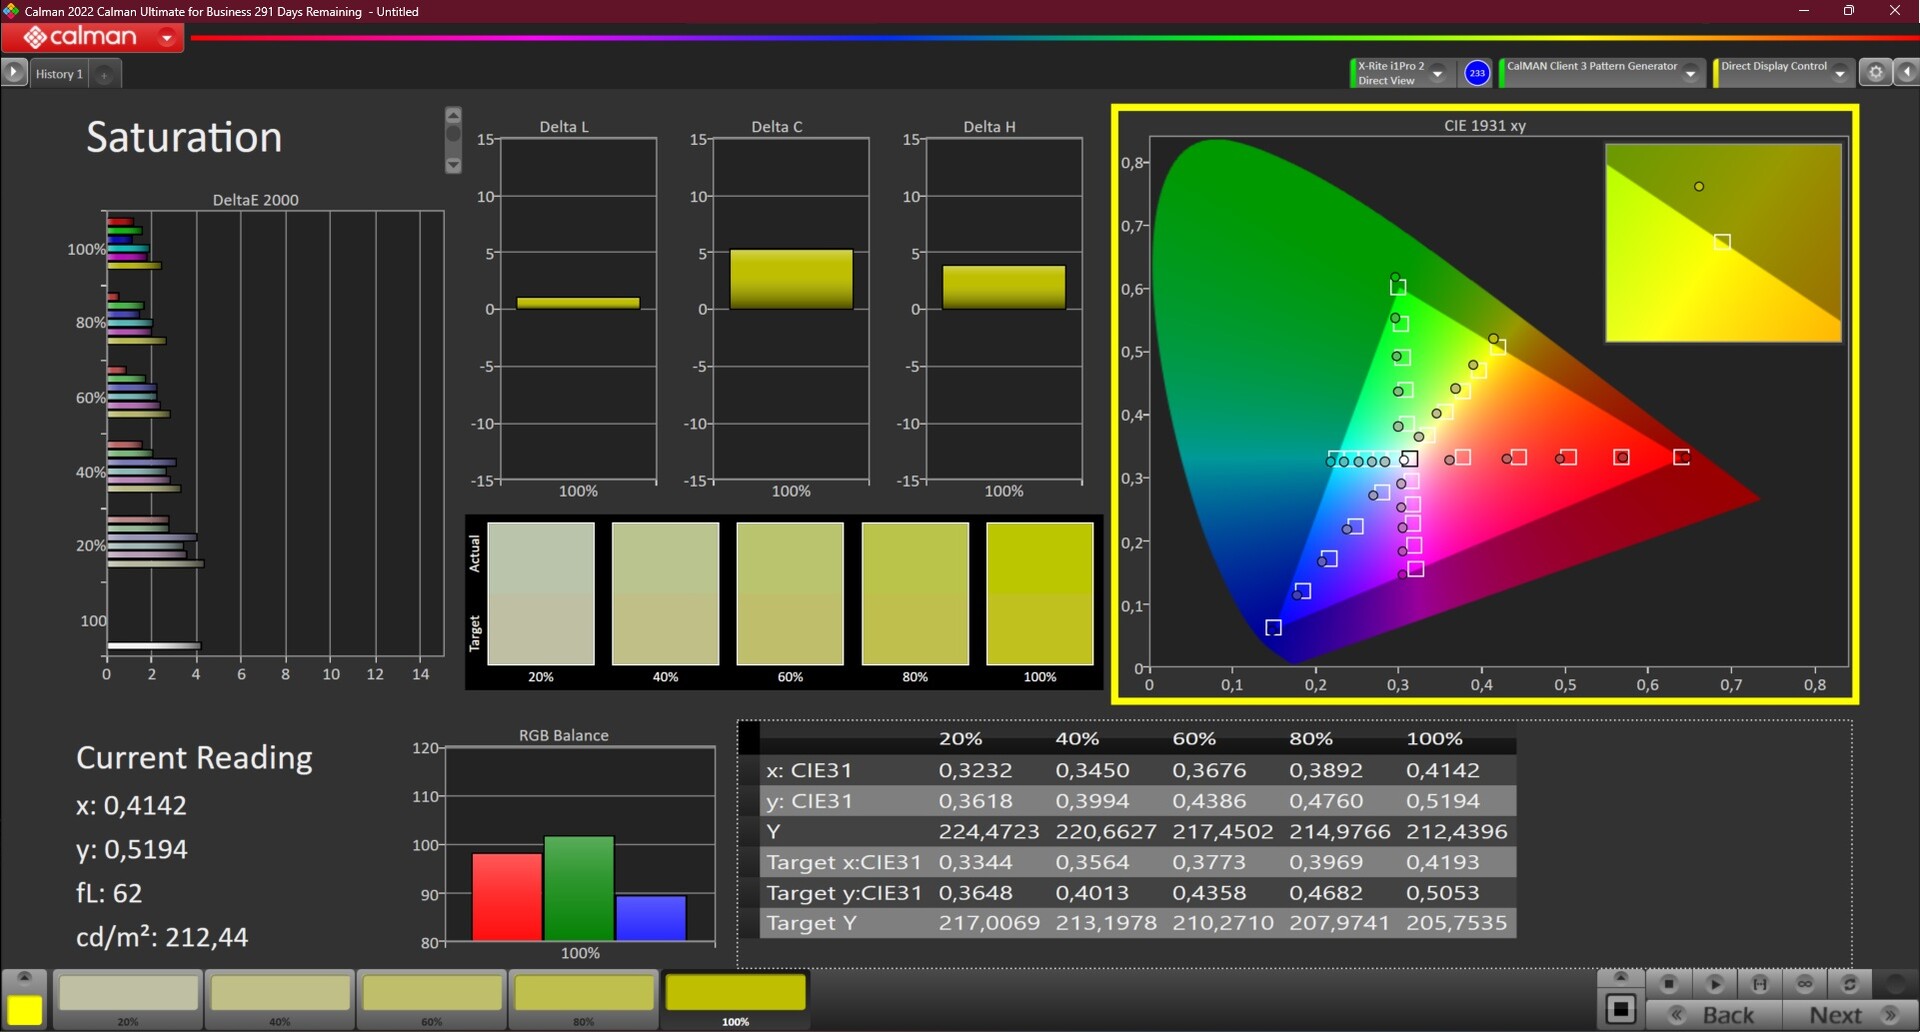
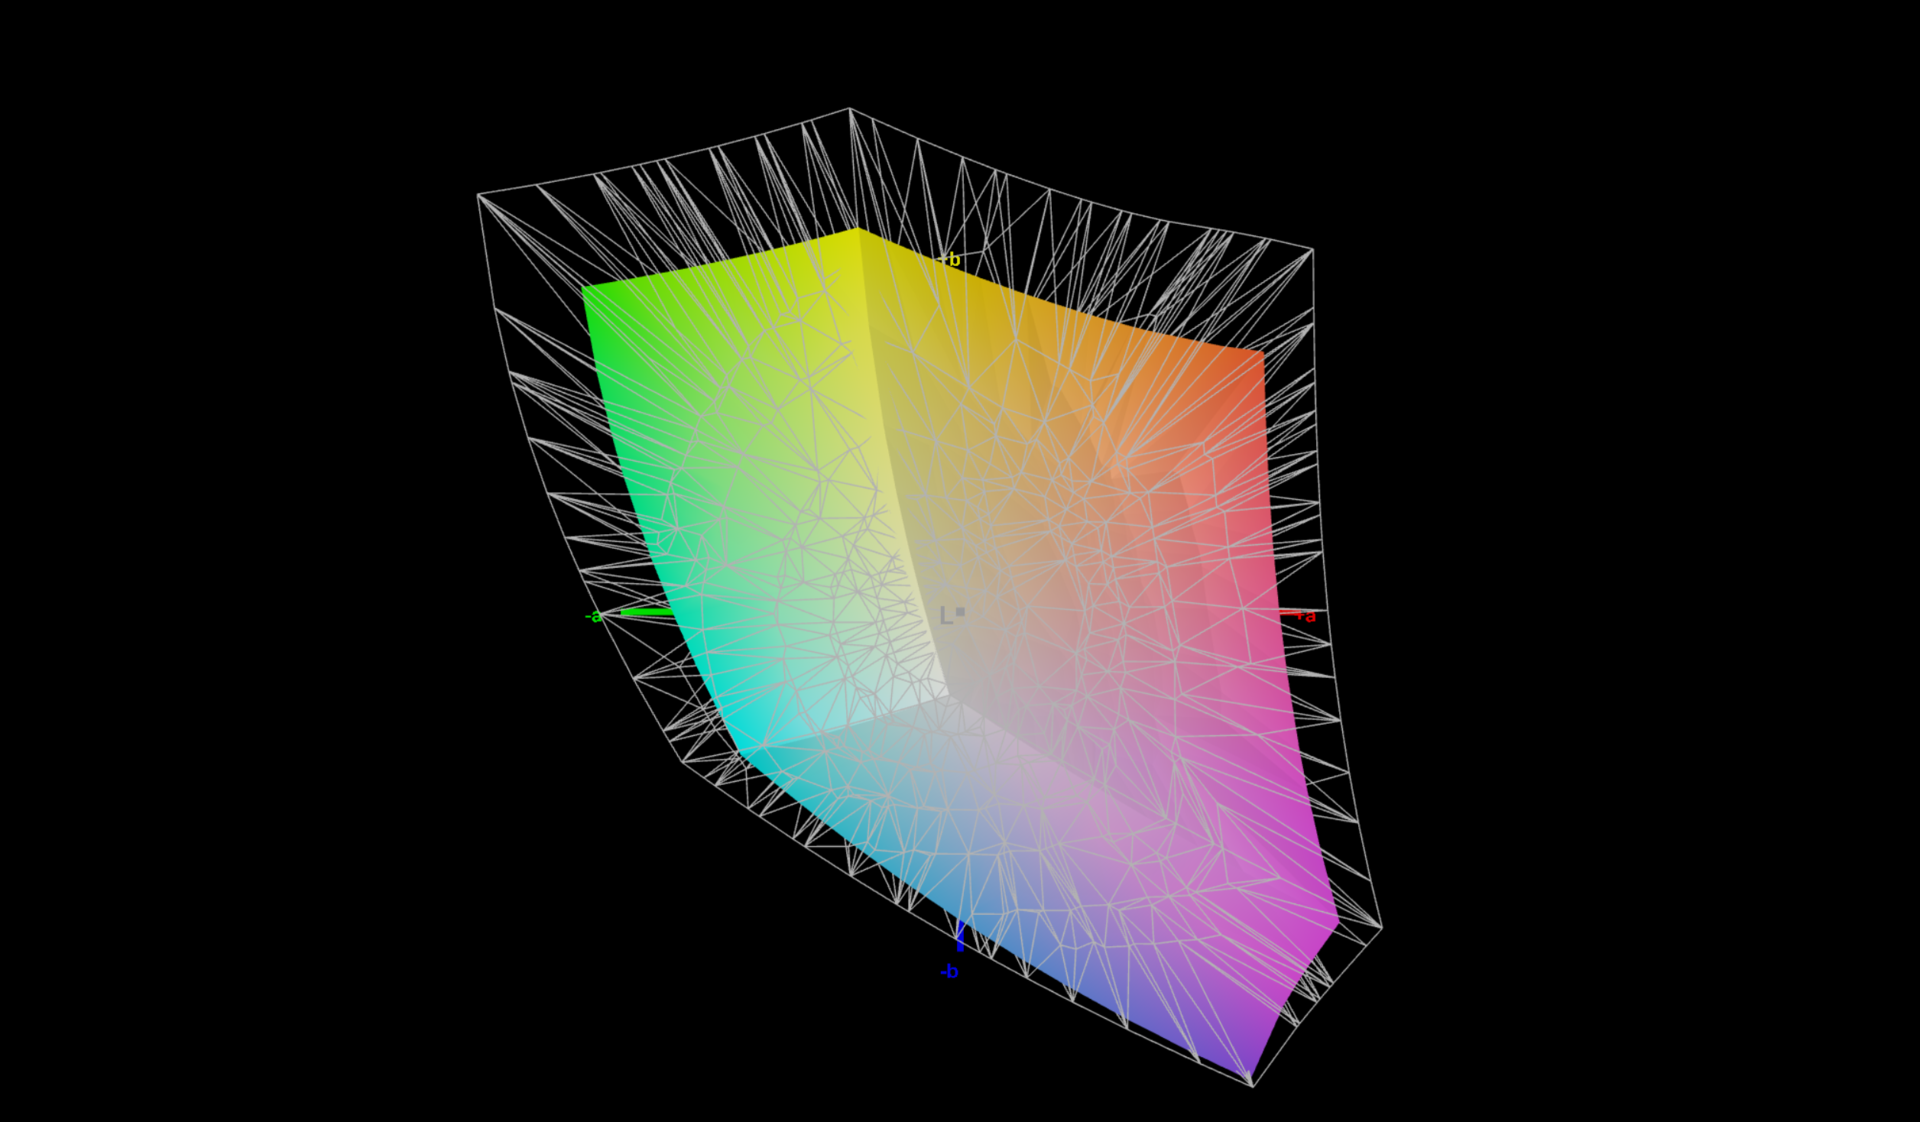
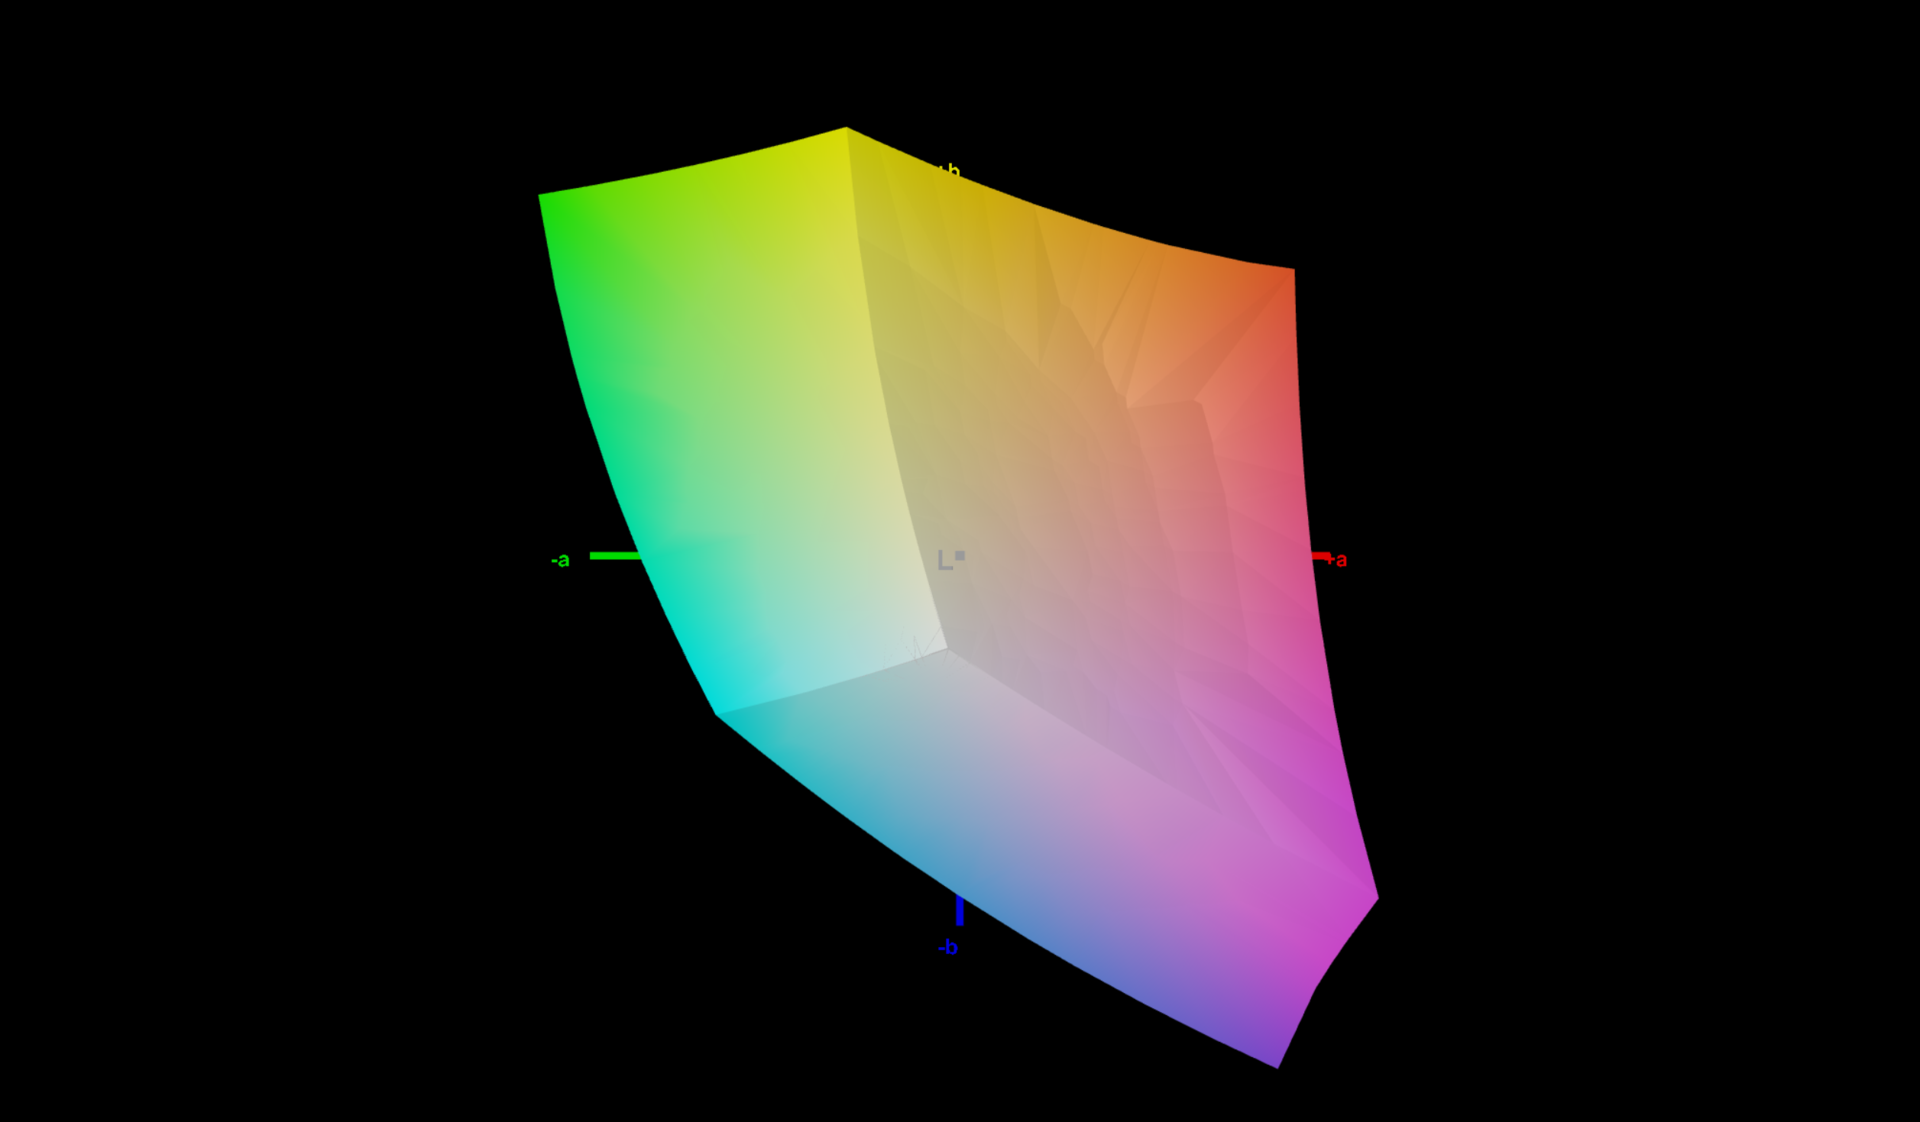
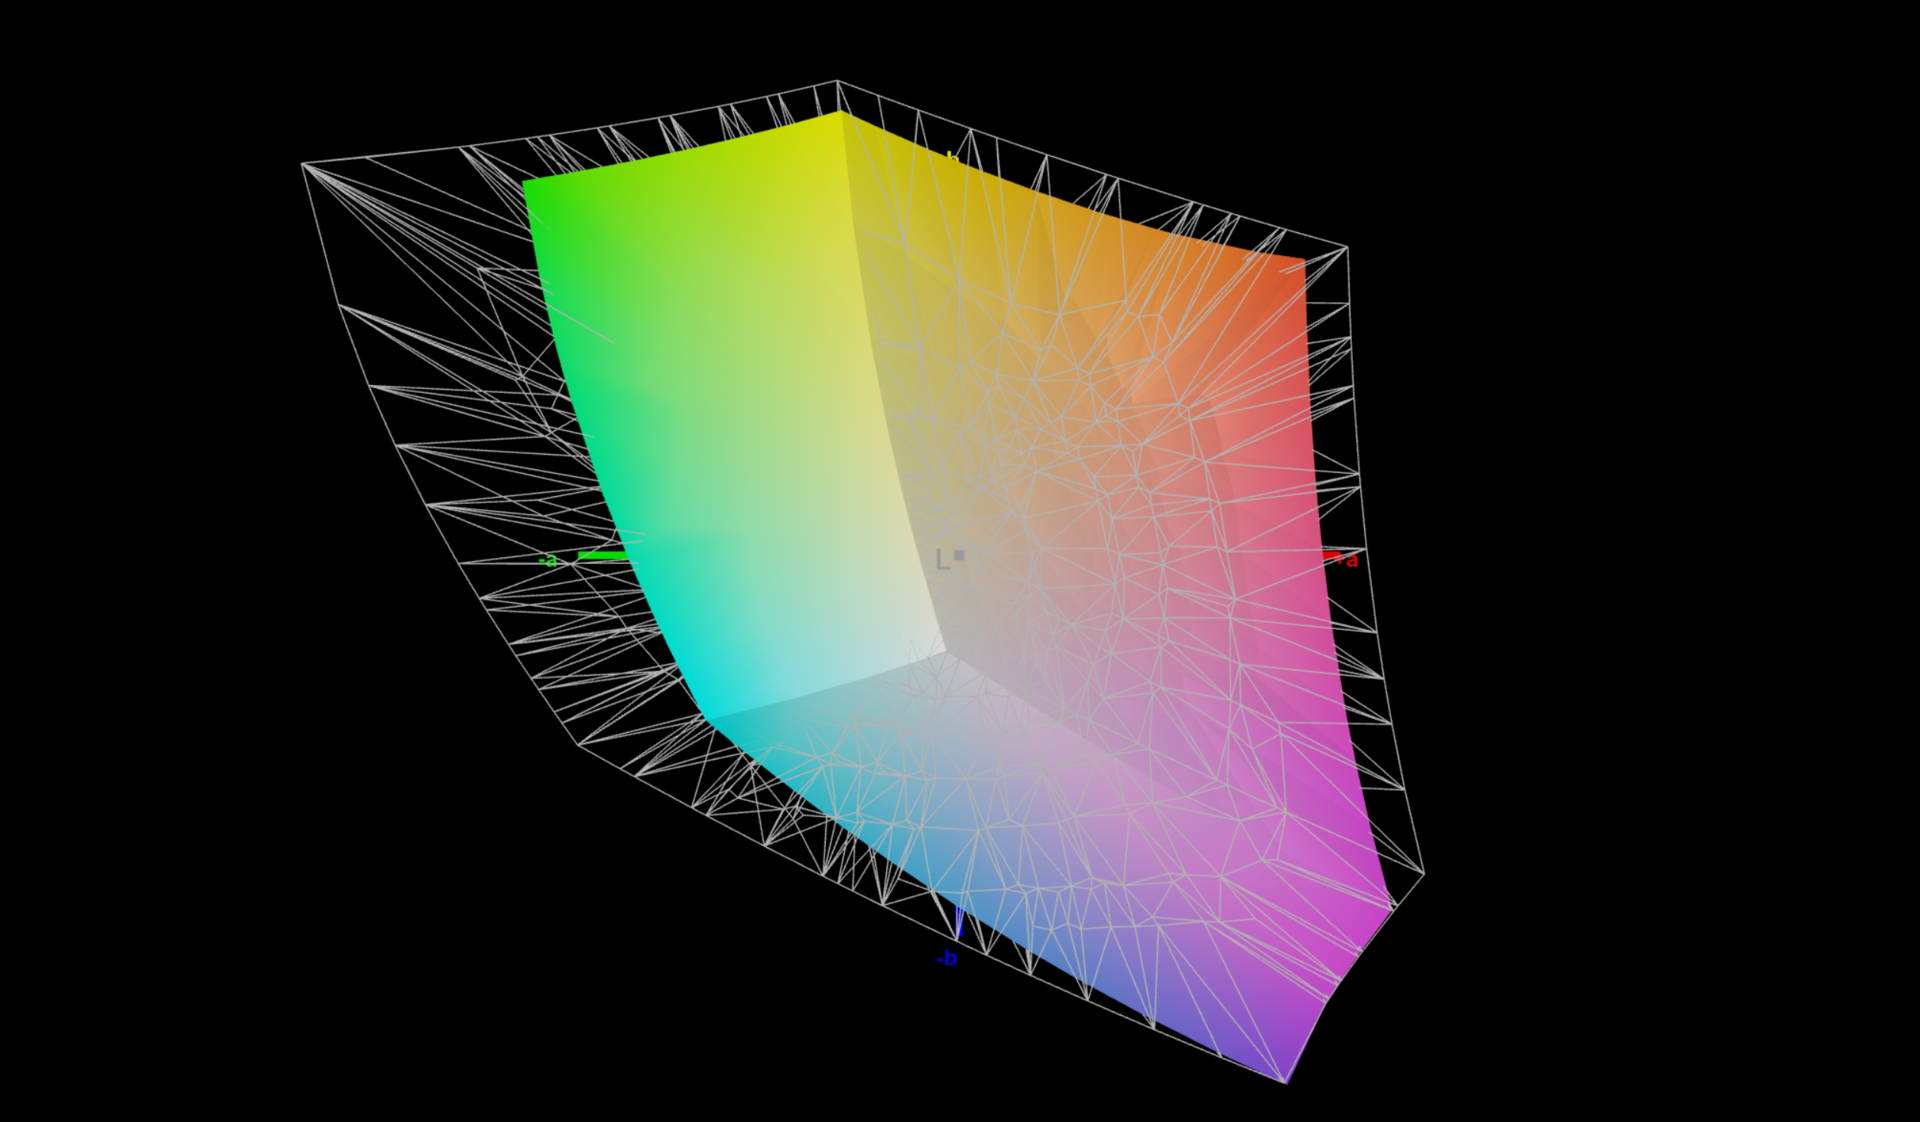
73.3% AdobeRGB 1998 (Argyll 3D)
100% sRGB (Argyll 3D)
71.5% Display P3 (Argyll 3D)
Gamma: 2.13
CCT: 7252 K
| Lenovo ThinkPad P16 G1 21D6001DMB NE160QDM-N63 , IPS LED, 2560x1600, 16" | Lenovo ThinkPad P15 G2-20YQ001JGE N156HCE_GN1, IPS, 1920x1080, 15.6" | Lenovo ThinkPad P17 G2-20YU0025G LP173WF4-SPF7, IPS LED, 1920x1080, 17.3" | HP ZBook Fury 17 G8-4A6A9EA AUOCD8C, IPS, 3840x2160, 17.3" | Dell Precision 7670 Samsung 160YV03, OLED, 3840x2400, 16" | Asus ExpertBook B6 Flip B6602FC2 AU Optronics Model: AUOE495, IPS, 2560x1600, 16" | |
|---|---|---|---|---|---|---|
| Display | -3% | -10% | 19% | 24% | 18% | |
| Display P3 Coverage (%) | 71.5 | 68.6 -4% | 67.9 -5% | 99.1 39% | 99.9 40% | 97.9 37% |
| sRGB Coverage (%) | 100 | 99.8 0% | 87.3 -13% | 100 0% | 100 0% | 99.89 0% |
| AdobeRGB 1998 Coverage (%) | 73.3 | 70.6 -4% | 63.9 -13% | 86.8 18% | 97.5 33% | 85.52 17% |
| Response Times | 20% | 6% | -41% | 94% | 20% | |
| Response Time Grey 50% / Grey 80% * (ms) | 37.7 ? | 37.6 ? -0% | 39.2 ? -4% | 67.6 ? -79% | 1.9 ? 95% | 36 ? 5% |
| Response Time Black / White * (ms) | 26.3 ? | 16 ? 39% | 22.4 ? 15% | 26.8 ? -2% | 2 ? 92% | 17 ? 35% |
| PWM Frequency (Hz) | 26040 ? | 59.5 ? | ||||
| Screen | -3% | -77% | 27% | -12% | -27% | |
| Brightness middle (cd/m²) | 424 | 498 17% | 361 -15% | 568 34% | 340.1 -20% | 440 4% |
| Brightness (cd/m²) | 398 | 490 23% | 334 -16% | 564 42% | 342 -14% | 418 5% |
| Brightness Distribution (%) | 90 | 95 6% | 87 -3% | 88 -2% | 98 9% | 82 -9% |
| Black Level * (cd/m²) | 0.24 | 0.39 -63% | 0.35 -46% | 0.33 -38% | 0.3 -25% | |
| Contrast (:1) | 1767 | 1277 -28% | 1031 -42% | 1721 -3% | 1467 -17% | |
| Colorchecker dE 2000 * | 2.6 | 2.1 19% | 5.4 -108% | 1 62% | 2.5 4% | 2.81 -8% |
| Colorchecker dE 2000 max. * | 4.9 | 5.6 -14% | 9.9 -102% | 2.4 51% | 8.19 -67% | 4.62 6% |
| Colorchecker dE 2000 calibrated * | 0.8 | 0.8 -0% | 3.2 -300% | 0.5 37% | 2.99 -274% | |
| Greyscale dE 2000 * | 4.1 | 3.4 17% | 6.5 -59% | 1.7 59% | 3.5 15% | 0.91 78% |
| Gamma | 2.13 103% | 2.32 95% | 2.23 99% | 2.18 101% | 2.12 104% | 2.2 100% |
| CCT | 7252 90% | 7162 91% | 7351 88% | 6461 101% | 6704 97% | 6600 98% |
| Total Average (Program / Settings) | 5% /
1% | -27% /
-51% | 2% /
16% | 35% /
17% | 4% /
-10% |
* ... smaller is better
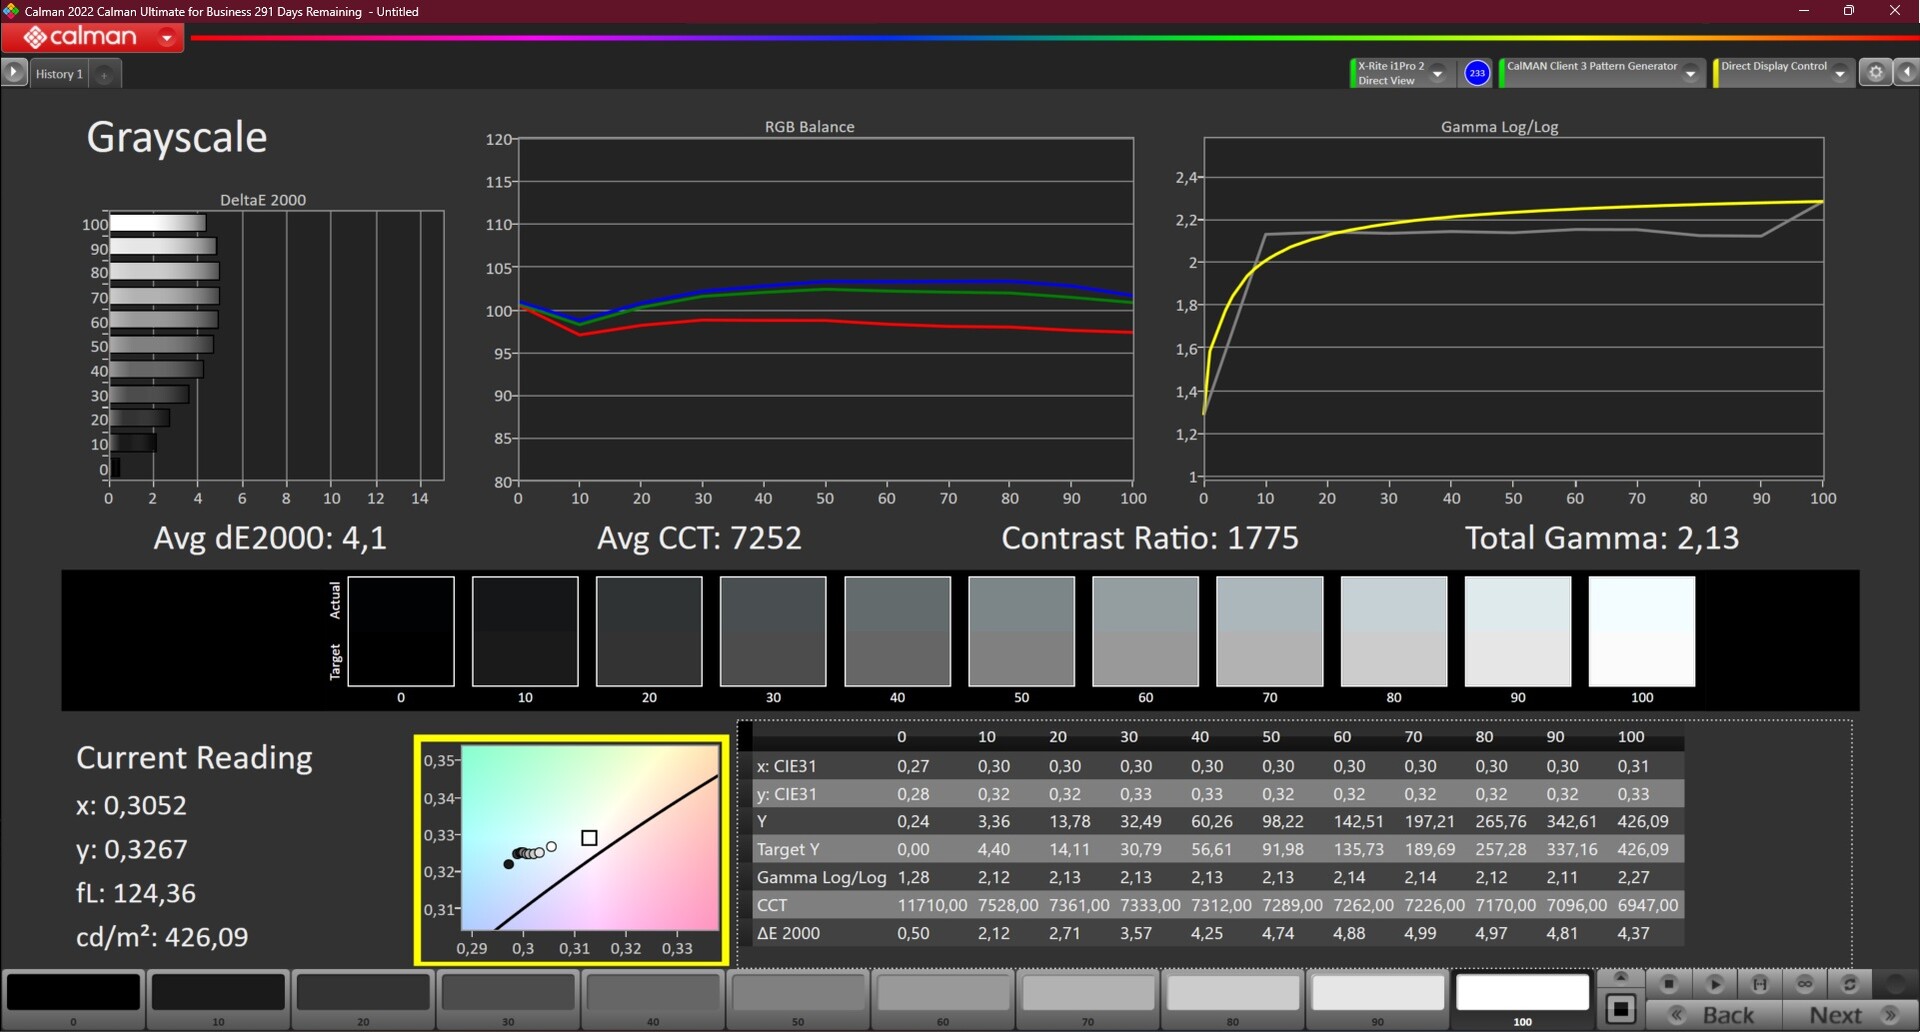
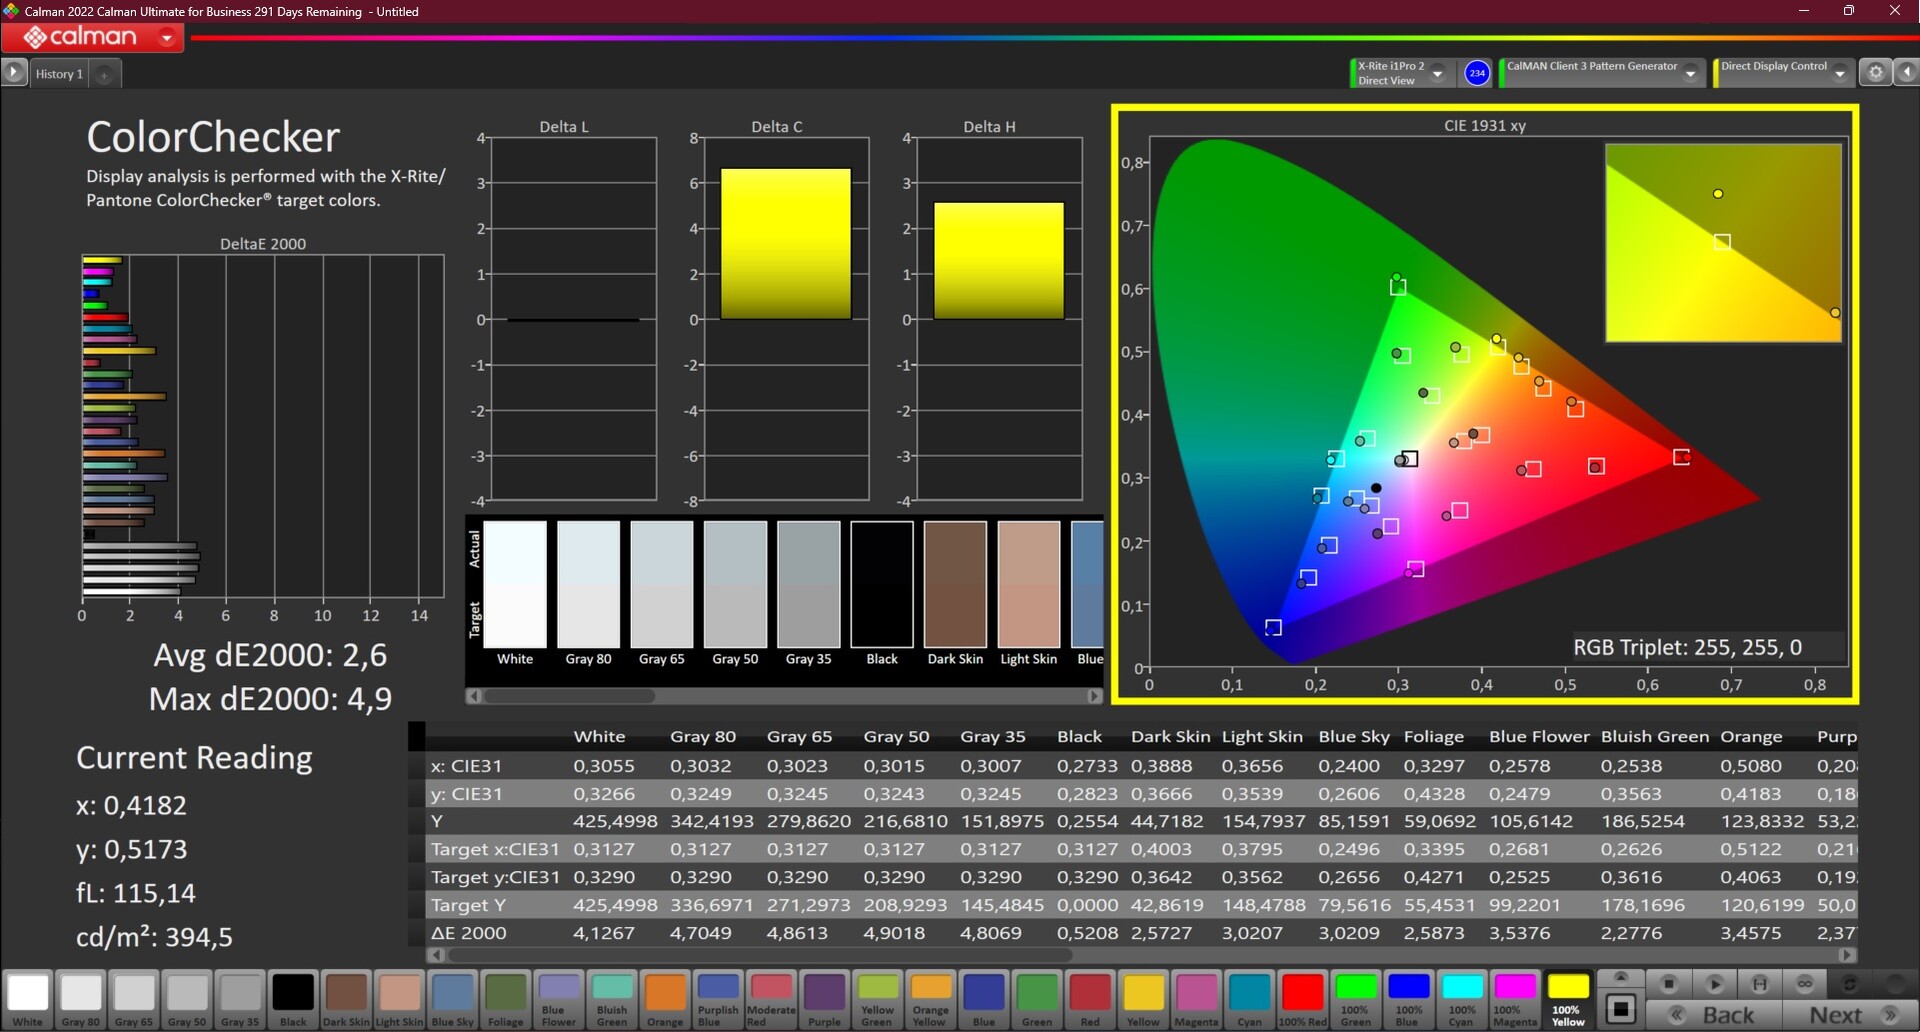
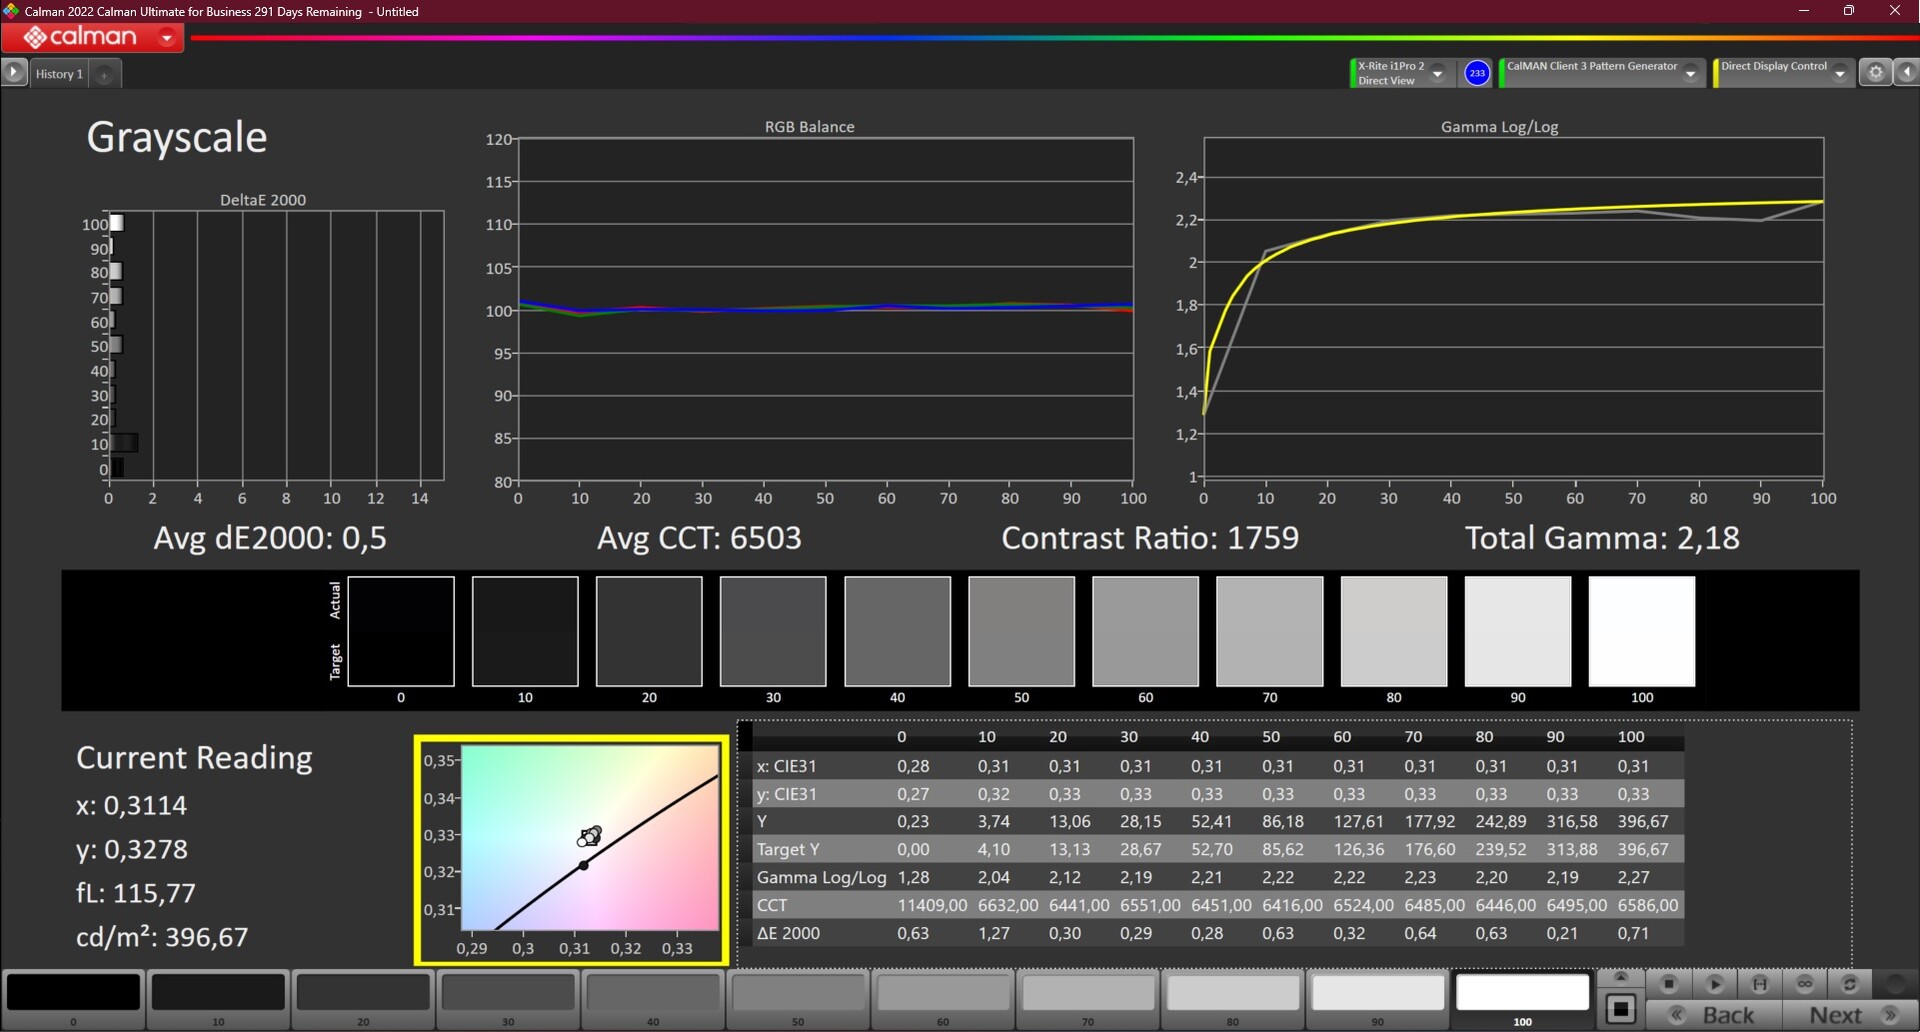
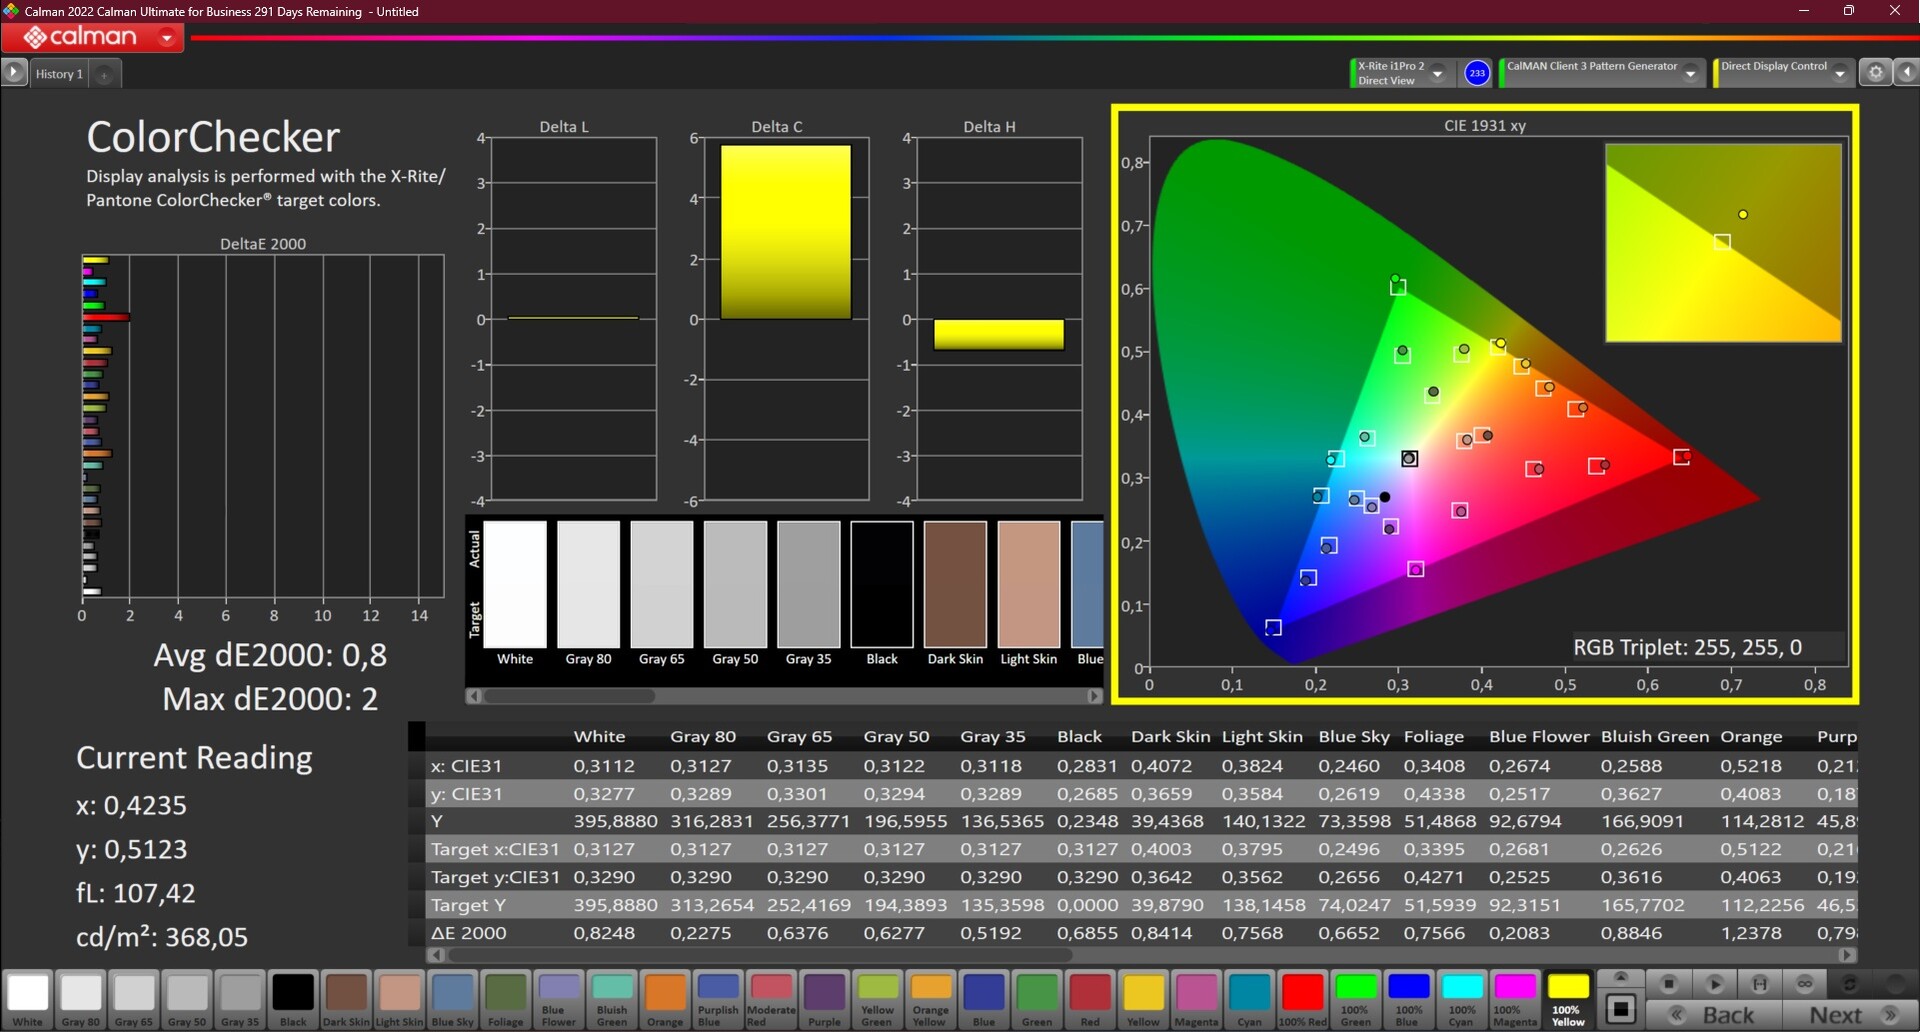
开箱后,颜色被设置得有点太冷,我们能够使用CalMan和X-Rite i1Pro 2色度计来测量。校准有助于纠正这一点,也有助于实现0.8的优秀DeltaE值。一如既往,我们创建的配置文件可供免费下载。
校准后,该显示器也可用于简单的图像处理,因为它完全覆盖了sRGB色彩空间。对于更大的色彩空间,应该选择WQUXGA选项之一。
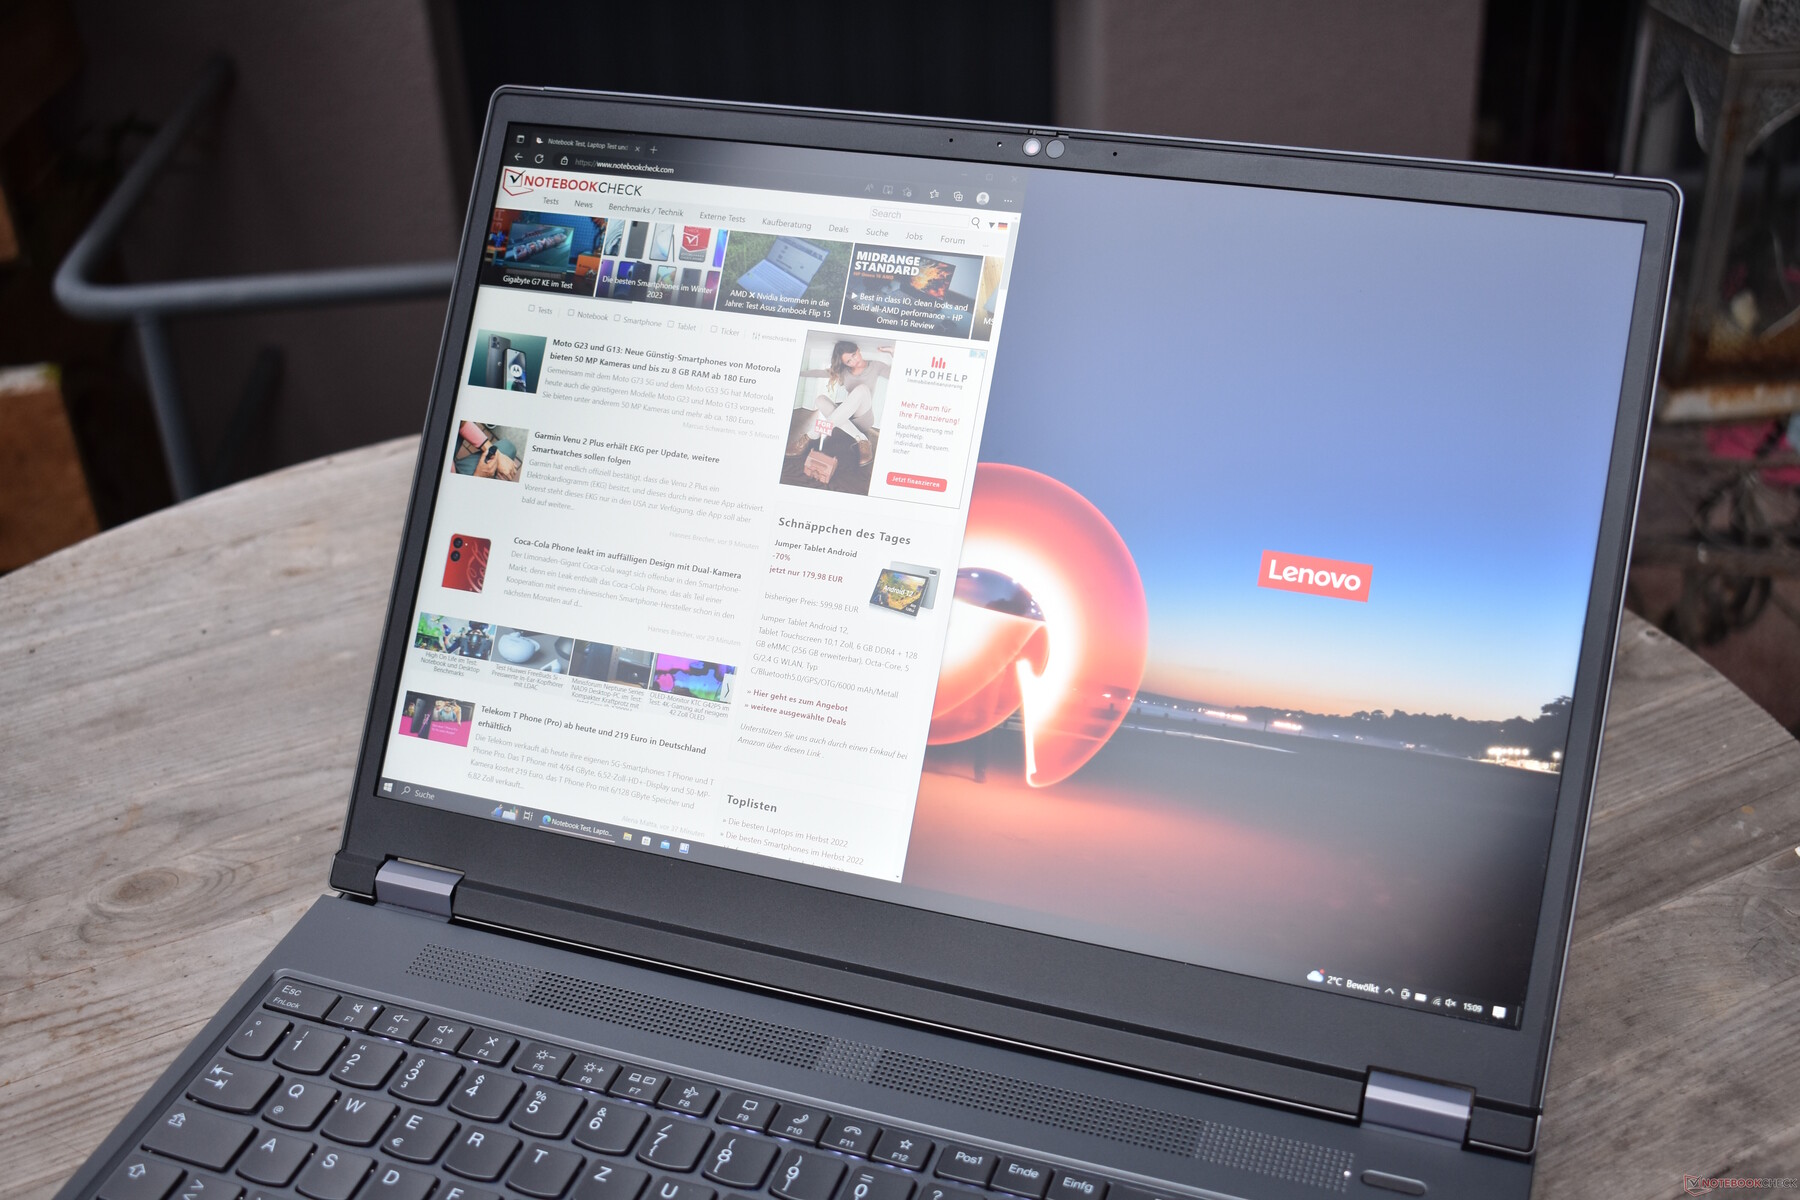
在户外,联想ThinkPad P16 G1的表现非常好,这要归功于哑光显示屏的良好亮度水平。
Display Response Times
| ↔ Response Time Black to White | ||
|---|---|---|
| 26.3 ms ... rise ↗ and fall ↘ combined | ↗ 14 ms rise | 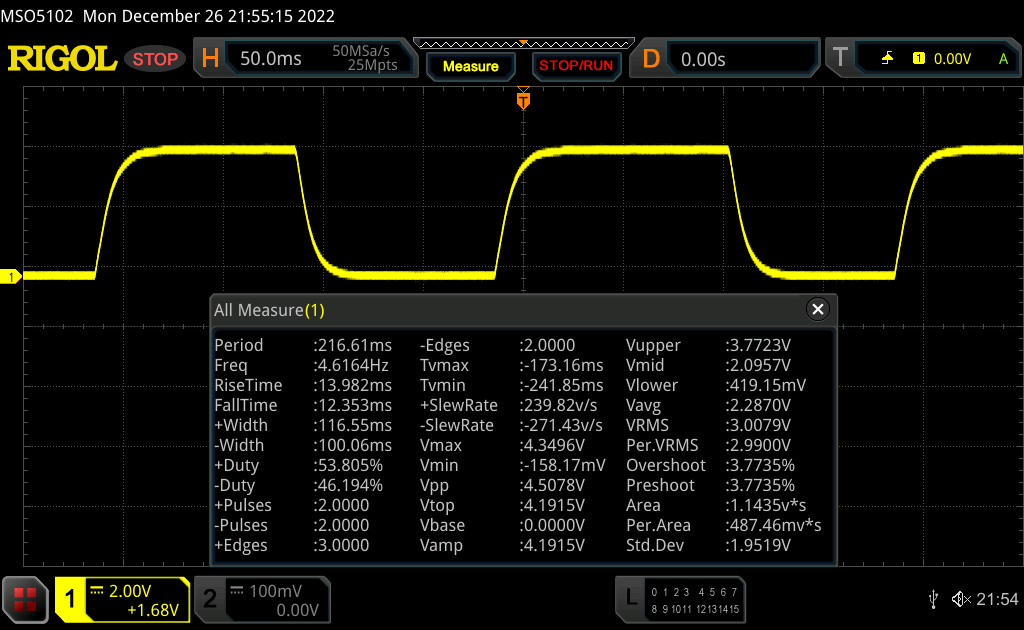 |
| ↘ 12.3 ms fall | ||
| The screen shows relatively slow response rates in our tests and may be too slow for gamers. In comparison, all tested devices range from 0.1 (minimum) to 240 (maximum) ms. » 66 % of all devices are better. This means that the measured response time is worse than the average of all tested devices (19.8 ms). | ||
| ↔ Response Time 50% Grey to 80% Grey | ||
| 37.7 ms ... rise ↗ and fall ↘ combined | ↗ 18.6 ms rise | 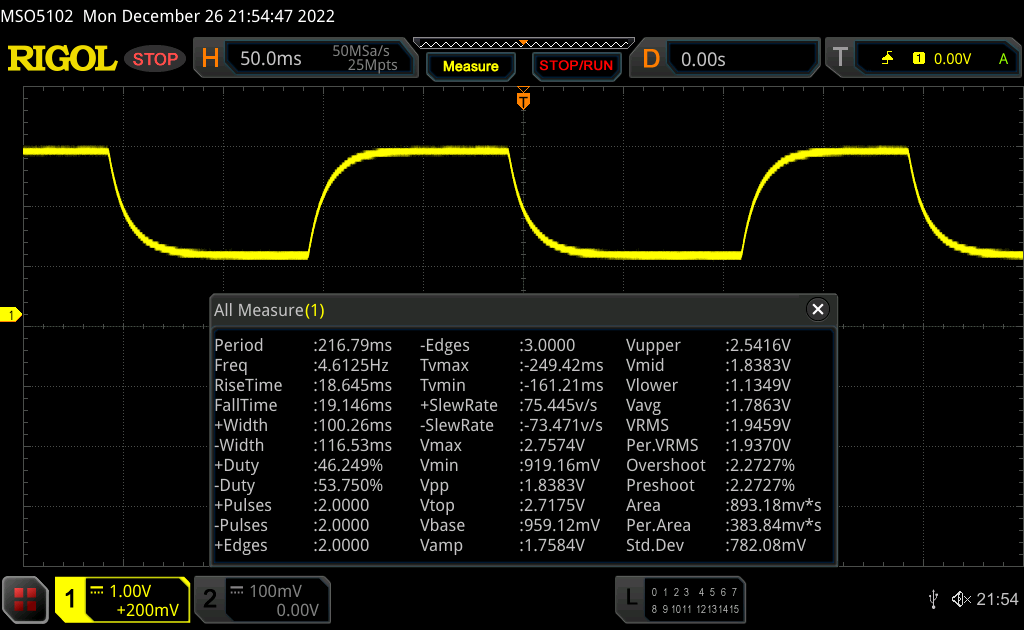 |
| ↘ 19.1 ms fall | ||
| The screen shows slow response rates in our tests and will be unsatisfactory for gamers. In comparison, all tested devices range from 0.165 (minimum) to 636 (maximum) ms. » 55 % of all devices are better. This means that the measured response time is worse than the average of all tested devices (31 ms). | ||
Screen Flickering / PWM (Pulse-Width Modulation)
| Screen flickering / PWM not detected | 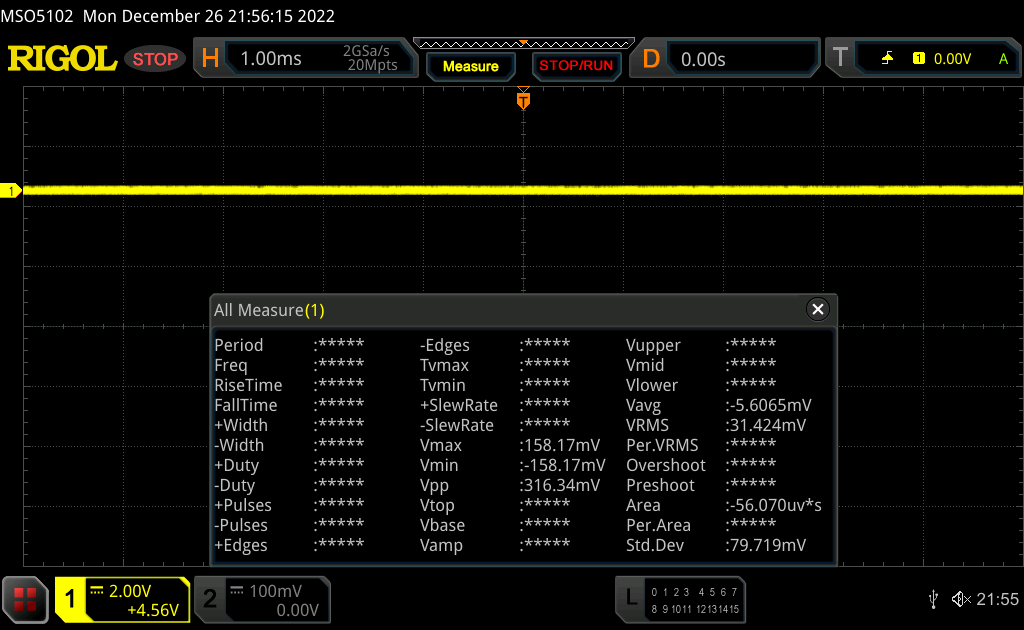 | ||
In comparison: 52 % of all tested devices do not use PWM to dim the display. If PWM was detected, an average of 7757 (minimum: 5 - maximum: 343500) Hz was measured. | |||
性能。一个强大的英特尔CPU和一个相当弱的Nvidia GPU
联想提供ThinkPad P16 G1的各种配置。所有的配置都包含Alder Lake HX系列的英特尔处理器,可供选择的型号为英特尔酷睿i5-12600HX, i7-12800HX, i7-12850HX, i9-12900HX以及i9-12950HX.不幸的是,至强CPU已经不复存在,它们的工作现在由以50结尾的CPU完成。由于联想没有焊接其GPU,这些处理器中的每一个都可以配置以下GPU之一。英特尔ARC Pro A30M。 Nvidia RTX A1000, RTX A2000, RTX A3000, RTX A4500和 RTX A5500.
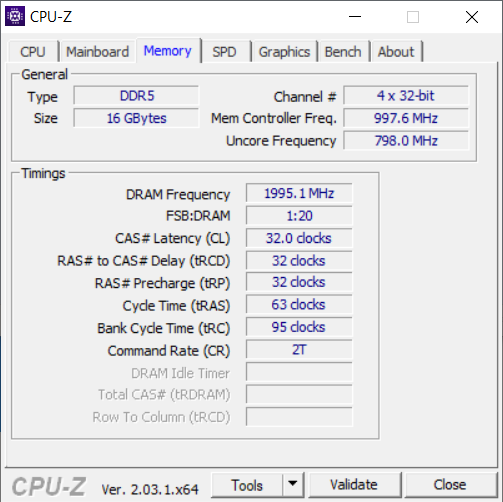
可能的变化并没有结束,联想ThinkPad P16 G1有四个内存插槽。这使得它有可能拥有高达128GB的DDR5-3600内存,同时ECC内存也可用于50种型号的CPU。总共有两个SSD插槽,都可以接受M.2 2280 SSD。联想在其ThinkPad笔记本电脑中销售的最大容量的海量存储是高达8兆字节,并以两个4兆字节的SSD的形式出现。
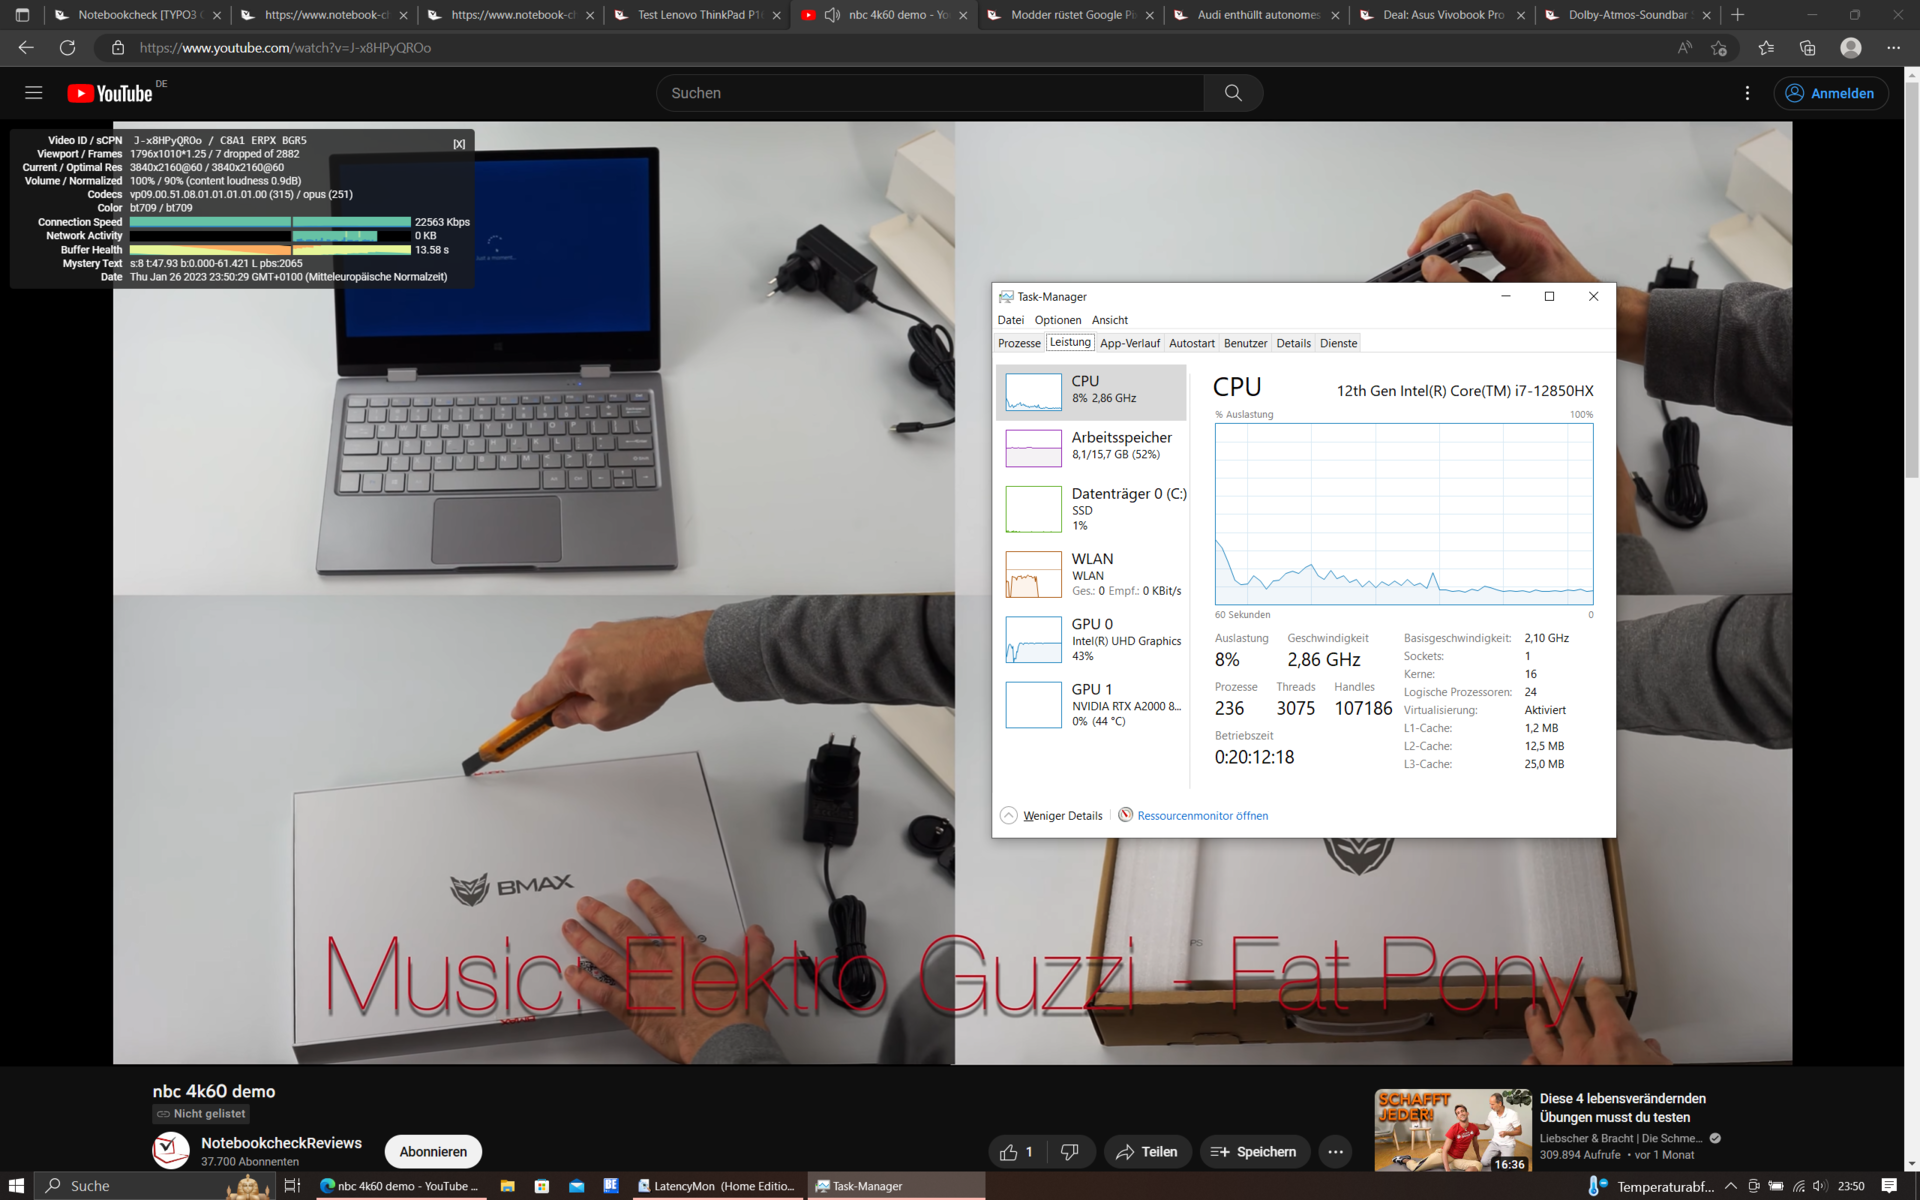
测试条件
联想为其ThinkPads电源模式使用了Windows自己的电源模式。在短时间内,处理器的消耗量可以达到125瓦,但在较长时间内被限制在95瓦。如果选择电源模式 "更好的性能",而不是 "最佳性能",则消耗量会短暂停留在100瓦,而在持续负载下则为80瓦。使用 "更高的电池效率 "模式,其限制要严重得多,涡轮增压为70瓦,持续消耗为30瓦。除了WiFi电池测试外,我们的测试是使用 "最佳性能 "模式进行的。
我们的评测设备有一个特殊的功能。它仍然配备了Windows 10 Pro。对于大多数测试来说,这不是一个问题,但这个旧版本的Windows在Cinebench R15中的得分很低。由于这个原因,我们决定不使用该设备的Cinebench R15循环。
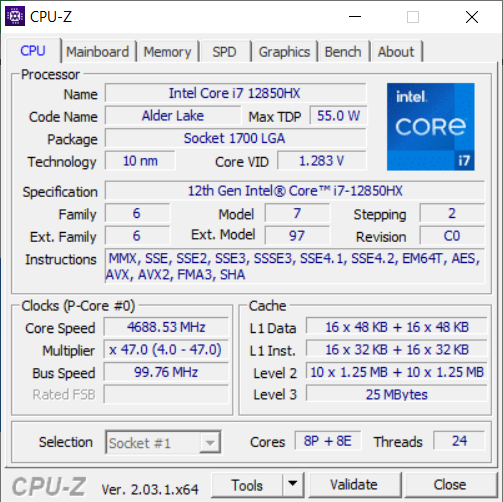
处理器
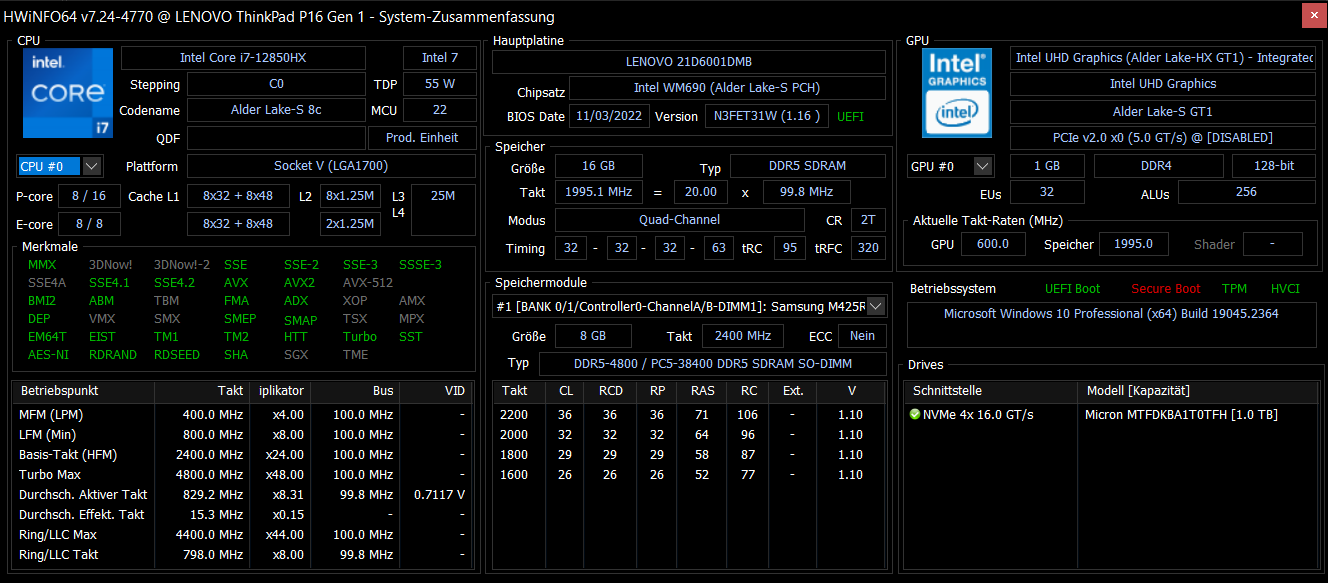
芯片英特尔酷睿i7-12850HX是一款总共有16个内核的处理器。由于 "桤木湖 "架构拥有不对称的结构,其中八个核心是强大的P核(2.1至4.8 GHz),其他八个核心是高效的E核(1.5至3.4 GHz)。由于采用了超线程技术,该处理器拥有超过24个线程。作为HX55系列的一员,典型的TDP徘徊在55瓦左右。关于与当前其他处理器的详细比较,请查看我们的 CPU列表.
该系统的CPU性能很好,高于该处理器的平均水平。ThinkPad P16相当有说服力地击败了戴尔Precision 7670 。然而,华硕ExpertBook B6 Flip ,由于其i9,速度更快。有趣的是,X1 Extreme G5 ,虽然只有六个P核,但几乎与P16持平。与P15 G2 和P17 G2 相比,CPU性能大约提高了31-35%。
在电池模式下,ThinkPad P16在Cinebench R23中的得分是14.844分。在没有连接电源装置的情况下,CPU的性能要低15%左右。
Cinebench R23 Multi Endurance Test
Cinebench R23: Multi Core | Single Core
Cinebench R20: CPU (Multi Core) | CPU (Single Core)
Cinebench R15: CPU Multi 64Bit | CPU Single 64Bit
Blender: v2.79 BMW27 CPU
7-Zip 18.03: 7z b 4 | 7z b 4 -mmt1
Geekbench 5.5: Multi-Core | Single-Core
HWBOT x265 Benchmark v2.2: 4k Preset
LibreOffice : 20 Documents To PDF
R Benchmark 2.5: Overall mean
| CPU Performance rating | |
| Average of class Workstation | |
| Asus ExpertBook B6 Flip B6602FC2 | |
| Lenovo ThinkPad P16 G1 21D6001DMB | |
| Lenovo ThinkPad X1 Extreme G5-21DE003RGE | |
| Average Intel Core i7-12850HX | |
| Dell Precision 7670 | |
| HP ZBook Fury 17 G8-4A6A9EA | |
| Lenovo ThinkPad Z16 G1 21D5S00T00 | |
| Lenovo ThinkPad P17 G2-20YU0025G | |
| Lenovo ThinkPad P15 G2-20YQ001JGE | |
| Cinebench R23 / Multi Core | |
| Average of class Workstation (14621 - 38520, n=23, last 2 years) | |
| Asus ExpertBook B6 Flip B6602FC2 | |
| Lenovo ThinkPad X1 Extreme G5-21DE003RGE | |
| Lenovo ThinkPad P16 G1 21D6001DMB | |
| Average Intel Core i7-12850HX (15093 - 17510, n=2) | |
| Dell Precision 7670 | |
| HP ZBook Fury 17 G8-4A6A9EA | |
| Lenovo ThinkPad P17 G2-20YU0025G | |
| Lenovo ThinkPad Z16 G1 21D5S00T00 | |
| Lenovo ThinkPad P15 G2-20YQ001JGE | |
| Cinebench R23 / Single Core | |
| Average of class Workstation (1712 - 2228, n=23, last 2 years) | |
| Asus ExpertBook B6 Flip B6602FC2 | |
| Lenovo ThinkPad P16 G1 21D6001DMB | |
| Lenovo ThinkPad X1 Extreme G5-21DE003RGE | |
| Average Intel Core i7-12850HX (1596 - 1845, n=2) | |
| HP ZBook Fury 17 G8-4A6A9EA | |
| Dell Precision 7670 | |
| Lenovo ThinkPad P17 G2-20YU0025G | |
| Lenovo ThinkPad P15 G2-20YQ001JGE | |
| Lenovo ThinkPad Z16 G1 21D5S00T00 | |
| Cinebench R20 / CPU (Multi Core) | |
| Average of class Workstation (5760 - 15043, n=23, last 2 years) | |
| Asus ExpertBook B6 Flip B6602FC2 | |
| Lenovo ThinkPad X1 Extreme G5-21DE003RGE | |
| Lenovo ThinkPad P16 G1 21D6001DMB | |
| Average Intel Core i7-12850HX (6217 - 6764, n=2) | |
| Dell Precision 7670 | |
| Lenovo ThinkPad P17 G2-20YU0025G | |
| HP ZBook Fury 17 G8-4A6A9EA | |
| Lenovo ThinkPad Z16 G1 21D5S00T00 | |
| Lenovo ThinkPad P15 G2-20YQ001JGE | |
| Cinebench R20 / CPU (Single Core) | |
| Average of class Workstation (671 - 857, n=23, last 2 years) | |
| Asus ExpertBook B6 Flip B6602FC2 | |
| Lenovo ThinkPad P16 G1 21D6001DMB | |
| Lenovo ThinkPad X1 Extreme G5-21DE003RGE | |
| Average Intel Core i7-12850HX (687 - 708, n=2) | |
| Dell Precision 7670 | |
| HP ZBook Fury 17 G8-4A6A9EA | |
| Lenovo ThinkPad Z16 G1 21D5S00T00 | |
| Lenovo ThinkPad P17 G2-20YU0025G | |
| Lenovo ThinkPad P15 G2-20YQ001JGE | |
| Cinebench R15 / CPU Multi 64Bit | |
| Average of class Workstation (2489 - 5810, n=23, last 2 years) | |
| Asus ExpertBook B6 Flip B6602FC2 | |
| Lenovo ThinkPad P16 G1 21D6001DMB | |
| Lenovo ThinkPad X1 Extreme G5-21DE003RGE | |
| Average Intel Core i7-12850HX (2432 - 2926, n=2) | |
| Dell Precision 7670 | |
| Lenovo ThinkPad P17 G2-20YU0025G | |
| HP ZBook Fury 17 G8-4A6A9EA | |
| Lenovo ThinkPad Z16 G1 21D5S00T00 | |
| Lenovo ThinkPad P15 G2-20YQ001JGE | |
| Cinebench R15 / CPU Single 64Bit | |
| Average of class Workstation (191.4 - 328, n=23, last 2 years) | |
| Asus ExpertBook B6 Flip B6602FC2 | |
| Lenovo ThinkPad P16 G1 21D6001DMB | |
| Average Intel Core i7-12850HX (253 - 268, n=2) | |
| Lenovo ThinkPad X1 Extreme G5-21DE003RGE | |
| Dell Precision 7670 | |
| HP ZBook Fury 17 G8-4A6A9EA | |
| Lenovo ThinkPad Z16 G1 21D5S00T00 | |
| Lenovo ThinkPad P17 G2-20YU0025G | |
| Lenovo ThinkPad P15 G2-20YQ001JGE | |
| Blender / v2.79 BMW27 CPU | |
| Lenovo ThinkPad P15 G2-20YQ001JGE | |
| Lenovo ThinkPad P17 G2-20YU0025G | |
| HP ZBook Fury 17 G8-4A6A9EA | |
| Lenovo ThinkPad Z16 G1 21D5S00T00 | |
| Dell Precision 7670 | |
| Average Intel Core i7-12850HX (181 - 205, n=2) | |
| Asus ExpertBook B6 Flip B6602FC2 | |
| Lenovo ThinkPad X1 Extreme G5-21DE003RGE | |
| Lenovo ThinkPad P16 G1 21D6001DMB | |
| Average of class Workstation (91 - 222, n=23, last 2 years) | |
| 7-Zip 18.03 / 7z b 4 | |
| Average of class Workstation (60489 - 116969, n=23, last 2 years) | |
| Asus ExpertBook B6 Flip B6602FC2 | |
| Lenovo ThinkPad P16 G1 21D6001DMB | |
| Lenovo ThinkPad X1 Extreme G5-21DE003RGE | |
| Average Intel Core i7-12850HX (53893 - 69464, n=2) | |
| Lenovo ThinkPad Z16 G1 21D5S00T00 | |
| Dell Precision 7670 | |
| HP ZBook Fury 17 G8-4A6A9EA | |
| Lenovo ThinkPad P15 G2-20YQ001JGE | |
| Lenovo ThinkPad P17 G2-20YU0025G | |
| 7-Zip 18.03 / 7z b 4 -mmt1 | |
| Average of class Workstation (5126 - 6960, n=23, last 2 years) | |
| Asus ExpertBook B6 Flip B6602FC2 | |
| HP ZBook Fury 17 G8-4A6A9EA | |
| Lenovo ThinkPad P16 G1 21D6001DMB | |
| Lenovo ThinkPad X1 Extreme G5-21DE003RGE | |
| Average Intel Core i7-12850HX (5608 - 5916, n=2) | |
| Dell Precision 7670 | |
| Lenovo ThinkPad P15 G2-20YQ001JGE | |
| Lenovo ThinkPad P17 G2-20YU0025G | |
| Lenovo ThinkPad Z16 G1 21D5S00T00 | |
| Geekbench 5.5 / Multi-Core | |
| Average of class Workstation (11542 - 25554, n=23, last 2 years) | |
| Asus ExpertBook B6 Flip B6602FC2 | |
| Lenovo ThinkPad P16 G1 21D6001DMB | |
| Average Intel Core i7-12850HX (11509 - 13095, n=2) | |
| Lenovo ThinkPad X1 Extreme G5-21DE003RGE | |
| Dell Precision 7670 | |
| Lenovo ThinkPad P15 G2-20YQ001JGE | |
| Lenovo ThinkPad Z16 G1 21D5S00T00 | |
| HP ZBook Fury 17 G8-4A6A9EA | |
| Lenovo ThinkPad P17 G2-20YU0025G | |
| Geekbench 5.5 / Single-Core | |
| Average of class Workstation (1783 - 2183, n=23, last 2 years) | |
| Asus ExpertBook B6 Flip B6602FC2 | |
| Lenovo ThinkPad X1 Extreme G5-21DE003RGE | |
| Lenovo ThinkPad P16 G1 21D6001DMB | |
| Average Intel Core i7-12850HX (1777 - 1787, n=2) | |
| Dell Precision 7670 | |
| HP ZBook Fury 17 G8-4A6A9EA | |
| Lenovo ThinkPad P15 G2-20YQ001JGE | |
| Lenovo ThinkPad P17 G2-20YU0025G | |
| Lenovo ThinkPad Z16 G1 21D5S00T00 | |
| HWBOT x265 Benchmark v2.2 / 4k Preset | |
| Average of class Workstation (17.8 - 40.5, n=23, last 2 years) | |
| Asus ExpertBook B6 Flip B6602FC2 | |
| Dell Precision 7670 | |
| Average Intel Core i7-12850HX (17.2 - 17.3, n=2) | |
| Lenovo ThinkPad P16 G1 21D6001DMB | |
| Lenovo ThinkPad X1 Extreme G5-21DE003RGE | |
| Lenovo ThinkPad Z16 G1 21D5S00T00 | |
| Lenovo ThinkPad P17 G2-20YU0025G | |
| HP ZBook Fury 17 G8-4A6A9EA | |
| Lenovo ThinkPad P15 G2-20YQ001JGE | |
| LibreOffice / 20 Documents To PDF | |
| HP ZBook Fury 17 G8-4A6A9EA | |
| Lenovo ThinkPad P17 G2-20YU0025G | |
| Lenovo ThinkPad Z16 G1 21D5S00T00 | |
| Dell Precision 7670 | |
| Lenovo ThinkPad P15 G2-20YQ001JGE | |
| Average Intel Core i7-12850HX (46.9 - 48.6, n=2) | |
| Average of class Workstation (37.1 - 74.7, n=23, last 2 years) | |
| Lenovo ThinkPad P16 G1 21D6001DMB | |
| Asus ExpertBook B6 Flip B6602FC2 | |
| Lenovo ThinkPad X1 Extreme G5-21DE003RGE | |
| R Benchmark 2.5 / Overall mean | |
| Lenovo ThinkPad P17 G2-20YU0025G | |
| Lenovo ThinkPad P15 G2-20YQ001JGE | |
| HP ZBook Fury 17 G8-4A6A9EA | |
| Lenovo ThinkPad Z16 G1 21D5S00T00 | |
| Dell Precision 7670 | |
| Lenovo ThinkPad X1 Extreme G5-21DE003RGE | |
| Average Intel Core i7-12850HX (0.45 - 0.4698, n=2) | |
| Asus ExpertBook B6 Flip B6602FC2 | |
| Lenovo ThinkPad P16 G1 21D6001DMB | |
| Average of class Workstation (0.3825 - 0.603, n=23, last 2 years) | |
* ... smaller is better
AIDA64: FP32 Ray-Trace | FPU Julia | CPU SHA3 | CPU Queen | FPU SinJulia | FPU Mandel | CPU AES | CPU ZLib | FP64 Ray-Trace | CPU PhotoWorxx
| Performance rating | |
| Average of class Workstation | |
| Lenovo ThinkPad P16 G1 21D6001DMB | |
| Asus ExpertBook B6 Flip B6602FC2 | |
| Average Intel Core i7-12850HX | |
| HP ZBook Fury 17 G8-4A6A9EA | |
| Dell Precision 7670 | |
| AIDA64 / FP32 Ray-Trace | |
| Average of class Workstation (16730 - 61611, n=23, last 2 years) | |
| Lenovo ThinkPad P16 G1 21D6001DMB | |
| Asus ExpertBook B6 Flip B6602FC2 | |
| HP ZBook Fury 17 G8-4A6A9EA | |
| Average Intel Core i7-12850HX (12983 - 16752, n=2) | |
| Dell Precision 7670 | |
| AIDA64 / FPU Julia | |
| Average of class Workstation (89597 - 186971, n=23, last 2 years) | |
| Lenovo ThinkPad P16 G1 21D6001DMB | |
| Asus ExpertBook B6 Flip B6602FC2 | |
| Average Intel Core i7-12850HX (68219 - 87231, n=2) | |
| Dell Precision 7670 | |
| HP ZBook Fury 17 G8-4A6A9EA | |
| AIDA64 / CPU SHA3 | |
| Average of class Workstation (4178 - 8975, n=23, last 2 years) | |
| HP ZBook Fury 17 G8-4A6A9EA | |
| Lenovo ThinkPad P16 G1 21D6001DMB | |
| Asus ExpertBook B6 Flip B6602FC2 | |
| Average Intel Core i7-12850HX (3098 - 3818, n=2) | |
| Dell Precision 7670 | |
| AIDA64 / CPU Queen | |
| Average of class Workstation (60778 - 144411, n=23, last 2 years) | |
| Asus ExpertBook B6 Flip B6602FC2 | |
| HP ZBook Fury 17 G8-4A6A9EA | |
| Lenovo ThinkPad P16 G1 21D6001DMB | |
| Average Intel Core i7-12850HX (26716 - 95664, n=2) | |
| Dell Precision 7670 | |
| AIDA64 / FPU SinJulia | |
| Average of class Workstation (8165 - 29343, n=23, last 2 years) | |
| Lenovo ThinkPad P16 G1 21D6001DMB | |
| Asus ExpertBook B6 Flip B6602FC2 | |
| Average Intel Core i7-12850HX (9869 - 11286, n=2) | |
| HP ZBook Fury 17 G8-4A6A9EA | |
| Dell Precision 7670 | |
| AIDA64 / FPU Mandel | |
| Average of class Workstation (44497 - 98153, n=23, last 2 years) | |
| Lenovo ThinkPad P16 G1 21D6001DMB | |
| Asus ExpertBook B6 Flip B6602FC2 | |
| HP ZBook Fury 17 G8-4A6A9EA | |
| Average Intel Core i7-12850HX (34218 - 42580, n=2) | |
| Dell Precision 7670 | |
| AIDA64 / CPU AES | |
| Average of class Workstation (73133 - 187841, n=23, last 2 years) | |
| HP ZBook Fury 17 G8-4A6A9EA | |
| Lenovo ThinkPad P16 G1 21D6001DMB | |
| Asus ExpertBook B6 Flip B6602FC2 | |
| Average Intel Core i7-12850HX (63362 - 80775, n=2) | |
| Dell Precision 7670 | |
| AIDA64 / CPU ZLib | |
| Average of class Workstation (929 - 2148, n=23, last 2 years) | |
| Lenovo ThinkPad P16 G1 21D6001DMB | |
| Asus ExpertBook B6 Flip B6602FC2 | |
| Average Intel Core i7-12850HX (817 - 1102, n=2) | |
| Dell Precision 7670 | |
| HP ZBook Fury 17 G8-4A6A9EA | |
| AIDA64 / FP64 Ray-Trace | |
| Average of class Workstation (8545 - 32891, n=23, last 2 years) | |
| Lenovo ThinkPad P16 G1 21D6001DMB | |
| Asus ExpertBook B6 Flip B6602FC2 | |
| HP ZBook Fury 17 G8-4A6A9EA | |
| Average Intel Core i7-12850HX (7671 - 9145, n=2) | |
| Dell Precision 7670 | |
| AIDA64 / CPU PhotoWorxx | |
| Average of class Workstation (37151 - 93684, n=23, last 2 years) | |
| Dell Precision 7670 | |
| Average Intel Core i7-12850HX (33415 - 42035, n=2) | |
| Asus ExpertBook B6 Flip B6602FC2 | |
| Lenovo ThinkPad P16 G1 21D6001DMB | |
| HP ZBook Fury 17 G8-4A6A9EA | |
系统性能
虽然PCMark 10的分数相对较低,但联想ThinkPad P16 G1在日常使用中提供了非常好的性能--考虑到强大的组件,这也是合乎逻辑的。相应地,CrossMark的成绩也要好得多。
CrossMark: Overall | Productivity | Creativity | Responsiveness
| PCMark 10 / Score | |
| Average of class Workstation (6563 - 10409, n=19, last 2 years) | |
| Asus ExpertBook B6 Flip B6602FC2 | |
| Dell Precision 7670 | |
| Lenovo ThinkPad P15 G2-20YQ001JGE | |
| Average Intel Core i7-12850HX, NVIDIA RTX A2000 Laptop GPU (6226 - 6663, n=2) | |
| Lenovo ThinkPad P17 G2-20YU0025G | |
| Lenovo ThinkPad P16 G1 21D6001DMB | |
| HP ZBook Fury 17 G8-4A6A9EA | |
| PCMark 10 / Essentials | |
| Asus ExpertBook B6 Flip B6602FC2 | |
| Dell Precision 7670 | |
| Average of class Workstation (9622 - 11157, n=19, last 2 years) | |
| Average Intel Core i7-12850HX, NVIDIA RTX A2000 Laptop GPU (10128 - 10555, n=2) | |
| Lenovo ThinkPad P15 G2-20YQ001JGE | |
| Lenovo ThinkPad P16 G1 21D6001DMB | |
| Lenovo ThinkPad P17 G2-20YU0025G | |
| HP ZBook Fury 17 G8-4A6A9EA | |
| PCMark 10 / Productivity | |
| Average of class Workstation (8789 - 20616, n=19, last 2 years) | |
| Asus ExpertBook B6 Flip B6602FC2 | |
| Lenovo ThinkPad P16 G1 21D6001DMB | |
| Average Intel Core i7-12850HX, NVIDIA RTX A2000 Laptop GPU (9008 - 9349, n=2) | |
| Dell Precision 7670 | |
| Lenovo ThinkPad P15 G2-20YQ001JGE | |
| Lenovo ThinkPad P17 G2-20YU0025G | |
| HP ZBook Fury 17 G8-4A6A9EA | |
| PCMark 10 / Digital Content Creation | |
| Average of class Workstation (8108 - 15631, n=19, last 2 years) | |
| HP ZBook Fury 17 G8-4A6A9EA | |
| Asus ExpertBook B6 Flip B6602FC2 | |
| Lenovo ThinkPad P15 G2-20YQ001JGE | |
| Lenovo ThinkPad P17 G2-20YU0025G | |
| Dell Precision 7670 | |
| Average Intel Core i7-12850HX, NVIDIA RTX A2000 Laptop GPU (6918 - 8443, n=2) | |
| Lenovo ThinkPad P16 G1 21D6001DMB | |
| CrossMark / Overall | |
| Asus ExpertBook B6 Flip B6602FC2 | |
| Average of class Workstation (1307 - 2267, n=22, last 2 years) | |
| Lenovo ThinkPad P16 G1 21D6001DMB | |
| Average Intel Core i7-12850HX, NVIDIA RTX A2000 Laptop GPU (1509 - 1720, n=2) | |
| Dell Precision 7670 | |
| HP ZBook Fury 17 G8-4A6A9EA | |
| CrossMark / Productivity | |
| Asus ExpertBook B6 Flip B6602FC2 | |
| Average of class Workstation (1130 - 2122, n=22, last 2 years) | |
| Lenovo ThinkPad P16 G1 21D6001DMB | |
| Average Intel Core i7-12850HX, NVIDIA RTX A2000 Laptop GPU (1445 - 1611, n=2) | |
| HP ZBook Fury 17 G8-4A6A9EA | |
| Dell Precision 7670 | |
| CrossMark / Creativity | |
| Average of class Workstation (1657 - 2725, n=22, last 2 years) | |
| Asus ExpertBook B6 Flip B6602FC2 | |
| Lenovo ThinkPad P16 G1 21D6001DMB | |
| Average Intel Core i7-12850HX, NVIDIA RTX A2000 Laptop GPU (1682 - 1943, n=2) | |
| Dell Precision 7670 | |
| HP ZBook Fury 17 G8-4A6A9EA | |
| CrossMark / Responsiveness | |
| Asus ExpertBook B6 Flip B6602FC2 | |
| Average of class Workstation (993 - 2096, n=22, last 2 years) | |
| Lenovo ThinkPad P16 G1 21D6001DMB | |
| Average Intel Core i7-12850HX, NVIDIA RTX A2000 Laptop GPU (1238 - 1454, n=2) | |
| Dell Precision 7670 | |
| HP ZBook Fury 17 G8-4A6A9EA | |
| PCMark 10 Score | 6226 points | |
Help | ||
| AIDA64 / Memory Copy | |
| Average of class Workstation (56003 - 164795, n=23, last 2 years) | |
| Dell Precision 7670 | |
| Asus ExpertBook B6 Flip B6602FC2 | |
| Average Intel Core i7-12850HX (53840 - 62841, n=2) | |
| Lenovo ThinkPad P16 G1 21D6001DMB | |
| HP ZBook Fury 17 G8-4A6A9EA | |
| AIDA64 / Memory Read | |
| Average of class Workstation (55795 - 121563, n=23, last 2 years) | |
| Dell Precision 7670 | |
| Average Intel Core i7-12850HX (58944 - 68747, n=2) | |
| Asus ExpertBook B6 Flip B6602FC2 | |
| Lenovo ThinkPad P16 G1 21D6001DMB | |
| HP ZBook Fury 17 G8-4A6A9EA | |
| AIDA64 / Memory Write | |
| Average of class Workstation (55663 - 214520, n=23, last 2 years) | |
| Dell Precision 7670 | |
| Asus ExpertBook B6 Flip B6602FC2 | |
| Average Intel Core i7-12850HX (52160 - 64365, n=2) | |
| Lenovo ThinkPad P16 G1 21D6001DMB | |
| HP ZBook Fury 17 G8-4A6A9EA | |
| AIDA64 / Memory Latency | |
| Average of class Workstation (84.5 - 165.2, n=23, last 2 years) | |
| Lenovo ThinkPad P16 G1 21D6001DMB | |
| Asus ExpertBook B6 Flip B6602FC2 | |
| Average Intel Core i7-12850HX (88.5 - 95.4, n=2) | |
| Dell Precision 7670 | |
| HP ZBook Fury 17 G8-4A6A9EA | |
| Lenovo ThinkPad P17 G2-20YU0025G | |
| Lenovo ThinkPad P15 G2-20YQ001JGE | |
* ... smaller is better
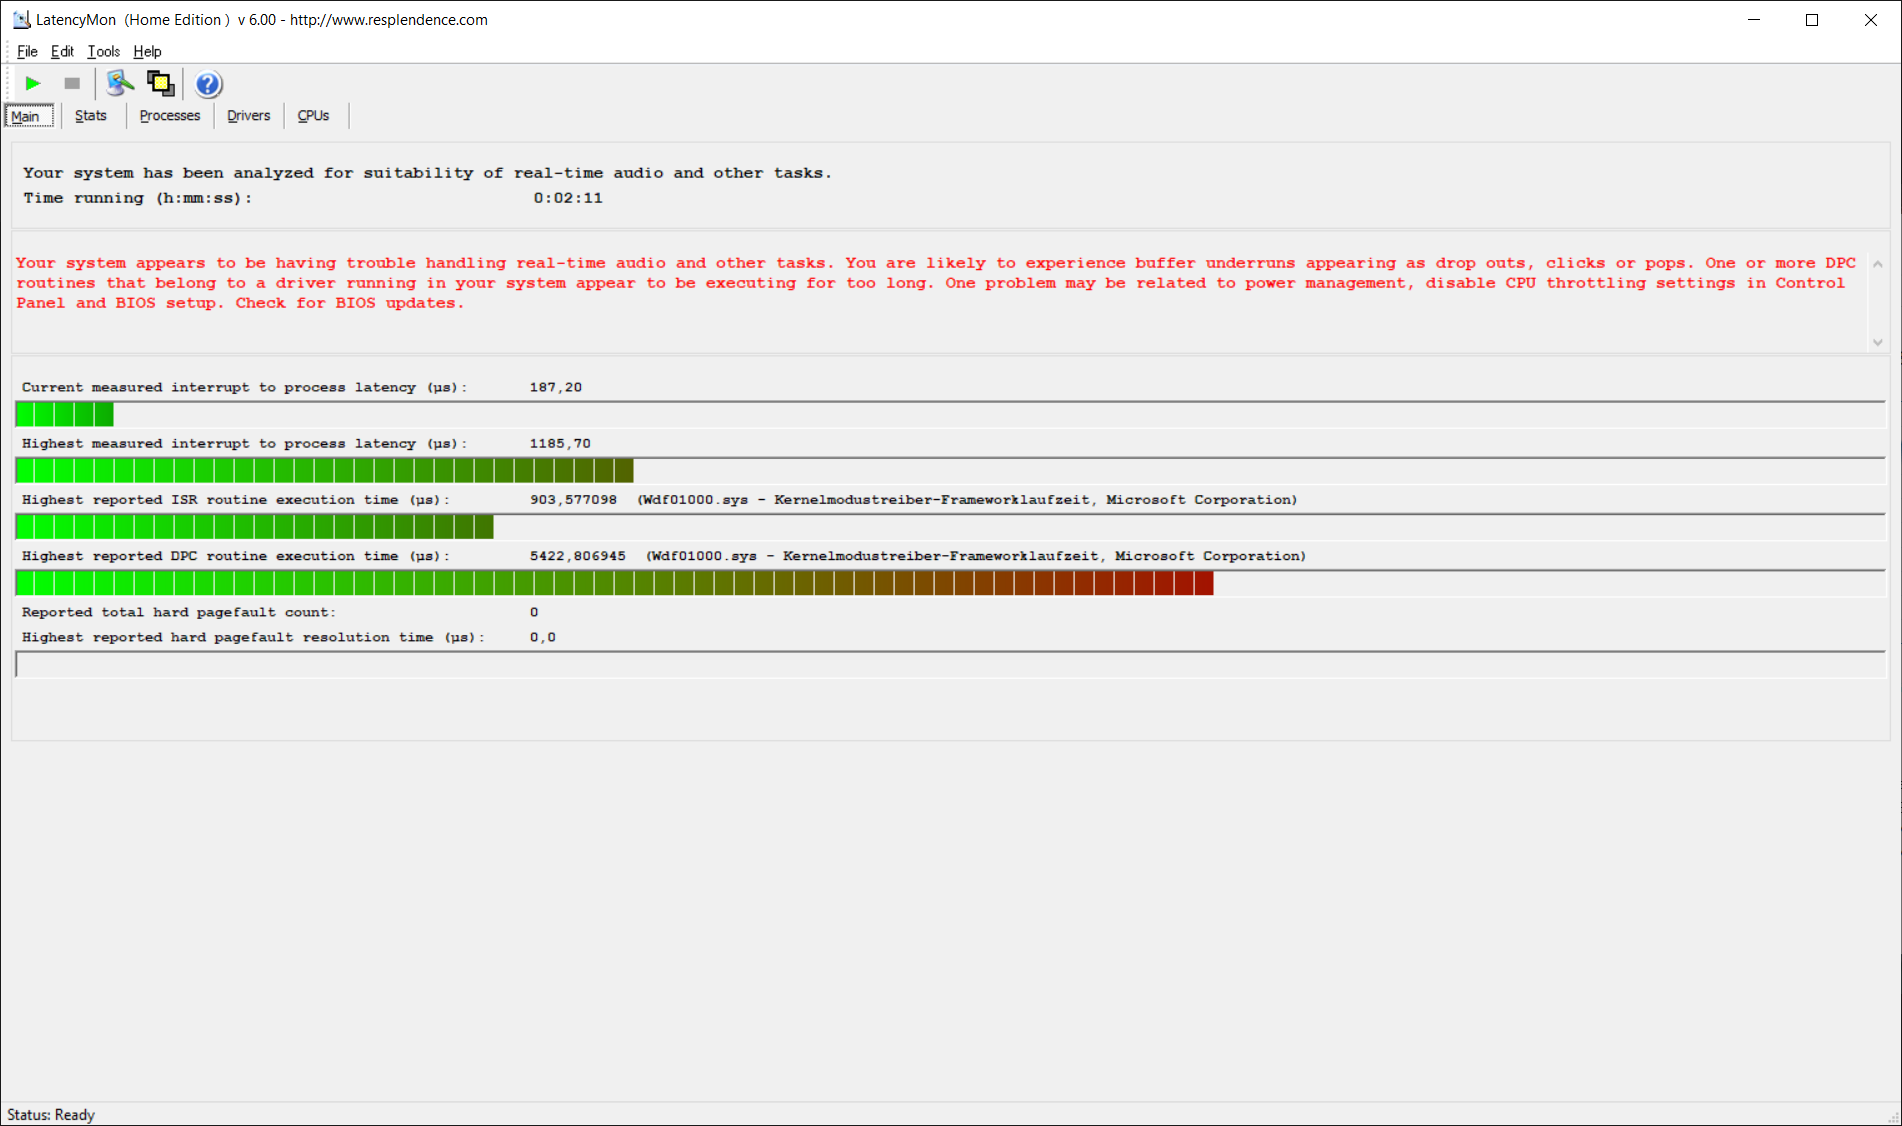
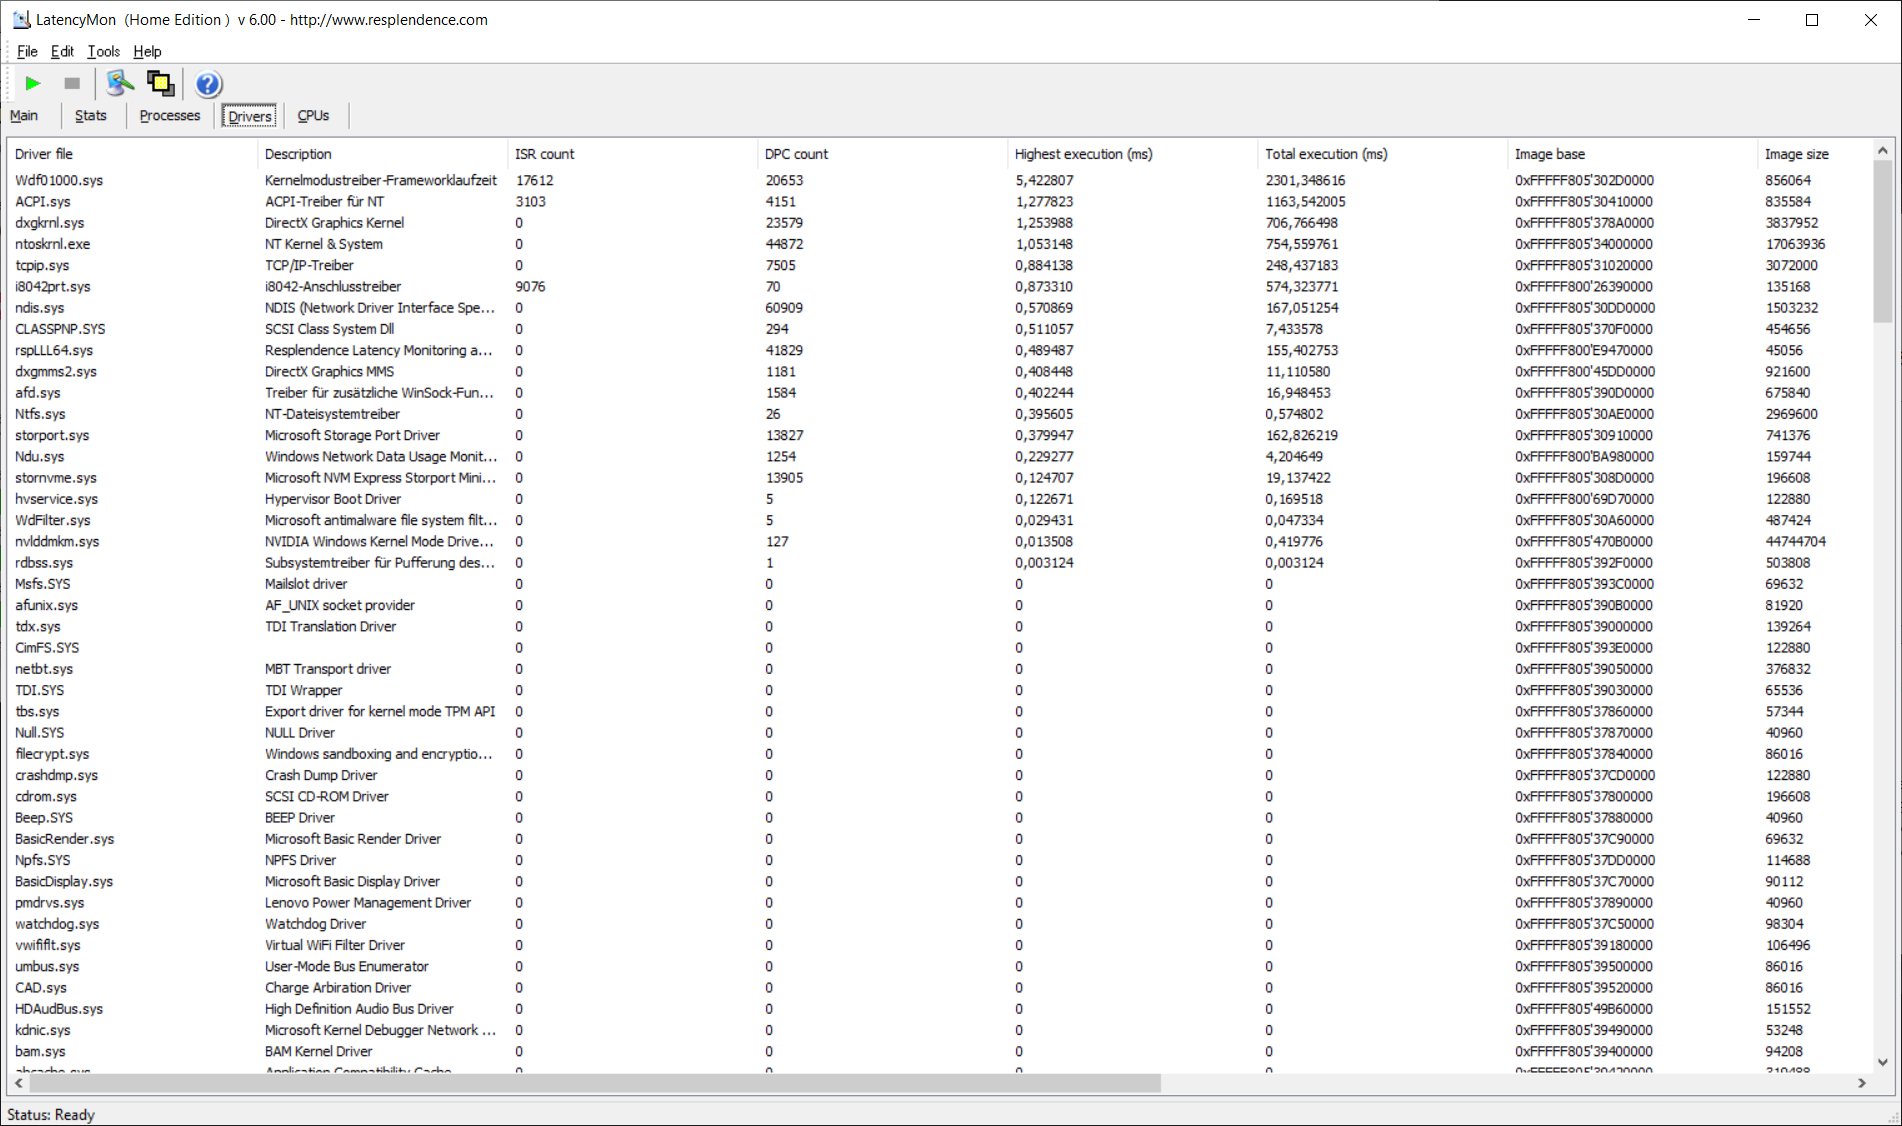
DPC延迟
DPC的延迟明显低于其前身,但仍然过高。尽管如此,在驱动程序更新的帮助下,这种情况可以在任何时候改变。
| DPC Latencies / LatencyMon - interrupt to process latency (max), Web, Youtube, Prime95 | |
| Lenovo ThinkPad P17 G2-20YU0025G | |
| Lenovo ThinkPad P15 G2-20YQ001JGE | |
| Asus ExpertBook B6 Flip B6602FC2 | |
| Dell Precision 7670 | |
| Lenovo ThinkPad P16 G1 21D6001DMB | |
| HP ZBook Studio 16 G9 62U04EA | |
* ... smaller is better
大容量存储
联想ThinkPad P16 G1的固态硬盘来自美光,容量为1TB,是一款速度非常快的NVMe PCIe 4.0固态硬盘,采用M.2 2280格式。该固态硬盘比华硕ExpertBook中的三星固态硬盘要慢,但比其他竞争对手要快。

* ... smaller is better
Continuous Performance Read: DiskSpd Read Loop, Queue Depth 8
图形卡
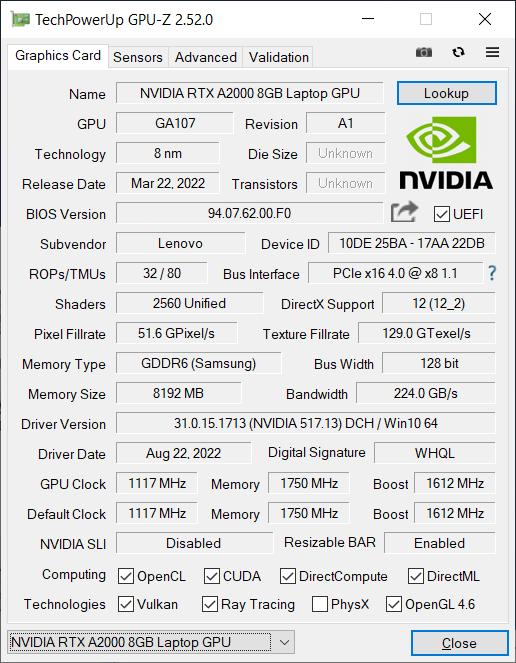
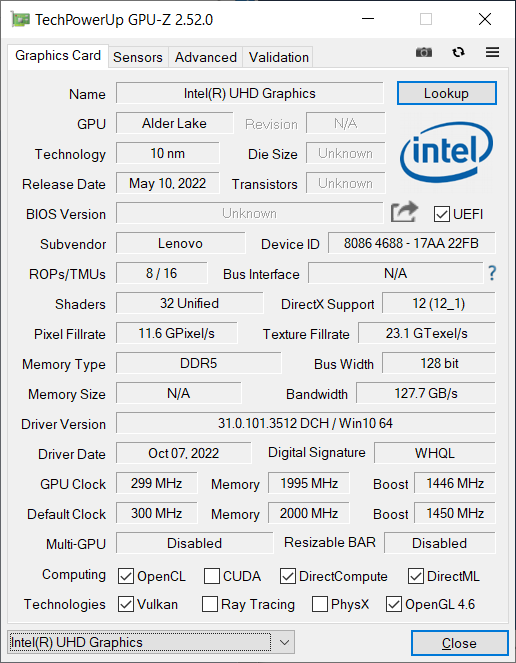
的Nvidia RTX A2000是Nvidia专业RTX系列的安培一代GPU,以前被称为 "Quadro"。2560个着色器单元的最大时钟速度为1.678 GHz。这种图形芯片的典型TDP在35至95瓦之间;RTX A2000有8GB的专用内存,连接到128位内存总线。该GPU列表是与其他图形芯片进行基准比较的一个优秀资源。
联想ThinkPad P16中的RTX A2000最多可消耗60瓦,使其成为入门级选择之一,其次是RTX A3000,能够消耗115瓦的GPU。根据有限的消耗,RTX A2000的性能并不特别突出。在所有比较的工作站中,联想ThinkPad P16表现最差,不管是在3DMark测试中还是在工作站专用的SPECviewperf基准测试中。尤其是戴尔Precision 7670,以及 华硕ExpertBook B6 Flip在这些笔记本电脑中,几乎使用相同的GPU,分别以90瓦和95瓦的TDP运行,表现更好。
这一结果也反映在Blender测试中。在GPU加速测试中,ThinkPad P16 G1的速度比竞争对手慢。然而,在Blender CPU测试中,它是最快的移动工作站。
与处理器一样,GPU性能在电池模式下受到限制,与电源操作相比,性能下降了约15%。
| 3DMark 11 Performance | 15998 points | |
| 3DMark Cloud Gate Standard Score | 40815 points | |
| 3DMark Fire Strike Score | 10381 points | |
| 3DMark Time Spy Score | 5184 points | |
Help | ||
* ... smaller is better
游戏性能
作为一个移动工作站,联想ThinkPad P16不是游戏笔记本电脑。然而,较新的游戏也是可以的,即使不是4K的。与合成基准测试一样,直接竞争对手的速度比P16快。由于P16无法在恒定负载下保持恒定的GPU性能,低TDP变得更加困难。
| The Witcher 3 - 1920x1080 Ultra Graphics & Postprocessing (HBAO+) | |
| Average of class Workstation (n=1last 2 years) | |
| Lenovo ThinkPad P15 G2-20YQ001JGE | |
| Asus ExpertBook B6 Flip B6602FC2 | |
| HP ZBook Fury 17 G8-4A6A9EA | |
| Dell Precision 7670 | |
| Lenovo ThinkPad P17 G2-20YU0025G | |
| Lenovo ThinkPad P16 G1 21D6001DMB | |
Witcher 3 FPS diagram
| low | med. | high | ultra | QHD | |
|---|---|---|---|---|---|
| The Witcher 3 (2015) | 273 | 150.5 | 79.7 | 43.6 | |
| Dota 2 Reborn (2015) | 177.5 | 160.8 | 149.3 | 139.5 | |
| Final Fantasy XV Benchmark (2018) | 96.7 | 51.9 | 38.3 | 31.1 | |
| X-Plane 11.11 (2018) | 140.3 | 119.2 | 95.6 | ||
| Strange Brigade (2018) | 280 | 118.6 | 91.1 | 77.8 | 54.3 |
排放物。风扇的声音很大,但ThinkPad笔记本电脑保持凉爽
噪声排放
闲置时,联想ThinkPad P16的风扇保持沉默。在负载情况下,它们的音量为56.3 dB(a),可以变得很大--甚至比笔记本的直接对应物还要大。然而,并不是每一个应用都是这样的。在Witcher 3 测试中,风扇运行得比较安静,只有34.1 dB(a)。
我们无法在联想笔记本电脑中检测到任何线圈的啸叫。
Noise level
| Idle |
| 23.2 / 23.2 / 23.2 dB(A) |
| Load |
| 47.8 / 56.3 dB(A) |
 | ||
30 dB silent 40 dB(A) audible 50 dB(A) loud |
||
min: | ||
| Lenovo ThinkPad P16 G1 21D6001DMB RTX A2000 Laptop GPU, i7-12850HX, Micron 3400 1TB MTFDKBA1T0TFH | Lenovo ThinkPad P15 G2-20YQ001JGE RTX A3000 Laptop GPU, i7-11800H, Kioxia XG7 KXG7AZNV512G | Lenovo ThinkPad P17 G2-20YU0025G RTX A2000 Laptop GPU, i7-11800H, Kioxia XG7 KXG7AZNV512G | HP ZBook Fury 17 G8-4A6A9EA RTX A3000 Laptop GPU, i9-11950H, Toshiba XG6 KXG60ZNV1T02 | Dell Precision 7670 RTX A2000 Laptop GPU, i7-12850HX, SK Hynix HFS001TEJ9X115N | Asus ExpertBook B6 Flip B6602FC2 RTX A2000 Laptop GPU, i9-12950HX, Samsung PM9A1 MZVL21T0HCLR | |
|---|---|---|---|---|---|---|
| Noise | -6% | -4% | -5% | -4% | -22% | |
| off / environment * (dB) | 23.2 | 24.3 -5% | 26.4 -14% | 24.5 -6% | 22.7 2% | 26 -12% |
| Idle Minimum * (dB) | 23.2 | 24.3 -5% | 26.4 -14% | 24.5 -6% | 22.9 1% | 32.4 -40% |
| Idle Average * (dB) | 23.2 | 24.3 -5% | 26.4 -14% | 24.5 -6% | 22.9 1% | 32.4 -40% |
| Idle Maximum * (dB) | 23.2 | 28.6 -23% | 26.4 -14% | 26.8 -16% | 24.5 -6% | 32.4 -40% |
| Load Average * (dB) | 47.8 | 47.5 1% | 38.1 20% | 41.8 13% | 48.7 -2% | 51.9 -9% |
| Witcher 3 ultra * (dB) | 34.1 | 38.1 -12% | 44.9 -32% | 45.2 -33% | ||
| Load Maximum * (dB) | 56.3 | 54.9 2% | 45 20% | 47.1 16% | 52.1 7% | 52.1 7% |
* ... smaller is better
温度
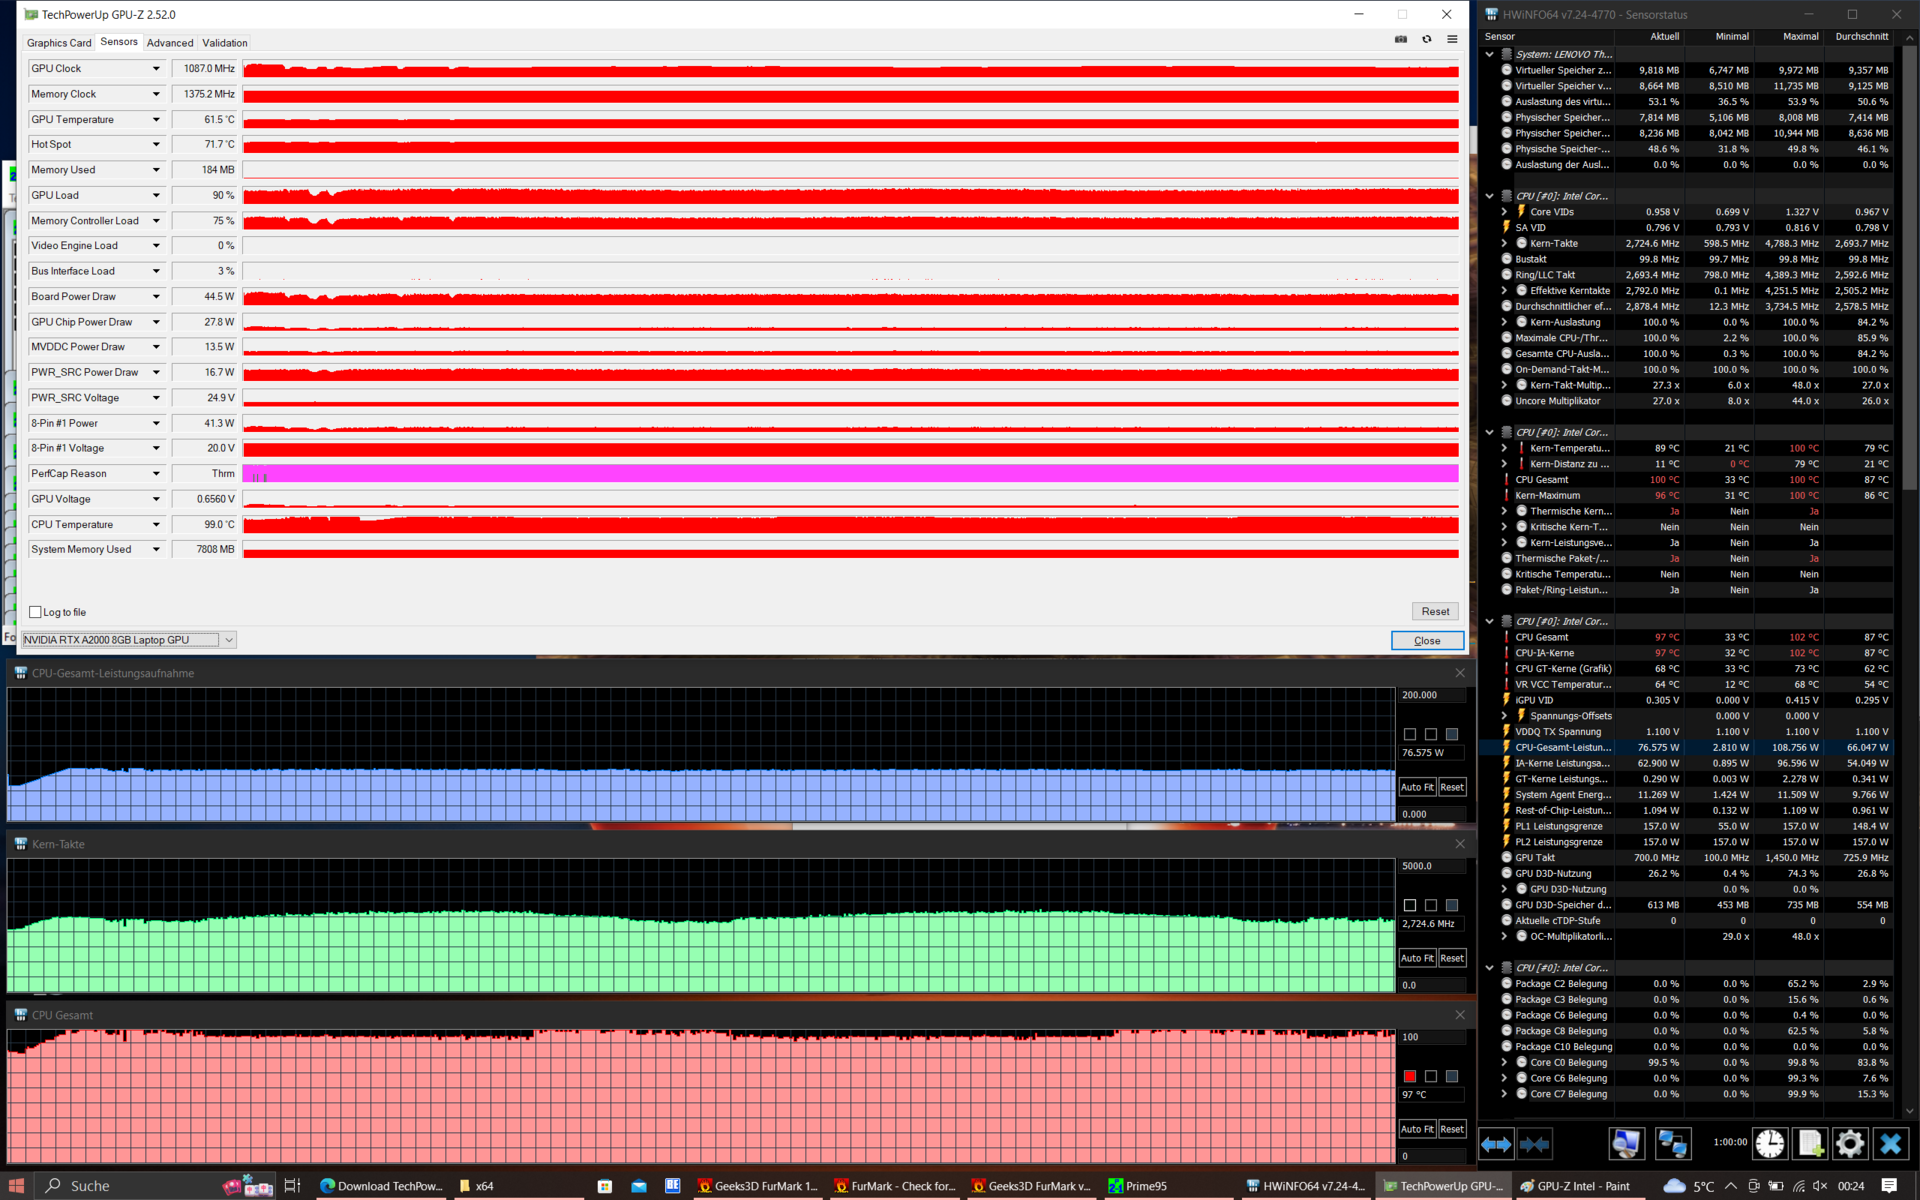
宽敞的机箱,其滚笼结构和蒸汽室,确保了废热的相对均匀分布。因此,联想ThinkPad P16的掌托会有点热,但最高温度保持在可接受的范围内。在压力测试中,热点温度为43,1度,可以说是一个很好的结果。
虽然处理器在压力测试中没有被节流,但GPU性能下降。一小时后,它只能消耗45瓦而不是60瓦。
(±) The maximum temperature on the upper side is 43.1 °C / 110 F, compared to the average of 38.2 °C / 101 F, ranging from 22.2 to 69.8 °C for the class Workstation.
(+) The bottom heats up to a maximum of 39.9 °C / 104 F, compared to the average of 41.1 °C / 106 F
(+) In idle usage, the average temperature for the upper side is 24.7 °C / 76 F, compared to the device average of 32 °C / 90 F.
(+) Playing The Witcher 3, the average temperature for the upper side is 31.2 °C / 88 F, compared to the device average of 32 °C / 90 F.
(±) The palmrests and touchpad can get very hot to the touch with a maximum of 36.7 °C / 98.1 F.
(-) The average temperature of the palmrest area of similar devices was 27.8 °C / 82 F (-8.9 °C / -16.1 F).
| Lenovo ThinkPad P16 G1 21D6001DMB Intel Core i7-12850HX, NVIDIA RTX A2000 Laptop GPU | Lenovo ThinkPad P15 G2-20YQ001JGE Intel Core i7-11800H, NVIDIA RTX A3000 Laptop GPU | Lenovo ThinkPad P17 G2-20YU0025G Intel Core i7-11800H, NVIDIA RTX A2000 Laptop GPU | HP ZBook Fury 17 G8-4A6A9EA Intel Core i9-11950H, NVIDIA RTX A3000 Laptop GPU | Dell Precision 7670 Intel Core i7-12850HX, NVIDIA RTX A2000 Laptop GPU | Asus ExpertBook B6 Flip B6602FC2 Intel Core i9-12950HX, NVIDIA RTX A2000 Laptop GPU | |
|---|---|---|---|---|---|---|
| Heat | -21% | -12% | -12% | -18% | -15% | |
| Maximum Upper Side * (°C) | 43.1 | 49.7 -15% | 49.6 -15% | 41.9 3% | 51 -18% | 48.4 -12% |
| Maximum Bottom * (°C) | 39.9 | 63.2 -58% | 52.1 -31% | 52.9 -33% | 45.8 -15% | 52.3 -31% |
| Idle Upper Side * (°C) | 26 | 27.1 -4% | 26 -0% | 28.2 -8% | 31.8 -22% | 27.8 -7% |
| Idle Bottom * (°C) | 27.6 | 29.8 -8% | 27.6 -0% | 30.7 -11% | 32.6 -18% | 30.3 -10% |
* ... smaller is better
发言人
立体声扬声器位于键盘的顶部。与之相比扬声器总体上更安静一些,但产生的声音更均衡,并有更多的低音。相比,扬声器总体上更安静一些,但能产生更均衡的声音和更多的低音。虽然对于一台笔记本电脑来说,音质很好,但仍然无法与外部音响系统相比。
Lenovo ThinkPad P16 G1 21D6001DMB audio analysis
(±) | speaker loudness is average but good (73.8 dB)
Bass 100 - 315 Hz
(±) | reduced bass - on average 9.7% lower than median
(±) | linearity of bass is average (12.8% delta to prev. frequency)
Mids 400 - 2000 Hz
(+) | balanced mids - only 2.9% away from median
(+) | mids are linear (6.3% delta to prev. frequency)
Highs 2 - 16 kHz
(+) | balanced highs - only 3.1% away from median
(+) | highs are linear (4.3% delta to prev. frequency)
Overall 100 - 16.000 Hz
(+) | overall sound is linear (13% difference to median)
Compared to same class
» 22% of all tested devices in this class were better, 6% similar, 72% worse
» The best had a delta of 7%, average was 17%, worst was 35%
Compared to all devices tested
» 13% of all tested devices were better, 3% similar, 85% worse
» The best had a delta of 4%, average was 23%, worst was 134%
Lenovo ThinkPad P15 G2-20YQ001JGE audio analysis
(±) | speaker loudness is average but good (78 dB)
Bass 100 - 315 Hz
(-) | nearly no bass - on average 15.5% lower than median
(±) | linearity of bass is average (9.6% delta to prev. frequency)
Mids 400 - 2000 Hz
(±) | higher mids - on average 7.5% higher than median
(+) | mids are linear (6.6% delta to prev. frequency)
Highs 2 - 16 kHz
(+) | balanced highs - only 2.4% away from median
(+) | highs are linear (5.8% delta to prev. frequency)
Overall 100 - 16.000 Hz
(±) | linearity of overall sound is average (20.6% difference to median)
Compared to same class
» 74% of all tested devices in this class were better, 6% similar, 21% worse
» The best had a delta of 7%, average was 17%, worst was 35%
Compared to all devices tested
» 55% of all tested devices were better, 8% similar, 37% worse
» The best had a delta of 4%, average was 23%, worst was 134%
电源管理。GPU对电源管理有负面影响
消耗功率
联想ThinkPad P16比同类设备的运行效率更高。即使在闲置时,它也比竞争对手更节能。然而,为了公平起见,还必须说,惠普和戴尔的类似笔记本电脑都有4K显示屏。同样,尽管它的WQXGA液晶显示器分辨率更高,但它比拥有全高清面板的P15和P17更有效率。
Slim Tip电源适配器可提供170瓦的功率--对于168.9瓦的最大消耗量来说相当到位。
| Off / Standby | |
| Idle | |
| Load |
|
Key:
min: | |
| Lenovo ThinkPad P16 G1 21D6001DMB i7-12850HX, RTX A2000 Laptop GPU, Micron 3400 1TB MTFDKBA1T0TFH, IPS LED, 2560x1600, 16" | Lenovo ThinkPad P15 G2-20YQ001JGE i7-11800H, RTX A3000 Laptop GPU, Kioxia XG7 KXG7AZNV512G, IPS, 1920x1080, 15.6" | Lenovo ThinkPad P17 G2-20YU0025G i7-11800H, RTX A2000 Laptop GPU, Kioxia XG7 KXG7AZNV512G, IPS LED, 1920x1080, 17.3" | HP ZBook Fury 17 G8-4A6A9EA i9-11950H, RTX A3000 Laptop GPU, Toshiba XG6 KXG60ZNV1T02, IPS, 3840x2160, 17.3" | Dell Precision 7670 i7-12850HX, RTX A2000 Laptop GPU, SK Hynix HFS001TEJ9X115N, OLED, 3840x2400, 16" | Asus ExpertBook B6 Flip B6602FC2 i9-12950HX, RTX A2000 Laptop GPU, Samsung PM9A1 MZVL21T0HCLR, IPS, 2560x1600, 16" | Average NVIDIA RTX A2000 Laptop GPU | Average of class Workstation | |
|---|---|---|---|---|---|---|---|---|
| Power Consumption | -23% | -15% | -49% | -56% | -67% | -24% | -39% | |
| Idle Minimum * (Watt) | 5.1 | 6.3 -24% | 6.1 -20% | 7.6 -49% | 7.5 -47% | 10.5 -106% | 6.6 ? -29% | 9.11 ? -79% |
| Idle Average * (Watt) | 9.2 | 10.7 -16% | 10.9 -18% | 16.7 -82% | 9.5 -3% | 11.9 -29% | 11.8 ? -28% | 13.8 ? -50% |
| Idle Maximum * (Watt) | 9.9 | 11.6 -17% | 12.3 -24% | 17.5 -77% | 28.4 -187% | 18 -82% | 16.7 ? -69% | 17.9 ? -81% |
| Load Average * (Watt) | 124.1 | 99.3 20% | 106.3 14% | 117 6% | 139.1 -12% | 182 -47% | 116.3 ? 6% | 96 ? 23% |
| Witcher 3 ultra * (Watt) | 87.7 | 154 -76% | 124 -41% | 150 -71% | 134 -53% | 177.5 -102% | ||
| Load Maximum * (Watt) | 168.9 | 210 -24% | 168.9 -0% | 202 -20% | 220.8 -31% | 229 -36% | 171.2 ? -1% | 180.3 ? -7% |
* ... smaller is better
Power consumption Witcher 3 / stress test
Power consumption with an external monitor
电池寿命
联想没有对内部94瓦时的锂聚合物电池进行任何改动。因此,在WiFi测试中,电池运行时间与前代产品的水平相似,约为9小时(150cd/m²的显示亮度)。ThinkPad P16有一个明显的优势,那就是比 戴尔Precision 7670由于其较小的83瓦时电池和4K显示屏,它在WiFi测试中的持续时间几乎没有那么长。
| Lenovo ThinkPad P16 G1 21D6001DMB i7-12850HX, RTX A2000 Laptop GPU, 94 Wh | Lenovo ThinkPad P15 G2-20YQ001JGE i7-11800H, RTX A3000 Laptop GPU, 94 Wh | Lenovo ThinkPad P17 G2-20YU0025G i7-11800H, RTX A2000 Laptop GPU, 94 Wh | HP ZBook Fury 17 G8-4A6A9EA i9-11950H, RTX A3000 Laptop GPU, 94 Wh | Dell Precision 7670 i7-12850HX, RTX A2000 Laptop GPU, 83 Wh | Asus ExpertBook B6 Flip B6602FC2 i9-12950HX, RTX A2000 Laptop GPU, 90 Wh | Average of class Workstation | |
|---|---|---|---|---|---|---|---|
| Battery runtime | -12% | -9% | -5% | -33% | -7% | -15% | |
| WiFi v1.3 (h) | 9.4 | 9.9 5% | 9.8 4% | 7.4 -21% | 5.9 -37% | 8.7 -7% | 8.55 ? -9% |
| Load (h) | 1.8 | 1.3 -28% | 1.4 -22% | 2 11% | 1.3 -28% | 1.7 -6% | 1.441 ? -20% |
Pros
Cons
结论:新的ThinkPad工作站因图形芯片而暴露无遗
通过ThinkPad P16 Gen 1,联想迈出了一大步,从拥有两款、15和17英寸的工作站到只有一款16英寸的机型--这是对产品线罕见但令人欢迎的简化。同时,联想也敢于动摇ThinkPad P系列以前的设计语言。总而言之,结果是一个非常好的工作站,然而,它也不是没有缺陷的。
毋庸置疑,联想笔记本电脑的优势之一是其可扩展性。只有这类工作站可以提供多达四个内存插槽。该设备的功能也很齐全,并为WWAN做了预先准备。然而,我们错过了RJ45以太网端口。新的设计是否是一种光学改进,这是一个品味问题,但新的金属加固的显示盖毫无疑问是非常坚固的。哑光的WQXGA显示屏以其高亮度给人留下深刻印象,但遗憾的是,联想没有提供165赫兹的面板,在X1 Extreme 第五代.ThinkPad P16的输入设备仍然非常好,但减少的键程使它与它的前辈ThinkPad P17不在同一水平上。ThinkPad P17.
当涉及到移动工作站时,性能是关键。在这里,我们可以看到处理器的性能得到了显著提高。然而,这并不适用于GPU:不必要的是,联想将RTX A2000的消耗量仅为60瓦。奇怪的是,在纯粹的CPU负载下,风扇的运行并不强大,所以由于这个原因,笔记本在负载下的性能被扼杀了。说到风扇。在持续负载下,主动冷却的运行声音非常大。然而,这样做的好处是,几乎在每一个领域,ThinkPad P16都能保持比其头脑发热的前辈机型P15和P17低得多的温度。
强大的CPU性能,但在ThinkPad P16的这个评测版本中,GPU落在了后面。
总之,我们的评测机型联想ThinkPad P16 G1在被要求执行CPU重的任务时是一个很好的选择。如果GPU很重要,你应该避免购买RTX-A2000版本。然而,这并不意味着配备更强大的GPU之一的ThinkPad P16也会遭受同样的问题--我们对Nvidia RTX A5500 型号的审查现在已经上线。
对于寻求更多移动工作站的人来说,一个有趣的选择可能是戴尔Precision 7670 ,它有更薄、更紧凑的外壳。华硕ExpertBook B6 Flip 将工作站的功能与可转换设计相结合,对于经常使用手写笔工作的用户可能是一个令人兴奋的选择。
价格和可用性
高性能是有代价的。ThinkPad P16的价格至少为2050美元,装备较好的型号价格超过3500美元。在亚马逊上,与我们的评测机型类似的设备价格为,约2800美元。
Lenovo ThinkPad P16 G1 21D6001DMB
- 01/27/2023 v7 (old)
Benjamin Herzig
Price comparison

