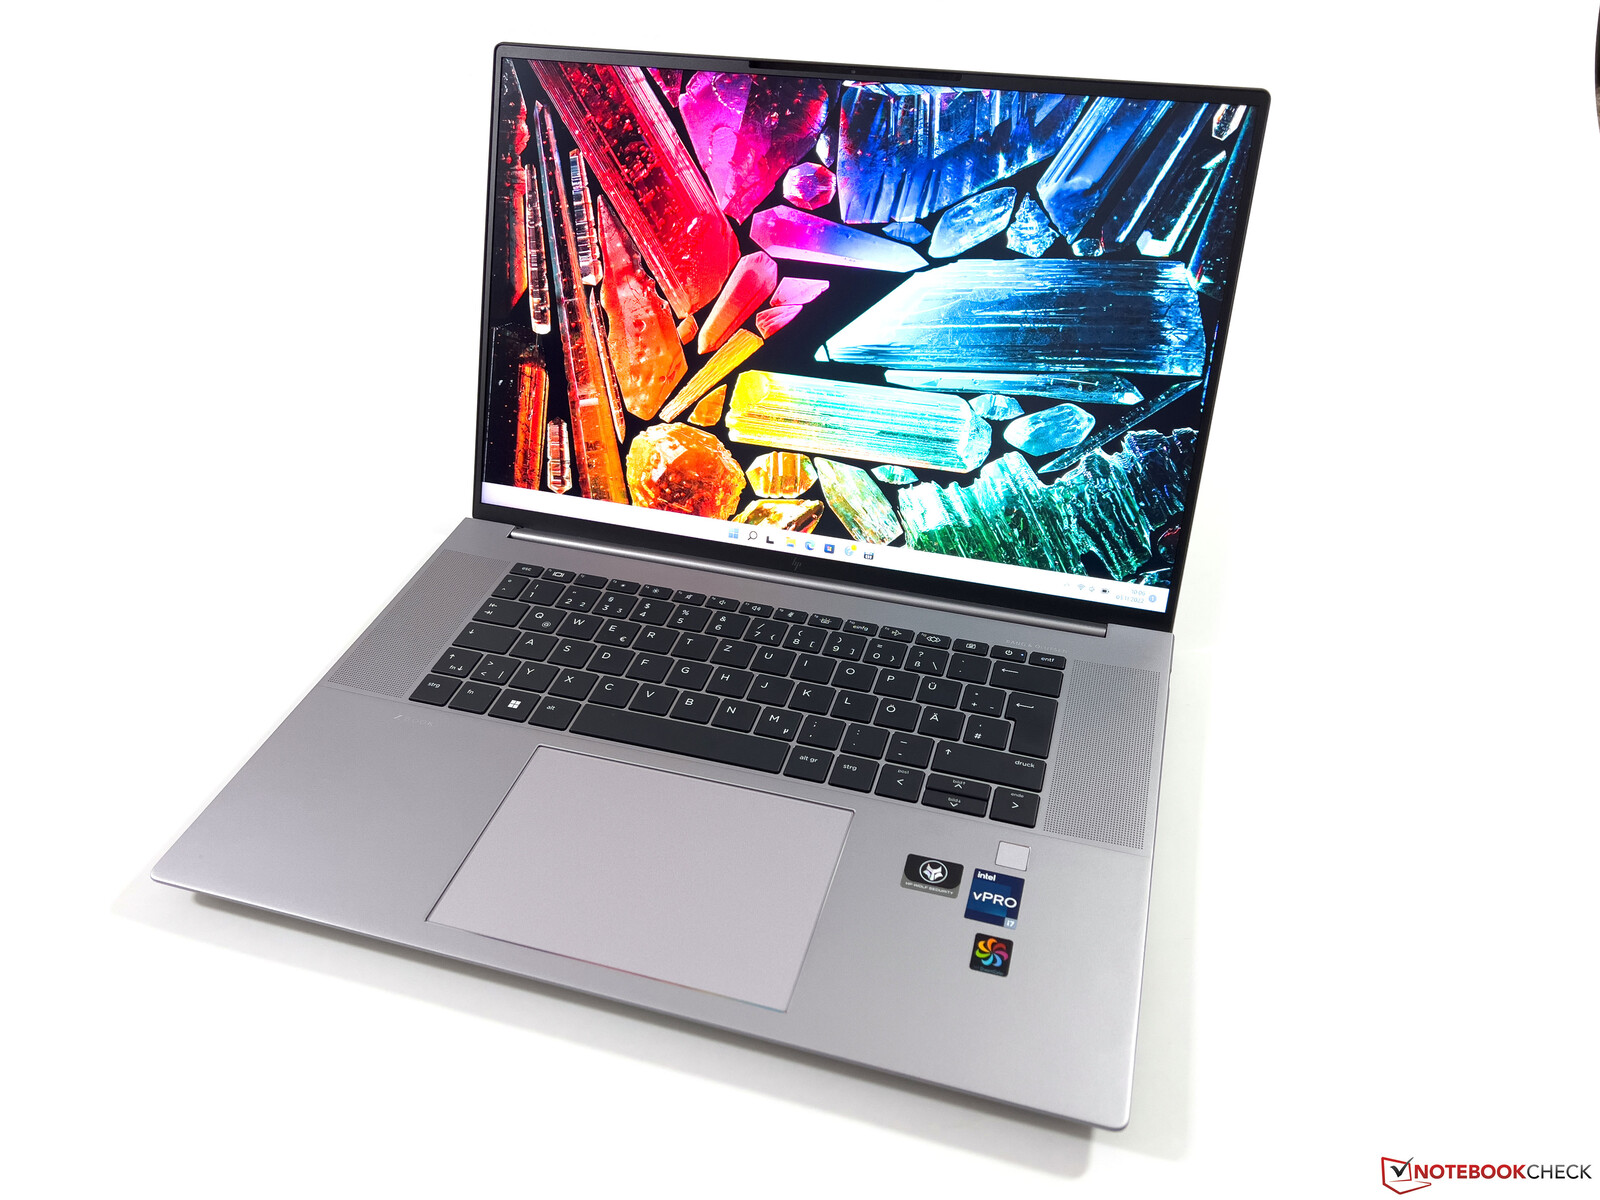
惠普ZBook Studio 16 G9笔记本电脑评测。配备120赫兹DreamColor显示屏的工作站
惠普的ZBook Studio是一款高质量和超薄的移动工作站,与诸如以下机型直接竞争。戴尔Precision 5560或 联想ThinkPad P1。虽然它确实拥有强大的组件,但与惠普更庞大的ZBook Fury系列相比,它对移动性的关注更多。 ZBook Fury系列.
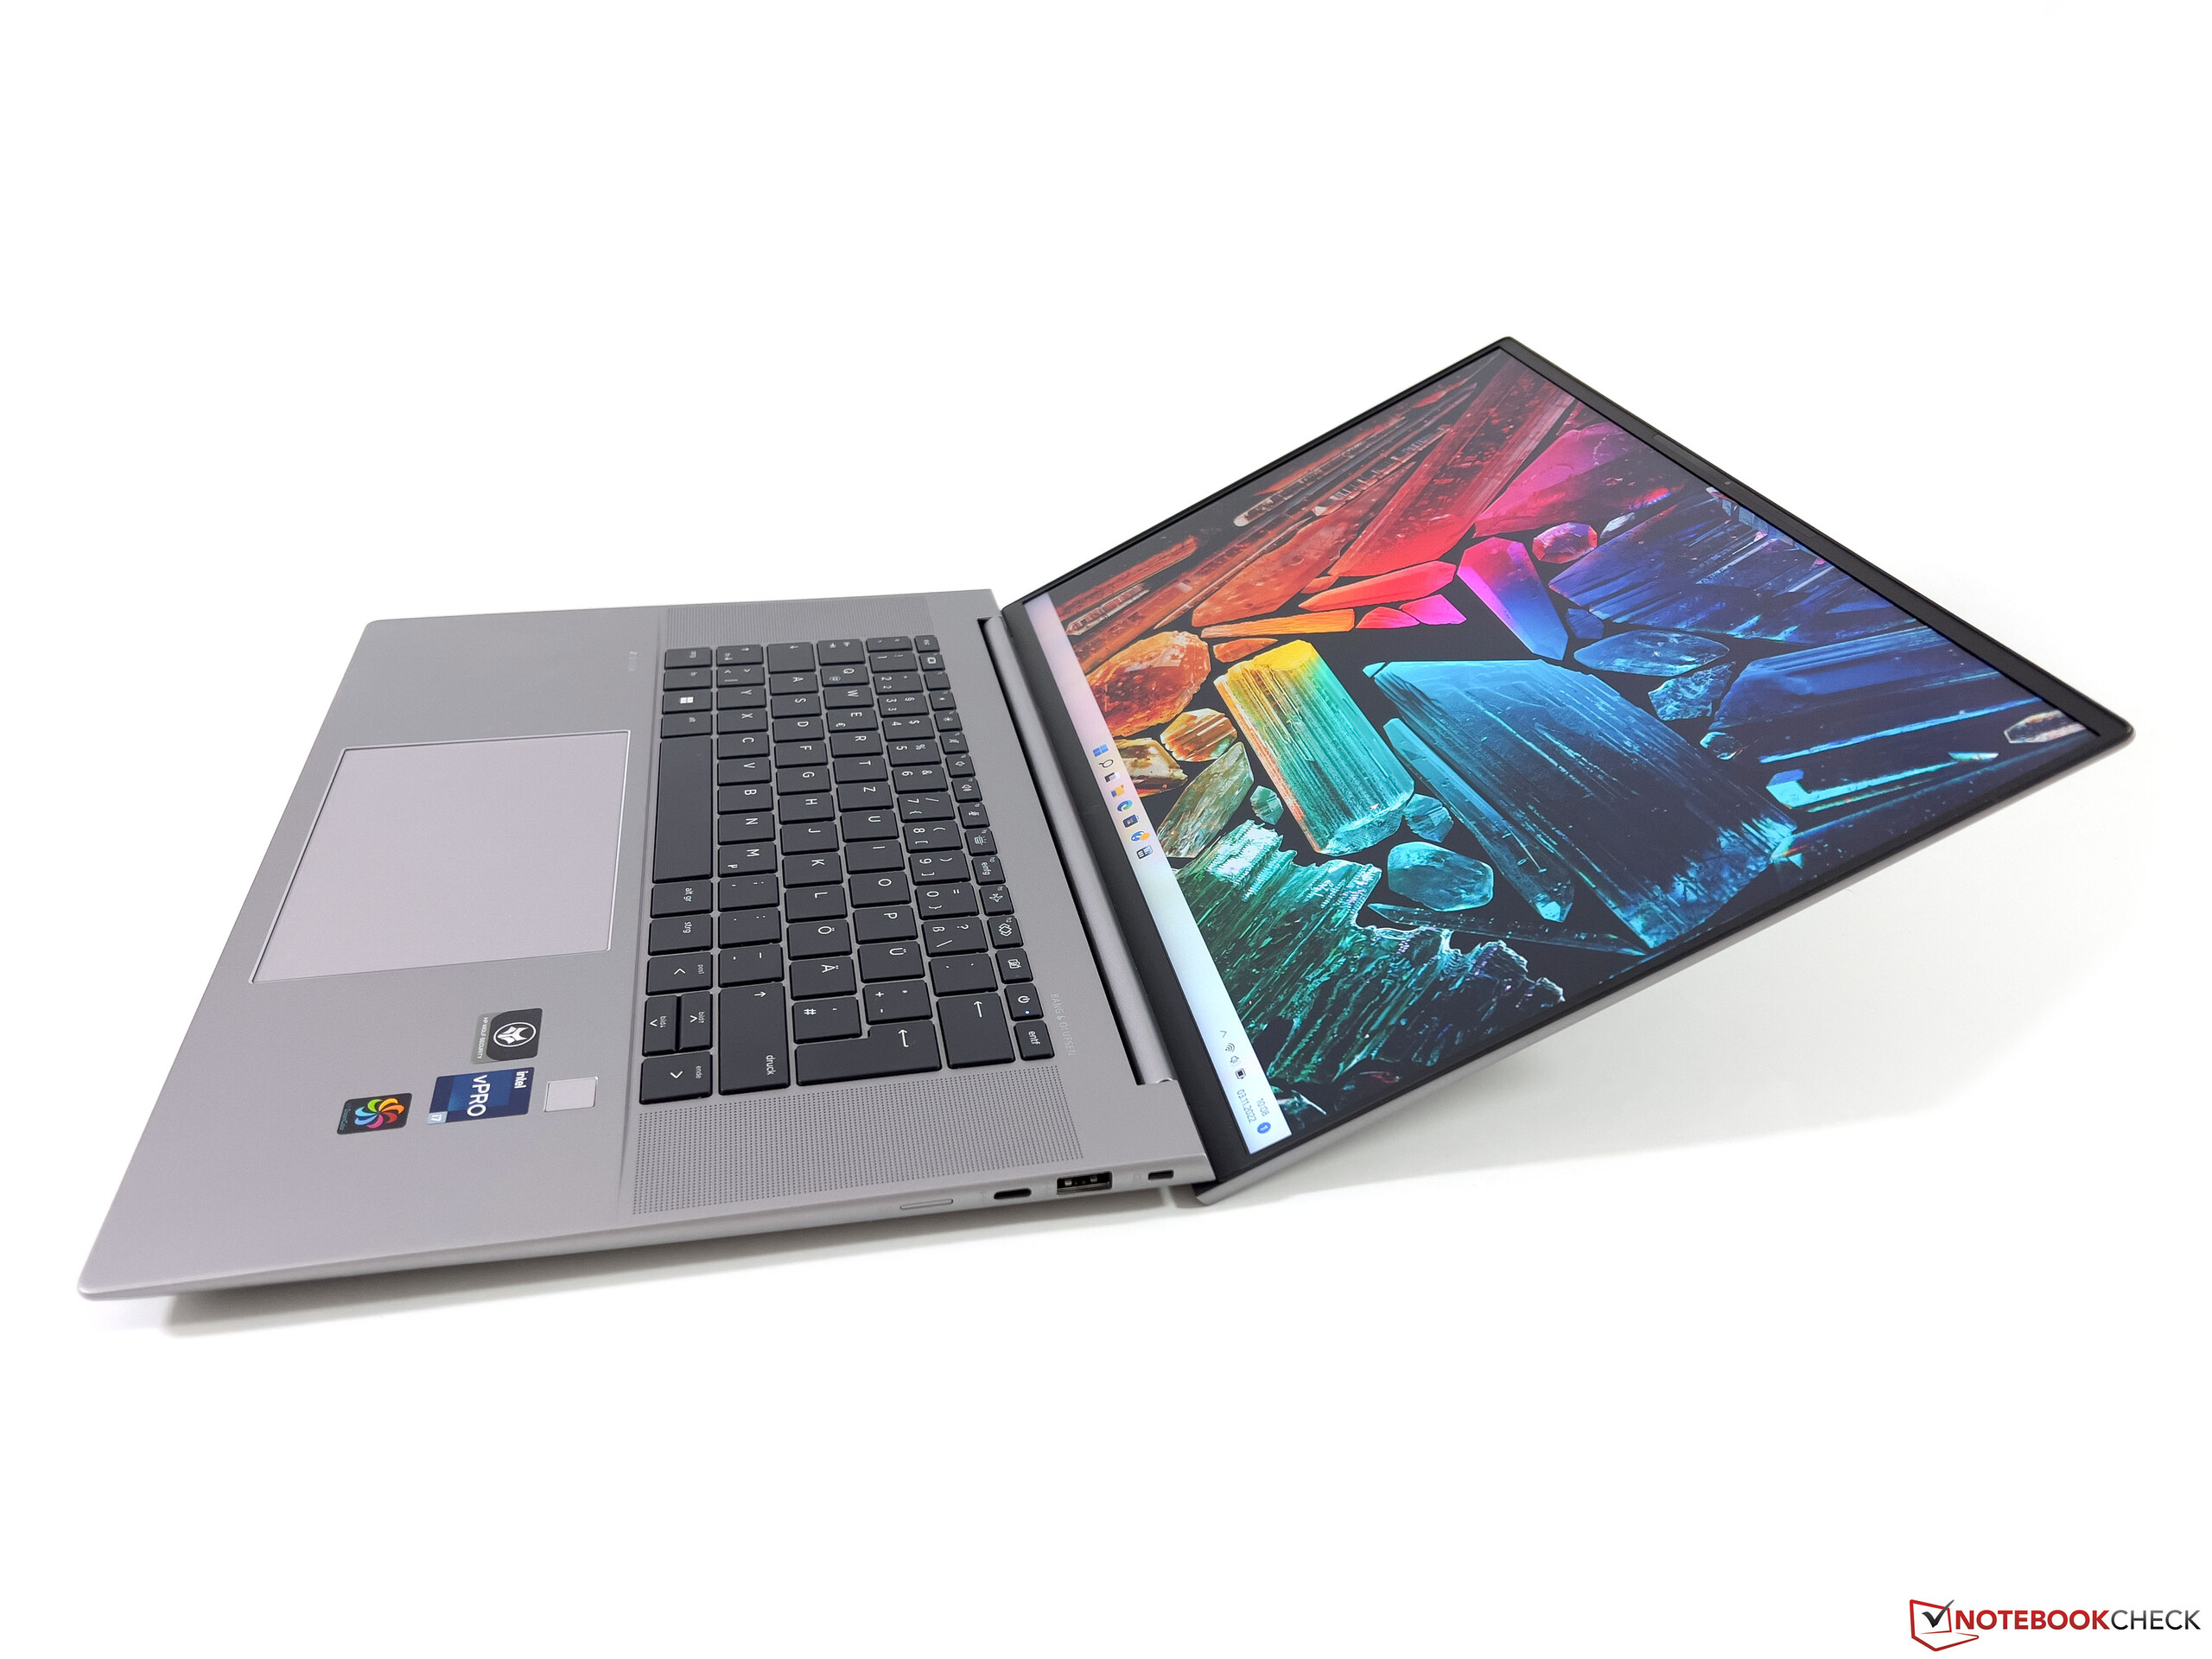
新的ZBook Studio 16 G9提供了几个主要的升级,因为惠普已经从旧的G8模型的15.6英寸显示屏(16:9)切换到16:10外形尺寸的新的16英寸面板,并伴随着一个全新的外壳。提供了广泛的配置,特别是在显卡方面。我们的~3300美元的昂贵评测设备装备良好,因为目前的酷睿i7-12800H处理器由32GB内存和1TB PCIe 4.0 SSD支持。一块120赫兹的4K DreamColor面板也开始发挥作用,而苛刻的图形处理则由专业的 Nvidia RTX A2000(可与 GeForce RTX 3050 Ti).
潜在的竞争对手比较
Rating | Date | Model | Weight | Height | Size | Resolution | Price |
|---|---|---|---|---|---|---|---|
| 90.1 % v7 (old) | 11 / 2022 | HP ZBook Studio 16 G9 62U04EA i7-12800H, RTX A2000 Laptop GPU | 1.8 kg | 19 mm | 16.00" | 3840x2400 | |
| 89.3 % v7 (old) | 02 / 2022 | Lenovo ThinkPad P1 G4-20Y4Z9DVUS i7-11800H, T1200 Laptop GPU | 1.8 kg | 17.7 mm | 16.00" | 2560x1600 | |
| 92.5 % v7 (old) | 11 / 2021 | Apple MacBook Pro 16 2021 M1 Max M1 Max, M1 Max 32-Core GPU | 2.2 kg | 16.8 mm | 16.20" | 3456x2234 | |
| 88.3 % v7 (old) | 10 / 2021 | Dell Precision 5000 5560 i7-11850H, RTX A2000 Laptop GPU | 2 kg | 18 mm | 15.60" | 3840x2400 | |
| 87.8 % v7 (old) | 08 / 2021 | HP ZBook Studio 15 G8 i9-11950H, GeForce RTX 3070 Laptop GPU | 1.9 kg | 18 mm | 15.60" | 3840x2160 |
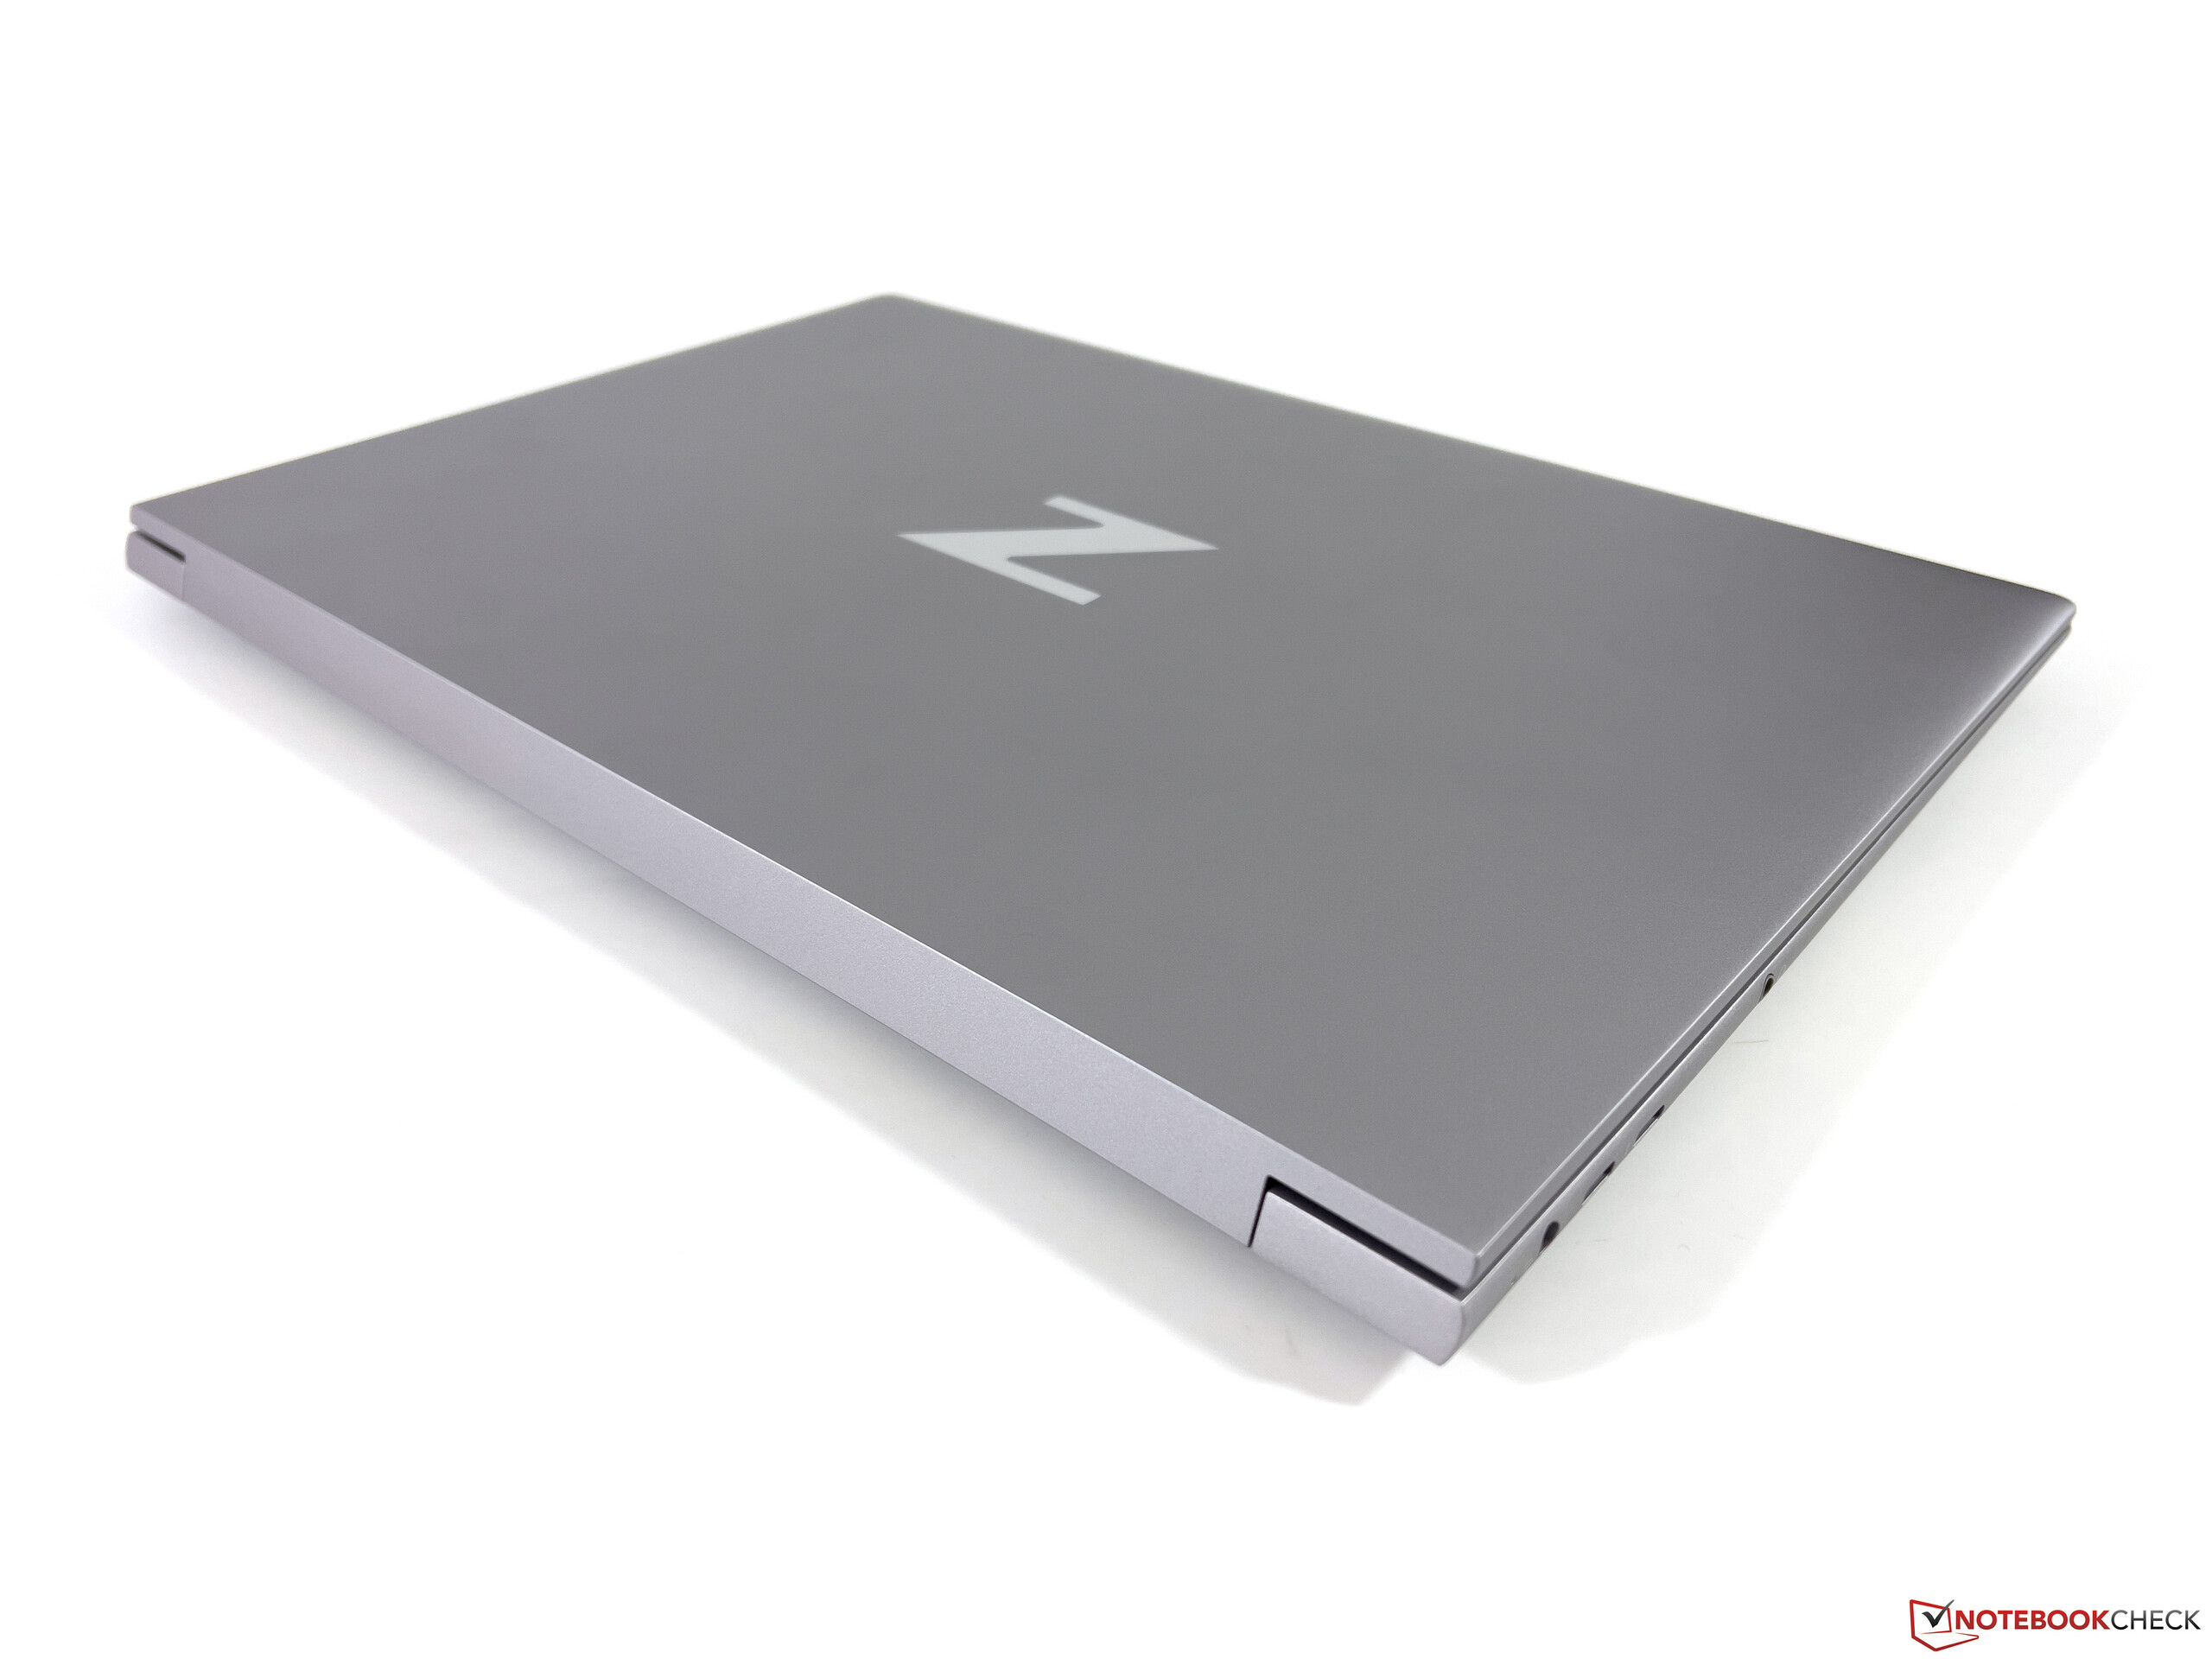
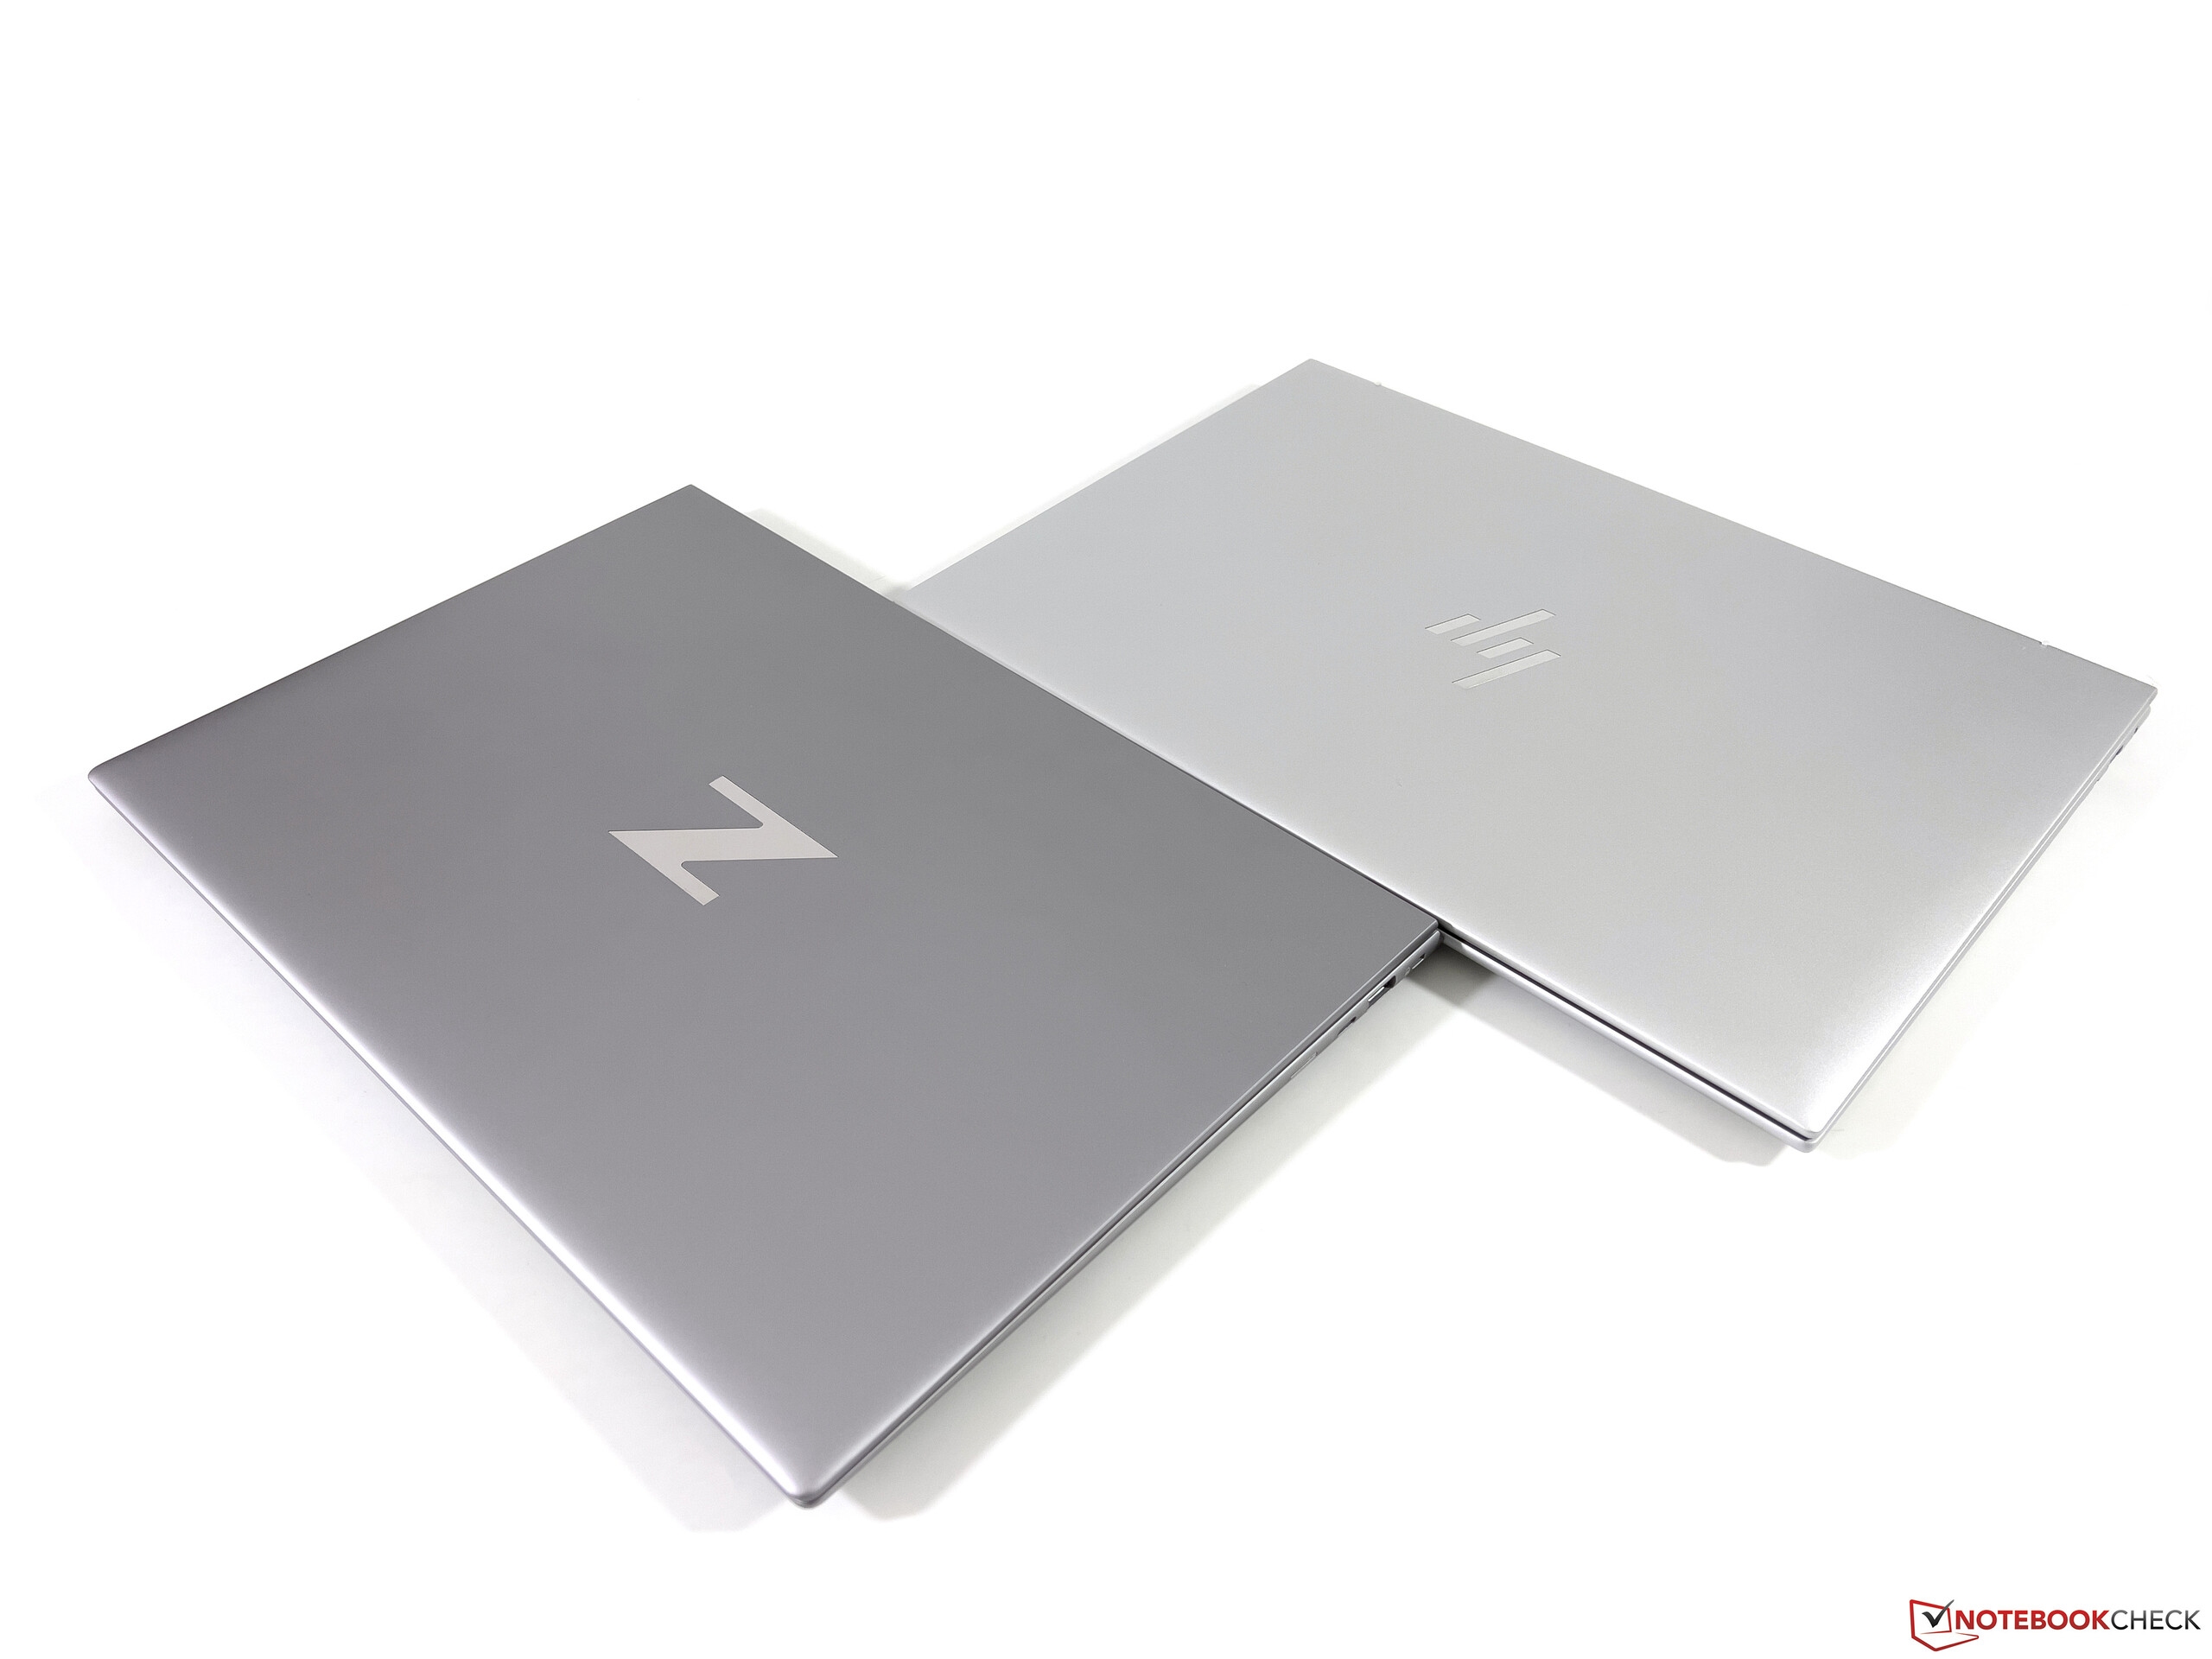
外壳 - ZBook的铝制外壳
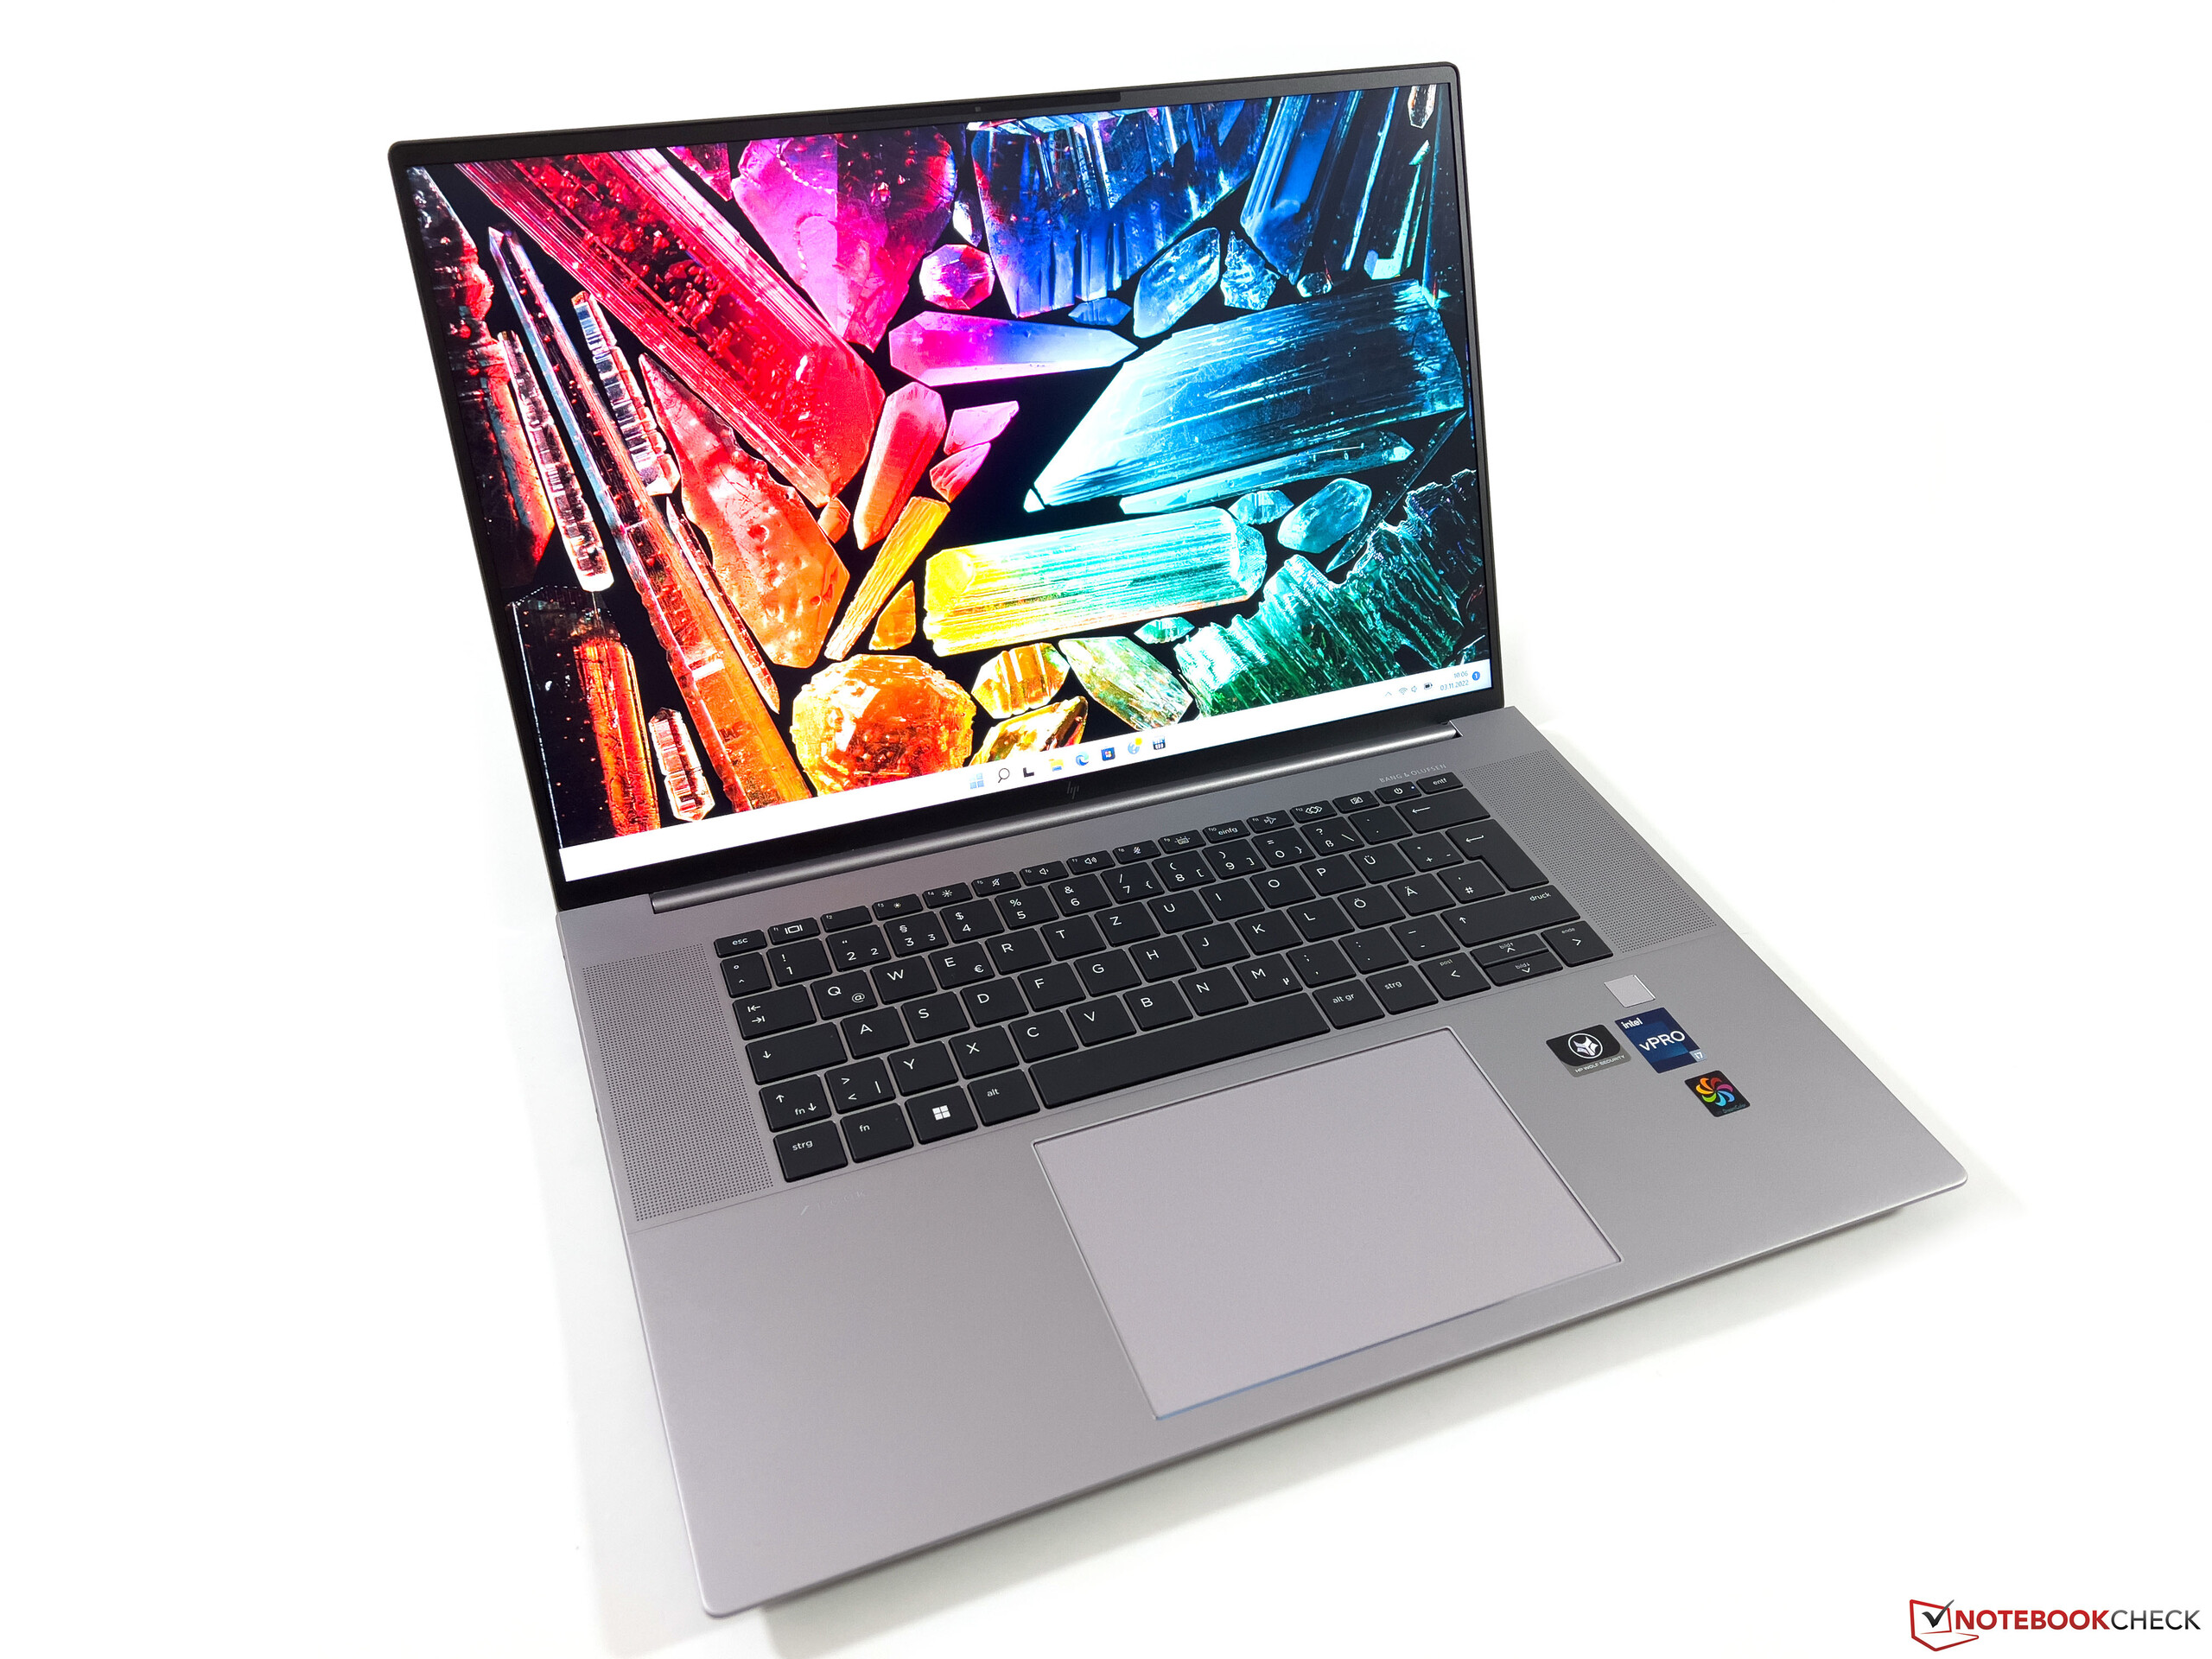
尽管不是很明显,但惠普为新的ZBook Studio 16 G9使用了一个全新的外壳。背面的边缘仍然是有棱有角的,但外壳的其余部分现在更圆一些。与普通EliteBook机型(银色)相比,该机型采用了更深的灰色,这在下面的对比图中可以清楚地看到。只要你打开屏幕面板,你就会立即注意到狭窄的屏幕边缘,这看起来非常现代。
从质量上看,这个金属外壳无可指责,因为基本单元和相对较薄的屏幕盖子都非常稳定。因此,我们无法引出任何吱吱作响的声音或图像错误。屏幕的铰链也调整得非常好,在改变打开角度时,只有极少的摇晃,其最大角度约为150度。
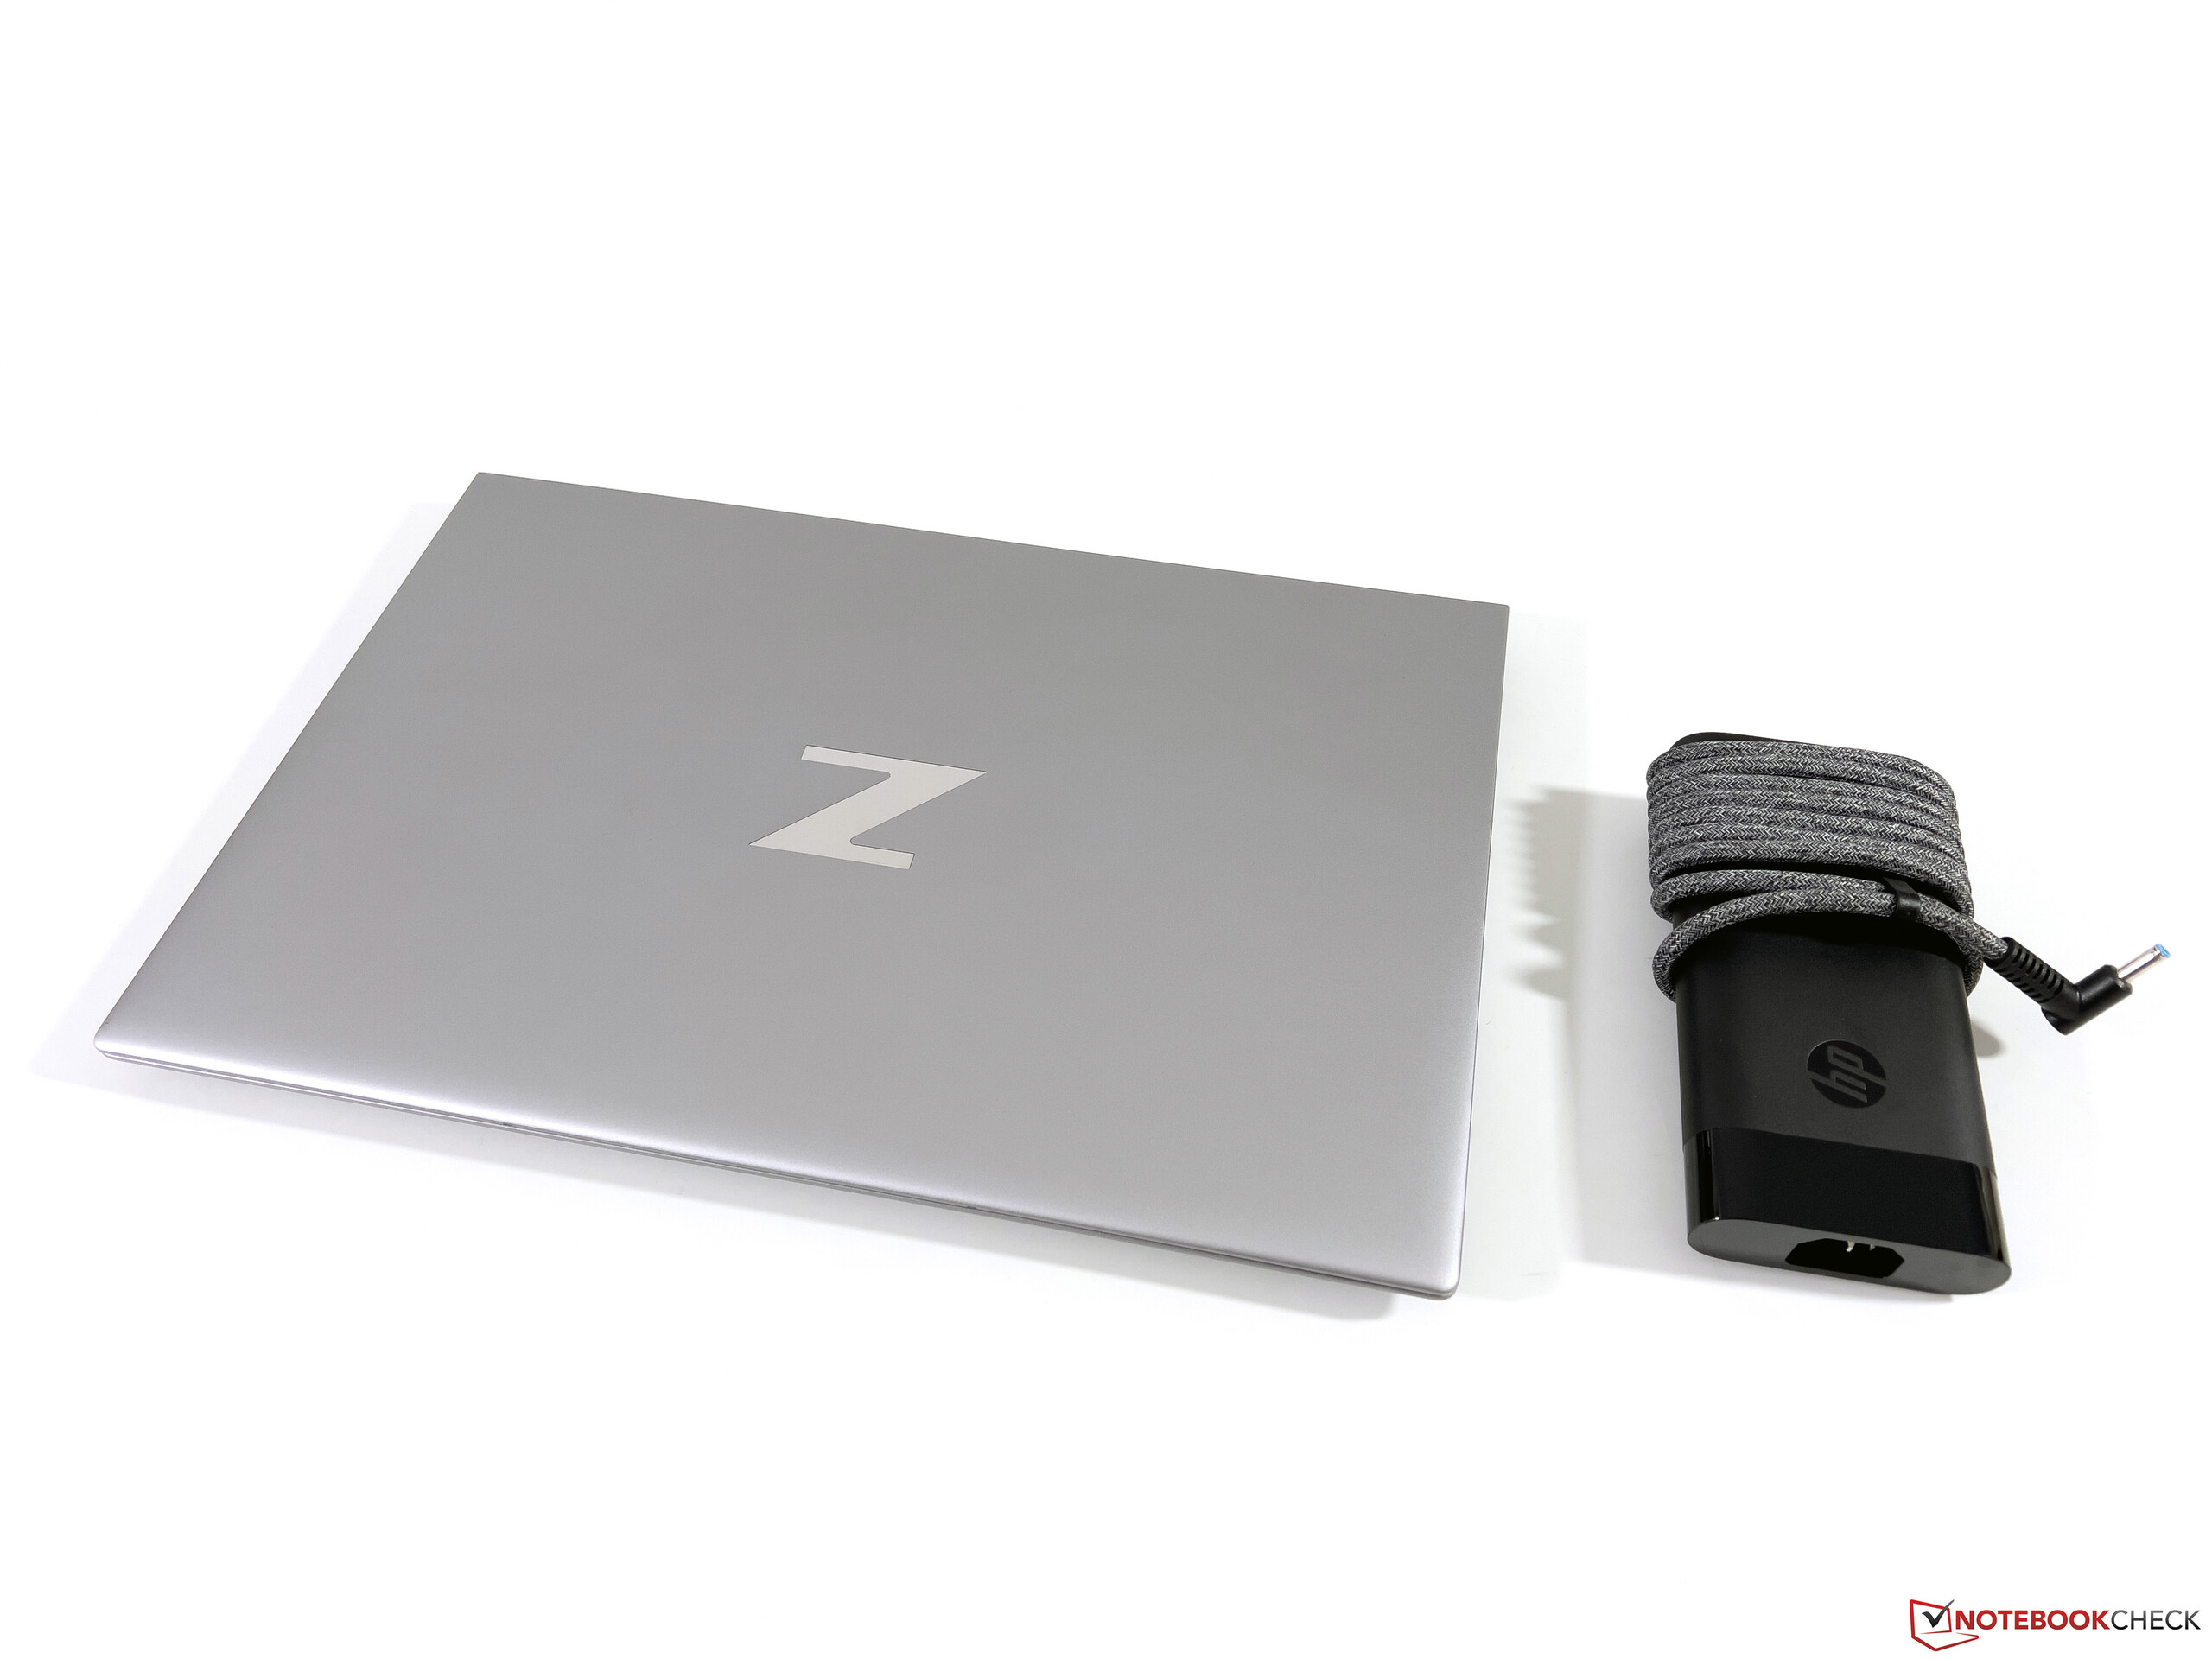
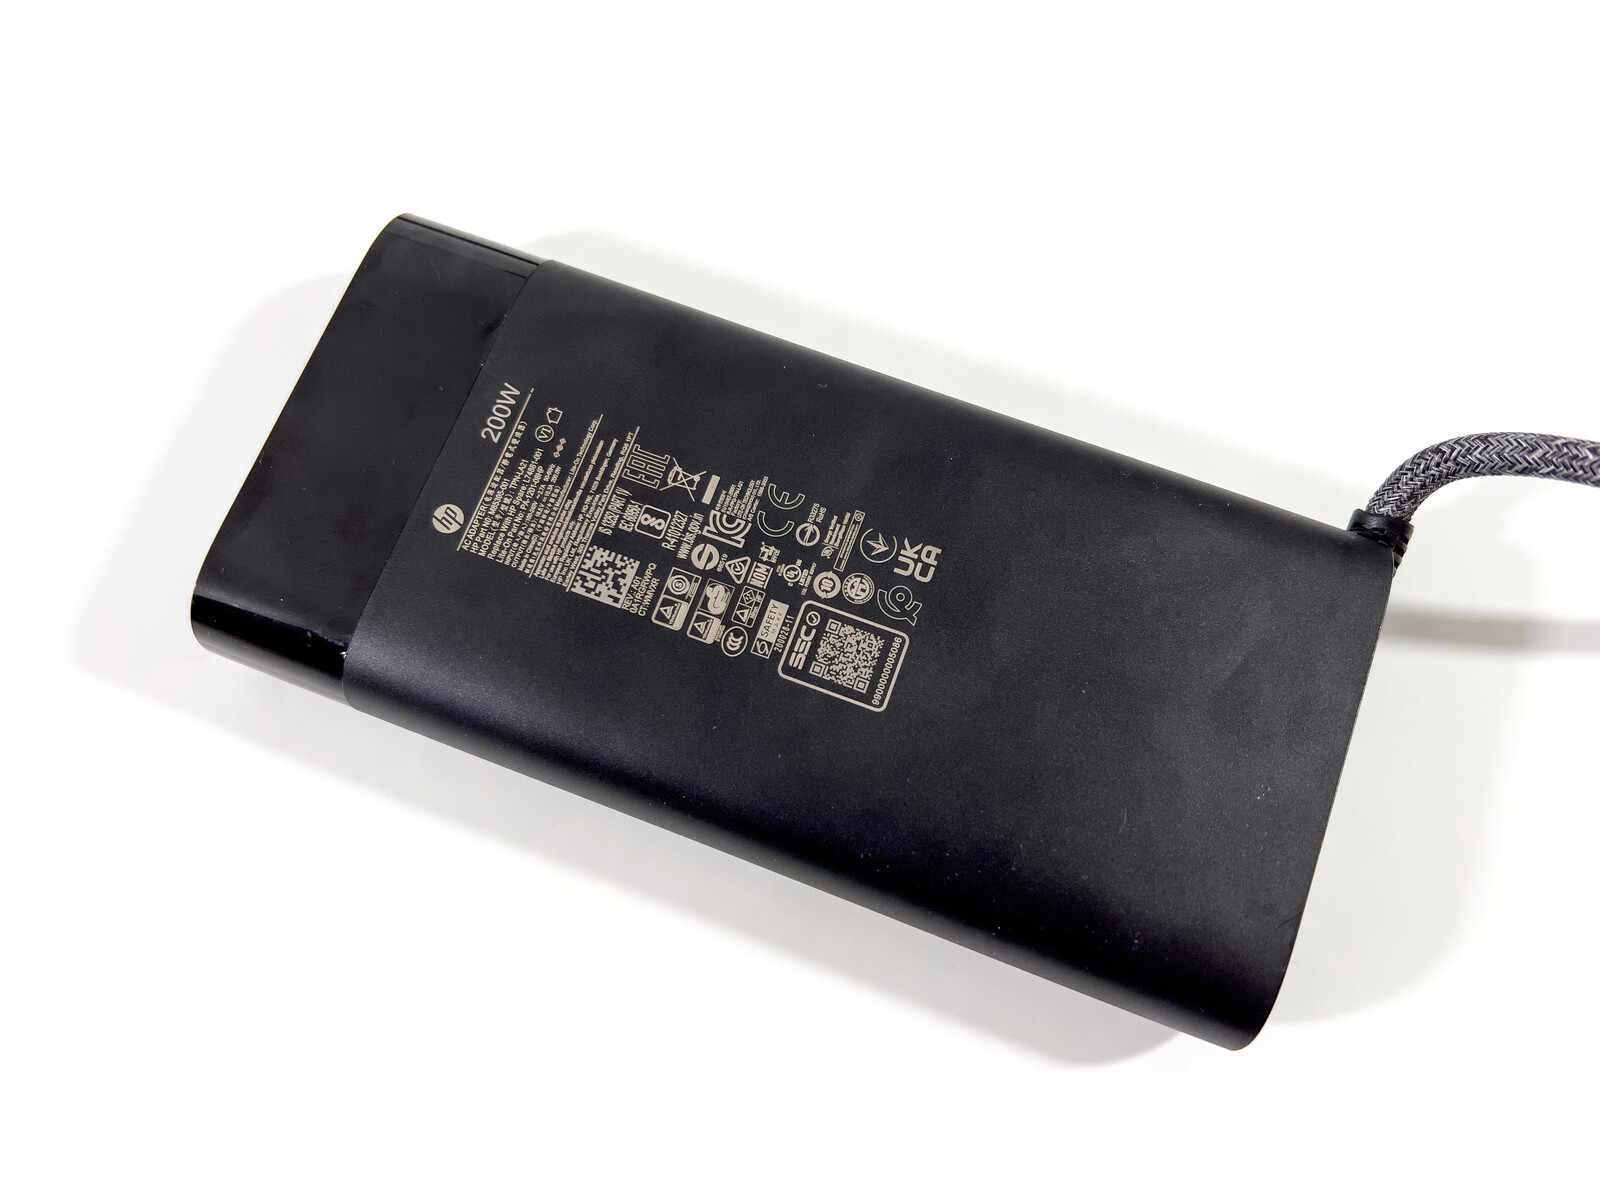
与老款相比ZBook Studio 15 G8相比,新的16英寸机型变得略微更深,略微更宽。另一方面,新的ZBook是最轻的机型之一,在这种配置下略高于1.8公斤。200瓦的电源适配器又增加了613克。
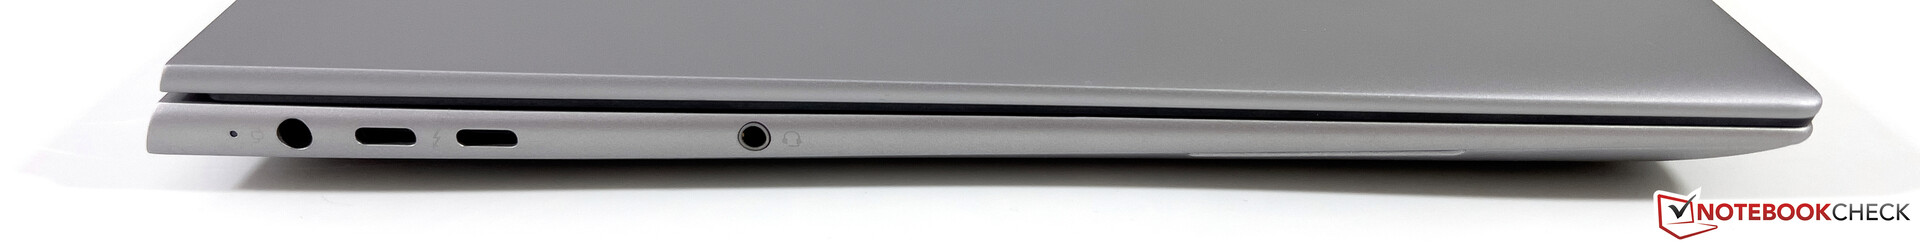
装备--2个霹雳火4
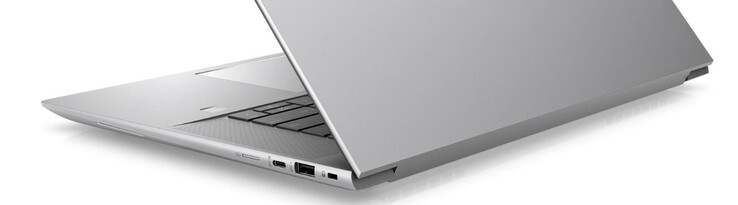
端口有一些小变化,因为DisplayPort不得不为另一个USB-C端口让路。与上一代产品相比,布局也有变化。前代产品ZBook不能通过USB-C充电的事实让人恼火。
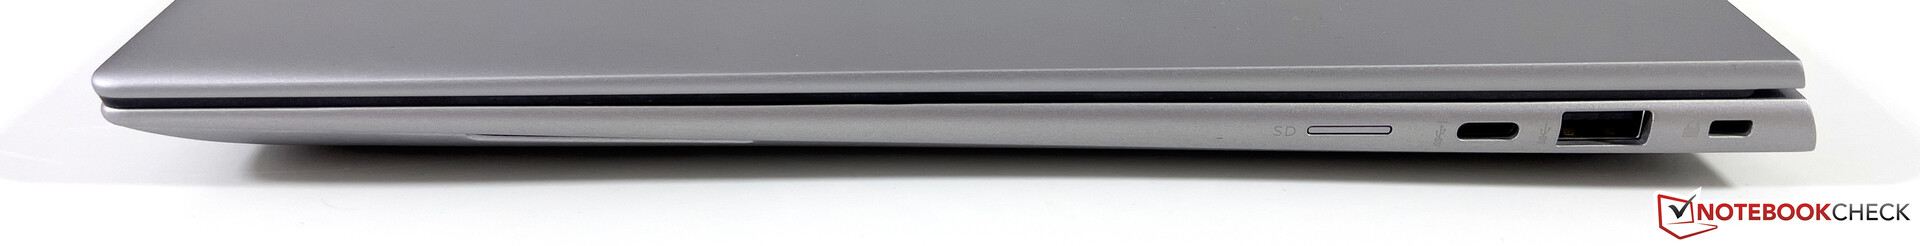
SD卡阅读器
惠普已将录音室15 G8的全面的SD读卡器换成了一个完全接受microSD卡的读卡器。读卡器有一个弹簧机制,取出插入的卡可能有点麻烦。就速度而言,读卡器仍处于同一水平,约为80MB/s,但竞争对手更快。
| SD Card Reader | |
| average JPG Copy Test (av. of 3 runs) | |
| Lenovo ThinkPad P1 G4-20Y4Z9DVUS (Angelbird AV Pro V60) | |
| Dell Precision 5000 5560 (AV Pro V60) | |
| Average of class Workstation (49.6 - 681, n=14, last 2 years) | |
| HP ZBook Studio 15 G8 (AV Pro V60) | |
| HP ZBook Studio 16 G9 62U04EA (Angelbird AV PRO V60) | |
| maximum AS SSD Seq Read Test (1GB) | |
| Average of class Workstation (87.6 - 1455, n=14, last 2 years) | |
| Dell Precision 5000 5560 (AV Pro V60) | |
| Lenovo ThinkPad P1 G4-20Y4Z9DVUS (Angelbird AV Pro V60) | |
| HP ZBook Studio 15 G8 (AV Pro V60) | |
| HP ZBook Studio 16 G9 62U04EA (Angelbird AV PRO V60) | |
沟通
英特尔的现代AX211模块支持当前的Wi-Fi 6E标准,我们能够毫无问题地连接到华硕的参考路由器的6GHz网络。传输速率非常好,没有发现信号质量的问题。ZBook Studio 16 G9中没有WWAN模块(LTE或5G)。
| Networking | |
| HP ZBook Studio 16 G9 62U04EA | |
| iperf3 receive AXE11000 6GHz | |
| iperf3 transmit AXE11000 6GHz | |
| Lenovo ThinkPad P1 G4-20Y4Z9DVUS | |
| iperf3 receive AX12 | |
| iperf3 transmit AX12 | |
| Dell Precision 5000 5560 | |
| iperf3 receive AX12 | |
| iperf3 transmit AX12 | |
| Apple MacBook Pro 16 2021 M1 Pro | |
| iperf3 receive AXE11000 | |
| iperf3 transmit AXE11000 | |
| iperf3 receive AX12 | |
| iperf3 transmit AX12 | |
网络摄像头
关于网络摄像头,新的ZBook Studio令人失望,因为它只有一个720p的传感器供其使用。颜色还可以,但照片就是不怎么清晰和详细。


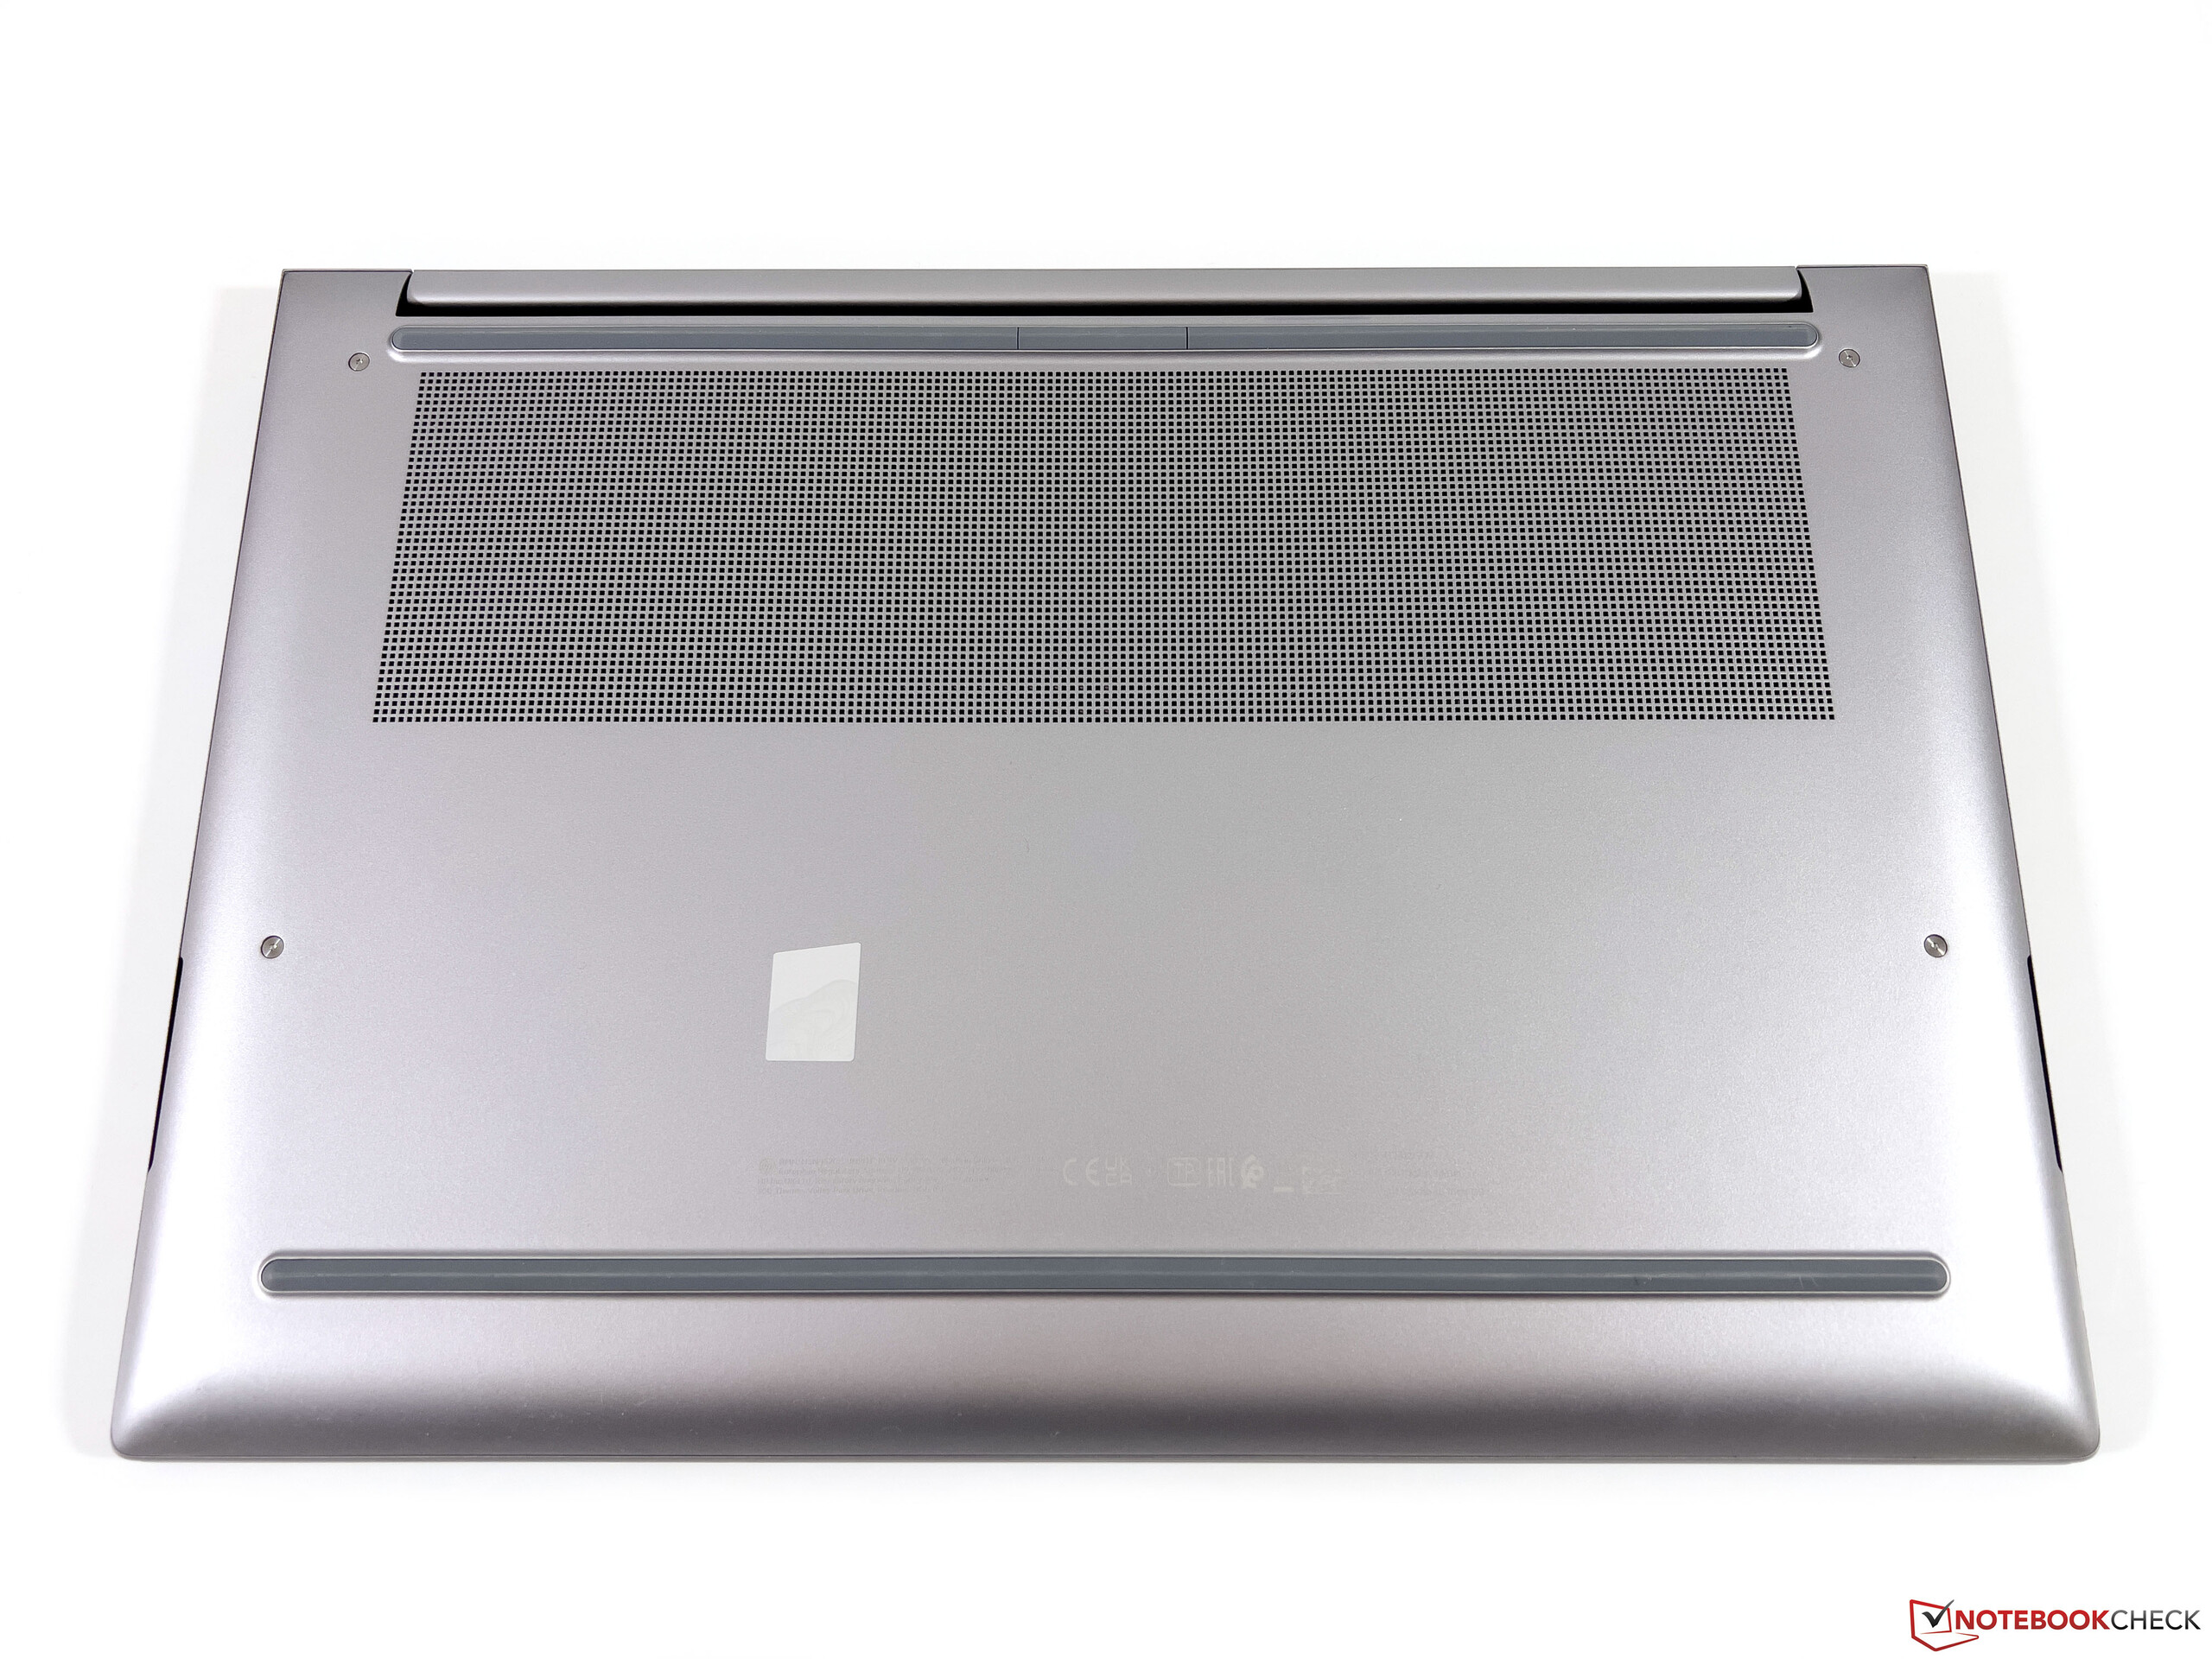
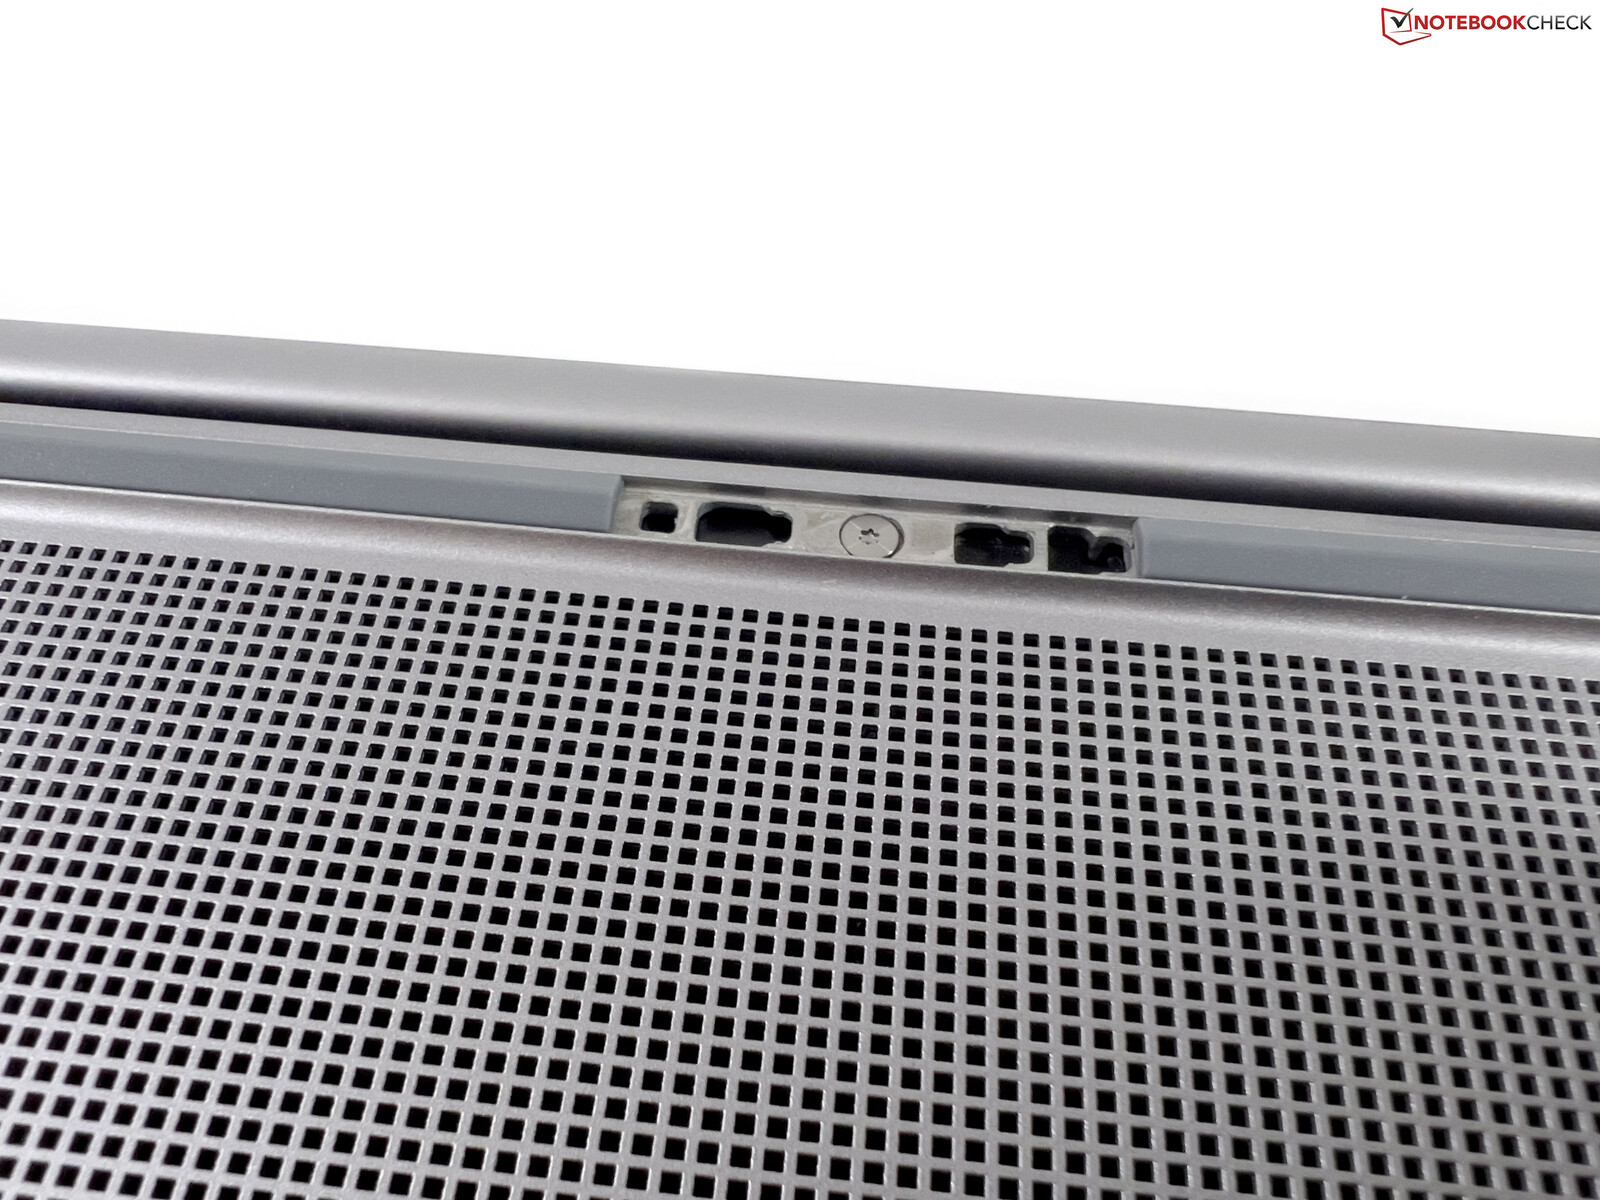
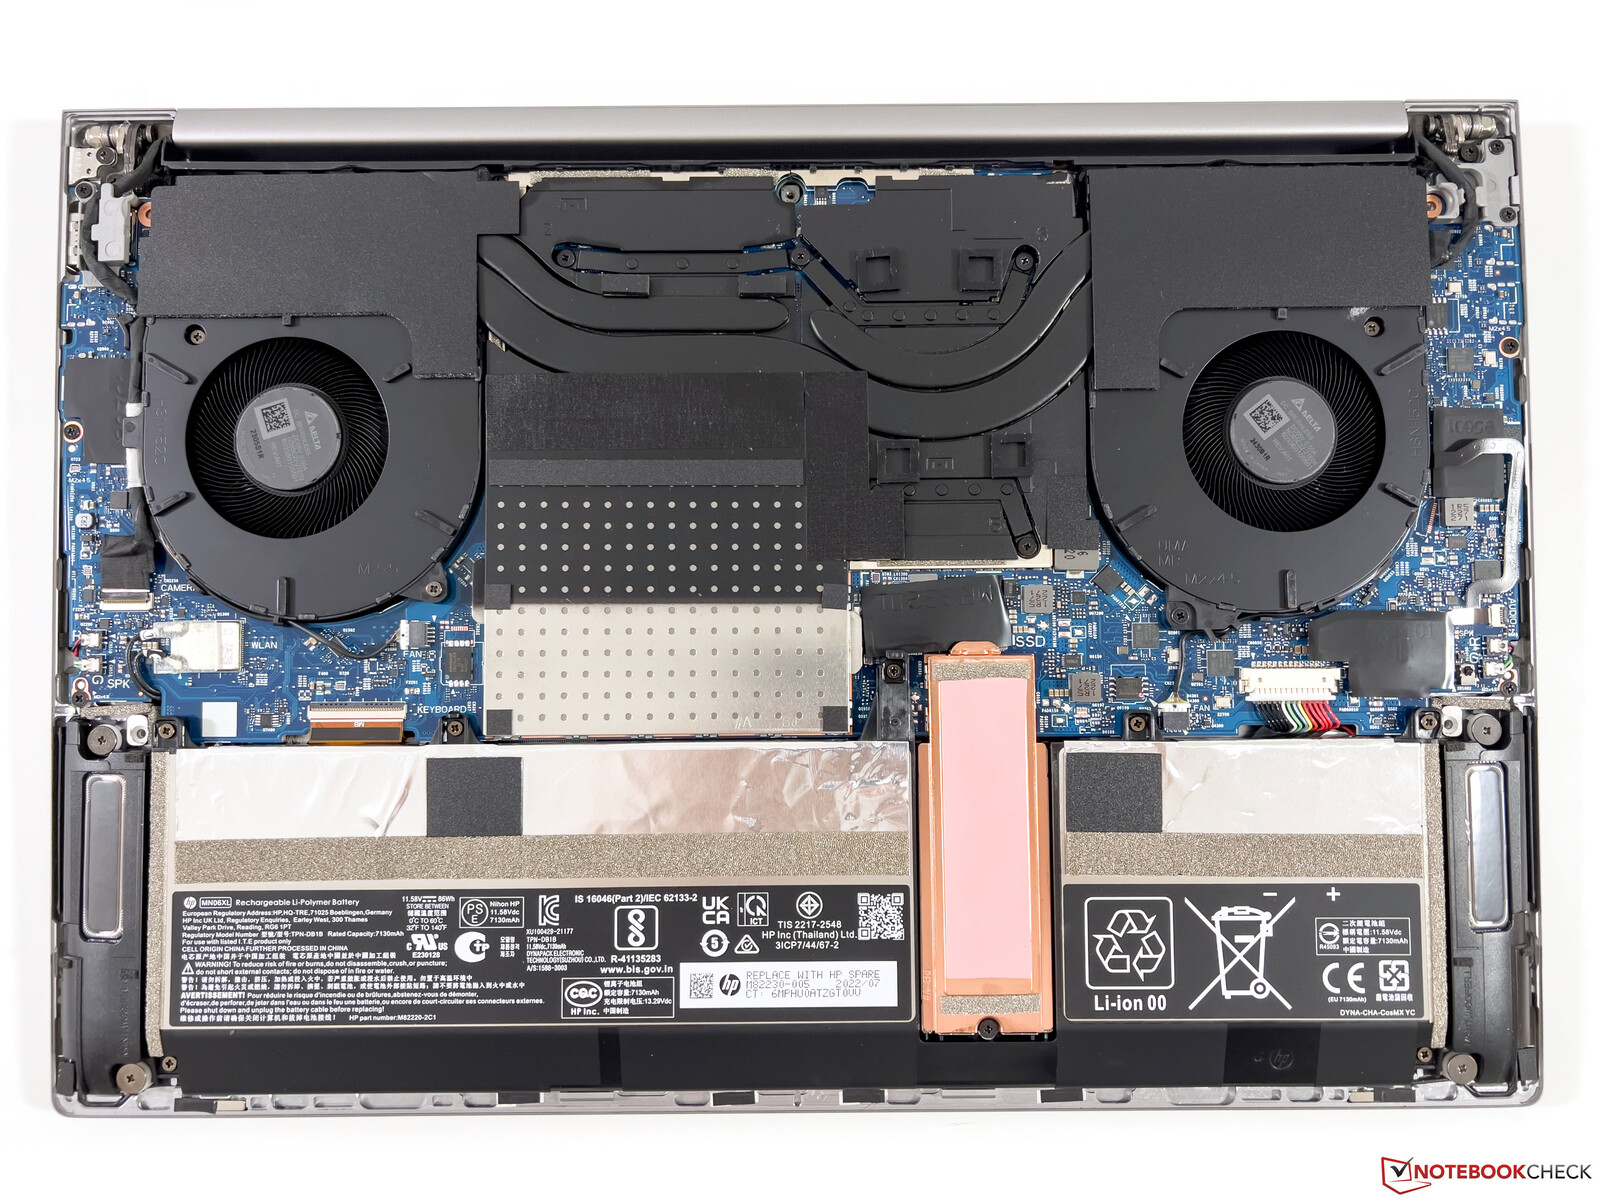
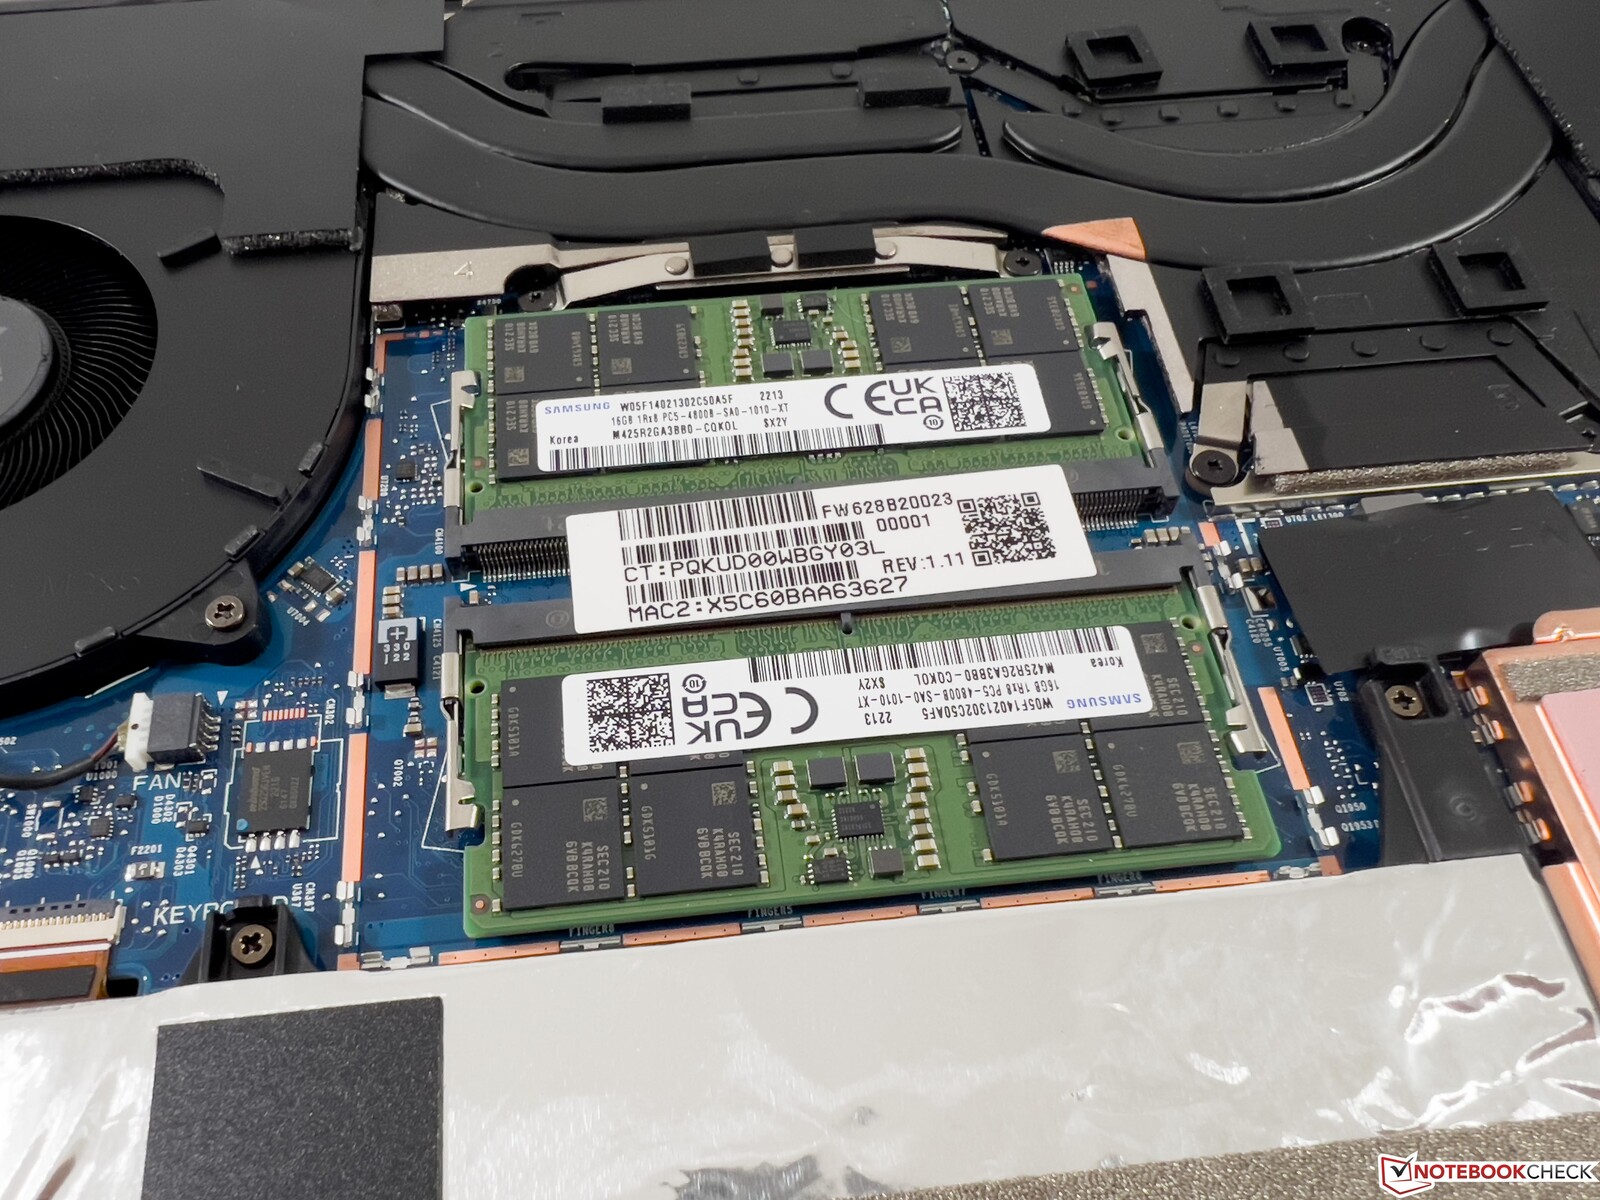
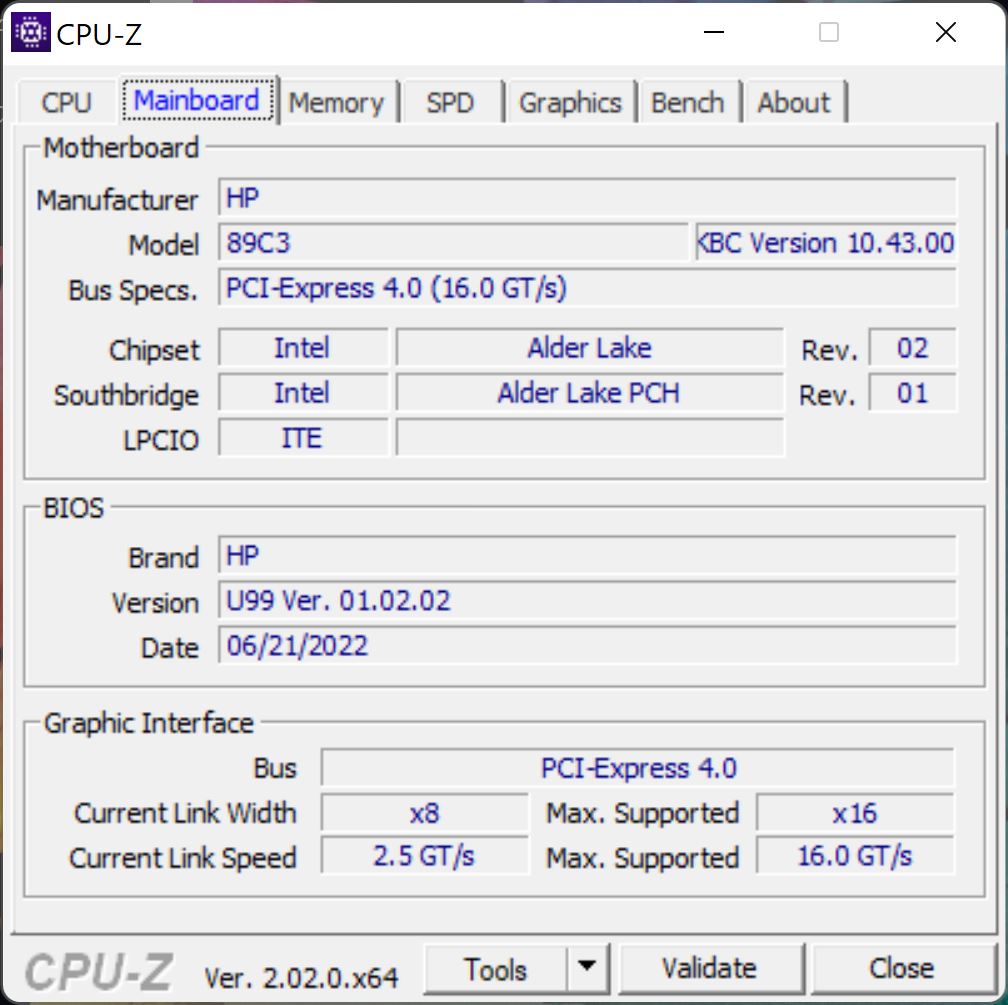
维护
维护选项有了一些改善,因为惠普在Studio 16 G9中重新引入了SO-DIMM内存托架,这就是为什么现在可以再次升级内存。这也适用于M.2-2280固态硬盘,而且风扇也可以清洗。然而,WLAN模块是焊接在主板上的。根据规格表,带有Vapor-Chamber冷却装置的型号也应该有两个SODIMM插槽。
访问组件是非常困难的,因为一个机箱螺丝位于后部橡胶脚的下面。在中间,橡胶脚可以用一点压力取下,但材料非常硬,很快就会发生变形。这个小部件不太可能在几次拆卸中毫发无损。
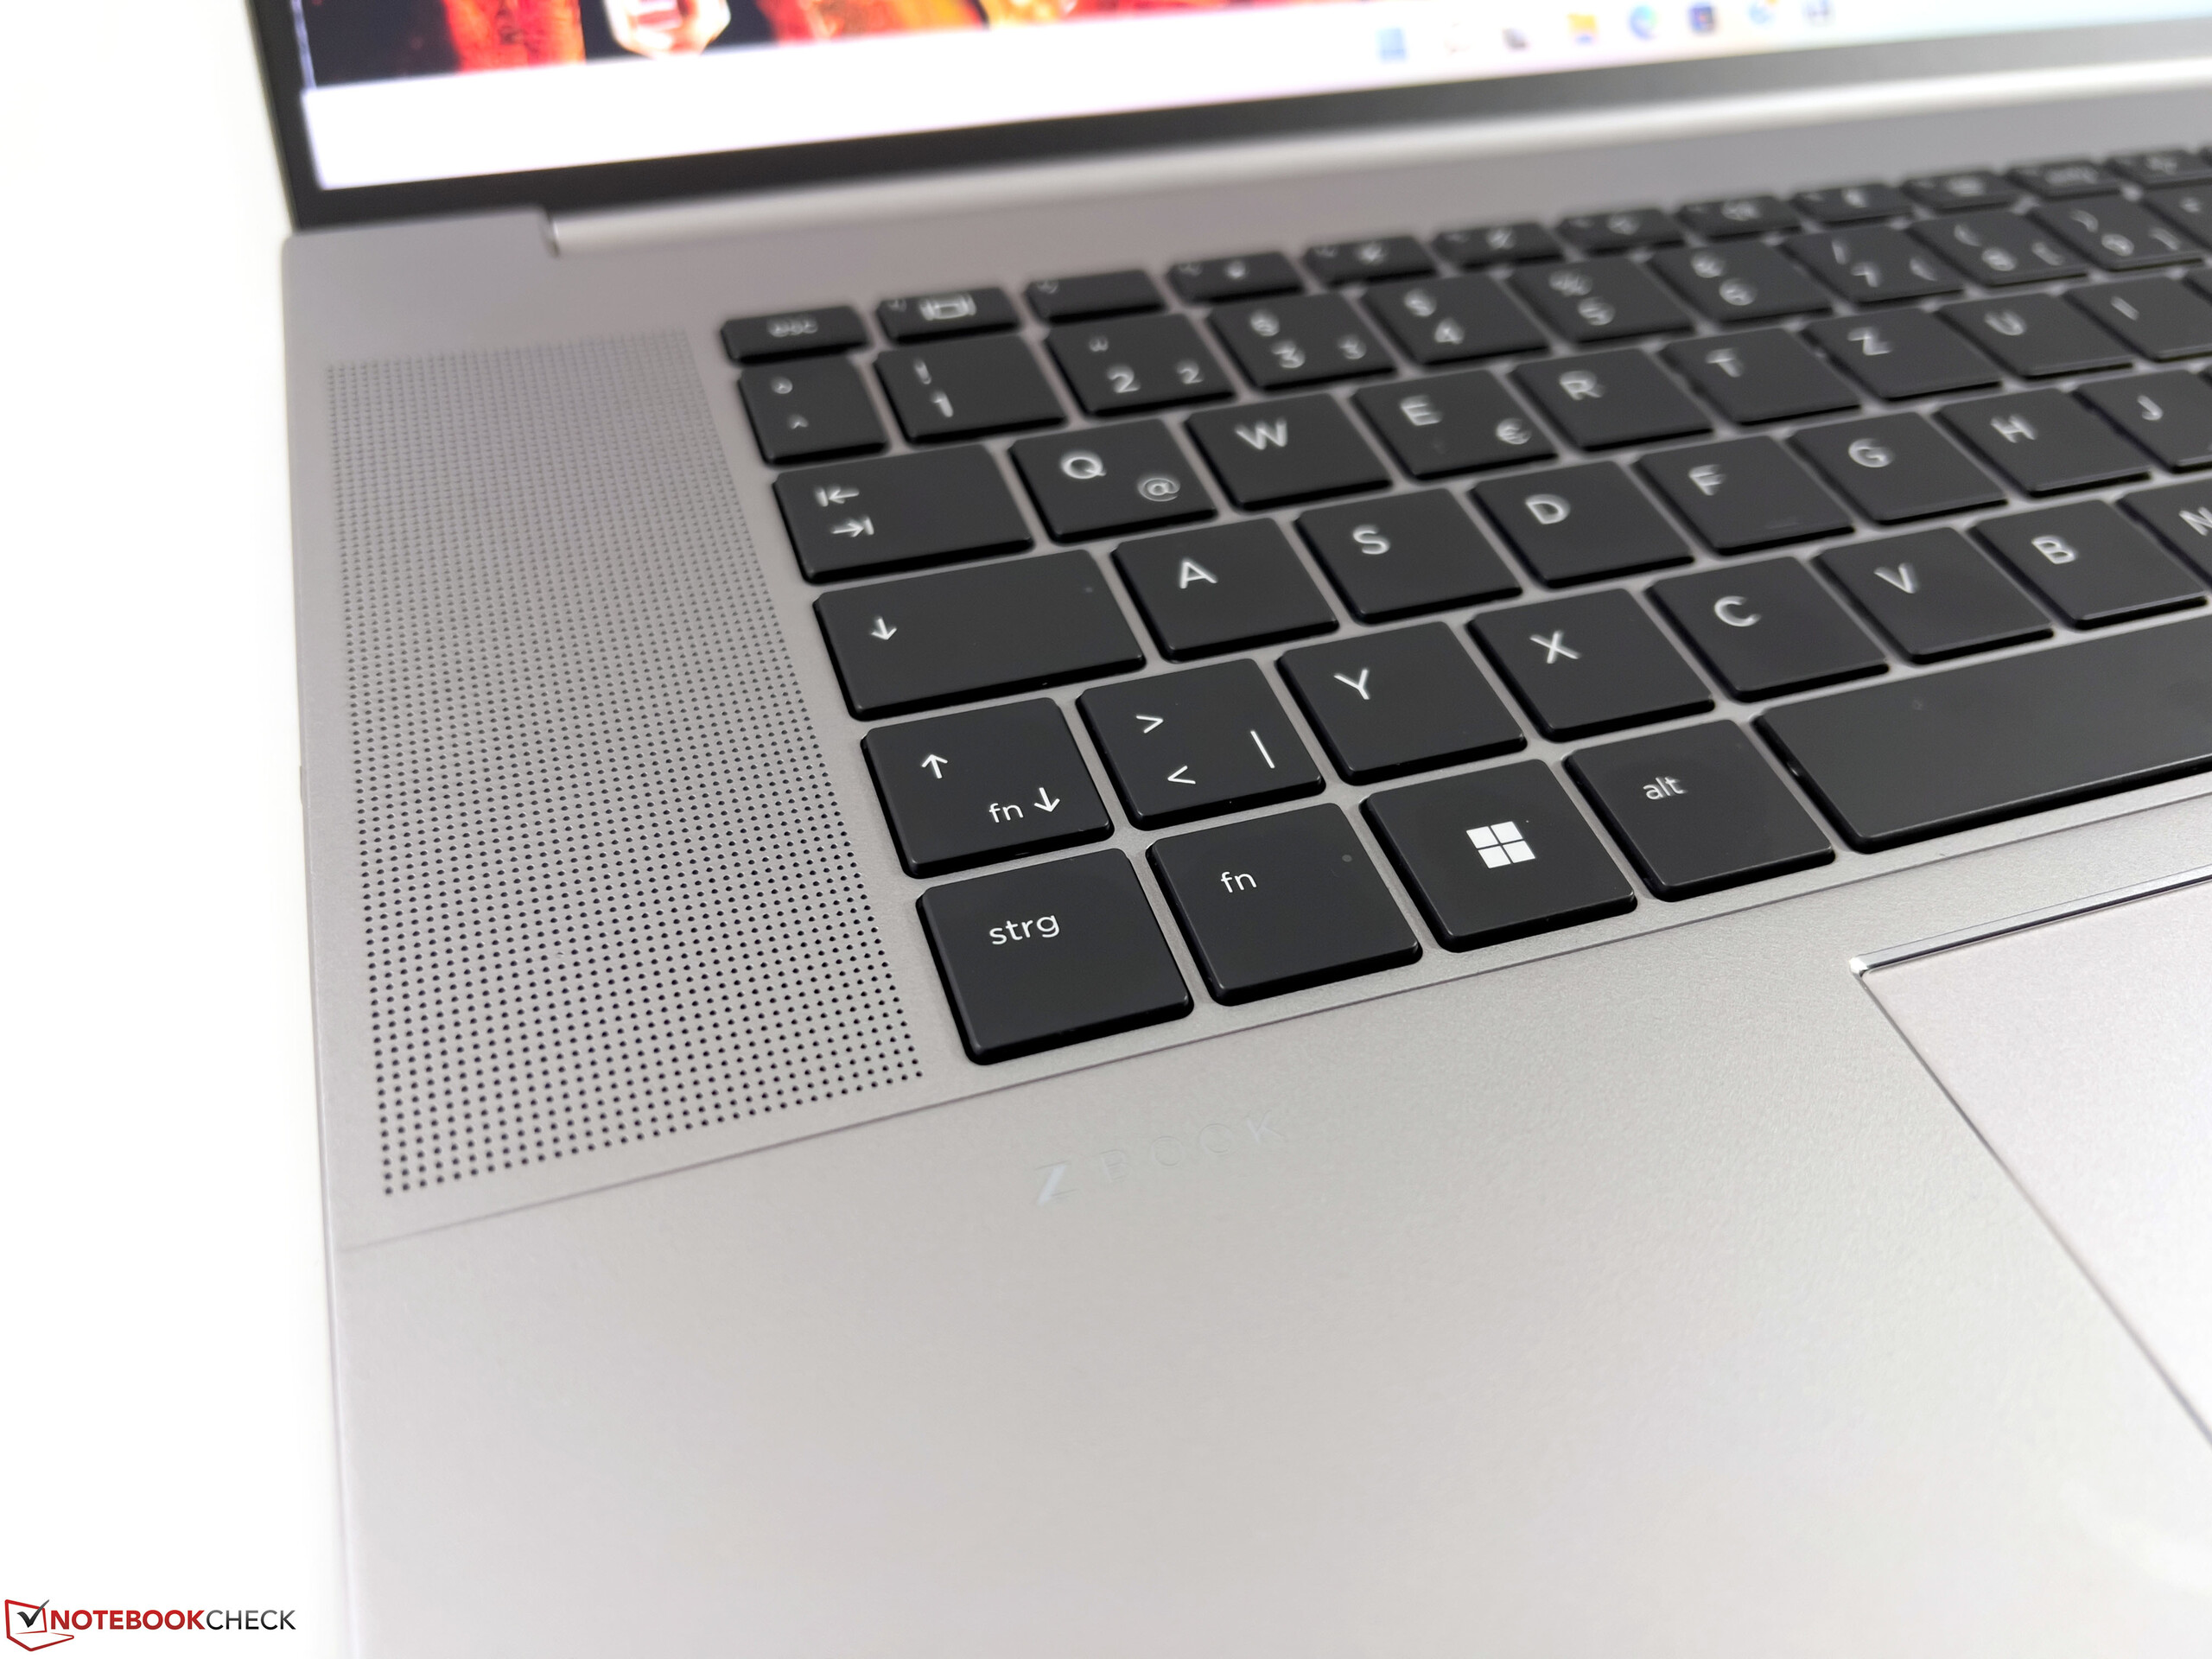
输入设备 - 更小、更弱的键盘
键盘
与旧款相比,惠普现在在右侧安装了一个更紧凑的键盘,没有附加键。实际上,这里有足够的空间安装带有数字键盘的全键盘(比如在ZBook Firefly 16 G9),但这个空间被用于扬声器。因此,这也意味着不再有专用的上一页和下一页功能键。总的来说,键盘已经更多地移向基本单元内的屏幕。
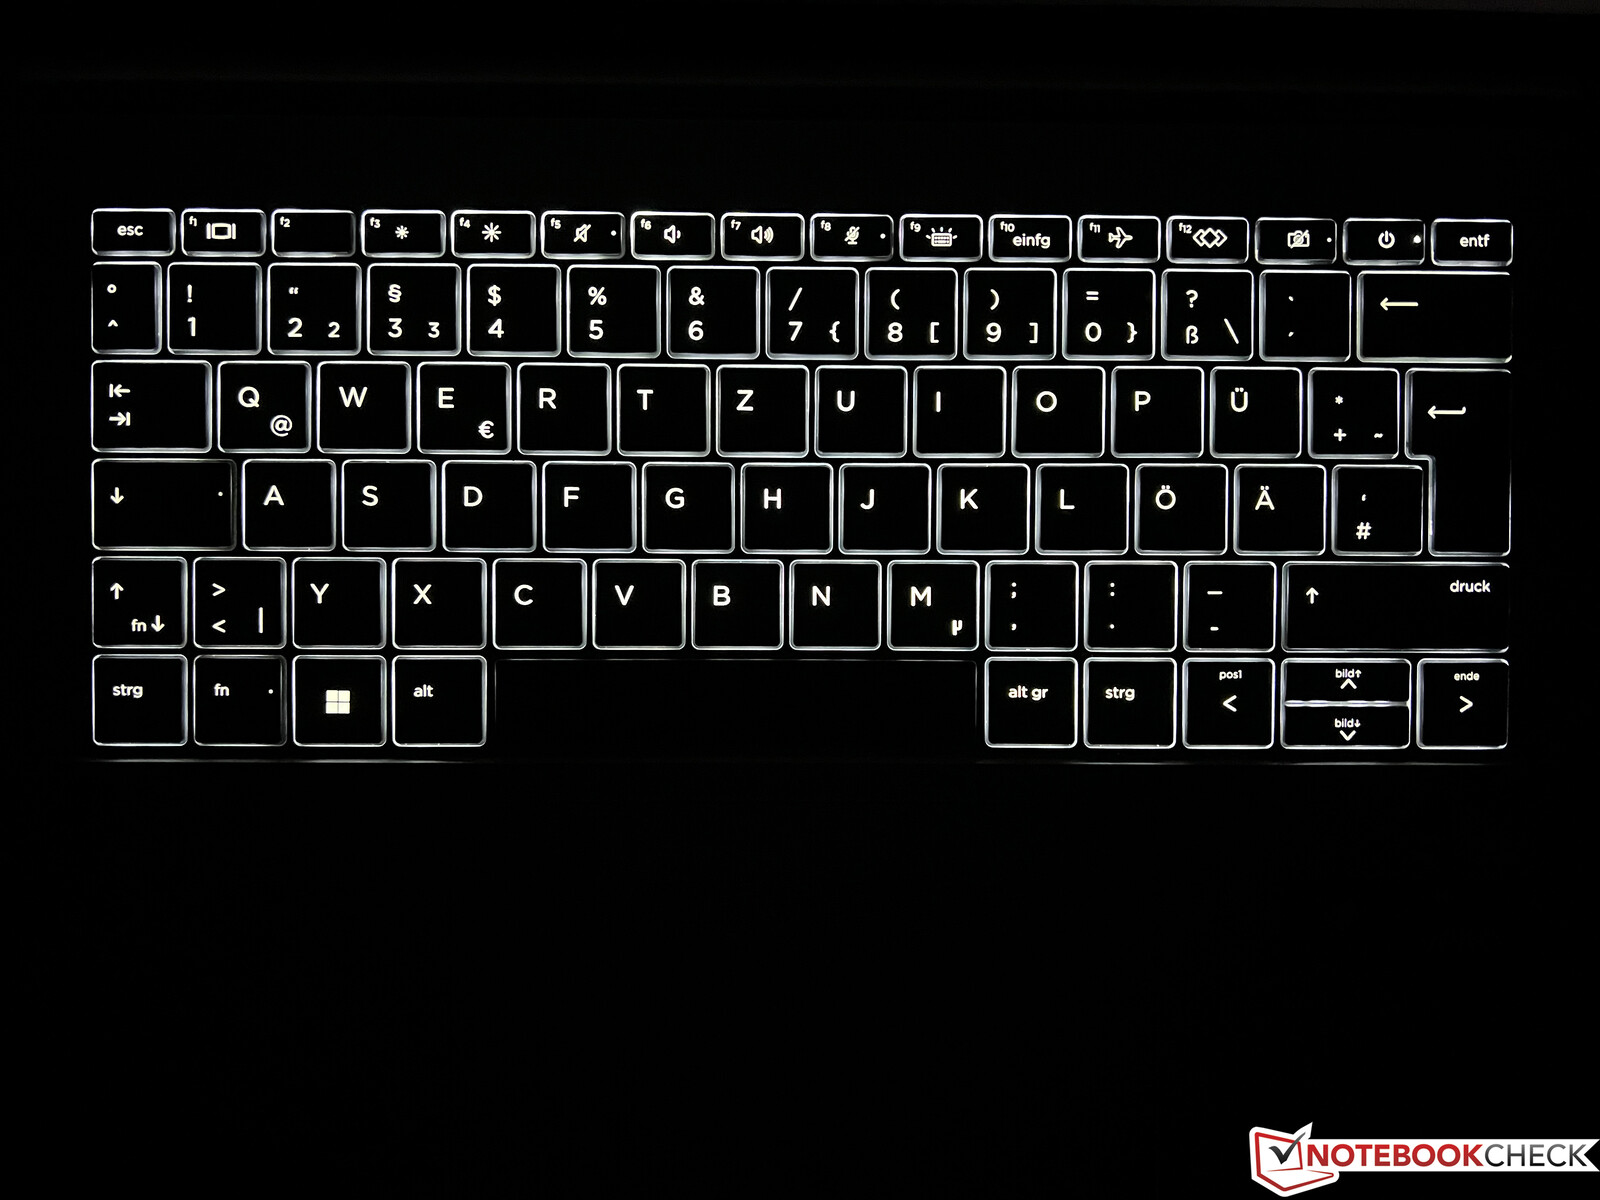
键盘有背光灯,而且是防水的,但机械结构并不完全令人信服。按键略显佝偻,总体上不像ZBook Firefly 16 G9(或相同结构的EliteBook 865 G9)那样好。与之相比前辈,它也是一个轻微的退步。
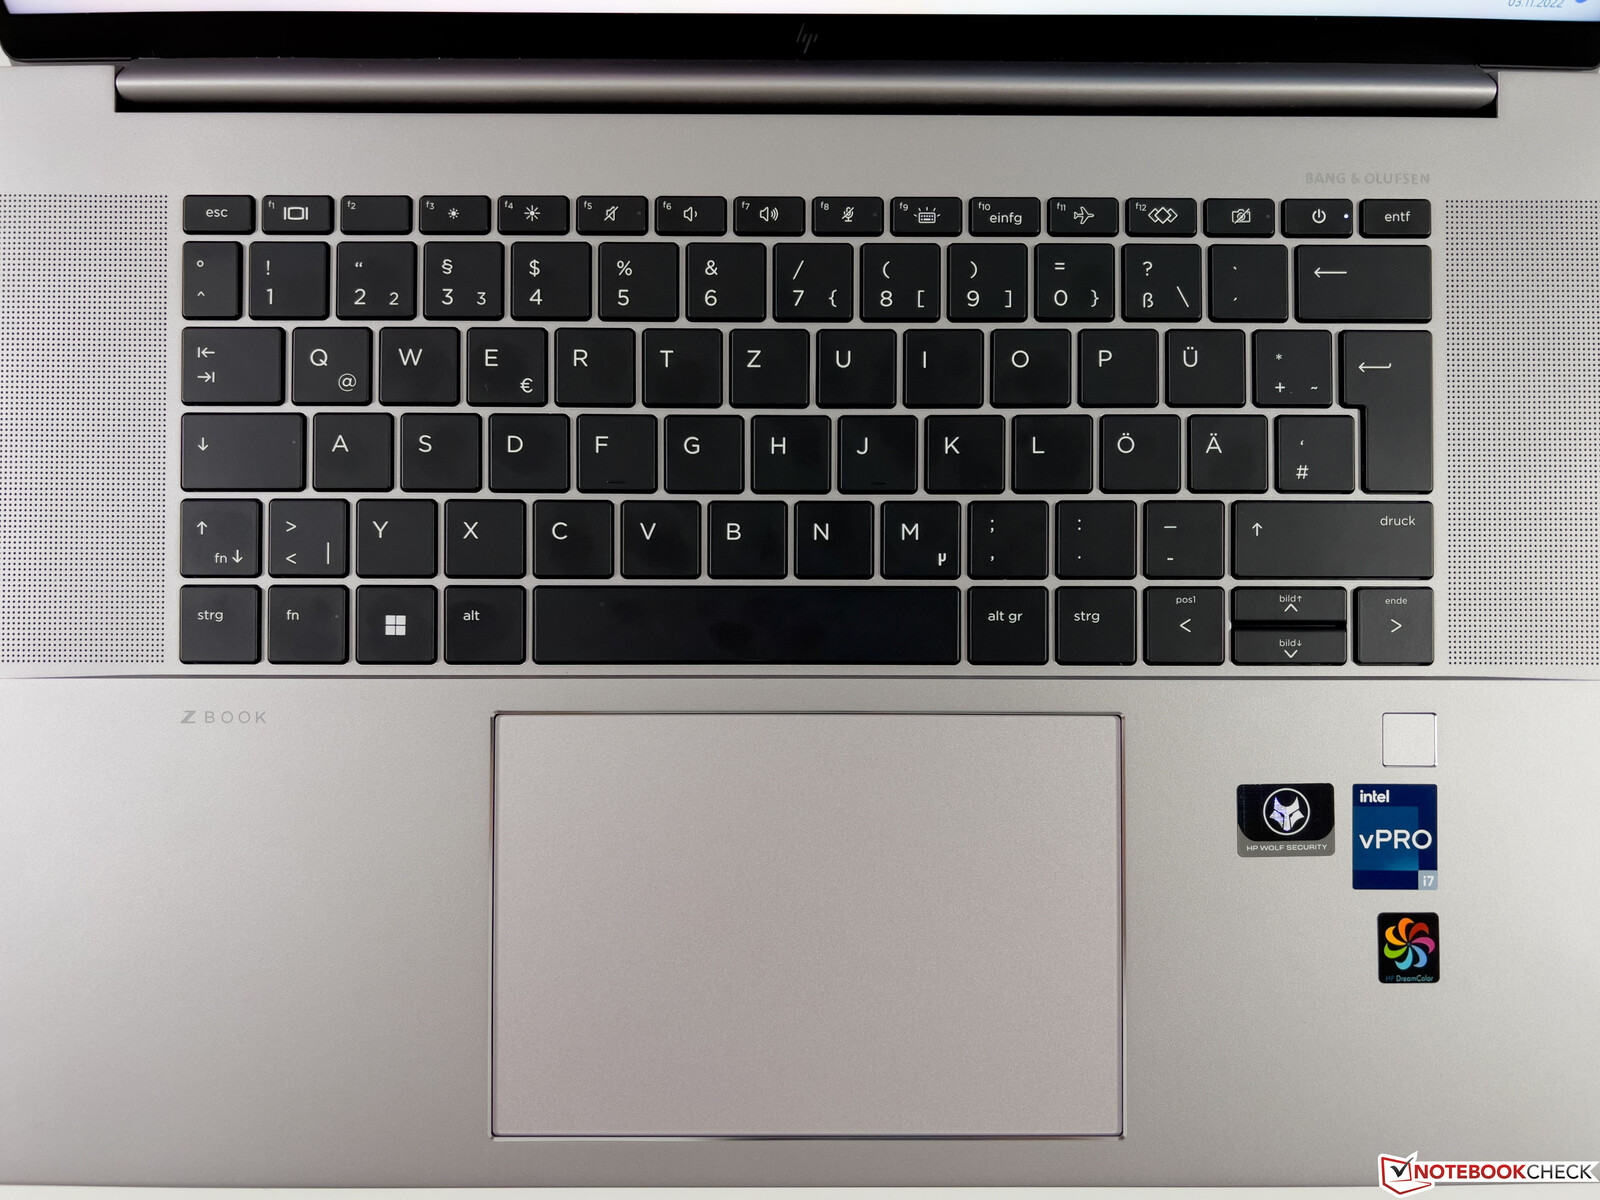
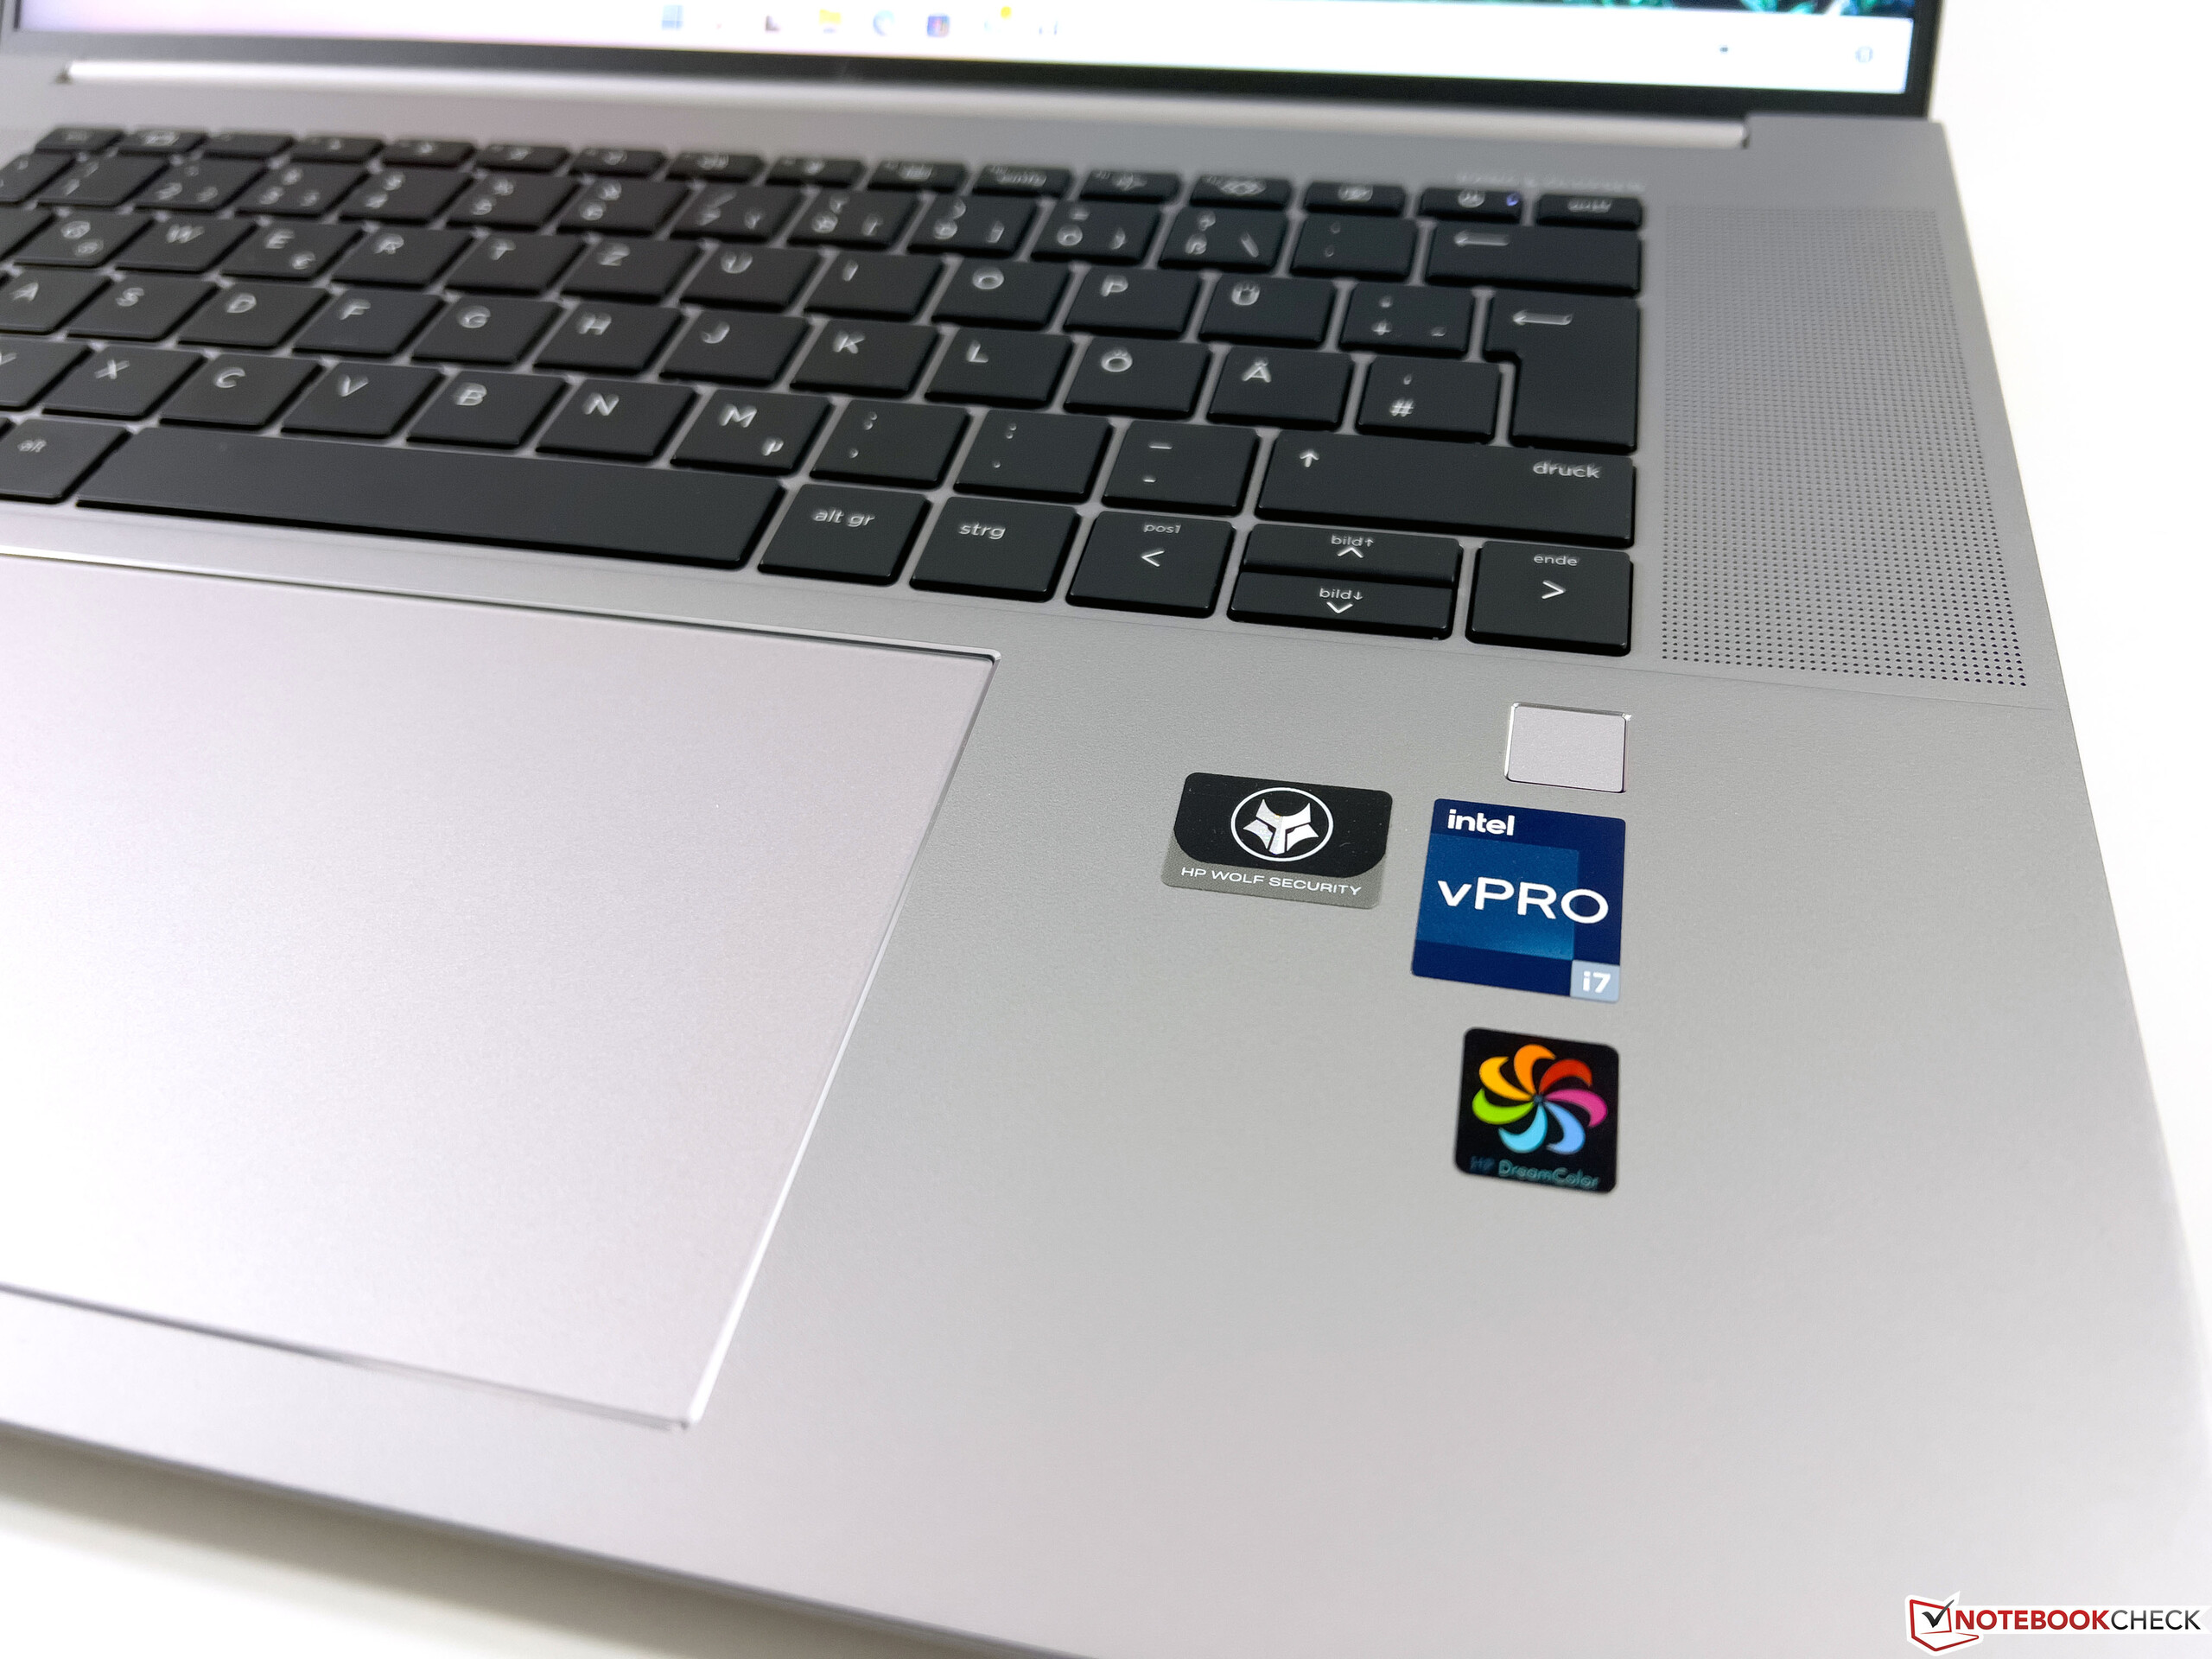
触摸板
几年前,惠普在ZBook Studio上取消了PointStick和专用的鼠标按钮,现在采用了一个大的ClickPad,它比旧款还要大,有13.4 x 8.9厘米。ClickPad得分很高:操作无误,滑行性能很好,而且Pad产生了一种消音但高质量的点击声。
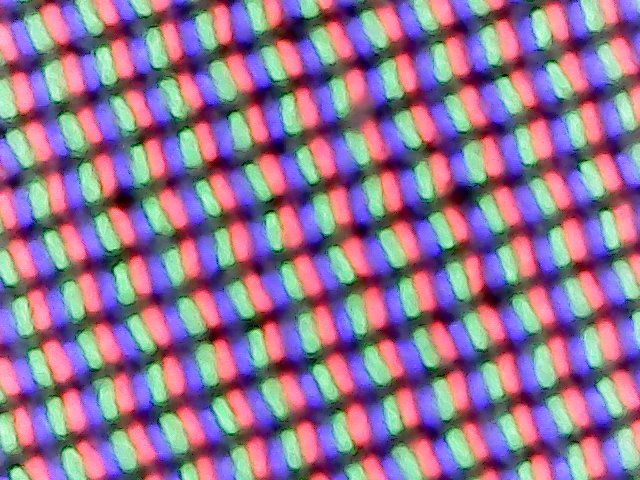
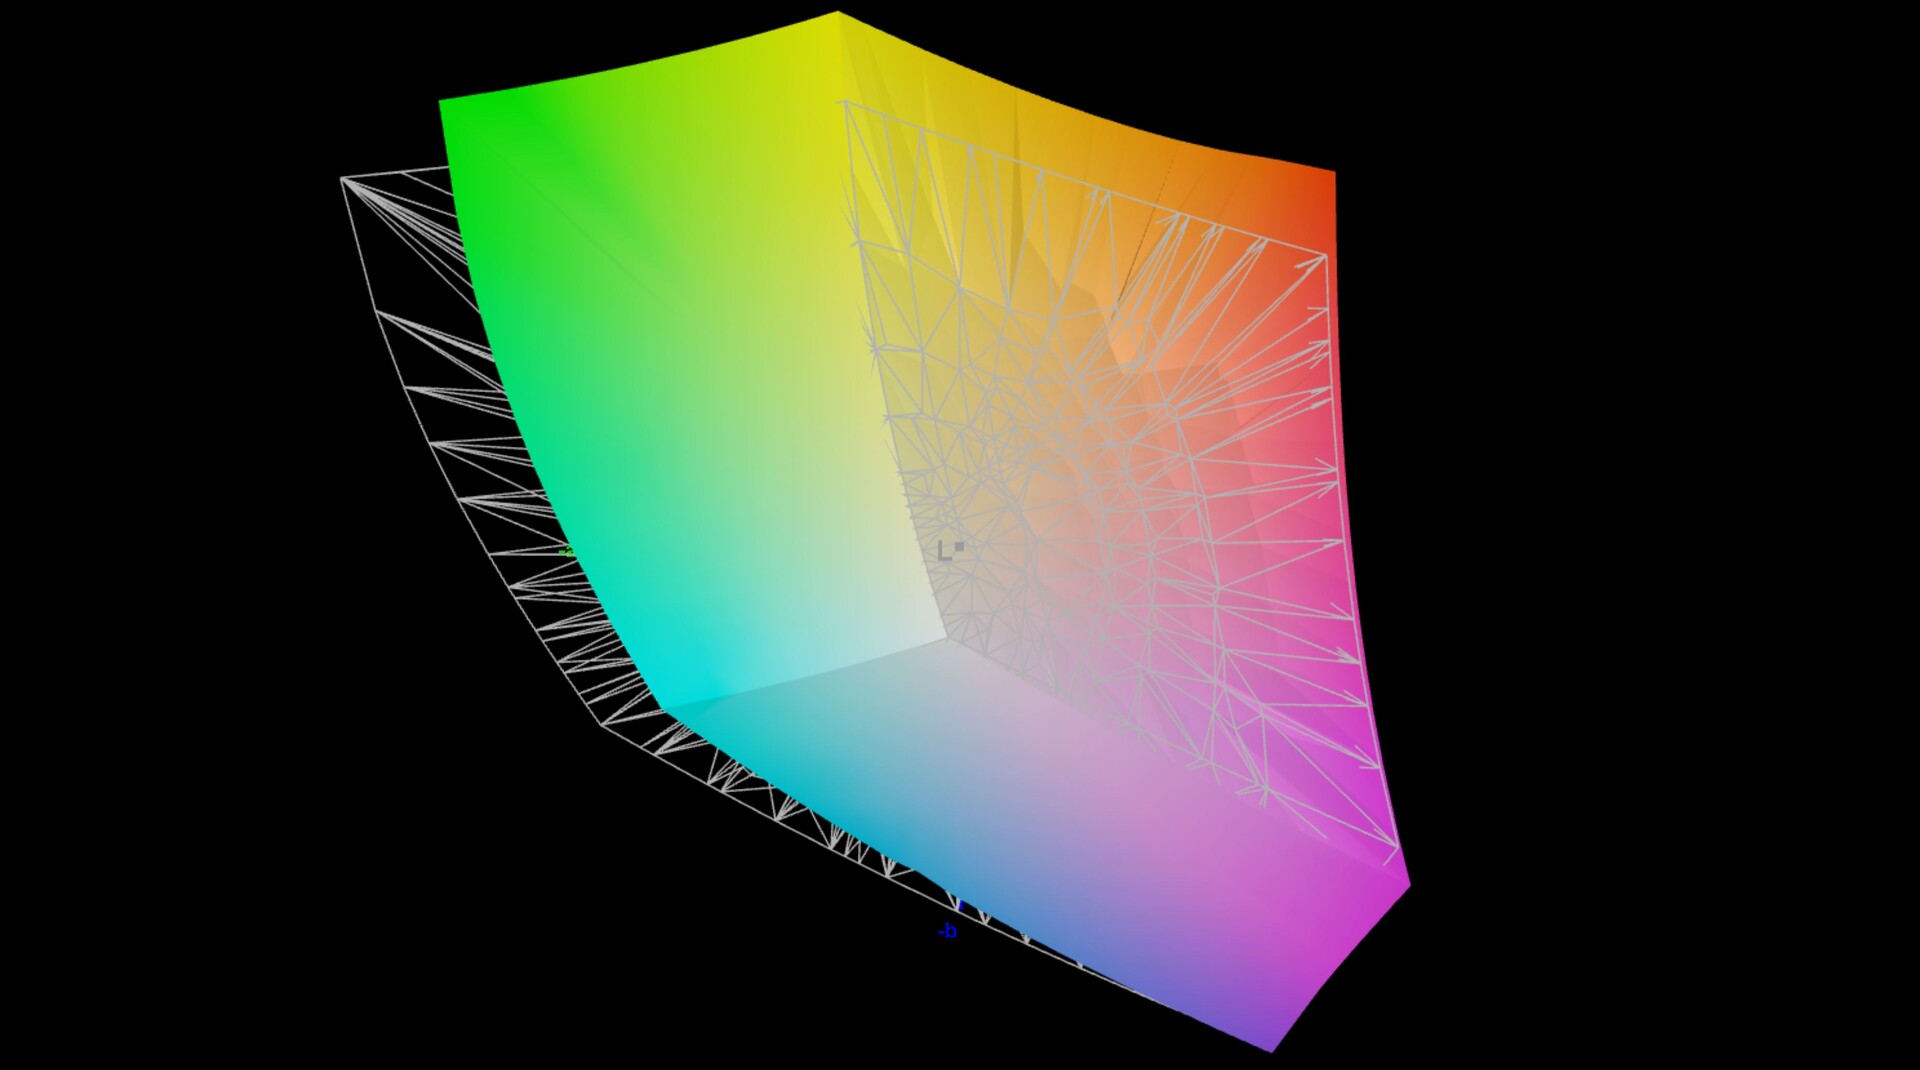
显示器 - 4K梦幻色彩,120赫兹
惠普现在使用更大的16英寸显示屏,采用16:10格式,总共有四种不同的面板可供选择。
- 1,920 x 1,200像素,IPS,哑光,400尼特,低功率,100% sRGB。
- 1,920 x 1,200像素,IPS,亚光,1,000尼特,SureView隐私过滤器,72% NTSC
- 3,840 x 2,400像素,IPS,哑光,500尼特,DreamColor,120赫兹,100% DCI-P3
- 3.840 x 2.400像素,OLED,400尼特,康宁大猩猩玻璃5,100% DCI-P3
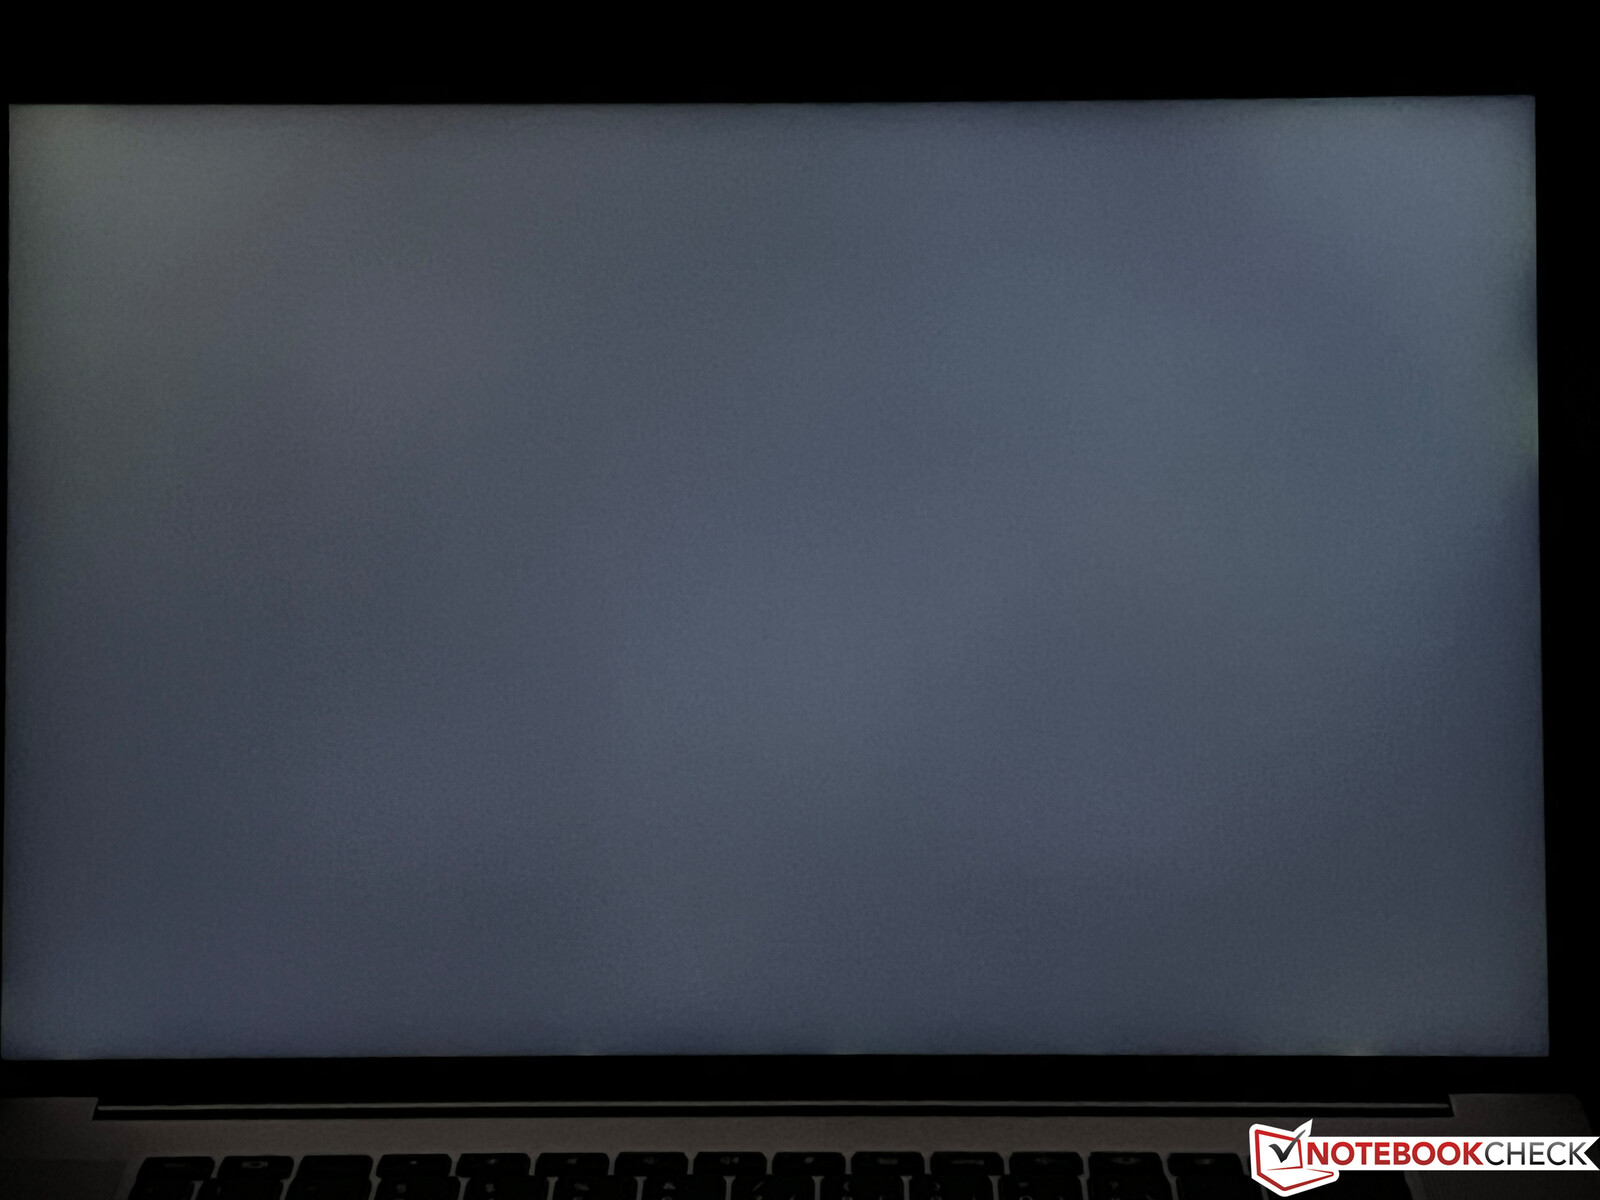
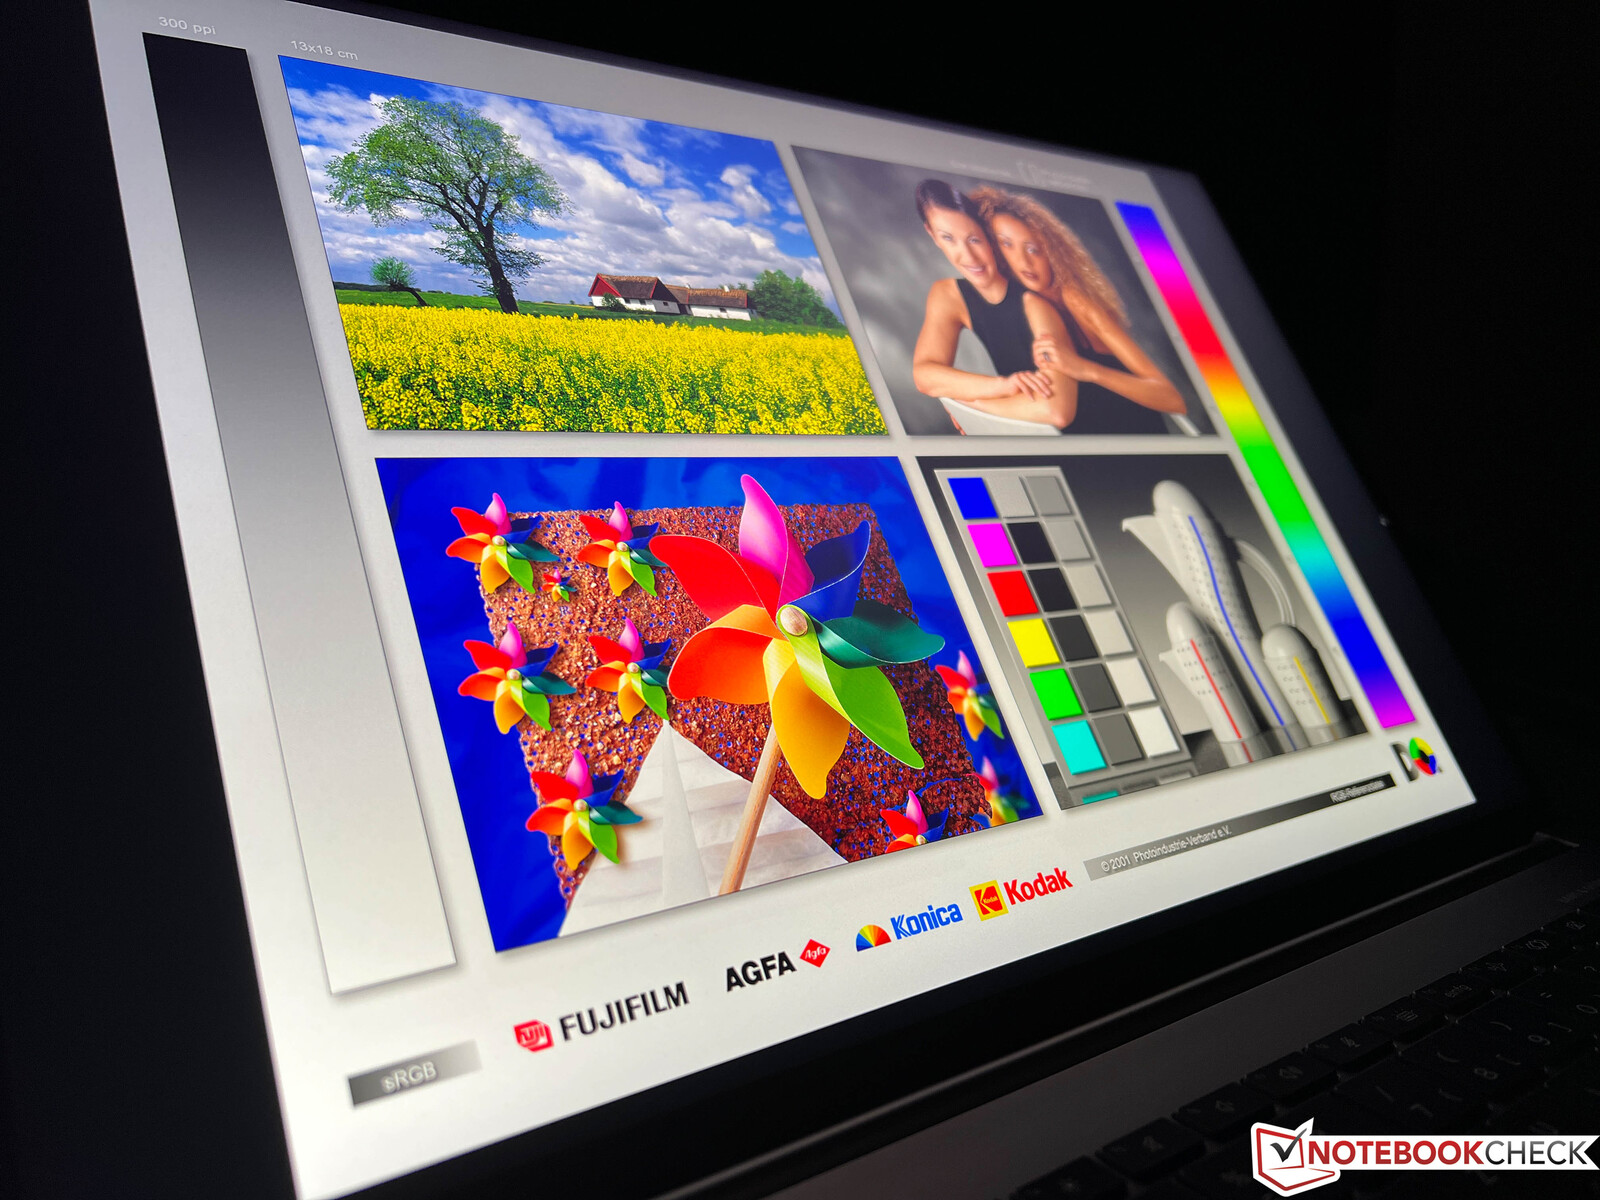
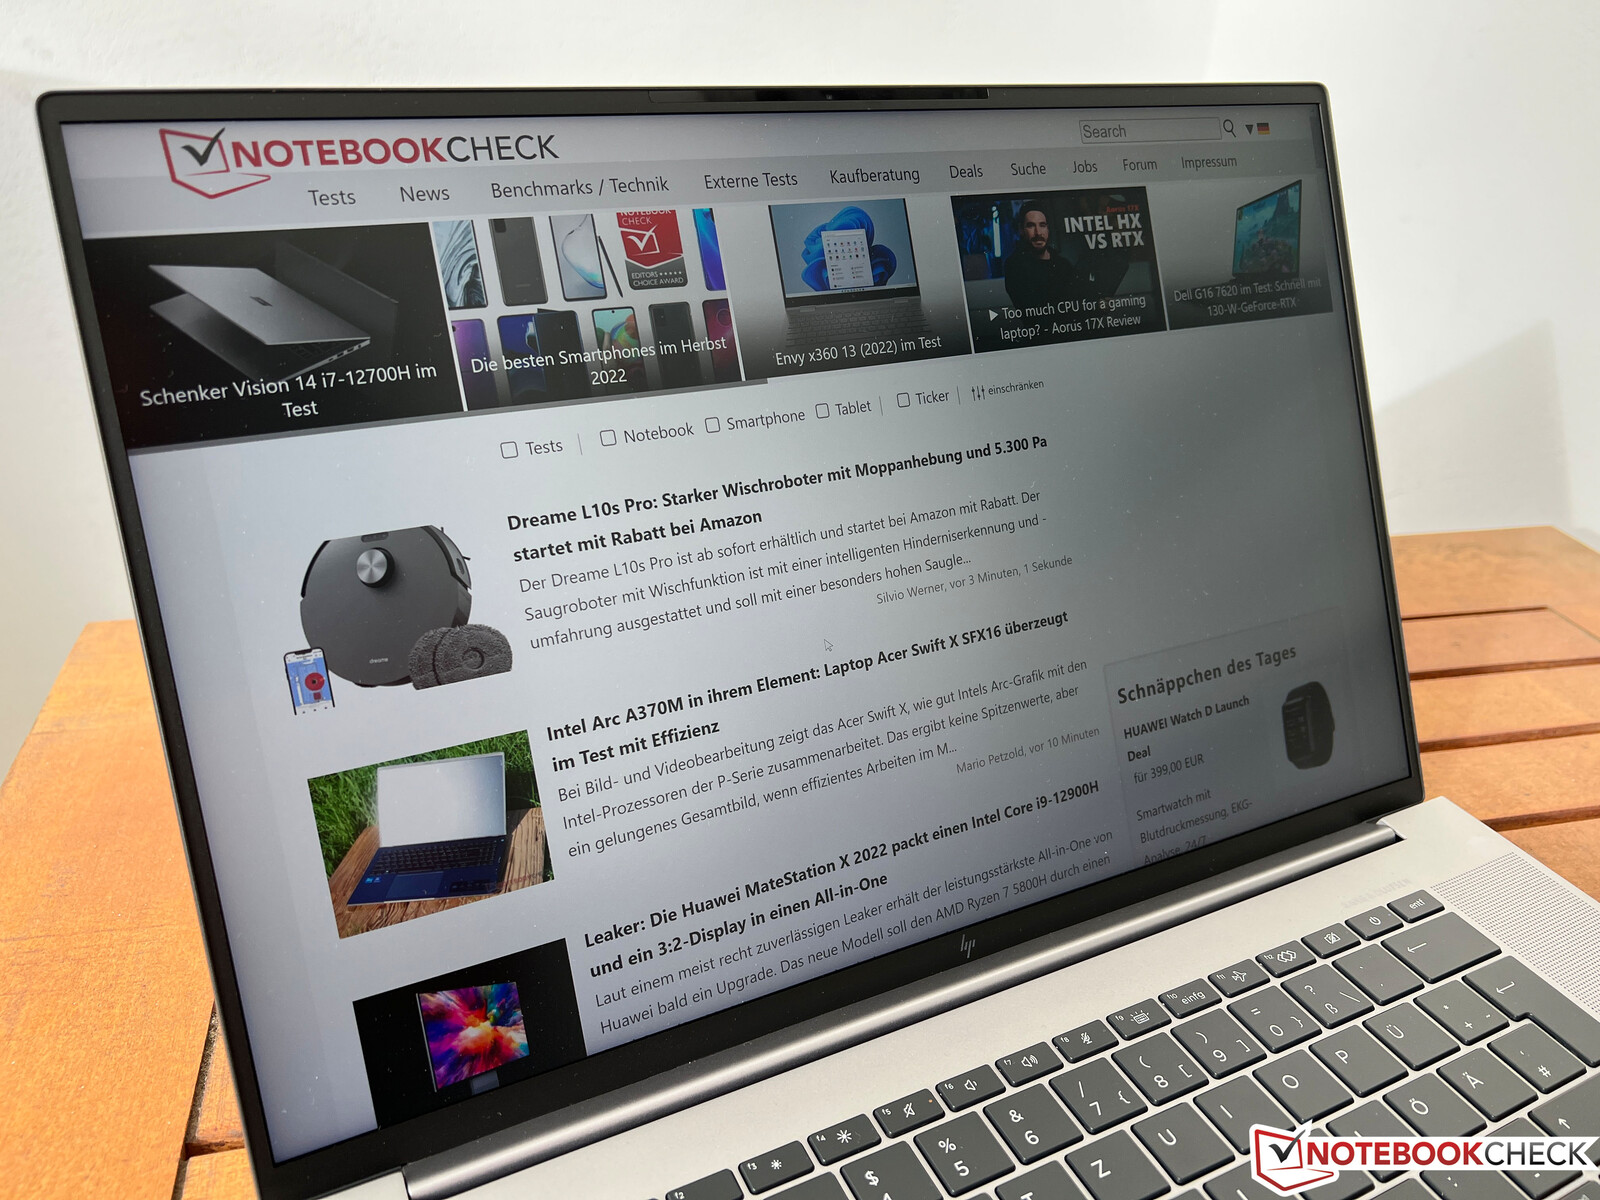
我们的评测设备配备的是4K DreamColor面板,它的主观画质非常好。哑光屏幕只有轻微的颗粒感,即使是在明亮的表面,但当坐在正常距离时,这一点并不明显。同时,内容非常清晰,色彩非常鲜艳。我们确定的平均亮度为良好的cd/m²,但0.47的黑值非常高,这导致 "只有"~1,200:1的体面的对比度。
120赫兹的较高频率在实践中也很明显,因为屏幕移动非常流畅,特别是在滚动浏览文件或网站时,对于IPS面板来说,响应时间也非常快。PWM闪烁不存在,可视角度的稳定性非常好,没有恼人的光晕。
| |||||||||||||||||||||||||
Brightness Distribution: 84 %
Center on Battery: 553 cd/m²
Contrast: 1179:1 (Black: 0.47 cd/m²)
ΔE ColorChecker Calman: 1 | ∀{0.5-29.43 Ø4.71}
calibrated: 0.6
ΔE Greyscale Calman: 1.6 | ∀{0.09-98 Ø4.96}
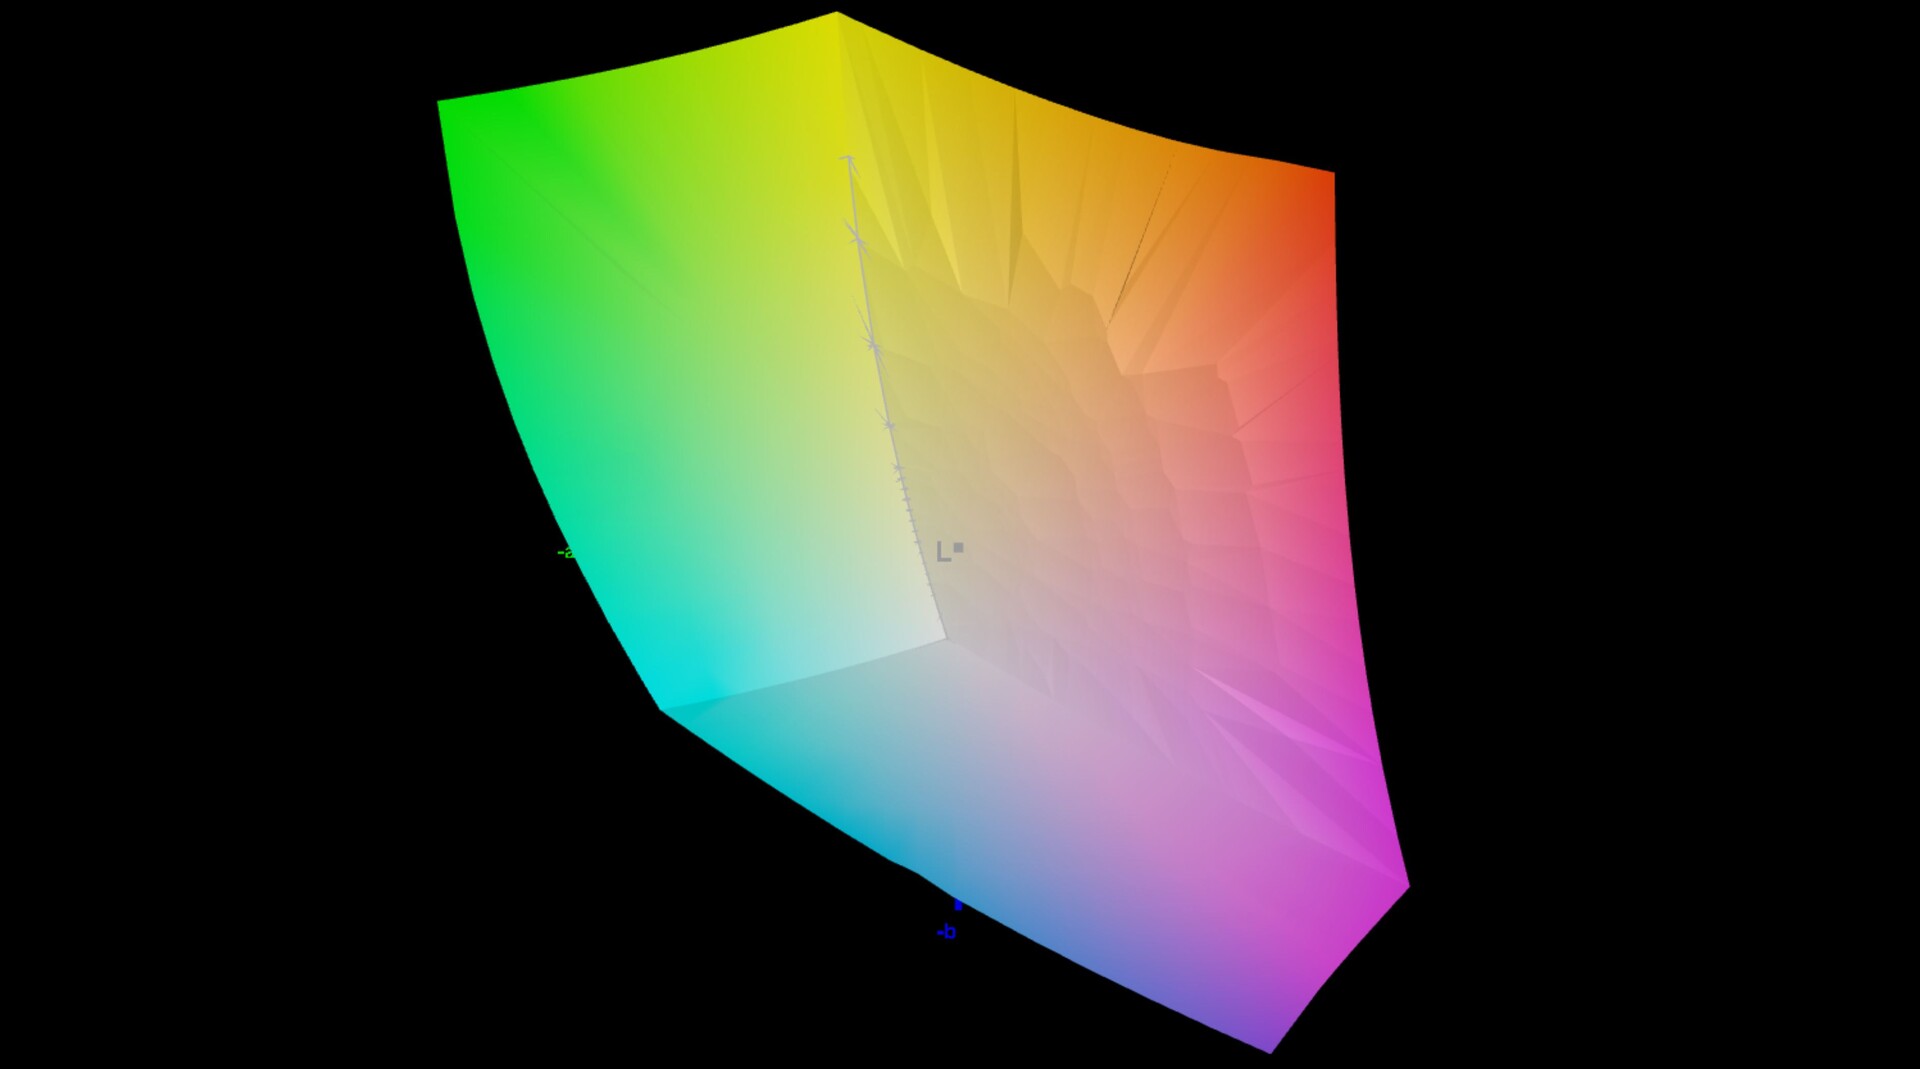
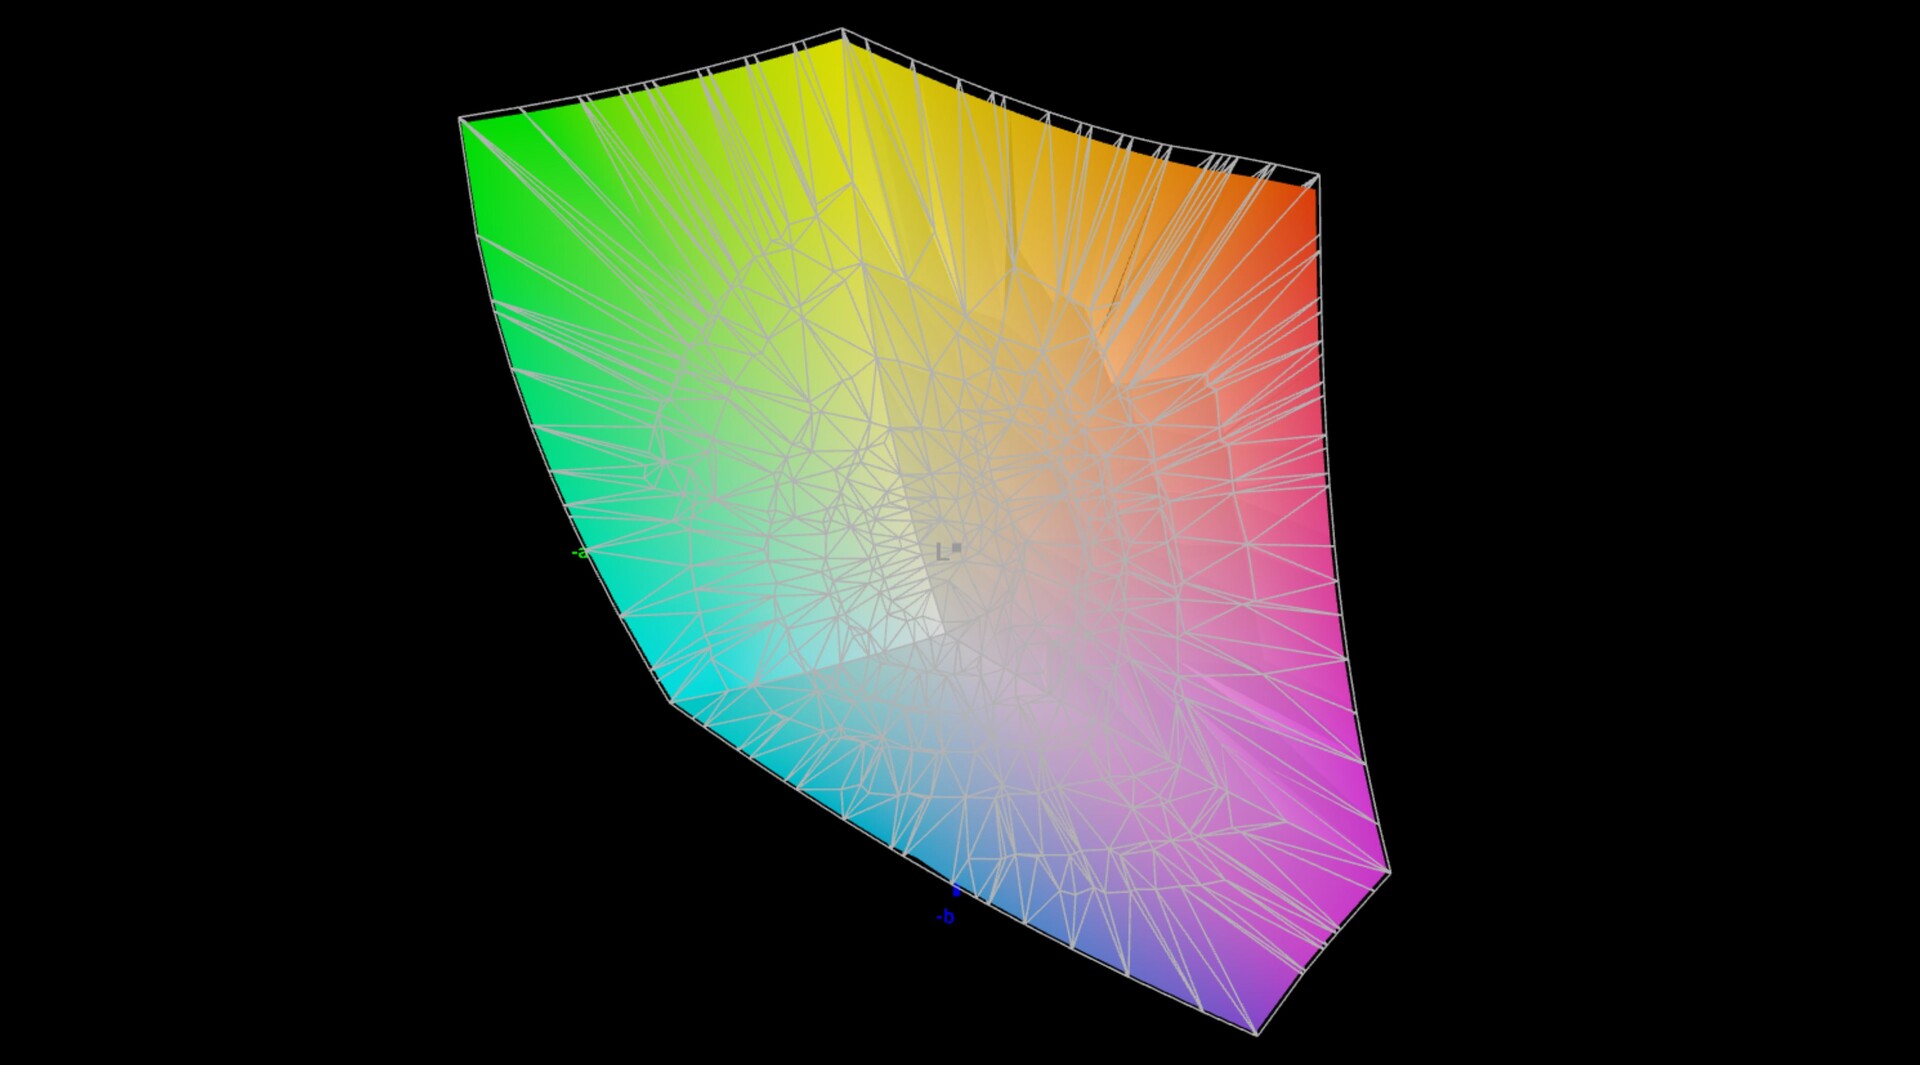
86.3% AdobeRGB 1998 (Argyll 3D)
99.9% sRGB (Argyll 3D)
97.5% Display P3 (Argyll 3D)
Gamma: 2.29
CCT: 6458 K
| HP ZBook Studio 16 G9 62U04EA BOE0A52, IPS, 3840x2400, 16" | Lenovo ThinkPad P1 G4-20Y4Z9DVUS NE160QDM-N63, IPS, 2560x1600, 16" | Apple MacBook Pro 16 2021 M1 Max Mini-LED, 3456x2234, 16.2" | Dell Precision 5000 5560 Sharp LQ156R1, IPS, 3840x2400, 15.6" | HP ZBook Studio 15 G8 SDC4145, OLED, 3840x2160, 15.6" | |
|---|---|---|---|---|---|
| Display | -13% | 4% | 4% | ||
| Display P3 Coverage (%) | 97.5 | 72.7 -25% | 94.9 -3% | 99.9 2% | |
| sRGB Coverage (%) | 99.9 | 99.3 -1% | 100 0% | 100 0% | |
| AdobeRGB 1998 Coverage (%) | 86.3 | 74.7 -13% | 100 16% | 95.3 10% | |
| Response Times | -204% | -303% | 73% | ||
| Response Time Grey 50% / Grey 80% * (ms) | 15.3 ? | 40.8 -167% | 47.2 ? -208% | 2.4 ? 84% | |
| Response Time Black / White * (ms) | 6.1 ? | 20.8 -241% | 30.4 ? -398% | 2.4 ? 61% | |
| PWM Frequency (Hz) | 240.4 ? | ||||
| Screen | -60% | 256% | -83% | -166% | |
| Brightness middle (cd/m²) | 554 | 441 -20% | 507 -8% | 501.5 -9% | 379.6 -31% |
| Brightness (cd/m²) | 516 | 420 -19% | 494 -4% | 467 -9% | 380 -26% |
| Brightness Distribution (%) | 84 | 90 7% | 96 14% | 83 -1% | 95 13% |
| Black Level * (cd/m²) | 0.47 | 0.27 43% | 0.02 96% | 0.44 6% | |
| Contrast (:1) | 1179 | 1633 39% | 25350 2050% | 1140 -3% | |
| Colorchecker dE 2000 * | 1 | 2.6 -160% | 1.4 -40% | 4.73 -373% | 5.15 -415% |
| Colorchecker dE 2000 max. * | 2.4 | 6 -150% | 2.8 -17% | 8.45 -252% | 7.79 -225% |
| Colorchecker dE 2000 calibrated * | 0.6 | 1.2 -100% | 0.51 15% | 3.1 -417% | |
| Greyscale dE 2000 * | 1.6 | 4.5 -181% | 2.3 -44% | 3.6 -125% | 2.6 -63% |
| Gamma | 2.29 96% | 2.18 101% | 2.27 97% | 2.08 106% | 1.99 111% |
| CCT | 6458 101% | 6623 98% | 6792 96% | 6447 101% | 6166 105% |
| Total Average (Program / Settings) | -92% /
-71% | 256% /
256% | -127% /
-96% | -30% /
-84% |
* ... smaller is better

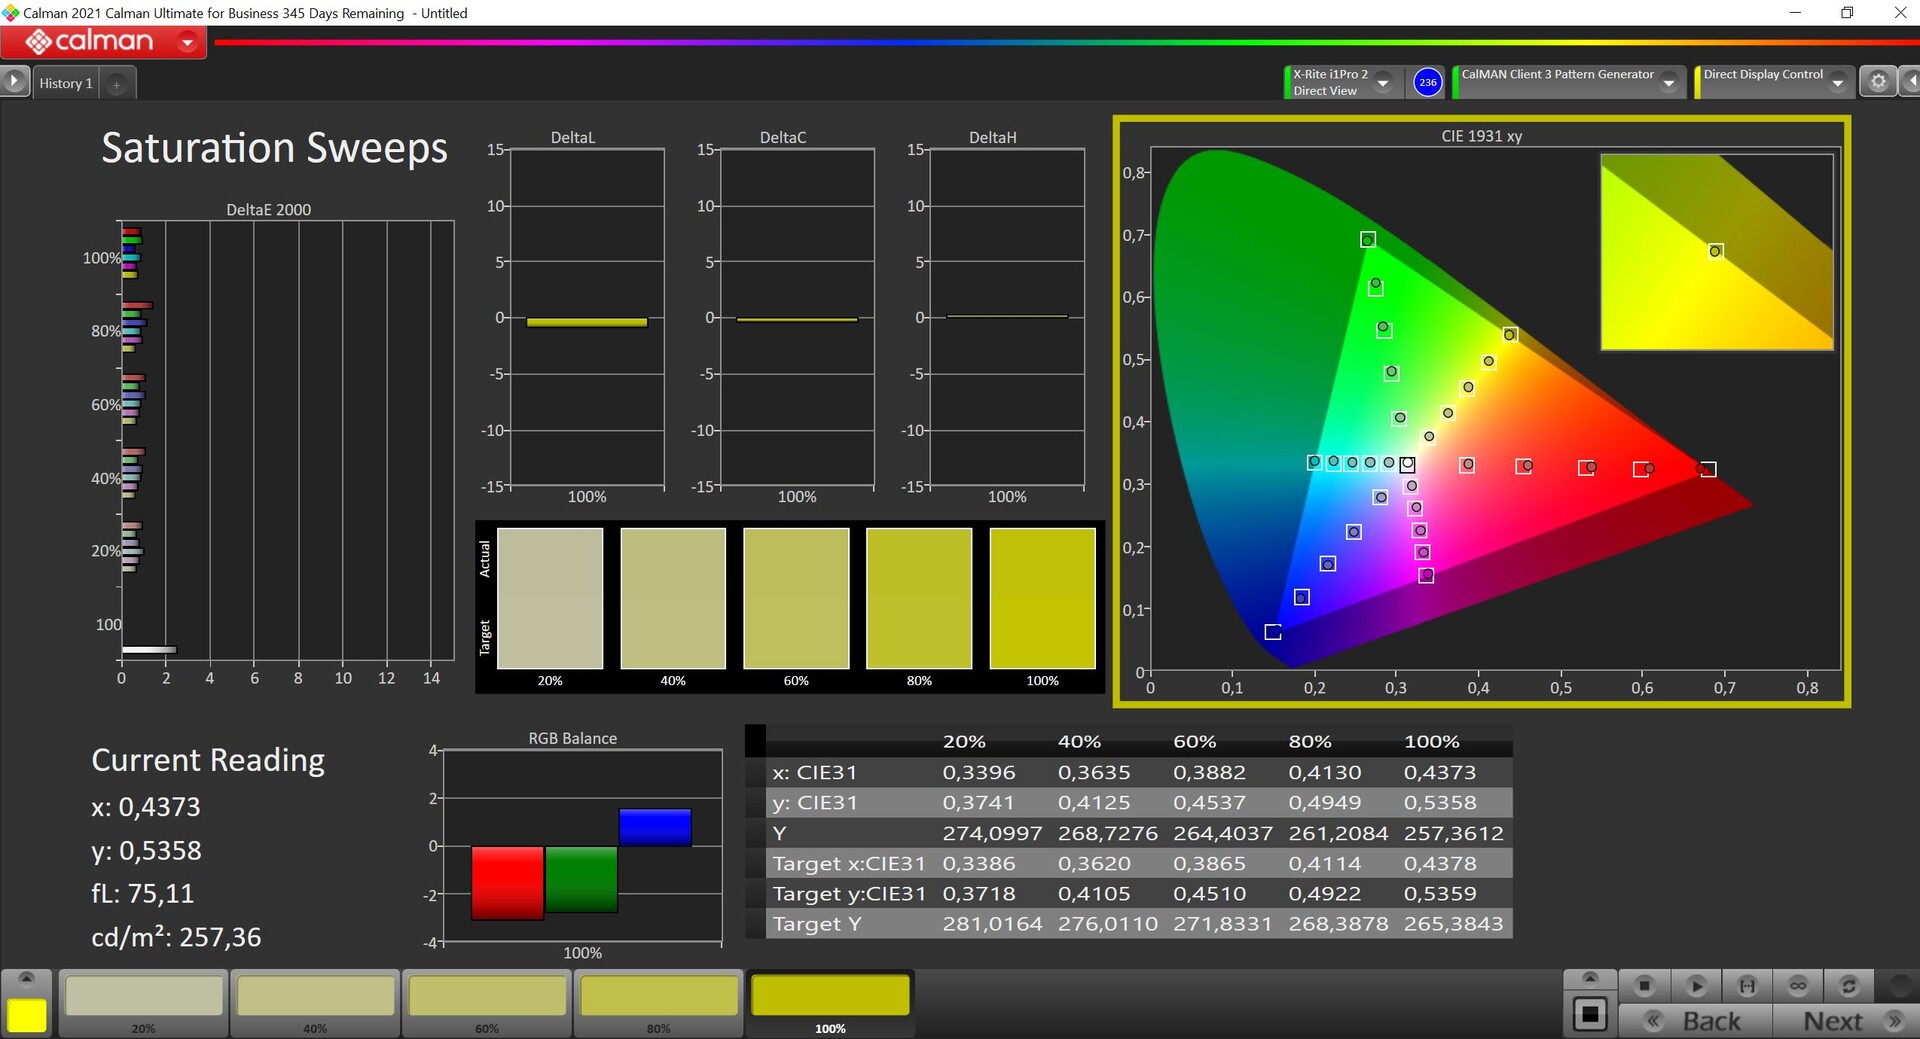

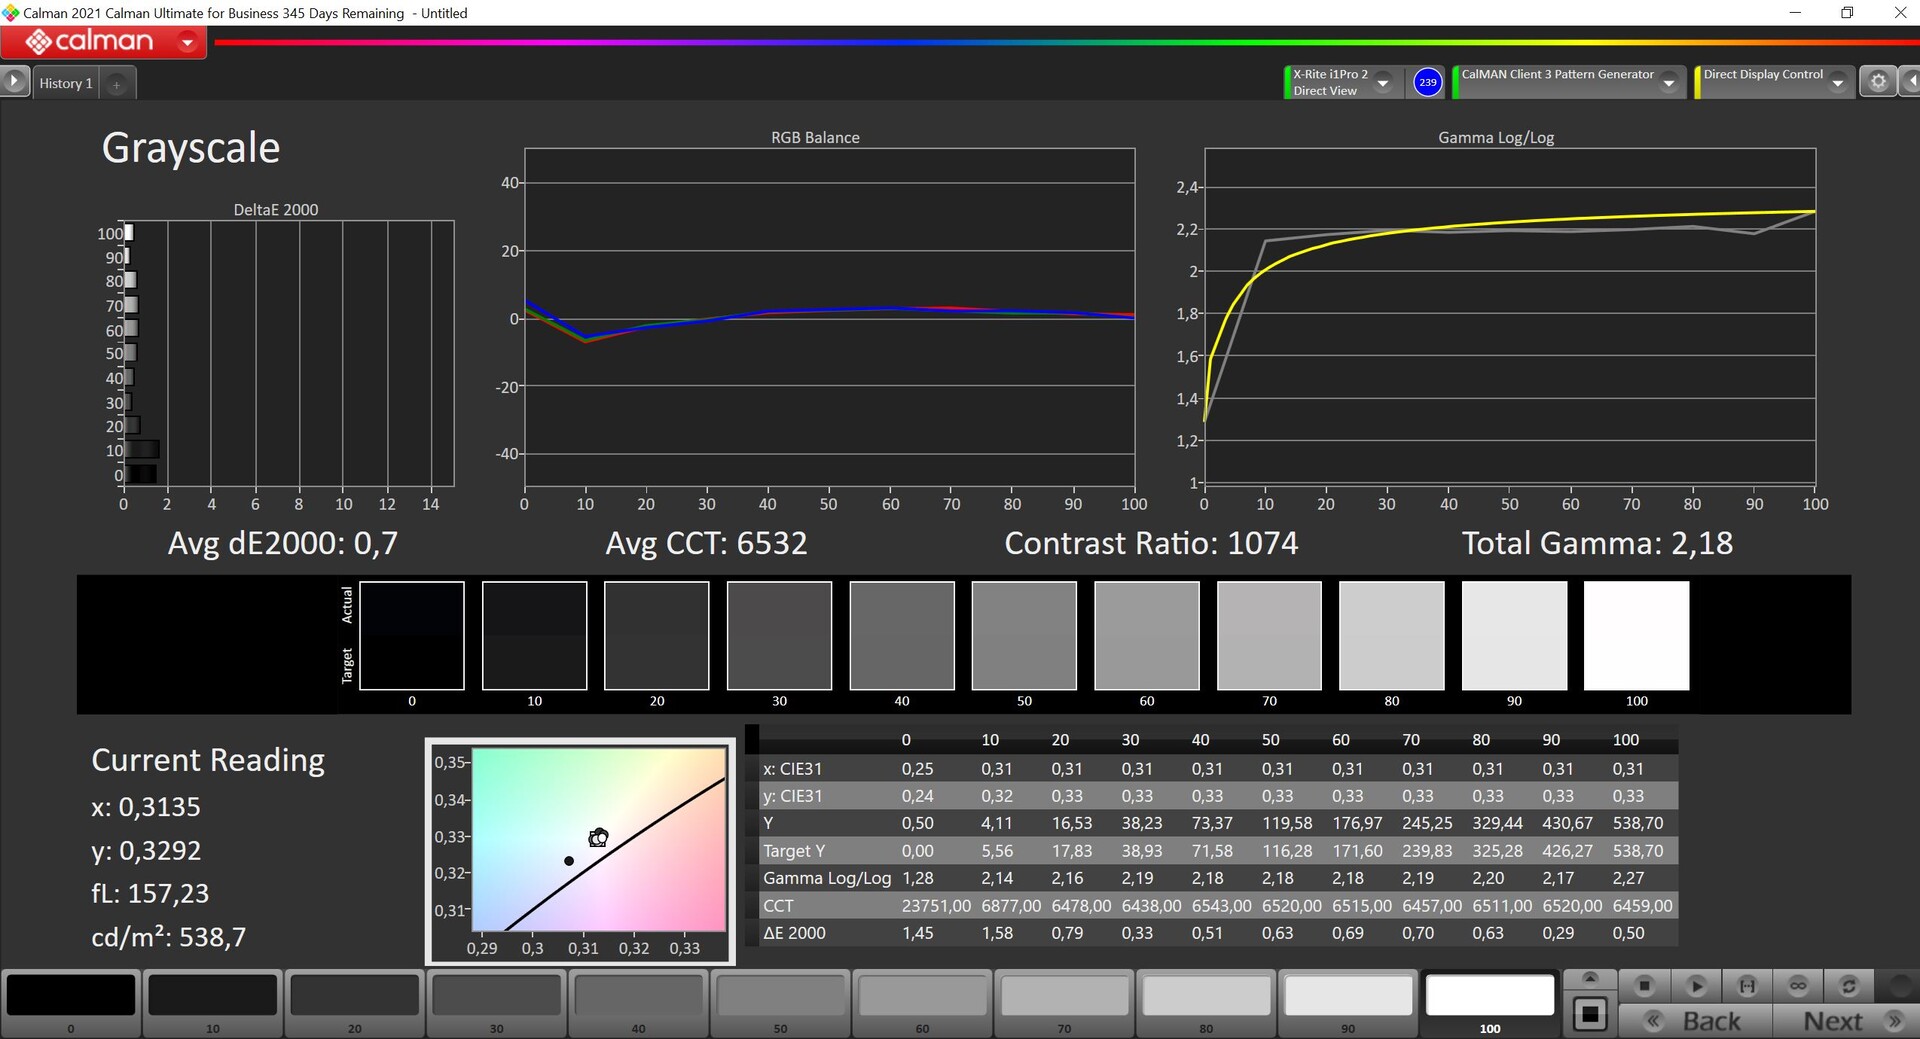

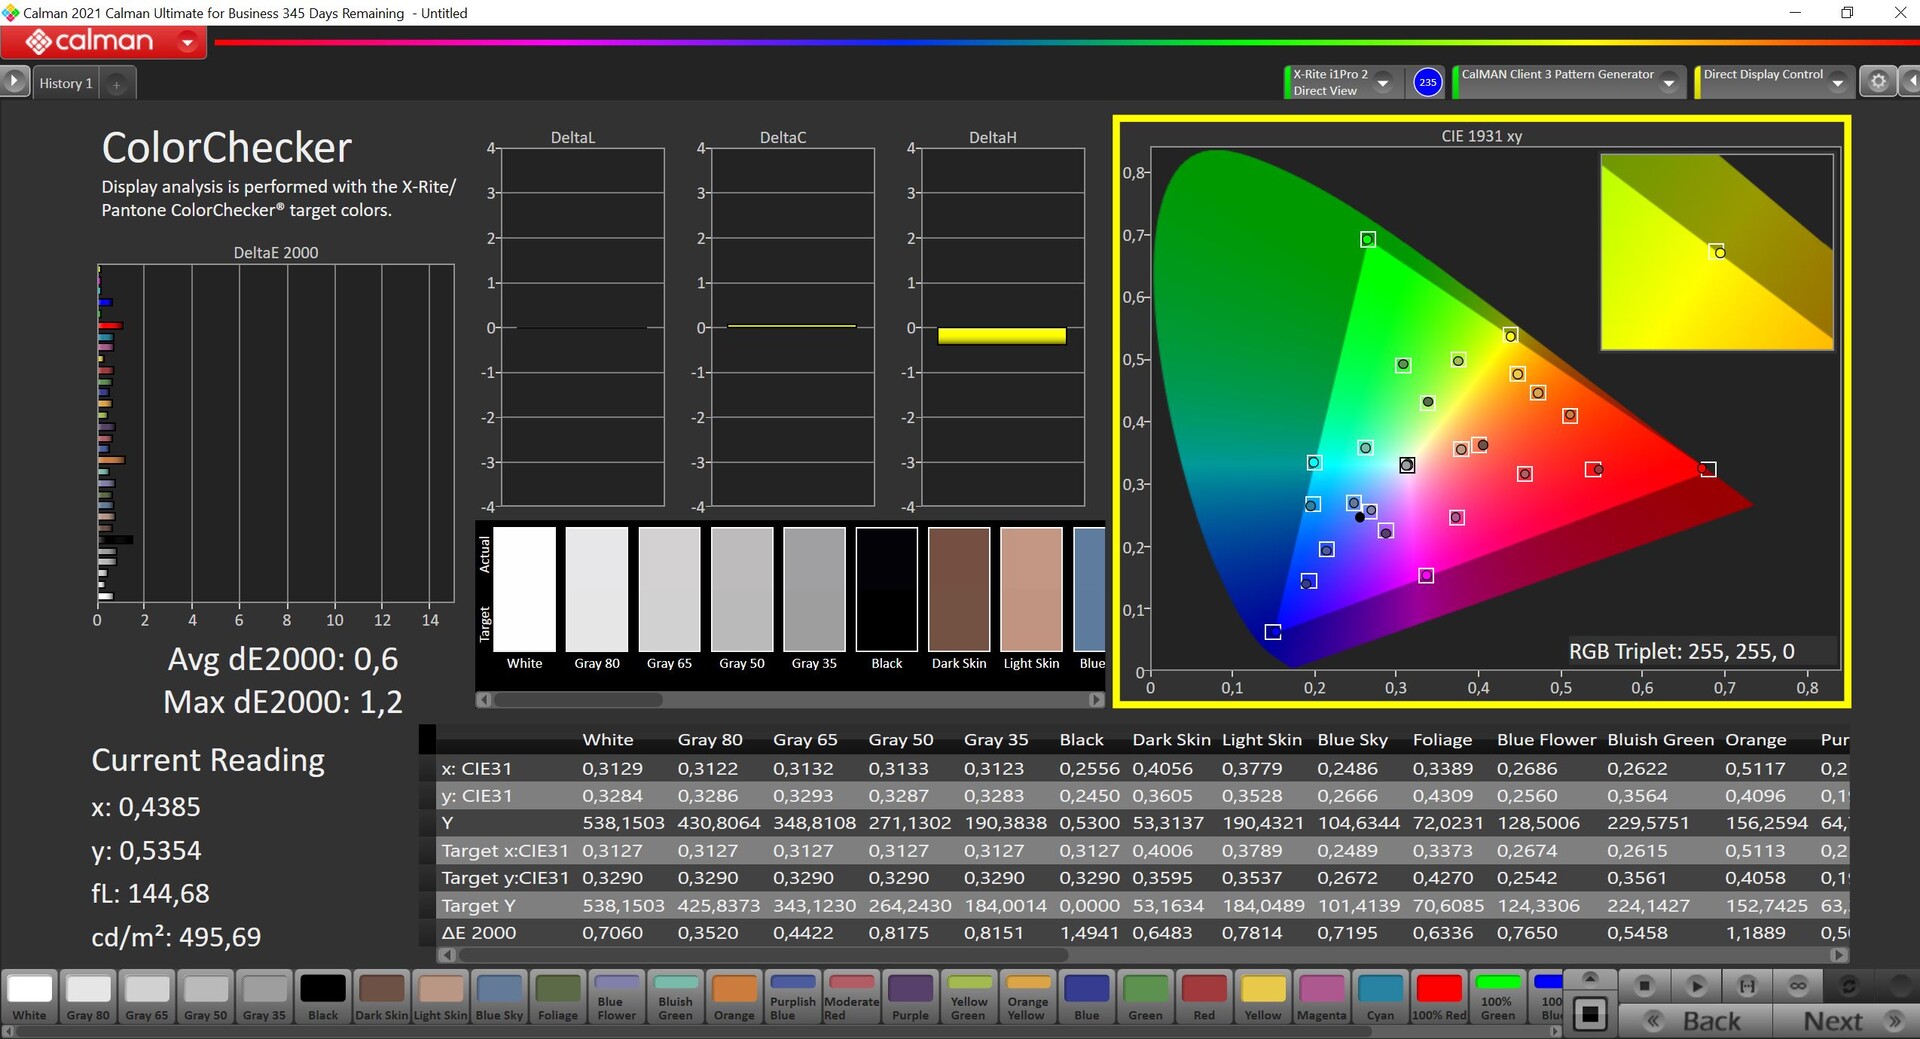
DreamColor显示器已经很好地调整了工作状态。在我们用专业的CalMAN软件进行的分析中,所有的偏差都已经在3的重要限制之下,而且没有偏色。我们能够通过自己的校准从面板中挤出更多一点,但这种差异只是可测量的,而不是可感知的。
然而,我们仍然不完全满意,因为与早期的DreamColor型号相比,只有DCI-P3色彩空间在一段时间内得到了完全覆盖,而这曾经是AdobeRGB。此外,以前有DreamColor软件可以用来切换色彩空间,比如说可以在sRGB色彩空间中工作。
Display Response Times
| ↔ Response Time Black to White | ||
|---|---|---|
| 6.1 ms ... rise ↗ and fall ↘ combined | ↗ 2.1 ms rise | 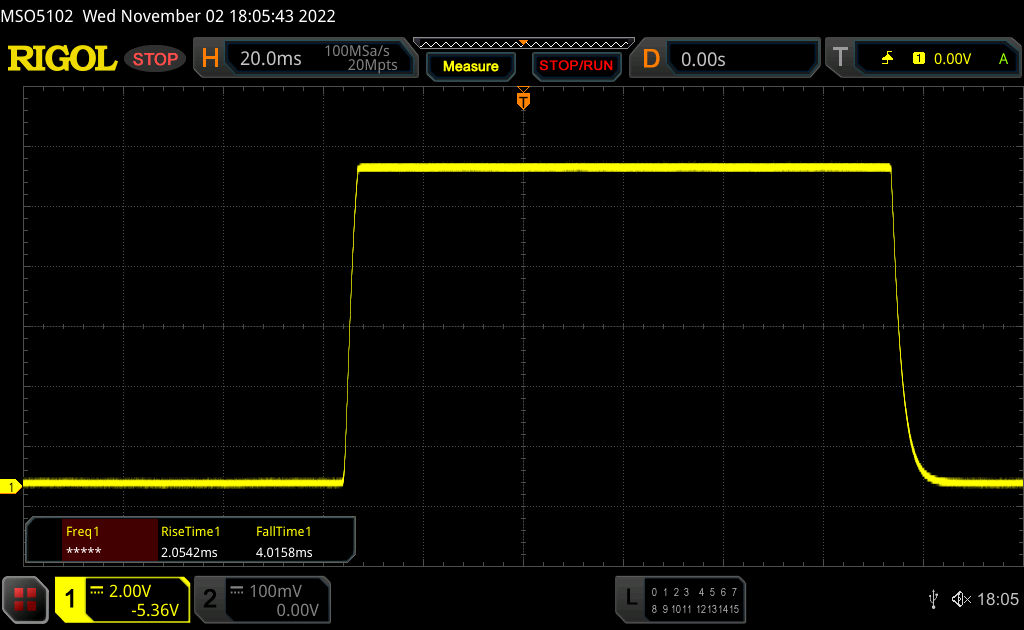 |
| ↘ 4 ms fall | ||
| The screen shows very fast response rates in our tests and should be very well suited for fast-paced gaming. In comparison, all tested devices range from 0.1 (minimum) to 240 (maximum) ms. » 20 % of all devices are better. This means that the measured response time is better than the average of all tested devices (19.8 ms). | ||
| ↔ Response Time 50% Grey to 80% Grey | ||
| 15.3 ms ... rise ↗ and fall ↘ combined | ↗ 6.9 ms rise | 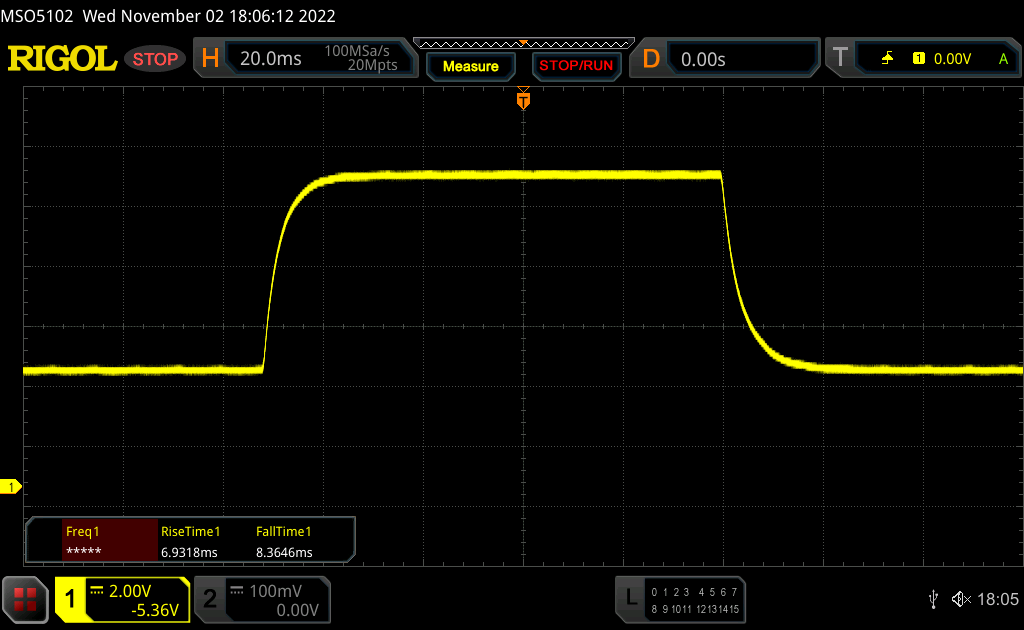 |
| ↘ 8.4 ms fall | ||
| The screen shows good response rates in our tests, but may be too slow for competitive gamers. In comparison, all tested devices range from 0.165 (minimum) to 636 (maximum) ms. » 30 % of all devices are better. This means that the measured response time is better than the average of all tested devices (31 ms). | ||
Screen Flickering / PWM (Pulse-Width Modulation)
| Screen flickering / PWM not detected | 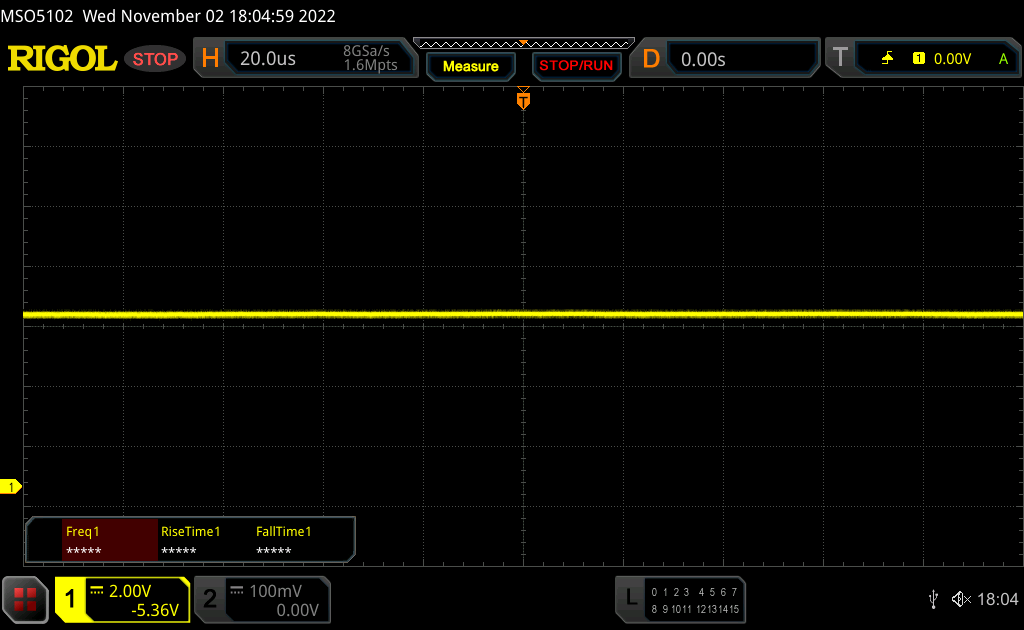 | ||
In comparison: 52 % of all tested devices do not use PWM to dim the display. If PWM was detected, an average of 7754 (minimum: 5 - maximum: 343500) Hz was measured. | |||
在户外,你可以用ZBook Studio 16 G9舒适地工作。由于哑光的表面和良好的亮度,即使在明亮的日子里,屏幕内容也很容易看到。只能避免光源的直接反射。
性能 - Alder Lake和大量的GPU
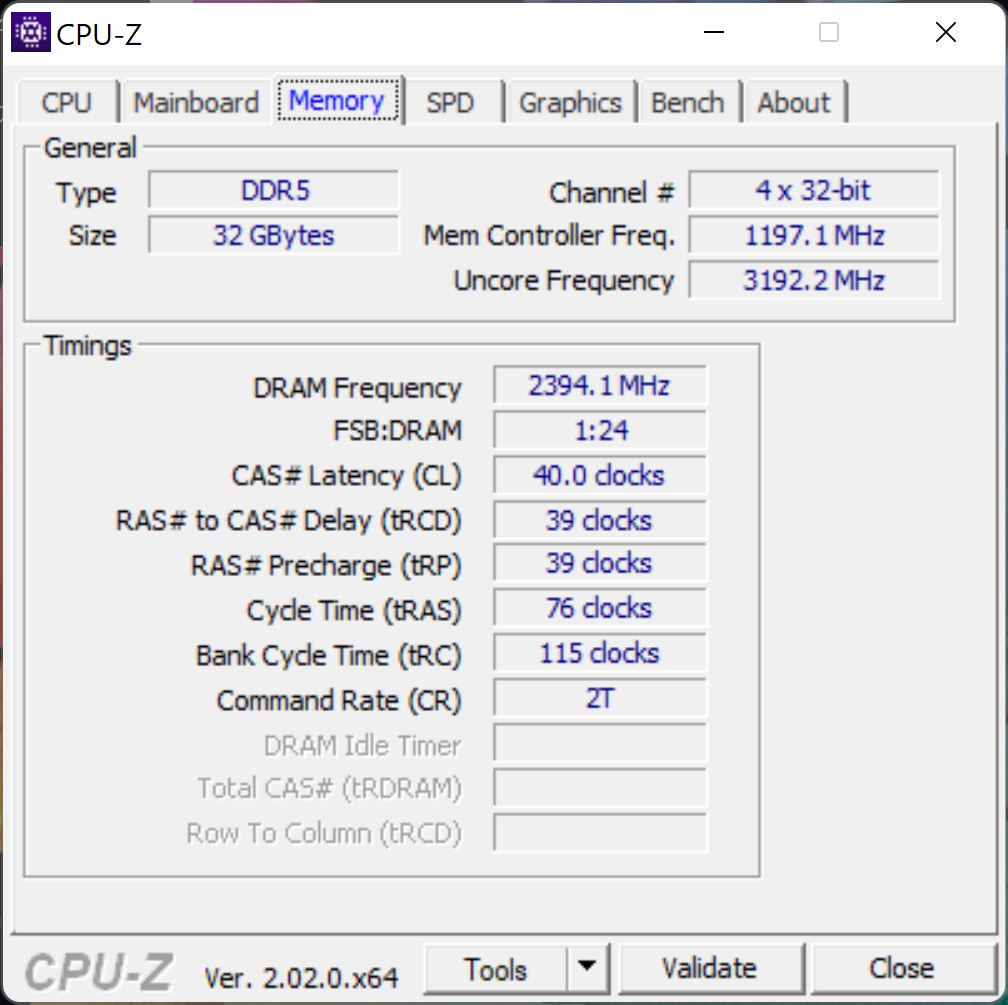
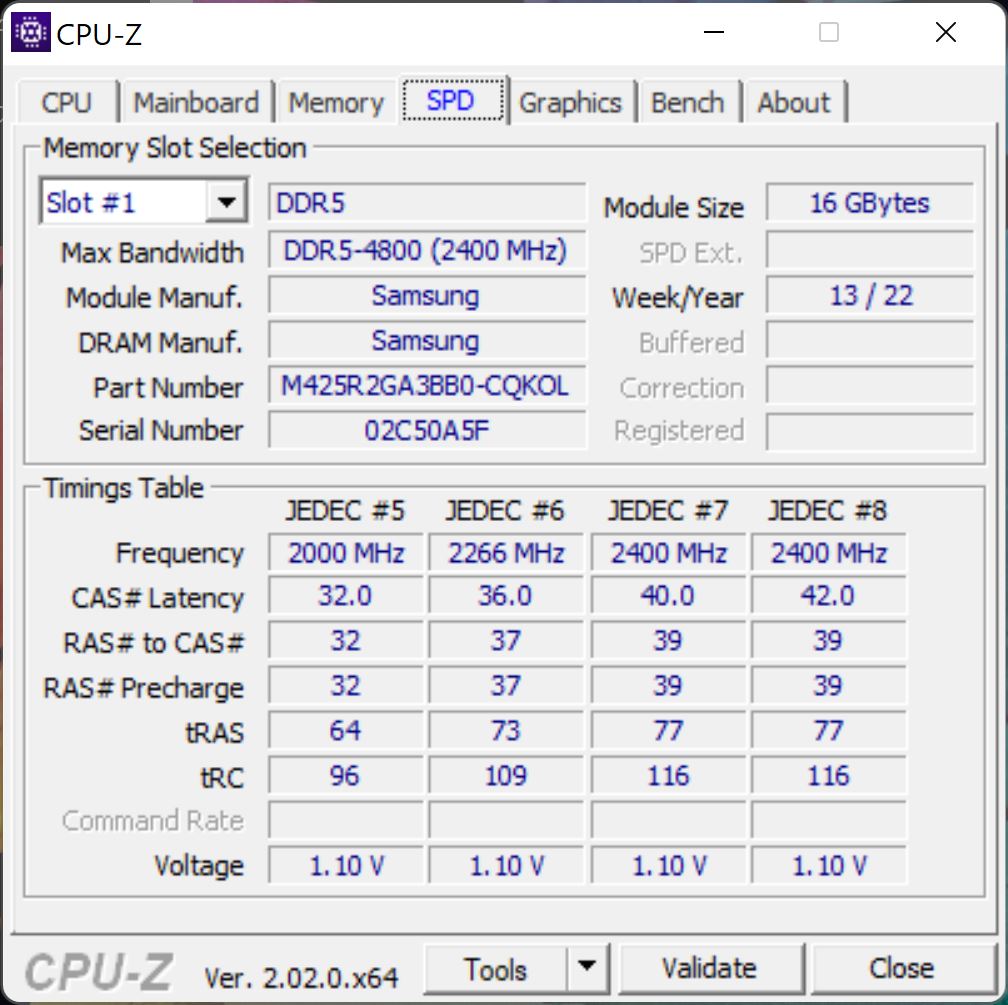
惠普提供了ZBook Studio 16 G9,其中包括酷睿i7-12800H或 酷睿i9-12900H两者都来自英特尔目前的Alder Lake一代,支持vPro。然而,在显卡选择方面,你可以选择Nvidia的整个专业GPU组合,从 RTX A1000到 RTX A5500也有专业的AMD Radeon Pro 6600M。如果你不需要任何特殊的驱动认证,惠普仍然提供最新的GeForce GPU (RTX 3060至 RTX 3080 Ti)。 ZBook还提供两个SODIMM插槽(DDR5-4800 RAM),最大容量为64GB(2x 32GB)。
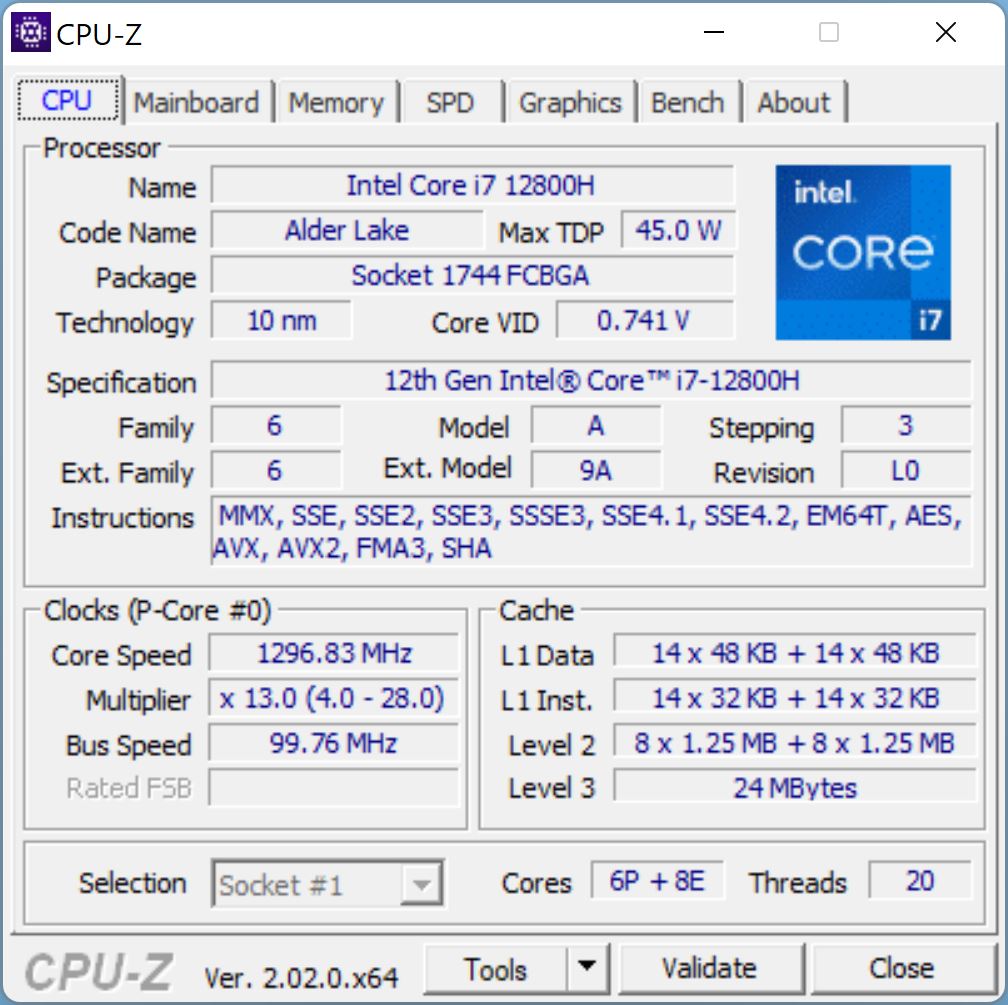
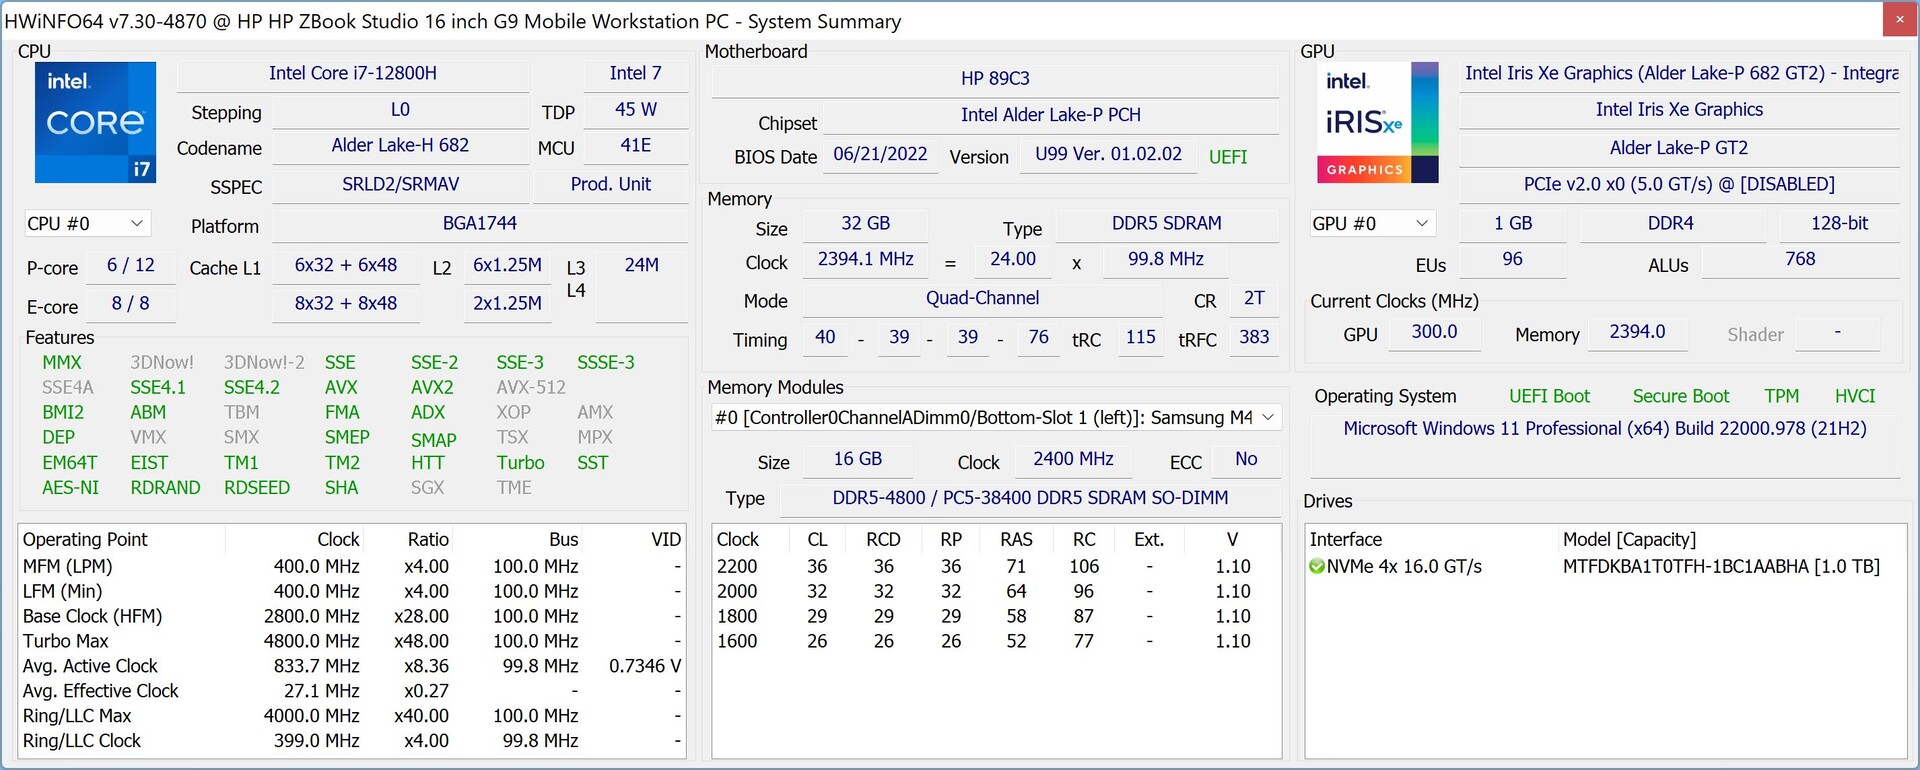
处理器 - 酷睿i7-12800H
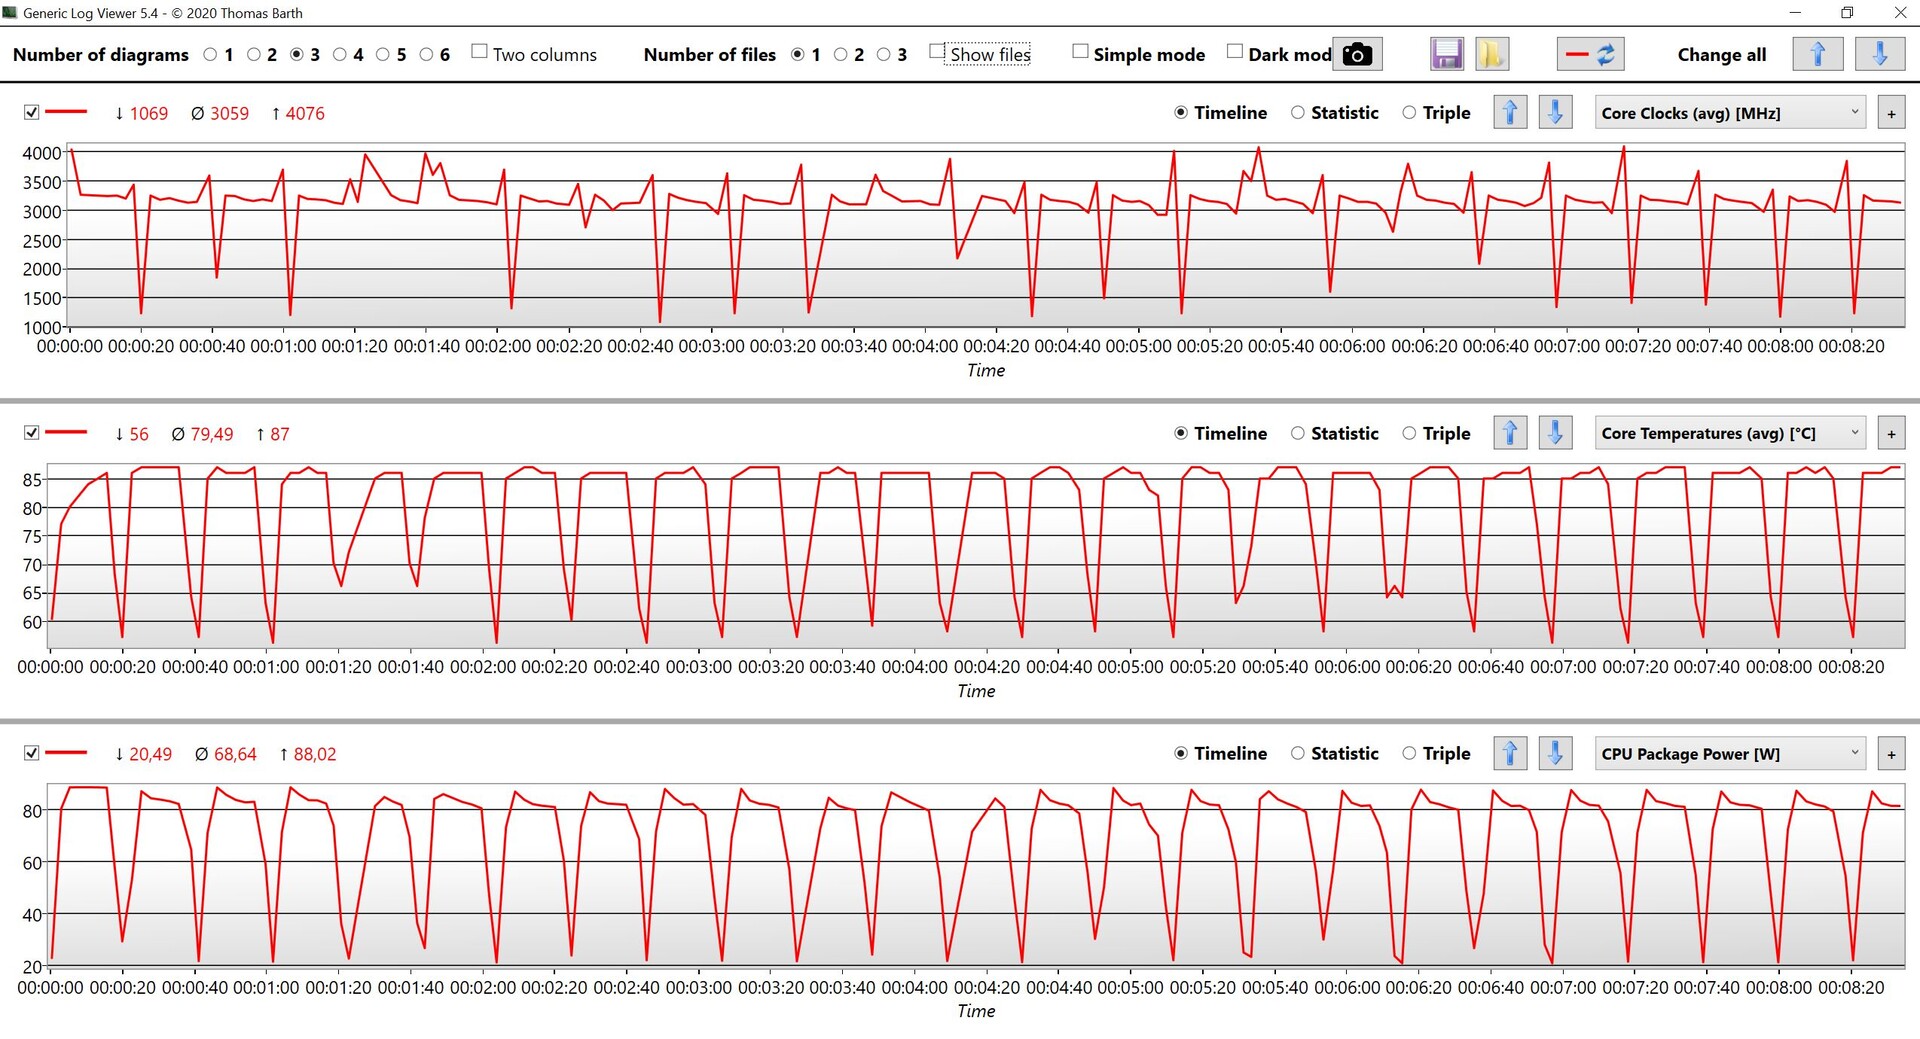
芯片 酷睿i7-12800H结合了6个快速性能核心和8个效率核心。原则上,这对应于普通的 酷睿i7-12700H但实现了最低限度的更高的涡轮频率,也支持英特尔的vPro技术。ZBook Studio 16 G9的性能值非常好,因为该处理器能够消耗最大的88瓦,在持续负载下达到70瓦的水平。在我们的Cinebench R15循环中,该处理器恢复得非常快,而且还能很好地利用高涡轮增压时钟。单核结果也很好。把所有的CPU基准测试放在一起,新机型比之前的机型快30%。 ZBook Studio 15 G8配备的 酷睿i9-11950H.
在电池供电的情况下,该处理器最多可消耗60瓦,这就是为什么多核性能略低(-18%)。这里有更多的CPU基准测试。
Cinebench R15 Multi Sustained Load
Cinebench R23: Multi Core | Single Core
Cinebench R20: CPU (Multi Core) | CPU (Single Core)
Cinebench R15: CPU Multi 64Bit | CPU Single 64Bit
Blender: v2.79 BMW27 CPU
7-Zip 18.03: 7z b 4 | 7z b 4 -mmt1
Geekbench 5.5: Multi-Core | Single-Core
HWBOT x265 Benchmark v2.2: 4k Preset
LibreOffice : 20 Documents To PDF
R Benchmark 2.5: Overall mean
| CPU Performance rating | |
| Average of class Workstation | |
| HP ZBook Studio 16 G9 62U04EA | |
| Average Intel Core i7-12800H | |
| Apple MacBook Pro 16 2021 M1 Max -5! | |
| HP ZBook Studio 15 G8 | |
| Lenovo ThinkPad P1 G4-20Y4Z9DVUS | |
| Dell Precision 5000 5560 -2! | |
| Cinebench R23 / Multi Core | |
| Average of class Workstation (14621 - 38520, n=23, last 2 years) | |
| HP ZBook Studio 16 G9 62U04EA | |
| Average Intel Core i7-12800H (9777 - 16597, n=5) | |
| Apple MacBook Pro 16 2021 M1 Max | |
| Lenovo ThinkPad P1 G4-20Y4Z9DVUS | |
| HP ZBook Studio 15 G8 | |
| Dell Precision 5000 5560 | |
| Cinebench R23 / Single Core | |
| Average of class Workstation (1712 - 2228, n=23, last 2 years) | |
| HP ZBook Studio 16 G9 62U04EA | |
| Average Intel Core i7-12800H (1796 - 1859, n=5) | |
| HP ZBook Studio 15 G8 | |
| Apple MacBook Pro 16 2021 M1 Max | |
| Dell Precision 5000 5560 | |
| Lenovo ThinkPad P1 G4-20Y4Z9DVUS | |
| Cinebench R20 / CPU (Multi Core) | |
| Average of class Workstation (5760 - 15043, n=23, last 2 years) | |
| HP ZBook Studio 16 G9 62U04EA | |
| Average Intel Core i7-12800H (3741 - 6433, n=5) | |
| Lenovo ThinkPad P1 G4-20Y4Z9DVUS | |
| HP ZBook Studio 15 G8 | |
| Dell Precision 5000 5560 | |
| Apple MacBook Pro 16 2021 M1 Max | |
| Cinebench R20 / CPU (Single Core) | |
| Average of class Workstation (671 - 857, n=23, last 2 years) | |
| HP ZBook Studio 16 G9 62U04EA | |
| Average Intel Core i7-12800H (690 - 714, n=5) | |
| HP ZBook Studio 15 G8 | |
| Lenovo ThinkPad P1 G4-20Y4Z9DVUS | |
| Dell Precision 5000 5560 | |
| Apple MacBook Pro 16 2021 M1 Max | |
| Cinebench R15 / CPU Multi 64Bit | |
| Average of class Workstation (2489 - 5810, n=23, last 2 years) | |
| HP ZBook Studio 16 G9 62U04EA | |
| Average Intel Core i7-12800H (1566 - 2697, n=5) | |
| Lenovo ThinkPad P1 G4-20Y4Z9DVUS | |
| HP ZBook Studio 15 G8 | |
| Apple MacBook Pro 16 2021 M1 Max | |
| Dell Precision 5000 5560 | |
| Cinebench R15 / CPU Single 64Bit | |
| Average of class Workstation (191.4 - 328, n=23, last 2 years) | |
| HP ZBook Studio 16 G9 62U04EA | |
| Average Intel Core i7-12800H (242 - 269, n=5) | |
| HP ZBook Studio 15 G8 | |
| Dell Precision 5000 5560 | |
| Lenovo ThinkPad P1 G4-20Y4Z9DVUS | |
| Apple MacBook Pro 16 2021 M1 Max | |
| Blender / v2.79 BMW27 CPU | |
| Dell Precision 5000 5560 | |
| HP ZBook Studio 15 G8 | |
| Lenovo ThinkPad P1 G4-20Y4Z9DVUS | |
| Average Intel Core i7-12800H (192 - 306, n=5) | |
| HP ZBook Studio 16 G9 62U04EA | |
| Apple MacBook Pro 16 2021 M1 Max | |
| Average of class Workstation (91 - 222, n=23, last 2 years) | |
| 7-Zip 18.03 / 7z b 4 | |
| Average of class Workstation (60489 - 116969, n=23, last 2 years) | |
| HP ZBook Studio 16 G9 62U04EA | |
| Average Intel Core i7-12800H (44553 - 68930, n=5) | |
| Lenovo ThinkPad P1 G4-20Y4Z9DVUS | |
| HP ZBook Studio 15 G8 | |
| Dell Precision 5000 5560 | |
| 7-Zip 18.03 / 7z b 4 -mmt1 | |
| Average of class Workstation (5126 - 6960, n=23, last 2 years) | |
| HP ZBook Studio 16 G9 62U04EA | |
| Average Intel Core i7-12800H (5726 - 5976, n=5) | |
| HP ZBook Studio 15 G8 | |
| Dell Precision 5000 5560 | |
| Lenovo ThinkPad P1 G4-20Y4Z9DVUS | |
| Geekbench 5.5 / Multi-Core | |
| Average of class Workstation (11542 - 25554, n=23, last 2 years) | |
| HP ZBook Studio 16 G9 62U04EA | |
| Apple MacBook Pro 16 2021 M1 Max | |
| Average Intel Core i7-12800H (9607 - 12940, n=5) | |
| Lenovo ThinkPad P1 G4-20Y4Z9DVUS | |
| HP ZBook Studio 15 G8 | |
| Geekbench 5.5 / Single-Core | |
| Average of class Workstation (1783 - 2183, n=23, last 2 years) | |
| HP ZBook Studio 16 G9 62U04EA | |
| Average Intel Core i7-12800H (1739 - 1842, n=5) | |
| Apple MacBook Pro 16 2021 M1 Max | |
| HP ZBook Studio 15 G8 | |
| Lenovo ThinkPad P1 G4-20Y4Z9DVUS | |
| HWBOT x265 Benchmark v2.2 / 4k Preset | |
| Average of class Workstation (17.8 - 40.5, n=23, last 2 years) | |
| HP ZBook Studio 16 G9 62U04EA | |
| Average Intel Core i7-12800H (11.7 - 19.4, n=5) | |
| HP ZBook Studio 15 G8 | |
| Lenovo ThinkPad P1 G4-20Y4Z9DVUS | |
| Dell Precision 5000 5560 | |
| LibreOffice / 20 Documents To PDF | |
| Lenovo ThinkPad P1 G4-20Y4Z9DVUS | |
| HP ZBook Studio 15 G8 | |
| Dell Precision 5000 5560 | |
| Average of class Workstation (37.1 - 74.7, n=23, last 2 years) | |
| Average Intel Core i7-12800H (41.3 - 51.5, n=5) | |
| HP ZBook Studio 16 G9 62U04EA | |
| R Benchmark 2.5 / Overall mean | |
| Lenovo ThinkPad P1 G4-20Y4Z9DVUS | |
| HP ZBook Studio 15 G8 | |
| Dell Precision 5000 5560 | |
| Average Intel Core i7-12800H (0.4442 - 0.4715, n=5) | |
| HP ZBook Studio 16 G9 62U04EA | |
| Average of class Workstation (0.3825 - 0.603, n=23, last 2 years) | |
* ... smaller is better
AIDA64: FP32 Ray-Trace | FPU Julia | CPU SHA3 | CPU Queen | FPU SinJulia | FPU Mandel | CPU AES | CPU ZLib | FP64 Ray-Trace | CPU PhotoWorxx
| Performance rating | |
| Average of class Workstation | |
| HP ZBook Studio 16 G9 62U04EA | |
| HP ZBook Studio 15 G8 | |
| Lenovo ThinkPad P1 G4-20Y4Z9DVUS | |
| Average Intel Core i7-12800H | |
| AIDA64 / FP32 Ray-Trace | |
| Average of class Workstation (16730 - 61611, n=23, last 2 years) | |
| Lenovo ThinkPad P1 G4-20Y4Z9DVUS | |
| HP ZBook Studio 16 G9 62U04EA | |
| HP ZBook Studio 15 G8 | |
| Average Intel Core i7-12800H (5839 - 15206, n=5) | |
| AIDA64 / FPU Julia | |
| Average of class Workstation (89597 - 186971, n=23, last 2 years) | |
| HP ZBook Studio 16 G9 62U04EA | |
| Lenovo ThinkPad P1 G4-20Y4Z9DVUS | |
| HP ZBook Studio 15 G8 | |
| Average Intel Core i7-12800H (27801 - 80002, n=5) | |
| AIDA64 / CPU SHA3 | |
| Average of class Workstation (4178 - 8975, n=23, last 2 years) | |
| Lenovo ThinkPad P1 G4-20Y4Z9DVUS | |
| HP ZBook Studio 15 G8 | |
| HP ZBook Studio 16 G9 62U04EA | |
| Average Intel Core i7-12800H (2013 - 3684, n=5) | |
| AIDA64 / CPU Queen | |
| Average of class Workstation (60778 - 144411, n=23, last 2 years) | |
| HP ZBook Studio 16 G9 62U04EA | |
| HP ZBook Studio 15 G8 | |
| Average Intel Core i7-12800H (85965 - 108084, n=5) | |
| Lenovo ThinkPad P1 G4-20Y4Z9DVUS | |
| AIDA64 / FPU SinJulia | |
| Average of class Workstation (8165 - 29343, n=23, last 2 years) | |
| HP ZBook Studio 15 G8 | |
| Lenovo ThinkPad P1 G4-20Y4Z9DVUS | |
| HP ZBook Studio 16 G9 62U04EA | |
| Average Intel Core i7-12800H (7027 - 9658, n=5) | |
| AIDA64 / FPU Mandel | |
| Average of class Workstation (44497 - 98153, n=23, last 2 years) | |
| HP ZBook Studio 16 G9 62U04EA | |
| Lenovo ThinkPad P1 G4-20Y4Z9DVUS | |
| HP ZBook Studio 15 G8 | |
| Average Intel Core i7-12800H (15765 - 38179, n=5) | |
| AIDA64 / CPU AES | |
| Average of class Workstation (73133 - 187841, n=23, last 2 years) | |
| Lenovo ThinkPad P1 G4-20Y4Z9DVUS | |
| HP ZBook Studio 15 G8 | |
| HP ZBook Studio 16 G9 62U04EA | |
| Average Intel Core i7-12800H (55371 - 73928, n=5) | |
| AIDA64 / CPU ZLib | |
| Average of class Workstation (929 - 2148, n=23, last 2 years) | |
| HP ZBook Studio 16 G9 62U04EA | |
| Average Intel Core i7-12800H (701 - 1047, n=5) | |
| Lenovo ThinkPad P1 G4-20Y4Z9DVUS | |
| HP ZBook Studio 15 G8 | |
| AIDA64 / FP64 Ray-Trace | |
| Average of class Workstation (8545 - 32891, n=23, last 2 years) | |
| HP ZBook Studio 16 G9 62U04EA | |
| Lenovo ThinkPad P1 G4-20Y4Z9DVUS | |
| HP ZBook Studio 15 G8 | |
| Average Intel Core i7-12800H (3257 - 8559, n=5) | |
| AIDA64 / CPU PhotoWorxx | |
| Average of class Workstation (37151 - 93684, n=23, last 2 years) | |
| HP ZBook Studio 16 G9 62U04EA | |
| Average Intel Core i7-12800H (31329 - 40992, n=5) | |
| HP ZBook Studio 15 G8 | |
| Lenovo ThinkPad P1 G4-20Y4Z9DVUS | |
系统性能
ZBook Studio 16 G9是一个非常强大和反应迅速的设备,这也被良好的基准测试结果所证实。在测试中没有发现任何问题。
CrossMark: Overall | Productivity | Creativity | Responsiveness
| PCMark 10 / Score | |
| Average of class Workstation (6563 - 10409, n=19, last 2 years) | |
| HP ZBook Studio 15 G8 | |
| Dell Precision 5000 5560 | |
| HP ZBook Studio 16 G9 62U04EA | |
| Average Intel Core i7-12800H, NVIDIA RTX A2000 Laptop GPU (n=1) | |
| Lenovo ThinkPad P1 G4-20Y4Z9DVUS | |
| PCMark 10 / Essentials | |
| Dell Precision 5000 5560 | |
| Average of class Workstation (9622 - 11157, n=19, last 2 years) | |
| Lenovo ThinkPad P1 G4-20Y4Z9DVUS | |
| HP ZBook Studio 15 G8 | |
| HP ZBook Studio 16 G9 62U04EA | |
| Average Intel Core i7-12800H, NVIDIA RTX A2000 Laptop GPU (n=1) | |
| PCMark 10 / Productivity | |
| Average of class Workstation (8789 - 20616, n=19, last 2 years) | |
| Dell Precision 5000 5560 | |
| HP ZBook Studio 15 G8 | |
| Lenovo ThinkPad P1 G4-20Y4Z9DVUS | |
| HP ZBook Studio 16 G9 62U04EA | |
| Average Intel Core i7-12800H, NVIDIA RTX A2000 Laptop GPU (n=1) | |
| PCMark 10 / Digital Content Creation | |
| Average of class Workstation (8108 - 15631, n=19, last 2 years) | |
| HP ZBook Studio 15 G8 | |
| HP ZBook Studio 16 G9 62U04EA | |
| Average Intel Core i7-12800H, NVIDIA RTX A2000 Laptop GPU (n=1) | |
| Dell Precision 5000 5560 | |
| Lenovo ThinkPad P1 G4-20Y4Z9DVUS | |
| CrossMark / Overall | |
| Average of class Workstation (1307 - 2267, n=22, last 2 years) | |
| HP ZBook Studio 16 G9 62U04EA | |
| Average Intel Core i7-12800H, NVIDIA RTX A2000 Laptop GPU (n=1) | |
| Apple MacBook Pro 16 2021 M1 Max | |
| Lenovo ThinkPad P1 G4-20Y4Z9DVUS | |
| CrossMark / Productivity | |
| Average of class Workstation (1130 - 2122, n=22, last 2 years) | |
| HP ZBook Studio 16 G9 62U04EA | |
| Average Intel Core i7-12800H, NVIDIA RTX A2000 Laptop GPU (n=1) | |
| Lenovo ThinkPad P1 G4-20Y4Z9DVUS | |
| Apple MacBook Pro 16 2021 M1 Max | |
| CrossMark / Creativity | |
| Average of class Workstation (1657 - 2725, n=22, last 2 years) | |
| Apple MacBook Pro 16 2021 M1 Max | |
| HP ZBook Studio 16 G9 62U04EA | |
| Average Intel Core i7-12800H, NVIDIA RTX A2000 Laptop GPU (n=1) | |
| Lenovo ThinkPad P1 G4-20Y4Z9DVUS | |
| CrossMark / Responsiveness | |
| Average of class Workstation (993 - 2096, n=22, last 2 years) | |
| HP ZBook Studio 16 G9 62U04EA | |
| Average Intel Core i7-12800H, NVIDIA RTX A2000 Laptop GPU (n=1) | |
| Lenovo ThinkPad P1 G4-20Y4Z9DVUS | |
| Apple MacBook Pro 16 2021 M1 Max | |
| PCMark 10 Score | 6321 points | |
Help | ||
| AIDA64 / Memory Copy | |
| Average of class Workstation (56003 - 164795, n=23, last 2 years) | |
| HP ZBook Studio 16 G9 62U04EA | |
| Average Intel Core i7-12800H (48643 - 62522, n=5) | |
| HP ZBook Studio 15 G8 | |
| Lenovo ThinkPad P1 G4-20Y4Z9DVUS | |
| AIDA64 / Memory Read | |
| Average of class Workstation (55795 - 121563, n=23, last 2 years) | |
| HP ZBook Studio 16 G9 62U04EA | |
| Average Intel Core i7-12800H (56629 - 66199, n=5) | |
| HP ZBook Studio 15 G8 | |
| Lenovo ThinkPad P1 G4-20Y4Z9DVUS | |
| AIDA64 / Memory Write | |
| Average of class Workstation (55663 - 214520, n=23, last 2 years) | |
| HP ZBook Studio 16 G9 62U04EA | |
| Average Intel Core i7-12800H (50923 - 66074, n=5) | |
| HP ZBook Studio 15 G8 | |
| Lenovo ThinkPad P1 G4-20Y4Z9DVUS | |
| AIDA64 / Memory Latency | |
| Average of class Workstation (84.5 - 165.2, n=23, last 2 years) | |
| HP ZBook Studio 16 G9 62U04EA | |
| Lenovo ThinkPad P1 G4-20Y4Z9DVUS | |
| HP ZBook Studio 15 G8 | |
| Average Intel Core i7-12800H (89.3 - 95.2, n=5) | |
* ... smaller is better
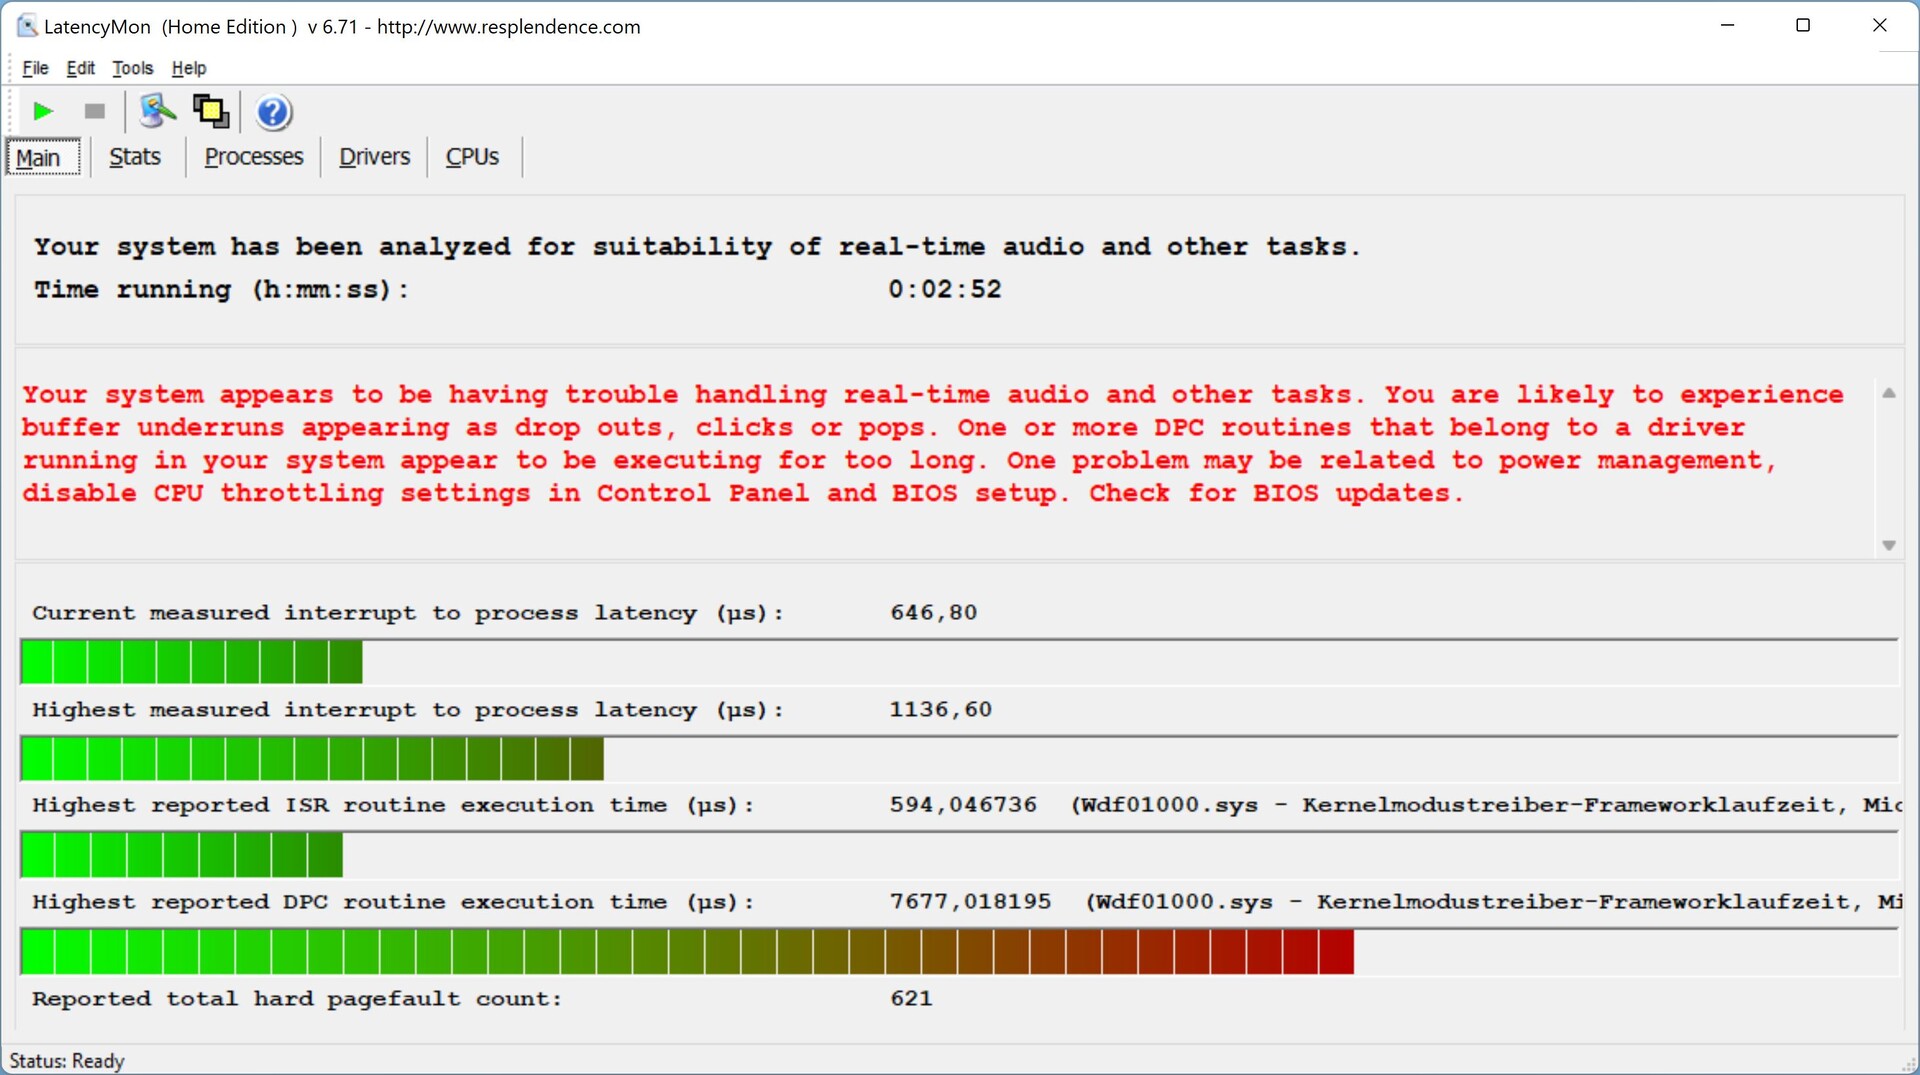
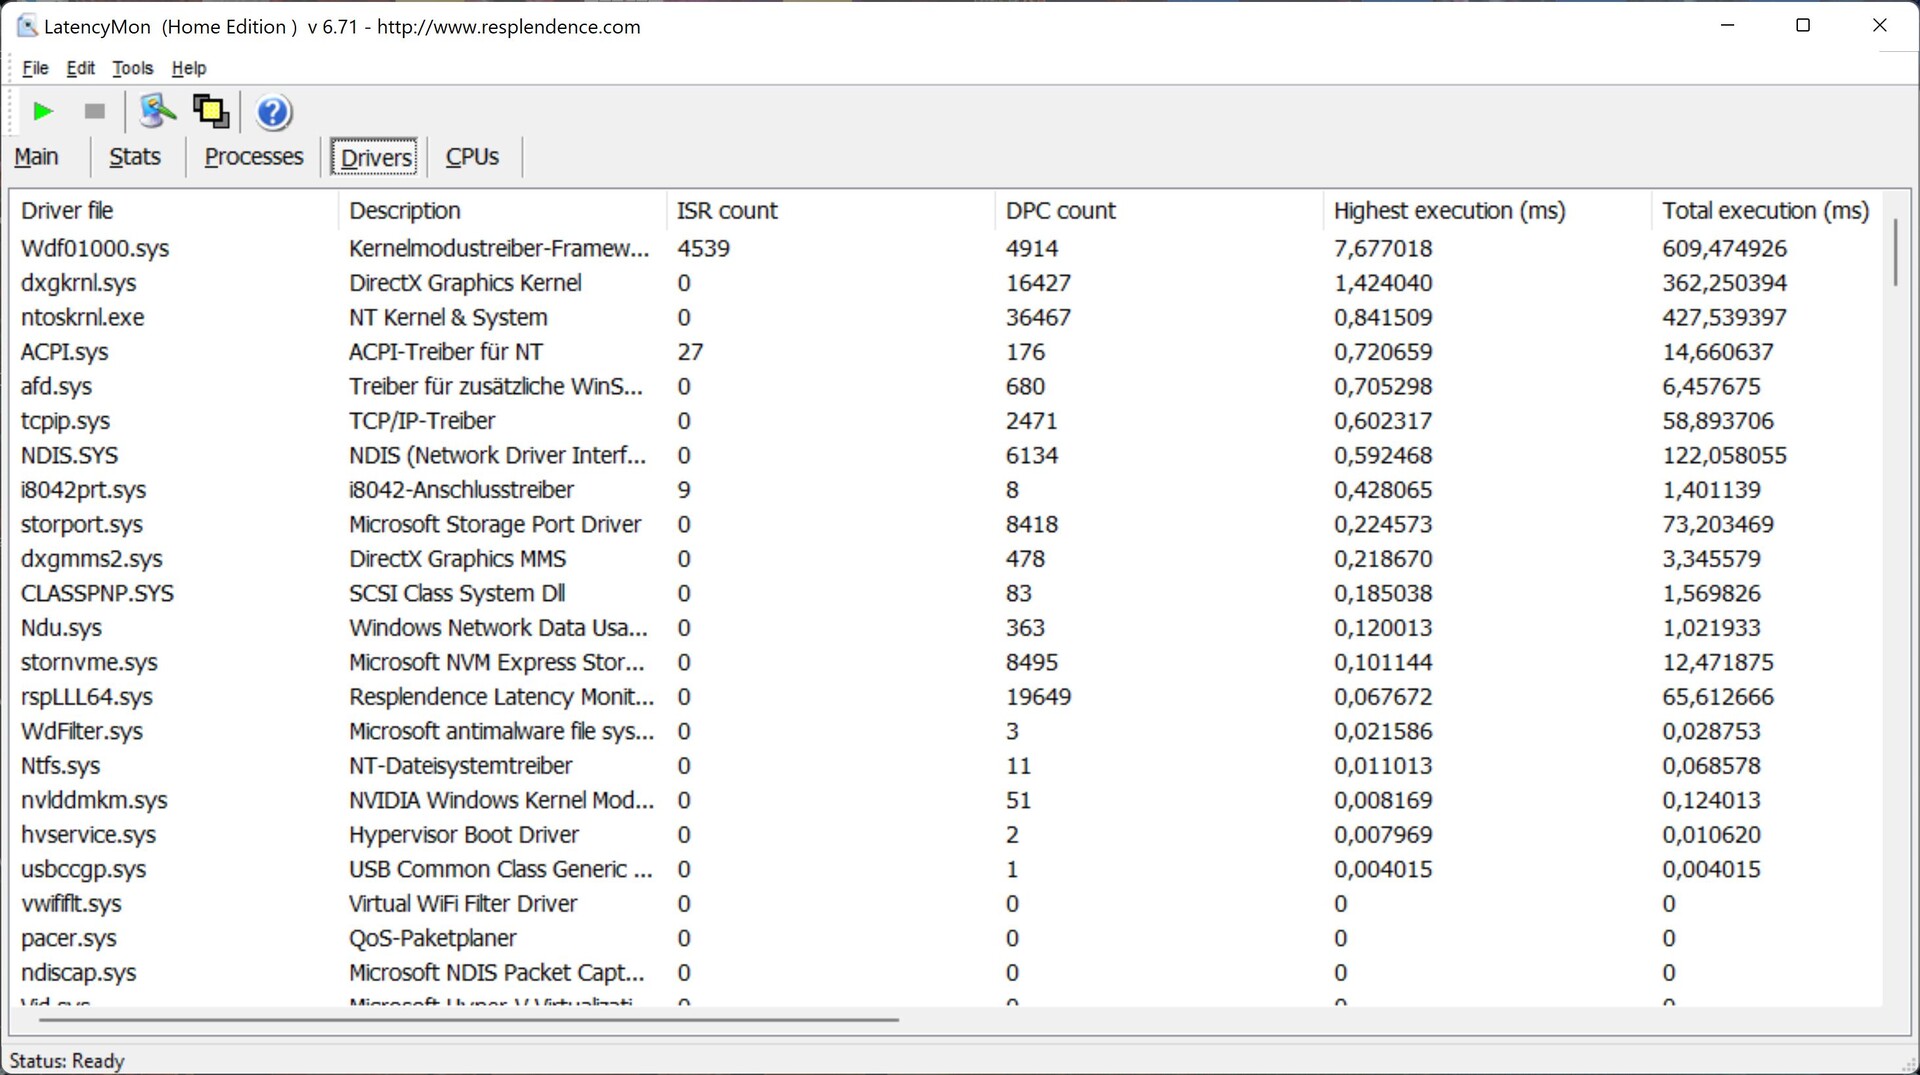
DPC延时
我们评测设备中的当前BIOS版本在我们的标准化延迟测试中显示出轻微的局限性(网页浏览、4K YouTube播放、CPU负载),因此并非最适合实时音频应用。
| DPC Latencies / LatencyMon - interrupt to process latency (max), Web, Youtube, Prime95 | |
| HP ZBook Studio 15 G8 | |
| Lenovo ThinkPad P1 G4-20Y4Z9DVUS | |
| HP ZBook Studio 16 G9 62U04EA | |
| Dell Precision 5000 5560 | |
* ... smaller is better
存储设备
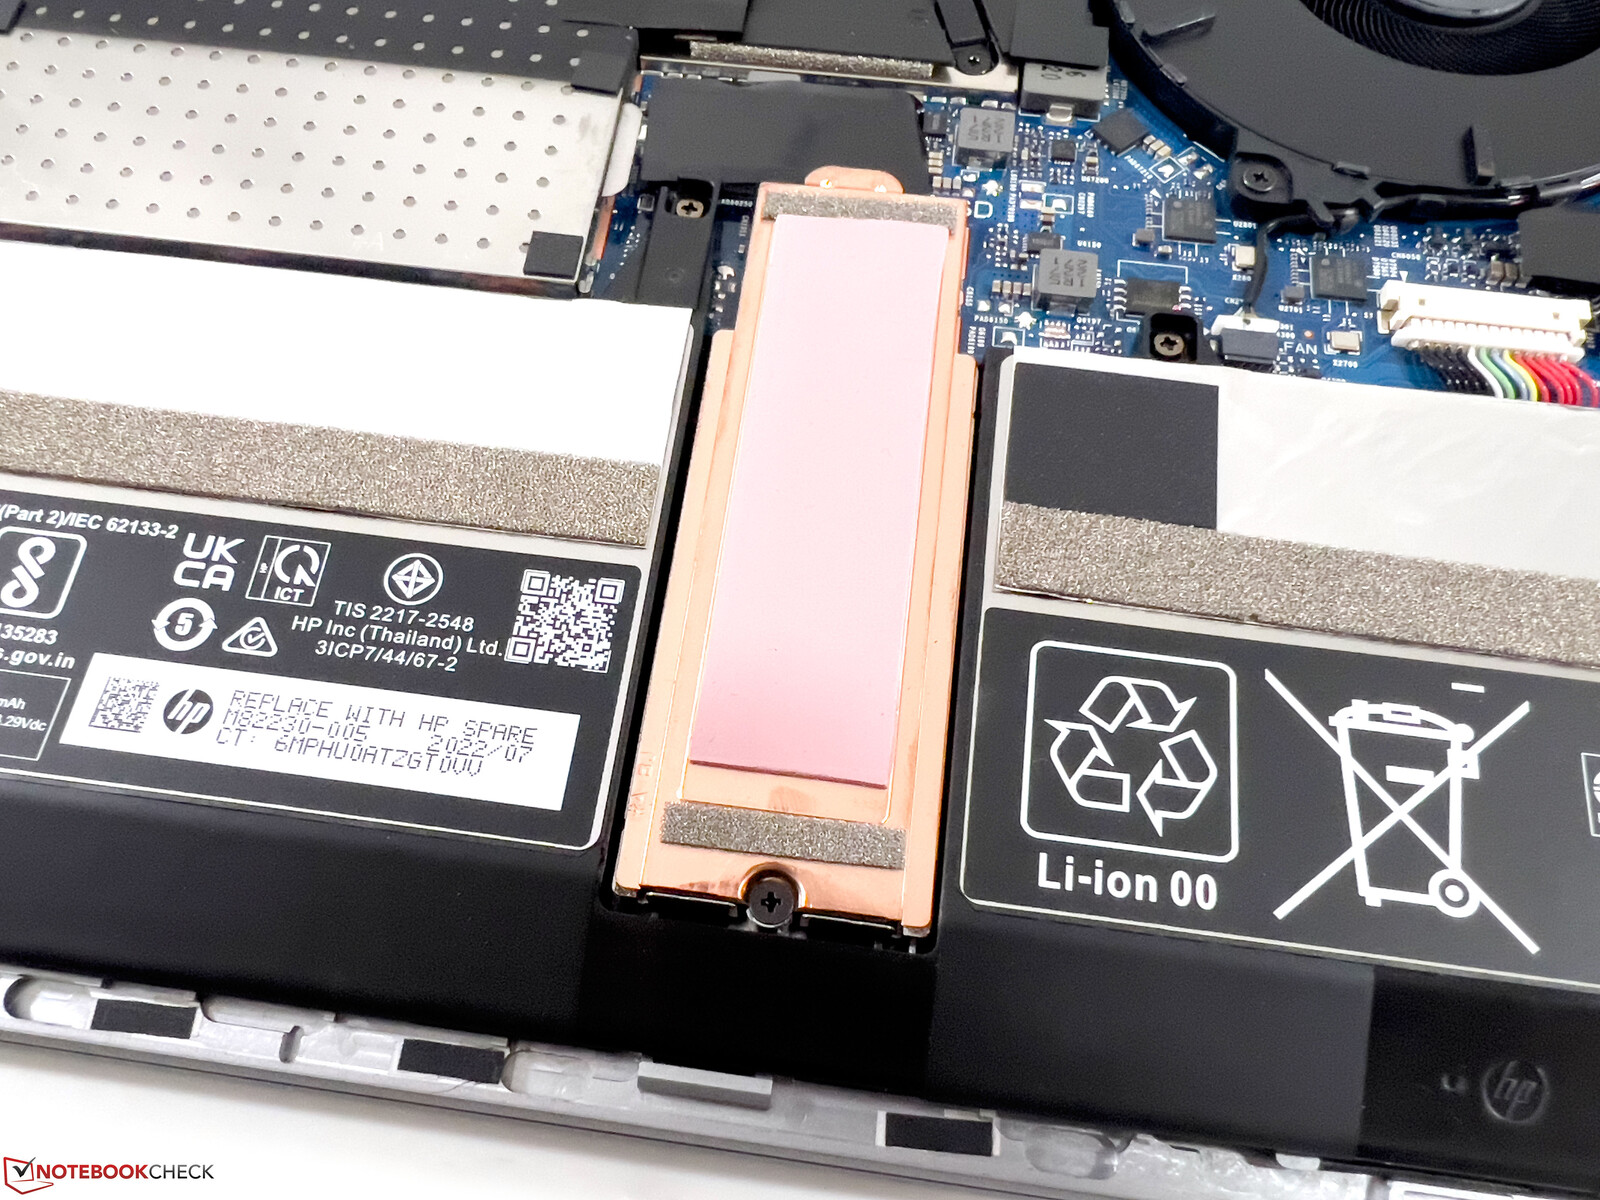
惠普使用快速的PCIe 4.0 Micron 3400固态硬盘,存储容量为1TB(首次启动后可用880GB)。传输速率非常高,即使在永久性负载下,几分钟后也只有极小的性能下降,但这在实践中并不重要。更多的SSD基准测试可在 这里.

* ... smaller is better
Sustained Read Performance: DiskSpd Read Loop, Queue Depth 8
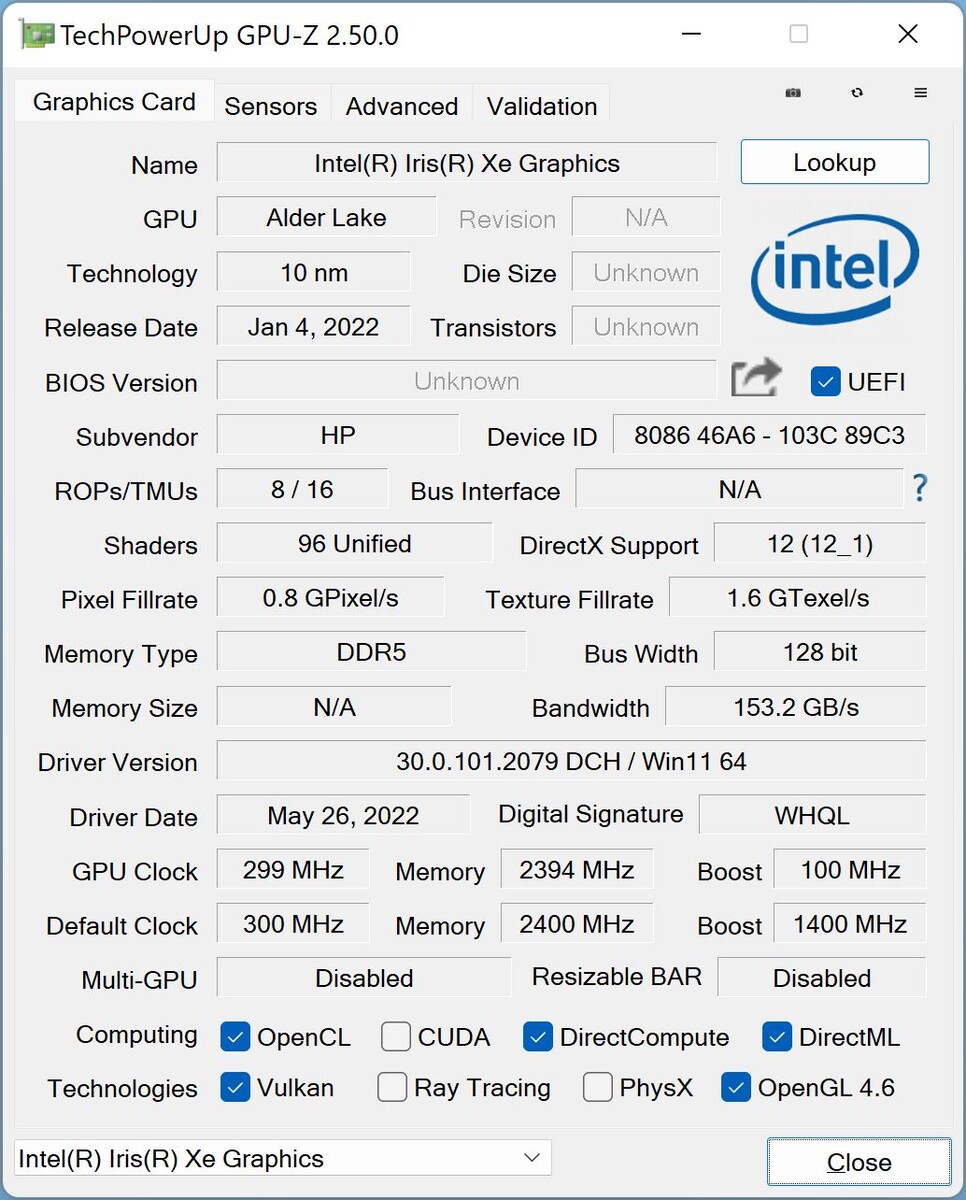
显卡 - Nvidia RTX A2000
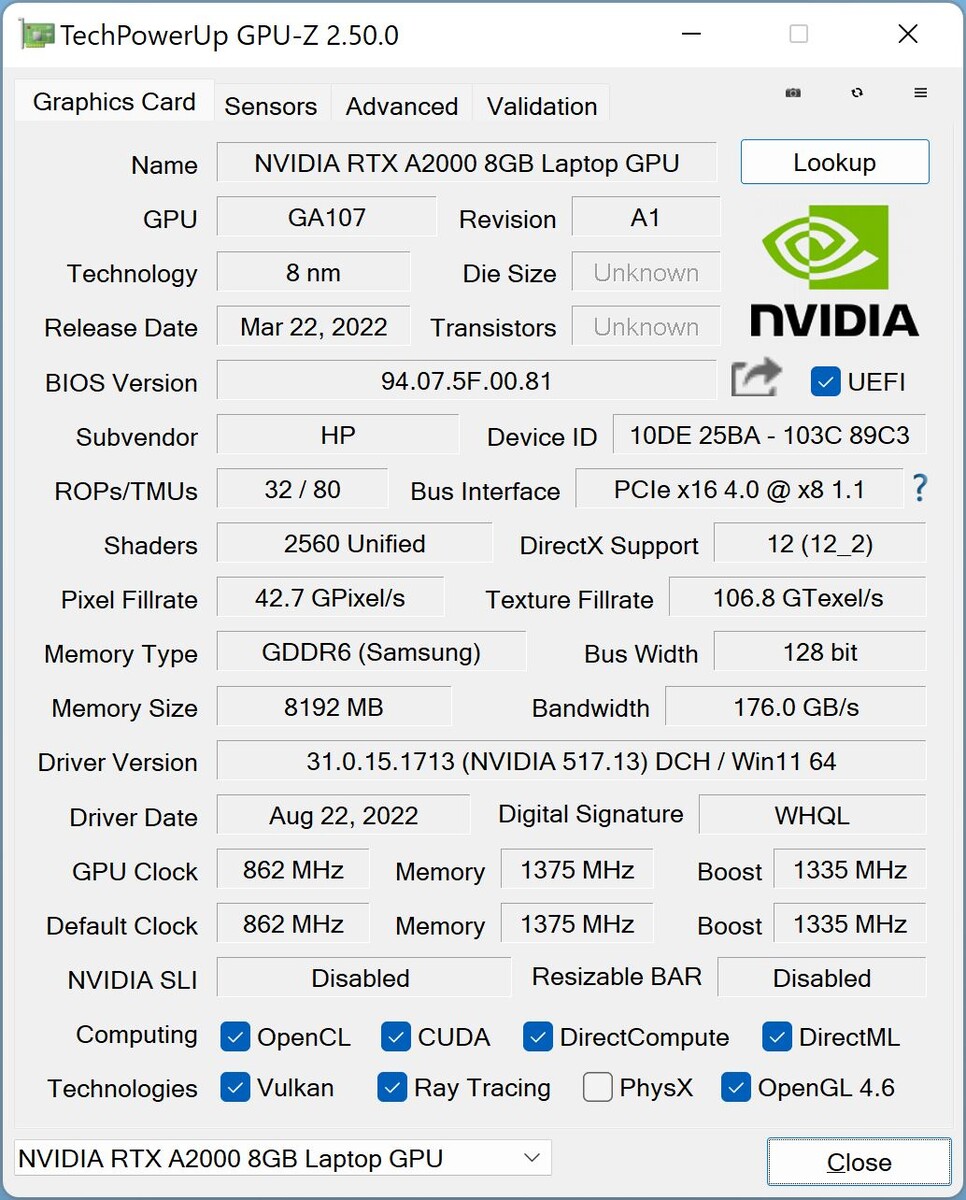
的 英伟达RTX A2000是一款基于GA107芯片的专业GPU,与 GeForce RTX 3050 Ti。尽管名称相同,但RTX A2000在今年得到了升级:它现在不再是4GB GDDR6 VRAM,而是8GB VRAM,速度略高。
惠普使用45瓦的RTX A2000版本,其中有额外的5瓦可供处理器使用。这使得它成为较慢的版本之一,在我们的数据库中这种GPU的平均得分也略高。就原始性能而言,ZBook Studio 16 G9中的RTX A2000大致上可以与M1-Pro-GPU中的 MacBook Pro 16.
而 RTX 3070的RTX 3070在原始性能方面当然更胜一筹,但在专业测试中,由于有专业驱动程序,RTX A2000偶尔会有明显的优势。此外,RTX A2000的性能在永久负载下保持完全稳定,这在3DMark压力测试以及我们的Witcher 3 循环中都很明显。ZBook也可以进行游戏;根据标题的不同,它经常为全高清的高细节提供足够的动力。
在电池供电的情况下,GPU的功耗被限制在35瓦,这相当于20%左右的赤字。更多的GPU基准测试被列在 我们的技术部分.
| 3DMark Performance rating - Percent | |
| Average of class Workstation -1! | |
| Apple MacBook Pro 16 2021 M1 Max -21! | |
| Average NVIDIA RTX A2000 Laptop GPU | |
| HP ZBook Studio 15 G8 -11! | |
| Dell Precision 5000 5560 -3! | |
| HP ZBook Studio 16 G9 62U04EA | |
| Apple MacBook Pro 16 2021 M1 Pro -21! | |
| Lenovo ThinkPad P1 G4-20Y4Z9DVUS -1! | |
| 3DMark 11 Performance | 18475 points | |
| 3DMark Fire Strike Score | 12211 points | |
| 3DMark Time Spy Score | 5523 points | |
Help | ||
* ... smaller is better
Witcher 3 FPS chart
| low | med. | high | ultra | QHD | 4K | |
|---|---|---|---|---|---|---|
| GTA V (2015) | 185.7 | 181.1 | 146.3 | 72.1 | 51.8 | 44.1 |
| The Witcher 3 (2015) | 282 | 188 | 103 | 48.8 | 33 | |
| Dota 2 Reborn (2015) | 181.5 | 166.9 | 157.4 | 149.4 | 72.3 | |
| Final Fantasy XV Benchmark (2018) | 141.7 | 78 | 56.4 | 41 | 23.1 | |
| X-Plane 11.11 (2018) | 138.8 | 119 | 97 | 76.5 | ||
| Far Cry 5 (2018) | 165 | 96 | 88 | 83 | 57 | 26 |
| Strange Brigade (2018) | 289 | 134 | 106 | 92 | 66 | 35 |
| F1 2021 (2021) | 290 | 166 | 138.5 | 68.4 | 48.3 | 25.7 |
| Cyberpunk 2077 1.6 (2022) | 69 | 59 | 44 | 37 | 23 | |
| F1 22 (2022) | 155.4 | 147.8 | 111.6 | 33.6 | 20.7 | 9.76 |
排放 - 带有非常好的扬声器的Zbook
噪声
ZBook Studio 16 G9的两个风扇启动得很快,即使在低负载情况下也是如此,被动冷却系统的整体性能不是很好。甚至在打开网络浏览器时,风扇也启动了。在更高的负载下,风扇加速非常快:我们在综合负载下测量到45-48 dB(A)之间。有趣的是,在CPU原始负载为51 dB(A)的情况下,风扇的声音甚至有点大。没有检测到任何电子噪音。
Noise level
| Idle |
| 24 / 27.7 / 27.7 dB(A) |
| Load |
| 39.8 / 47.7 dB(A) |
 | ||
30 dB silent 40 dB(A) audible 50 dB(A) loud |
||
min: | ||
| HP ZBook Studio 16 G9 62U04EA RTX A2000 Laptop GPU, i7-12800H, Micron 3400 1TB MTFDKBA1T0TFH | Lenovo ThinkPad P1 G4-20Y4Z9DVUS T1200 Laptop GPU, i7-11800H, Samsung PM9A1 MZVL2512HCJQ | Apple MacBook Pro 16 2021 M1 Max M1 Max 32-Core GPU, M1 Max, Apple SSD AP2048R | Dell Precision 5000 5560 RTX A2000 Laptop GPU, i7-11850H, Samsung PM9A1 MZVL22T0HBLB | HP ZBook Studio 15 G8 GeForce RTX 3070 Laptop GPU, i9-11950H, Samsung PM981a MZVLB2T0HALB | |
|---|---|---|---|---|---|
| Noise | -1% | 5% | 13% | -1% | |
| off / environment * (dB) | 24 | 24.3 -1% | 24.2 -1% | 23.4 2% | 23.5 2% |
| Idle Minimum * (dB) | 24 | 24.3 -1% | 24.2 -1% | 23.6 2% | 25.3 -5% |
| Idle Average * (dB) | 27.7 | 24.3 12% | 24.2 13% | 23.6 15% | 25.3 9% |
| Idle Maximum * (dB) | 27.7 | 26.6 4% | 24.2 13% | 23.6 15% | 25.3 9% |
| Load Average * (dB) | 39.8 | 46.8 -18% | 42.9 -8% | 25.8 35% | 41.2 -4% |
| Witcher 3 ultra * (dB) | 44.3 | 46.8 -6% | 39.5 11% | 40.1 9% | 49.4 -12% |
| Load Maximum * (dB) | 47.7 | 46.8 2% | 42.9 10% | 41.4 13% | 49.4 -4% |
* ... smaller is better
温度
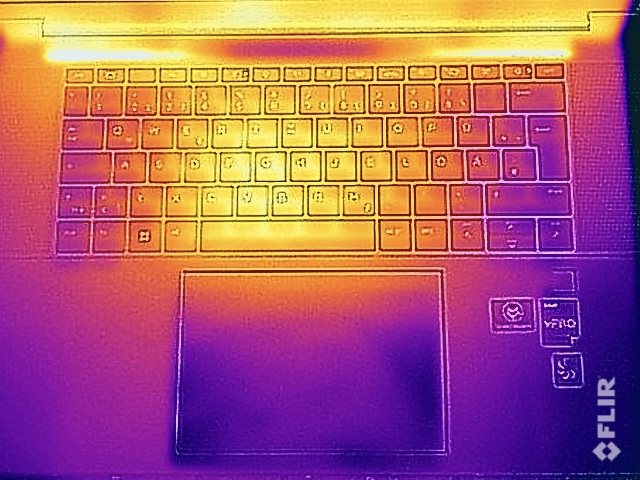
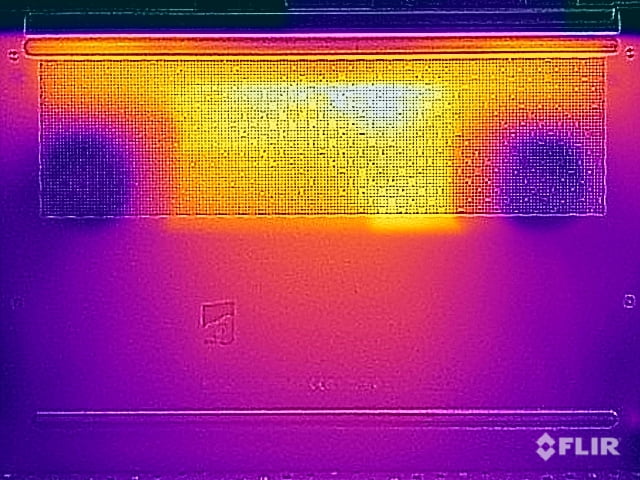
惠普将新的ZBook Studio 16 G9的表面温度控制得很好。在低负载情况下,机箱几乎没有发热,整个键盘区域保持着宜人的温度,即使在最大负载情况下,最高温度也只有不到36℃。它的底部变得有点热,你应该注意避免皮肤接触中间区域的热点(~53℃),但这里没有一般的限制。
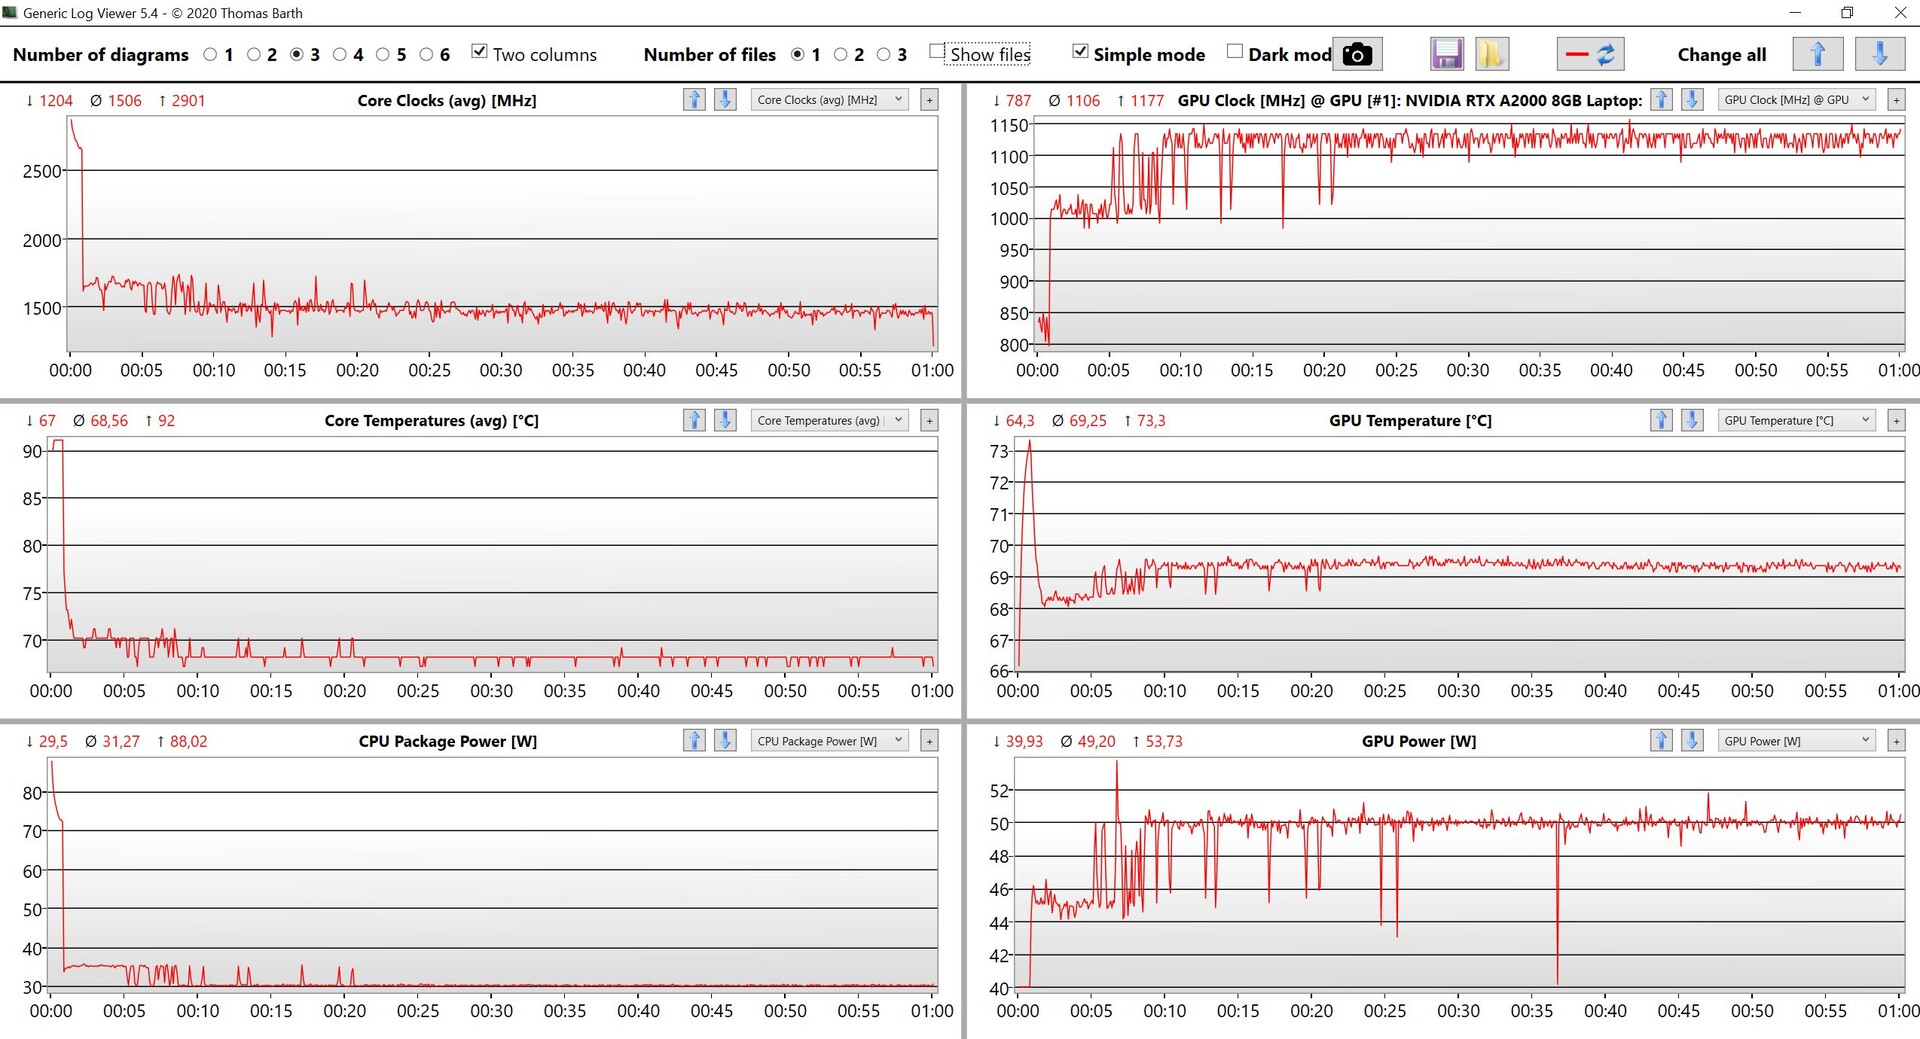
在压力测试中,处理器最初的功率为35瓦,显卡的功率为45瓦。然而,这一比例在进一步的测试过程中发生了变化,处理器下降到30瓦,而GPU同时上升到50瓦。这证实了冷却系统能够保持总共约80瓦的永久冷却。不幸的是,我们不能对使用更强的显卡的配置做出任何声明(从 RTX A3000到 GeForce RTX 3060),因为这里使用的是更强的Vapor-Chamber冷却。
(+) The maximum temperature on the upper side is 38.7 °C / 102 F, compared to the average of 38.2 °C / 101 F, ranging from 22.2 to 69.8 °C for the class Workstation.
(-) The bottom heats up to a maximum of 53.4 °C / 128 F, compared to the average of 41.1 °C / 106 F
(+) In idle usage, the average temperature for the upper side is 25.9 °C / 79 F, compared to the device average of 32 °C / 90 F.
(+) Playing The Witcher 3, the average temperature for the upper side is 30.6 °C / 87 F, compared to the device average of 32 °C / 90 F.
(+) The palmrests and touchpad are cooler than skin temperature with a maximum of 28.1 °C / 82.6 F and are therefore cool to the touch.
(±) The average temperature of the palmrest area of similar devices was 27.8 °C / 82 F (-0.3 °C / -0.6 F).
| HP ZBook Studio 16 G9 62U04EA Intel Core i7-12800H, NVIDIA RTX A2000 Laptop GPU | Lenovo ThinkPad P1 G4-20Y4Z9DVUS Intel Core i7-11800H, NVIDIA T1200 Laptop GPU | Apple MacBook Pro 16 2021 M1 Max Apple M1 Max, Apple M1 Max 32-Core GPU | Dell Precision 5000 5560 Intel Core i7-11850H, NVIDIA RTX A2000 Laptop GPU | HP ZBook Studio 15 G8 Intel Core i9-11950H, NVIDIA GeForce RTX 3070 Laptop GPU | |
|---|---|---|---|---|---|
| Heat | -3% | 12% | -11% | -5% | |
| Maximum Upper Side * (°C) | 38.7 | 49.9 -29% | 42.3 -9% | 48.2 -25% | 49 -27% |
| Maximum Bottom * (°C) | 53.4 | 56.7 -6% | 41.7 22% | 42.6 20% | 54.2 -1% |
| Idle Upper Side * (°C) | 27.3 | 25.5 7% | 23.9 12% | 34.8 -27% | 26.2 4% |
| Idle Bottom * (°C) | 31.6 | 26.2 17% | 23.9 24% | 35.2 -11% | 30.2 4% |
* ... smaller is better
发言人
如前所述,惠普现在将扬声器放在了键盘旁边,四个模块的性能非常好。声音非常丰满,而且产生了立体声效果。只有低音可以做一些改进,但这将被一些人认为是发散性的。
HP ZBook Studio 16 G9 62U04EA audio analysis
(±) | speaker loudness is average but good (81.6 dB)
Bass 100 - 315 Hz
(±) | reduced bass - on average 8.7% lower than median
(±) | linearity of bass is average (10.4% delta to prev. frequency)
Mids 400 - 2000 Hz
(+) | balanced mids - only 3.7% away from median
(+) | mids are linear (4.6% delta to prev. frequency)
Highs 2 - 16 kHz
(+) | balanced highs - only 2.7% away from median
(+) | highs are linear (3.5% delta to prev. frequency)
Overall 100 - 16.000 Hz
(+) | overall sound is linear (10.6% difference to median)
Compared to same class
» 9% of all tested devices in this class were better, 5% similar, 87% worse
» The best had a delta of 7%, average was 17%, worst was 35%
Compared to all devices tested
» 6% of all tested devices were better, 1% similar, 93% worse
» The best had a delta of 4%, average was 23%, worst was 134%
Apple MacBook Pro 16 2021 M1 Pro audio analysis
(+) | speakers can play relatively loud (84.7 dB)
Bass 100 - 315 Hz
(+) | good bass - only 3.8% away from median
(+) | bass is linear (5.2% delta to prev. frequency)
Mids 400 - 2000 Hz
(+) | balanced mids - only 1.3% away from median
(+) | mids are linear (2.1% delta to prev. frequency)
Highs 2 - 16 kHz
(+) | balanced highs - only 1.9% away from median
(+) | highs are linear (2.7% delta to prev. frequency)
Overall 100 - 16.000 Hz
(+) | overall sound is linear (4.6% difference to median)
Compared to same class
» 0% of all tested devices in this class were better, 0% similar, 100% worse
» The best had a delta of 5%, average was 17%, worst was 45%
Compared to all devices tested
» 0% of all tested devices were better, 0% similar, 100% worse
» The best had a delta of 4%, average was 23%, worst was 134%
电源管理--DreamColor消耗了大量的电力
消耗功率
高分辨率的DreamColor面板需要大量的电力,空闲模式下近19瓦的测量结果证实了这一点。前代产品的4K OLED面板在这方面甚至更加饥饿。负载下没有出现异常情况。
我们测量了186瓦的最大峰值消耗,但这很快就在120瓦左右趋于平稳。因此,附带的200瓦电源是完全足够的。
| Off / Standby | |
| Idle | |
| Load |
|
Key:
min: | |
| HP ZBook Studio 16 G9 62U04EA i7-12800H, RTX A2000 Laptop GPU, Micron 3400 1TB MTFDKBA1T0TFH, IPS, 3840x2400, 16" | Lenovo ThinkPad P1 G4-20Y4Z9DVUS i7-11800H, T1200 Laptop GPU, Samsung PM9A1 MZVL2512HCJQ, IPS, 2560x1600, 16" | Apple MacBook Pro 16 2021 M1 Max M1 Max, M1 Max 32-Core GPU, Apple SSD AP2048R, Mini-LED, 3456x2234, 16.2" | Dell Precision 5000 5560 i7-11850H, RTX A2000 Laptop GPU, Samsung PM9A1 MZVL22T0HBLB, IPS, 3840x2400, 15.6" | HP ZBook Studio 15 G8 i9-11950H, GeForce RTX 3070 Laptop GPU, Samsung PM981a MZVLB2T0HALB, OLED, 3840x2160, 15.6" | Average NVIDIA RTX A2000 Laptop GPU | Average of class Workstation | |
|---|---|---|---|---|---|---|---|
| Power Consumption | 6% | 15% | 12% | -25% | 12% | 4% | |
| Idle Minimum * (Watt) | 7.2 | 9.9 -38% | 5.4 25% | 6.2 14% | 11 -53% | 6.6 ? 8% | 9.11 ? -27% |
| Idle Average * (Watt) | 18.1 | 13.9 23% | 16.4 9% | 13.9 23% | 18.8 -4% | 11.8 ? 35% | 13.8 ? 24% |
| Idle Maximum * (Watt) | 18.5 | 14.6 21% | 16.7 10% | 23.8 -29% | 31.7 -71% | 16.7 ? 10% | 17.9 ? 3% |
| Load Average * (Watt) | 112.8 | 95 16% | 94 17% | 95.7 15% | 105.2 7% | 116.3 ? -3% | 96 ? 15% |
| Witcher 3 ultra * (Watt) | 106.7 | 98.9 7% | 104 3% | 87 18% | 148 -39% | ||
| Load Maximum * (Watt) | 186 | 170.8 8% | 135 27% | 132.6 29% | 171.8 8% | 171.2 ? 8% | 180.3 ? 3% |
* ... smaller is better
Power consumption Witcher 3 / Stress test
Power consumption with an external monitor
电池寿命
尽管有86Wh的大电池,但电池寿命不是特别长。在我们的Wi-Fi测试中,我们记录了4.5-6.5小时,取决于亮度。当然,这对于偶尔的会议来说是完全足够的,但对于在没有电源适配器的情况下完成一个完整的工作日来说是不够的。鉴于这些结果,ZBook Studio 16 G9因此在比较领域中排名靠后。如果你对ZBook Studio感兴趣,并且需要更长的电池寿命,你应该选择带有低功耗显示屏(400尼特)的配置。
设备开机后,电池充满需要2个小时;大约1个小时后就可以使用80%的容量。
| HP ZBook Studio 16 G9 62U04EA i7-12800H, RTX A2000 Laptop GPU, 86 Wh | Lenovo ThinkPad P1 G4-20Y4Z9DVUS i7-11800H, T1200 Laptop GPU, 90 Wh | Apple MacBook Pro 16 2021 M1 Max M1 Max, M1 Max 32-Core GPU, 99.6 Wh | Dell Precision 5000 5560 i7-11850H, RTX A2000 Laptop GPU, 86 Wh | HP ZBook Studio 15 G8 i9-11950H, GeForce RTX 3070 Laptop GPU, 83 Wh | Average of class Workstation | |
|---|---|---|---|---|---|---|
| Battery runtime | 40% | 79% | 32% | 31% | 29% | |
| H.264 (h) | 8.5 | 17 100% | 10.1 ? 19% | |||
| WiFi v1.3 (h) | 6.3 | 8.8 40% | 14.9 137% | 6.3 0% | 6.2 -2% | 8.55 ? 36% |
| Load (h) | 1.1 | 1.1 0% | 1.8 64% | 1.8 64% | 1.441 ? 31% |
Pros
Cons
结论 - ZBook Studio G9是一个坚实的进步
新的ZBook Studio 16 G9在几个方面是一个坚实的提升。惠普的移动工作站笔记本电脑仍然保持着极高的质量,但现在采用新的16:10显示屏,看起来更加现代。此外,板上再次有两个SODIMM插槽,因此可以轻松升级RAM。这里唯一的问题是很难接触到组件。
两个主要组件的性能总体上是好的。酷睿i7处理器受益于高功率限制,Nvidia RTX A2000提供了稳定的性能,即使它是最多50瓦(TGP)的较慢版本之一。然而,传统的冷却方式在综合负载下达到了极限,这就是为什么惠普在具有更强GPU的型号中安装了蒸汽室冷却。120赫兹的DreamColor显示屏提供了非常好的主观画质,在测试中也以准确的色彩给人留下深刻印象,但也需要大量的电力。
惠普ZBook Studio 16 G9是一款高质量和强大的移动工作站,尽管它的外形尺寸为16英寸,但仍然相当灵活
传统上,ZBook Studio不提供专门的数字键盘,键盘旁边的空间被用于(非常好的)音响系统。然而,我们必须在这里提到,较便宜的 ZBook Firefly 16 G9(以及EliteBook 865 G9)的键盘要好一些,也提供数字键盘。另一个批评点,尽管是表面上的,是更昂贵的ZBook Studio 16 G93的打字感觉,它在这里的表现确实不应该差。你还应该记住,在日常使用中,风扇的启动速度也比较快。
我们还没有审查其他当前和竞争的移动工作站,但新的ZBook Studio 16 G9在许多方面都做得很好,总体上是一个非常坚实的包。
价格和可用性
HP ZBook Studio 16 G9 62U04EA
- 11/10/2022 v7 (old)
Andreas Osthoff
Price comparison

