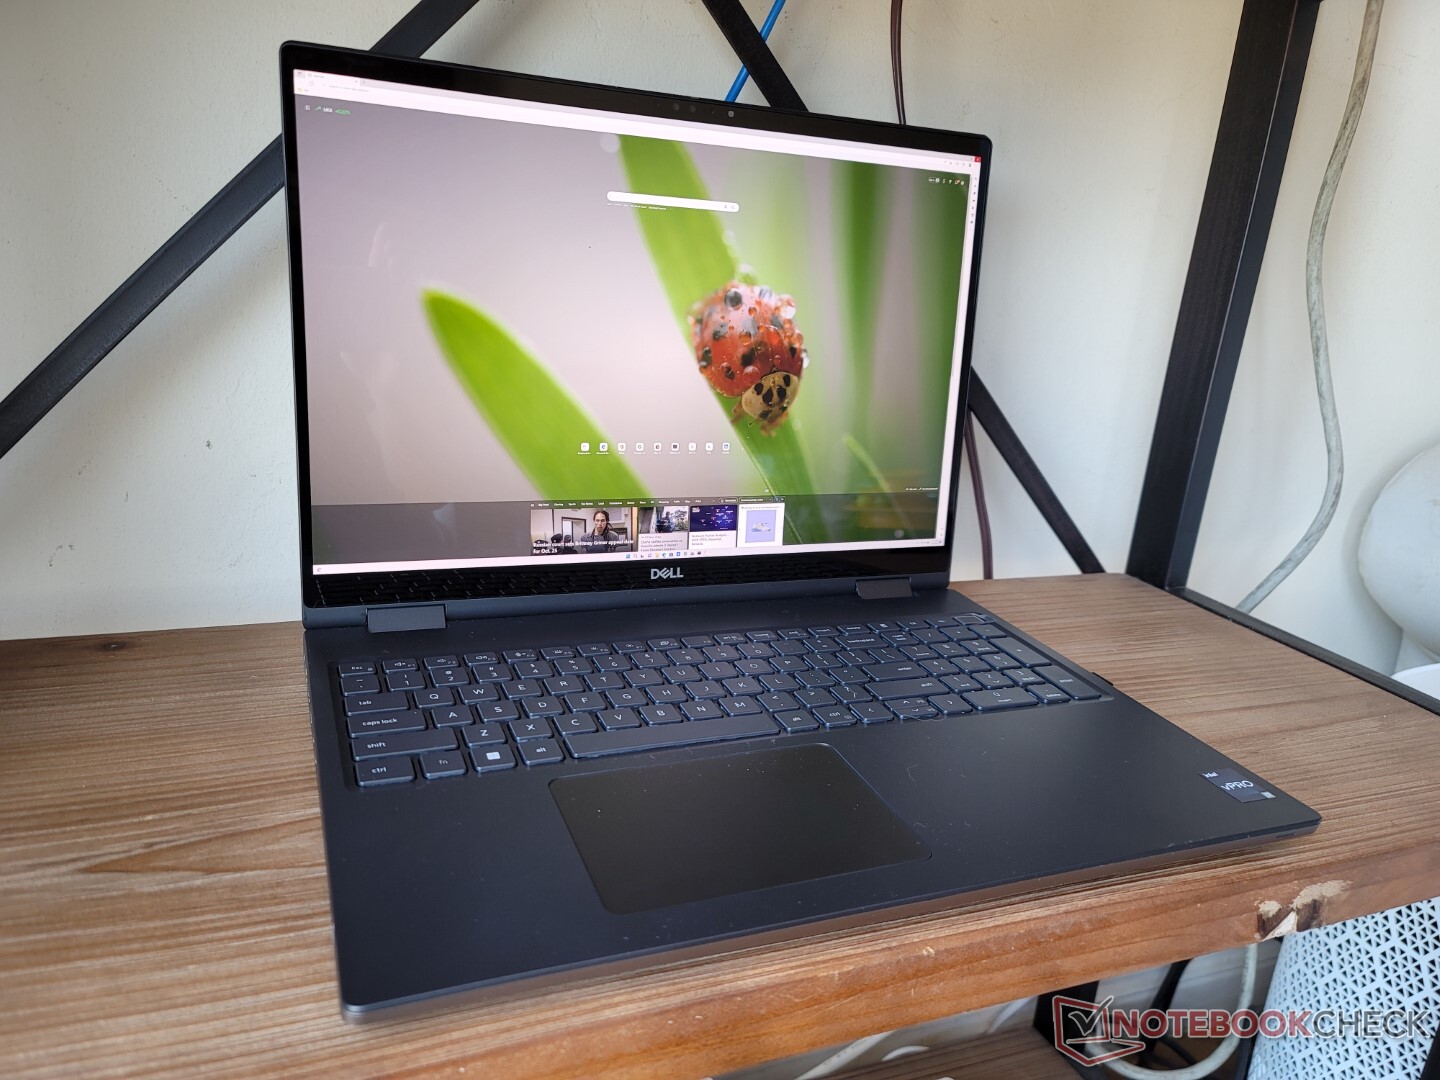
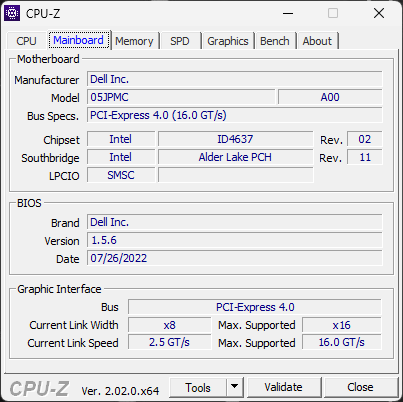
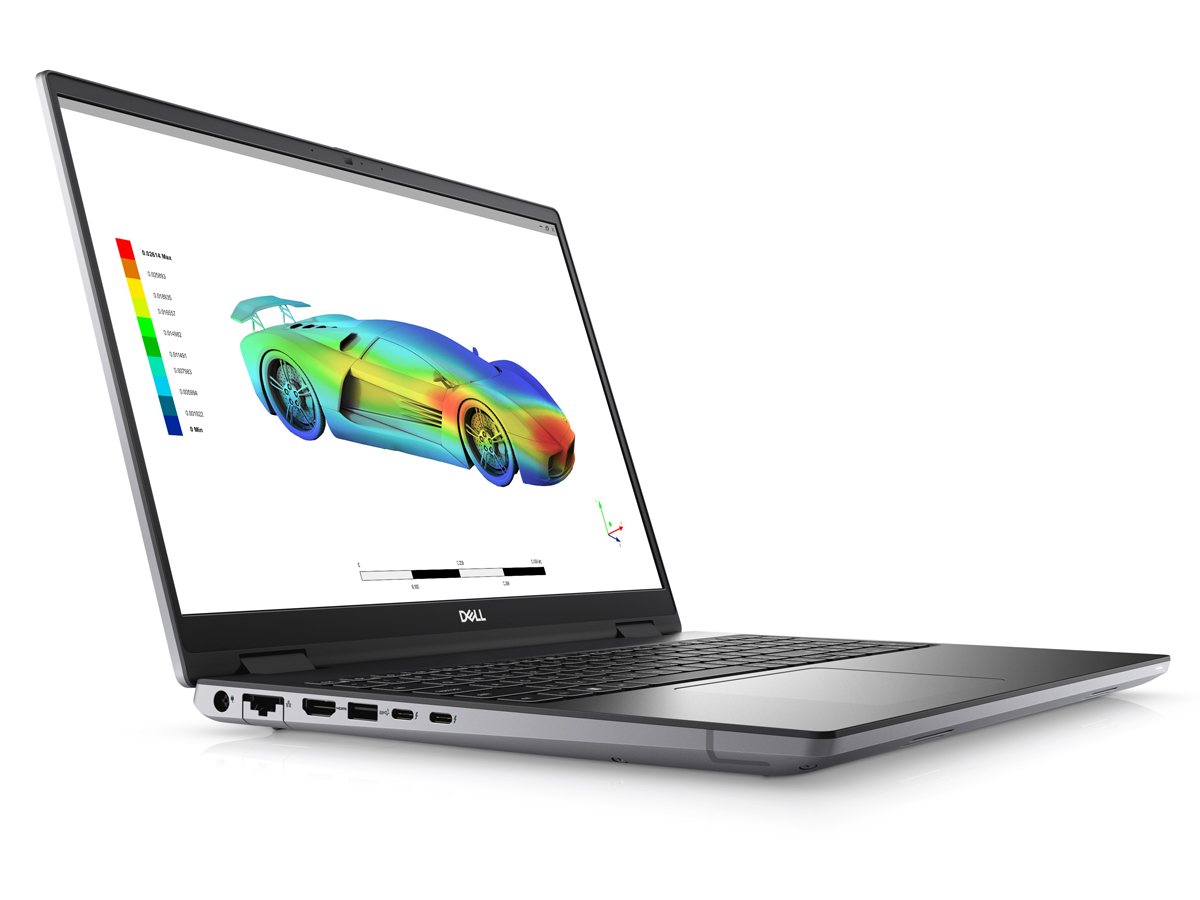
戴尔Precision 7670工作站回顾。酷睿i7-12850HX和CAMM内存首次亮相

Precision 7000系列是戴尔旗舰移动工作站的所在地,与中端Precision 5000系列或经济型Precision 3000系列形成对比。Precision 7670是该系列的第一个16英寸机型,位于15.6英寸Precision 7560和17.3英寸Precision 7760之间。令人困惑的是,戴尔正在生产Precision 7670的两个变体,称为 "性能底座 "和 "薄底座"。这个具体的审查是关于 "薄型基础 "变体,"性能基础 "的审查将在以后进行。
选项非常广泛,从Core i5-12600HX到i9-12950HX,Iris Xe图形到独立的Nvidia RTX A5500,FHD IPS到4K OLED显示屏,甚至SODIMM或CAMM内存到128GB。我们的具体审查单位是一个中档配置,配有i7-12850HX,95W RTX A2000,以及4K OLED触摸屏,价格约为4100美元。
不幸的是,目前Precision 7670没有Xeon或ECC内存选项,但所有SKU都支持vPro。
由于16英寸工作站领域仍然相对较新,目前几乎没有直接的竞争对手。目前的替代品包括 华硕ProArt StudioBook Pro 16, 联想ThinkPad P1 G4,以及惠普ZBook Fury 16。
更多戴尔评论。
潜在的竞争对手比较
Rating | Date | Model | Weight | Height | Size | Resolution | Price |
|---|---|---|---|---|---|---|---|
| 88.4 % v7 (old) | 10 / 2022 | Dell Precision 7670 i7-12850HX, RTX A2000 Laptop GPU | 2.7 kg | 24.7 mm | 16.00" | 3840x2400 | |
| 89.3 % v7 (old) | 02 / 2022 | Lenovo ThinkPad P1 G4-20Y4Z9DVUS i7-11800H, T1200 Laptop GPU | 1.8 kg | 17.7 mm | 16.00" | 2560x1600 | |
v (old) | 12 / 2021 | Asus ProArt StudioBook 16 W7600H5A-2BL2 W-11955M, RTX A5000 Laptop GPU | 2.4 kg | 21.4 mm | 16.00" | 3840x2400 | |
| 88.3 % v7 (old) | 10 / 2021 | Dell Precision 5000 5560 i7-11850H, RTX A2000 Laptop GPU | 2 kg | 18 mm | 15.60" | 3840x2400 | |
| 87.8 % v7 (old) | 12 / 2020 | Dell Precision 7550 W-10885M, Quadro RTX 5000 Max-Q | 2.8 kg | 27.36 mm | 15.60" | 3840x2160 | |
| 90.3 % v7 (old) | 10 / 2021 | HP ZBook Fury 15 G8 i9-11950H, RTX A5000 Laptop GPU | 2.5 kg | 25.9 mm | 15.60" | 3840x2160 |
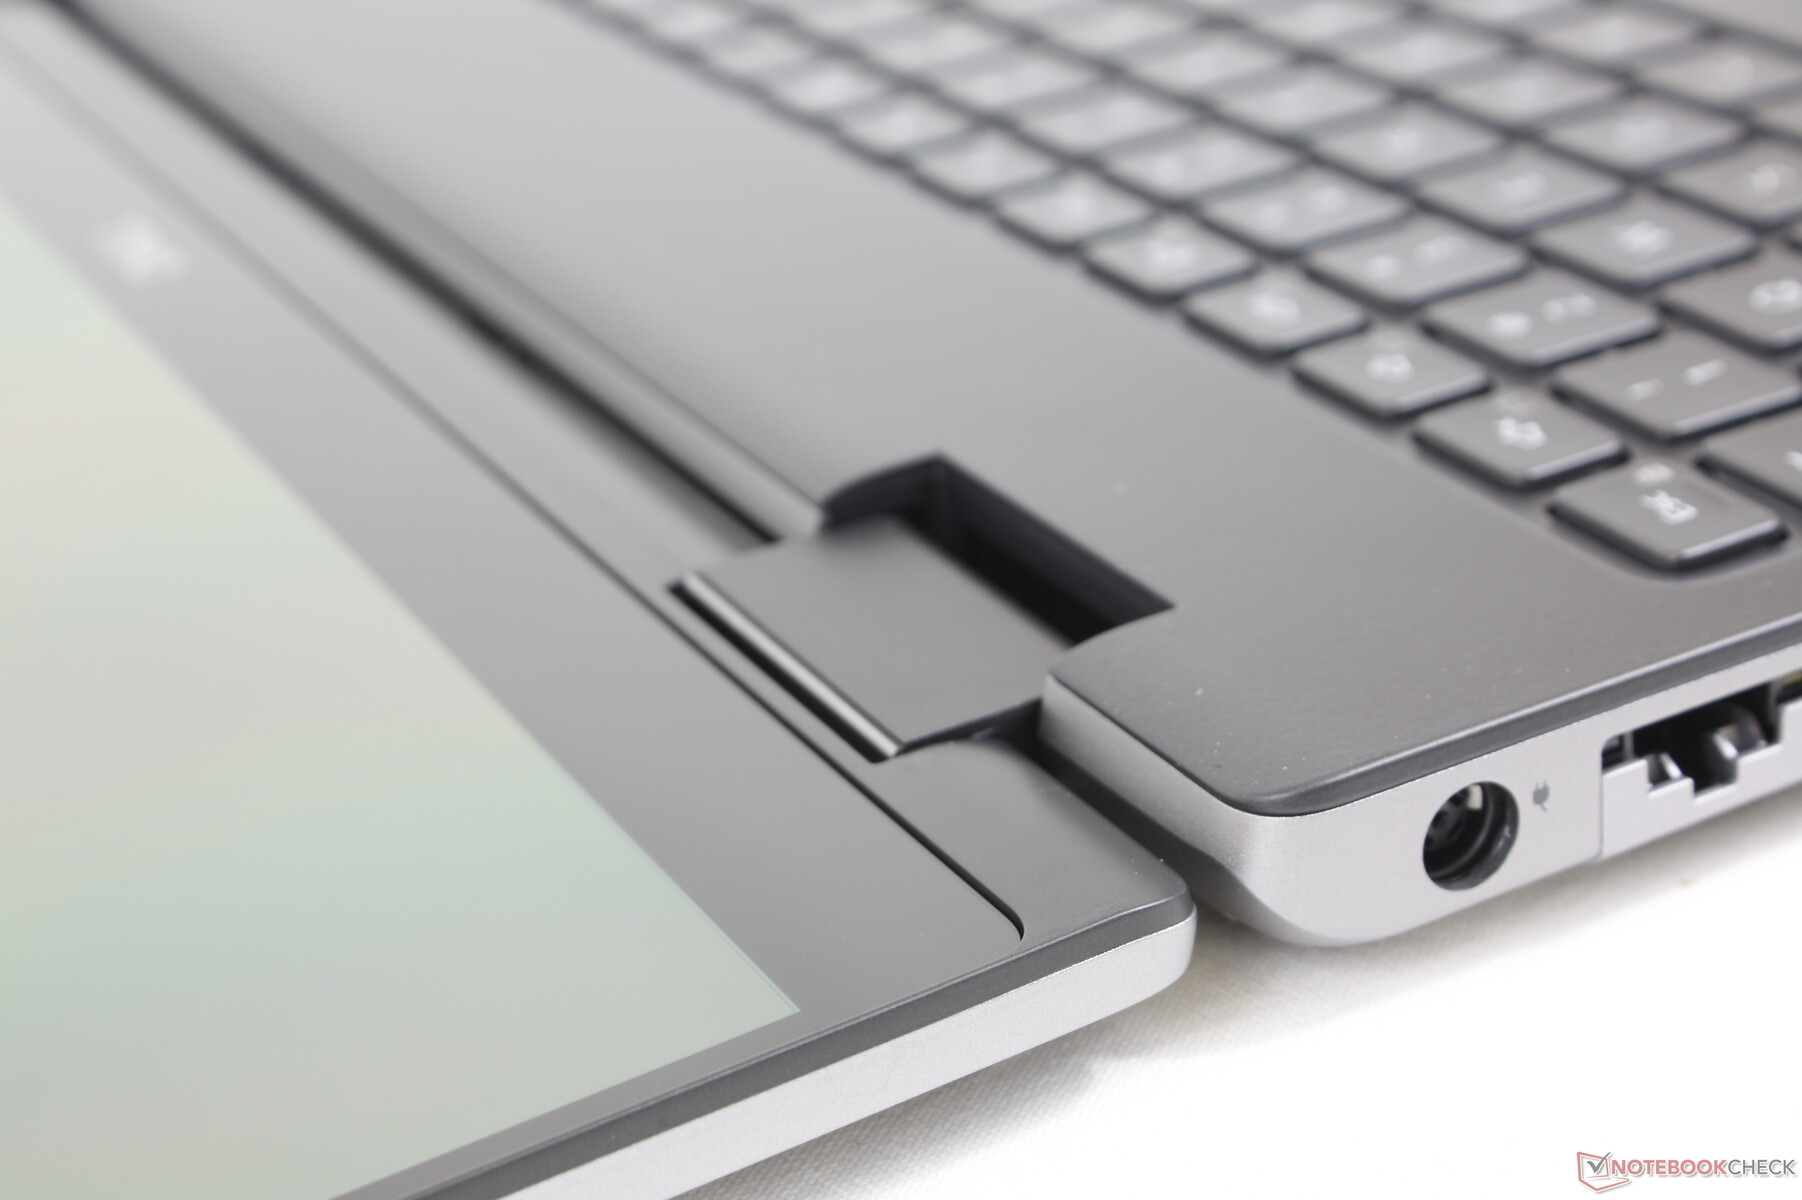
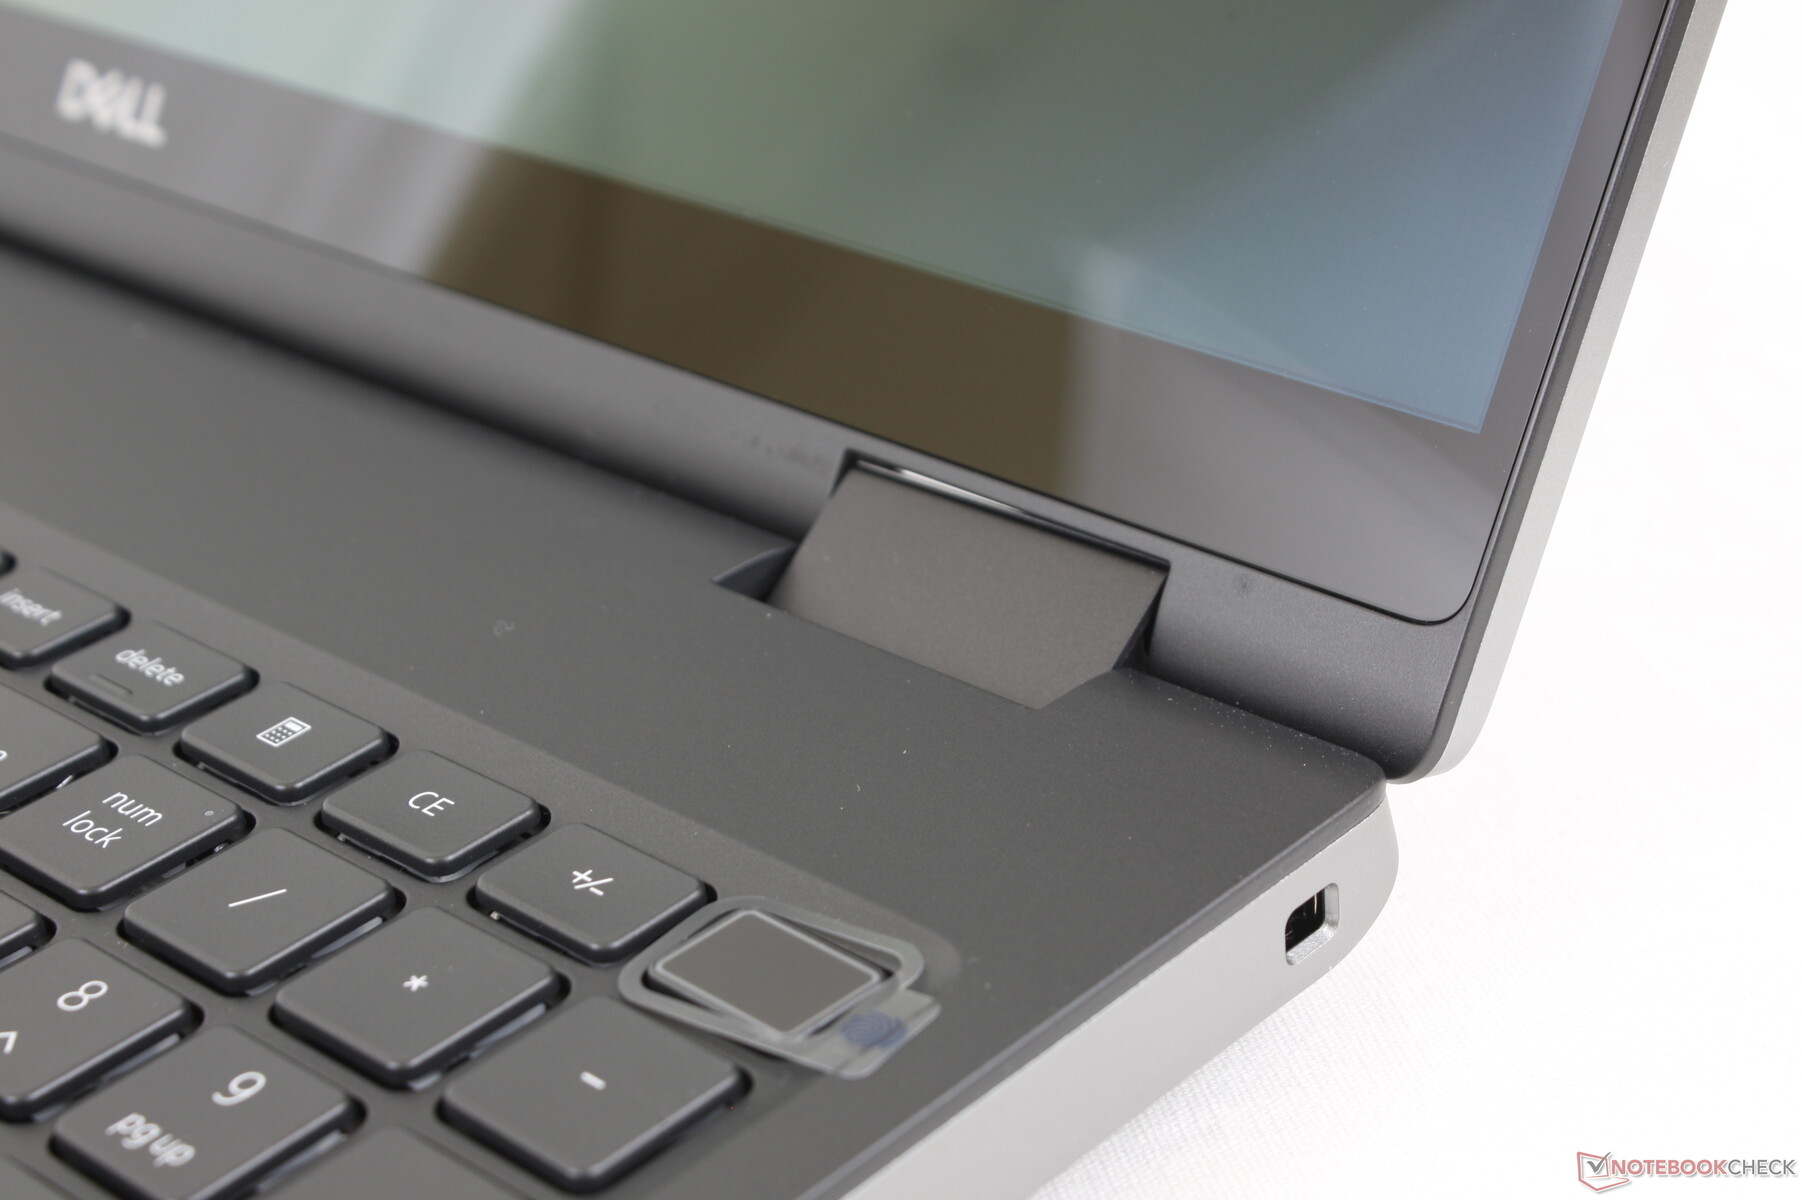
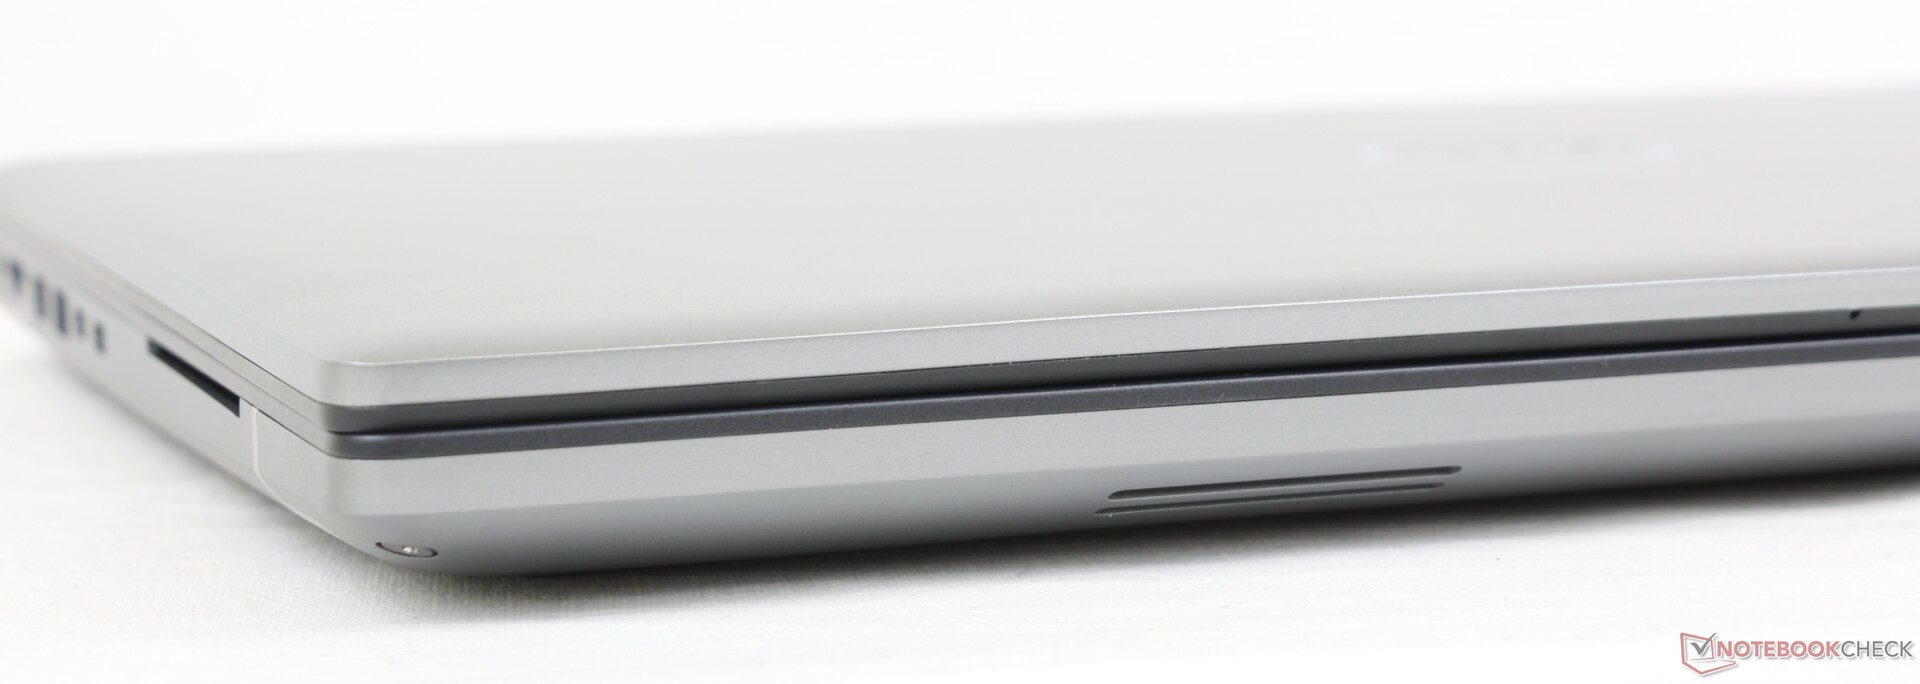
案例 - 经典Precision 外观和感觉
底盘设计和材料与2020年密切相关 Precision 7550.例如,黑色的键盘面板仍然是略带橡胶的高级感,而外部的金属骨架仍然很厚,给人的第一印象要比 ThinkPad P1 G4或 华硕ProArt StudioBook.在键盘中心或外盖上施加压力,其表面的翘曲程度会比ThinkPad P1 G4或Asus ProArt StudioBook稍大。 惠普ZBook Studio但我们可以注意到没有吱吱作响或主要的薄弱点。
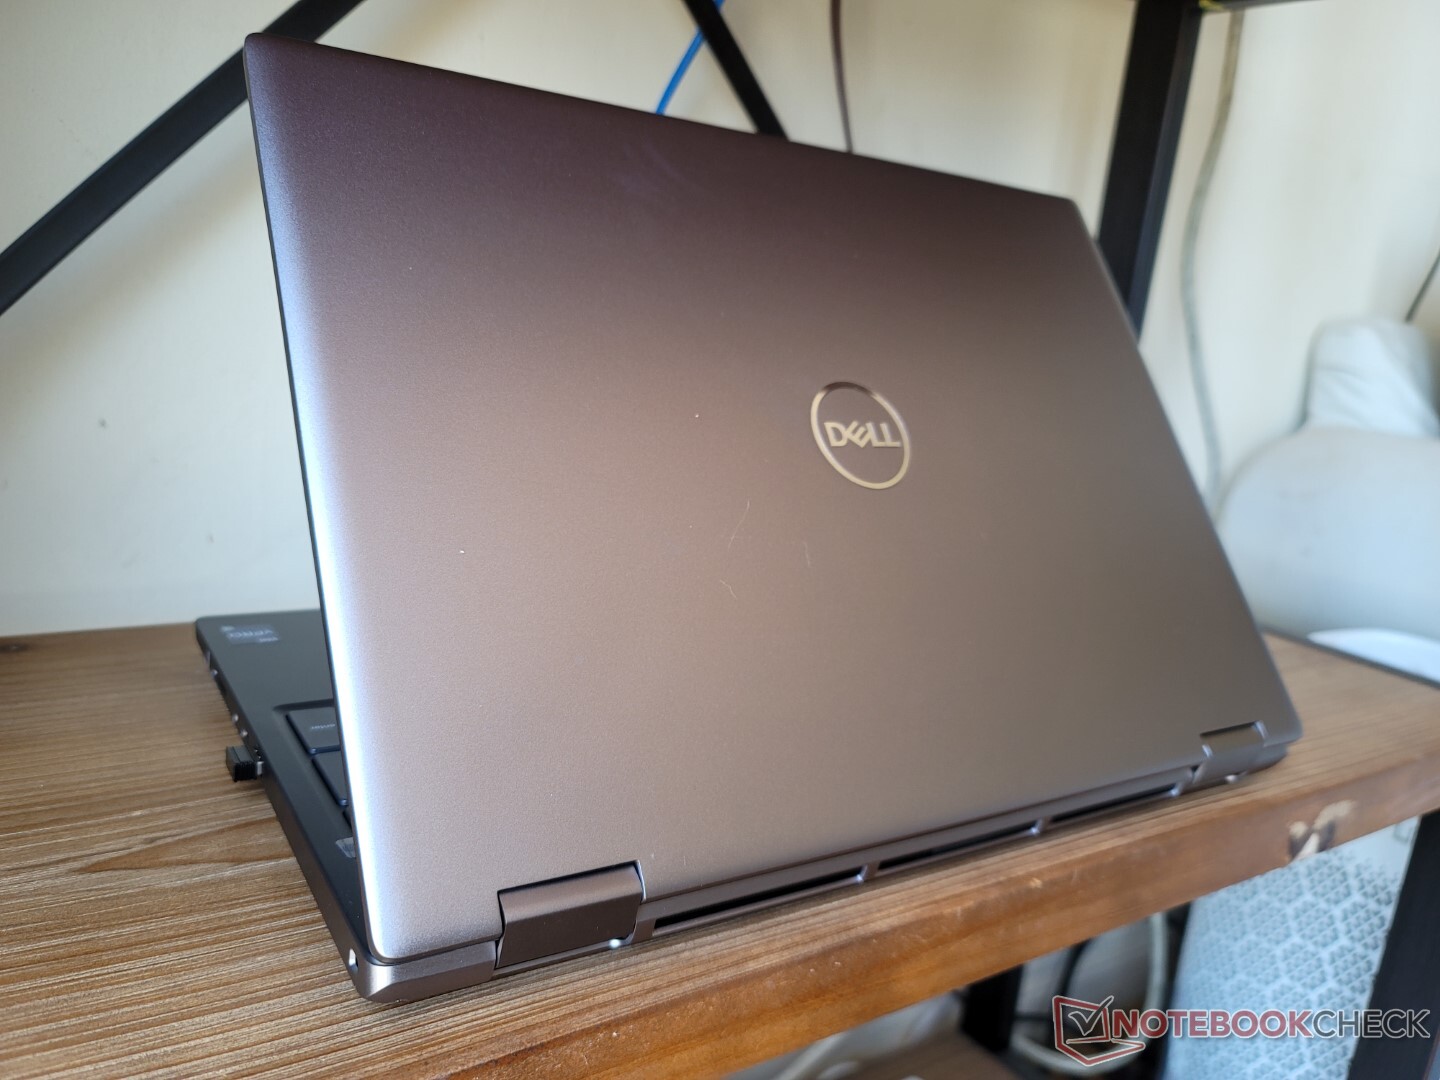
Precision 7670尽管我们的测试设备是 "薄型基础 "版本,但仍然比较大和重。该系统的厚度为24.7毫米,比华硕ProArt StudioBook 16厚,仅比惠普ZBook Fury 15 G8薄一截。它也重得多,每台都有几百克,部分原因是较大的16英寸16:10外形因素。
性能底座 "比 "薄底座 "厚约3毫米,至少重70克,具体取决于配置。
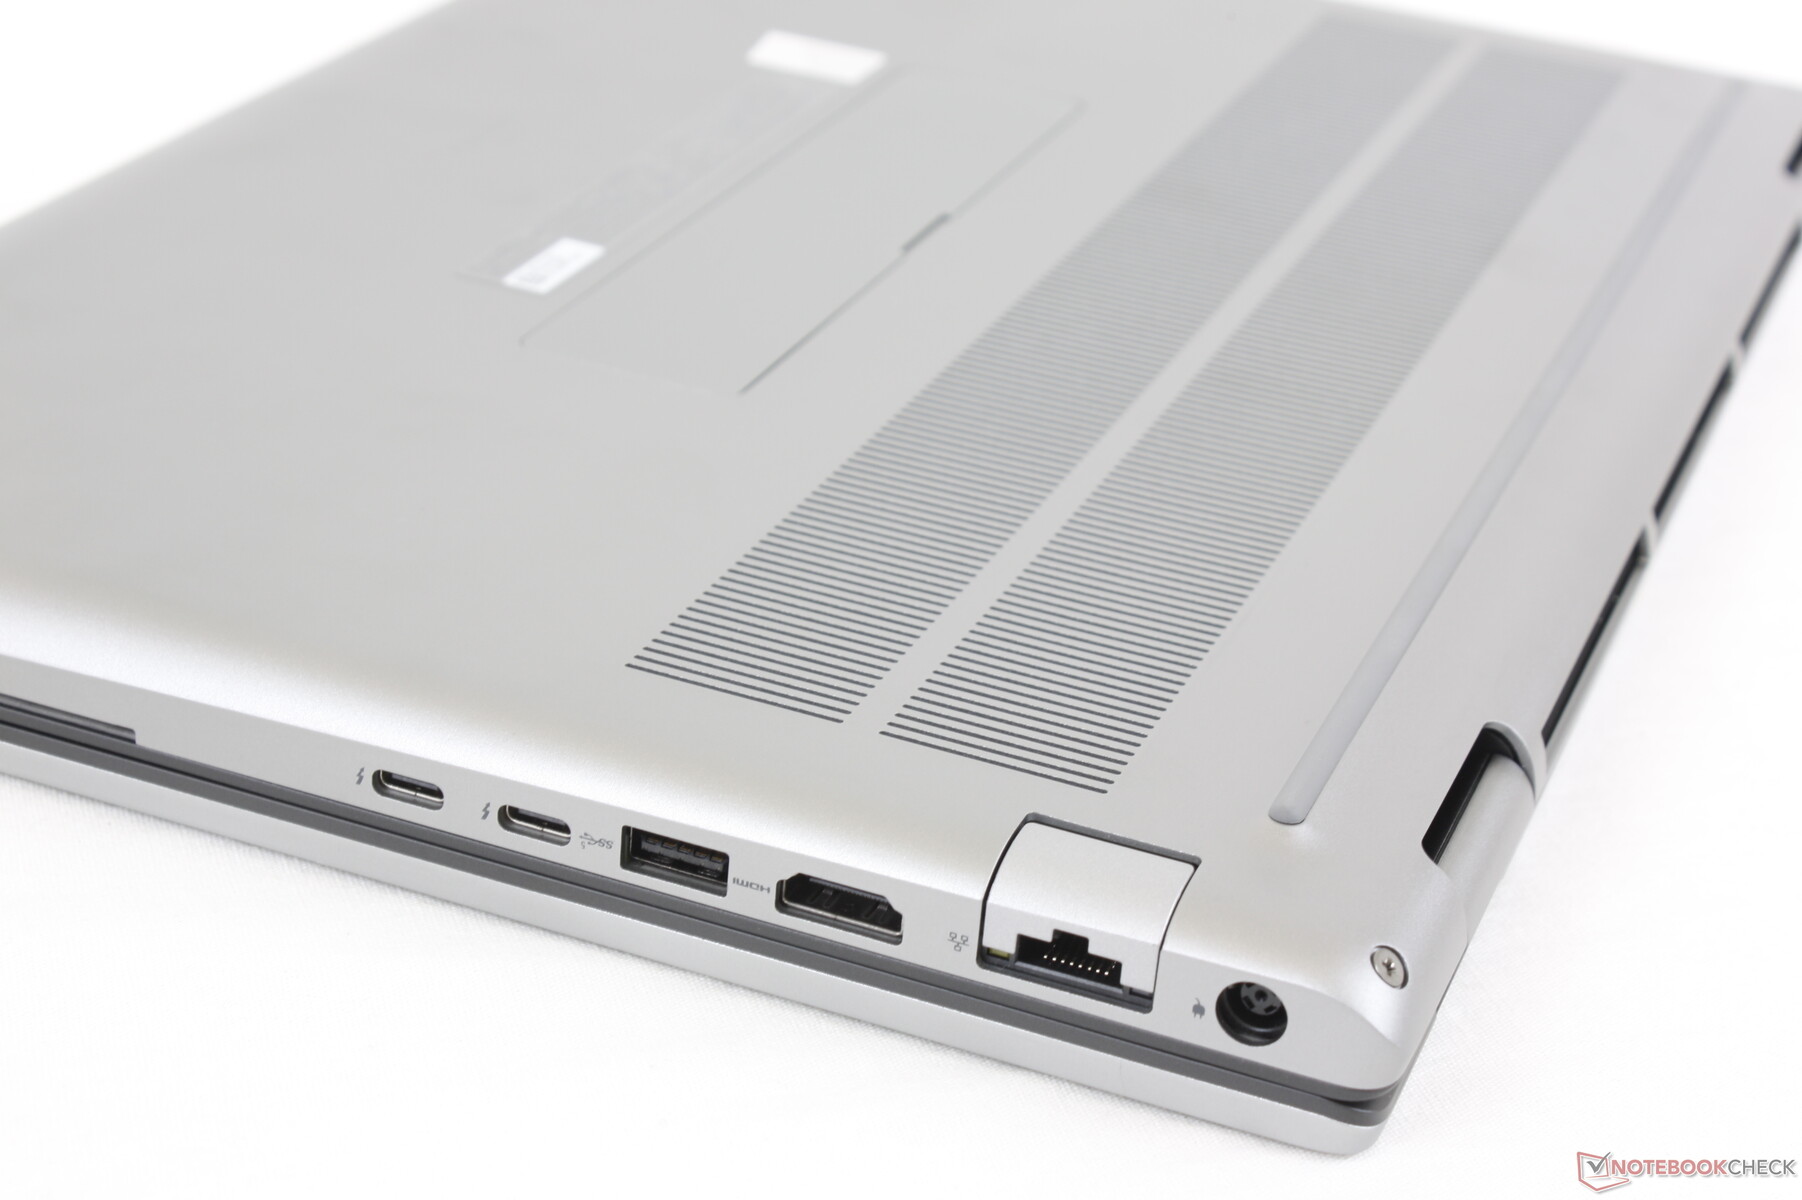
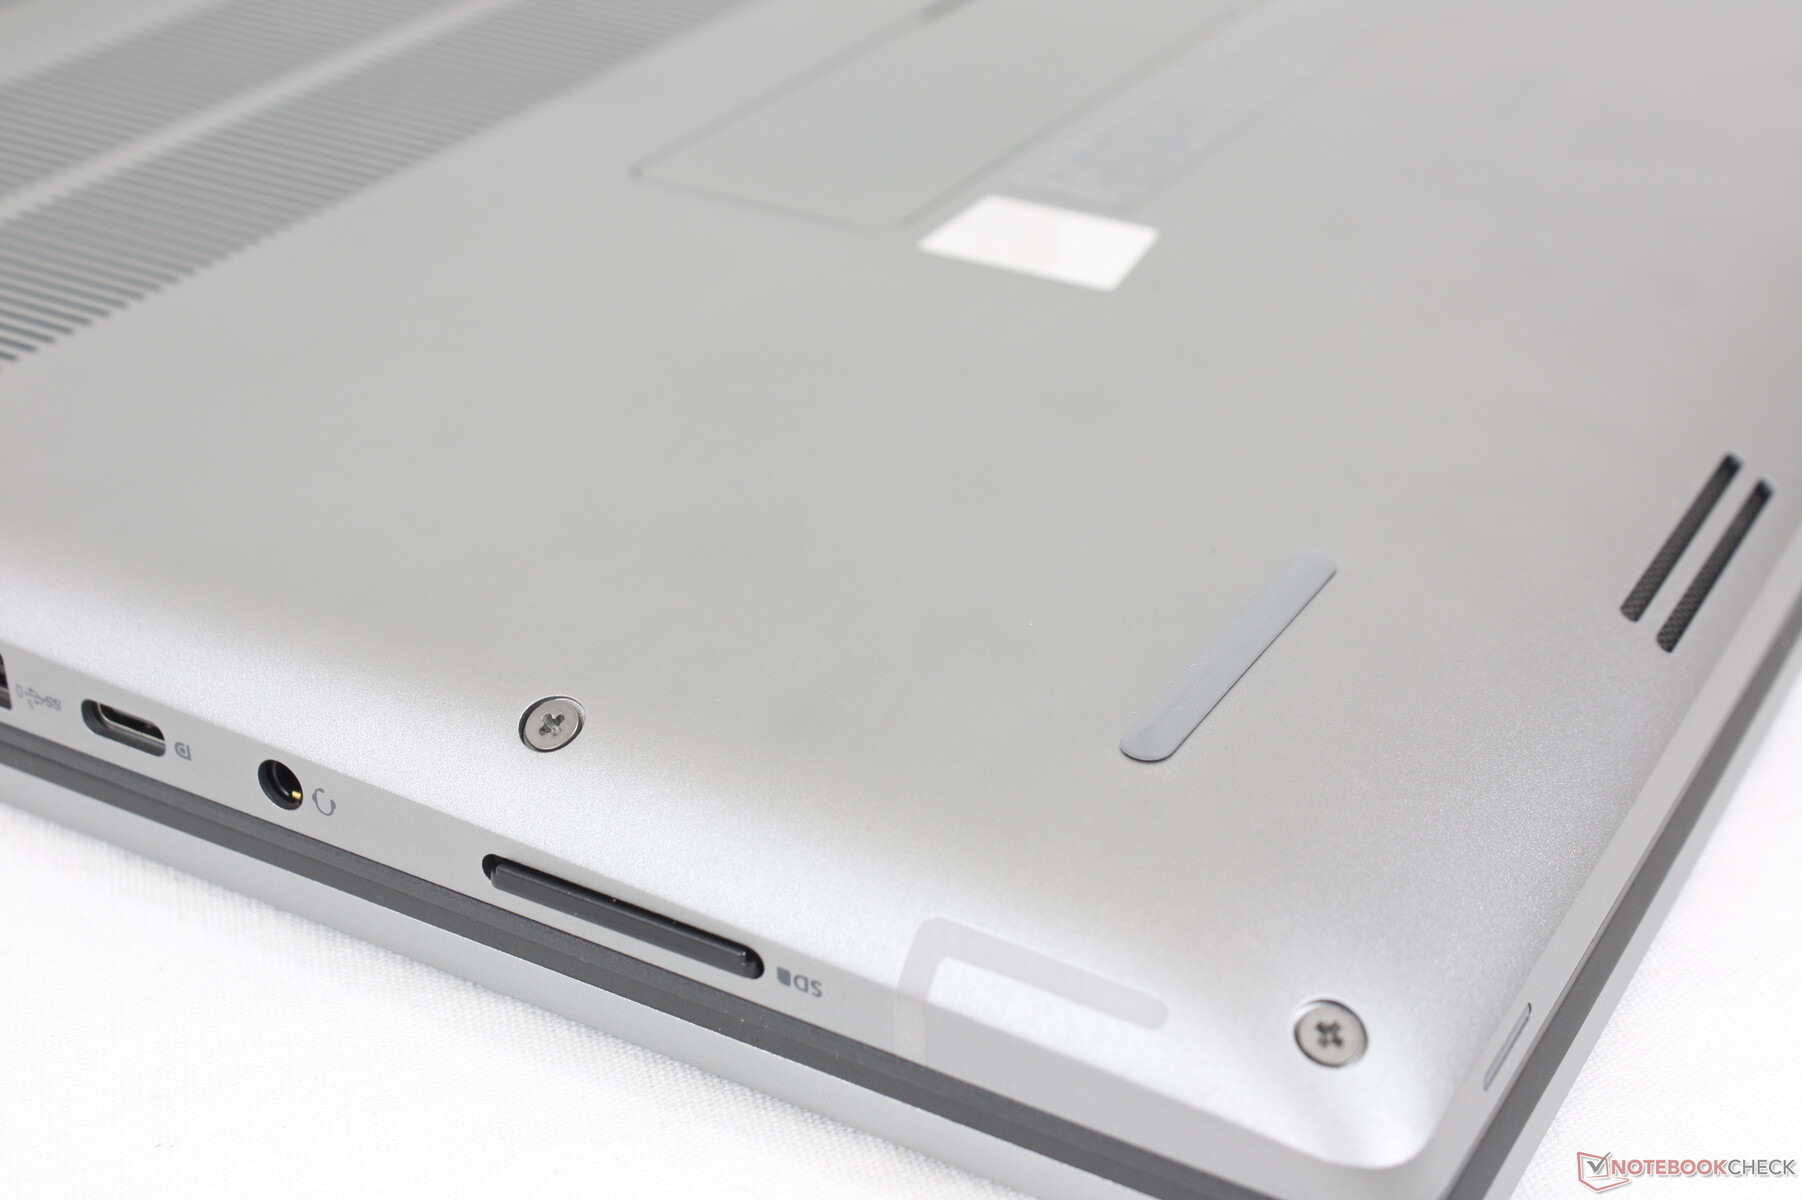
连接性--Thunderbolt 4但没有PD-In
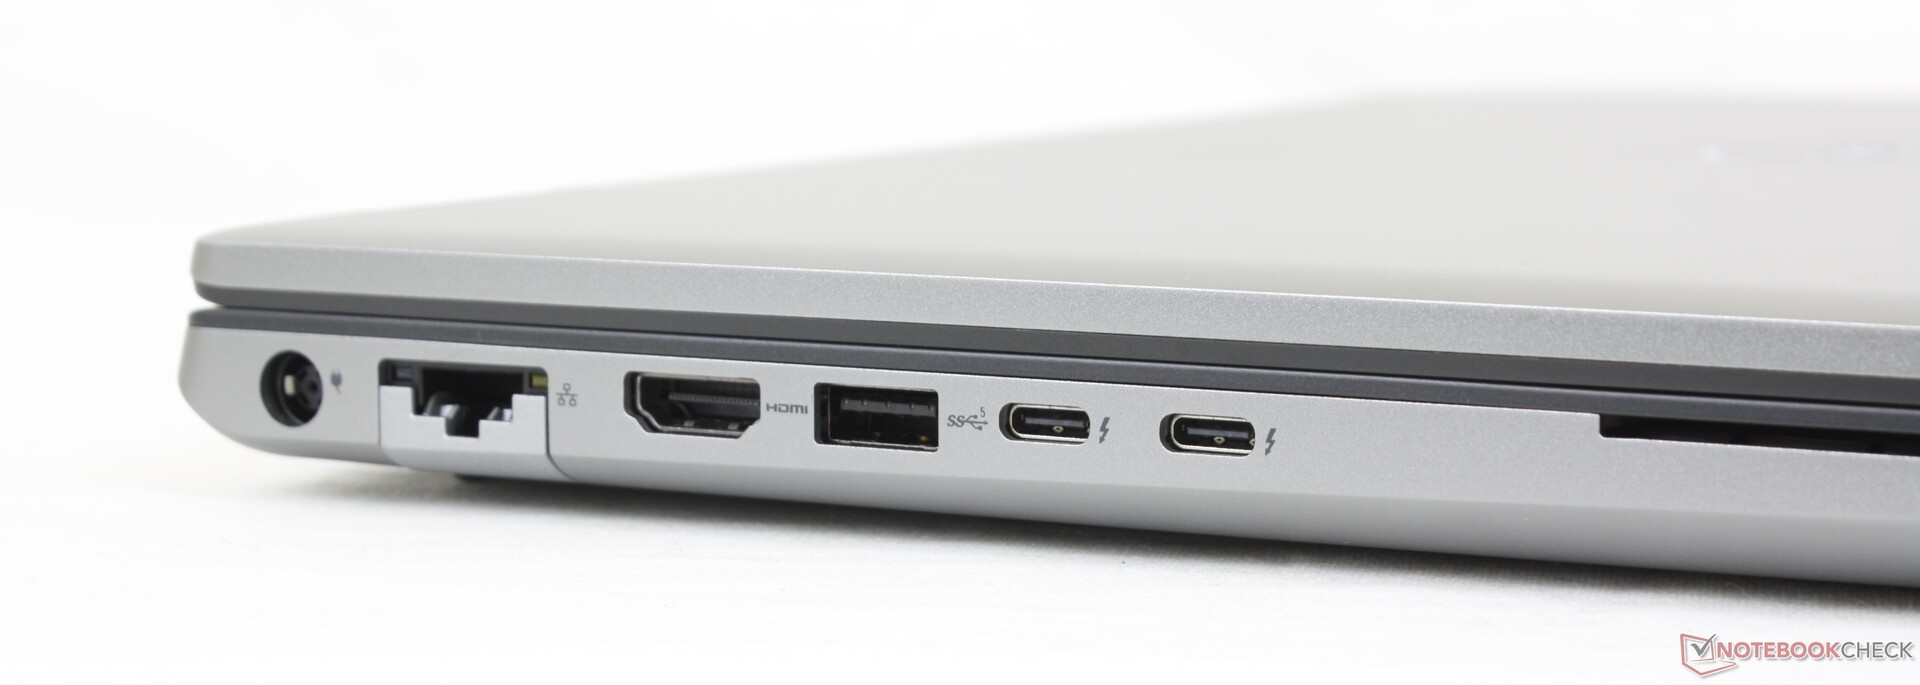
端口的选择非常好,尤其是比其他大多数工作站有更多的USB端口。许多端口都是沿着左侧边缘的,而右侧边缘的端口则相当靠近前面。请注意,RJ-45端口只支持高达1 Gbps的速度,而不是10 Gbps。
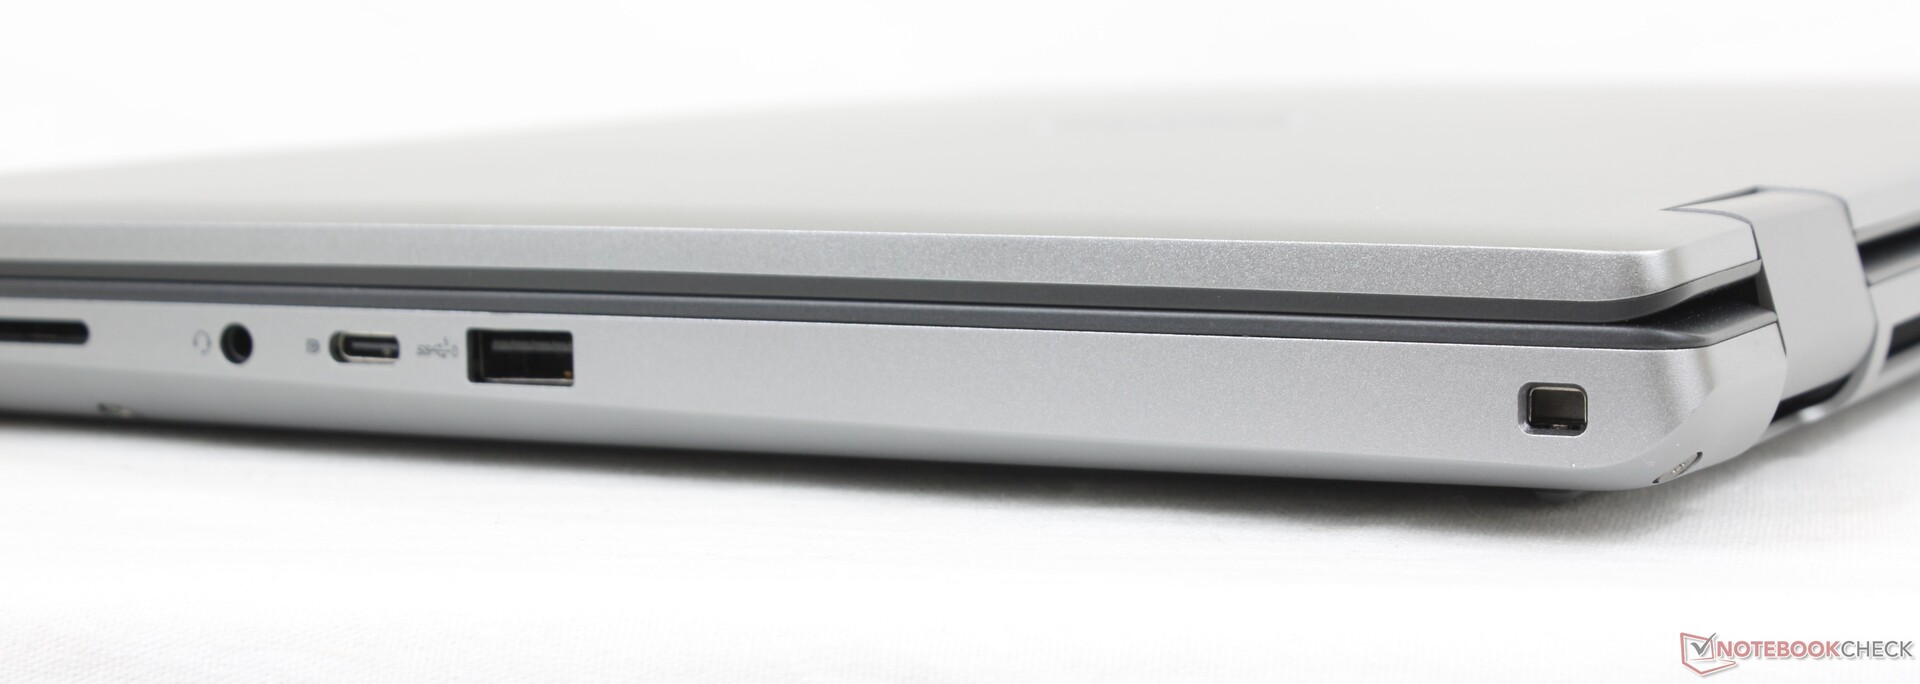
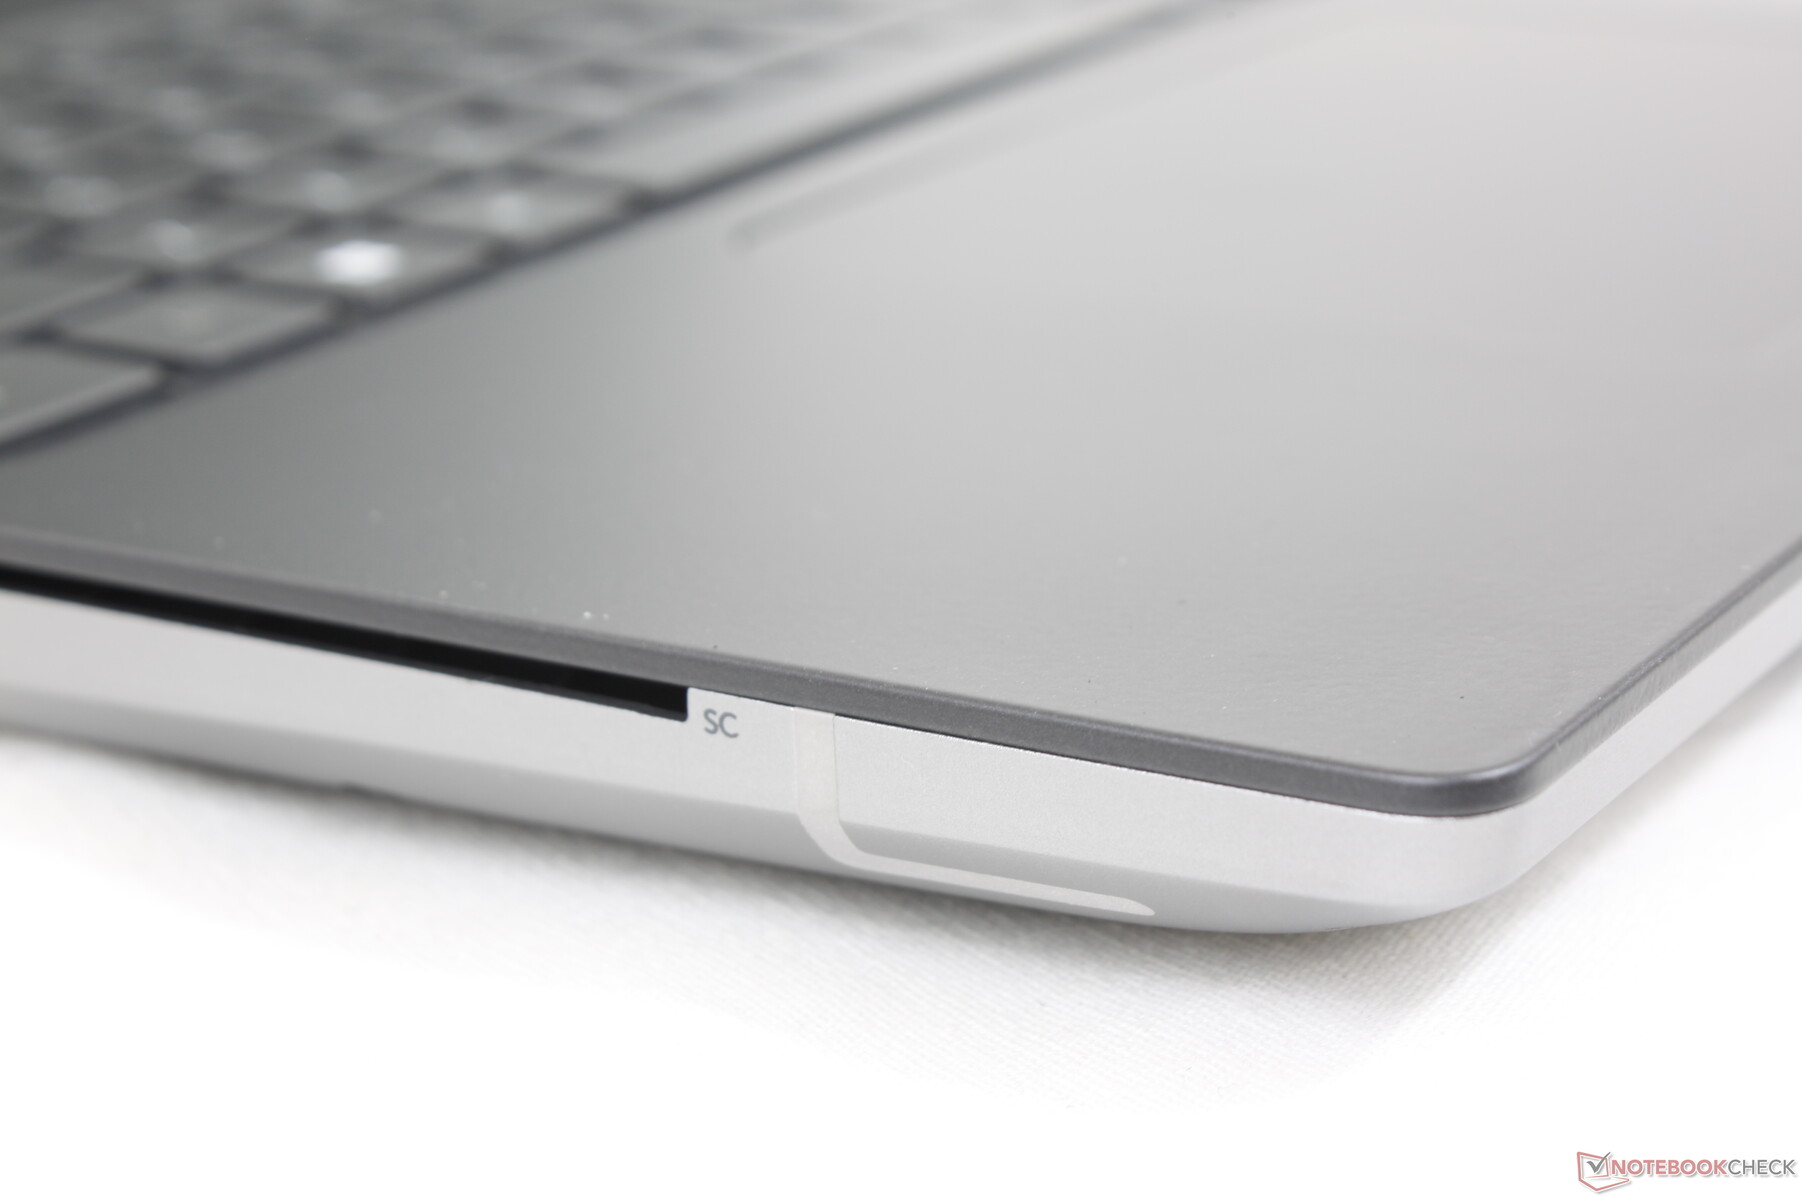
SD卡阅读器
使用弹簧式SD读卡器的传输速度与Precision 7550一样快,或比 7550快2倍以上。 惠普ZBook Fury G8.将1GB的图片从我们的UHS-II卡移动到桌面上只需要5到6秒。
| SD Card Reader | |
| average JPG Copy Test (av. of 3 runs) | |
| Lenovo ThinkPad P1 G4-20Y4Z9DVUS (Angelbird AV Pro V60) | |
| Dell Precision 5000 5560 (AV Pro V60) | |
| Dell Precision 7670 (Toshiba Exceria Pro SDXC 64 GB UHS-II) | |
| Dell Precision 7550 (Toshiba Exceria Pro SDXC 64 GB UHS-II) | |
| HP ZBook Fury 15 G8 (AV Pro V60) | |
| Asus ProArt StudioBook 16 W7600H5A-2BL2 (AV Pro SD microSD 128 GB V60) | |
| maximum AS SSD Seq Read Test (1GB) | |
| Dell Precision 5000 5560 (AV Pro V60) | |
| Dell Precision 7550 (Toshiba Exceria Pro SDXC 64 GB UHS-II) | |
| Dell Precision 7670 (Toshiba Exceria Pro SDXC 64 GB UHS-II) | |
| Lenovo ThinkPad P1 G4-20Y4Z9DVUS (Angelbird AV Pro V60) | |
| HP ZBook Fury 15 G8 (AV Pro V60) | |
| Asus ProArt StudioBook 16 W7600H5A-2BL2 (AV Pro SD microSD 128 GB V60) | |
沟通
一个英特尔AX211是Wi-Fi 6E连接的标准配置,也可选择蓝牙。不幸的是,在许多情况下,Wi-Fi 6E不一定比Wi-Fi 6快。与大多数其他工作站相比,我们的Precision 7670的传输速率似乎变化更大,即使离我们的6GHz接入点只有一到两米远。
| Networking | |
| iperf3 transmit AX12 | |
| Lenovo ThinkPad P1 G4-20Y4Z9DVUS | |
| HP ZBook Fury 15 G8 | |
| Dell Precision 7550 | |
| Dell Precision 5000 5560 | |
| Asus ProArt StudioBook 16 W7600H5A-2BL2 | |
| iperf3 receive AX12 | |
| Dell Precision 5000 5560 | |
| Lenovo ThinkPad P1 G4-20Y4Z9DVUS | |
| Dell Precision 7550 | |
| HP ZBook Fury 15 G8 | |
| Asus ProArt StudioBook 16 W7600H5A-2BL2 | |
| iperf3 receive AXE11000 6GHz | |
| Dell Precision 7670 | |
| iperf3 transmit AXE11000 6GHz | |
| Dell Precision 7670 | |
网络摄像头
2MP网络摄像头是大多数XPS系统上1MP网络摄像头的升级。然而,与大多数最新的惠普笔记本电脑上的500万像素摄像头相比,它仍然相形见绌。
红外线和快门都包括在内,分别用于支持Windows Hello和保护隐私。


维护--方便使用
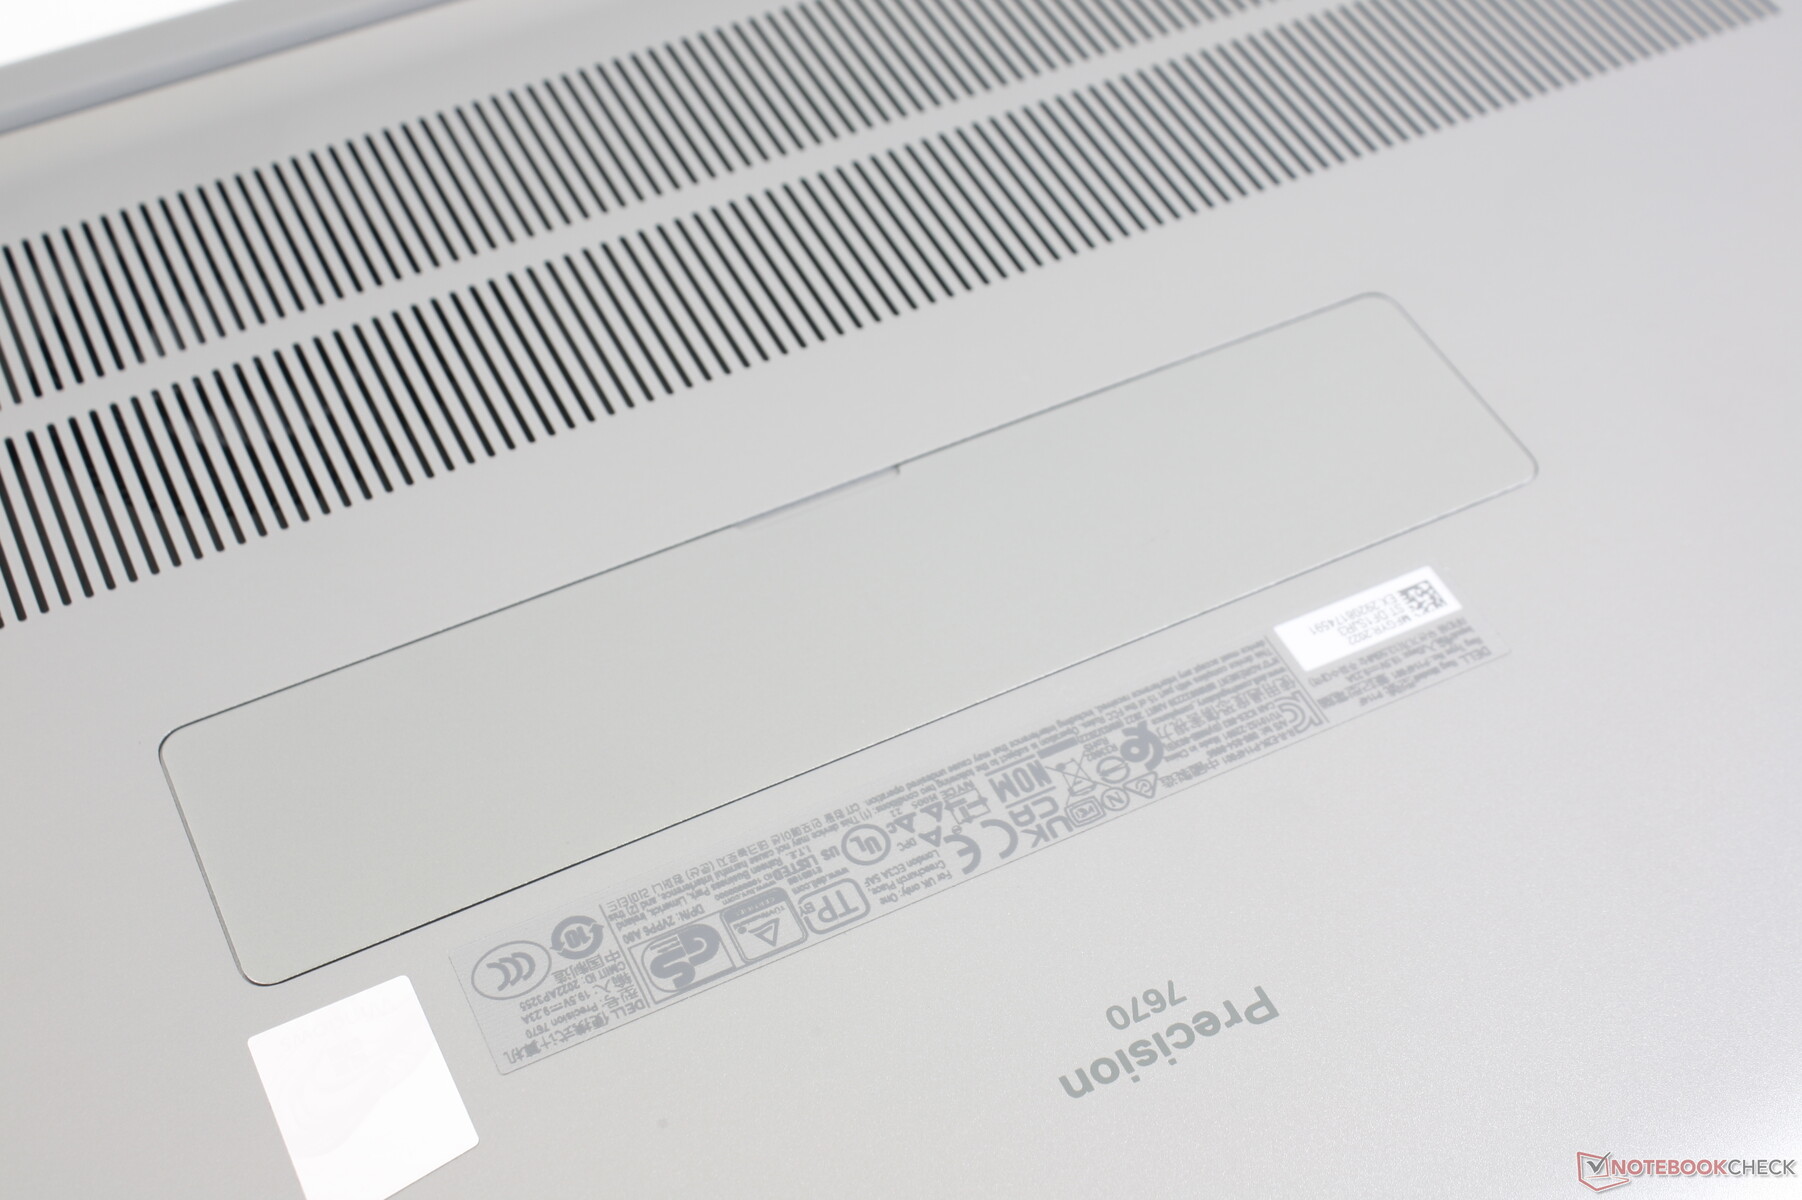
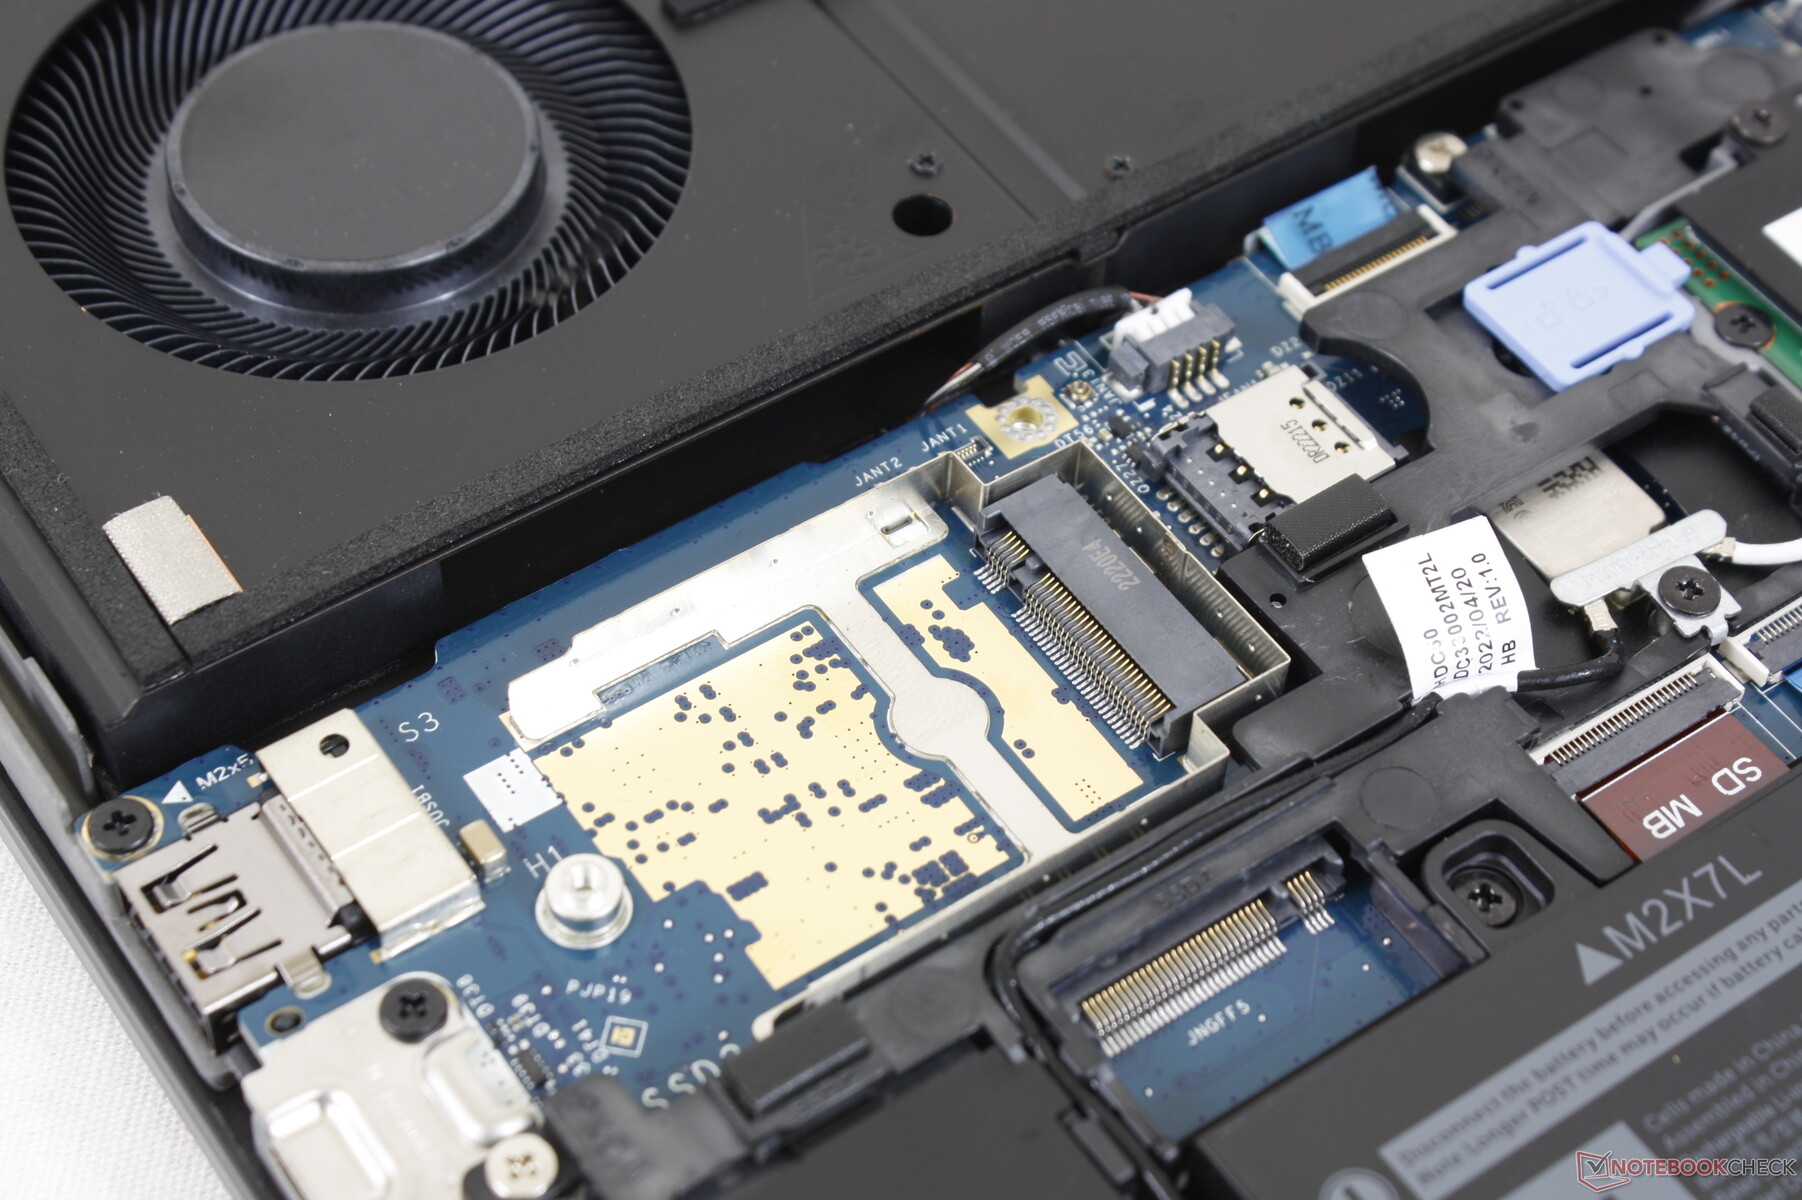
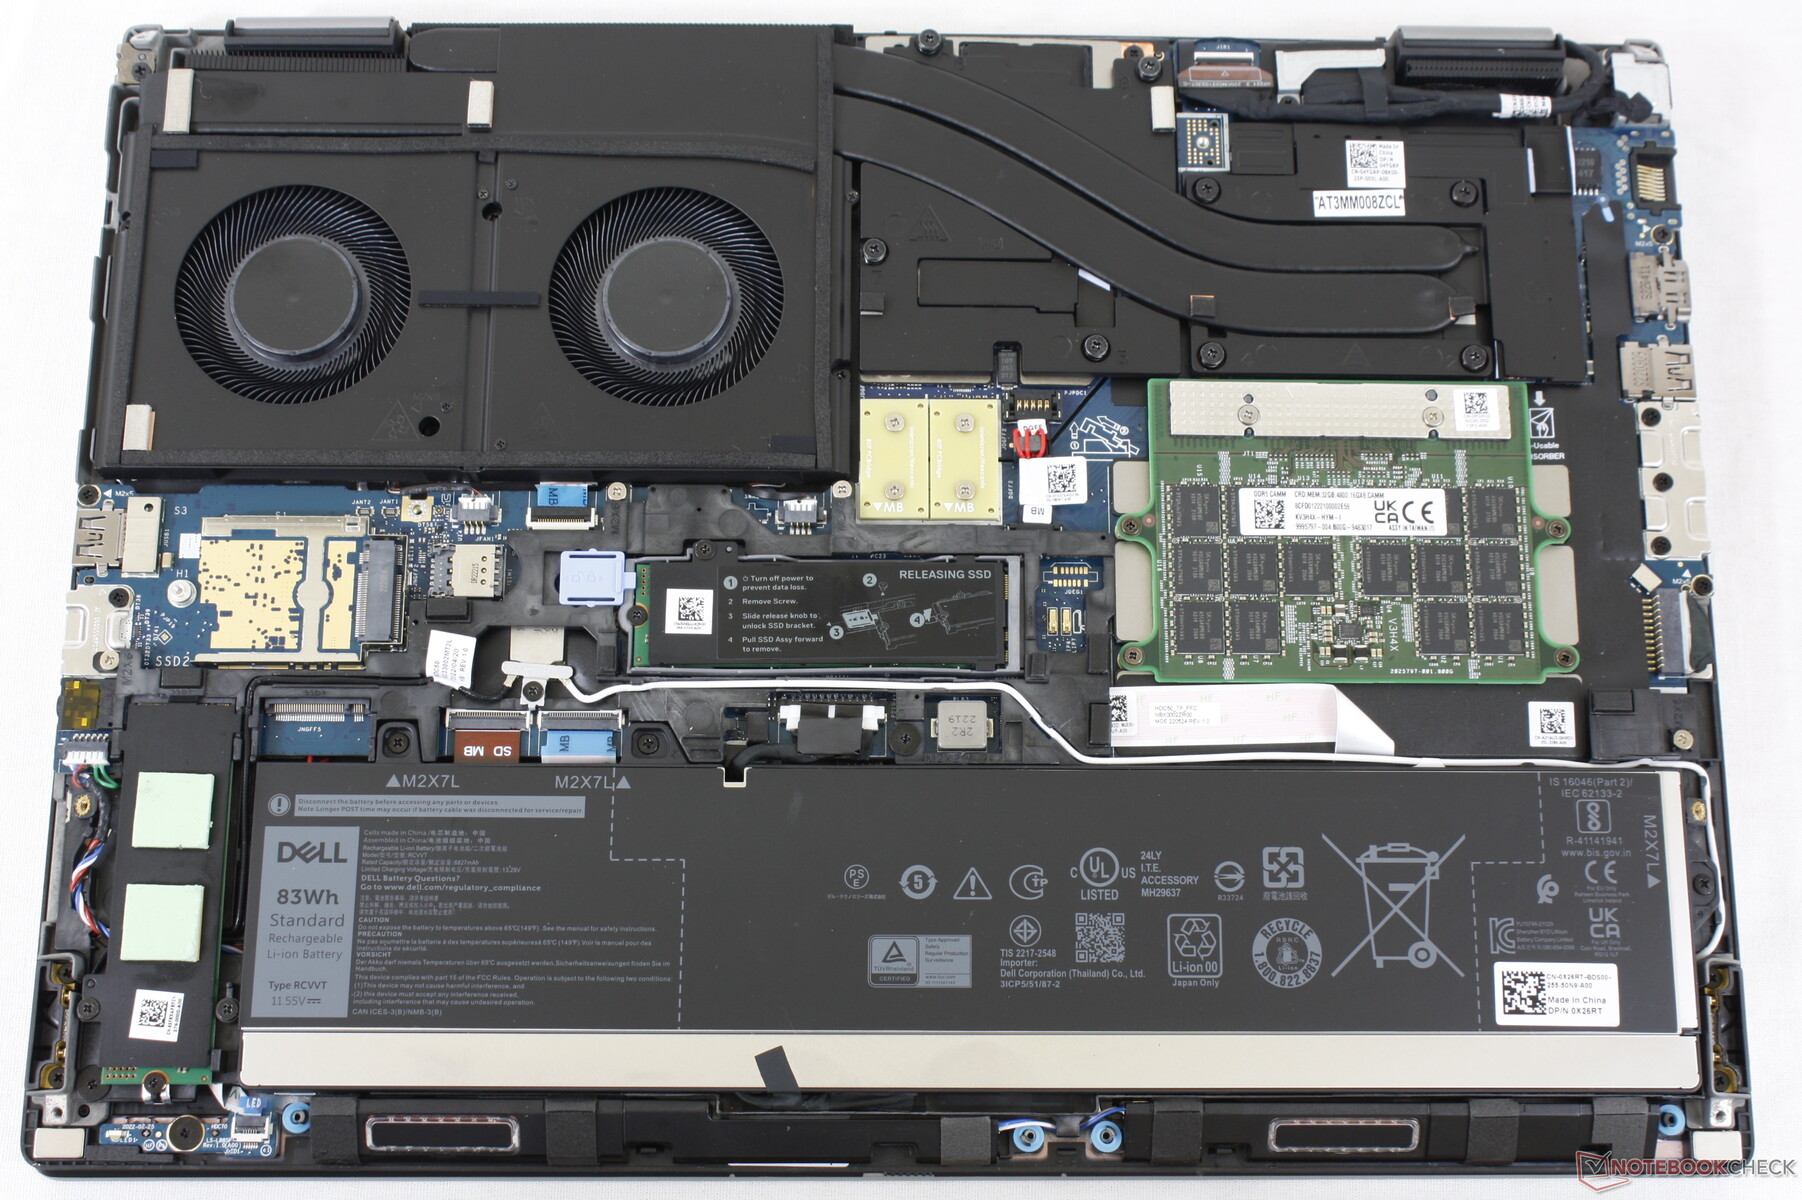
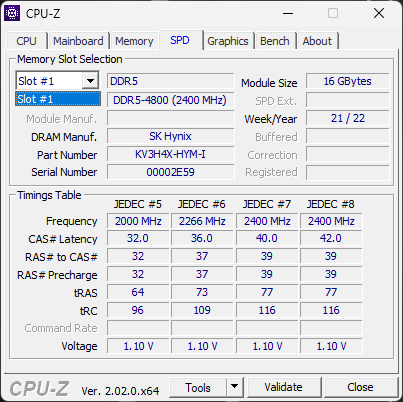
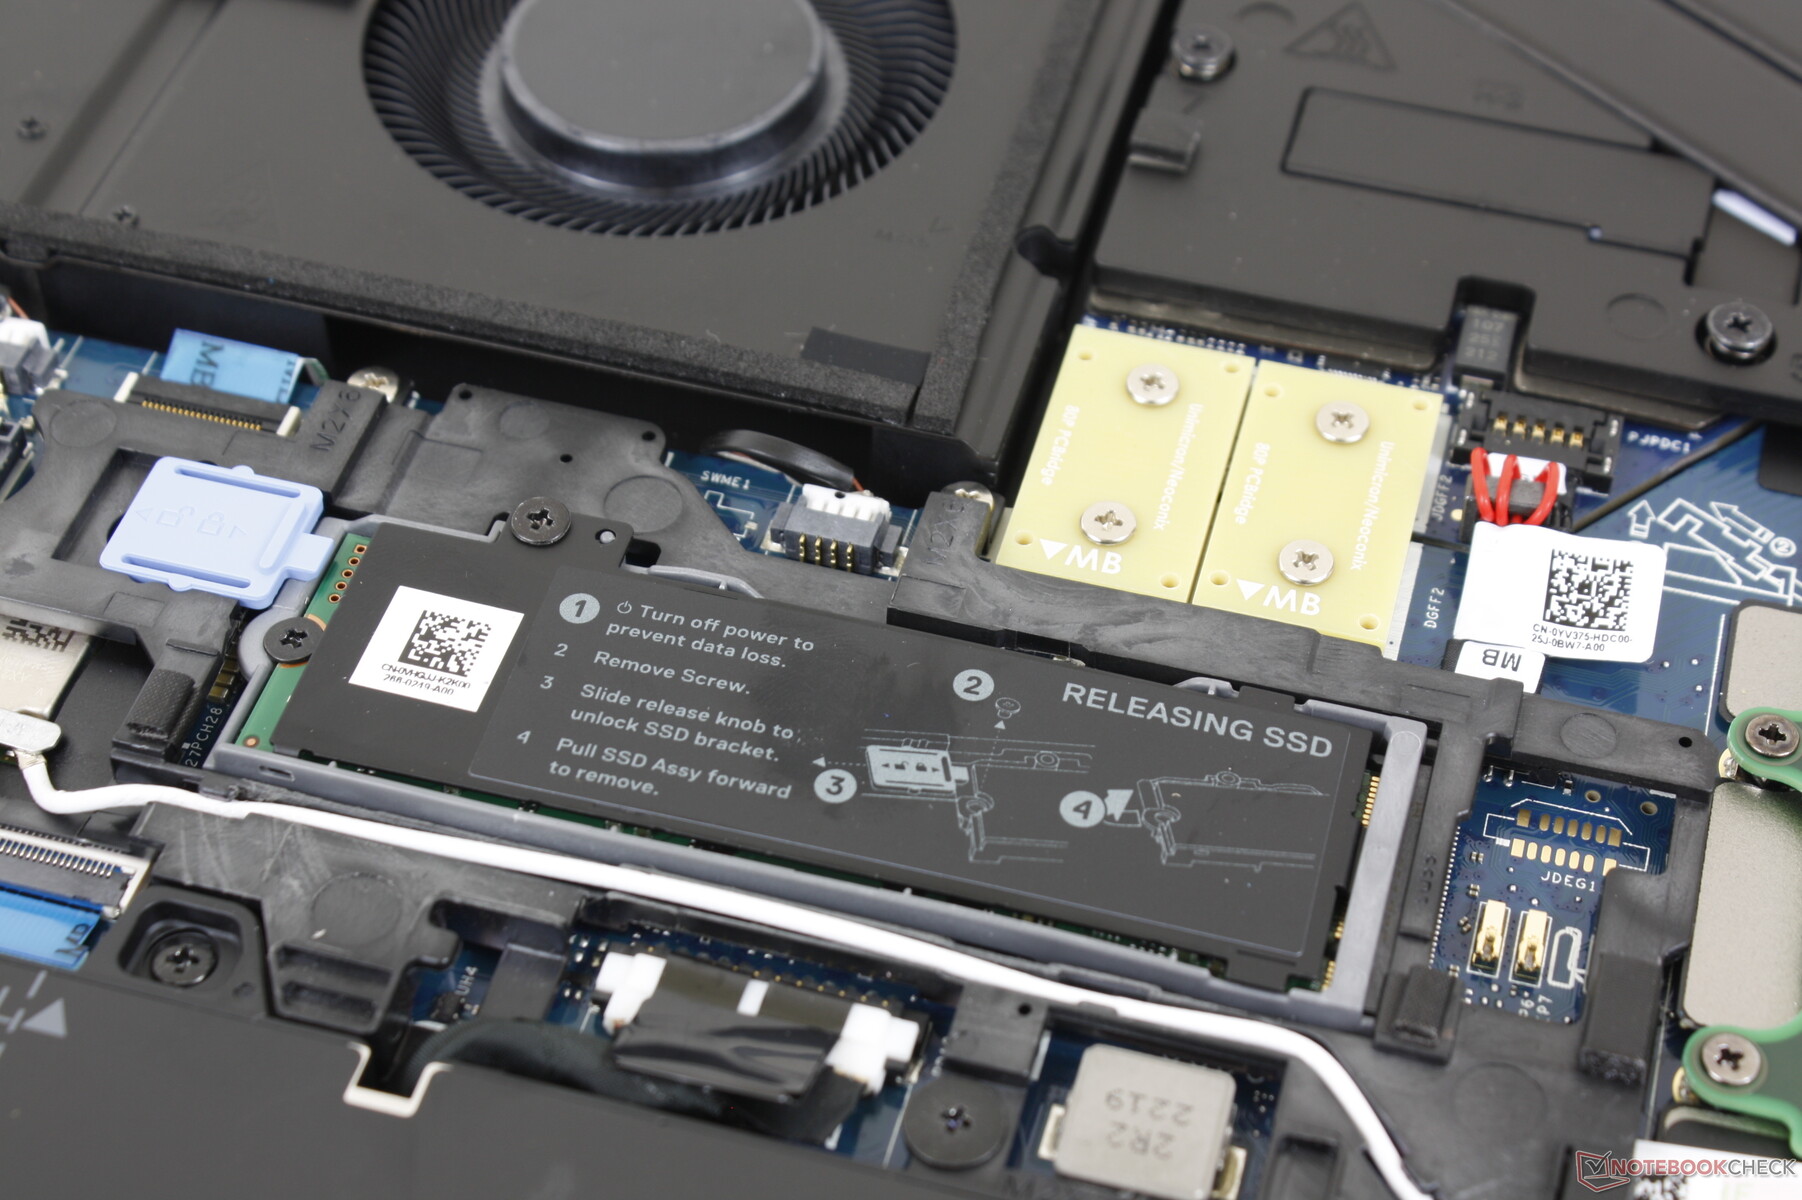
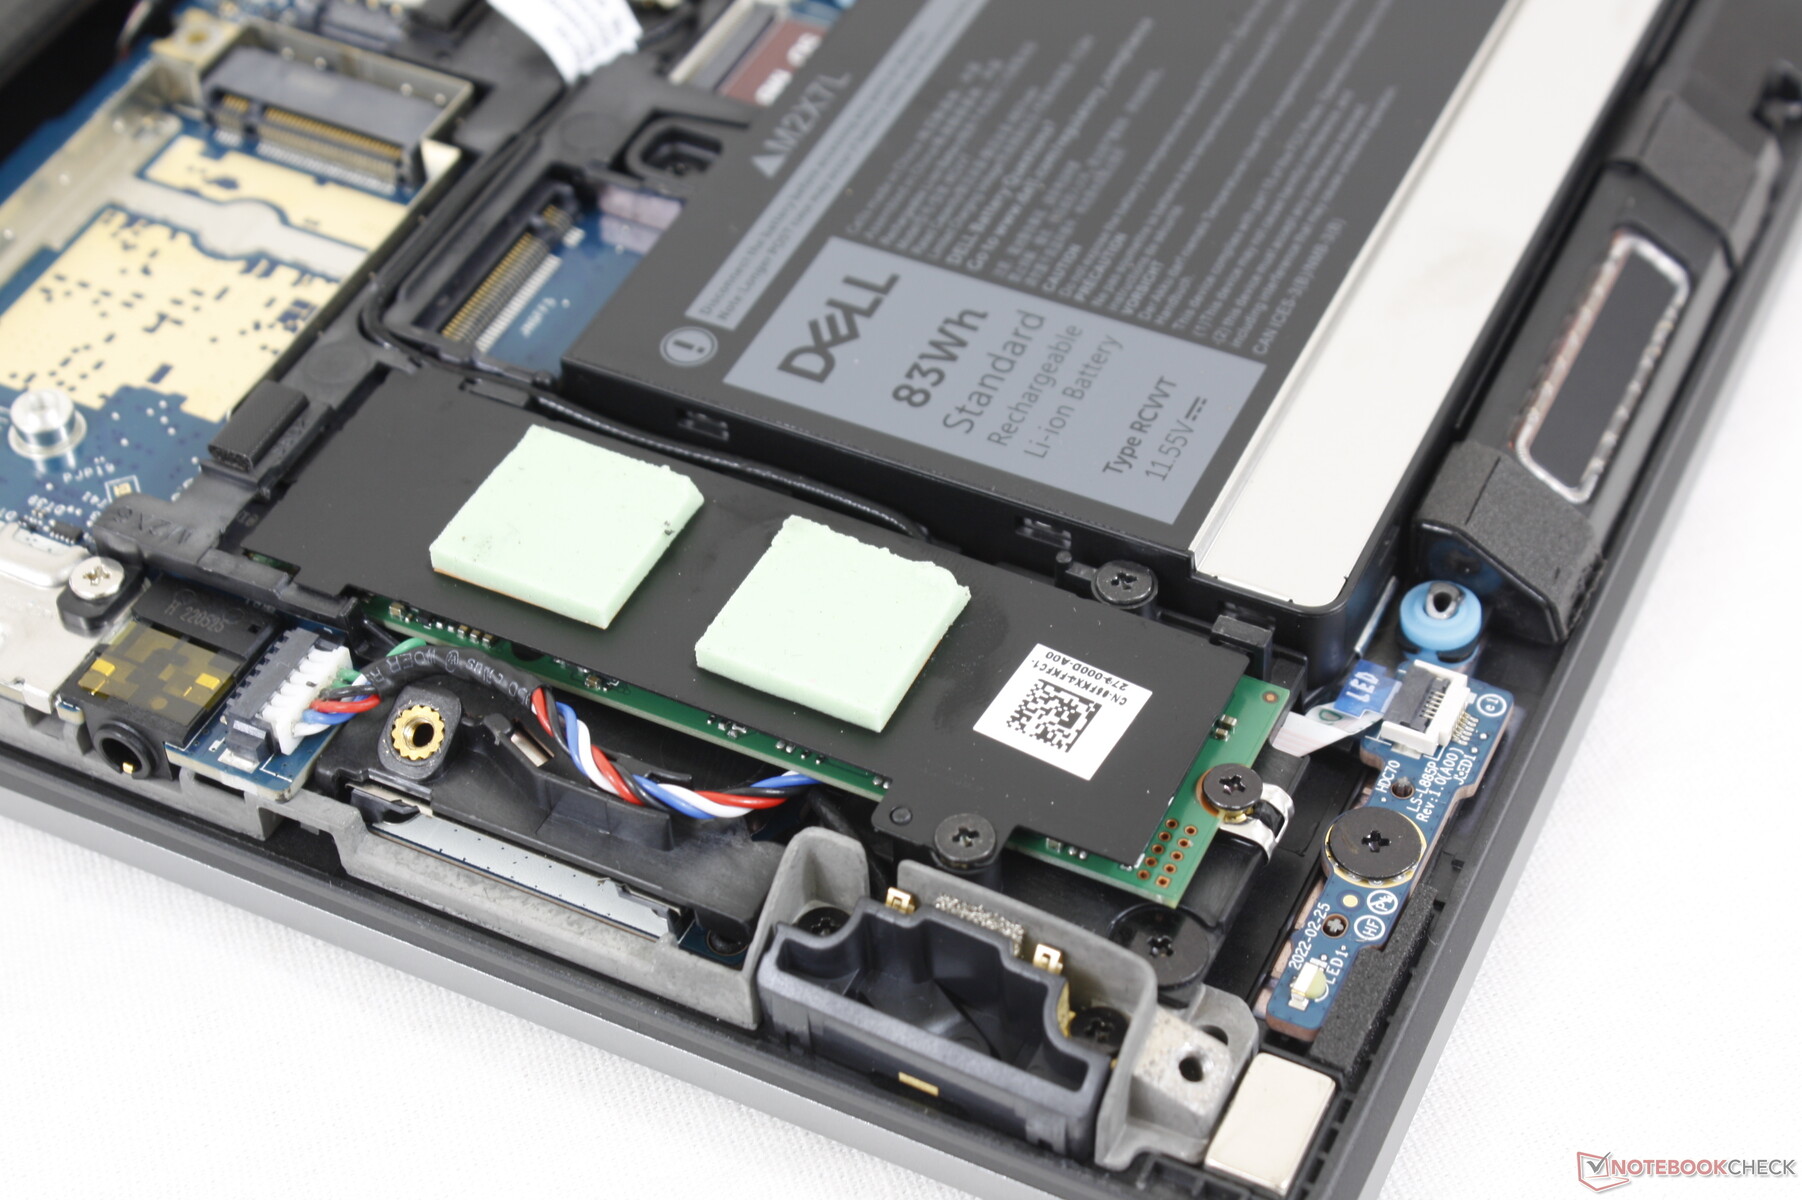
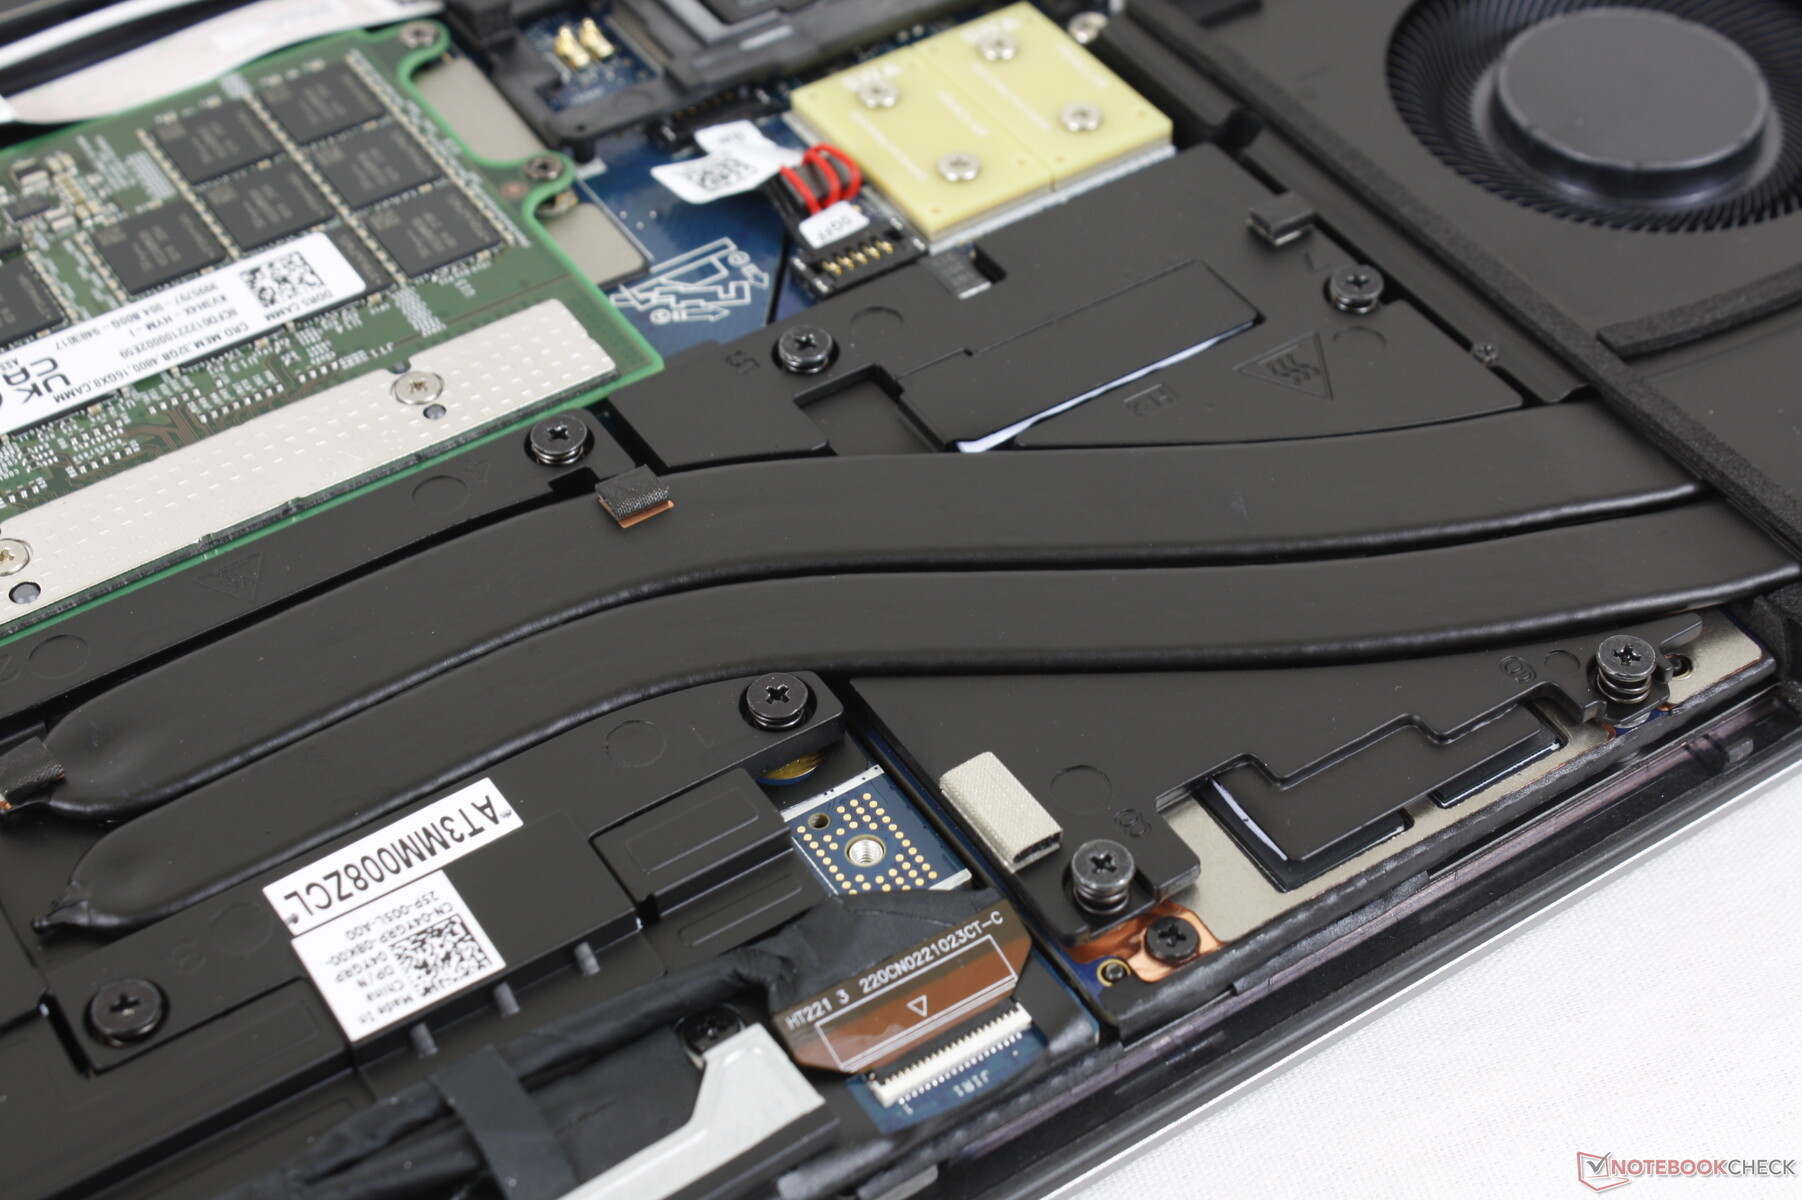
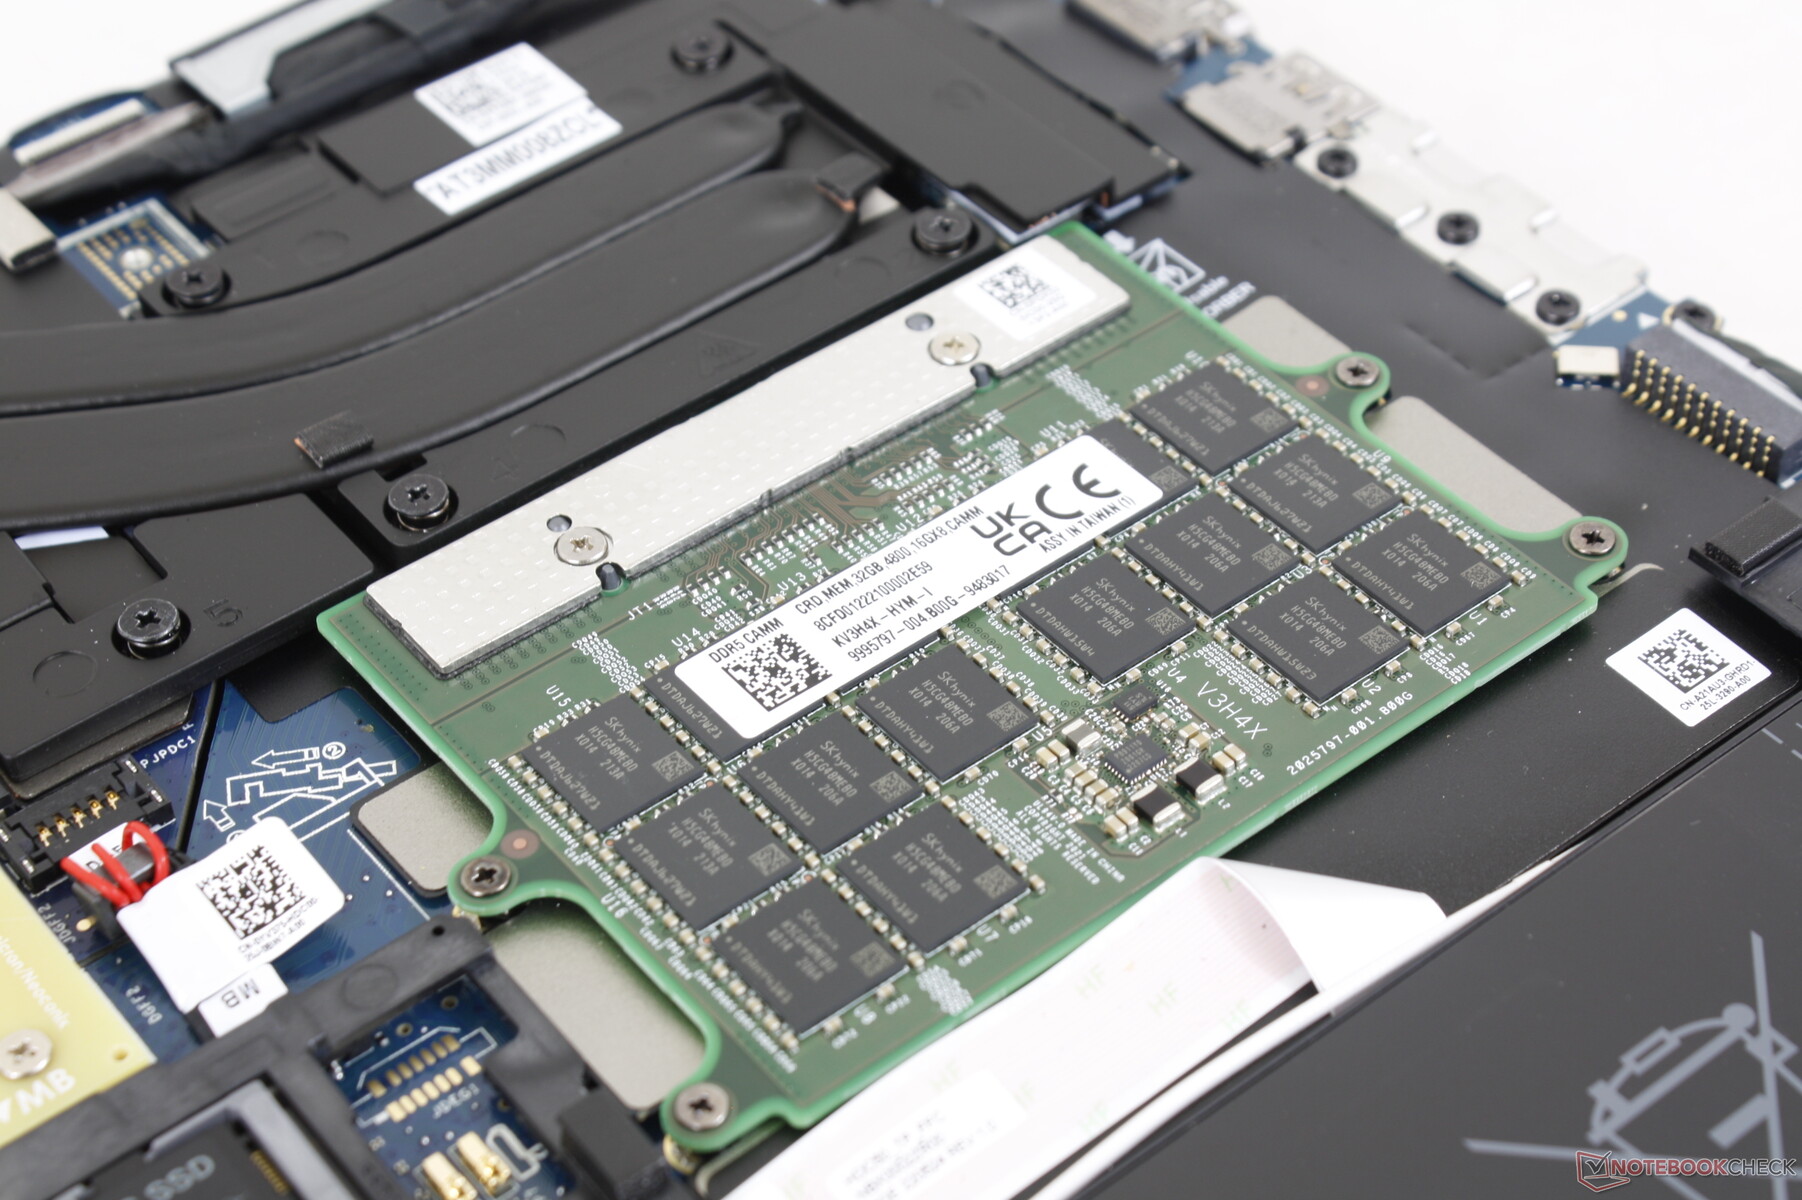
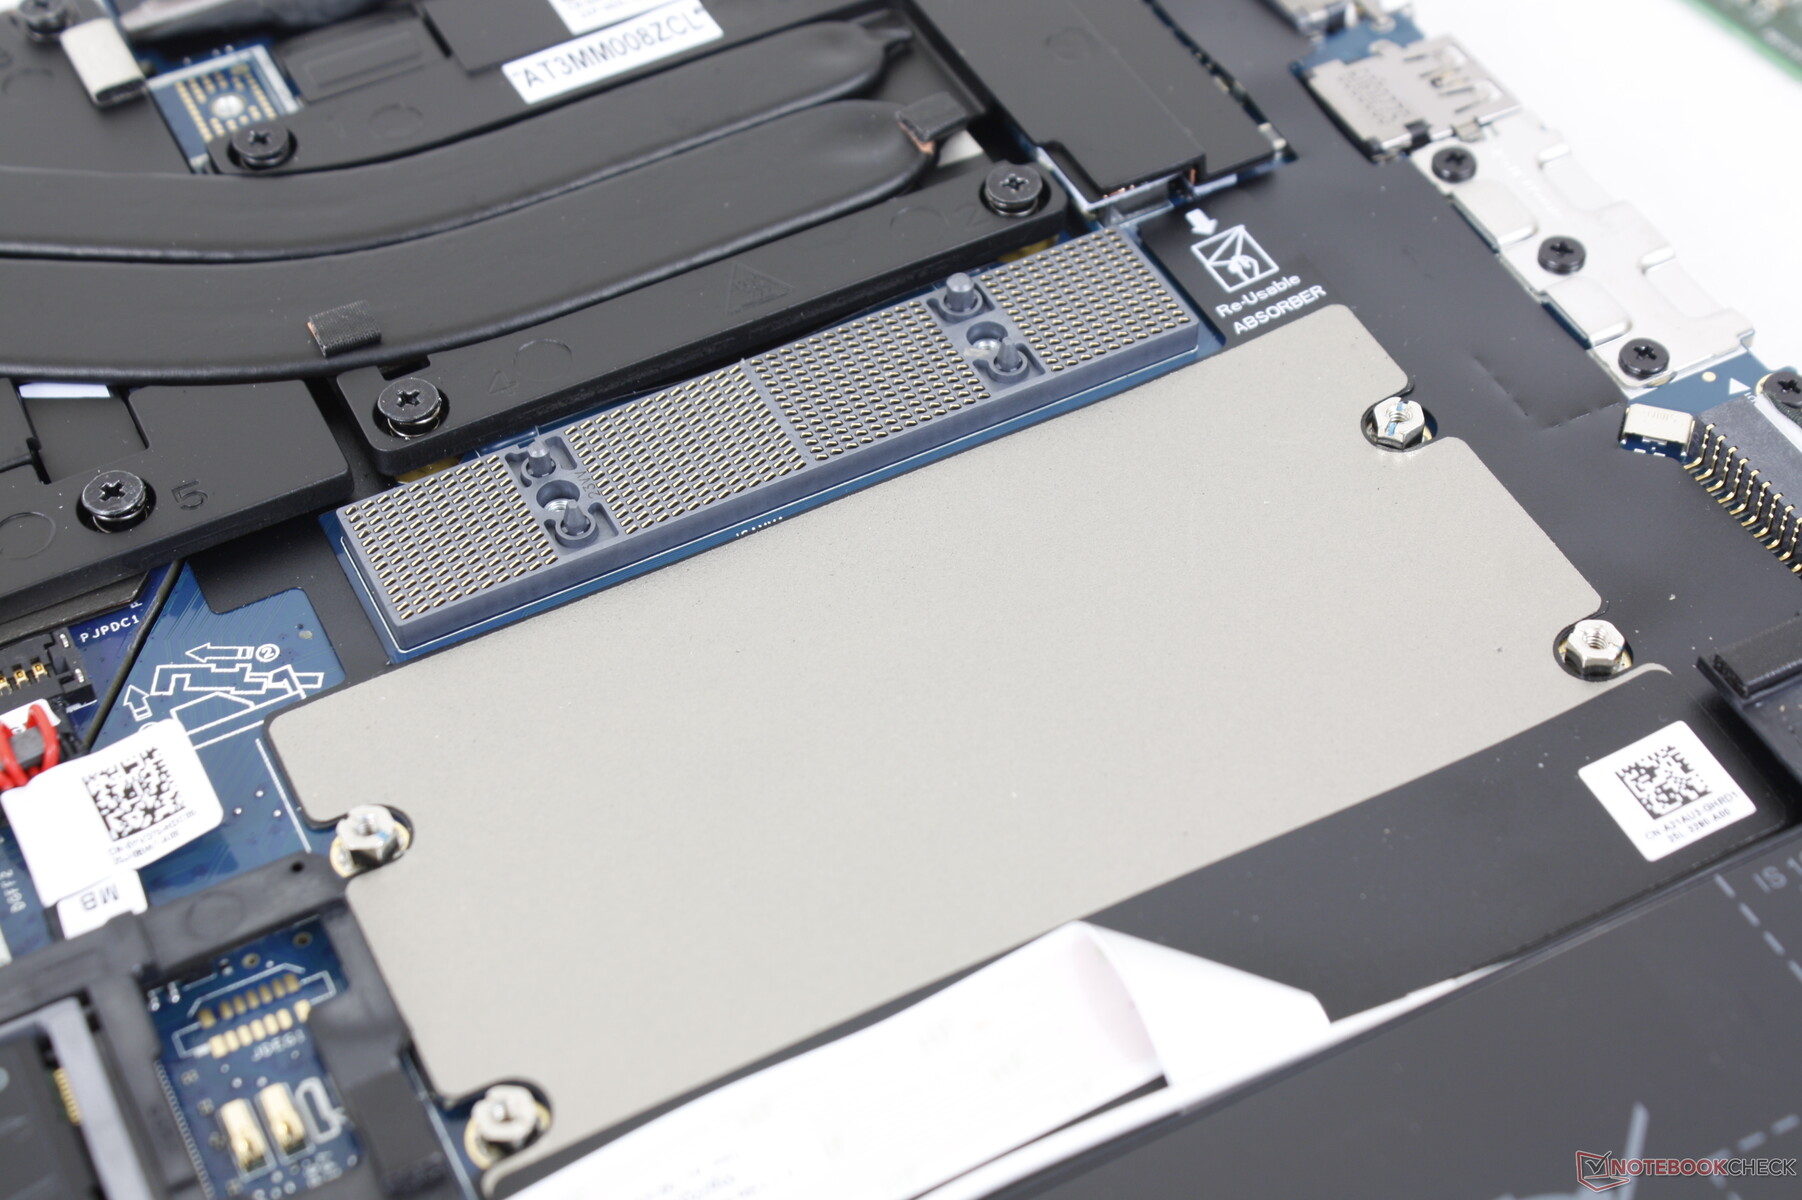
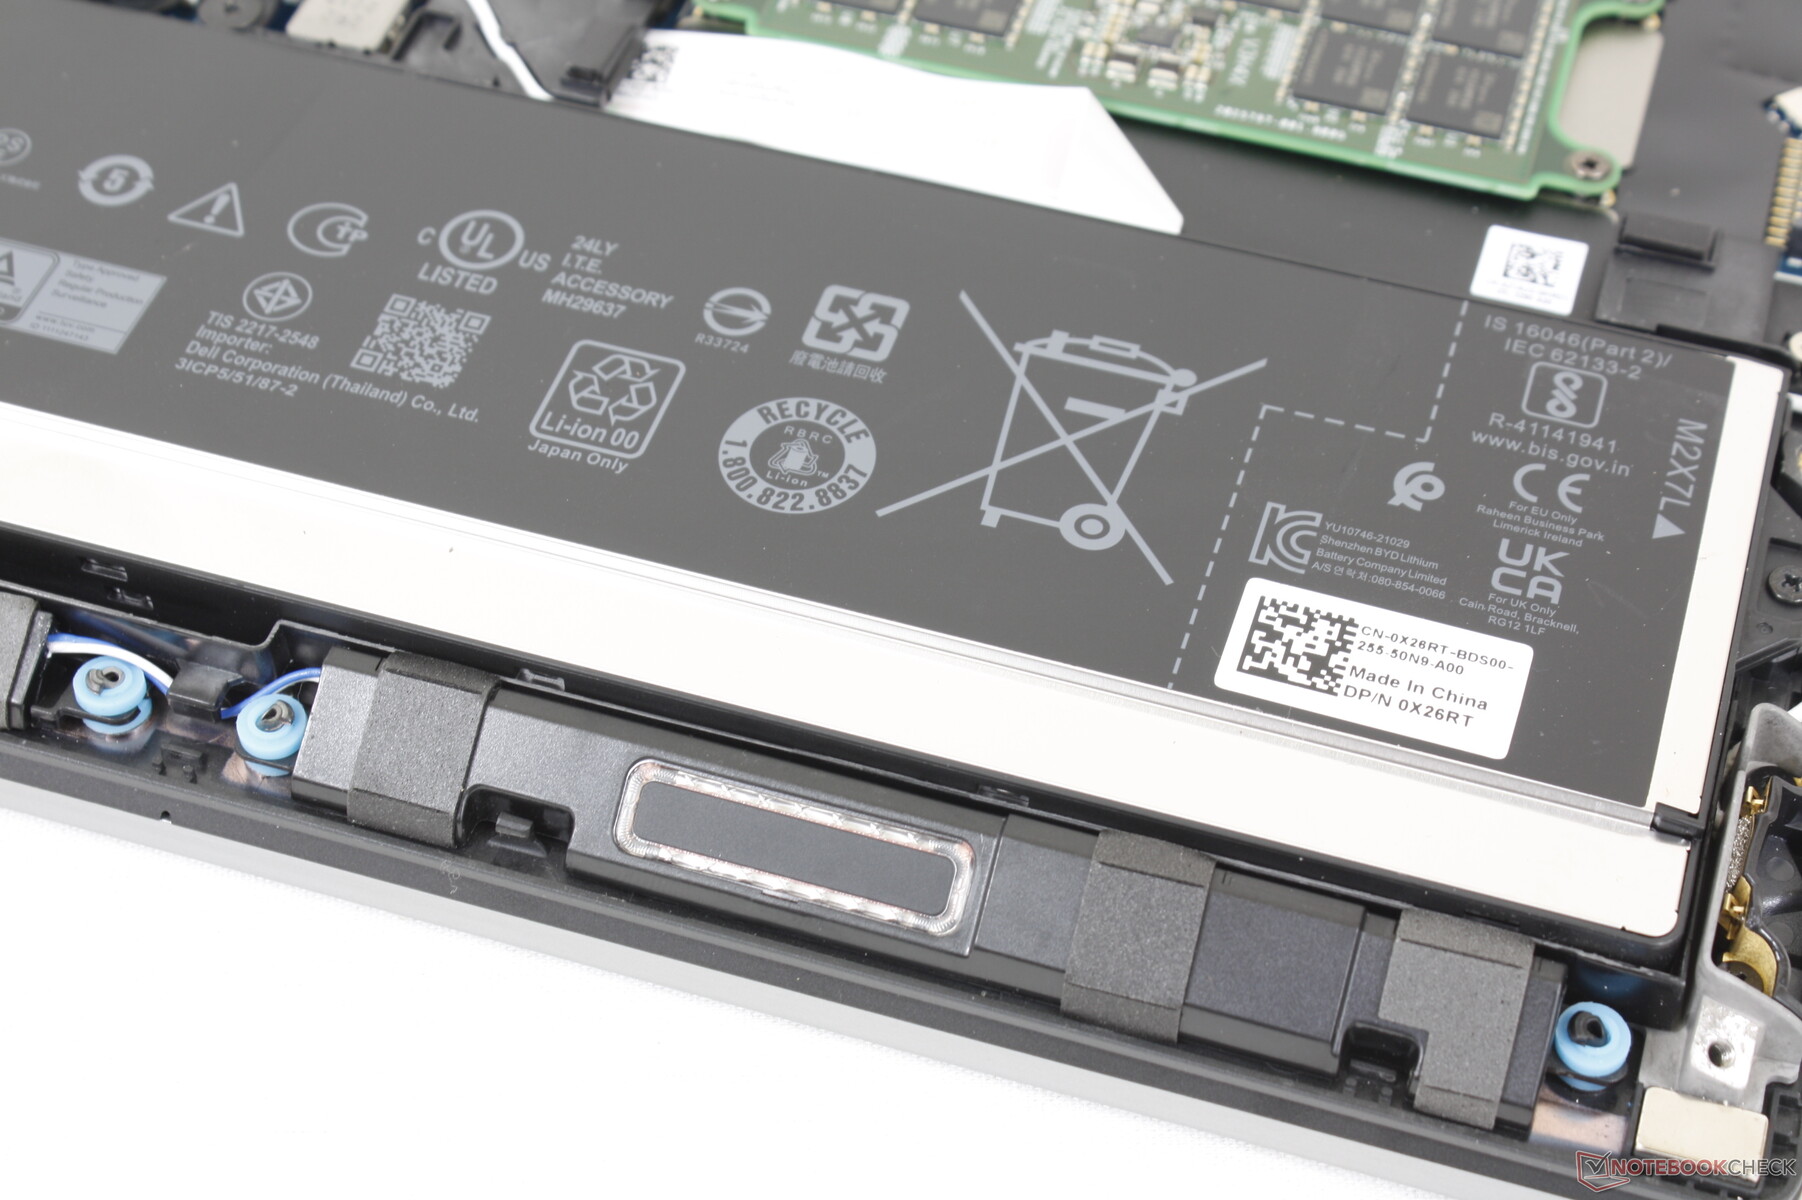
底部面板由6颗飞利浦螺钉固定,便于维修。用户可以使用两个M.2 PCIe4 x4 2280插槽,WAN插槽,Nano-SIM插槽,以及SODIMM或CAMM插槽,具体取决于配置。WLAN模块是不可拆卸的。
某些配置可以容纳多达三个M.2固态硬盘,如电池边缘附近的第三个M.2插槽就是例证。
关于CAMM内存的更多信息可以在我们的预览页面上找到 这里.
配件和保修
除了交流电适配器和文件之外,盒子里没有任何额外的东西。如果直接从戴尔购买,标准的三年有限制造商保修。
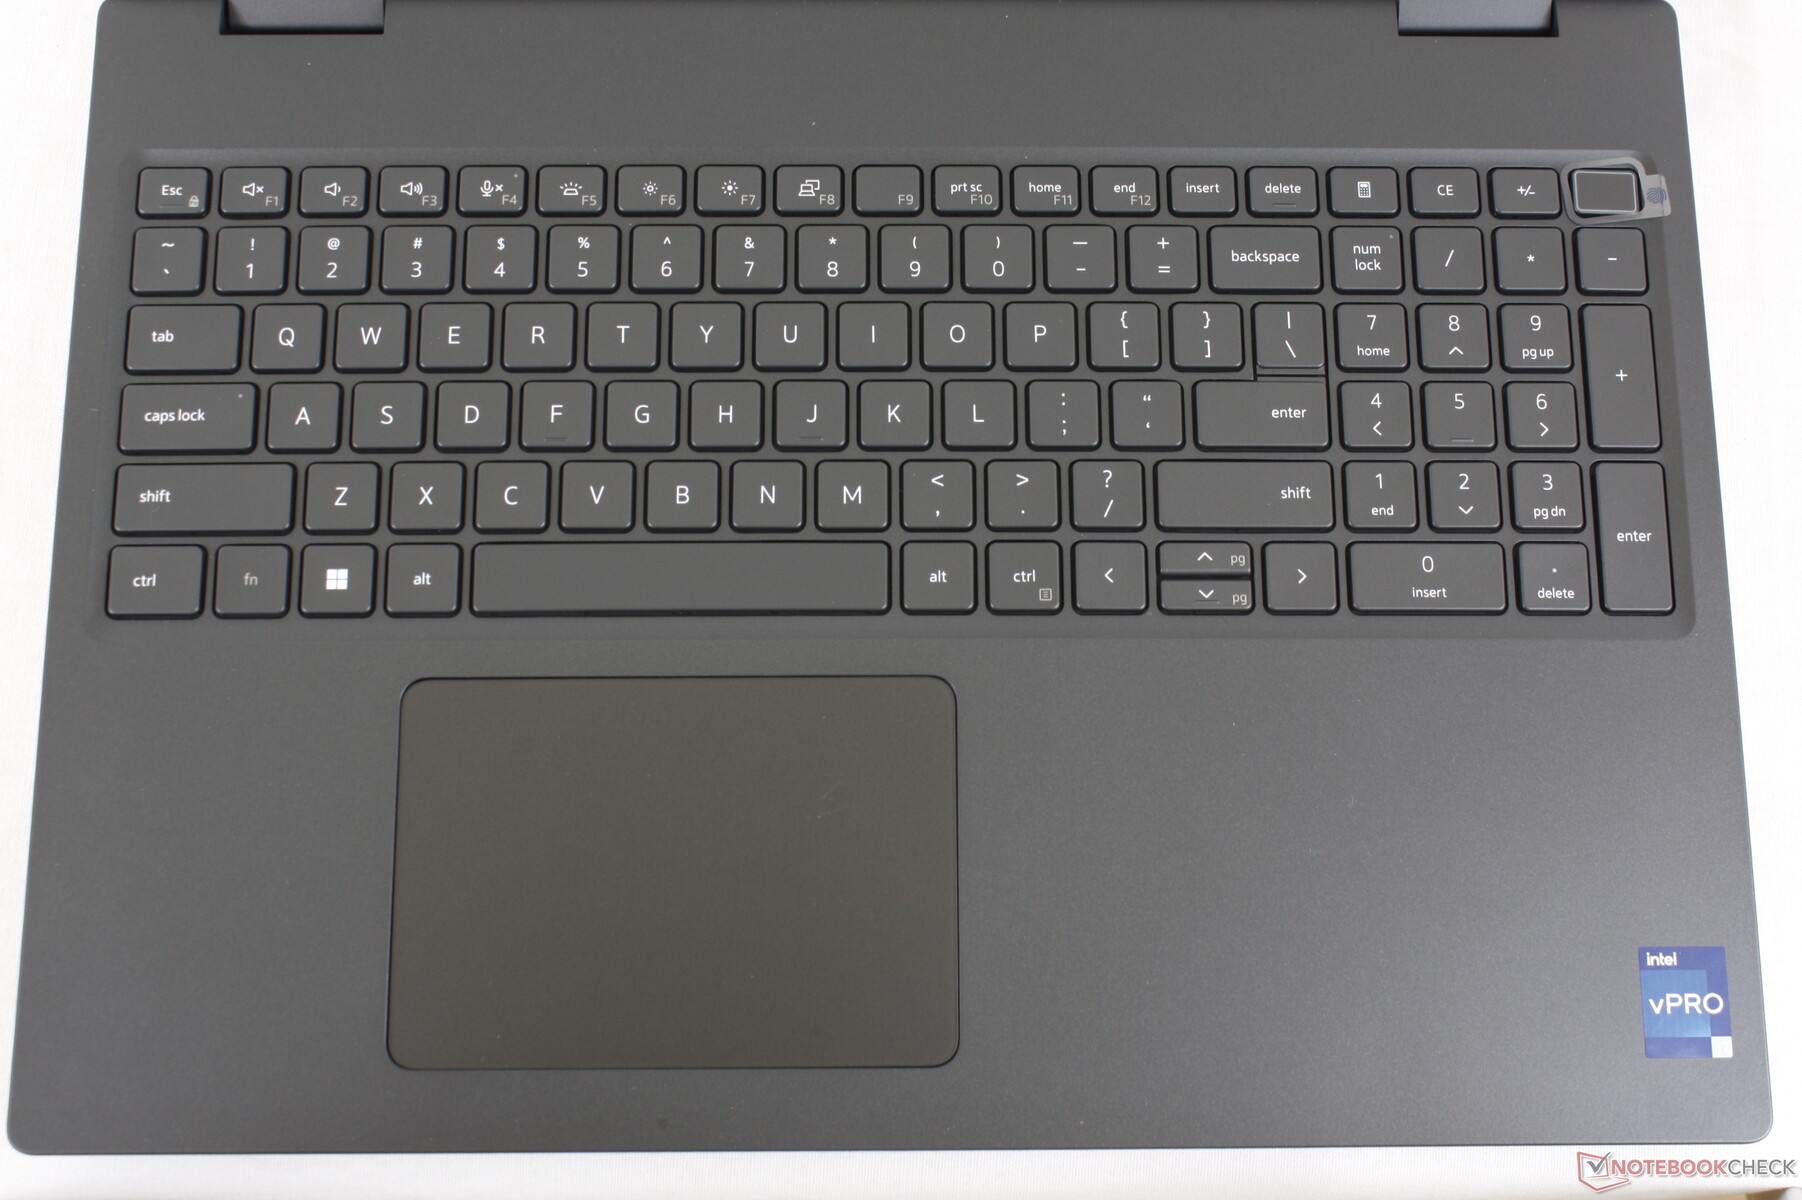
输入设备 - 舒适的键盘的大型点击板
键盘
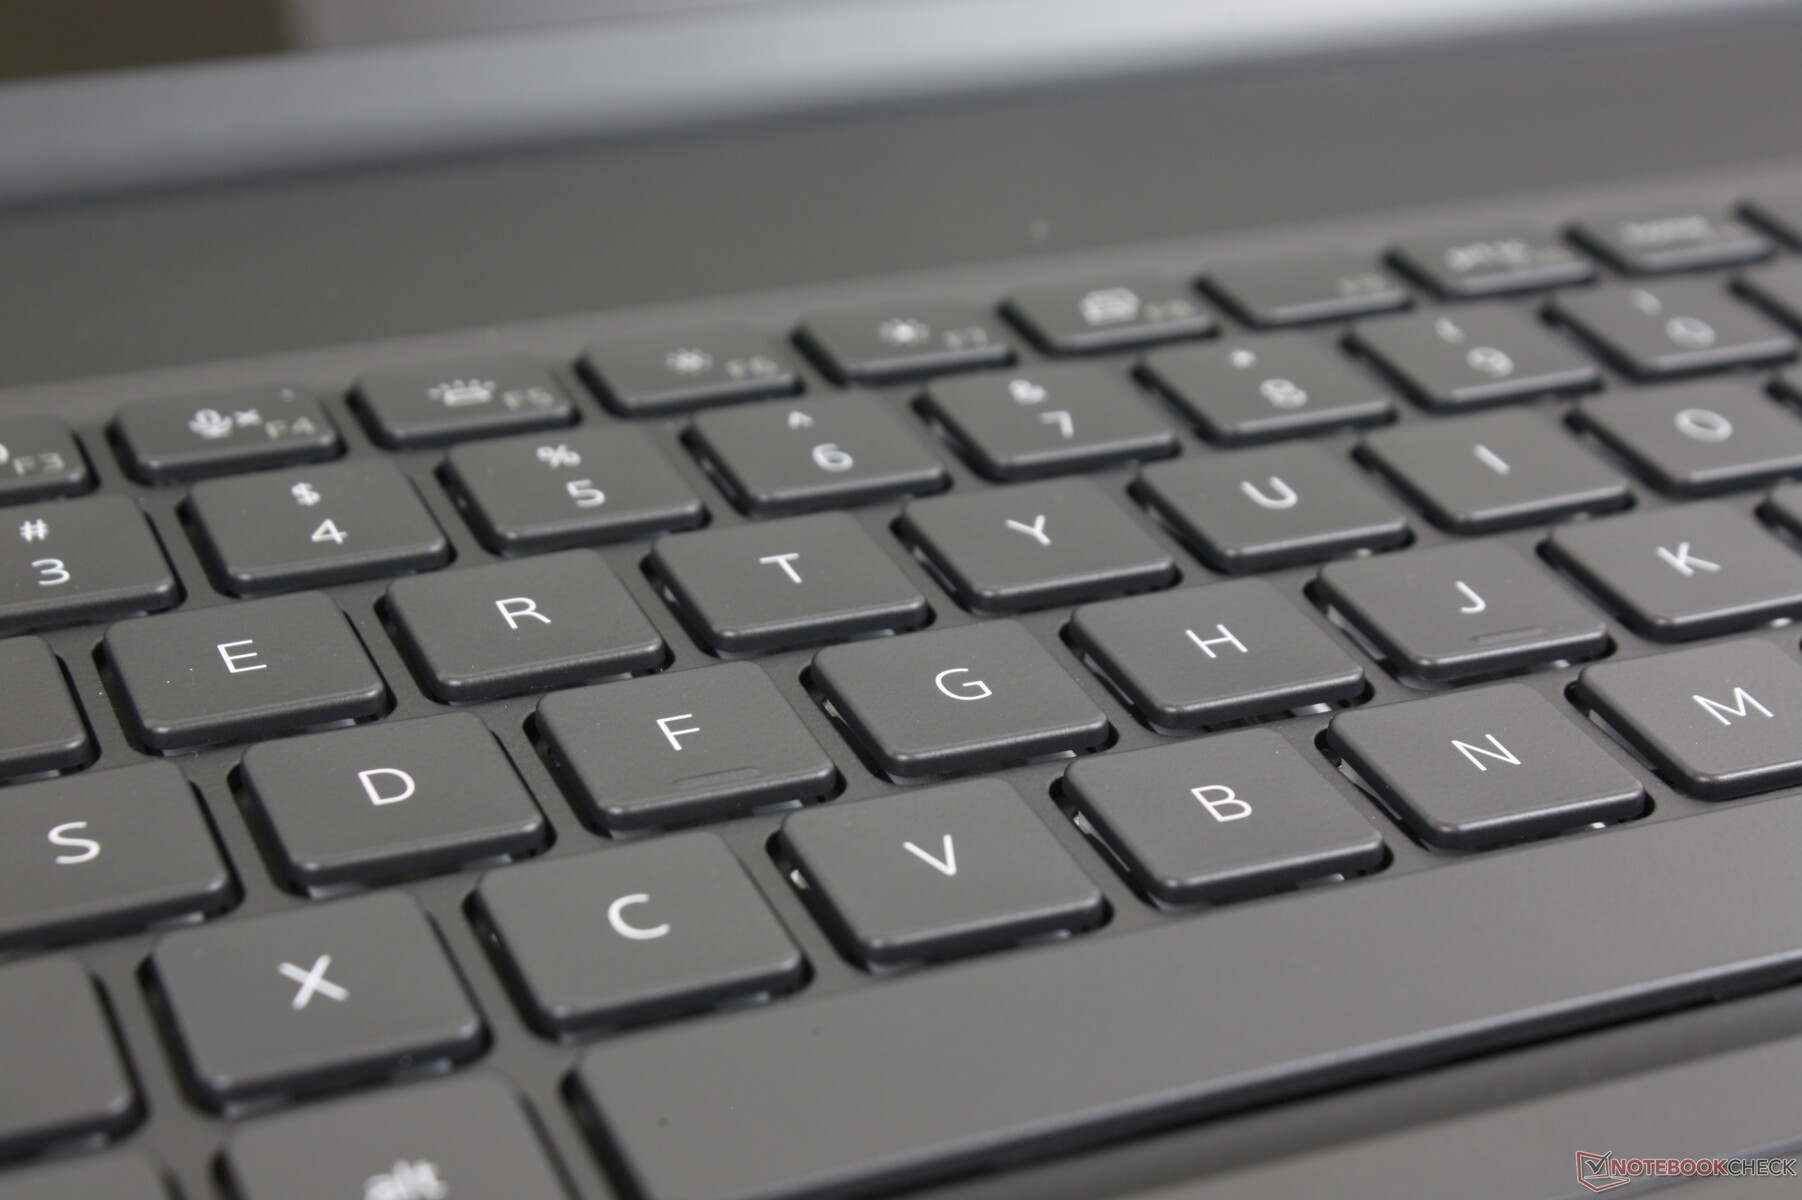
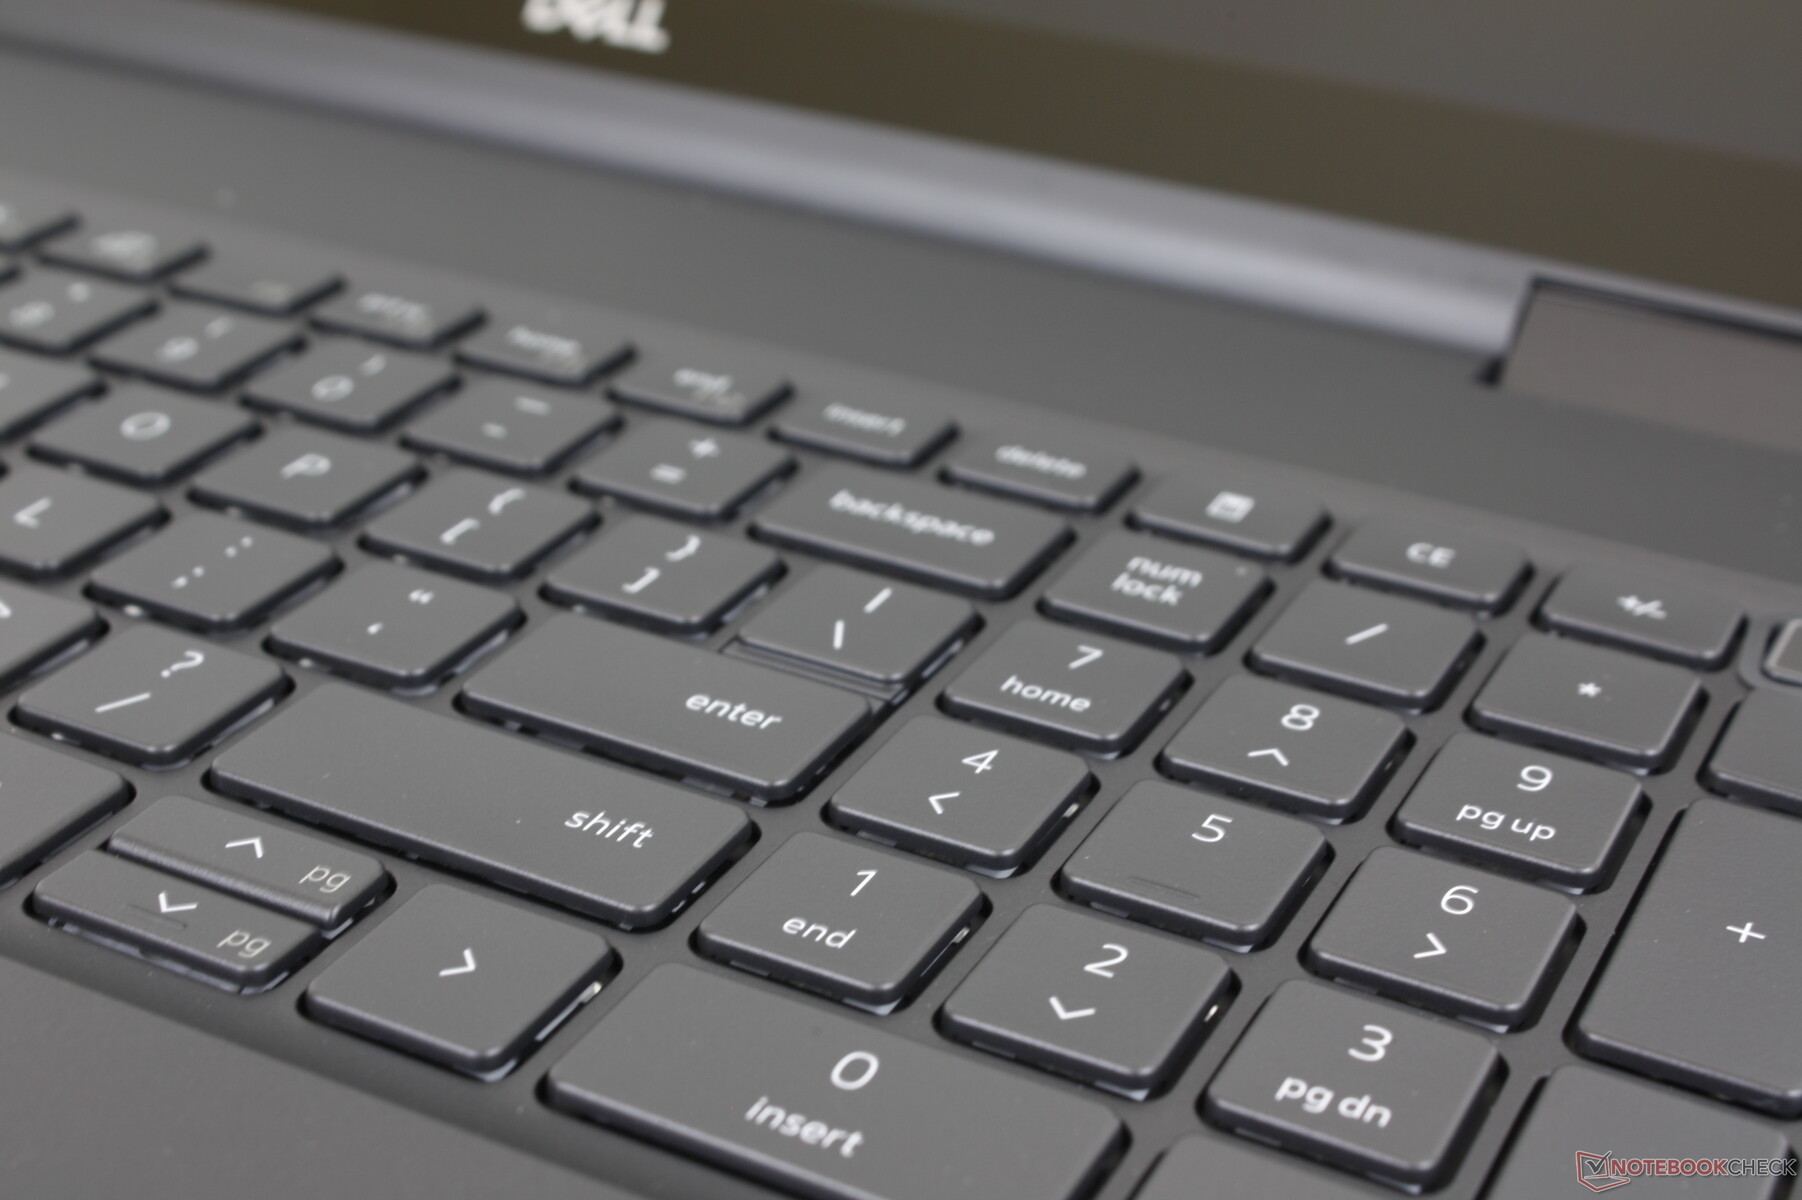
按键布局和反馈没有改变。 Precision 7550.我们发现按键的声音比XPS系列的按键略大,但反馈更强,行程更深。然而,与ThinkPad P1 G4或华硕ProArt StudioBook上较大的方向键不同,方向键仍然很拥挤。
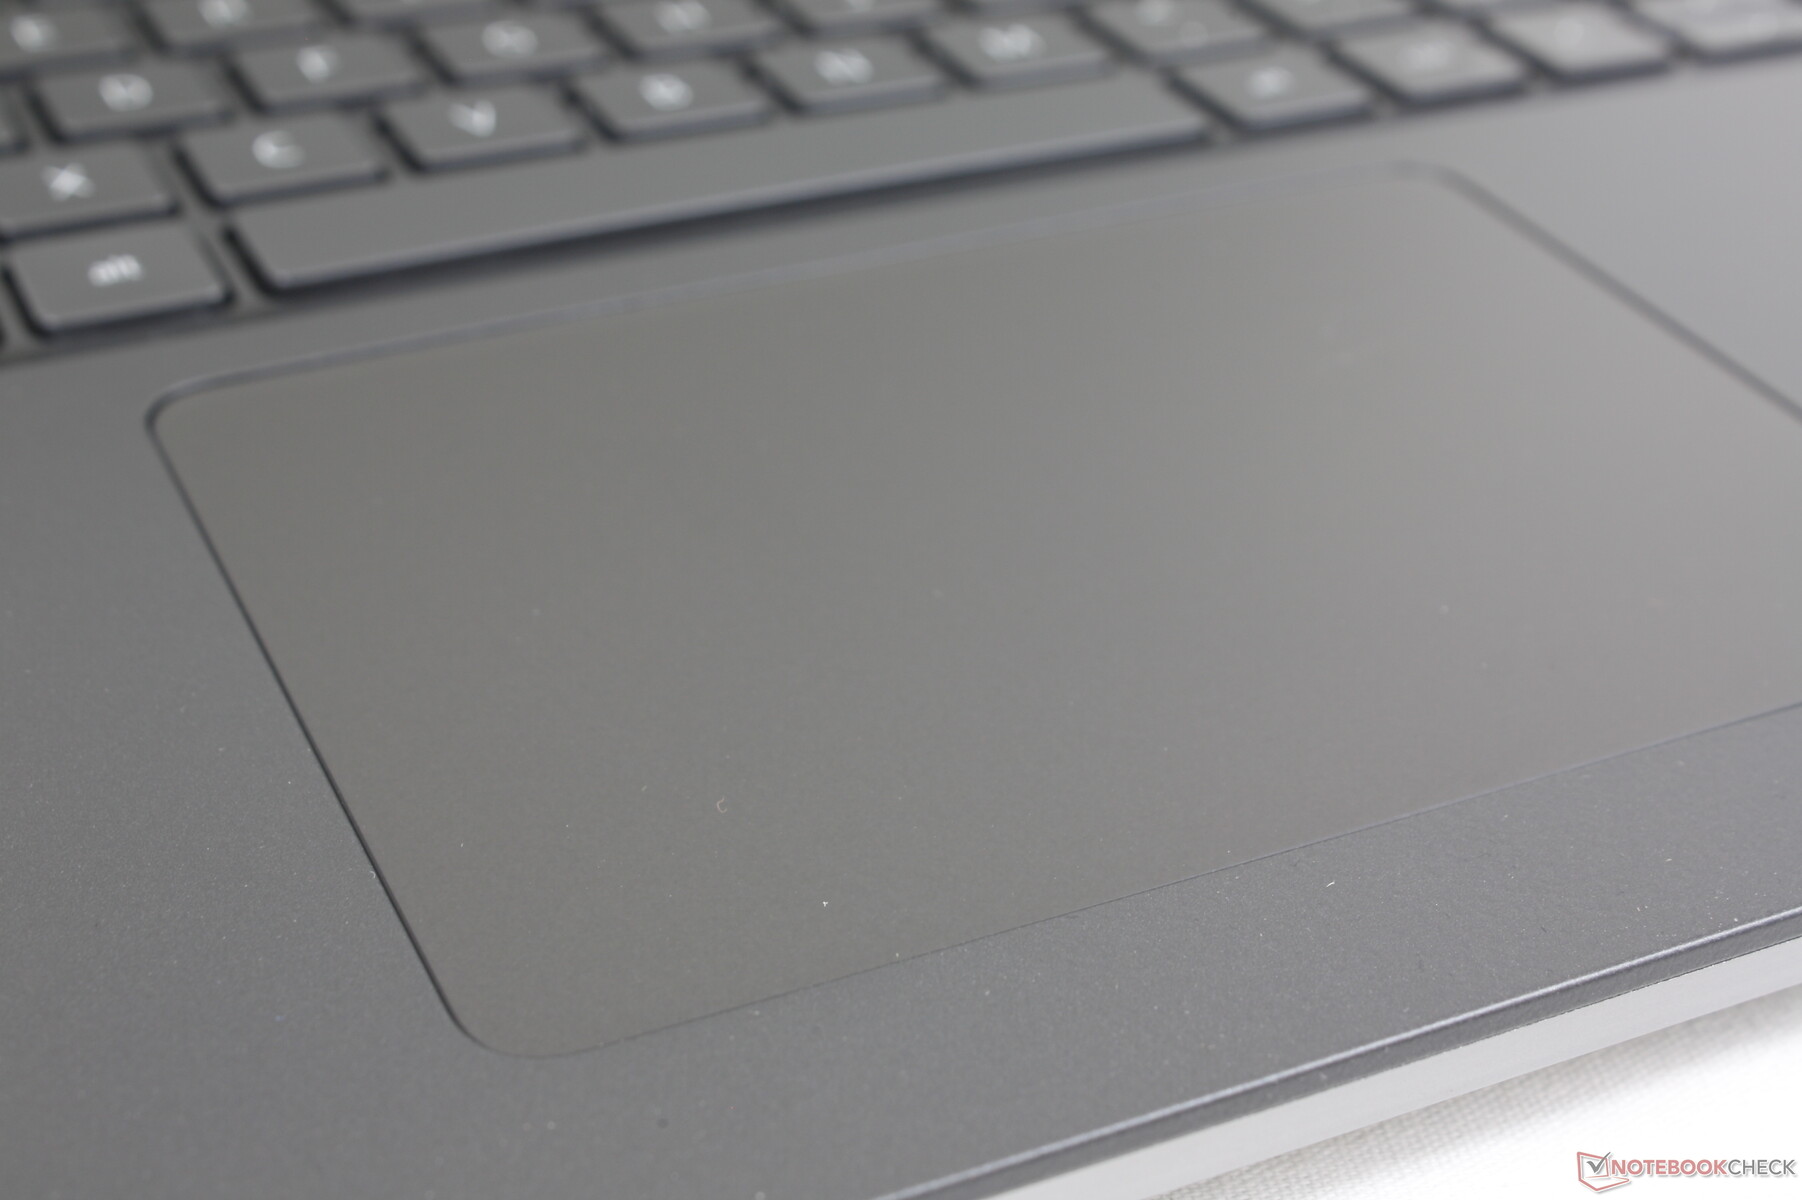
触摸板
点击板比Precision 7550上的大(11.5 x 8厘米对10 x 6.5厘米)。然而,没有更多的专用鼠标按钮,因此用户体验更接近于传统的超极本,而不是以商务为中心的ThinkPad或ZBook,在那里鼠标按钮仍然很突出。我们个人更喜欢专用按钮,因为拖放操作更容易,但缺乏按钮导致了更大的点击板面积,其他人可能会喜欢。
显示 - 没有120赫兹选项
截至本文撰写时,戴尔提供了三种显示屏选择。
- 1200p, 60 Hz, 60% sRGB, 250尼特, 非触摸
- 1200p, 60 Hz, 99% DCI-P3, 500尼特, 非触摸, IPS
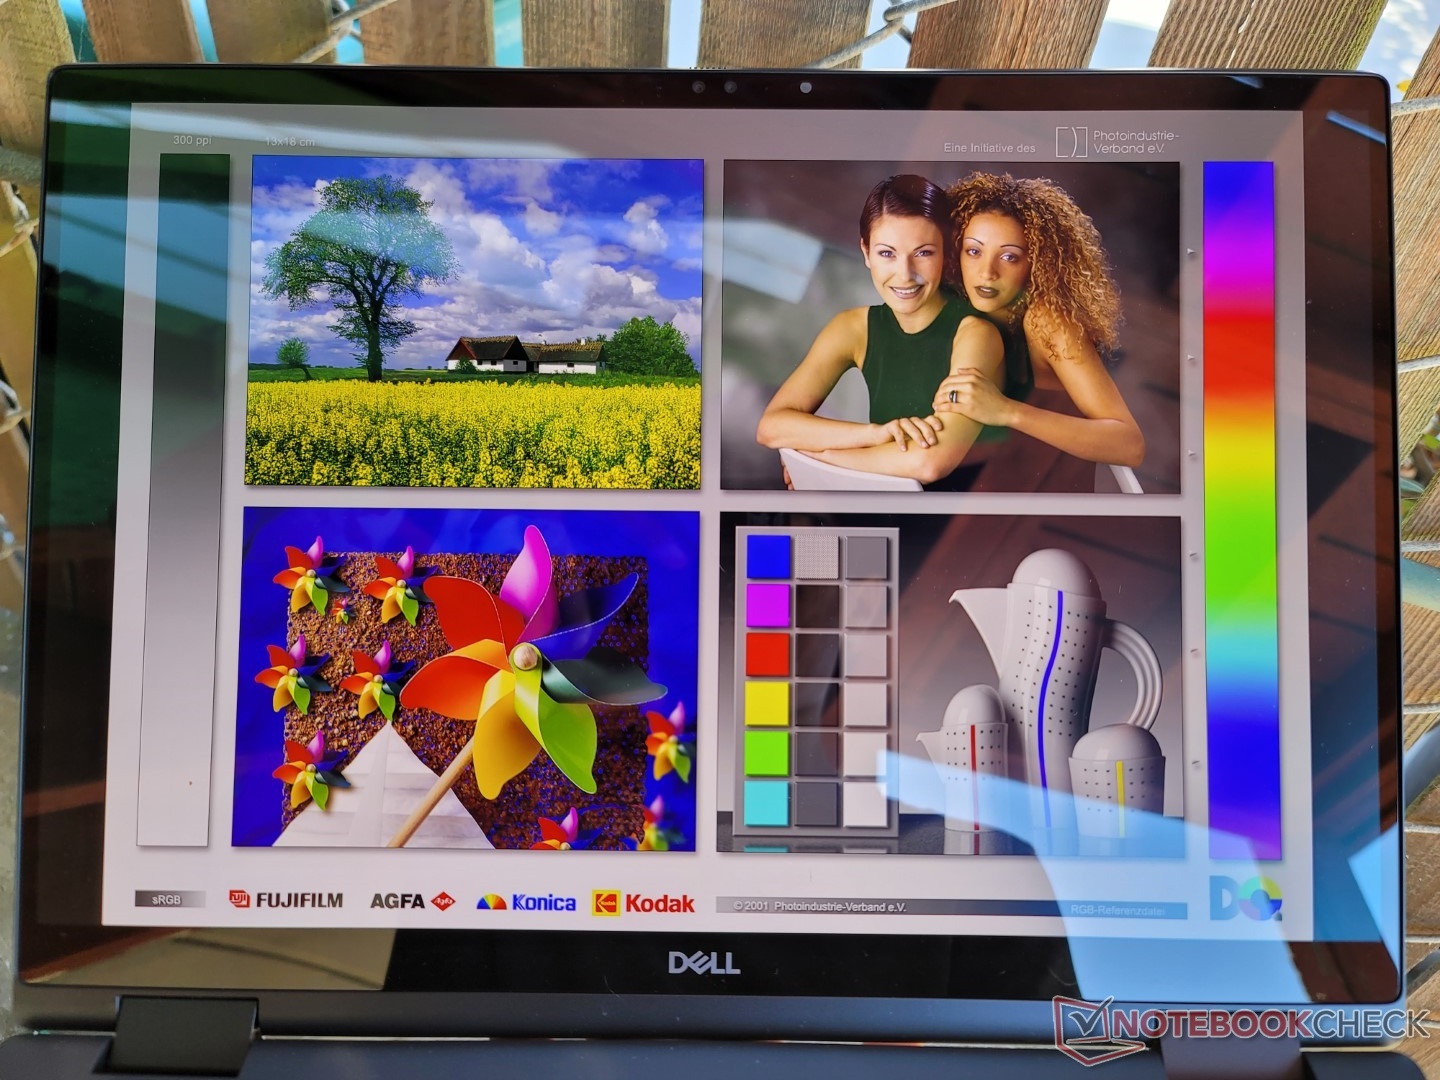
- 2400p, 60 Hz, 100% DCI-P3, 400尼特, 触摸, OLED
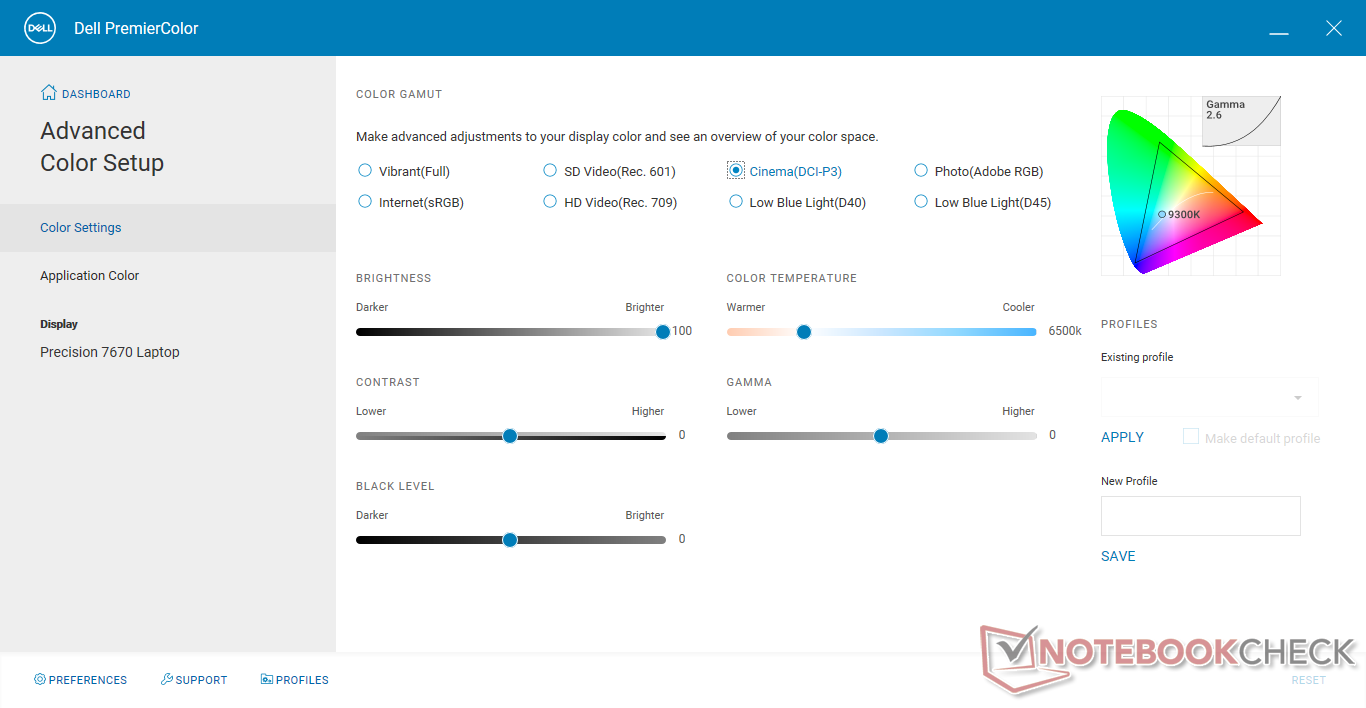
我们下面的独立测量结果只反映了上面的粗体选项。如果准确的色彩对你的工作负荷很重要,那么我们强烈建议避免使用基本的250尼特选项,因为它的色彩再现能力和许多预算消费型笔记本电脑一样差。用户应该熟悉戴尔PremierColor软件,以调整显示器的颜色配置文件。
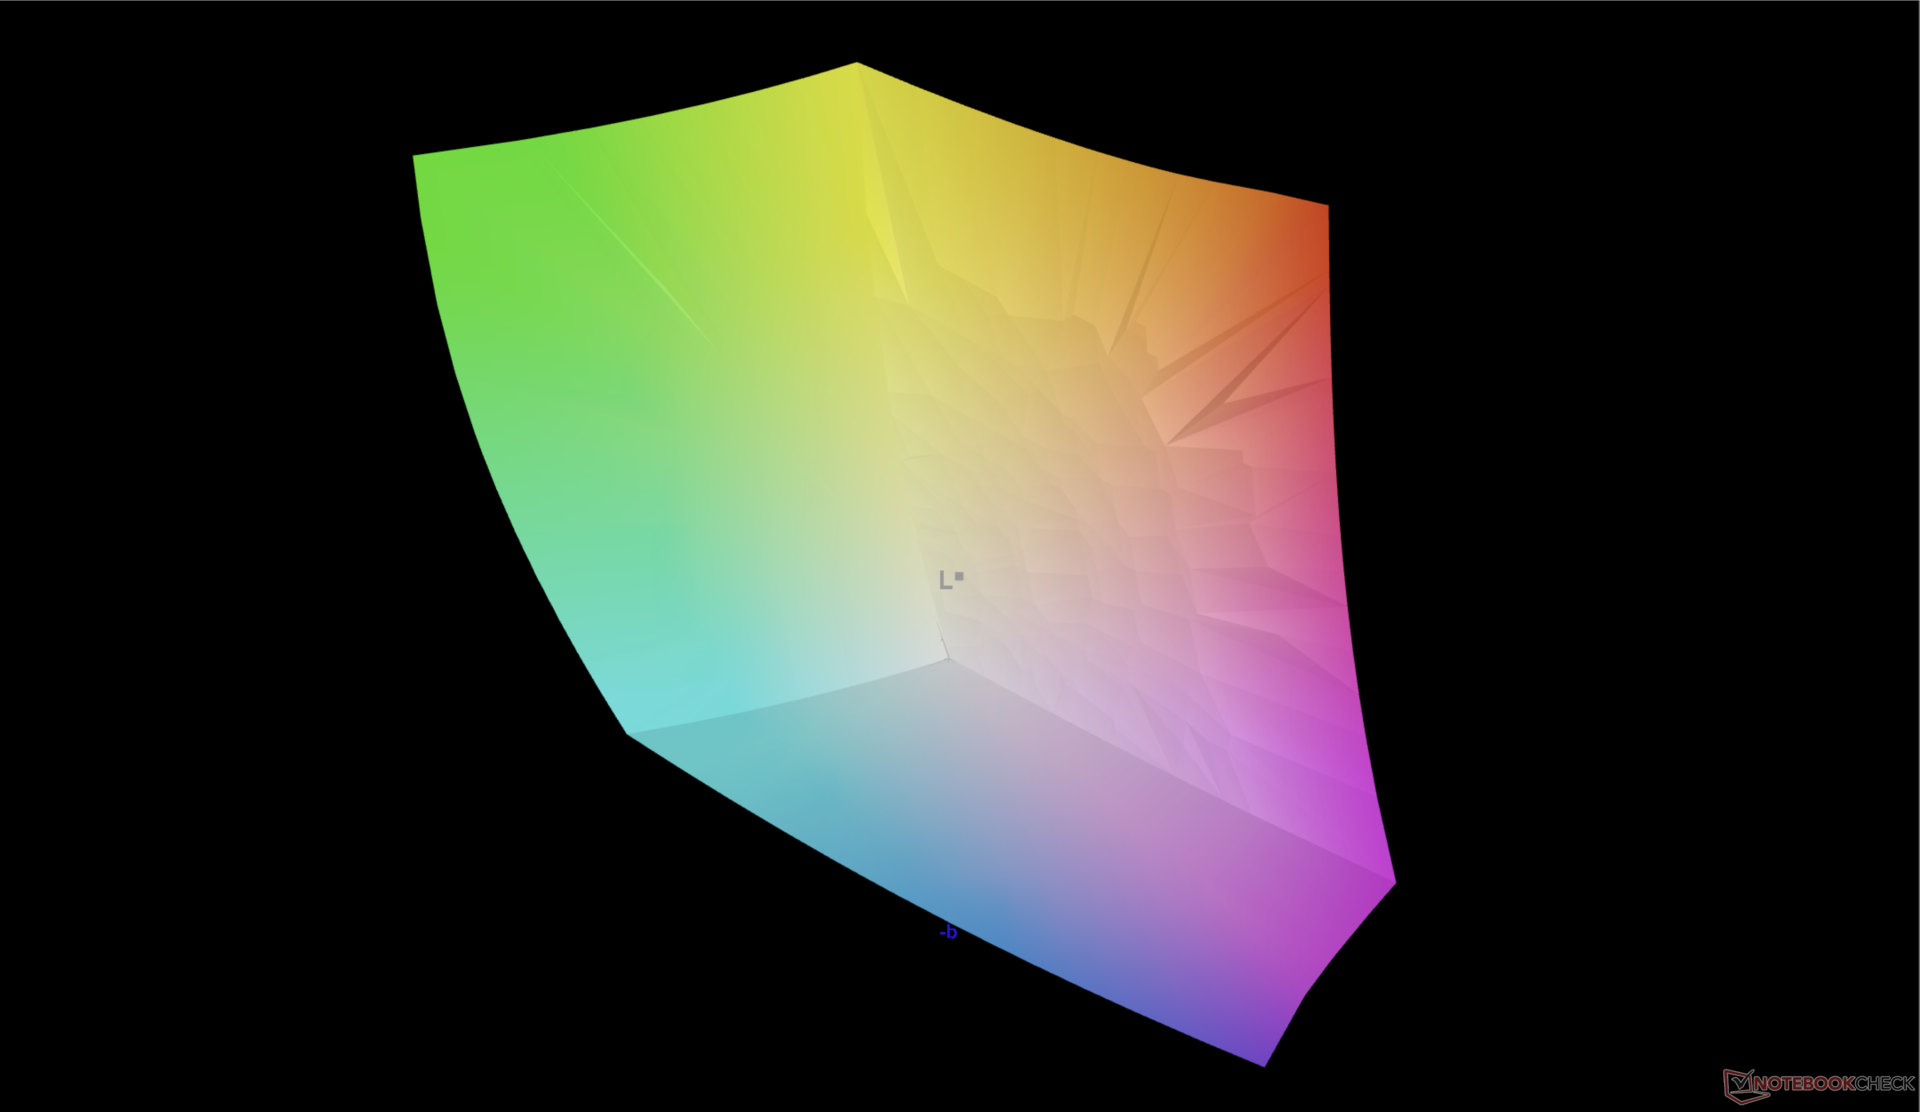
尽管我们能够用自己的X-Rite色度计确认OLED面板的全部DCI-P3覆盖率,但屏幕的最大亮度只有约340尼特,而广告中的400尼特甚至在禁用自动亮度控制之后。这使得我们的显示器比其他大多数工作站更暗,在这些工作站中,450尼特或更高的亮度是很常见的。
| |||||||||||||||||||||||||
Brightness Distribution: 98 %
Center on Battery: 340.1 cd/m²
Contrast: ∞:1 (Black: 0 cd/m²)
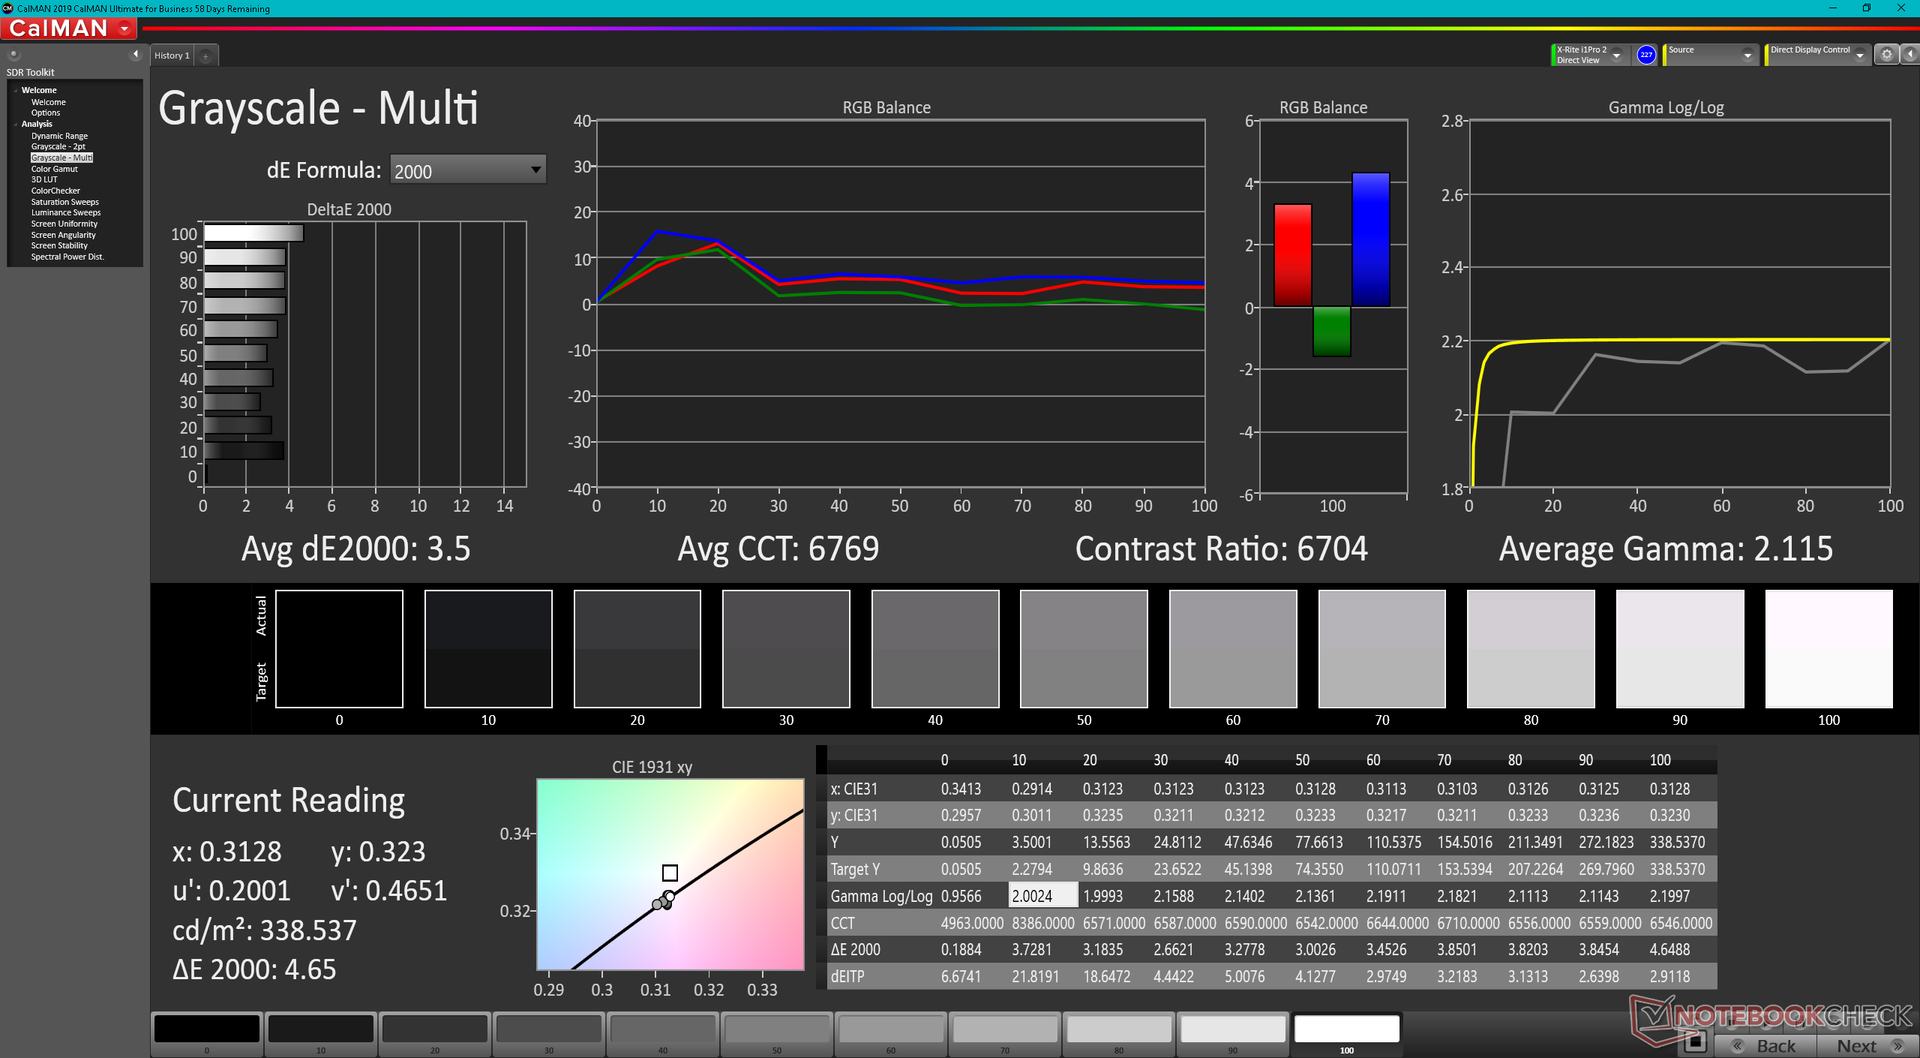
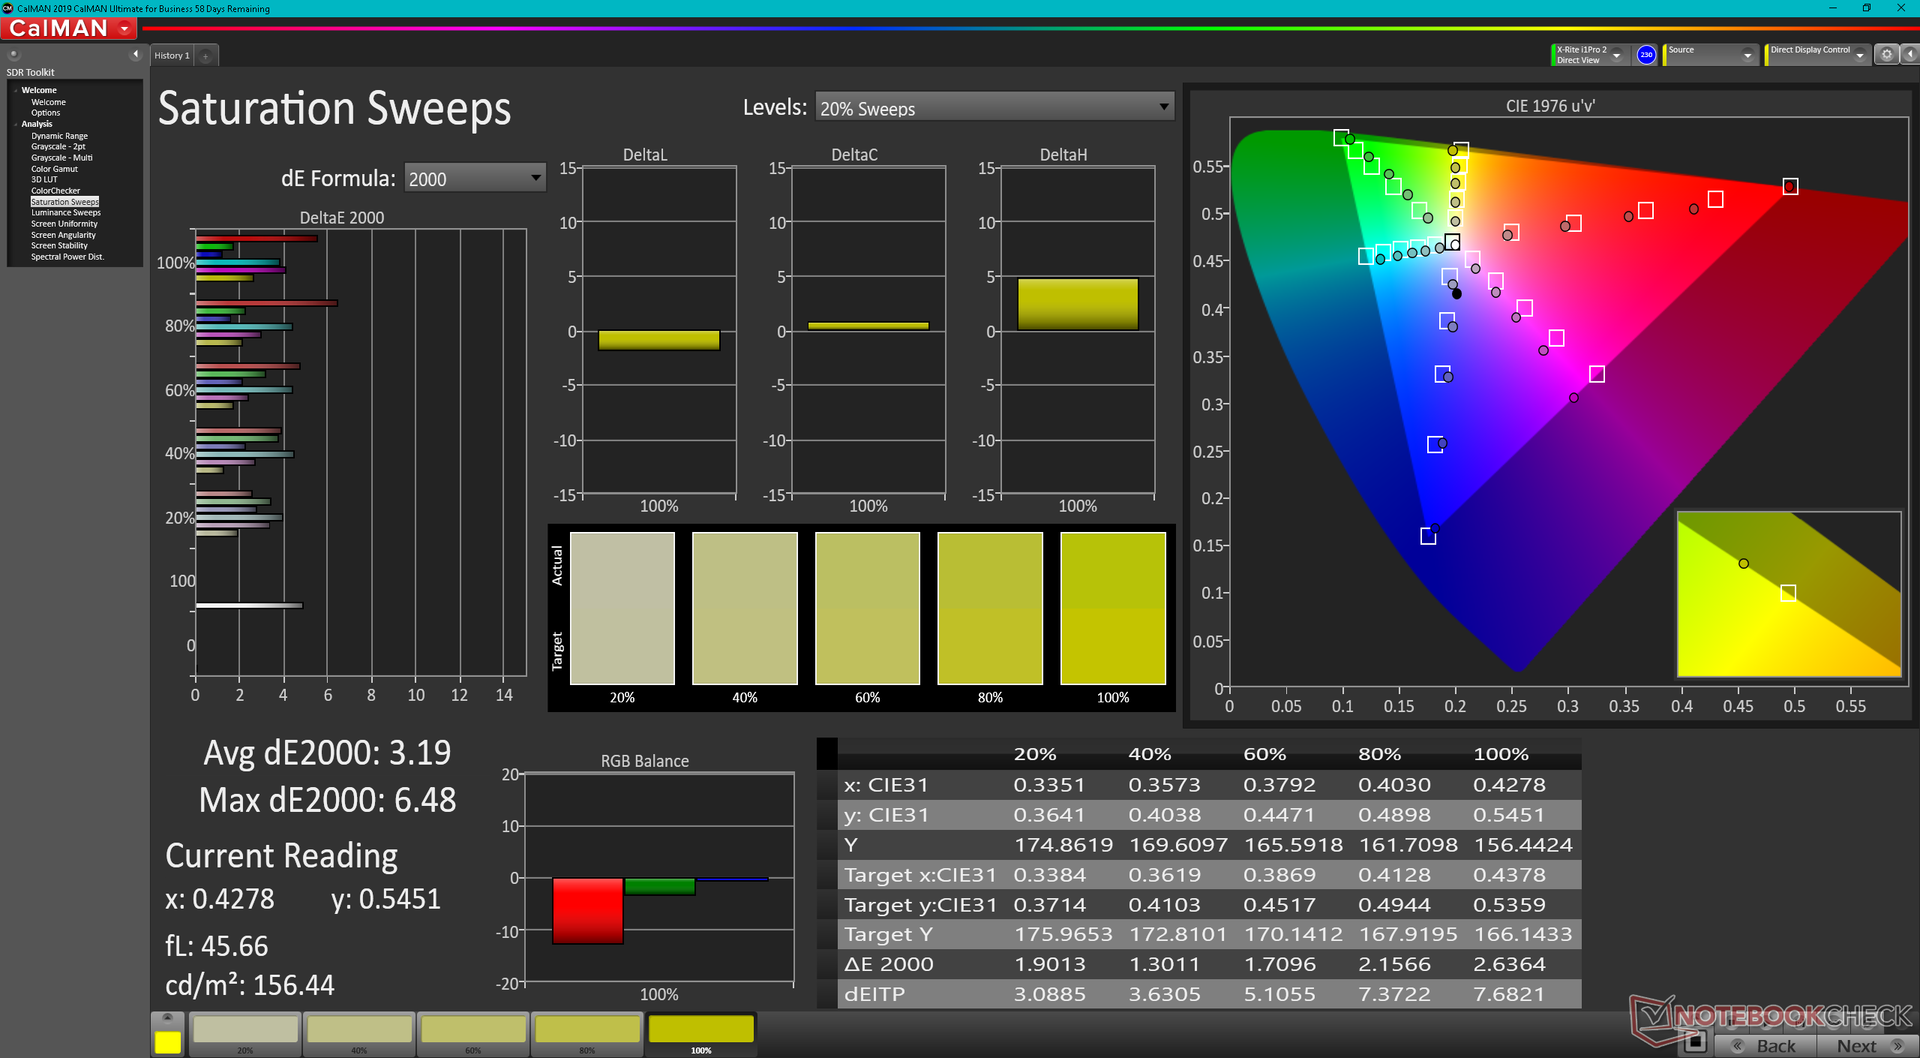
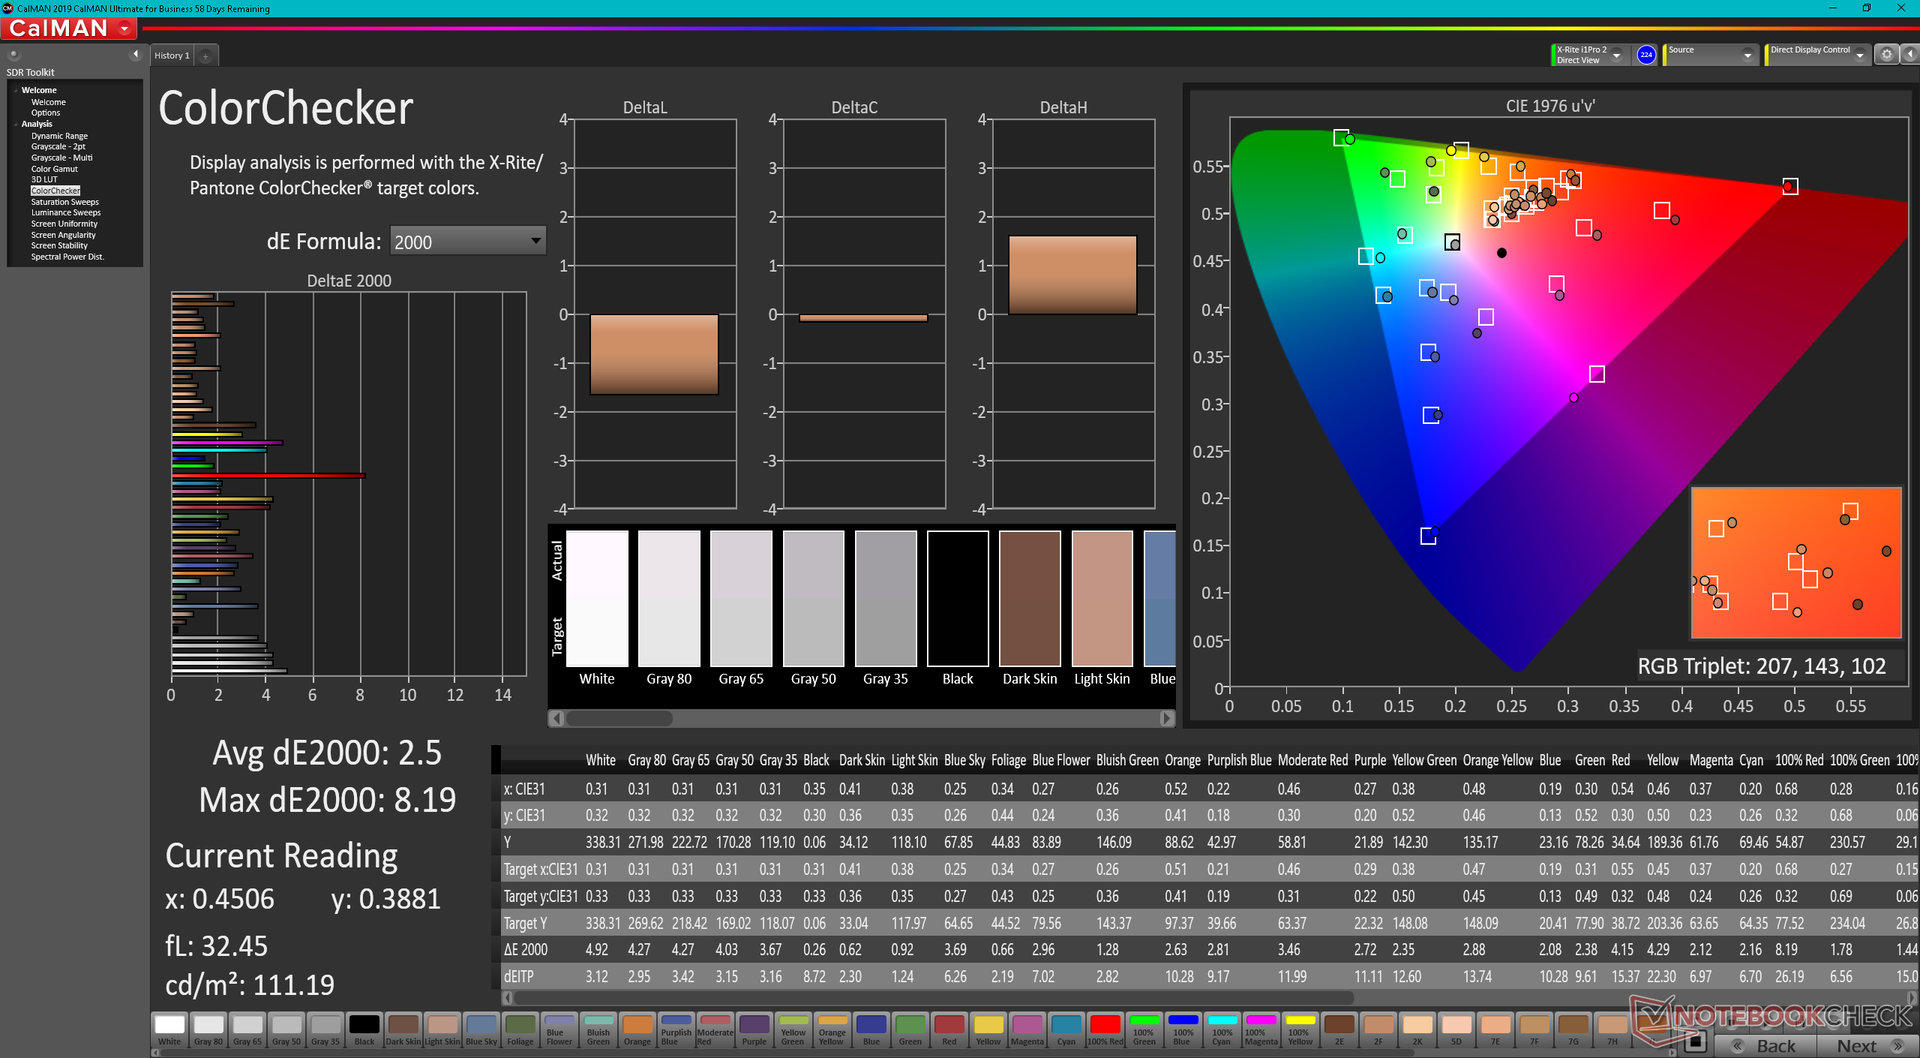
ΔE ColorChecker Calman: 2.5 | ∀{0.5-29.43 Ø4.71}
ΔE Greyscale Calman: 3.5 | ∀{0.09-98 Ø4.96}
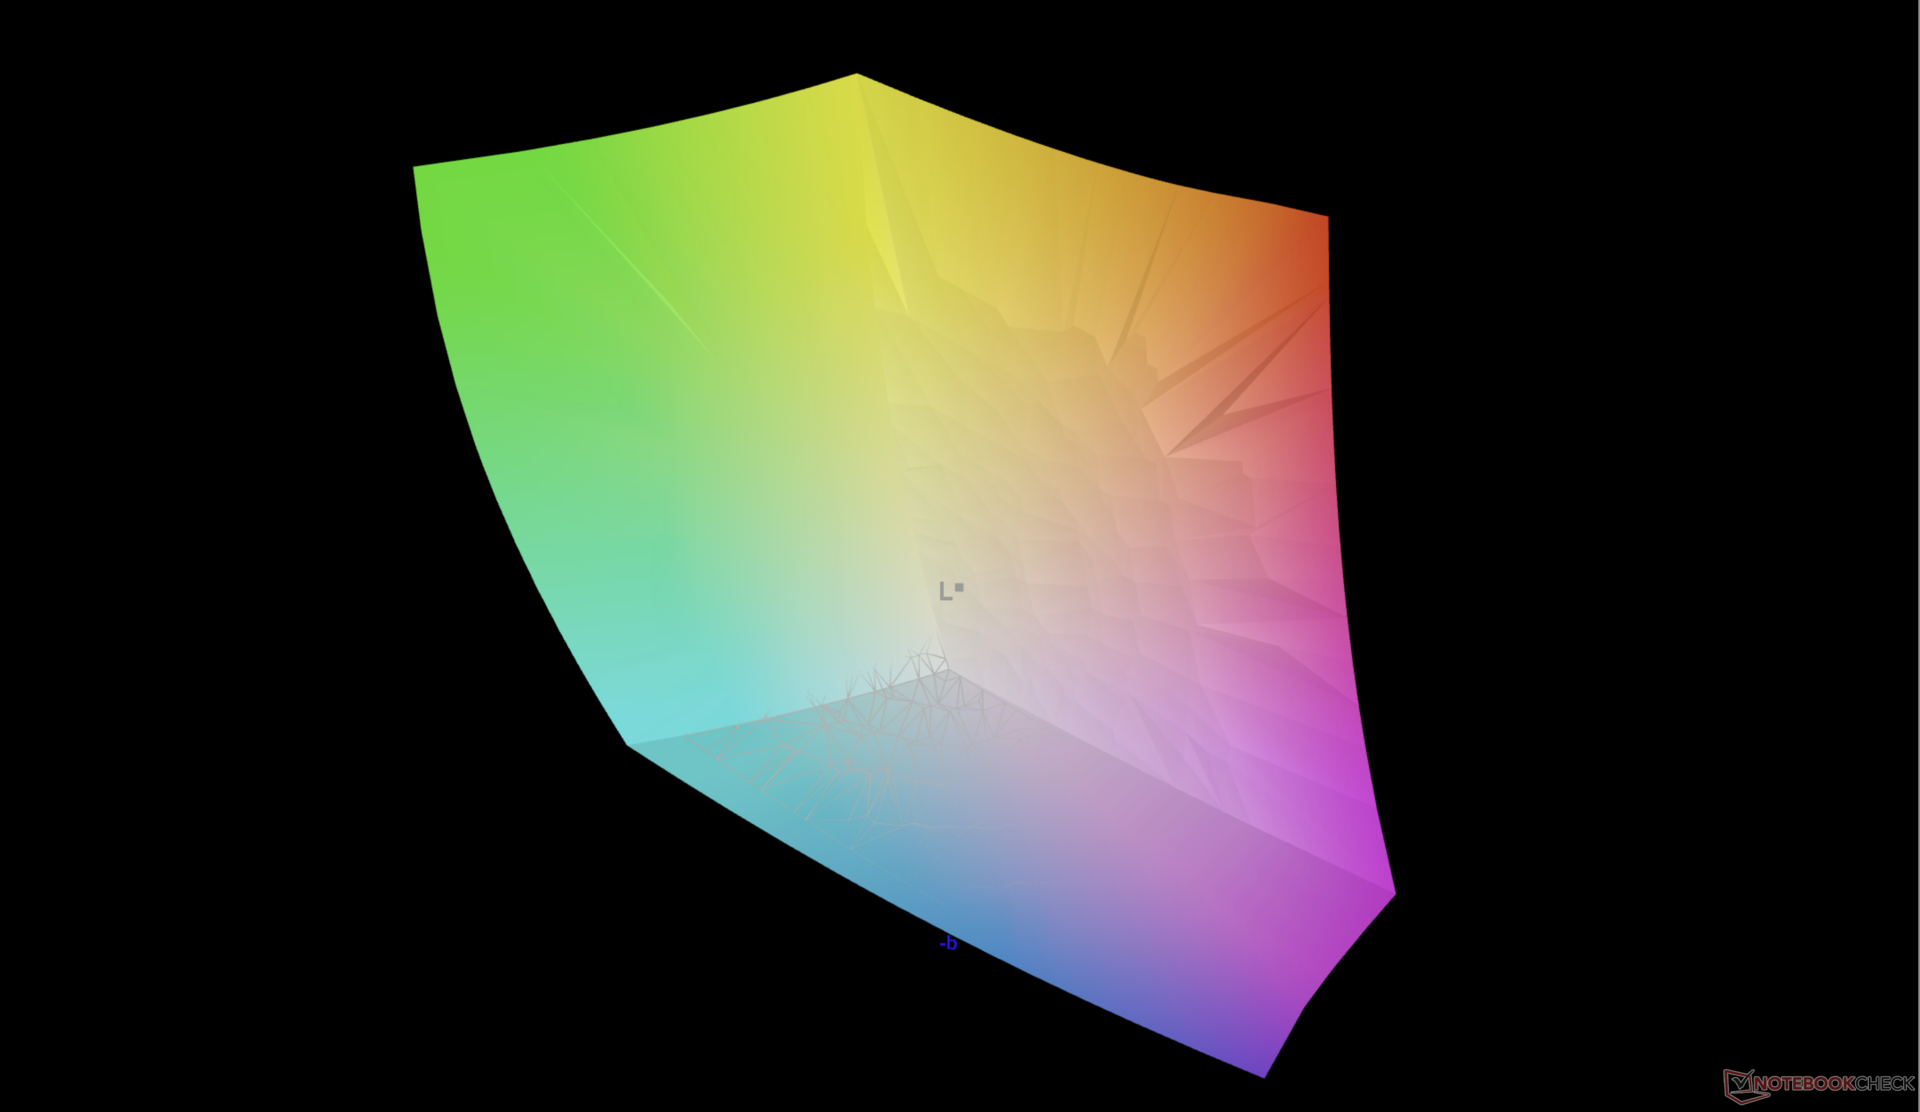
97.5% AdobeRGB 1998 (Argyll 3D)
100% sRGB (Argyll 3D)
99.9% Display P3 (Argyll 3D)
Gamma: 2.12
CCT: 6704 K
| Dell Precision 7670 Samsung 160YV03, OLED, 3840x2400, 16" | Lenovo ThinkPad P1 G4-20Y4Z9DVUS NE160QDM-N63, IPS, 2560x1600, 16" | Asus ProArt StudioBook 16 W7600H5A-2BL2 ATNA60YV02-0, OLED, 3840x2400, 16" | Dell Precision 5000 5560 Sharp LQ156R1, IPS, 3840x2400, 15.6" | Dell Precision 7550 AU Optronics B156ZAN, IPS, 3840x2160, 15.6" | HP ZBook Fury 15 G8 BOE0969, IPS, 3840x2160, 15.6" | |
|---|---|---|---|---|---|---|
| Display | -17% | 0% | -1% | -6% | -5% | |
| Display P3 Coverage (%) | 99.9 | 72.7 -27% | 99.9 0% | 94.9 -5% | 82.1 -18% | 95.9 -4% |
| sRGB Coverage (%) | 100 | 99.3 -1% | 100 0% | 100 0% | 99.6 0% | 100 0% |
| AdobeRGB 1998 Coverage (%) | 97.5 | 74.7 -23% | 98.6 1% | 100 3% | 96.8 -1% | 87.3 -10% |
| Response Times | -1494% | -3% | -1902% | -2098% | -565% | |
| Response Time Grey 50% / Grey 80% * (ms) | 1.9 ? | 40.8 -2047% | 2 ? -5% | 47.2 ? -2384% | 51.2 ? -2595% | 14.8 ? -679% |
| Response Time Black / White * (ms) | 2 ? | 20.8 -940% | 2 ? -0% | 30.4 ? -1420% | 34 ? -1600% | 11 ? -450% |
| PWM Frequency (Hz) | 59.5 ? | 240 ? | ||||
| Screen | 7% | 18% | -4% | -16% | -10% | |
| Brightness middle (cd/m²) | 340.1 | 441 30% | 353 4% | 501.5 47% | 473.5 39% | 626 84% |
| Brightness (cd/m²) | 342 | 420 23% | 360 5% | 467 37% | 461 35% | 589 72% |
| Brightness Distribution (%) | 98 | 90 -8% | 96 -2% | 83 -15% | 90 -8% | 87 -11% |
| Black Level * (cd/m²) | 0.27 | 0.44 | 0.55 | 0.58 | ||
| Colorchecker dE 2000 * | 2.5 | 2.6 -4% | 2.45 2% | 4.73 -89% | 4.8 -92% | 5.41 -116% |
| Colorchecker dE 2000 max. * | 8.19 | 6 27% | 3.75 54% | 8.45 -3% | 8.73 -7% | 9.05 -11% |
| Greyscale dE 2000 * | 3.5 | 4.5 -29% | 1.88 46% | 3.6 -3% | 5.6 -60% | 6.2 -77% |
| Gamma | 2.12 104% | 2.18 101% | 2.31 95% | 2.08 106% | 2.34 94% | 2.66 83% |
| CCT | 6704 97% | 6623 98% | 6441 101% | 6447 101% | 7549 86% | 6101 107% |
| Contrast (:1) | 1633 | 1140 | 861 | 1079 | ||
| Colorchecker dE 2000 calibrated * | 1.2 | 2.77 | 0.51 | 3.08 | 0.6 | |
| Color Space (Percent of AdobeRGB 1998) (%) | 86.4 | |||||
| Color Space (Percent of sRGB) (%) | 99.7 | |||||
| Total Average (Program / Settings) | -501% /
-273% | 5% /
10% | -636% /
-348% | -707% /
-392% | -193% /
-109% |
* ... smaller is better
在戴尔的任何广告或材料中,都没有提到在工厂预校准的显示器。尽管如此,在我们的OLED面板上,灰度和颜色仍然相当准确,平均deltaE值分别只有3.5和2.5。
Display Response Times
| ↔ Response Time Black to White | ||
|---|---|---|
| 2 ms ... rise ↗ and fall ↘ combined | ↗ 0.8 ms rise | 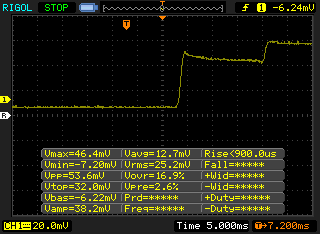 |
| ↘ 1.2 ms fall | ||
| The screen shows very fast response rates in our tests and should be very well suited for fast-paced gaming. In comparison, all tested devices range from 0.1 (minimum) to 240 (maximum) ms. » 11 % of all devices are better. This means that the measured response time is better than the average of all tested devices (19.8 ms). | ||
| ↔ Response Time 50% Grey to 80% Grey | ||
| 1.9 ms ... rise ↗ and fall ↘ combined | ↗ 1.1 ms rise | 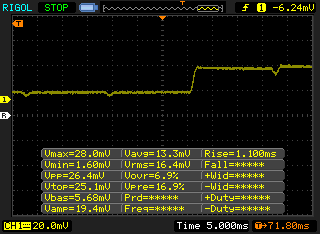 |
| ↘ 0.8 ms fall | ||
| The screen shows very fast response rates in our tests and should be very well suited for fast-paced gaming. In comparison, all tested devices range from 0.165 (minimum) to 636 (maximum) ms. » 9 % of all devices are better. This means that the measured response time is better than the average of all tested devices (31 ms). | ||
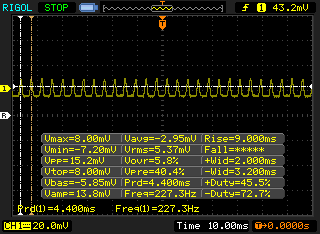
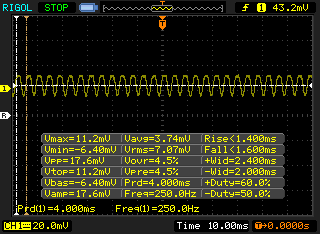
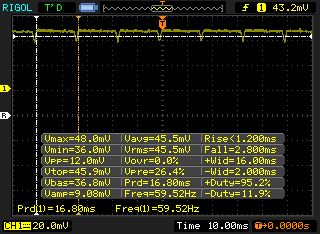
Screen Flickering / PWM (Pulse-Width Modulation)
| Screen flickering / PWM detected | 59.5 Hz | ≤ 100 % brightness setting |  |
The display backlight flickers at 59.5 Hz (worst case, e.g., utilizing PWM) Flickering detected at a brightness setting of 100 % and below. There should be no flickering or PWM above this brightness setting. The frequency of 59.5 Hz is very low, so the flickering may cause eyestrain and headaches after extended use. In comparison: 52 % of all tested devices do not use PWM to dim the display. If PWM was detected, an average of 7757 (minimum: 5 - maximum: 343500) Hz was measured. | |||
闪烁存在于所有的亮度水平,就像大多数其他OLED面板一样。我们能够检测到250赫兹的频率,从1%到56%的亮度,以及59.5赫兹,从57%的亮度到最大。
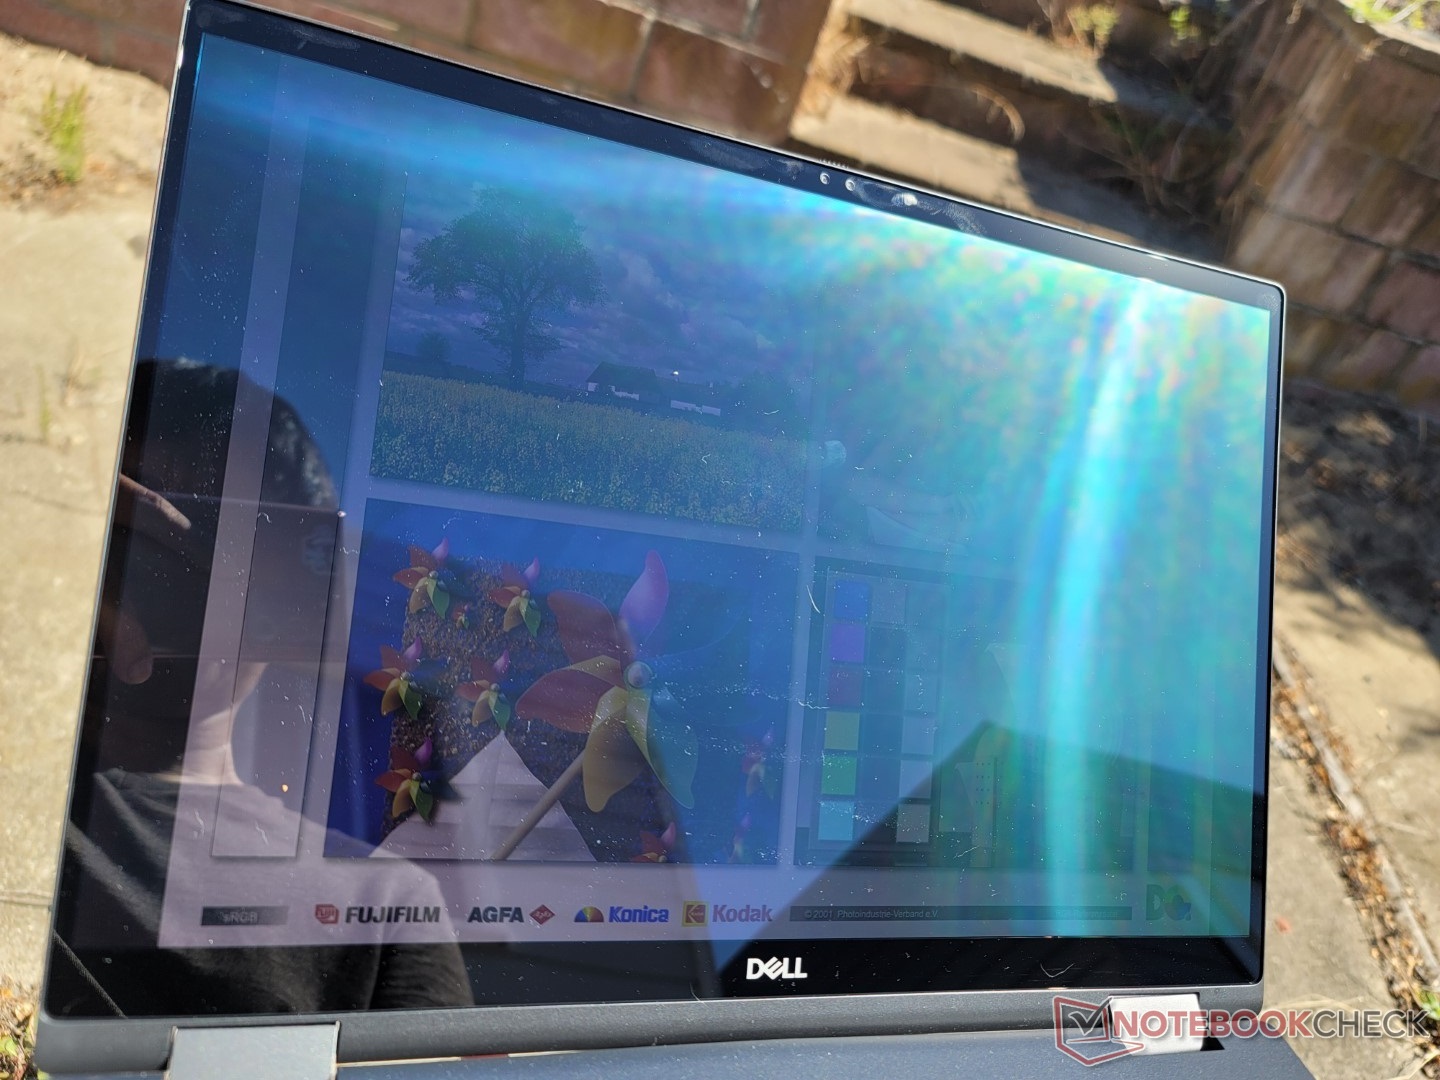
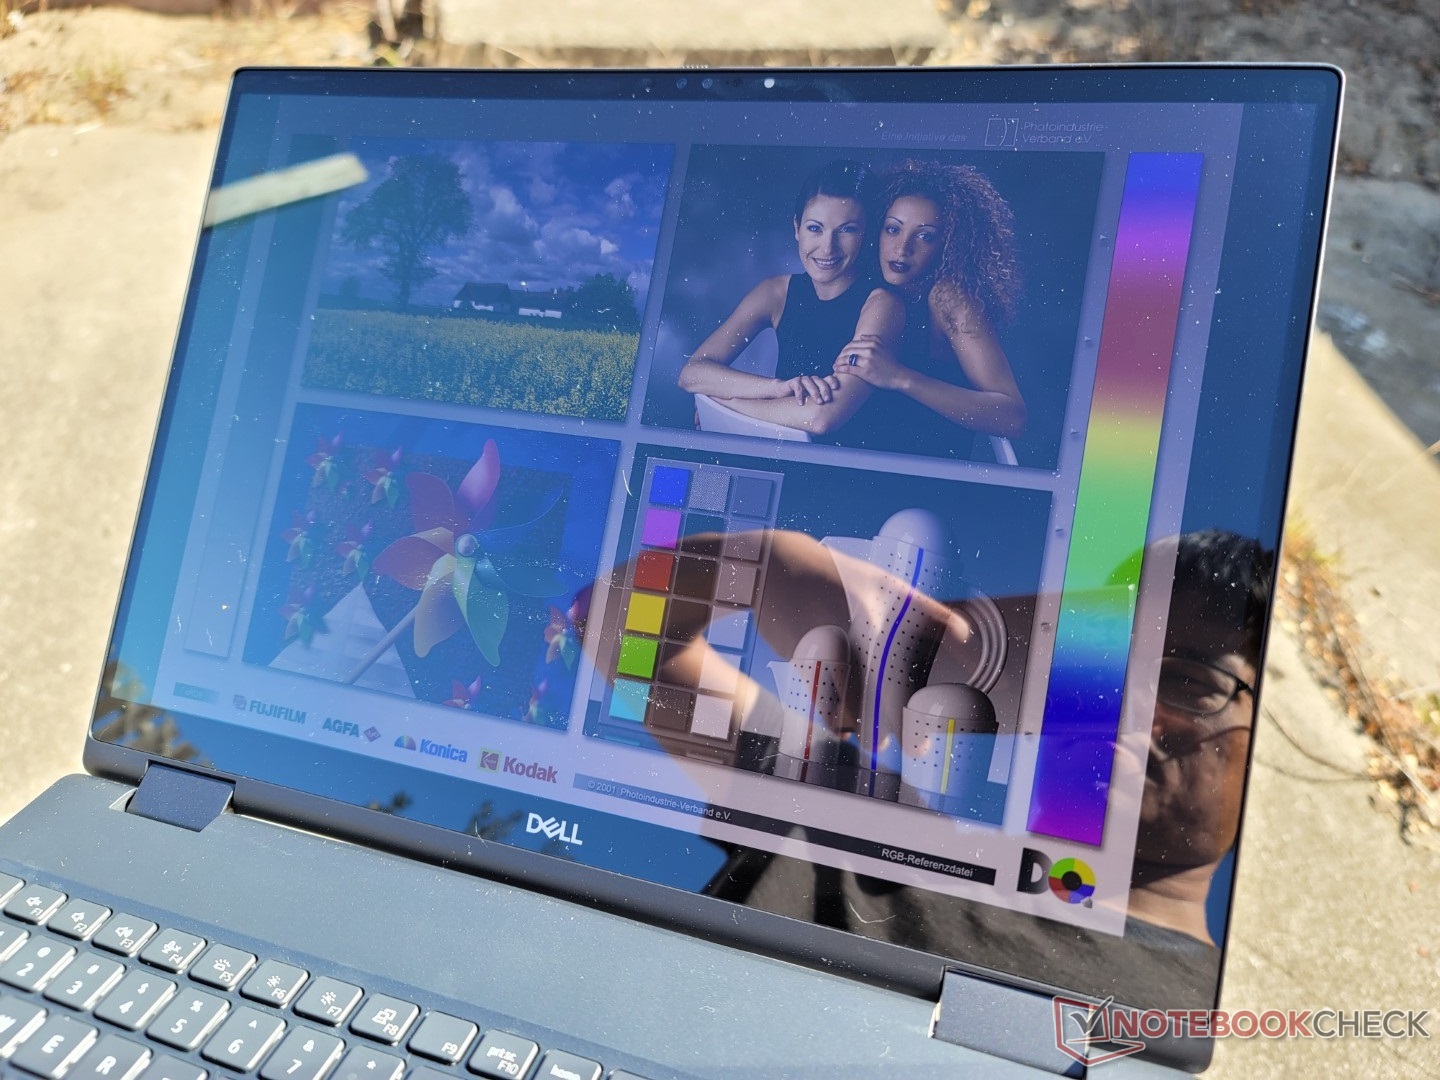
尽管这在技术上是一个 "防眩光 "显示屏,但仍有严重的眩光。背光不够亮,在大多数户外情况下无法舒适观看,除非你碰巧在树荫下。如果户外能见度很重要,那么我们建议检查一下惠普ZBook Fury 15 G8它的显示屏亮度几乎是我们Precision 的两倍。
性能--英特尔vPro为所有人服务
测试条件
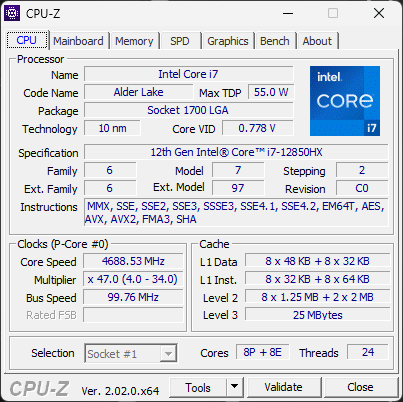
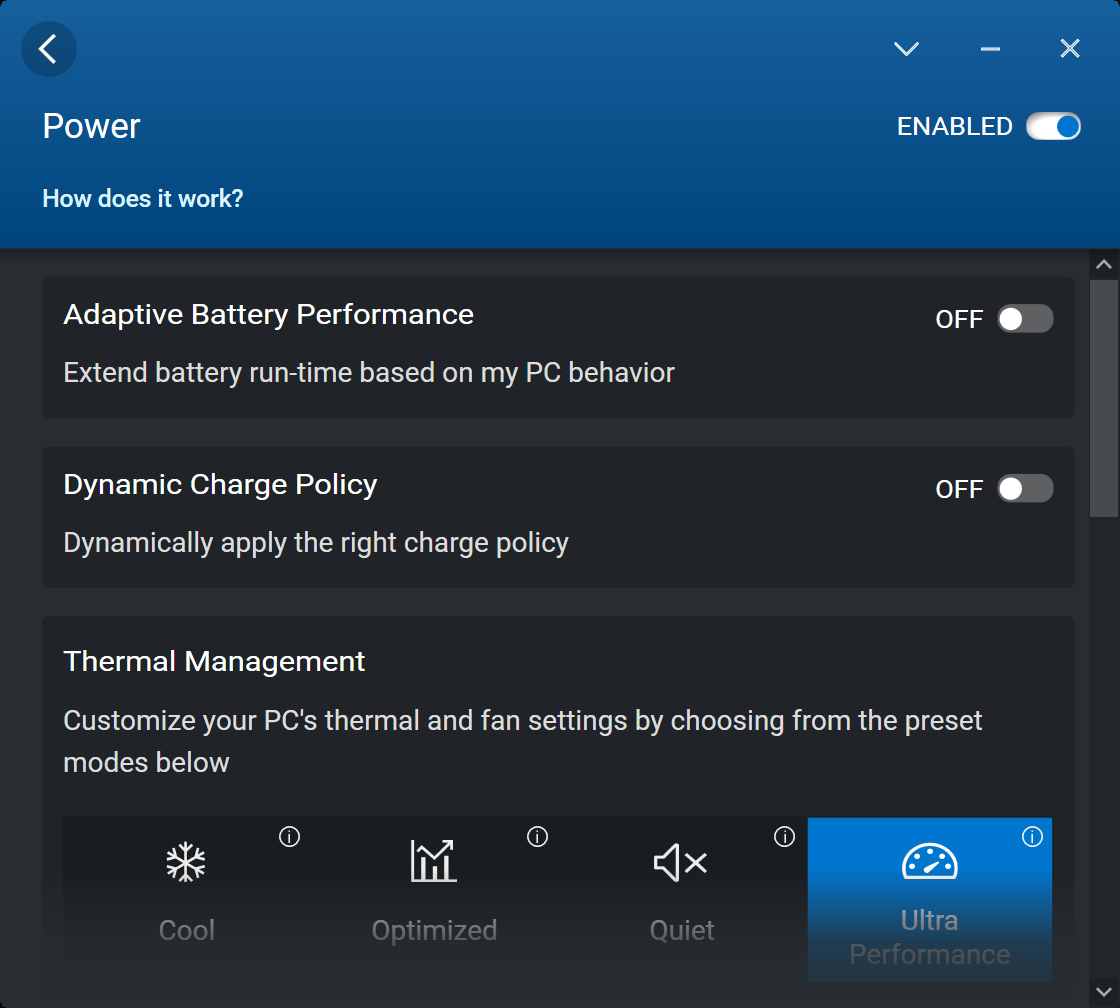
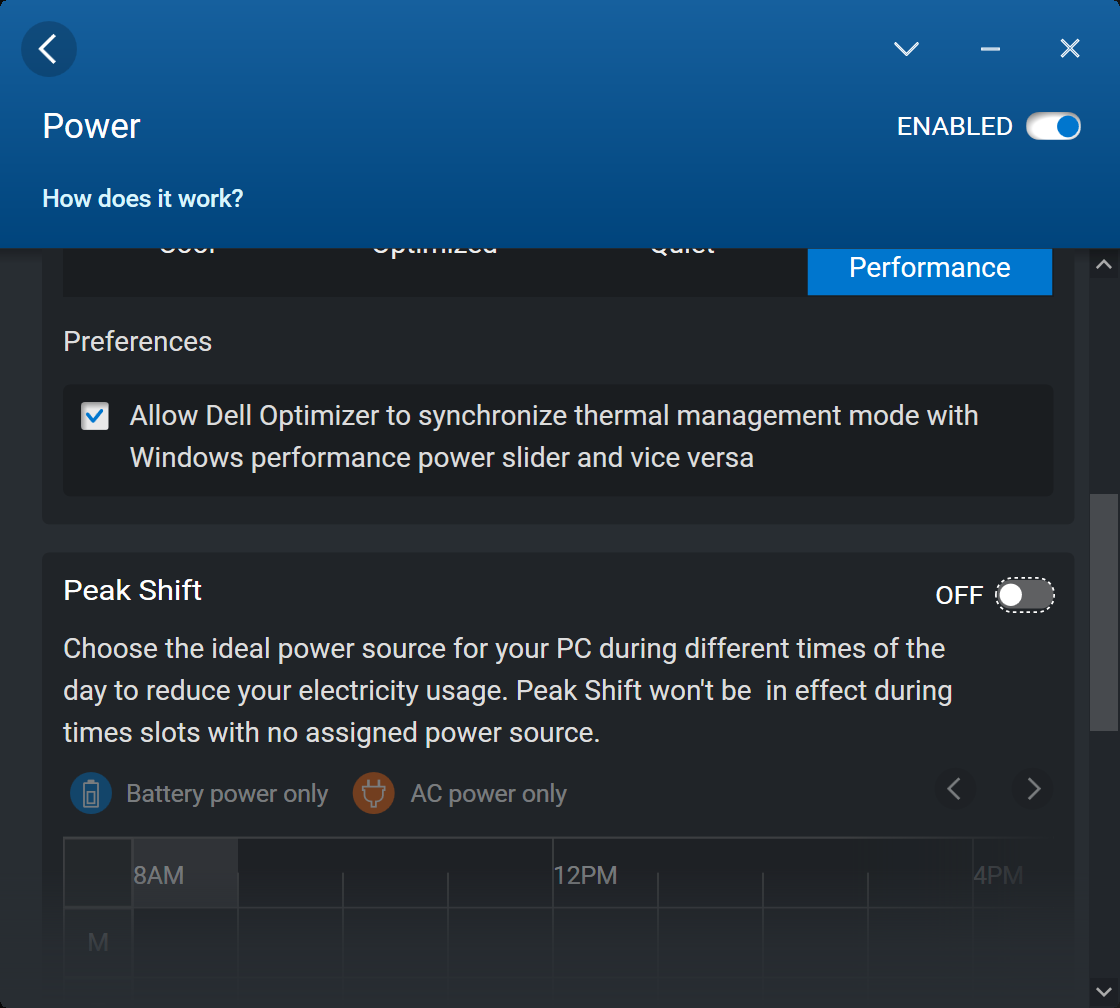
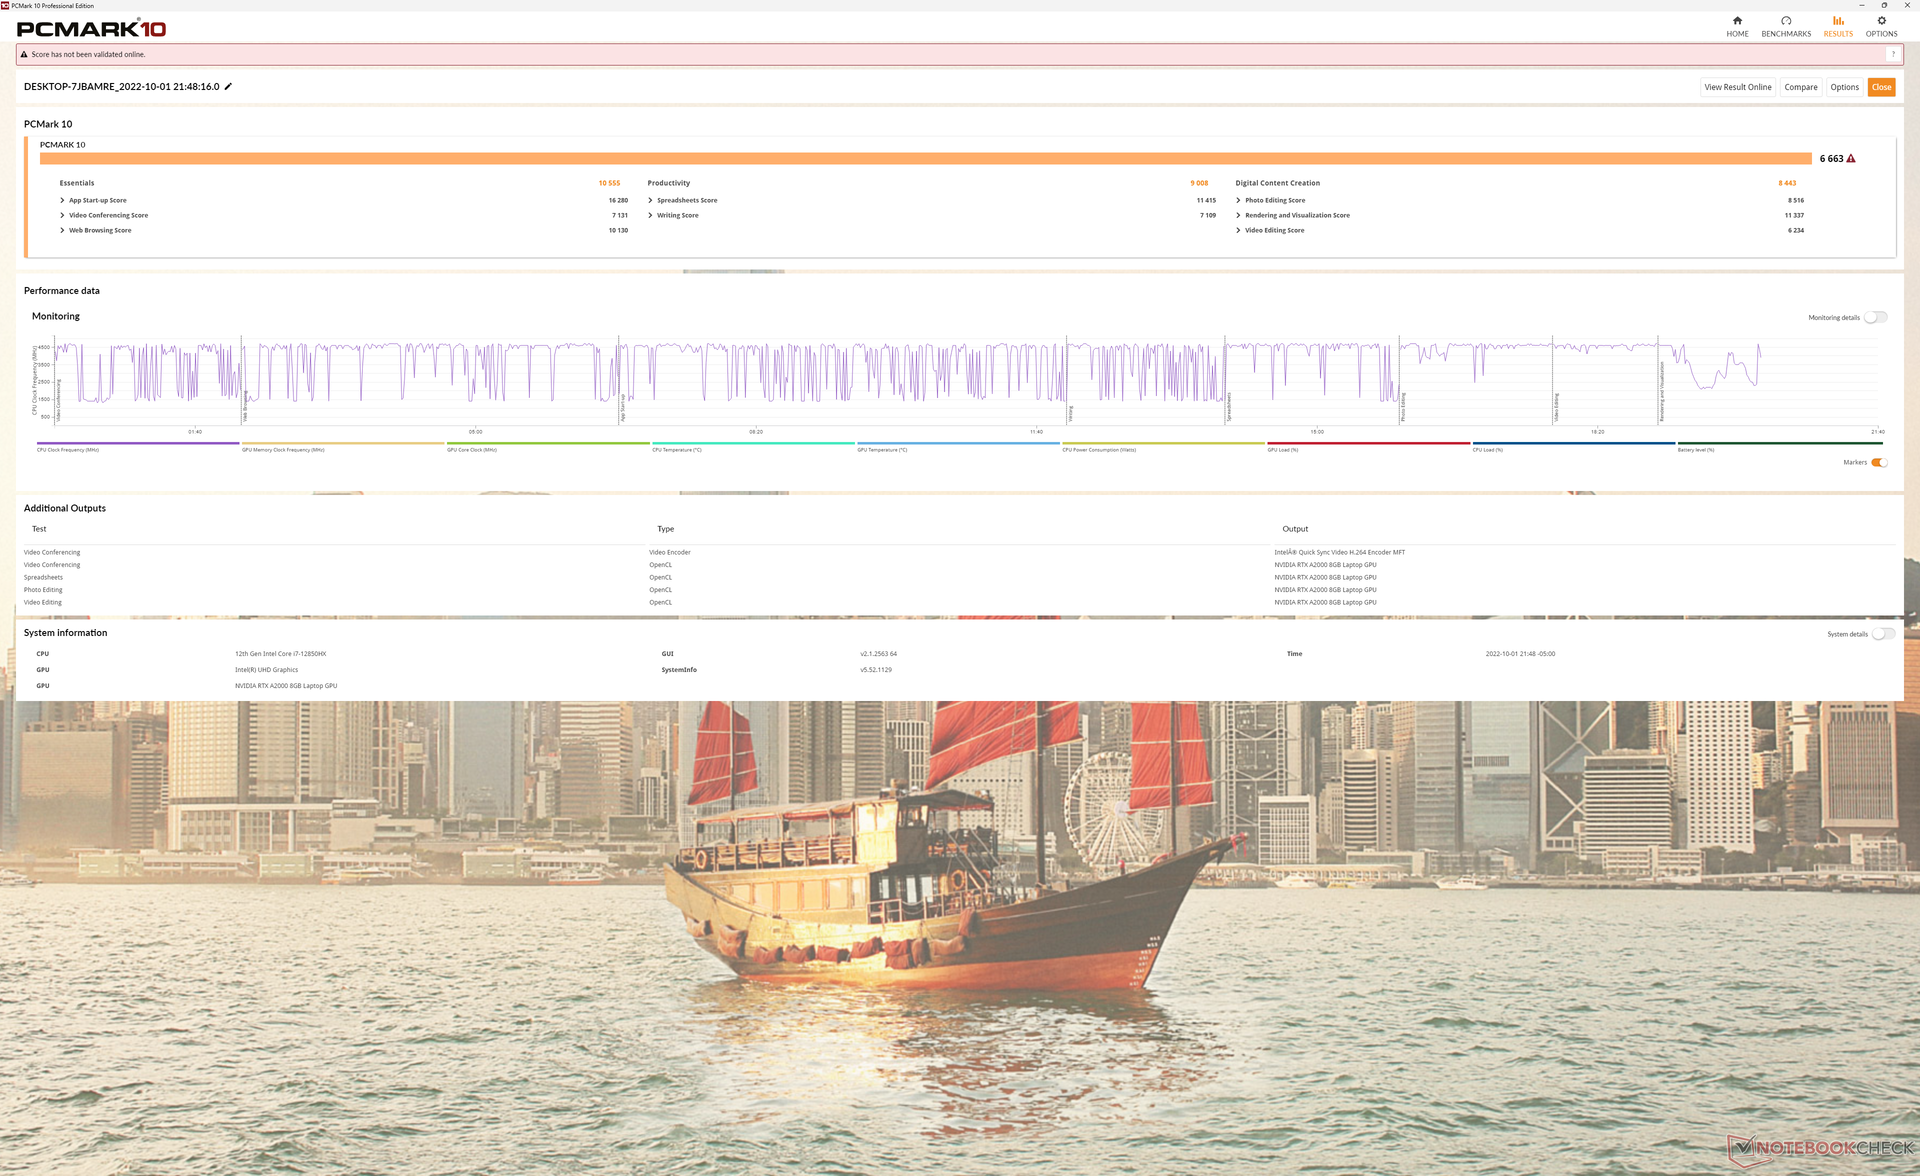
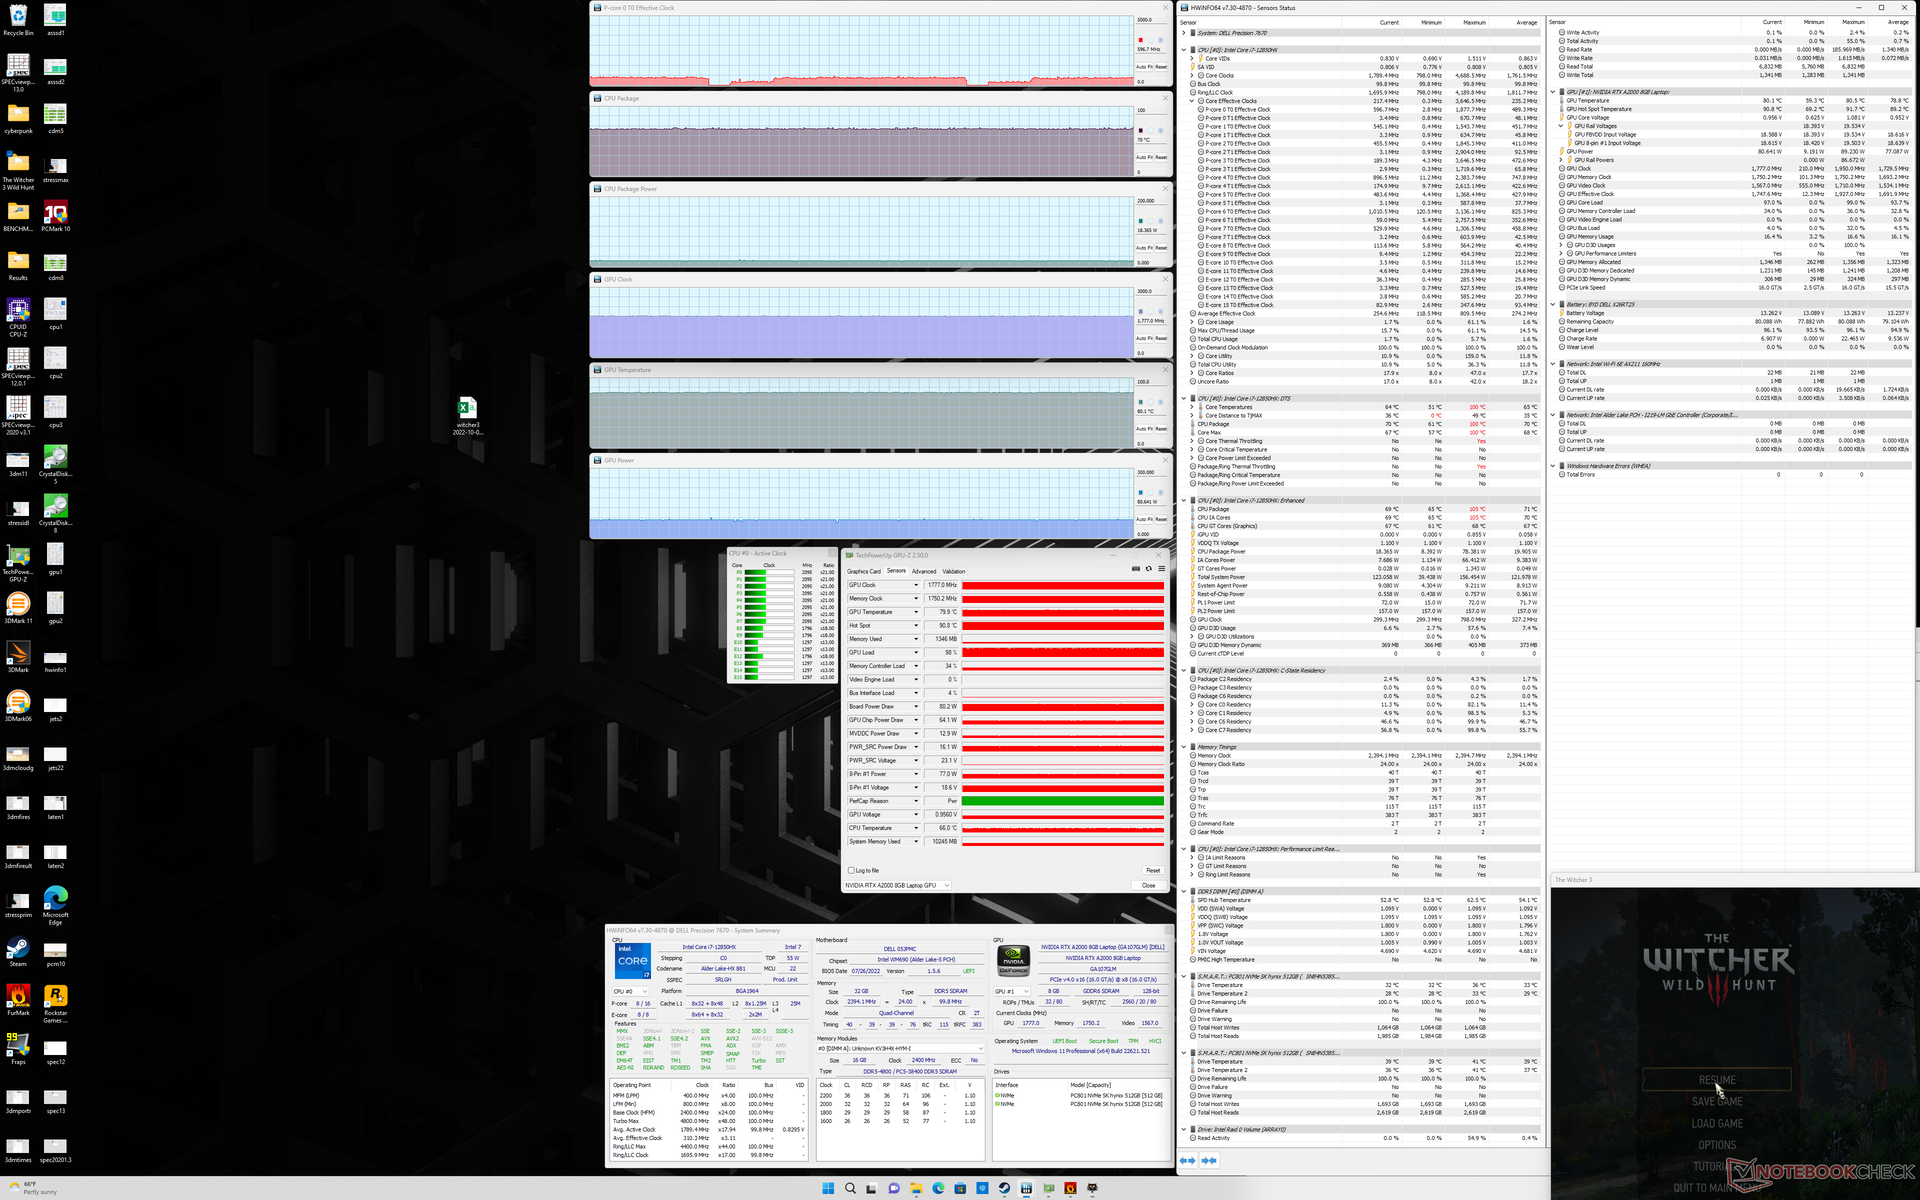
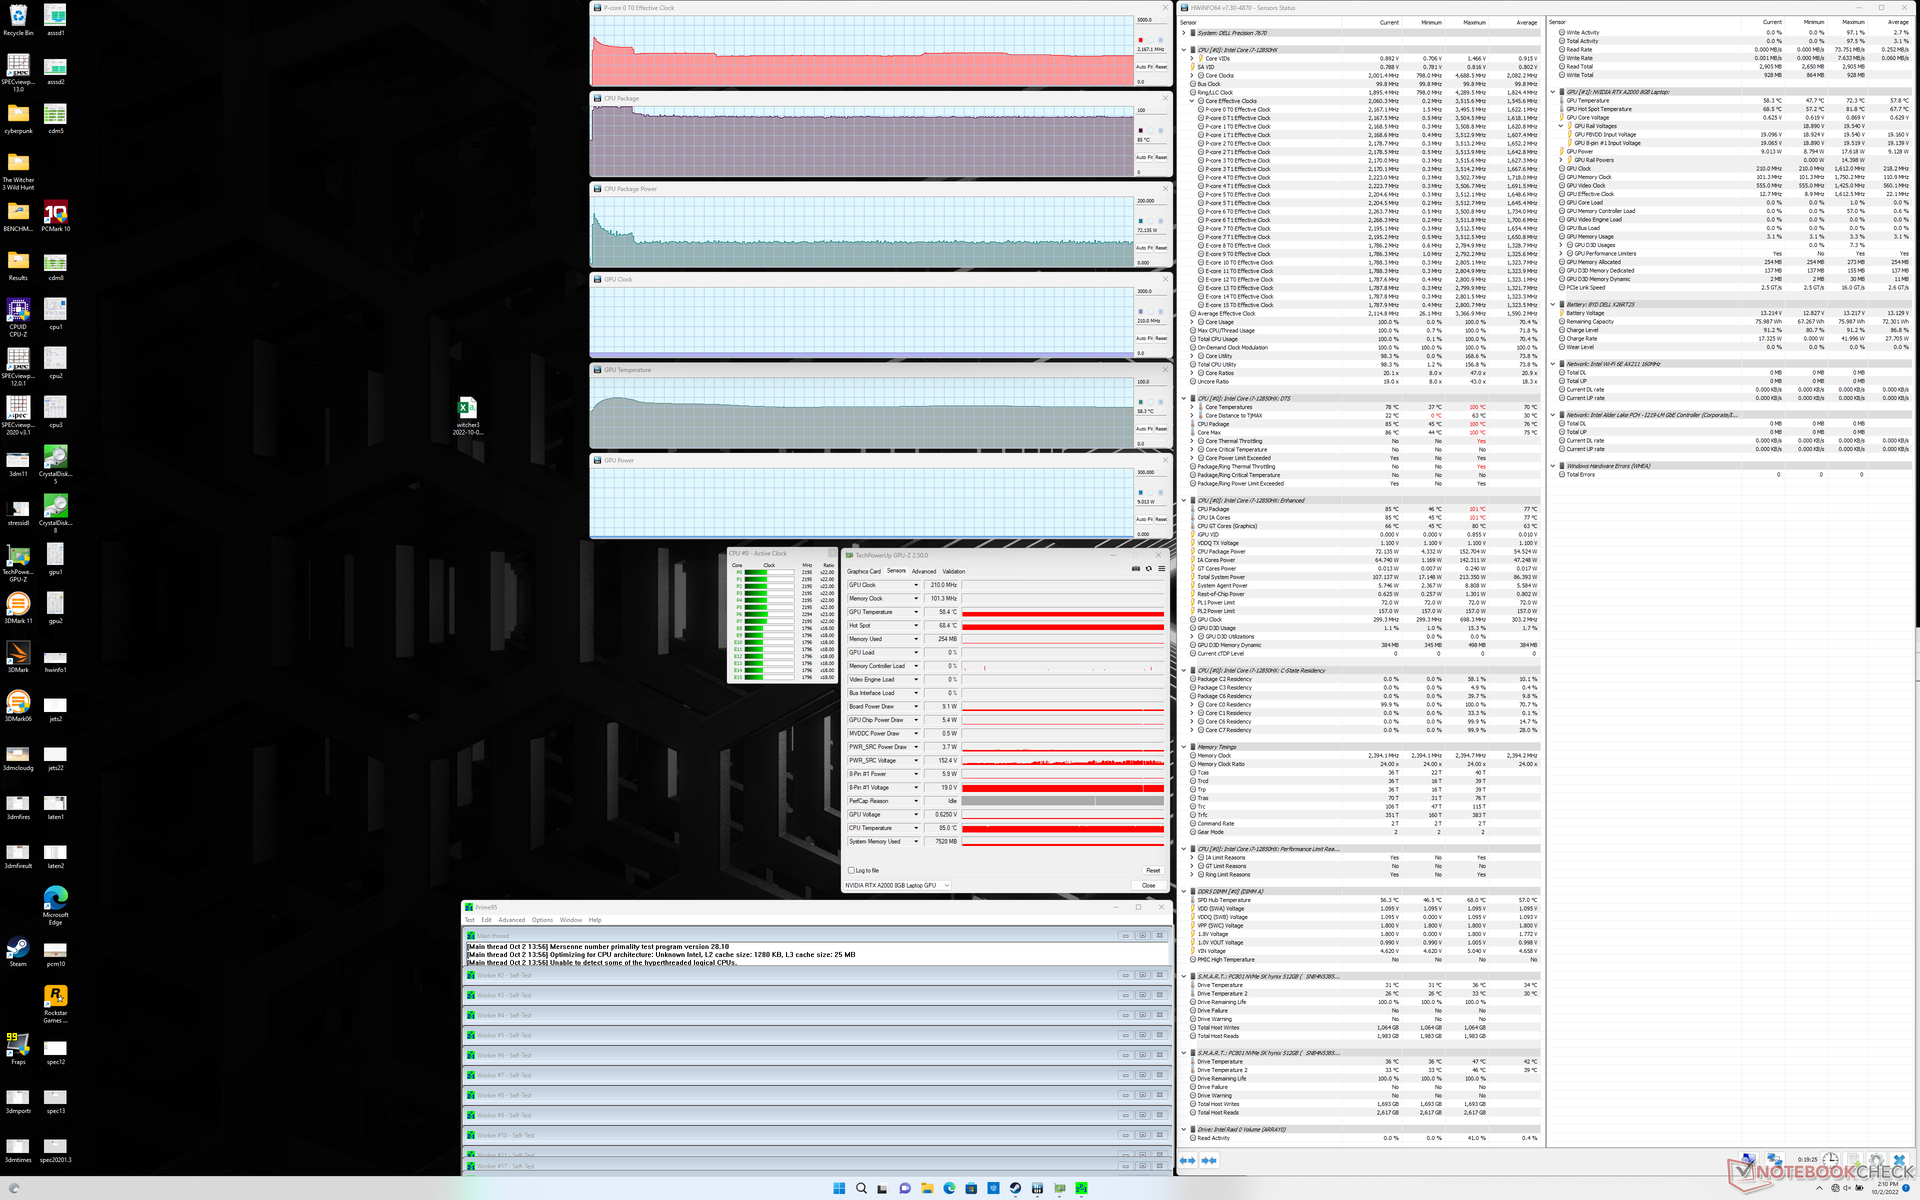
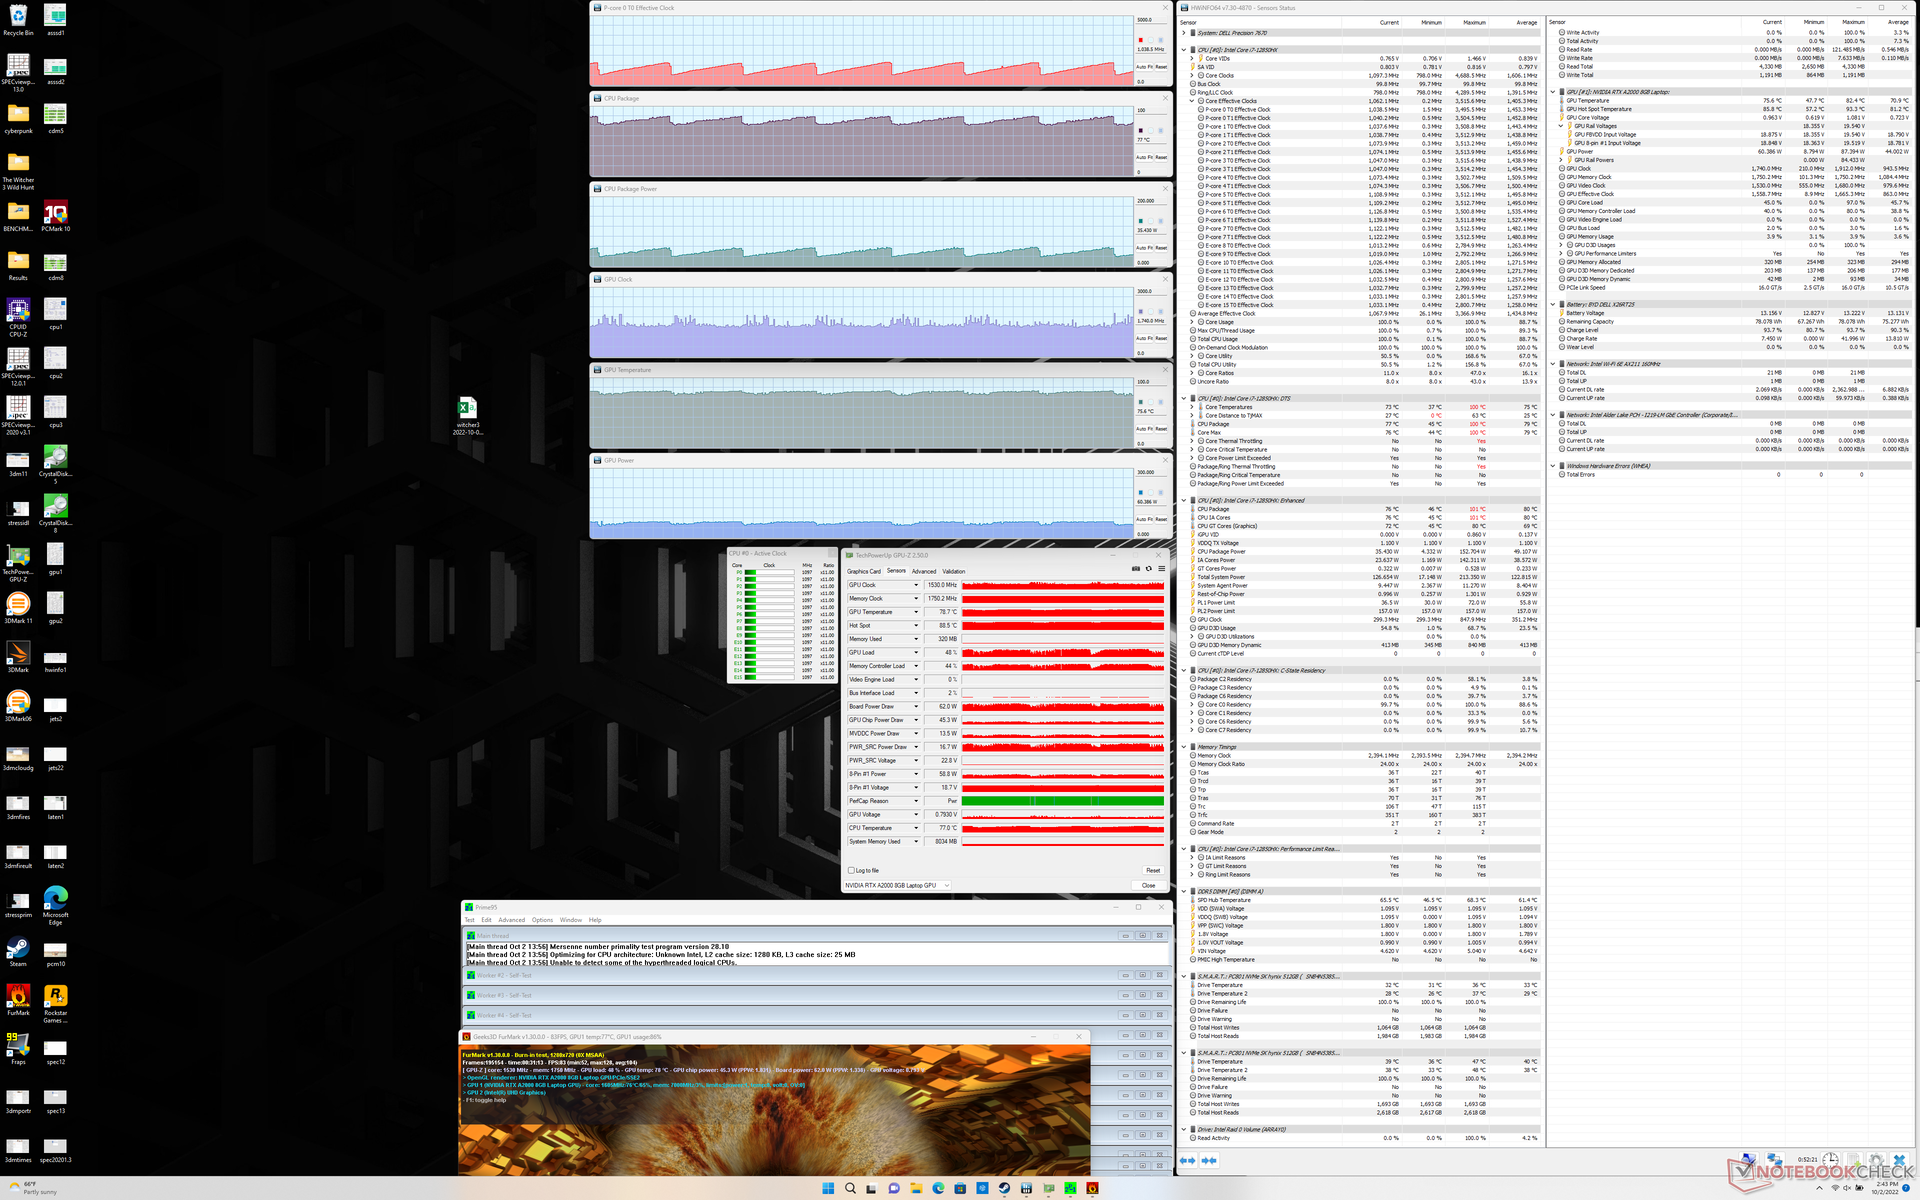
在运行以下任何基准测试之前,我们通过Dell Optimizer软件将我们的设备设置为超性能模式,并通过Nvidia控制面板将GPU设置为独立模式。令人讨厌的是,电源配置文件可以通过Windows、Dell Optimizer或Dell Power Manager进行调整,这可能使事情变得非常混乱。我们建议通过Optimizer在三个不同的应用程序之间启用电源配置文件同步,如下面的截图所示。
处理器
从纸面上看, 酷睿i7-12850HX的时钟频率、核心数量和高速缓存大小都与 i7-12800HX但增加了vPro支持。然而,在现实中,它们的性能可以有相当大的差异。
CPU性能更接近于 酷睿i7-12800H而不是酷睿i7-12800HX。事实上,多线程性能比i7-12800HX慢了大约30%,因为在 微星GE67 HX由于其更强大的冷却解决方案。即便如此,与其他工作站相比,性能仍然是最快的之一,因为许多工作站仍然运行在第11代英特尔CPU上。
涡轮增压的可持续性可以做得更好。当循环运行CineBench R15 xT时,性能在重复两三次后会下降25%之多,这将有助于解释上文提到的与Core i7-12800HX相比的广泛性能差距。
Cinebench R15 Multi Loop
Cinebench R23: Multi Core | Single Core
Cinebench R15: CPU Multi 64Bit | CPU Single 64Bit
Blender: v2.79 BMW27 CPU
7-Zip 18.03: 7z b 4 | 7z b 4 -mmt1
Geekbench 5.5: Multi-Core | Single-Core
HWBOT x265 Benchmark v2.2: 4k Preset
LibreOffice : 20 Documents To PDF
R Benchmark 2.5: Overall mean
Cinebench R23: Multi Core | Single Core
Cinebench R15: CPU Multi 64Bit | CPU Single 64Bit
Blender: v2.79 BMW27 CPU
7-Zip 18.03: 7z b 4 | 7z b 4 -mmt1
Geekbench 5.5: Multi-Core | Single-Core
HWBOT x265 Benchmark v2.2: 4k Preset
LibreOffice : 20 Documents To PDF
R Benchmark 2.5: Overall mean
* ... smaller is better
AIDA64: FP32 Ray-Trace | FPU Julia | CPU SHA3 | CPU Queen | FPU SinJulia | FPU Mandel | CPU AES | CPU ZLib | FP64 Ray-Trace | CPU PhotoWorxx
| Performance rating | |
| Average Intel Core i7-12850HX | |
| HP ZBook Fury 15 G8 | |
| Lenovo ThinkPad P1 G4-20Y4Z9DVUS | |
| Dell Precision 7670 | |
| Asus ProArt StudioBook 16 W7600H5A-2BL2 -9! | |
| Dell Precision 5000 5560 -9! | |
| AIDA64 / FP32 Ray-Trace | |
| Lenovo ThinkPad P1 G4-20Y4Z9DVUS | |
| Average Intel Core i7-12850HX (12983 - 16752, n=2) | |
| HP ZBook Fury 15 G8 | |
| Dell Precision 7670 | |
| AIDA64 / FPU Julia | |
| Average Intel Core i7-12850HX (68219 - 87231, n=2) | |
| Dell Precision 7670 | |
| Lenovo ThinkPad P1 G4-20Y4Z9DVUS | |
| HP ZBook Fury 15 G8 | |
| AIDA64 / CPU SHA3 | |
| Lenovo ThinkPad P1 G4-20Y4Z9DVUS | |
| HP ZBook Fury 15 G8 | |
| Average Intel Core i7-12850HX (3098 - 3818, n=2) | |
| Dell Precision 7670 | |
| AIDA64 / CPU Queen | |
| HP ZBook Fury 15 G8 | |
| Lenovo ThinkPad P1 G4-20Y4Z9DVUS | |
| Average Intel Core i7-12850HX (26716 - 95664, n=2) | |
| Dell Precision 7670 | |
| AIDA64 / FPU SinJulia | |
| Average Intel Core i7-12850HX (9869 - 11286, n=2) | |
| HP ZBook Fury 15 G8 | |
| Dell Precision 7670 | |
| Lenovo ThinkPad P1 G4-20Y4Z9DVUS | |
| AIDA64 / FPU Mandel | |
| Average Intel Core i7-12850HX (34218 - 42580, n=2) | |
| Lenovo ThinkPad P1 G4-20Y4Z9DVUS | |
| HP ZBook Fury 15 G8 | |
| Dell Precision 7670 | |
| AIDA64 / CPU AES | |
| Lenovo ThinkPad P1 G4-20Y4Z9DVUS | |
| HP ZBook Fury 15 G8 | |
| Average Intel Core i7-12850HX (63362 - 80775, n=2) | |
| Dell Precision 7670 | |
| AIDA64 / CPU ZLib | |
| Average Intel Core i7-12850HX (817 - 1102, n=2) | |
| Dell Precision 7670 | |
| Lenovo ThinkPad P1 G4-20Y4Z9DVUS | |
| HP ZBook Fury 15 G8 | |
| Asus ProArt StudioBook 16 W7600H5A-2BL2 | |
| Asus ProArt StudioBook 16 W7600H5A-2BL2 | |
| Dell Precision 5000 5560 | |
| AIDA64 / FP64 Ray-Trace | |
| Average Intel Core i7-12850HX (7671 - 9145, n=2) | |
| Lenovo ThinkPad P1 G4-20Y4Z9DVUS | |
| HP ZBook Fury 15 G8 | |
| Dell Precision 7670 | |
| AIDA64 / CPU PhotoWorxx | |
| Dell Precision 7670 | |
| Average Intel Core i7-12850HX (33415 - 42035, n=2) | |
| HP ZBook Fury 15 G8 | |
| Lenovo ThinkPad P1 G4-20Y4Z9DVUS | |
系统性能
PCMark 10的结果与其他采用Core H系列CPU和Nvidia Quadro GPU的工作站相似。配备更快的 RTX A5000像HP ZBook Fury 15 G8这样的机型,在数字内容创作等GPU重度基准测试中,仍然超过了我们的Precision 7670测试单元。
CrossMark: Overall | Productivity | Creativity | Responsiveness
| PCMark 10 / Score | |
| Asus ProArt StudioBook 16 W7600H5A-2BL2 | |
| HP ZBook Fury 15 G8 | |
| Dell Precision 5000 5560 | |
| Dell Precision 7670 | |
| Lenovo ThinkPad P1 G4-20Y4Z9DVUS | |
| Dell Precision 7550 | |
| PCMark 10 / Essentials | |
| Dell Precision 5000 5560 | |
| Dell Precision 7670 | |
| Asus ProArt StudioBook 16 W7600H5A-2BL2 | |
| HP ZBook Fury 15 G8 | |
| Lenovo ThinkPad P1 G4-20Y4Z9DVUS | |
| Dell Precision 7550 | |
| PCMark 10 / Productivity | |
| Dell Precision 7670 | |
| Dell Precision 5000 5560 | |
| Asus ProArt StudioBook 16 W7600H5A-2BL2 | |
| HP ZBook Fury 15 G8 | |
| Lenovo ThinkPad P1 G4-20Y4Z9DVUS | |
| Dell Precision 7550 | |
| PCMark 10 / Digital Content Creation | |
| Asus ProArt StudioBook 16 W7600H5A-2BL2 | |
| HP ZBook Fury 15 G8 | |
| Dell Precision 5000 5560 | |
| Dell Precision 7670 | |
| Lenovo ThinkPad P1 G4-20Y4Z9DVUS | |
| Dell Precision 7550 | |
| CrossMark / Overall | |
| Lenovo ThinkPad P1 G4-20Y4Z9DVUS | |
| Dell Precision 7670 | |
| CrossMark / Productivity | |
| Lenovo ThinkPad P1 G4-20Y4Z9DVUS | |
| Dell Precision 7670 | |
| CrossMark / Creativity | |
| Dell Precision 7670 | |
| Lenovo ThinkPad P1 G4-20Y4Z9DVUS | |
| CrossMark / Responsiveness | |
| Lenovo ThinkPad P1 G4-20Y4Z9DVUS | |
| Dell Precision 7670 | |
| PCMark 10 Score | 6663 points | |
Help | ||
| AIDA64 / Memory Copy | |
| Dell Precision 7670 | |
| HP ZBook Fury 15 G8 | |
| Lenovo ThinkPad P1 G4-20Y4Z9DVUS | |
| AIDA64 / Memory Read | |
| Dell Precision 7670 | |
| HP ZBook Fury 15 G8 | |
| Lenovo ThinkPad P1 G4-20Y4Z9DVUS | |
| AIDA64 / Memory Write | |
| Dell Precision 7670 | |
| HP ZBook Fury 15 G8 | |
| Lenovo ThinkPad P1 G4-20Y4Z9DVUS | |
| AIDA64 / Memory Latency | |
| HP ZBook Fury 15 G8 | |
| Dell Precision 7670 | |
| Lenovo ThinkPad P1 G4-20Y4Z9DVUS | |
| Asus ProArt StudioBook 16 W7600H5A-2BL2 | |
| Asus ProArt StudioBook 16 W7600H5A-2BL2 | |
* ... smaller is better
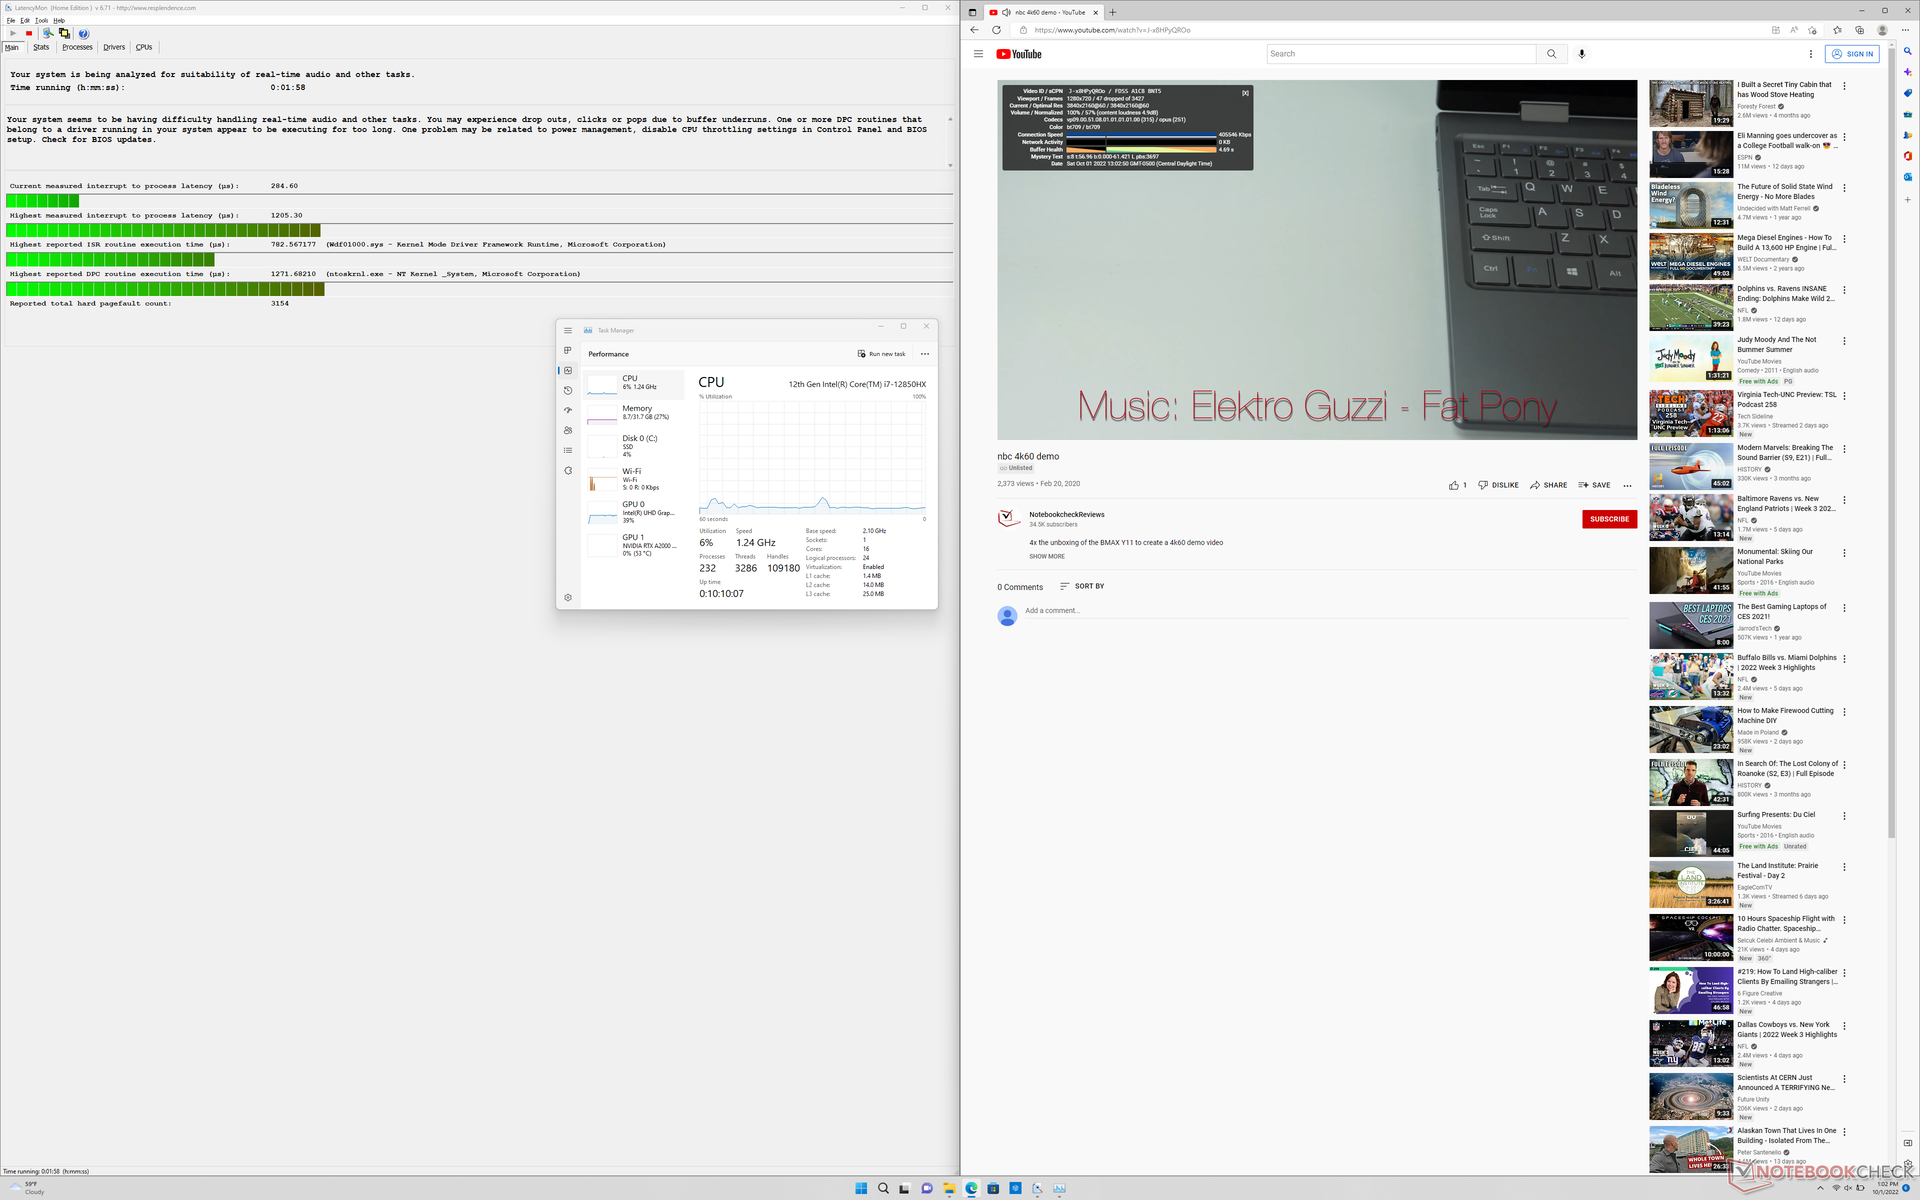
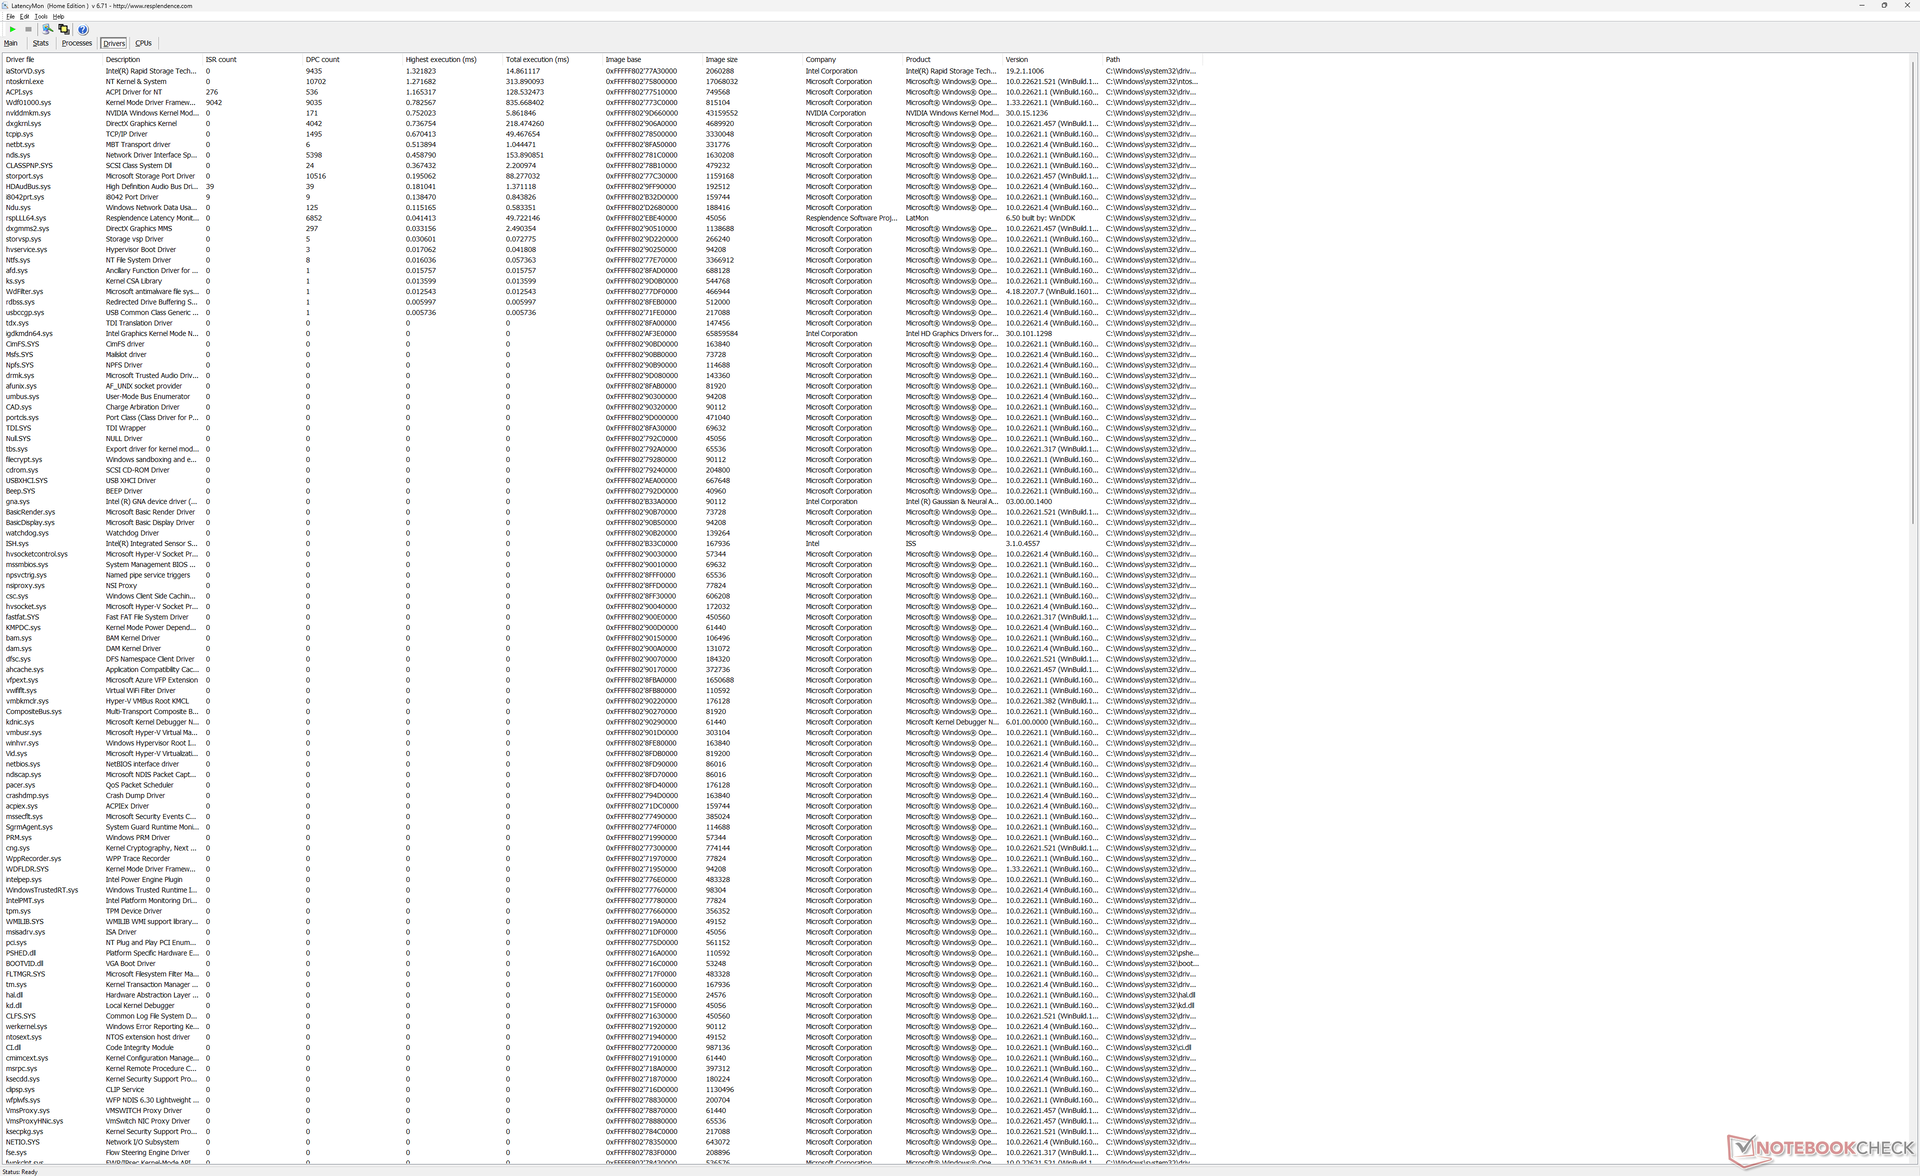
DPC延时
latencyMon显示,在打开我们的主页的多个浏览器标签时,存在轻微的DPC问题。此外,在我们长达1分钟的测试视频中,以60 FPS播放4K视频是不完美的,有47个丢帧。
| DPC Latencies / LatencyMon - interrupt to process latency (max), Web, Youtube, Prime95 | |
| Dell Precision 7550 | |
| Asus ProArt StudioBook 16 W7600H5A-2BL2 | |
| Lenovo ThinkPad P1 G4-20Y4Z9DVUS | |
| Dell Precision 7670 | |
| Dell Precision 5000 5560 | |
| HP ZBook Fury 15 G8 | |
* ... smaller is better
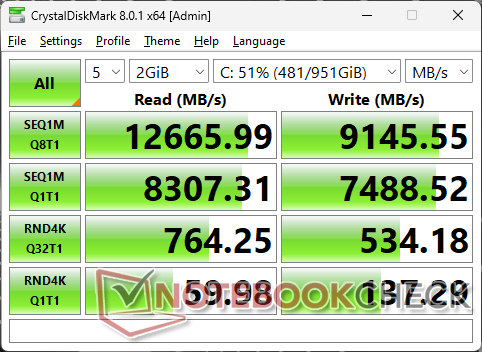
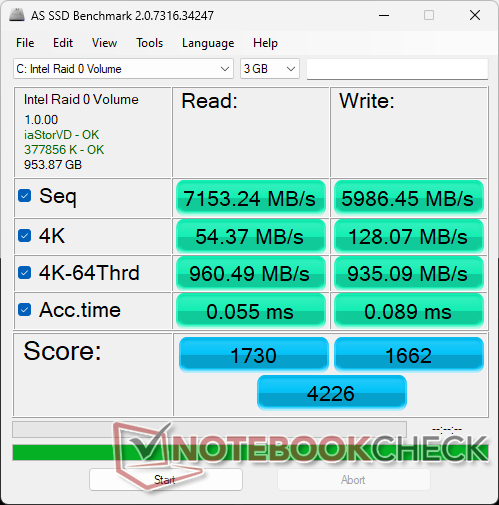
存储设备 - 使用PCIe4 x4 RAID 0的疯狂速度
所有的配置都可以支持多达两个M.2固态硬盘,有些还可以支持多达三个。我们的特定测试装置配备了两个 SK Hynix PC801PCIe4 x4 NVMe固态硬盘的RAID 0,连续读取和写入速率分别为13000 MB/s和9200 MB/s。当在DiskSpd下受压时,即使经过很长一段时间,驱动器也不会显示出性能节流的迹象。在所包含的固态硬盘上面有热扩散器或热垫,以帮助散热。

| Drive Performance rating - Percent | |
| Dell Precision 5000 5560 | |
| Dell Precision 7670 | |
| Lenovo ThinkPad P1 G4-20Y4Z9DVUS | |
| Asus ProArt StudioBook 16 W7600H5A-2BL2 | |
| HP ZBook Fury 15 G8 | |
| Dell Precision 7550 | |
* ... smaller is better
Disk Throttling: DiskSpd Read Loop, Queue Depth 8
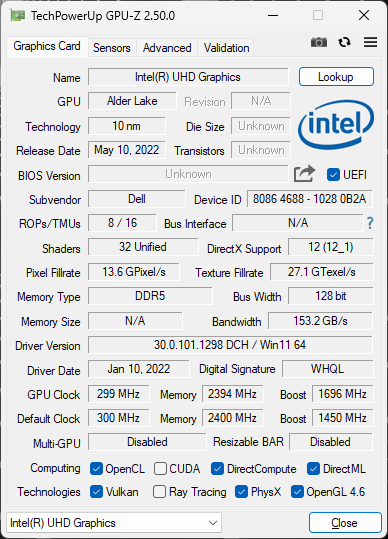
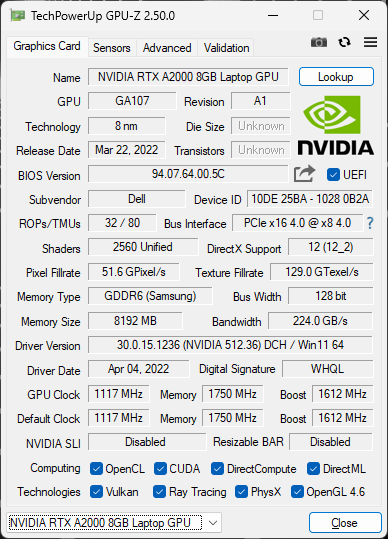
GPU性能 - 95 W TGP图形
ǞǞǞ RTX A2000是从 GeForce RTX 3050 Ti因此,这两款GPU共享类似的原始性能数据。升级到 RTX A3000或 RTX A5500选项,预计将分别提高15%至20%和70%至90%的性能。
有趣的是,光线追踪的Port Royal性能明显好于我们在老款的Precision 5560即使它们共享相同的RTX A2000 GPU。我们怀疑这可能是由于我们的Precision 7670的TGP目标(95W对45W)和较新的Nvidia驱动(512.36对472.12)。
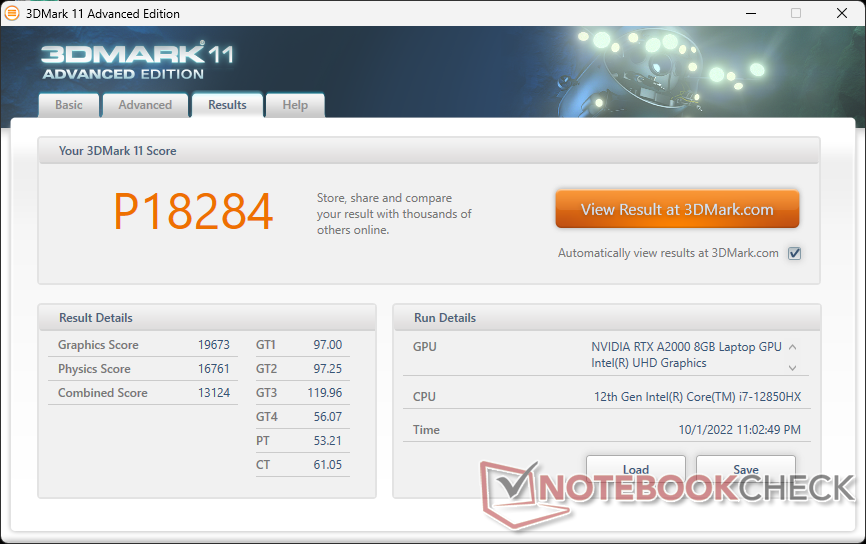
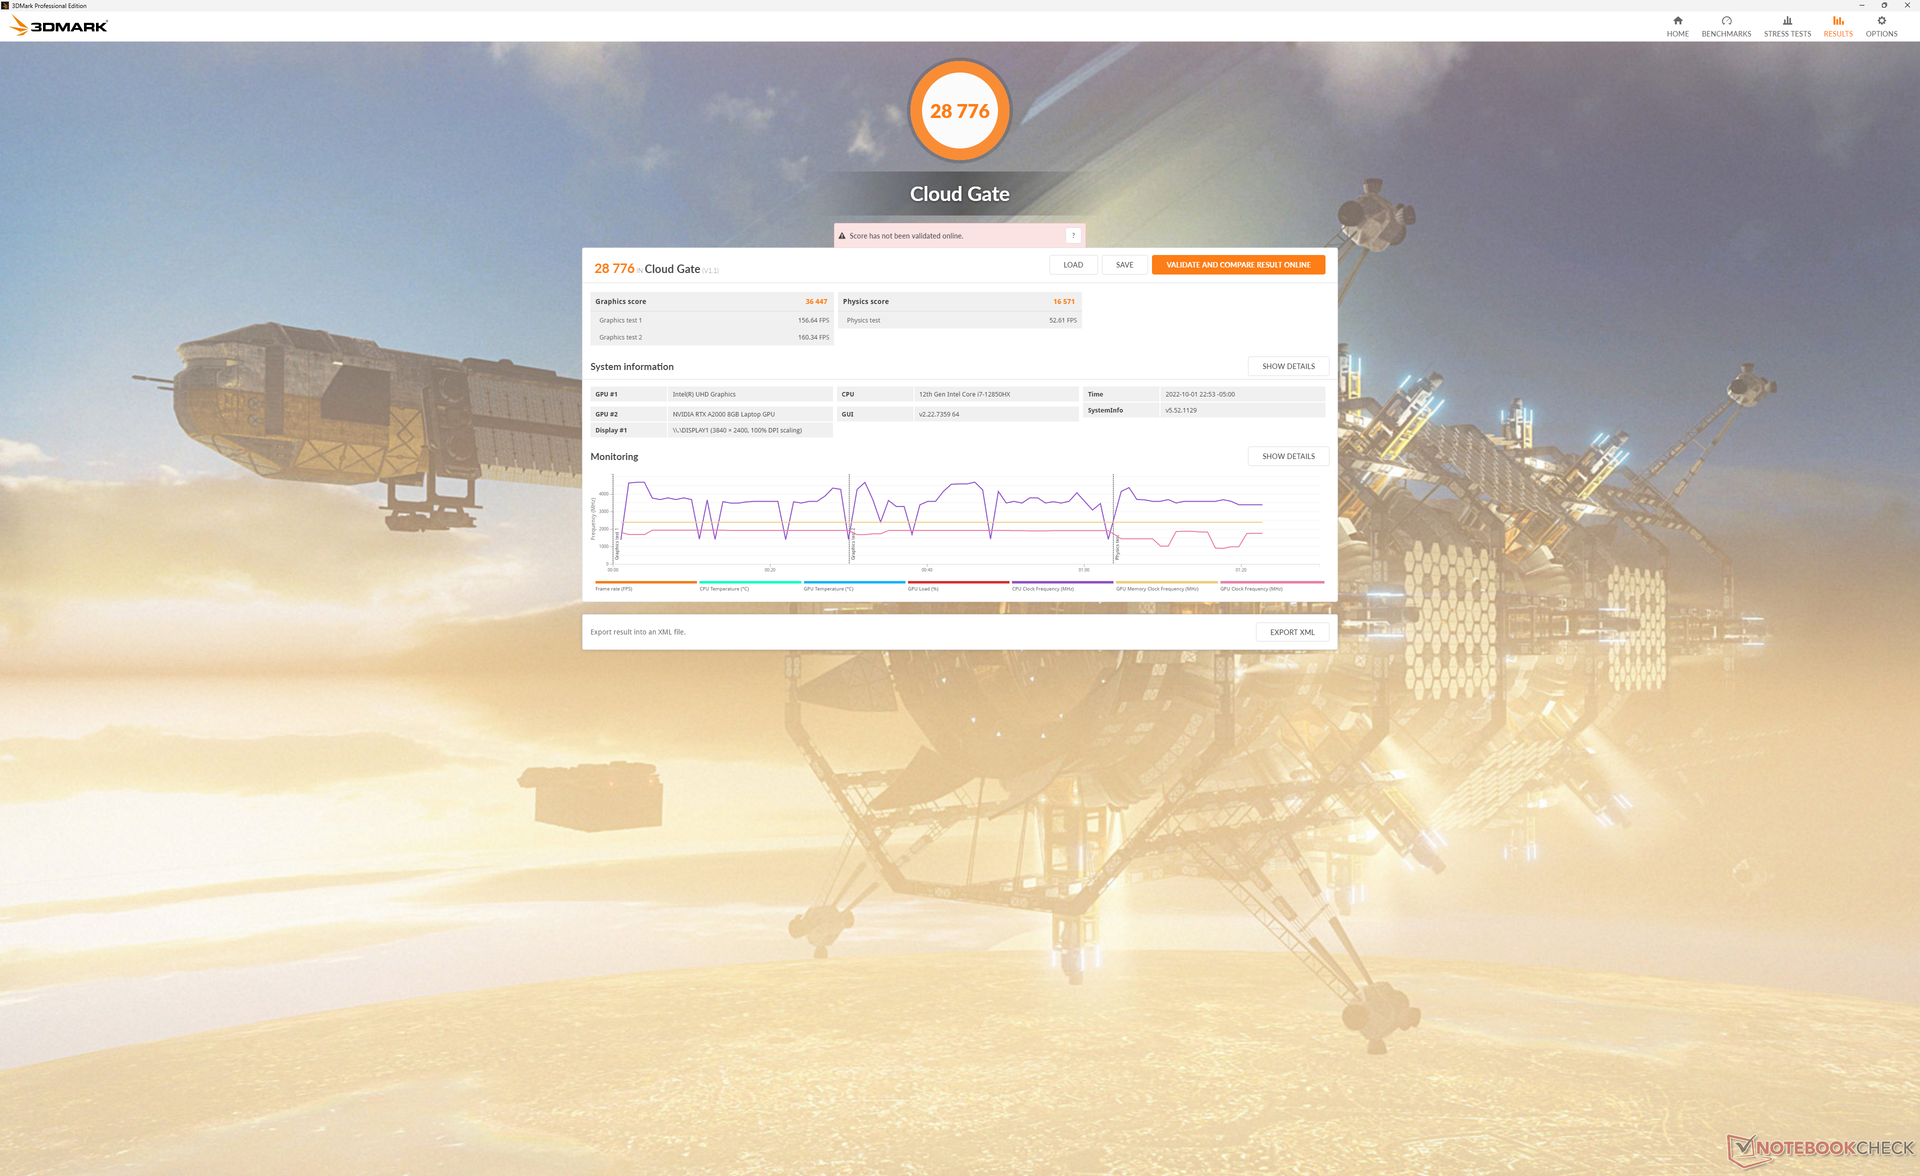
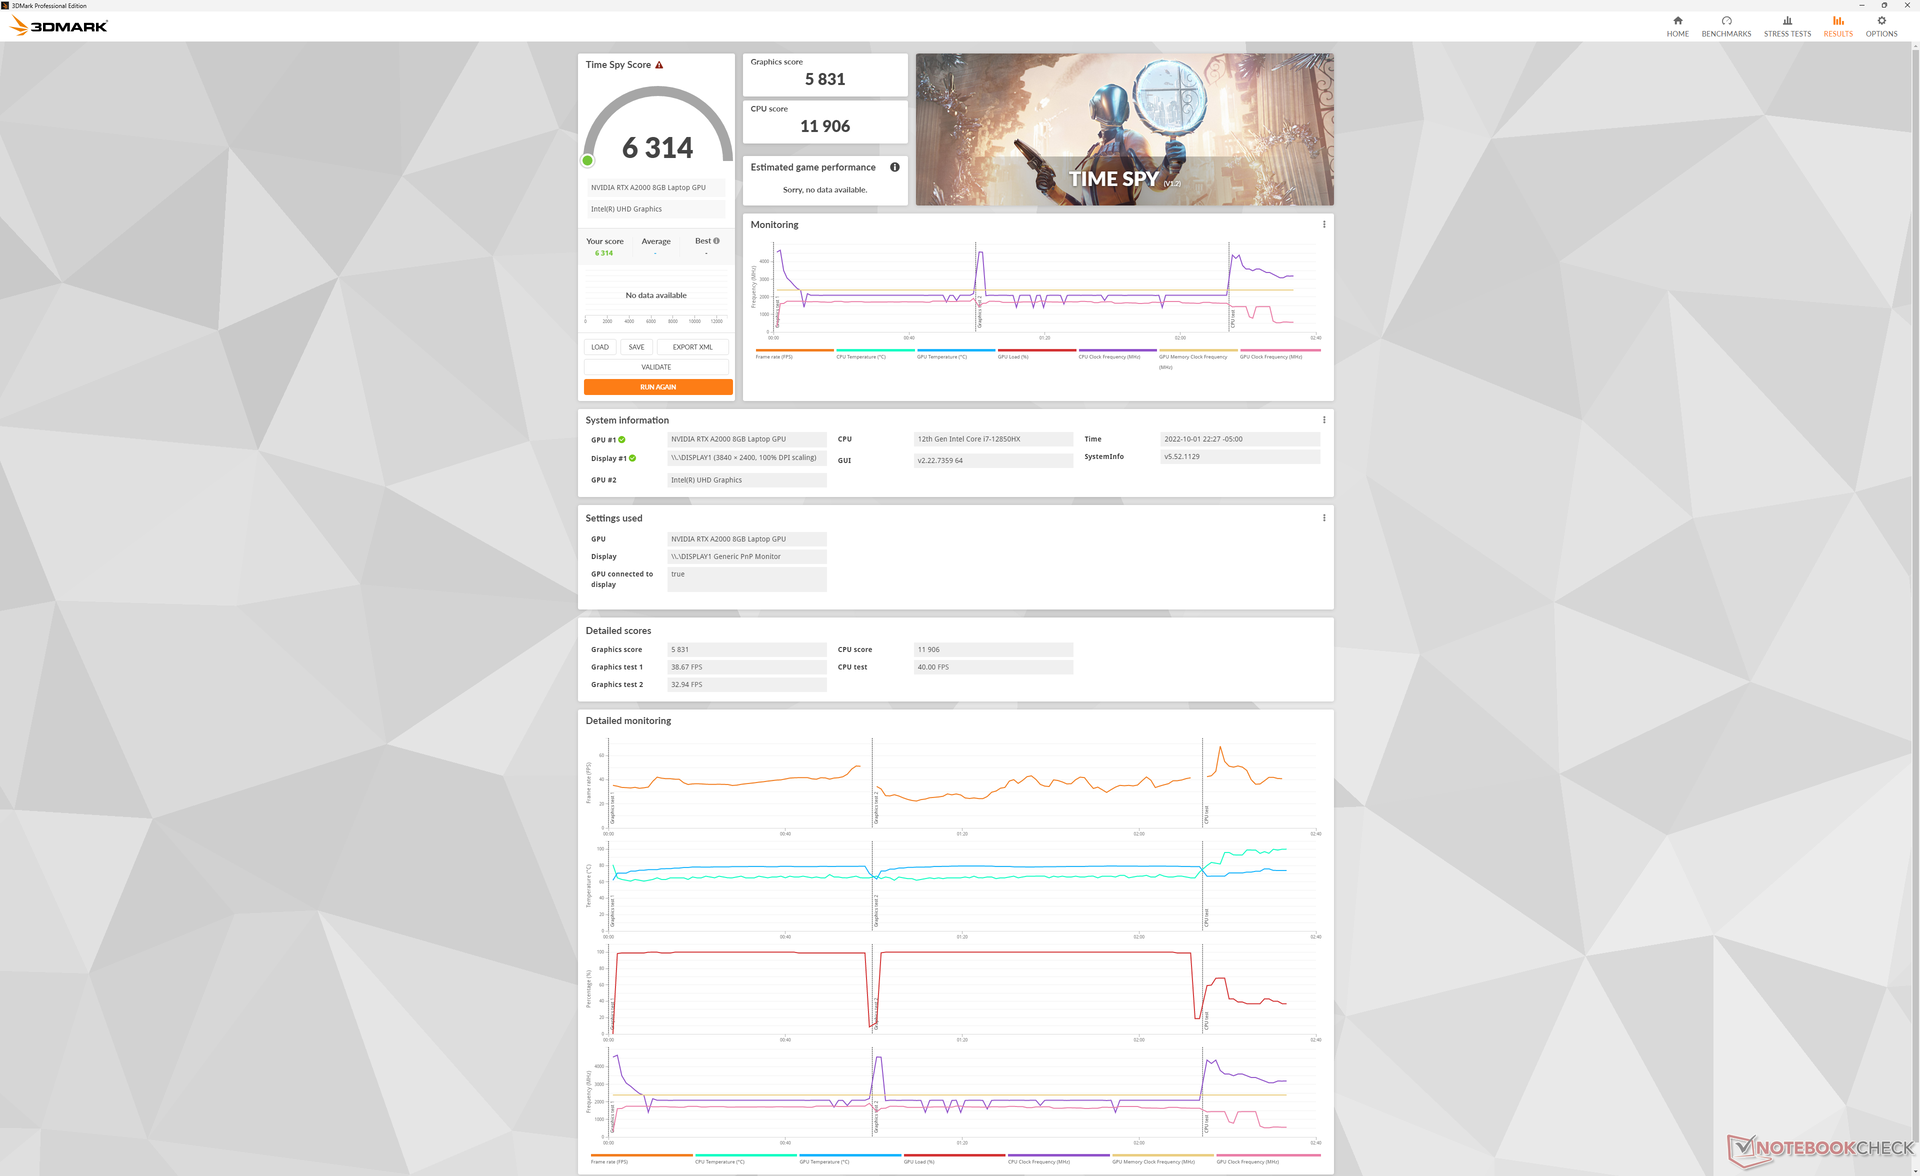
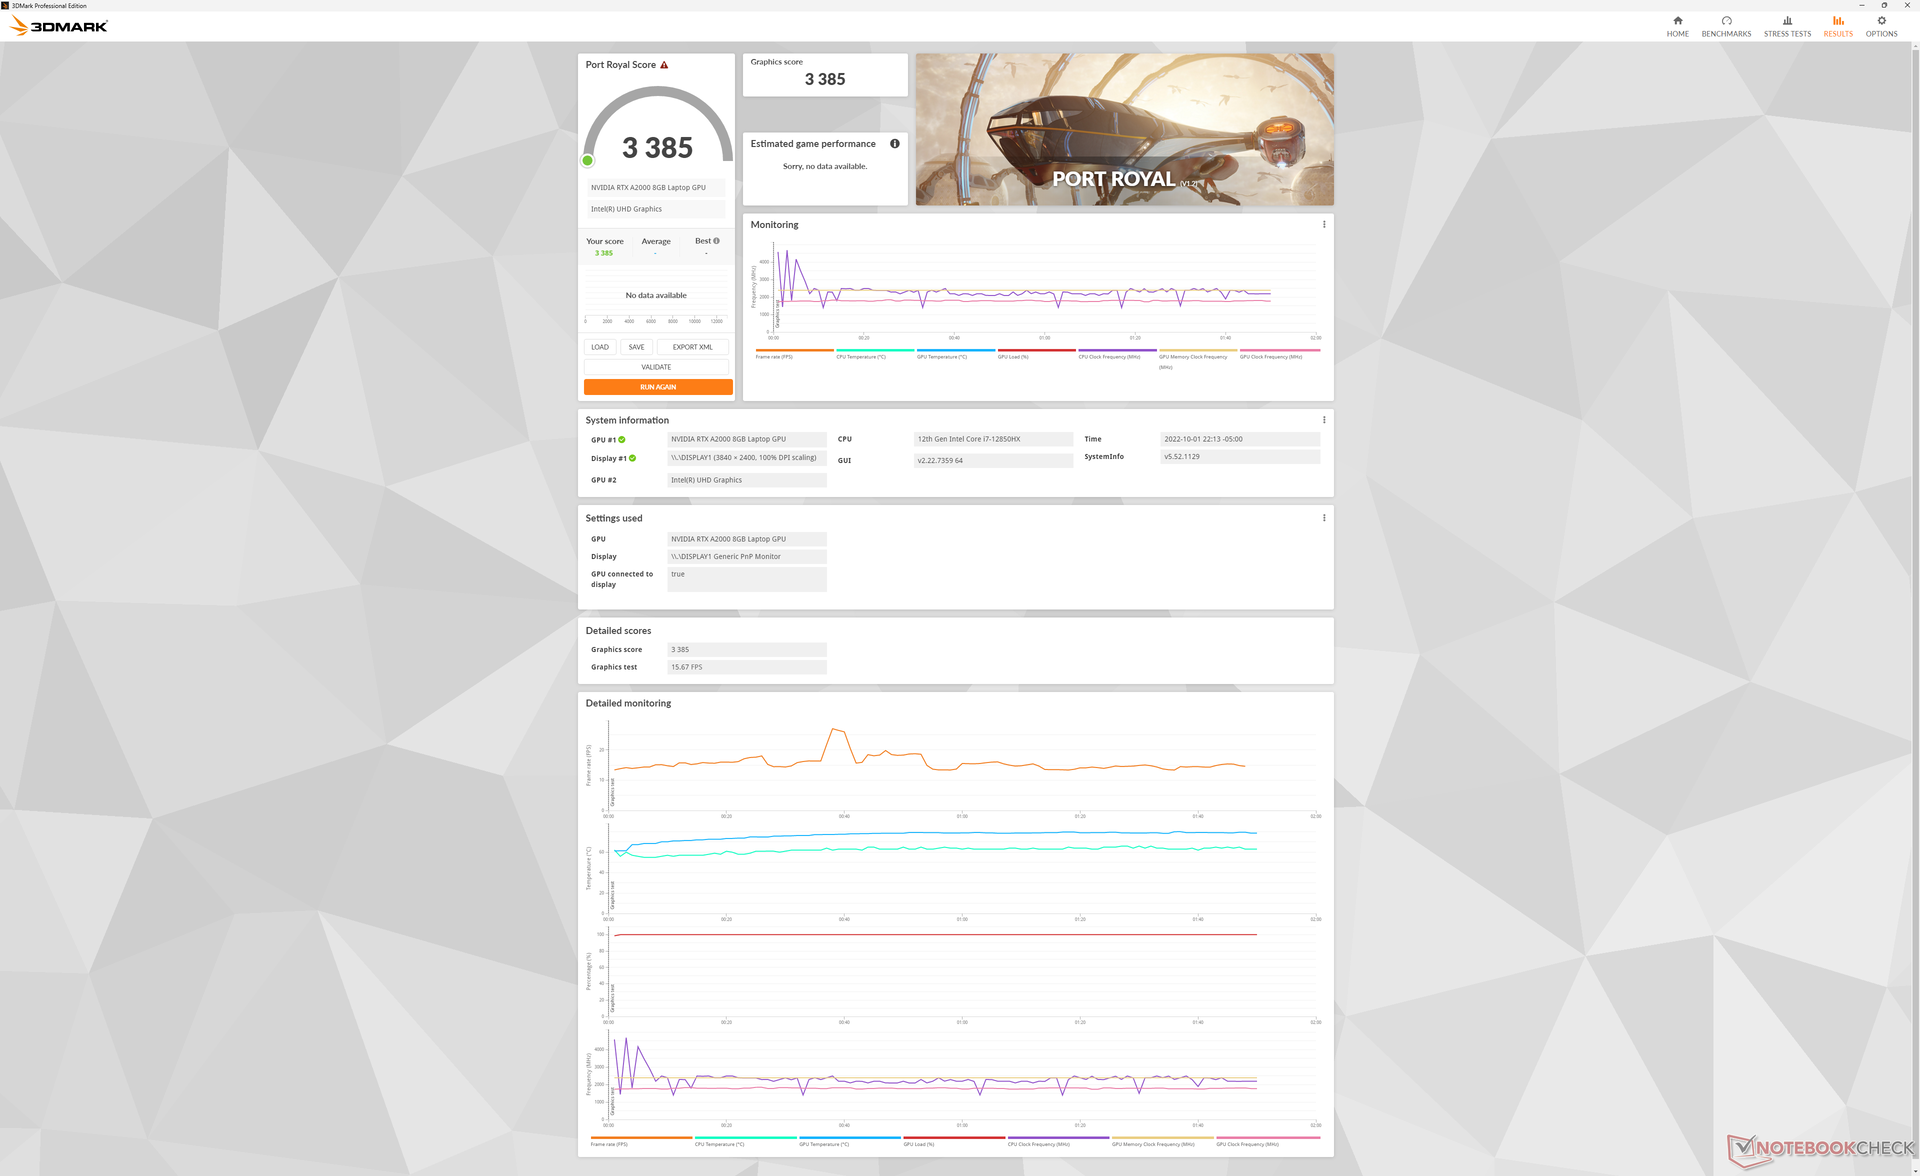
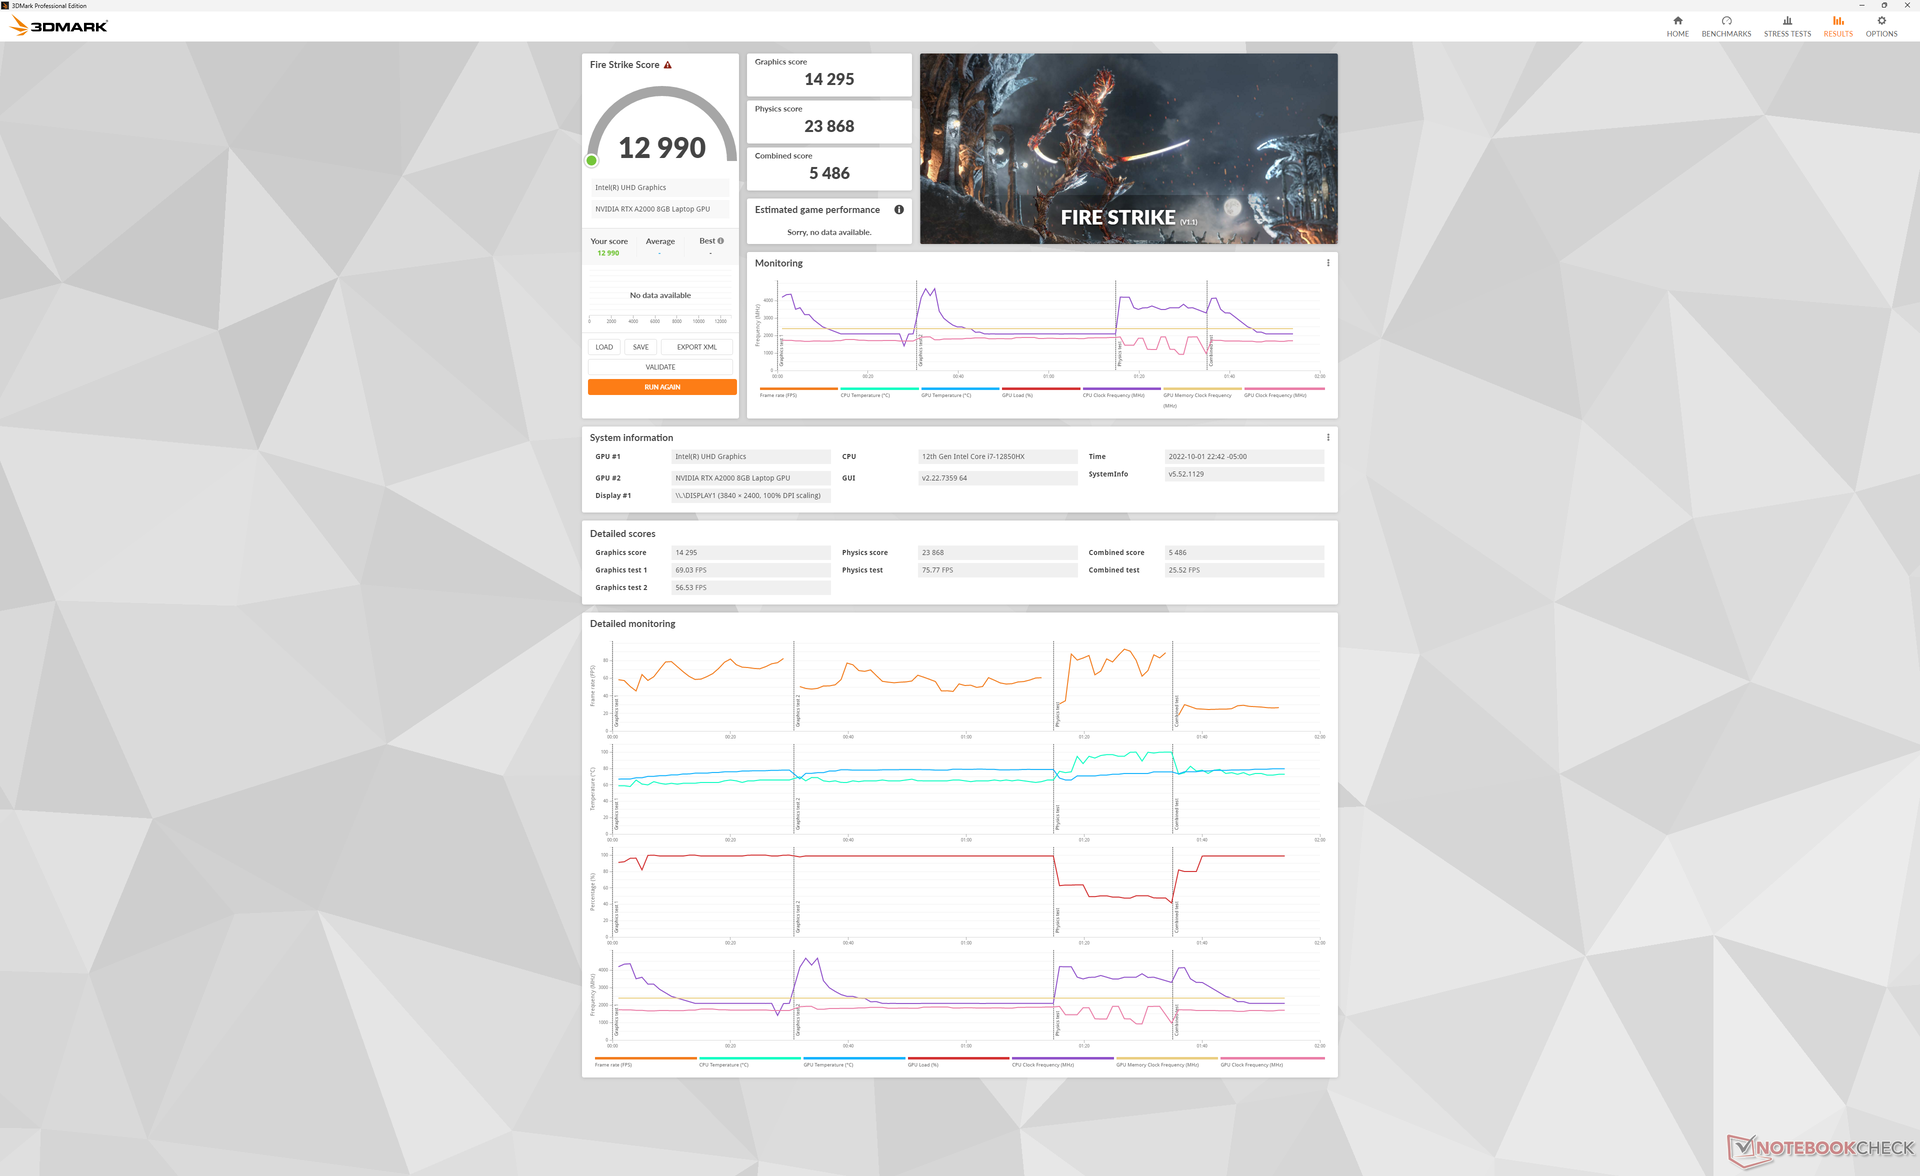
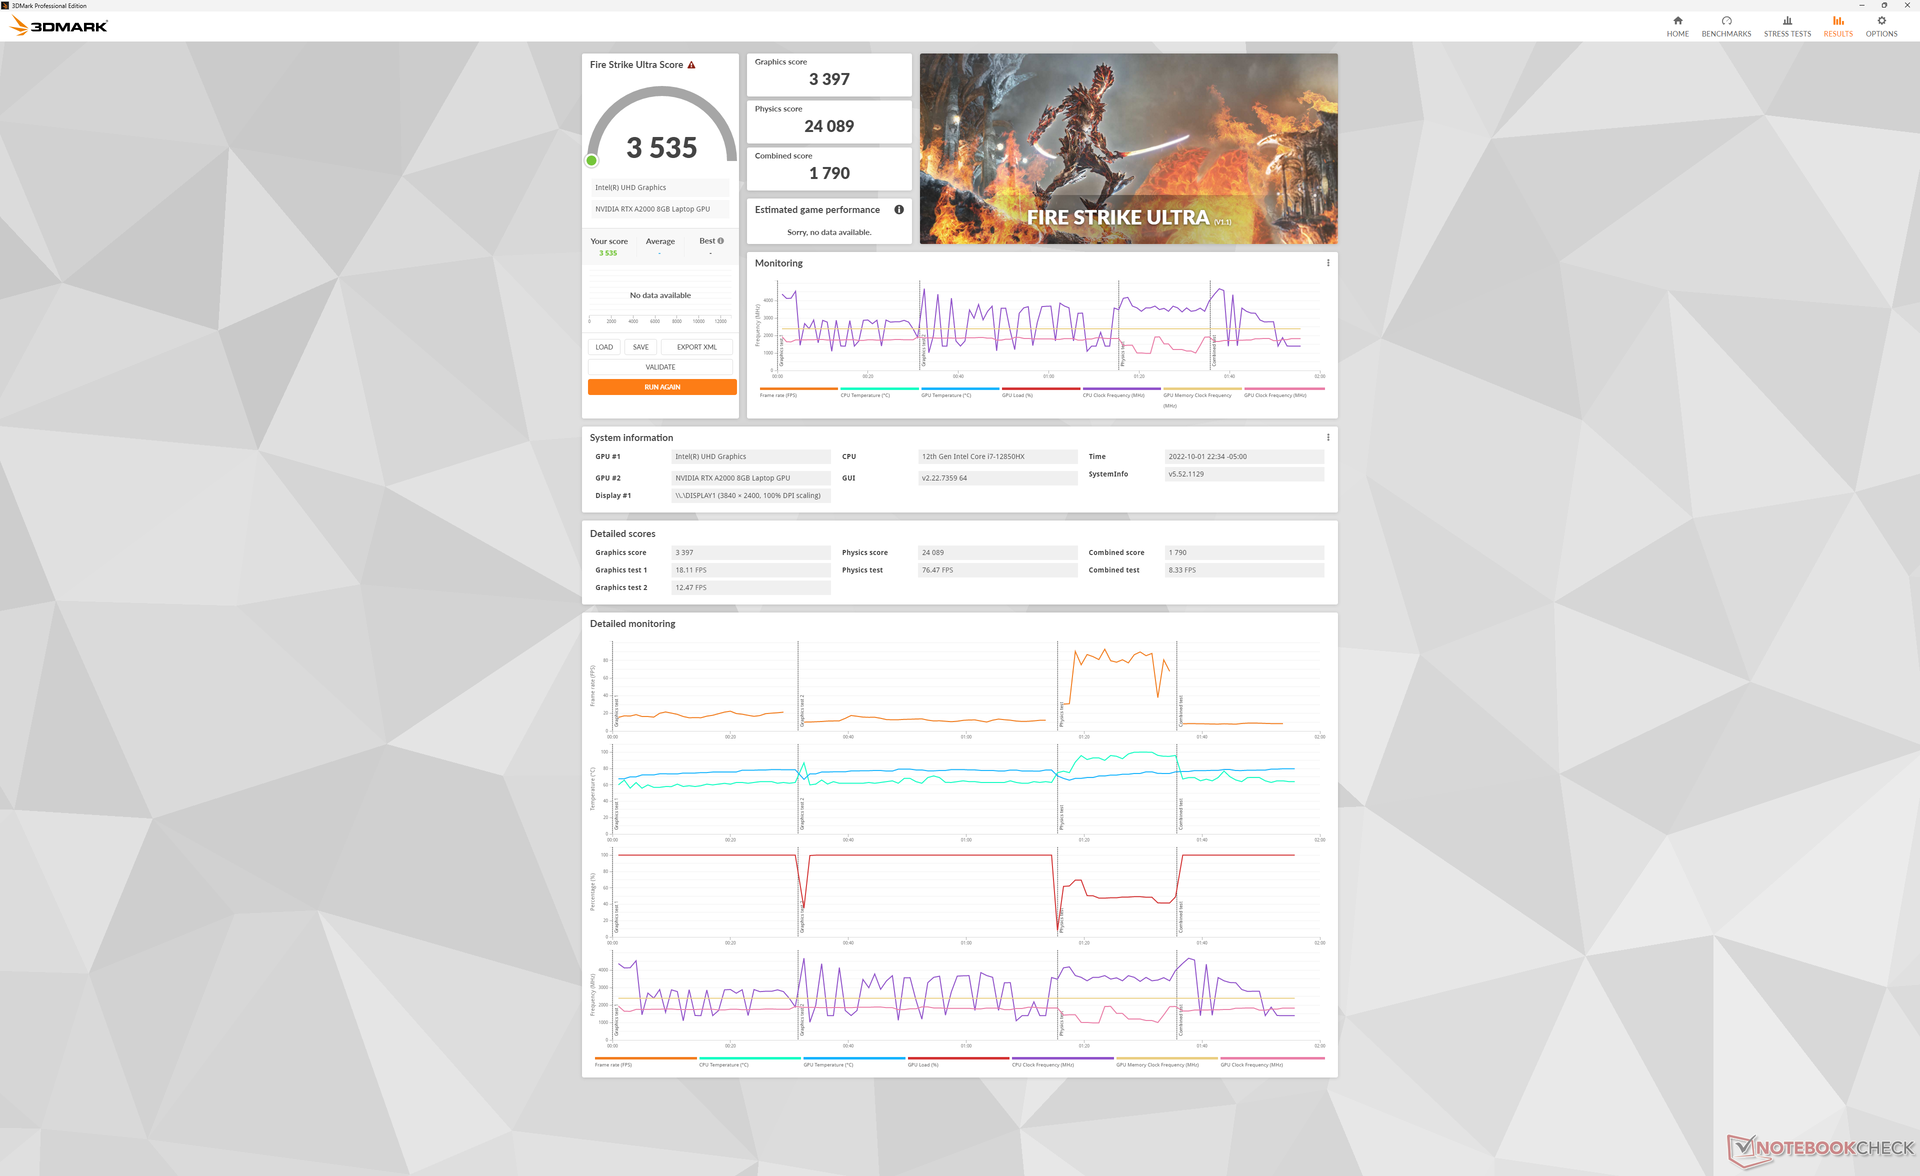
| 3DMark 11 Performance | 18284 points | |
| 3DMark Cloud Gate Standard Score | 28776 points | |
| 3DMark Fire Strike Score | 12990 points | |
| 3DMark Time Spy Score | 6314 points | |
Help | ||
| Blender | |
| v3.3 Classroom HIP/AMD | |
| Lenovo Legion 7 16ARHA7 | |
| v3.3 Classroom OPTIX/RTX | |
| Dell Precision 5000 5470 | |
| HP Envy 16 h0112nr | |
| Dell Precision 7670 | |
| v3.3 Classroom CUDA | |
| Dell Precision 5000 5470 | |
| HP Envy 16 h0112nr | |
| Dell Precision 7670 | |
| v3.3 Classroom CPU | |
| HP Envy 16 h0112nr | |
| Dell Precision 5000 5470 | |
| Lenovo Legion 7 16ARHA7 | |
| Dell Precision 7670 | |
* ... smaller is better
Witcher 3 FPS Chart
| low | med. | high | ultra | QHD | 4K | |
|---|---|---|---|---|---|---|
| GTA V (2015) | 181.7 | 177.6 | 155.1 | 79.1 | 57.1 | |
| The Witcher 3 (2015) | 297.1 | 181.7 | 108.6 | 57.4 | ||
| Dota 2 Reborn (2015) | 180.8 | 159.3 | 145.1 | 128.8 | 78.5 | |
| Final Fantasy XV Benchmark (2018) | 129.5 | 80.4 | 60.6 | 44.4 | 26 | |
| X-Plane 11.11 (2018) | 135.2 | 104.1 | 85.5 | 55.1 | ||
| Strange Brigade (2018) | 325 | 151.2 | 120.9 | 103.5 | 76.8 | |
| Cyberpunk 2077 1.6 (2022) | 78.5 | 65.1 | 55 | 44.3 | 27.4 |
排放
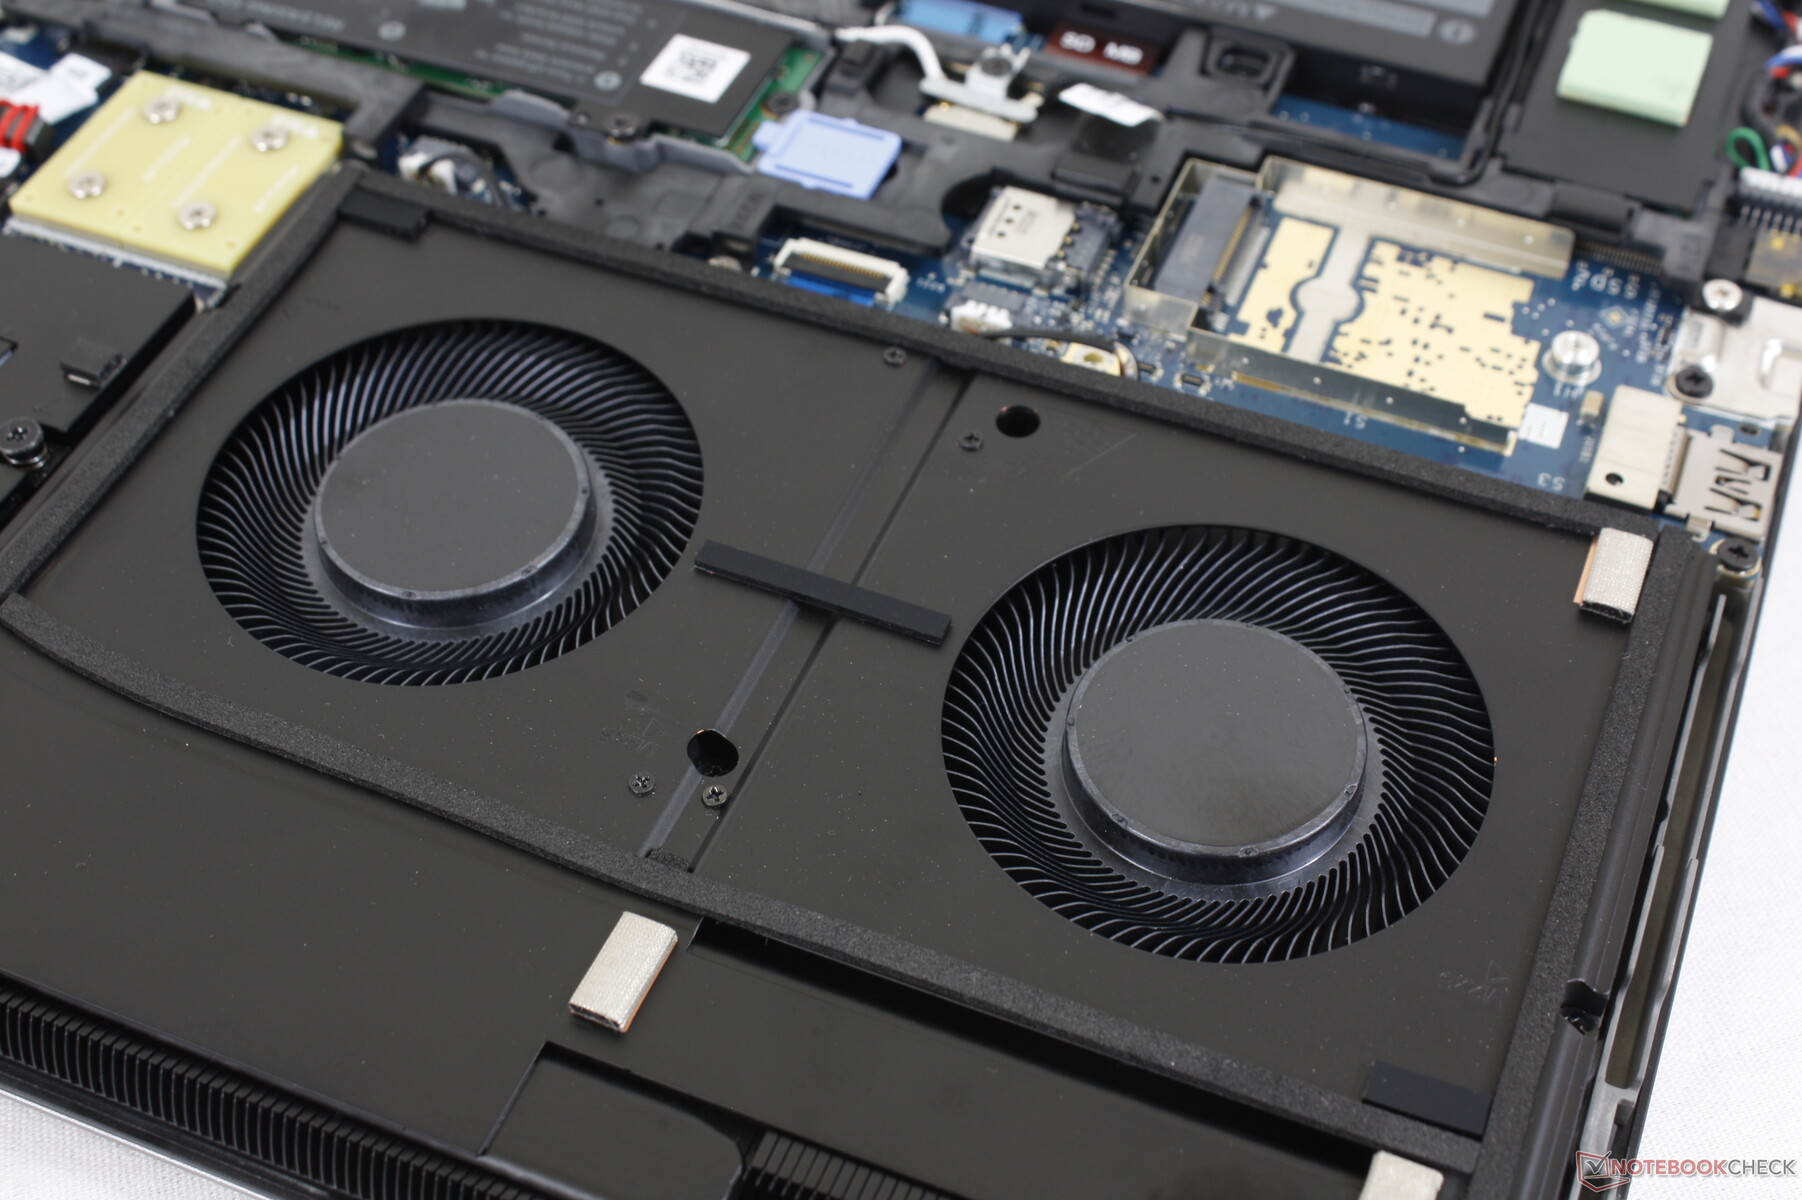
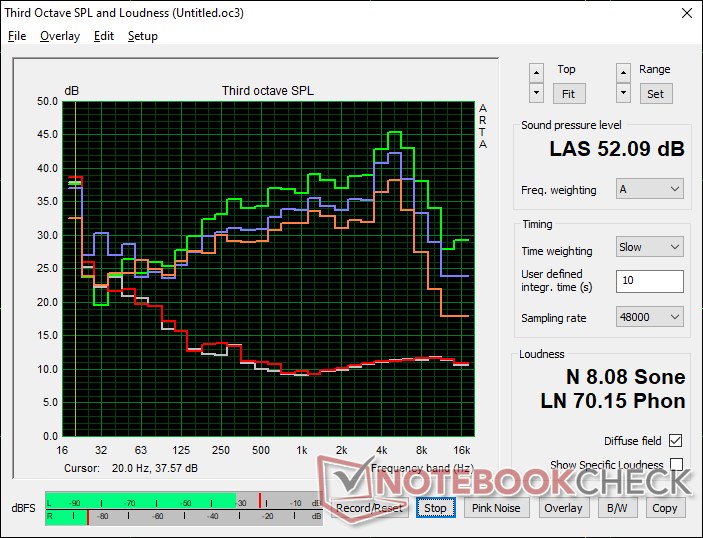
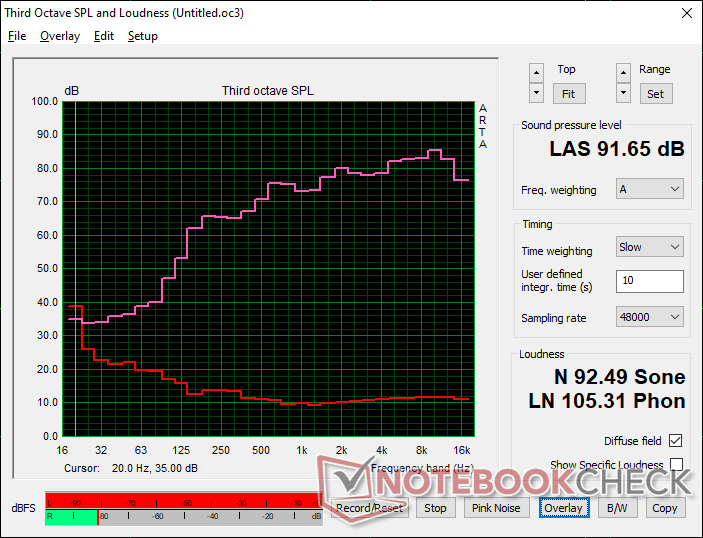
系统噪音
即使在桌面上空转时,风扇也几乎不可能是静音的,但它们还是很安静,在低负荷时很难注意到。在视频播放过程中,在22.7 dB(A)的无声背景下,预计噪音水平将保持在28 dB(A)以下。如果进行网页浏览或文字处理,风扇噪音甚至更小,为24.5 dB(A),这与我们在ZBook Fury 15 G8或5560上观察到的情况相似。 Precision 5560.
当引入更高的负载时,噪音水平上升得有点快。例如,3DMark 06的第一个基准场景将导致风扇噪音高达49 dB(A),即使设置为平衡电源配置文件。如果运行像Prime95和FurMark这样的极端负载,风扇噪音的峰值将达到约52 dB(A),就像在Precision 5560上一样。换句话说,Precision 7670在大多数情况下都能安静地运行,但如果有一点压力,它就会变得相当嘈杂。
Noise level
| Idle |
| 22.9 / 22.9 / 24.5 dB(A) |
| Load |
| 48.7 / 52.1 dB(A) |
 | ||
30 dB silent 40 dB(A) audible 50 dB(A) loud |
||
min: | ||
| Dell Precision 7670 RTX A2000 Laptop GPU, i7-12850HX, SK Hynix HFS001TEJ9X115N | Lenovo ThinkPad P1 G4-20Y4Z9DVUS T1200 Laptop GPU, i7-11800H, Samsung PM9A1 MZVL2512HCJQ | Asus ProArt StudioBook 16 W7600H5A-2BL2 RTX A5000 Laptop GPU, W-11955M, 2x Micron 2300 2TB MTFDHBA2T0TDV (RAID 0) | Dell Precision 5000 5560 RTX A2000 Laptop GPU, i7-11850H, Samsung PM9A1 MZVL22T0HBLB | Dell Precision 7550 Quadro RTX 5000 Max-Q, W-10885M, SK Hynix PC601A NVMe 1TB | HP ZBook Fury 15 G8 RTX A5000 Laptop GPU, i9-11950H, Samsung PM981a MZVLB1T0HBLR | |
|---|---|---|---|---|---|---|
| Noise | -3% | -3% | 11% | -9% | 3% | |
| off / environment * (dB) | 22.7 | 24.3 -7% | 26 -15% | 23.4 -3% | 25.8 -14% | 24.1 -6% |
| Idle Minimum * (dB) | 22.9 | 24.3 -6% | 26 -14% | 23.6 -3% | 25.8 -13% | 24.1 -5% |
| Idle Average * (dB) | 22.9 | 24.3 -6% | 26 -14% | 23.6 -3% | 25.8 -13% | 24.1 -5% |
| Idle Maximum * (dB) | 24.5 | 26.6 -9% | 26.5 -8% | 23.6 4% | 25.9 -6% | 24.8 -1% |
| Load Average * (dB) | 48.7 | 46.8 4% | 42 14% | 25.8 47% | 51.2 -5% | 37.8 22% |
| Witcher 3 ultra * (dB) | 45.2 | 46.8 -4% | 40.1 11% | 51.9 -15% | 44.2 2% | |
| Load Maximum * (dB) | 52.1 | 46.8 10% | 43 17% | 41.4 21% | 51.9 -0% | 44.2 15% |
* ... smaller is better
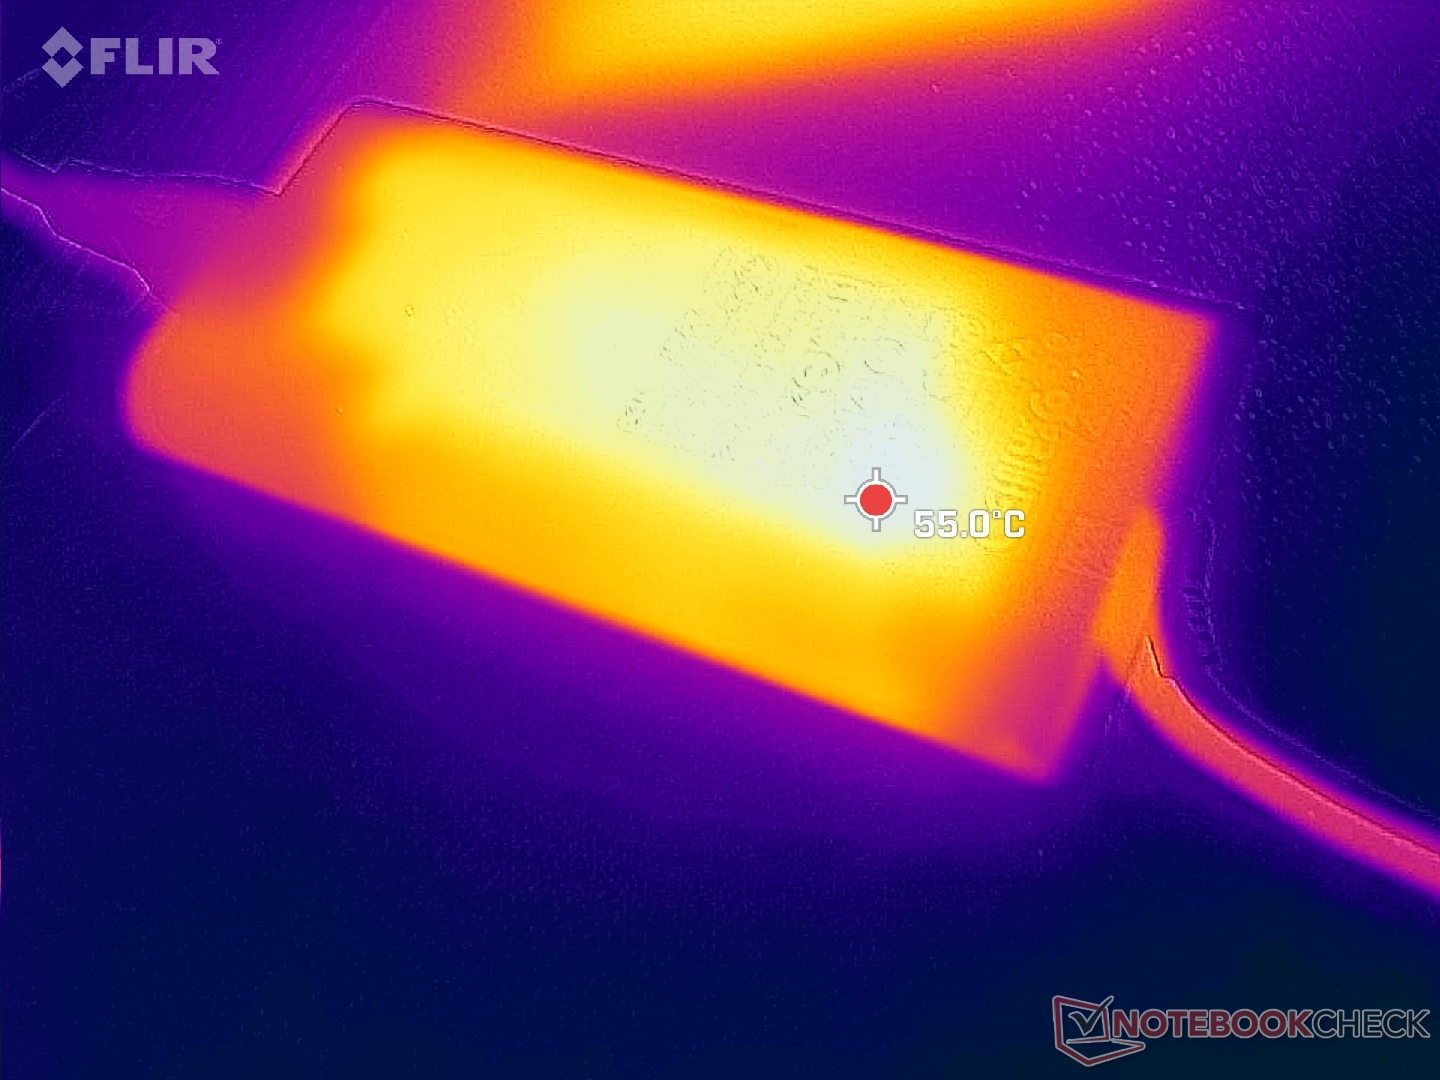
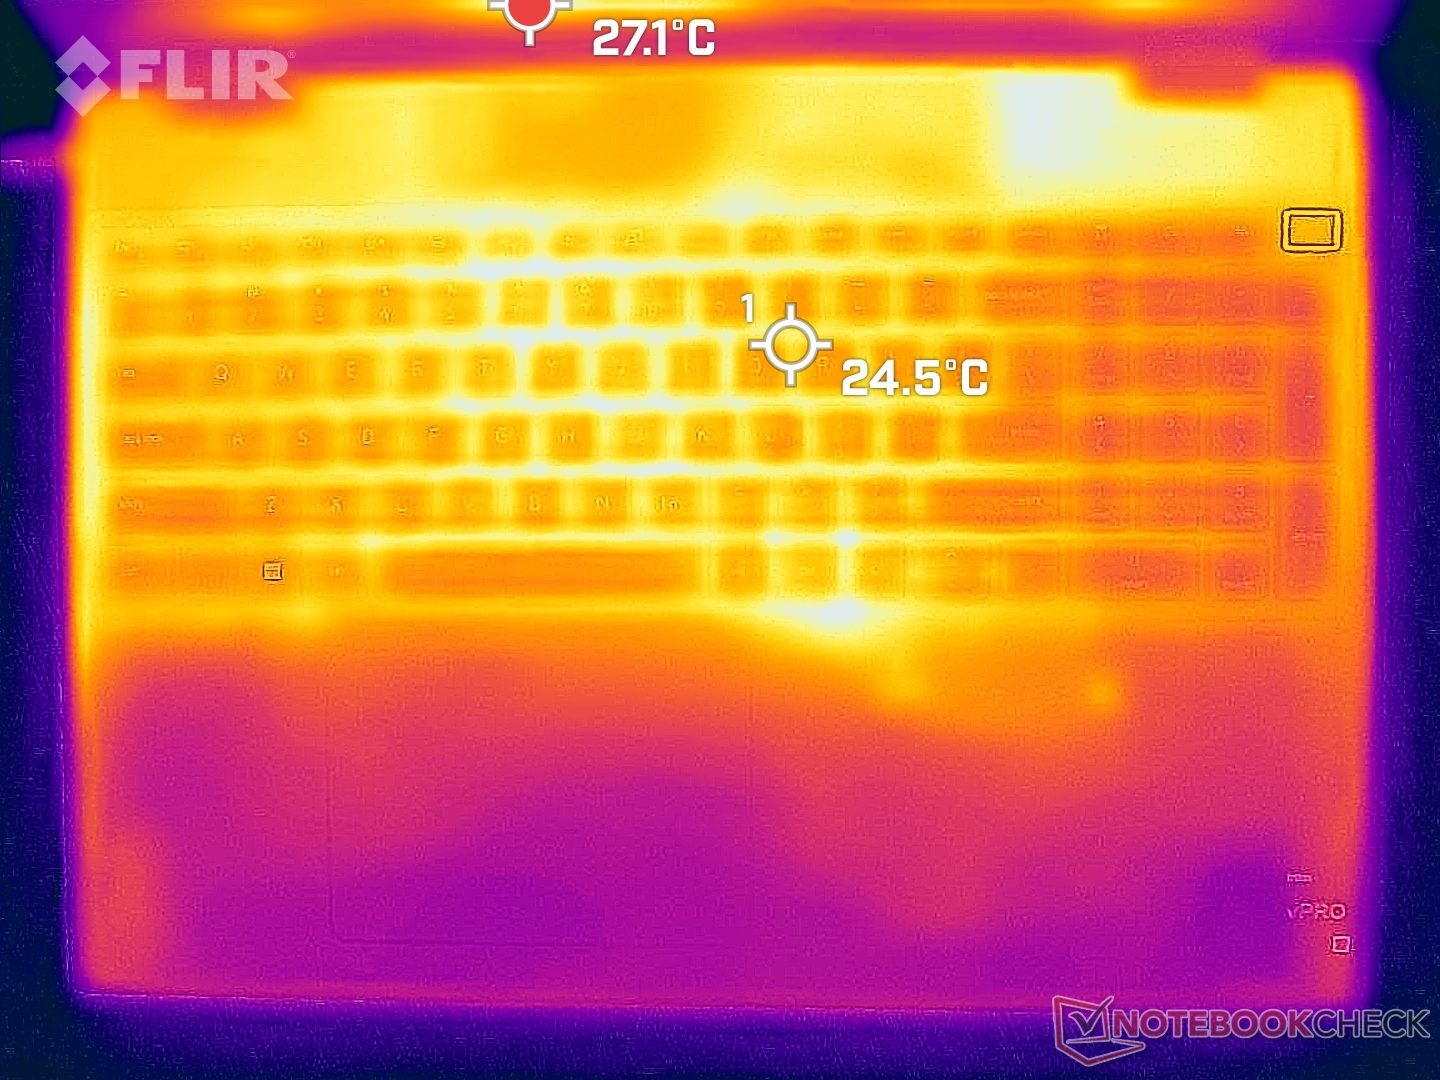
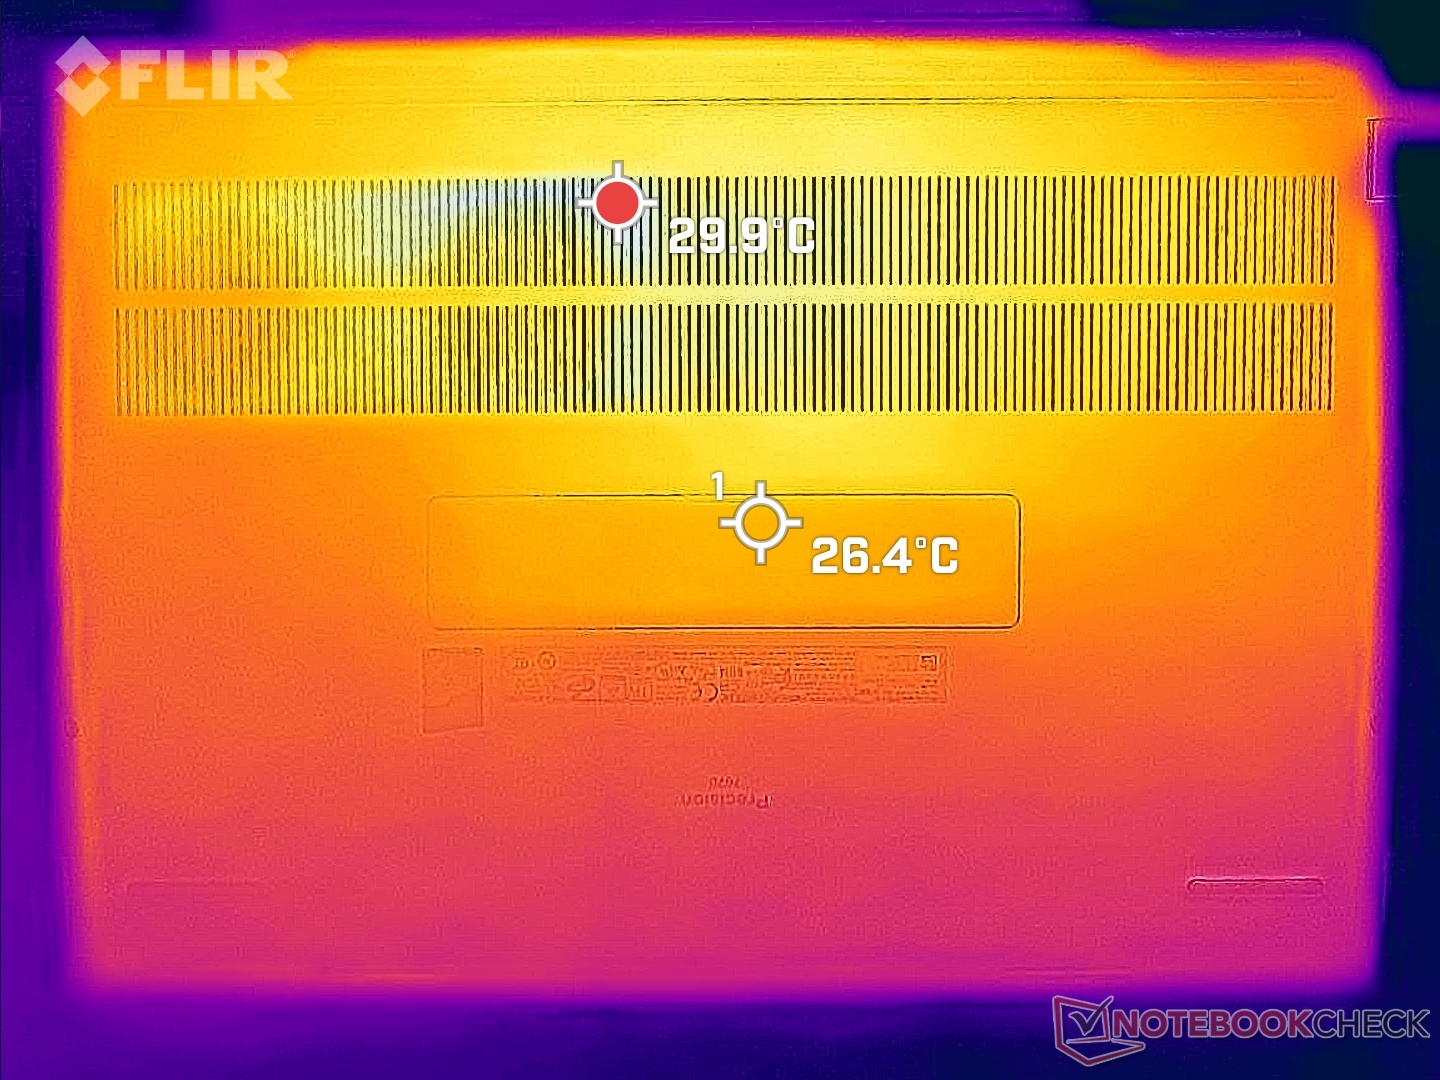
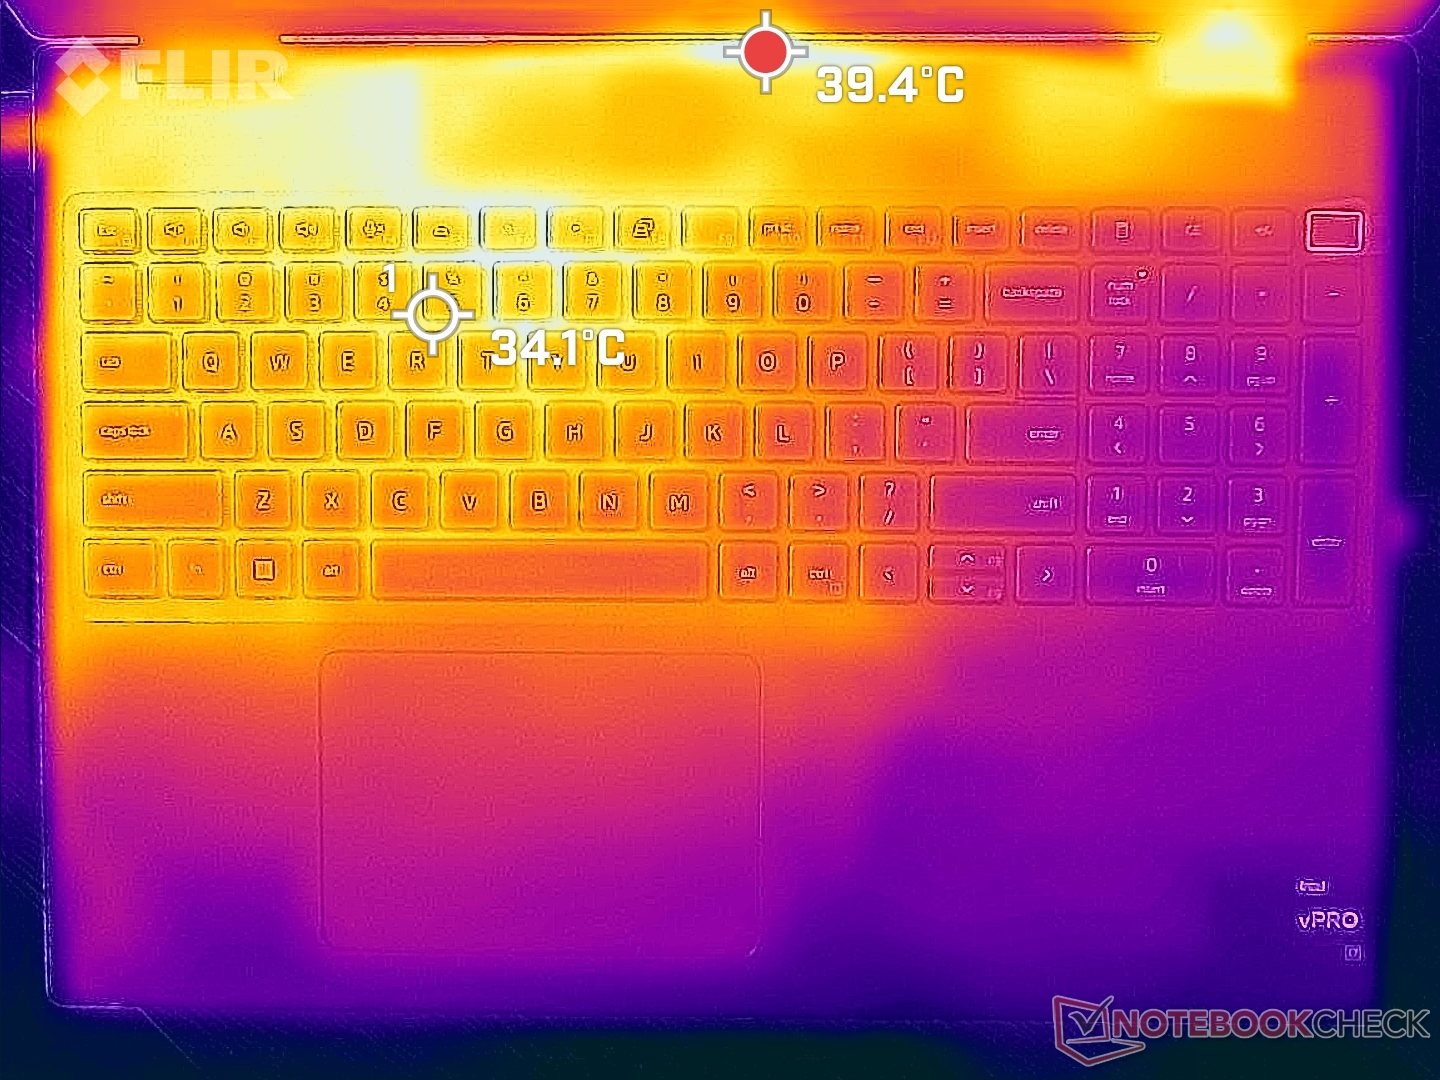
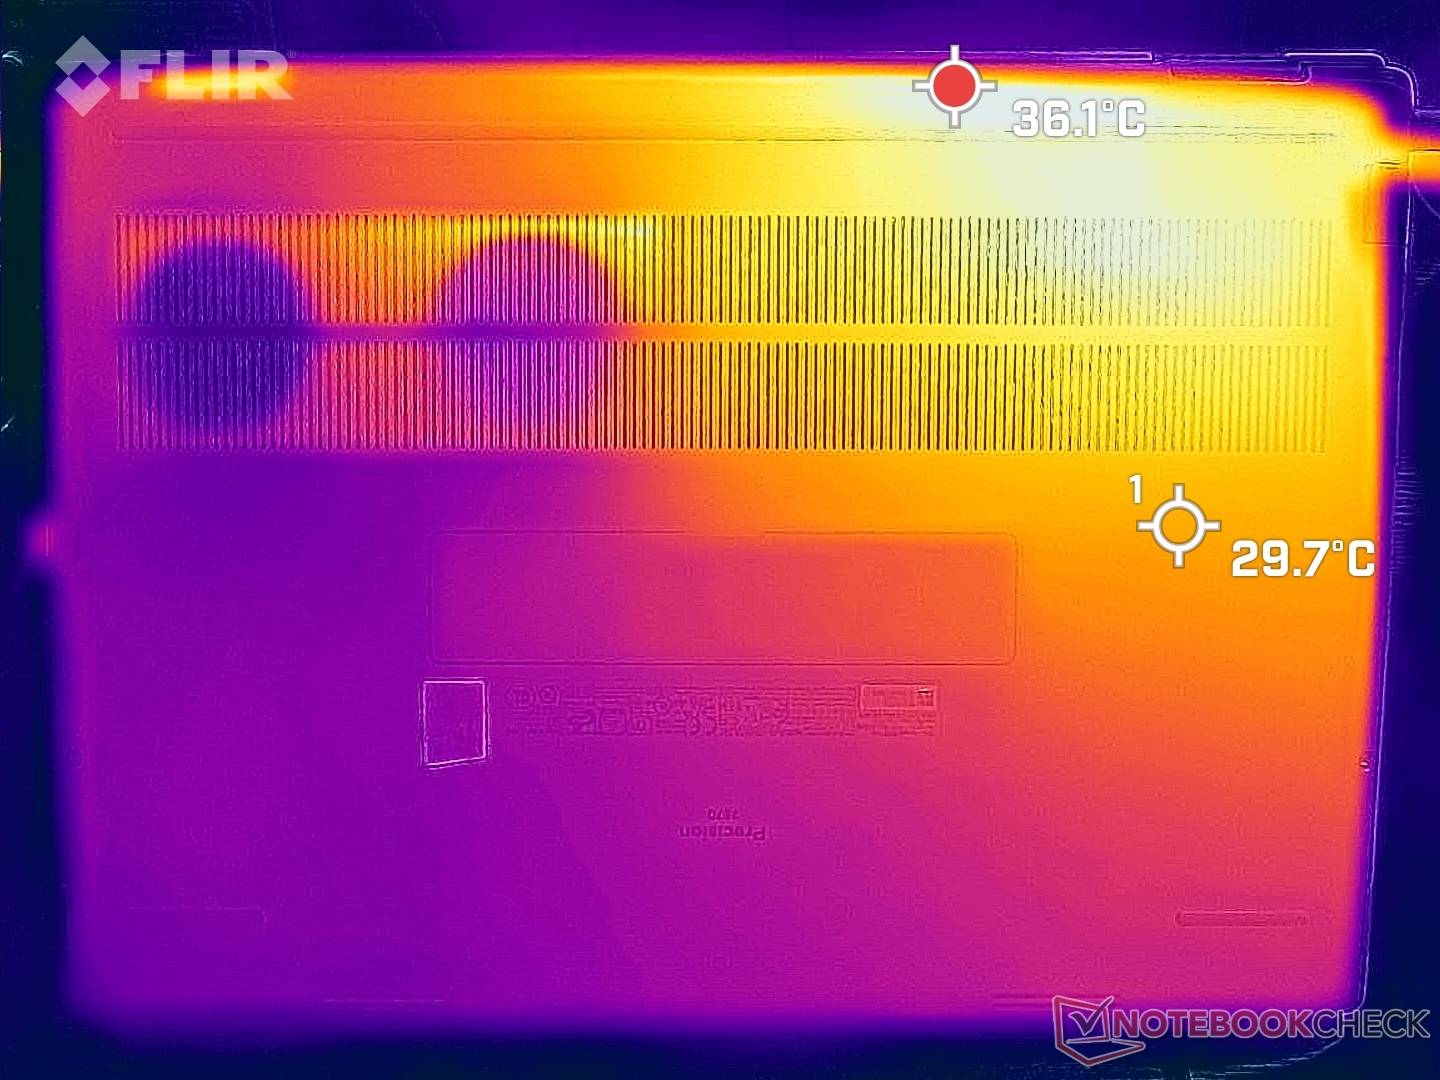
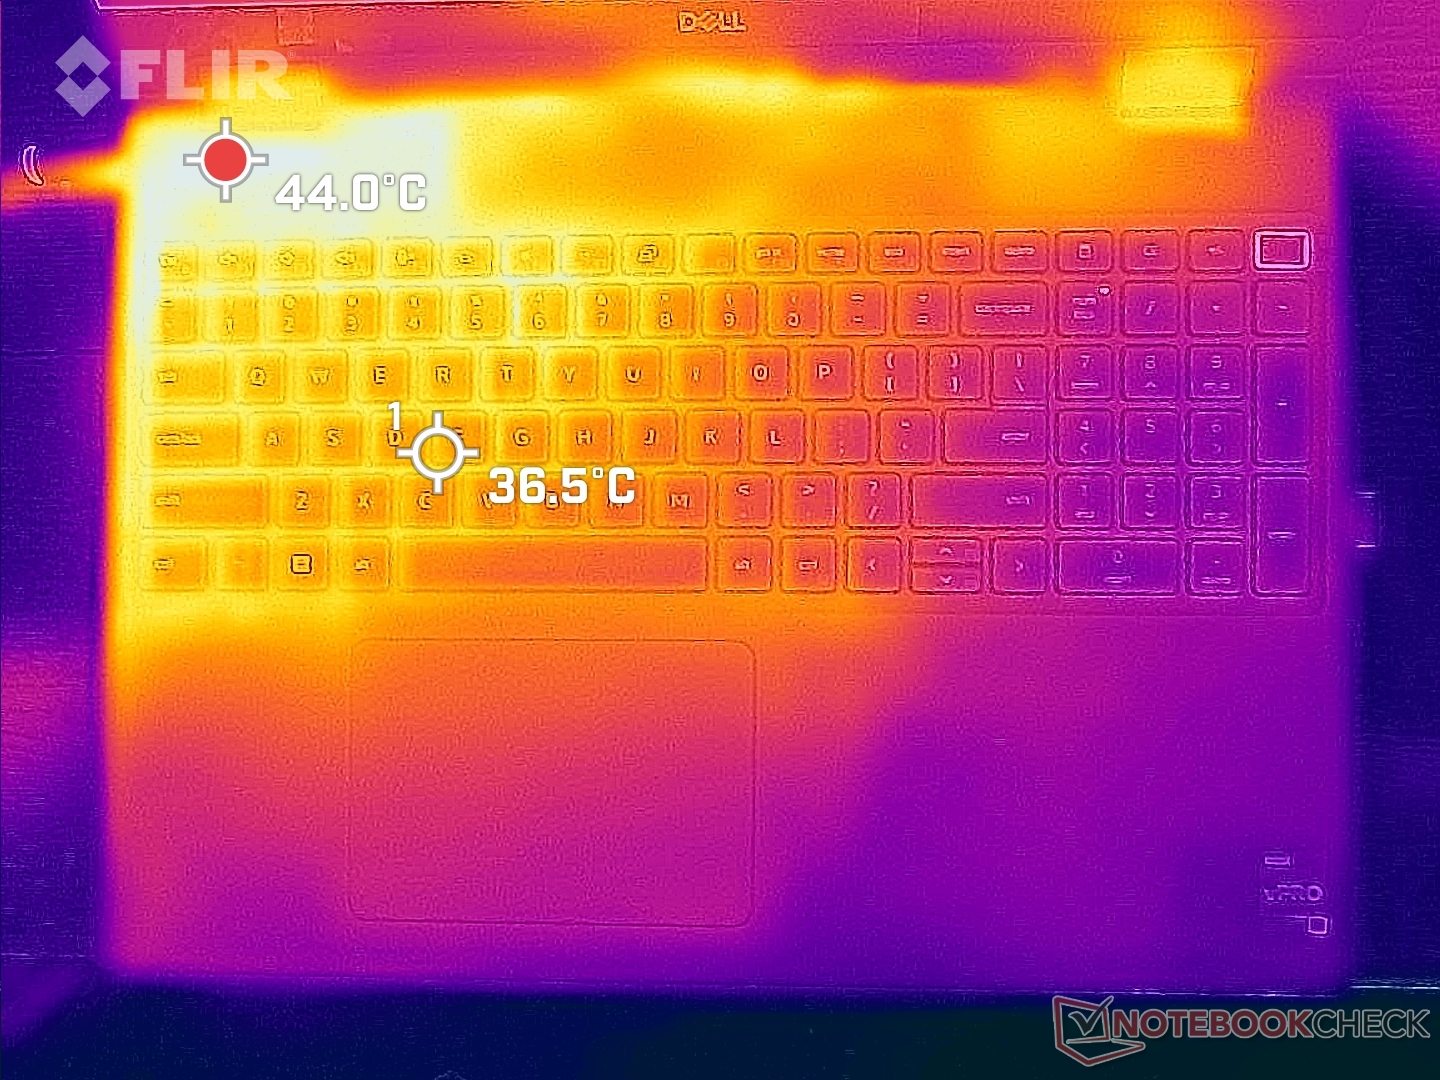
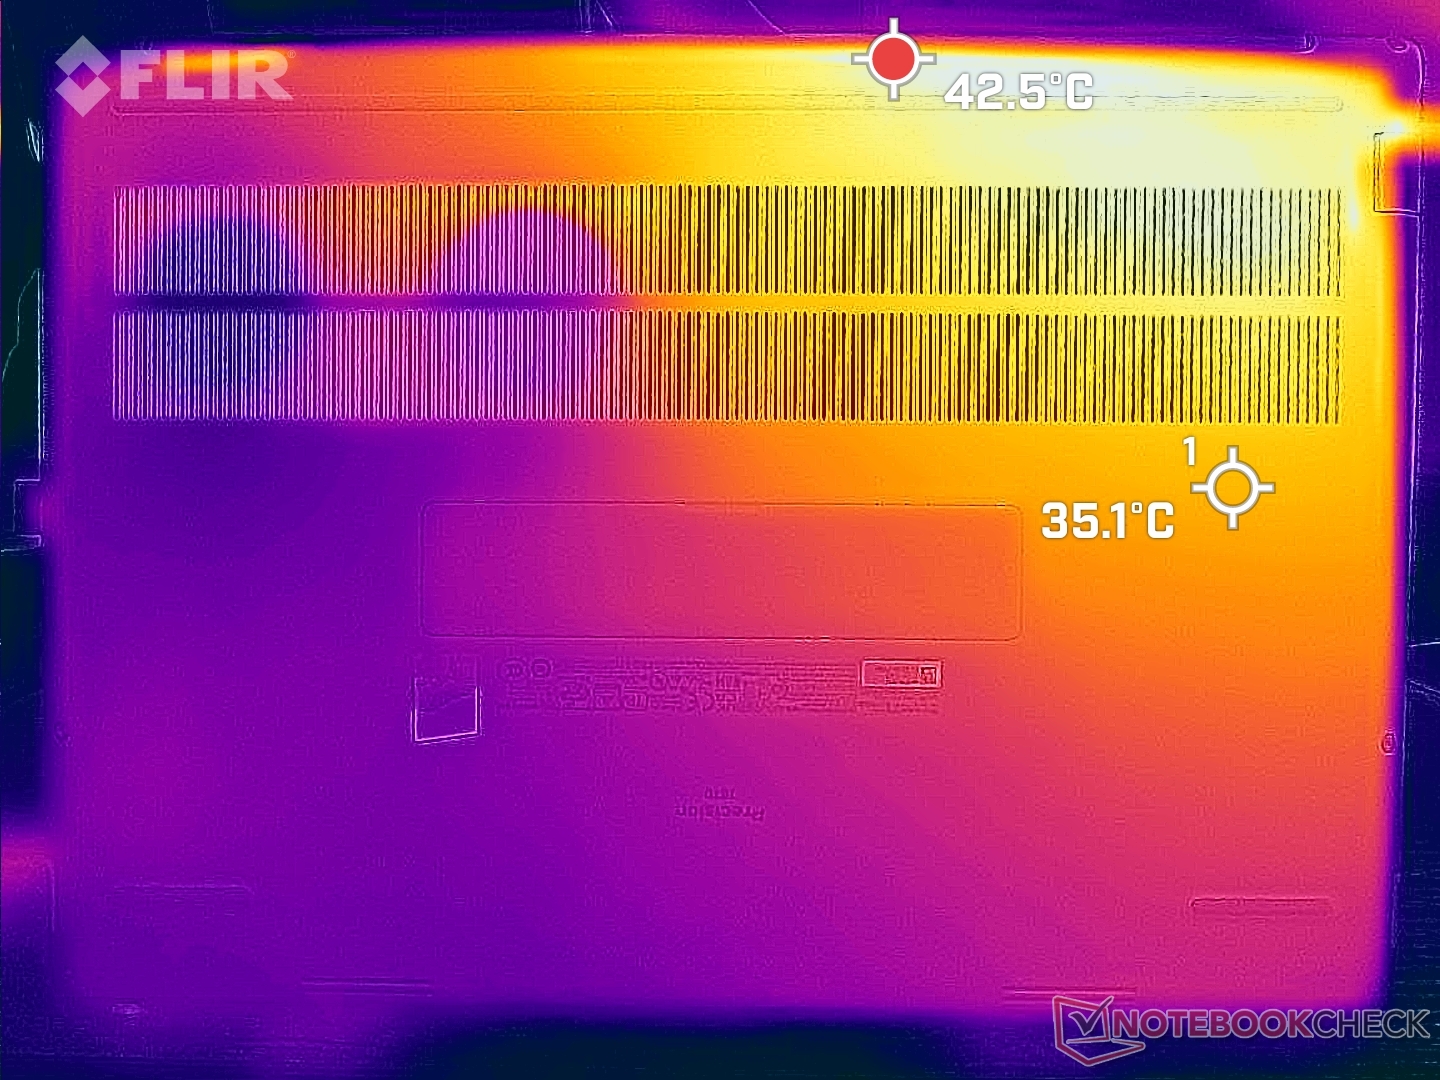
温度
无论屏幕上的负载如何,表面温度总是很高。例如,当在省电模式下空转时,键盘甲板和底部会分别稳定在30℃,而在26℃。联想ThinkPad P1 G4.华硕华硕ProArt StudioBook Pro 16在类似条件下,温度甚至可以达到近35摄氏度。
在运行极端负载时,我们能够在顶部和底部分别记录到51℃和46℃的热点。由于冷却方案和处理器在内部的位置,机箱的左半部分总是比右半部分更热。
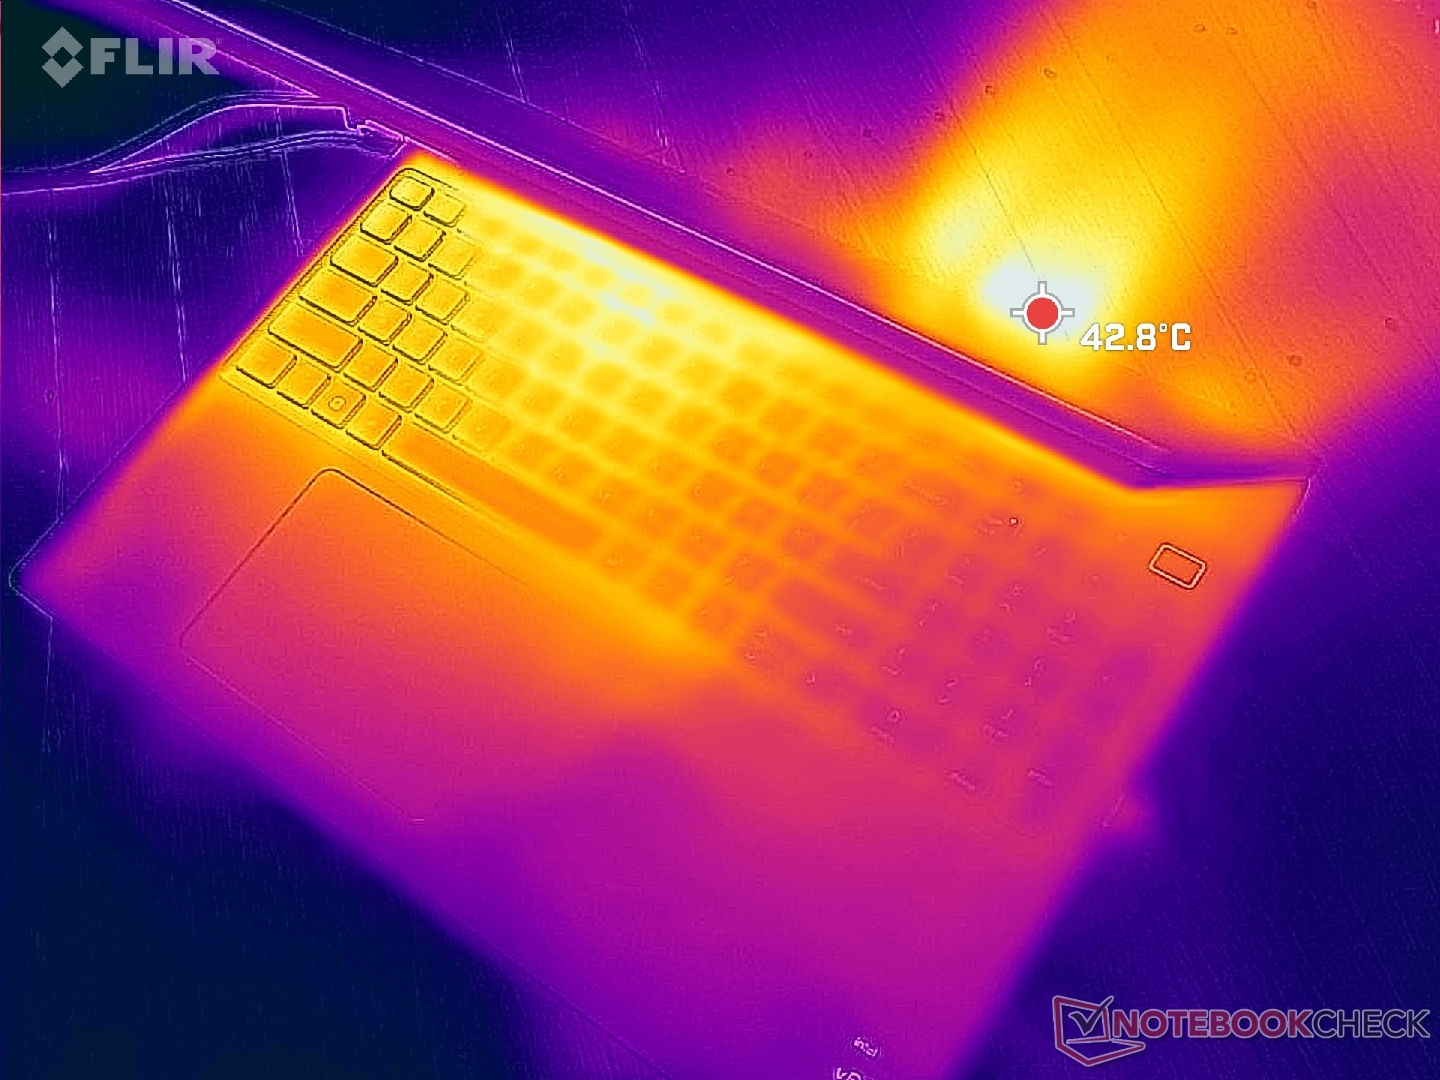
(-) The maximum temperature on the upper side is 51 °C / 124 F, compared to the average of 38.2 °C / 101 F, ranging from 22.2 to 69.8 °C for the class Workstation.
(-) The bottom heats up to a maximum of 45.8 °C / 114 F, compared to the average of 41.1 °C / 106 F
(+) In idle usage, the average temperature for the upper side is 29.8 °C / 86 F, compared to the device average of 32 °C / 90 F.
(±) Playing The Witcher 3, the average temperature for the upper side is 37.1 °C / 99 F, compared to the device average of 32 °C / 90 F.
(+) The palmrests and touchpad are reaching skin temperature as a maximum (34.2 °C / 93.6 F) and are therefore not hot.
(-) The average temperature of the palmrest area of similar devices was 27.8 °C / 82 F (-6.4 °C / -11.6 F).
| Dell Precision 7670 Intel Core i7-12850HX, NVIDIA RTX A2000 Laptop GPU | Lenovo ThinkPad P1 G4-20Y4Z9DVUS Intel Core i7-11800H, NVIDIA T1200 Laptop GPU | Asus ProArt StudioBook 16 W7600H5A-2BL2 Intel Xeon W-11955M, NVIDIA RTX A5000 Laptop GPU | Dell Precision 5000 5560 Intel Core i7-11850H, NVIDIA RTX A2000 Laptop GPU | Dell Precision 7550 Intel Xeon W-10885M, NVIDIA Quadro RTX 5000 Max-Q | HP ZBook Fury 15 G8 Intel Core i9-11950H, NVIDIA RTX A5000 Laptop GPU | |
|---|---|---|---|---|---|---|
| Heat | 5% | -3% | -1% | 2% | 4% | |
| Maximum Upper Side * (°C) | 51 | 49.9 2% | 45.7 10% | 48.2 5% | 49 4% | 45.6 11% |
| Maximum Bottom * (°C) | 45.8 | 56.7 -24% | 48.3 -5% | 42.6 7% | 51 -11% | 57.6 -26% |
| Idle Upper Side * (°C) | 31.8 | 25.5 20% | 35.3 -11% | 34.8 -9% | 28.2 11% | 26 18% |
| Idle Bottom * (°C) | 32.6 | 26.2 20% | 34.4 -6% | 35.2 -8% | 32 2% | 28.8 12% |
* ... smaller is better
压力测试
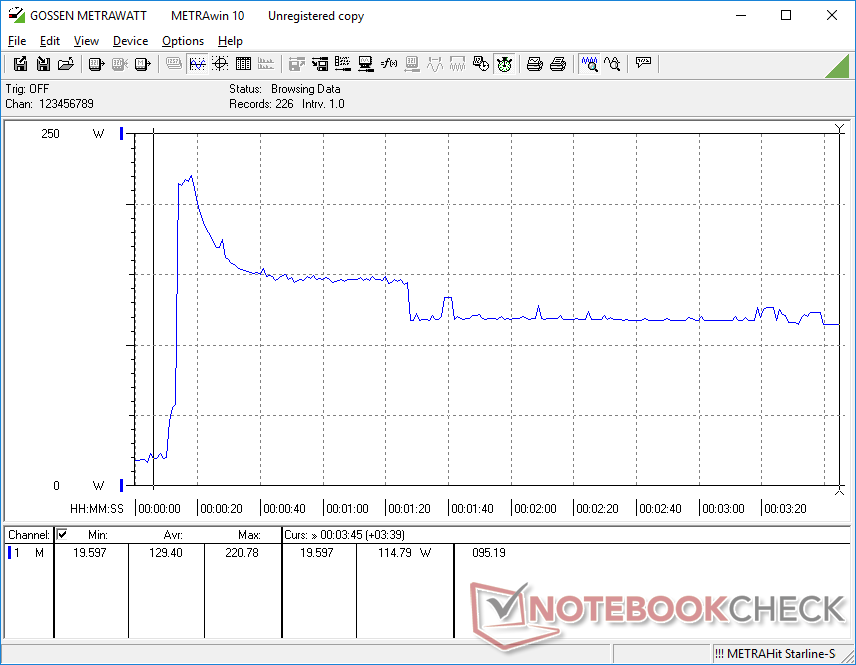
当运行Prime95对CPU施加压力时,时钟频率和主板功耗将分别飙升至3.5 GHz和153 W,最多只持续几秒钟。在这个短暂的时期内,核心温度将高达100℃。随后,时钟频率和功耗将稳步下降,然后分别稳定在2.2到2.4GHz和73W,以保持85C的更可容忍的核心温度。
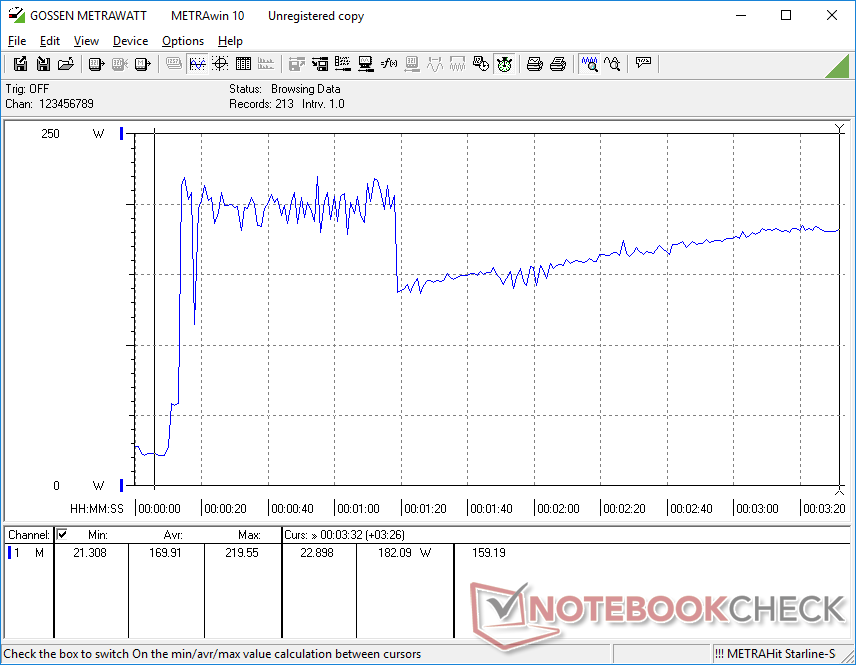
当运行Witcher 3 ,代表稳定的重负荷时,GPU时钟速率、温度和功耗将分别稳定在1777 MHz、80 C和80 W,而在较小的Precision 5560上,同样的RTX A2000 GPU,则分别为1462 MHz、75 C和45 W。
用电池供电运行限制了性能。在电池上进行的Fire Strike 测试将返回物理和图形分数,分别为9820分和6911分,而在主电源上则为23868和14295分。
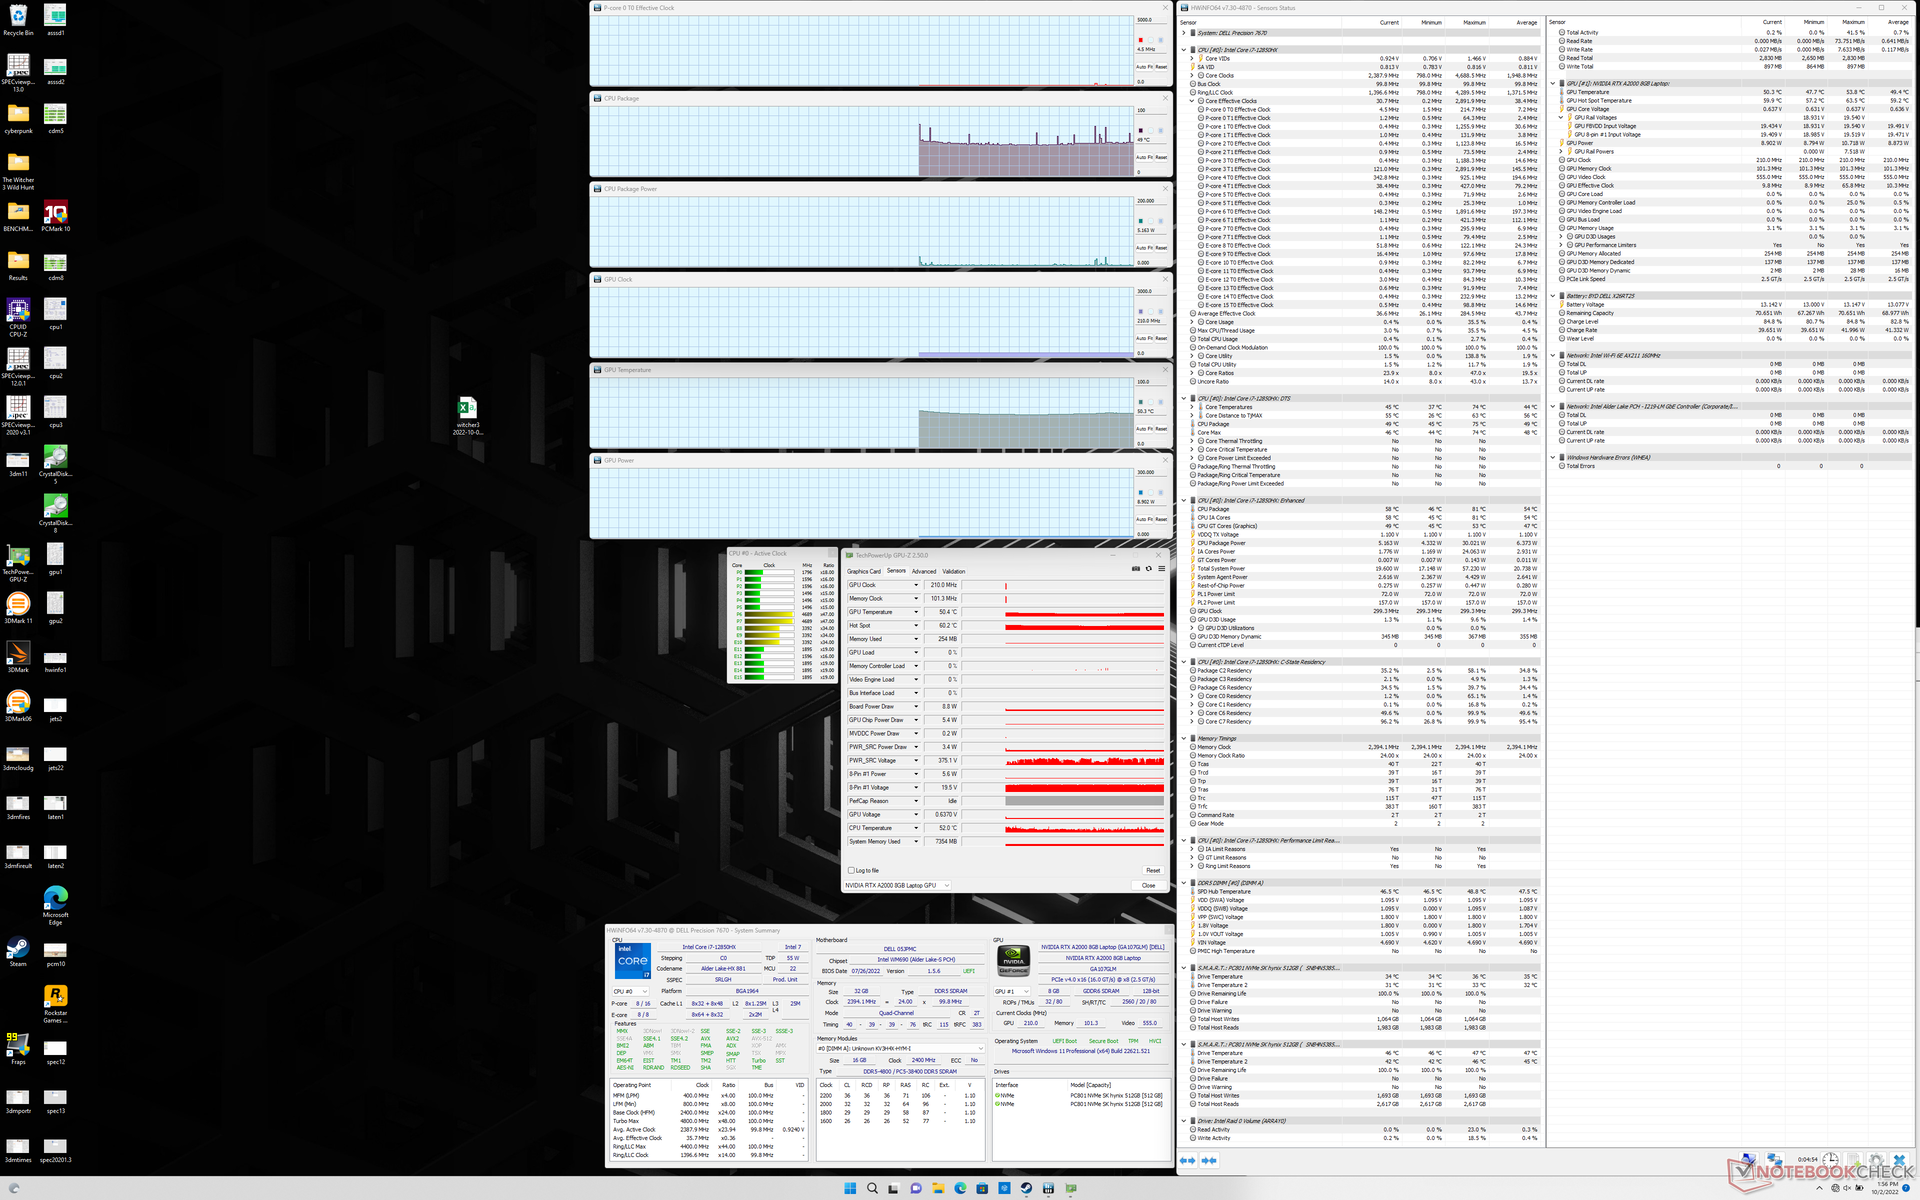
| CPU时钟(GHz) | GPU时钟(MHz) | CPU平均温度(℃) | GPU平均温度(℃) | |
| 系统空闲 | -- | -- | 49 | 50 |
| Prime95压力 | 2.2 | -- | 85 | 58 |
| Prime95 + FurMark 压力 | 0.8 - 1.3 | ~1450 | 76 - 86 | 62 - 72 |
| Witcher 3 应力 | 0.6 | 1777 | 70 | 80 |
发言人
Dell Precision 7670 audio analysis
(+) | speakers can play relatively loud (91.7 dB)
Bass 100 - 315 Hz
(-) | nearly no bass - on average 16.8% lower than median
(+) | bass is linear (6.7% delta to prev. frequency)
Mids 400 - 2000 Hz
(+) | balanced mids - only 3.5% away from median
(+) | mids are linear (3.9% delta to prev. frequency)
Highs 2 - 16 kHz
(+) | balanced highs - only 4.6% away from median
(+) | highs are linear (2% delta to prev. frequency)
Overall 100 - 16.000 Hz
(+) | overall sound is linear (12.2% difference to median)
Compared to same class
» 18% of all tested devices in this class were better, 3% similar, 79% worse
» The best had a delta of 7%, average was 17%, worst was 35%
Compared to all devices tested
» 10% of all tested devices were better, 2% similar, 88% worse
» The best had a delta of 4%, average was 23%, worst was 134%
Apple MacBook Pro 16 2021 M1 Pro audio analysis
(+) | speakers can play relatively loud (84.7 dB)
Bass 100 - 315 Hz
(+) | good bass - only 3.8% away from median
(+) | bass is linear (5.2% delta to prev. frequency)
Mids 400 - 2000 Hz
(+) | balanced mids - only 1.3% away from median
(+) | mids are linear (2.1% delta to prev. frequency)
Highs 2 - 16 kHz
(+) | balanced highs - only 1.9% away from median
(+) | highs are linear (2.7% delta to prev. frequency)
Overall 100 - 16.000 Hz
(+) | overall sound is linear (4.6% difference to median)
Compared to same class
» 0% of all tested devices in this class were better, 0% similar, 100% worse
» The best had a delta of 5%, average was 17%, worst was 45%
Compared to all devices tested
» 0% of all tested devices were better, 0% similar, 100% worse
» The best had a delta of 4%, average was 23%, worst was 134%
能源管理--要求非常高
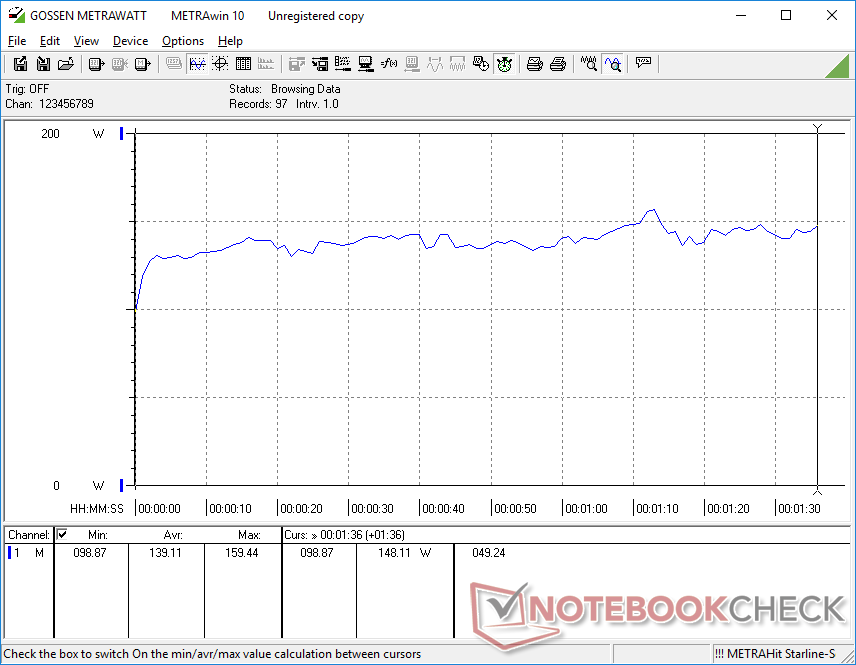
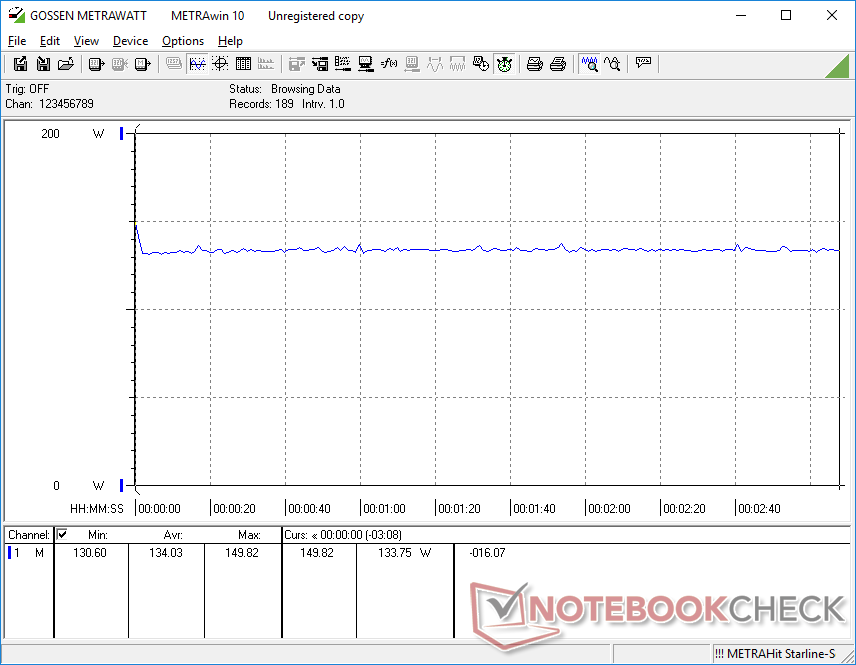
消耗功率
该系统在大多数条件下要求相当高。闲置在桌面上时,功耗在7瓦和25瓦之间,而更高的负载,如3DMark 06或 Witcher 3消耗大约140瓦。相比之下,华硕ProArt StudioBook 16或Precision 5560在类似条件下仅消耗132 W或96 W。
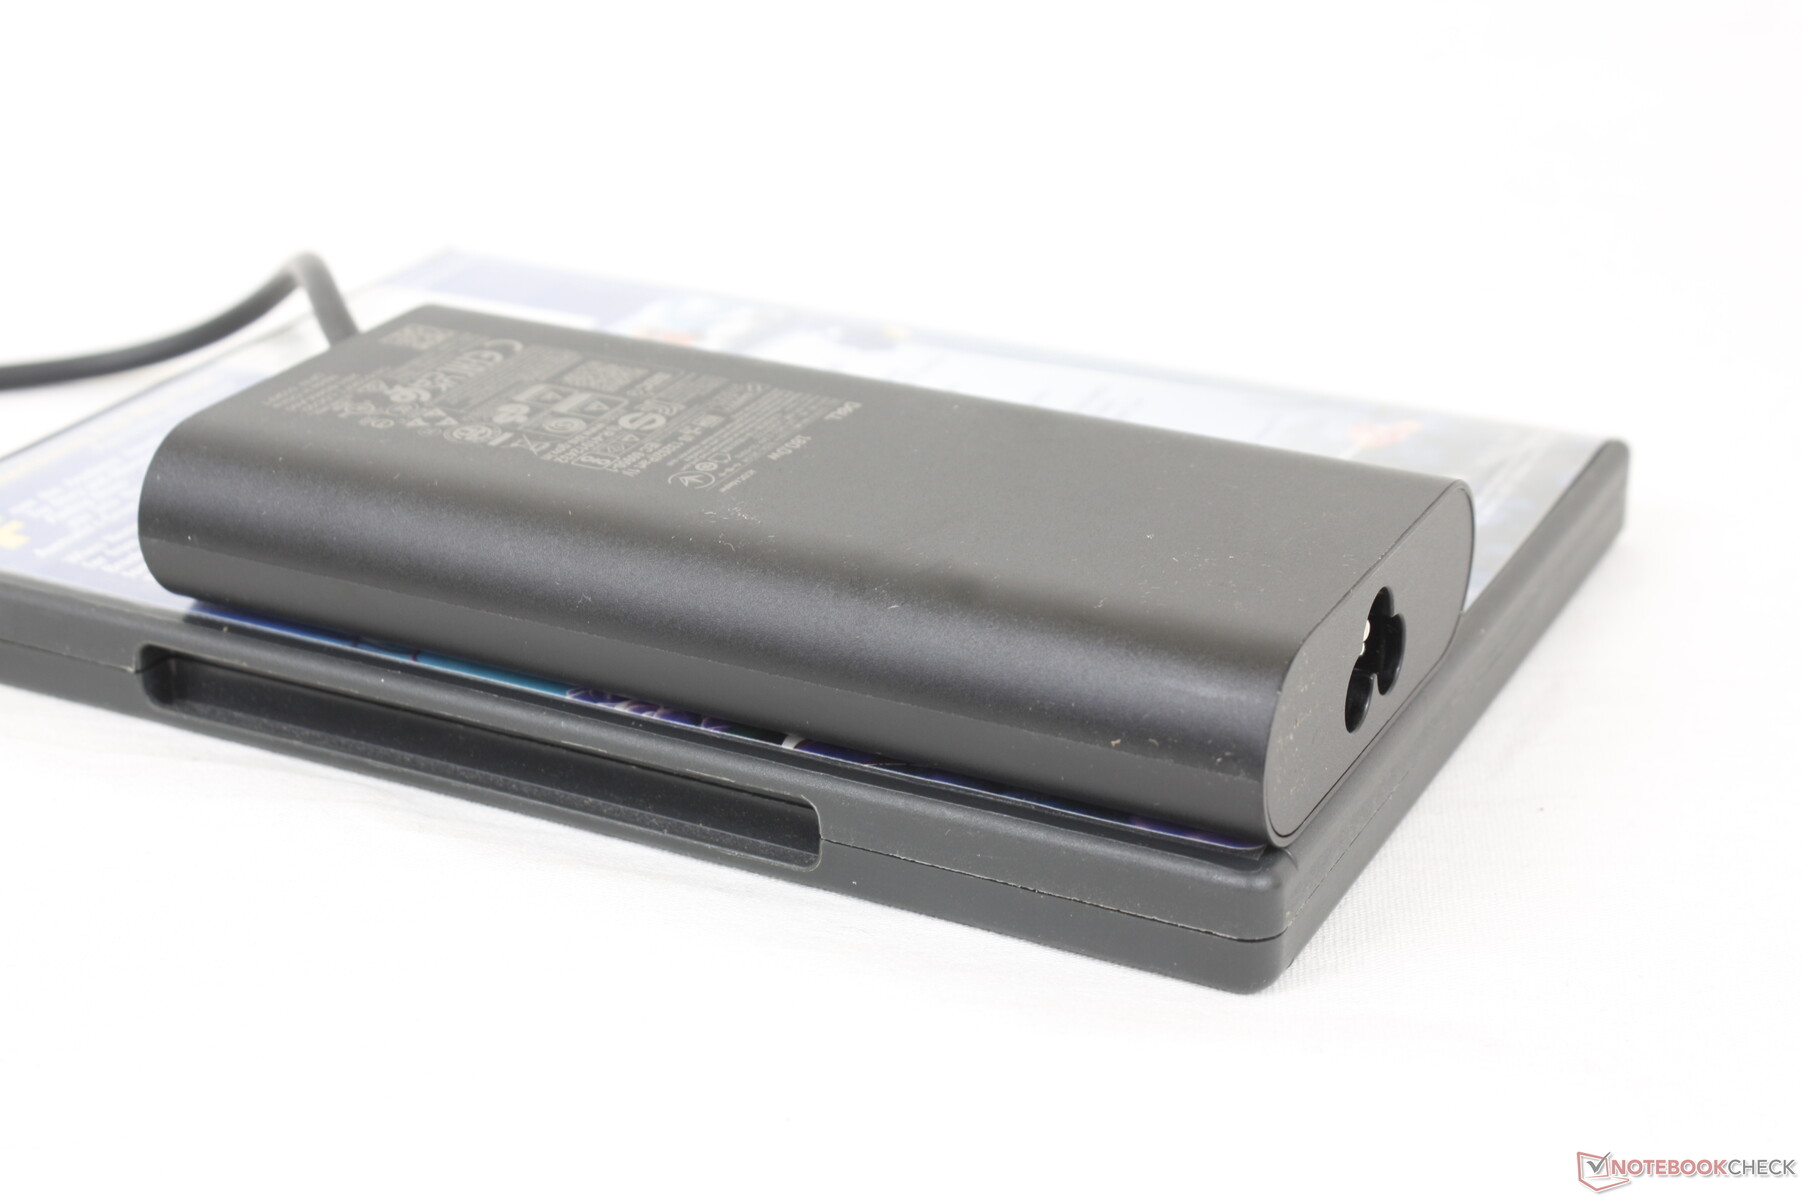
当CPU和GPU处于最大利用状态时,功耗可高达221 W,尽管中型交流适配器(约13.7 x 6.6 x 2.3厘米)的额定功率仅为180 W。这种极高的速率最多只能持续一分钟,如果CPU受到压力,就会降到114瓦,如果CPU和GPU同时受到压力,就会降到180瓦。如果在这种极端条件下,笔记本电脑的充电速度可能会因此而减慢到停滞。
如果用更快的GPU选项配置Precision 7670,戴尔提供一个能力更强的240W交流适配器。然而,根据我们对180W交流适配器的发现,也许240W的选项应该成为所有Nvidia RTX配置的标准。
| Off / Standby | |
| Idle | |
| Load |
|
Key:
min: | |
| Dell Precision 7670 i7-12850HX, RTX A2000 Laptop GPU, SK Hynix HFS001TEJ9X115N, OLED, 3840x2400, 16" | Lenovo ThinkPad P1 G4-20Y4Z9DVUS i7-11800H, T1200 Laptop GPU, Samsung PM9A1 MZVL2512HCJQ, IPS, 2560x1600, 16" | Asus ProArt StudioBook 16 W7600H5A-2BL2 W-11955M, RTX A5000 Laptop GPU, 2x Micron 2300 2TB MTFDHBA2T0TDV (RAID 0), OLED, 3840x2400, 16" | Dell Precision 5000 5560 i7-11850H, RTX A2000 Laptop GPU, Samsung PM9A1 MZVL22T0HBLB, IPS, 3840x2400, 15.6" | Dell Precision 7550 W-10885M, Quadro RTX 5000 Max-Q, SK Hynix PC601A NVMe 1TB, IPS, 3840x2160, 15.6" | HP ZBook Fury 15 G8 i9-11950H, RTX A5000 Laptop GPU, Samsung PM981a MZVLB1T0HBLR, IPS, 3840x2160, 15.6" | |
|---|---|---|---|---|---|---|
| Power Consumption | 9% | -14% | 16% | -12% | -13% | |
| Idle Minimum * (Watt) | 7.5 | 9.9 -32% | 12.4 -65% | 6.2 17% | 8.2 -9% | 8.3 -11% |
| Idle Average * (Watt) | 9.5 | 13.9 -46% | 16.5 -74% | 13.9 -46% | 16.8 -77% | 19.9 -109% |
| Idle Maximum * (Watt) | 28.4 | 14.6 49% | 25 12% | 23.8 16% | 24.4 14% | 21.8 23% |
| Load Average * (Watt) | 139.1 | 95 32% | 132 5% | 95.7 31% | 131 6% | 110.9 20% |
| Witcher 3 ultra * (Watt) | 134 | 98.9 26% | 132 1% | 87 35% | 156.6 -17% | 165 -23% |
| Load Maximum * (Watt) | 220.8 | 170.8 23% | 134 39% | 132.6 40% | 201.8 9% | 171.8 22% |
* ... smaller is better
Power Consumption Witcher 3 / Stresstest
Power Consumption external Monitor
电池寿命
WLAN的运行时间仅差6小时,要比Precision 5560或 Precision 7550.这主要是由于OLED面板在显示白色时比IPS消耗更多的能量。 在显示白色的时候比IPS消耗更多的电力.由于大多数网站都是以白色为主,所以电池寿命普遍较短并不意外。
用附带的交流适配器充电需要2个小时。该系统不能通过USB-C充电,因为它不支持PD-in。
| Dell Precision 7670 i7-12850HX, RTX A2000 Laptop GPU, 83 Wh | Lenovo ThinkPad P1 G4-20Y4Z9DVUS i7-11800H, T1200 Laptop GPU, 90 Wh | Asus ProArt StudioBook 16 W7600H5A-2BL2 W-11955M, RTX A5000 Laptop GPU, 90 Wh | Dell Precision 5000 5560 i7-11850H, RTX A2000 Laptop GPU, 86 Wh | Dell Precision 7550 W-10885M, Quadro RTX 5000 Max-Q, 95 Wh | HP ZBook Fury 15 G8 i9-11950H, RTX A5000 Laptop GPU, 94 Wh | |
|---|---|---|---|---|---|---|
| Battery runtime | 49% | -15% | 32% | 23% | 5% | |
| Reader / Idle (h) | 7.9 | 12 52% | 11.1 41% | |||
| WiFi v1.3 (h) | 5.9 | 8.8 49% | 5 -15% | 6.3 7% | 8.9 51% | 6.2 5% |
| Load (h) | 1.3 | 1.8 38% | 1 -23% | |||
| H.264 (h) | 1.8 | |||||
| Witcher 3 ultra (h) | 1.6 |
Pros
Cons
评语 - 强大而不失大度
Precision 7670直接与惠普ZBook Fury 16 G9竞争。由于我们还没有审查惠普的机型,我们只能将我们的Precision 与16英寸的联想ThinkPad P1 G4或华硕ProArt StudioBook Pro 16 W7600.戴尔的机型能够提供明显快于两者的CPU性能,同时还有更多的辅助功能,包括更容易的服务性、广域网连接和更多的存储选项。
Precision
7670在配置较高端的CPU和GPU选项时表现最好。然而,在低端选项中,你可以找到更薄、更轻的替代品,可以提供大约相同水平的性能。
重量是Precision 7670的一个关键缺点,因为该系统几乎与较大的17.3英寸Precision 7550一样重。此外,尽管重量很重,但酷睿i7-12850HX不能长时间维持Turbo Boost时钟速率,这一点有点令人失望。它仍然很快,但这里的覆盖式冷却方案限制了它的潜力。缺乏任何至强CPU选项使Precision 7670感觉更像一台工作室类型的笔记本电脑,而不是它所推销的成熟的工作站。
Precision 7670对于那些可以从拥有所有这些耗电的第12代英特尔核心和高端RTX A5500 GPU中受益的电力用户来说仍然是很好的。然而,对于低端配置来说,像前面提到的联想或华硕这样更薄、更轻的16英寸机型仍然可以成为不错的替代品。
价格和可用性
Precision 7670目前在Newegg上有售。 只有一个配置。我们建议直接从戴尔订购https://www.dell.com/en-us/shop/cty/pdp/spd/precision-16-7670-laptop/xctop7670usvp?configurationid=6fd7195d-151f-45a0-9e22-2b9e7769be75#features_section以获得更多的配置选择和保修选项。
Dell Precision 7670
- 10/06/2022 v7 (old)
Allen Ngo
Price comparison

