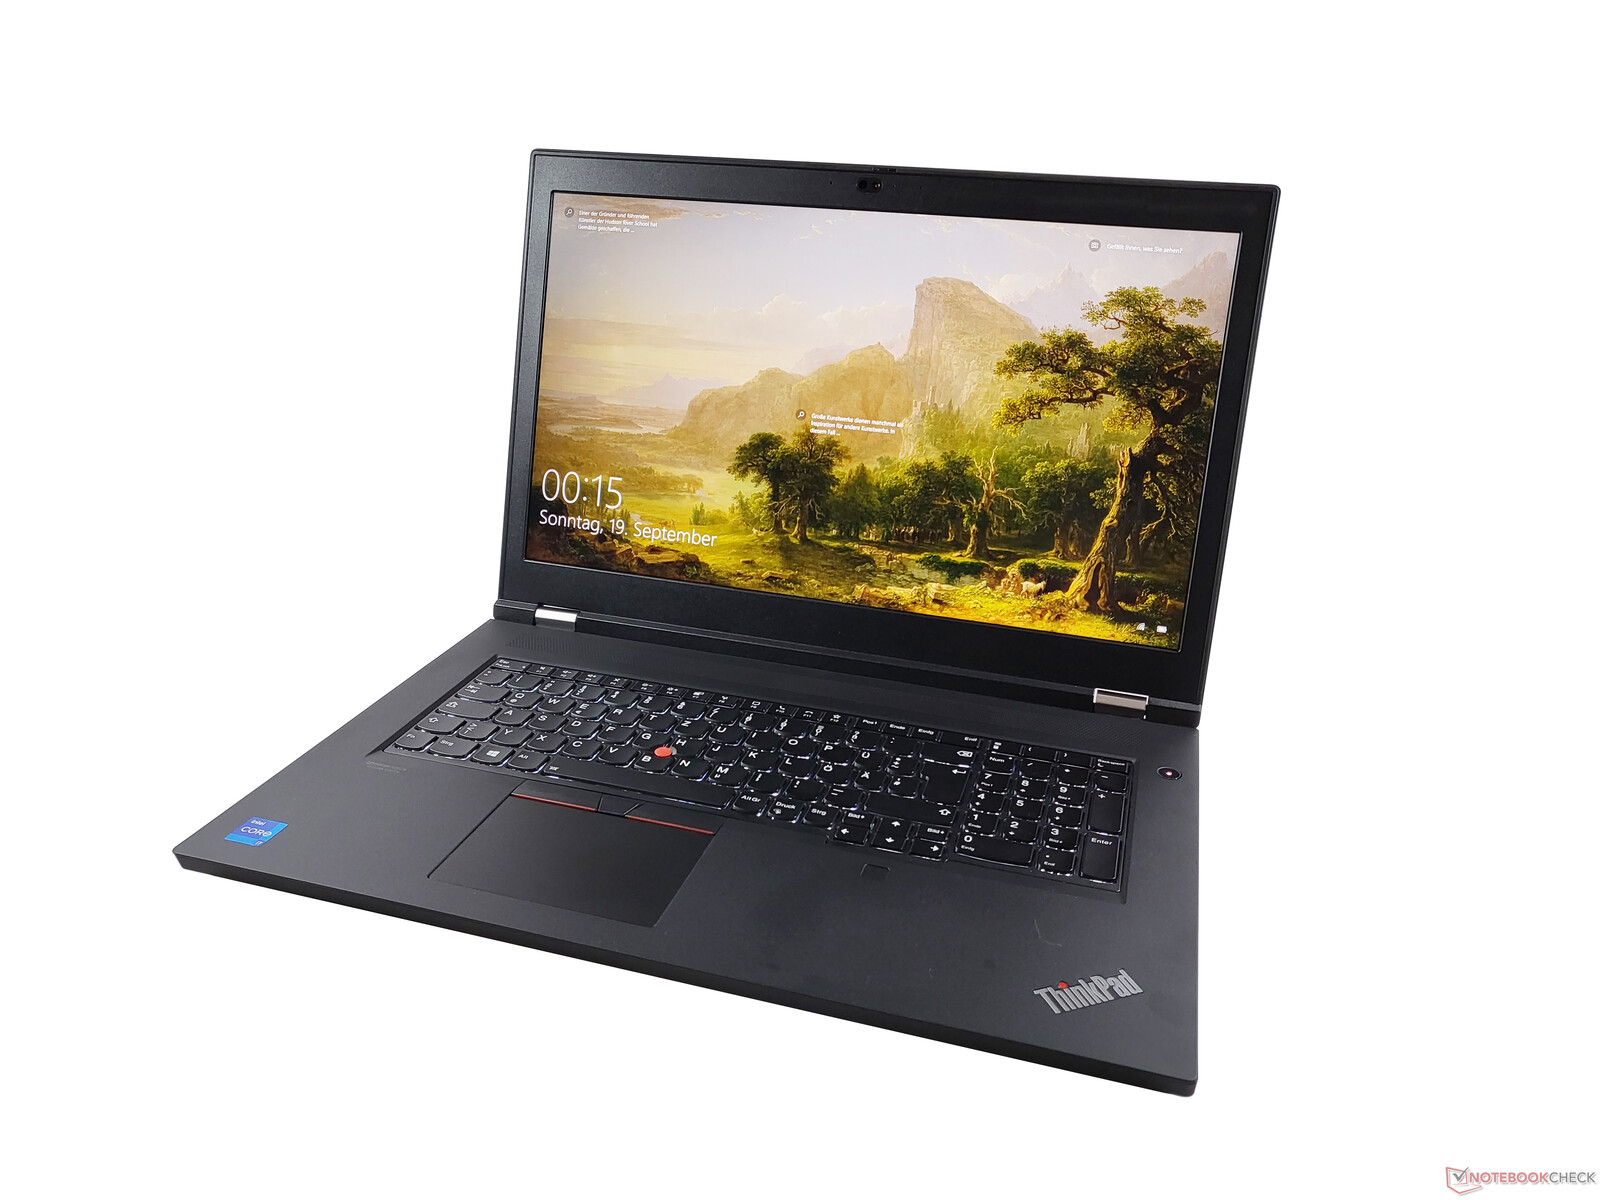
联想ThinkPad P17 G2笔记本电脑评论。具有内部升级功能的大型工作站
17英寸的外形因素远远不是最受欢迎的选择,特别是当涉及到企业客户的商务笔记本电脑时。后一类的系统必须是小而轻的,以便有更大的便携性。尽管联想ThinkPad P17 G2也很便携,但这款移动工作站的大重量和大尺寸使其更适合固定使用。它是唯一提供的17英寸ThinkPad,其主要使用情况是为CAD和其他计算密集型任务提供足够的性能。
Potential competitors in comparison
Rating | Date | Model | Weight | Height | Size | Resolution | Price |
|---|---|---|---|---|---|---|---|
| 87.8 % v7 (old) | 10 / 2021 | Lenovo ThinkPad P17 G2-20YU0025G i7-11800H, RTX A2000 Laptop GPU | 3.6 kg | 28.38 mm | 17.30" | 1920x1080 | |
| 86.6 % v7 (old) | Lenovo ThinkPad P73-20QR002DGE i7-9850H, Quadro RTX 3000 (Laptop) | 3.5 kg | 31 mm | 17.30" | 1920x1080 | ||
| 89.8 % v7 (old) | 09 / 2021 | HP ZBook Fury 17 G7 119W5EA i9-10885H, Quadro RTX 4000 Max-Q | 2.9 kg | 26.9 mm | 17.30" | 3840x2160 | |
| 87 % v7 (old) | 02 / 2021 | Dell Precision 5000 5750 P92F W-10885M, Quadro RTX 3000 Max-Q | 2.5 kg | 19.5 mm | 17.00" | 3840x2400 | |
| 86.4 % v7 (old) | 03 / 2020 | Asus ProArt StudioBook Pro 17 W700G3T i7-9750H, Quadro RTX 3000 Max-Q | 2.5 kg | 18.4 mm | 17.00" | 1920x1200 |
ThinkPad机箱。塑料外观,镁质底架
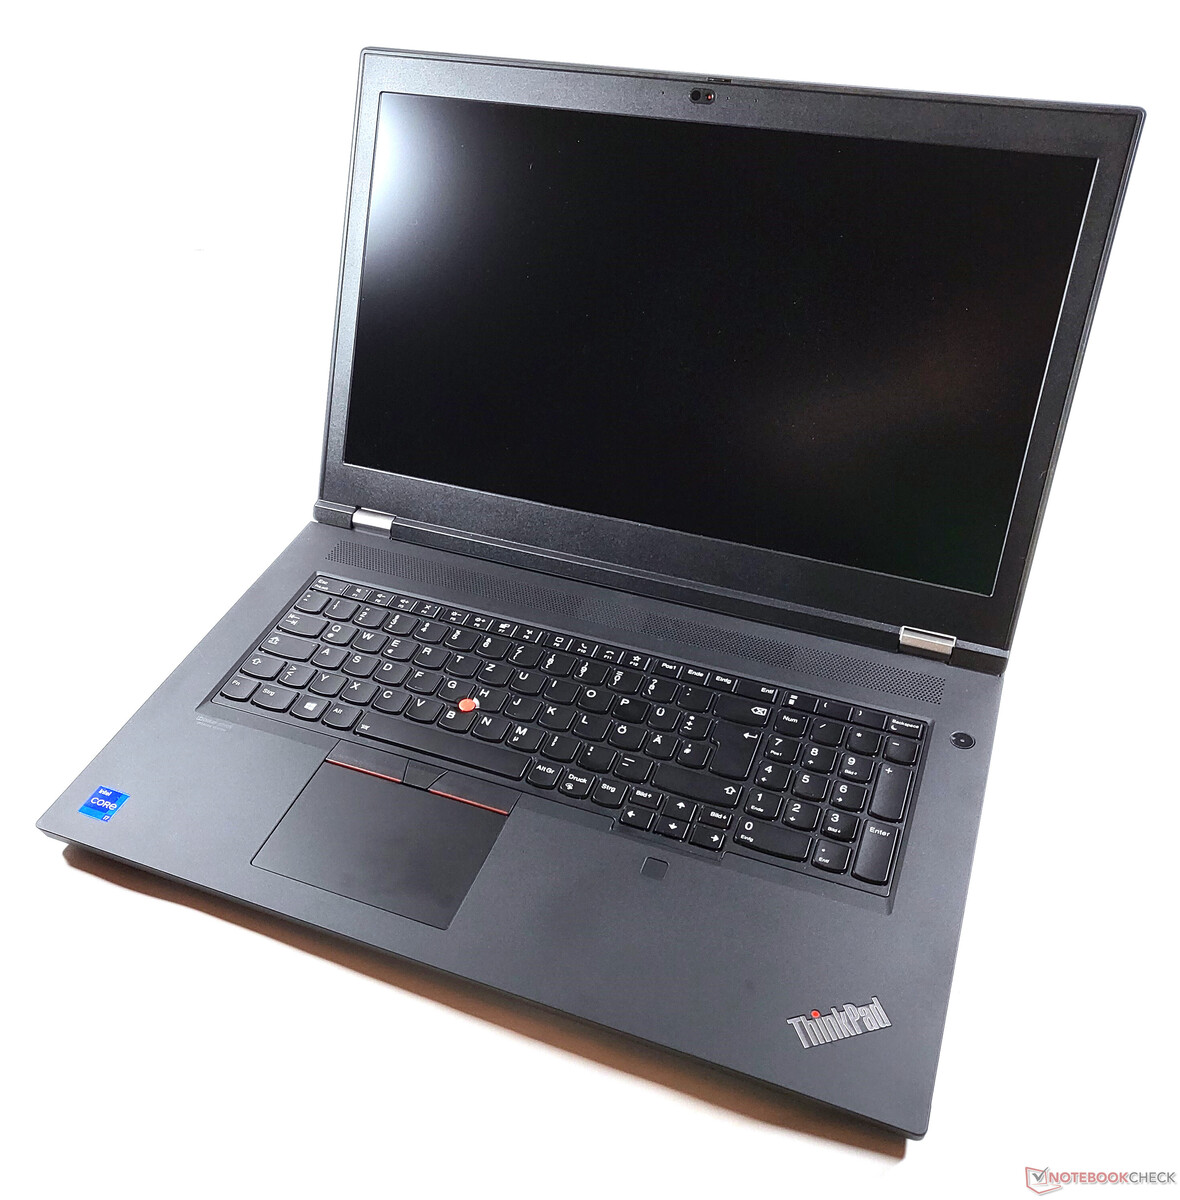
虽然联想去年已经更新了其最大的工作站,但去年的变化只集中在硬件上。事实上,自从ThinkPad P70上市以来,在设计方面几乎没有任何变化。 ThinkPad P70以来,在设计方面几乎没有任何变化。虽然相比于联想ThinkPad P73,一些小的细节发生了变化,但没有任何重大修订。
这一次,前几代产品中巨大的镁/铝底盖被纤维增强塑料外壳所取代。内部的、传统的ThinkPad结构框架由镁合金组成。因此,底座单元的刚度相当高。塑料上涂有天鹅绒质地的涂层,使其成为污点和指纹磁铁。显示屏盖的刚性令人惊讶,当试图从角落里扭转它时,几乎没有弯曲,在压力下几乎没有任何屈服。不幸的是,掌托的情况并非如此,它在靠近智能卡读卡器的地方很容易弯曲,而且不能顺利过渡到机箱前缘的底座上。
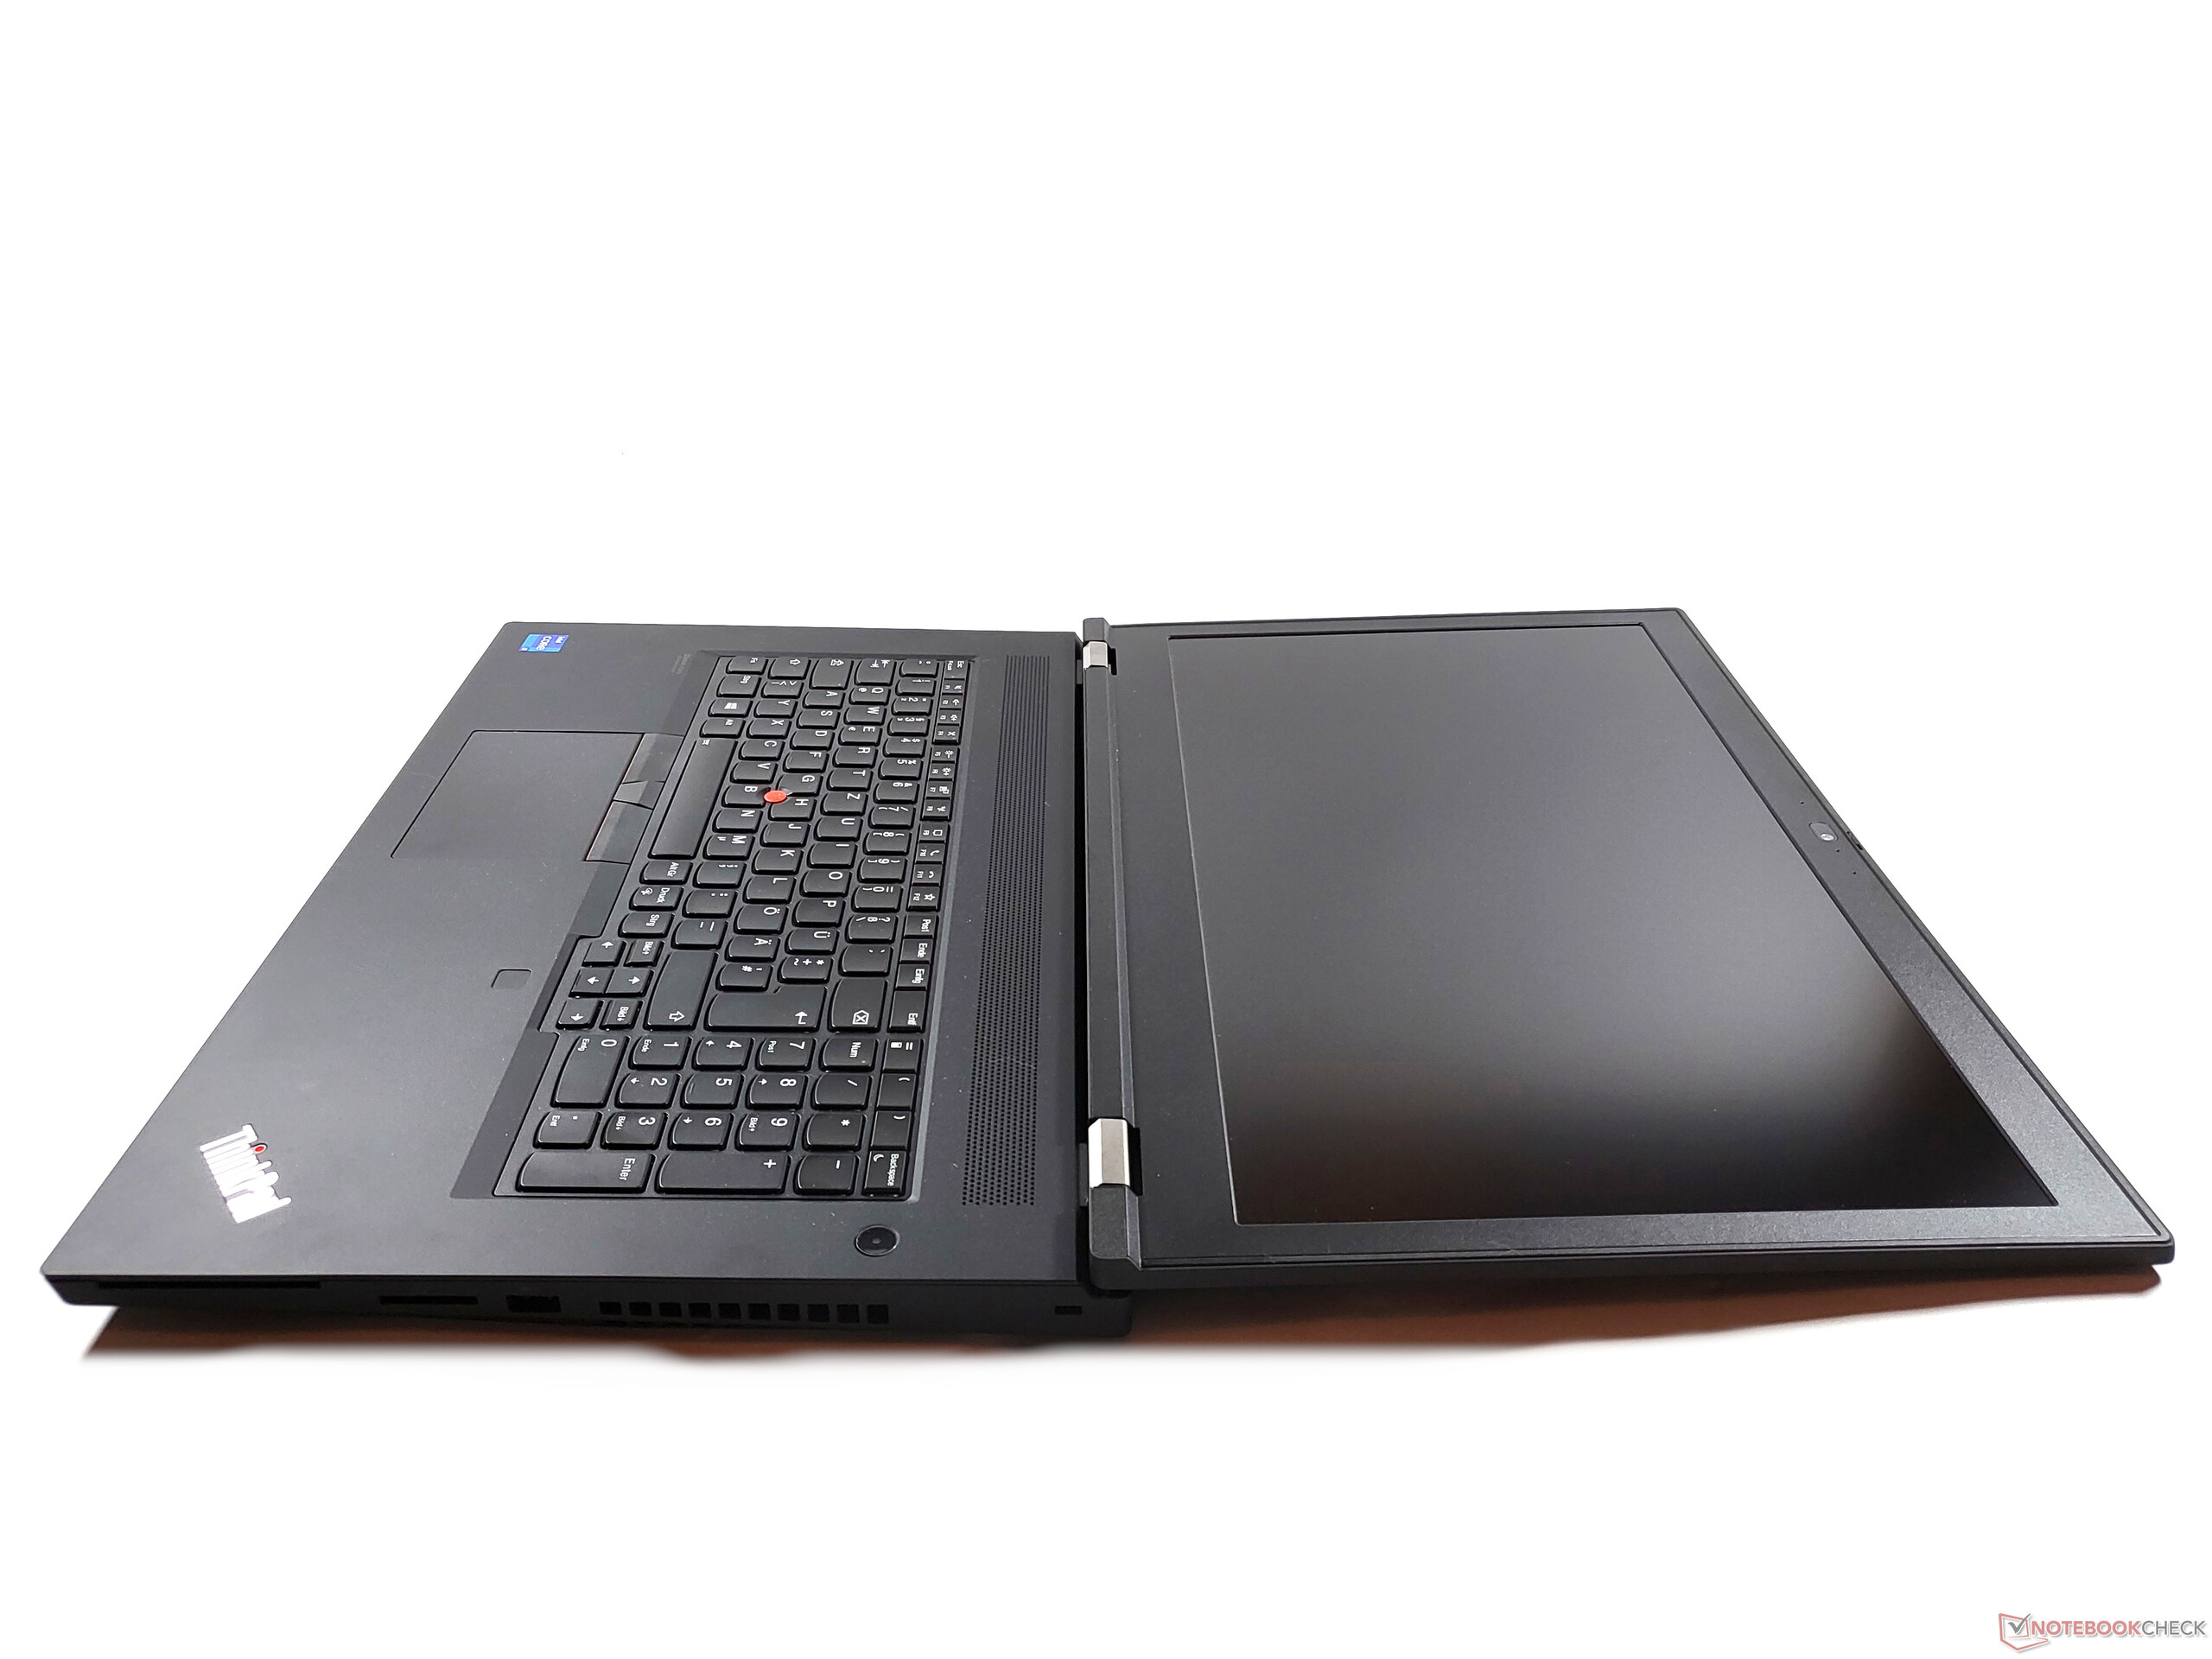
底座内的两个银色金属铰链足够牢固,可以将显示屏固定在原位,同时仍允许用户用一只手打开笔记本电脑。显示器的最大角度大于180度。
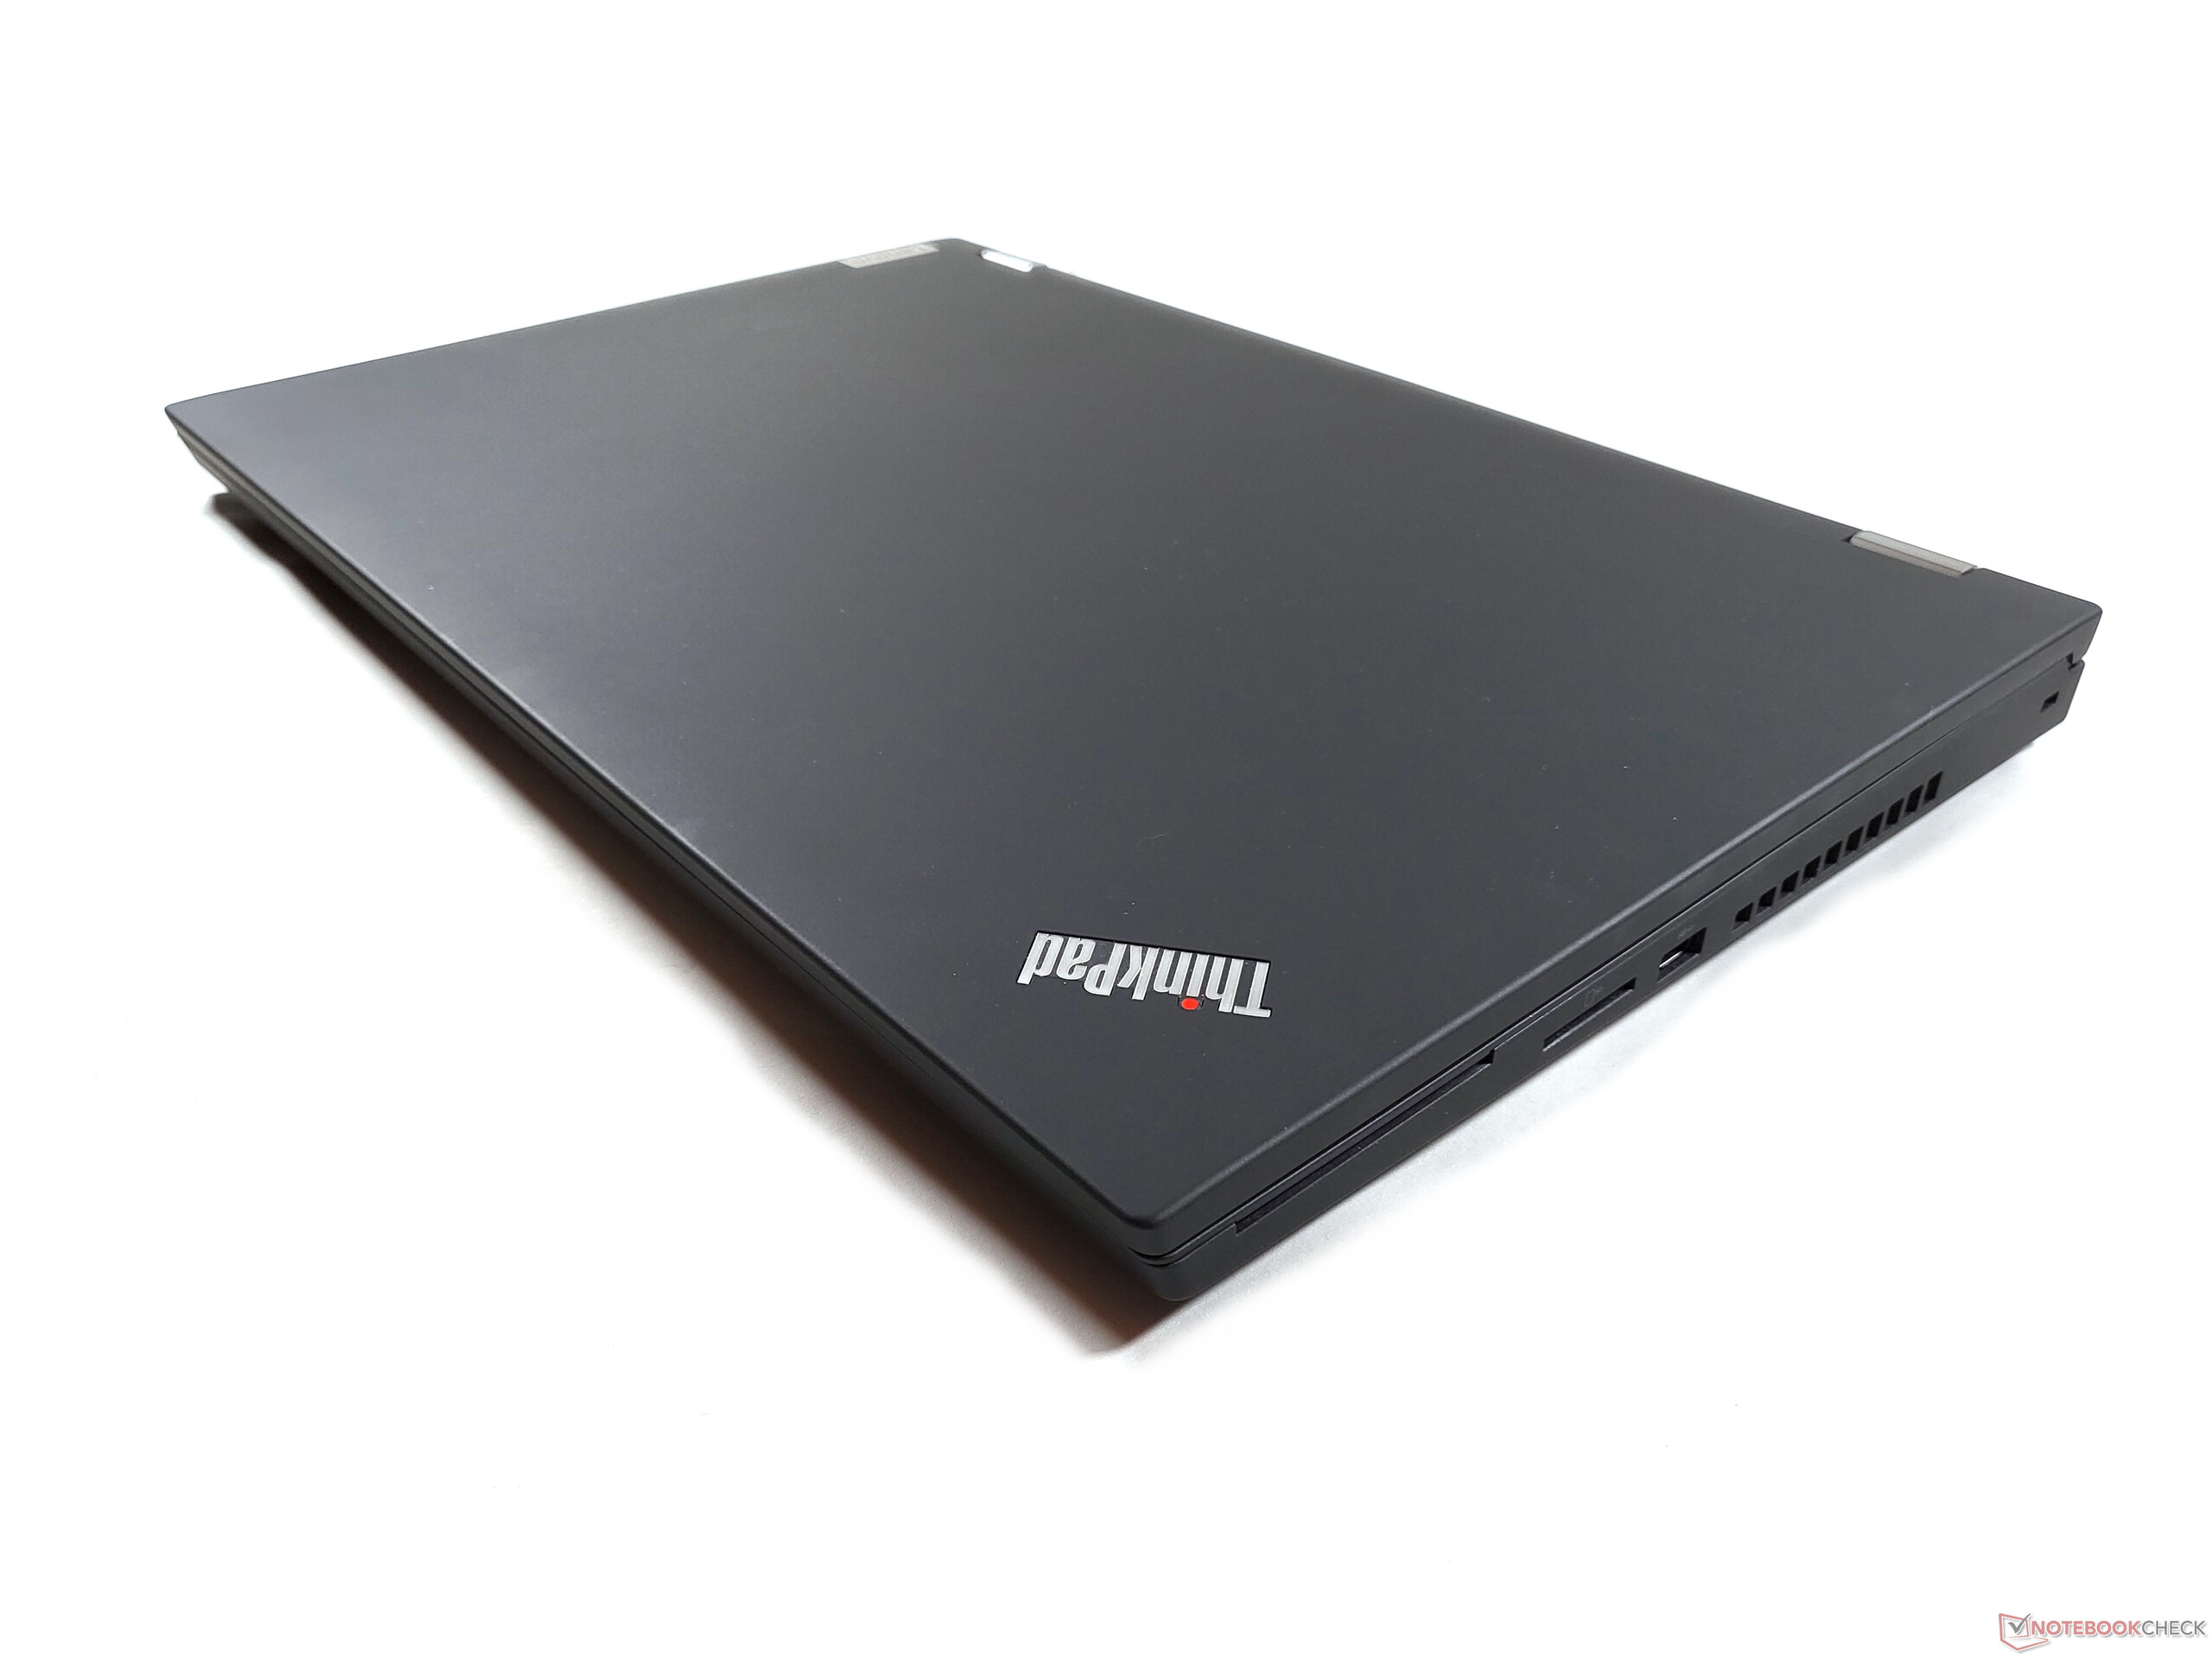
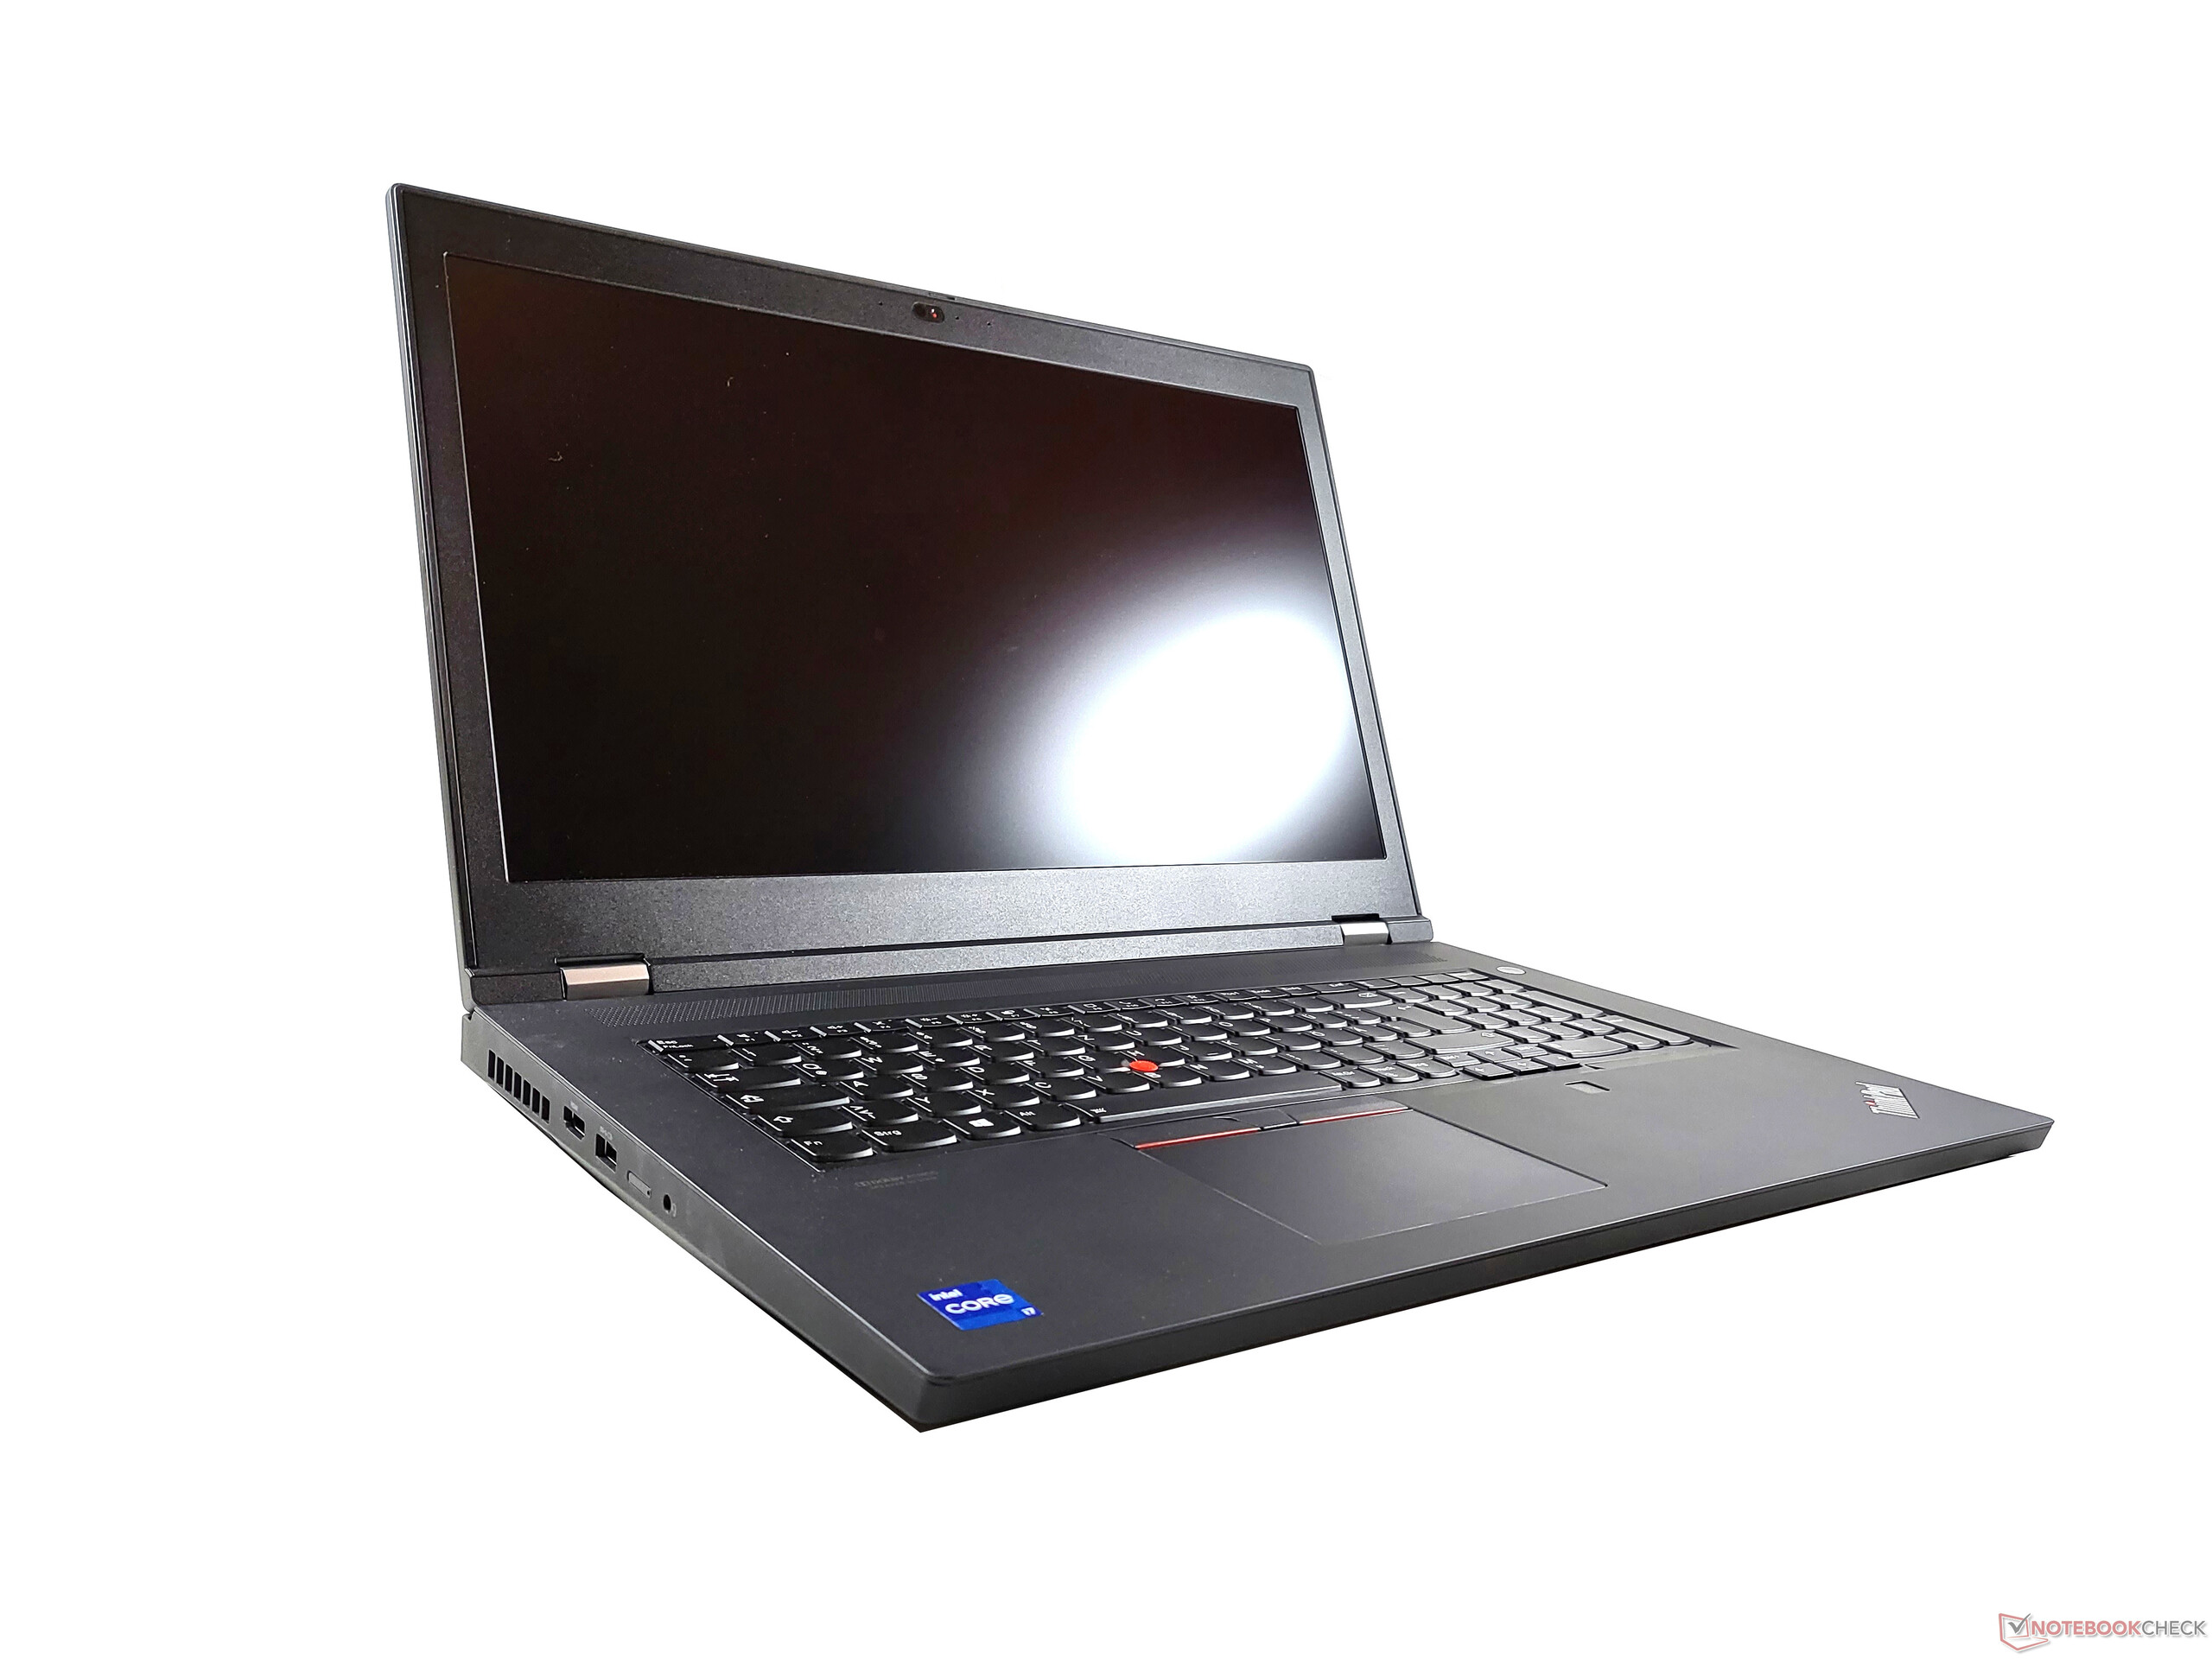
虽然我们会用 "传统 "这个相当正面的词来描述其构造,但显示屏边框的大小和机箱本身根本就已经过时了。除了去年的 ThinkPad P73我们的比较中没有其他17英寸工作站超过ThinkPad P17第二代的巨大尺寸,其中包括厚度和重量。 因此,旅行时使用这款联想笔记本电脑可能是个例外。
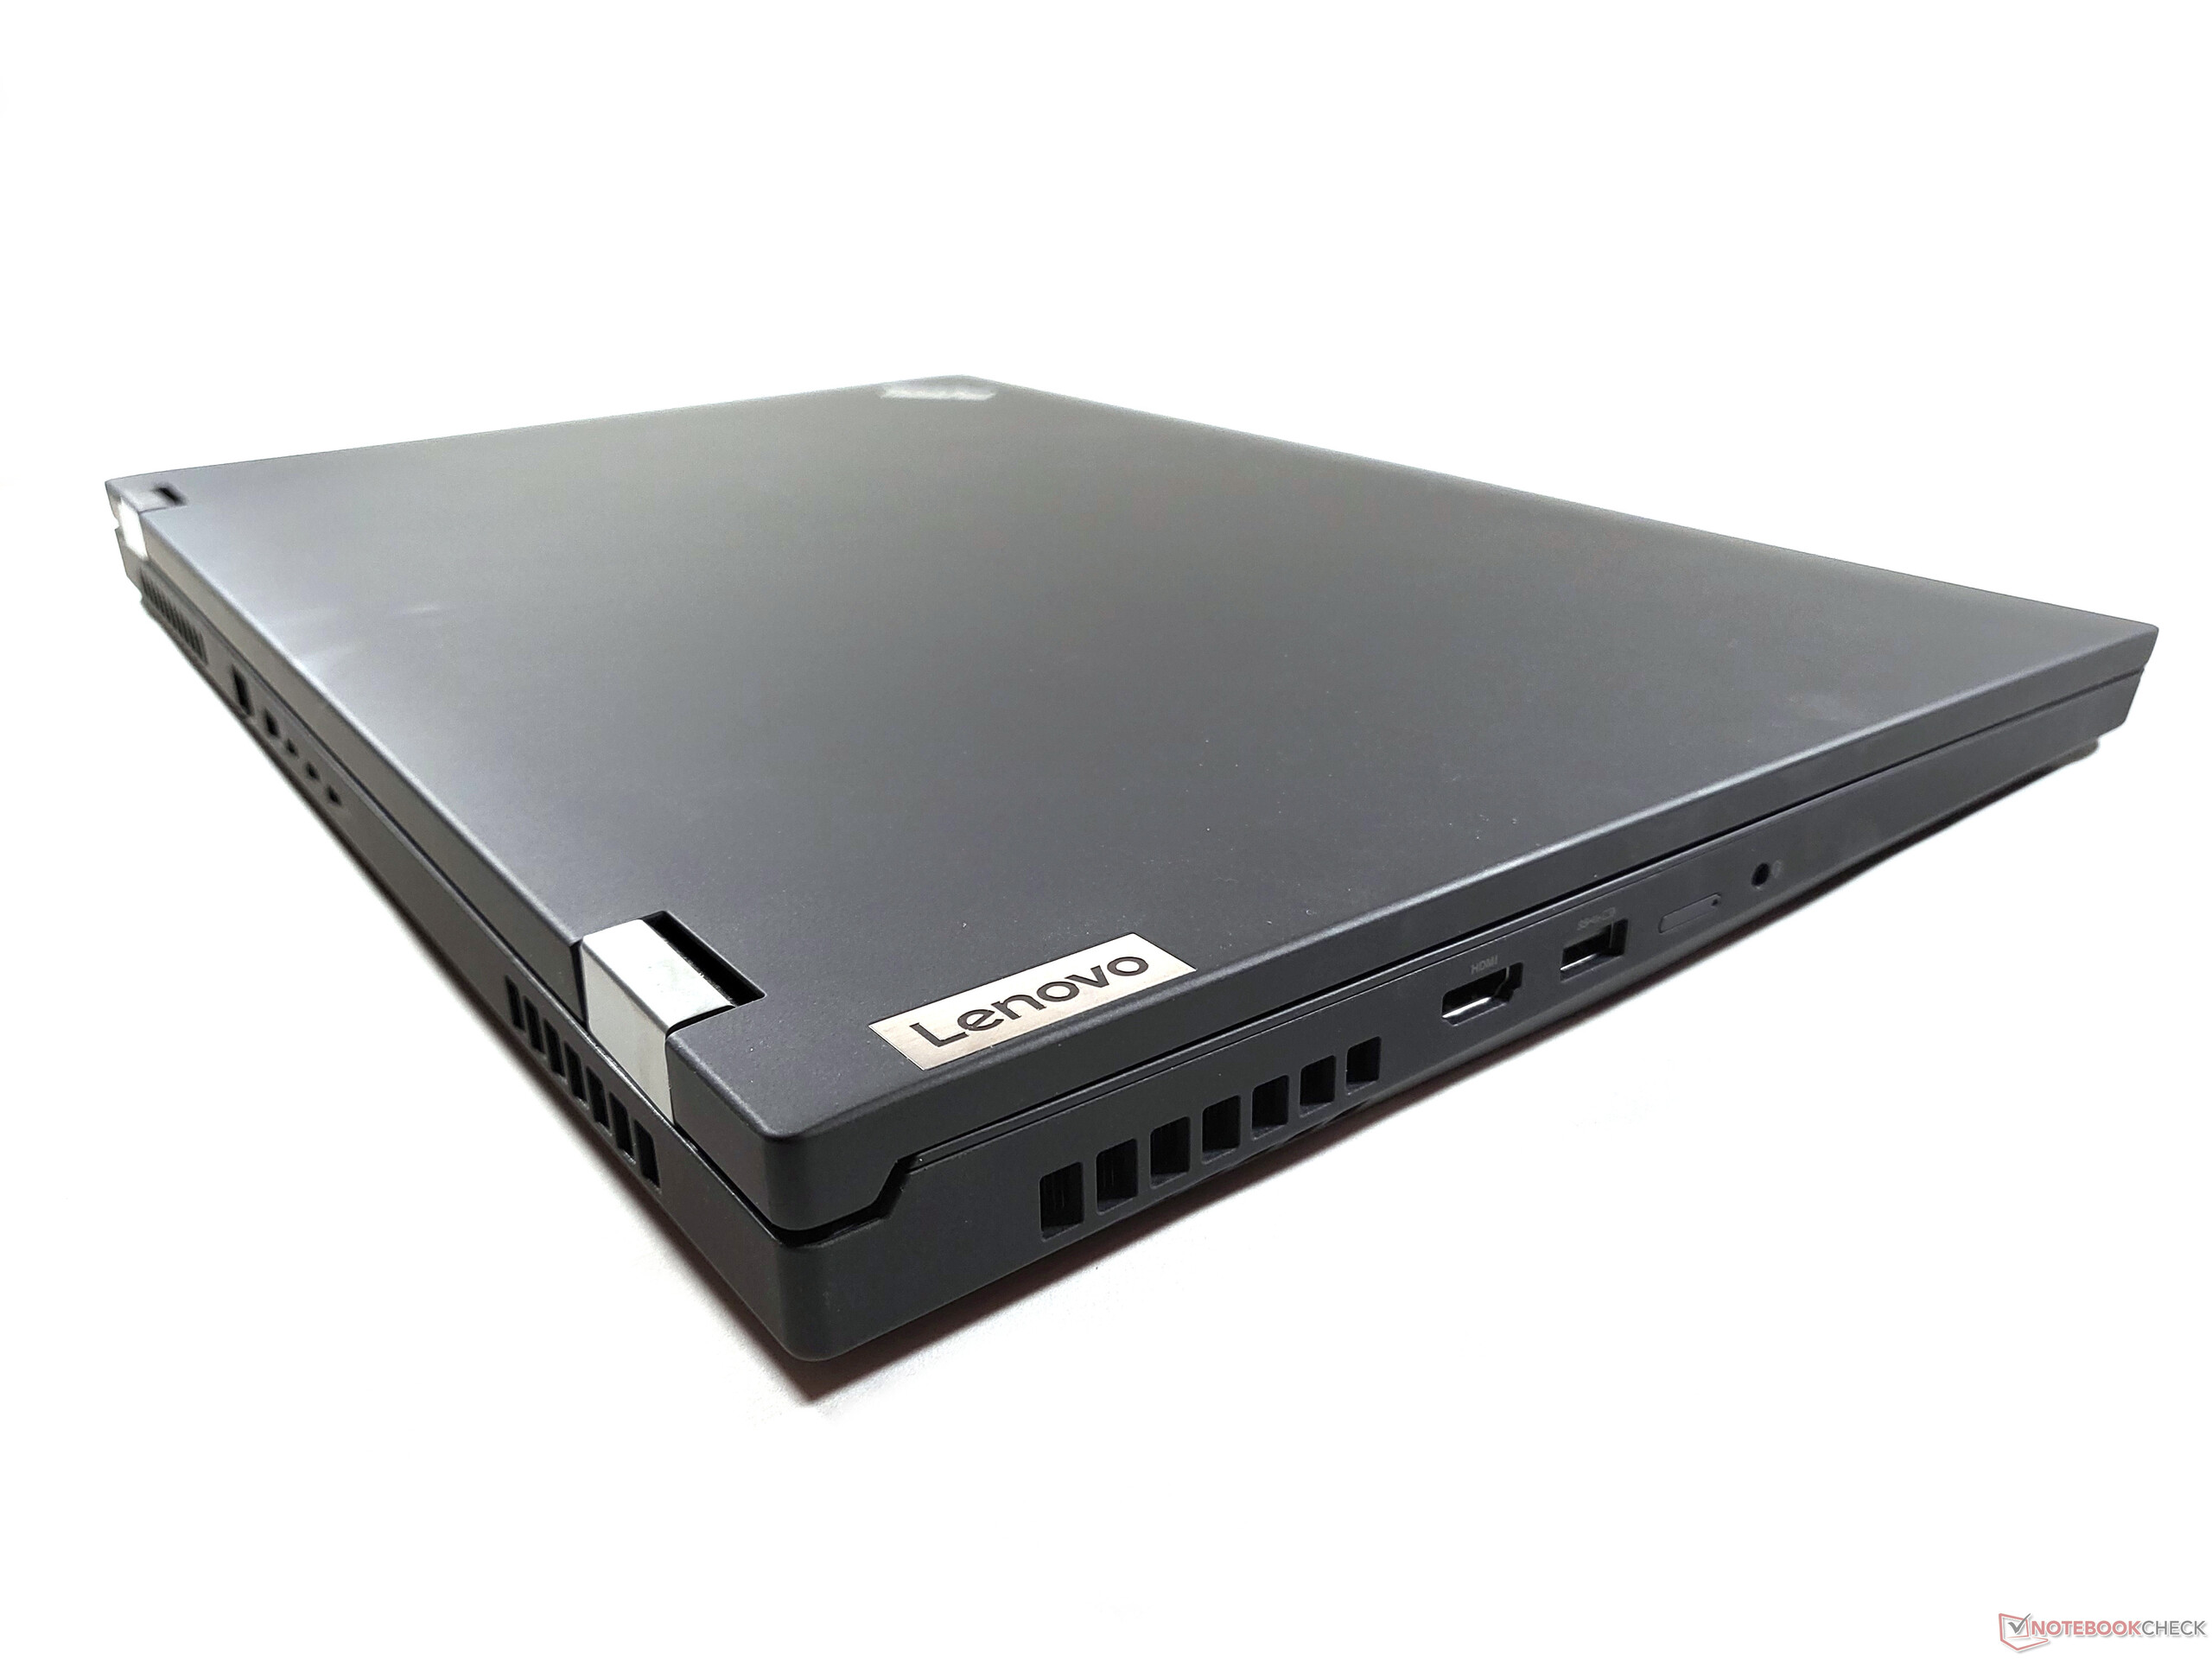
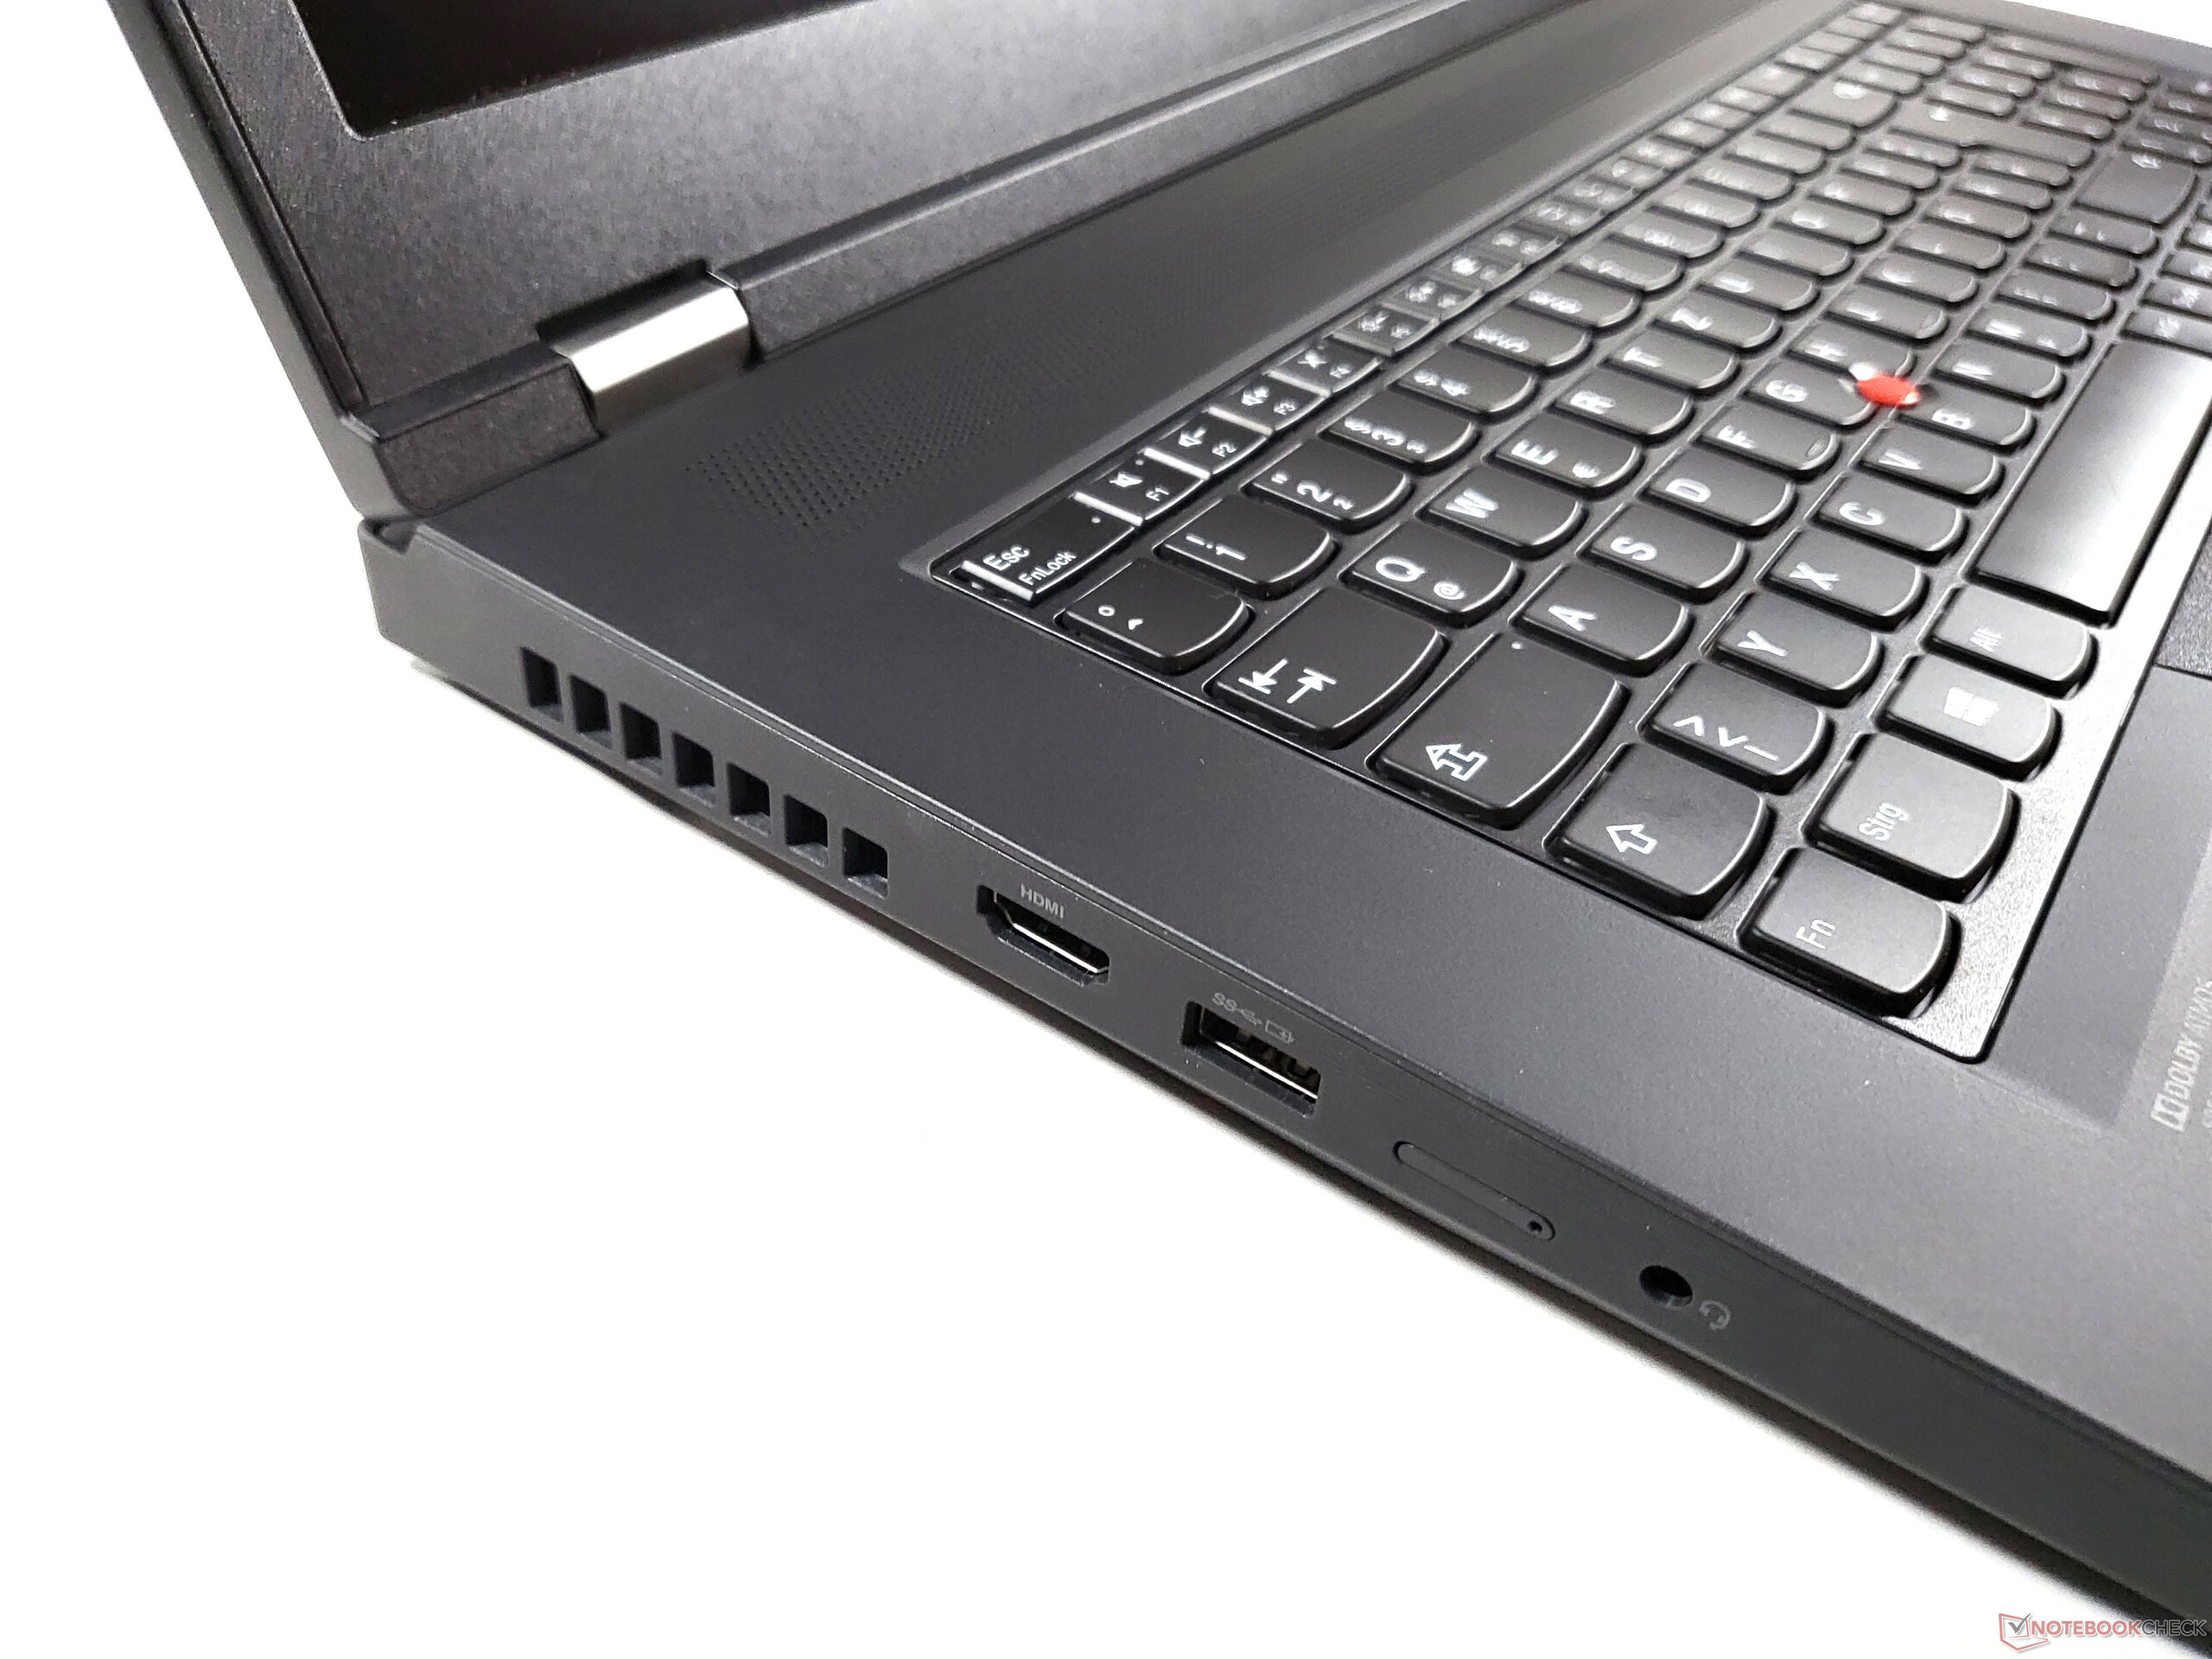
连接性。联想笔记本电脑有很多端口
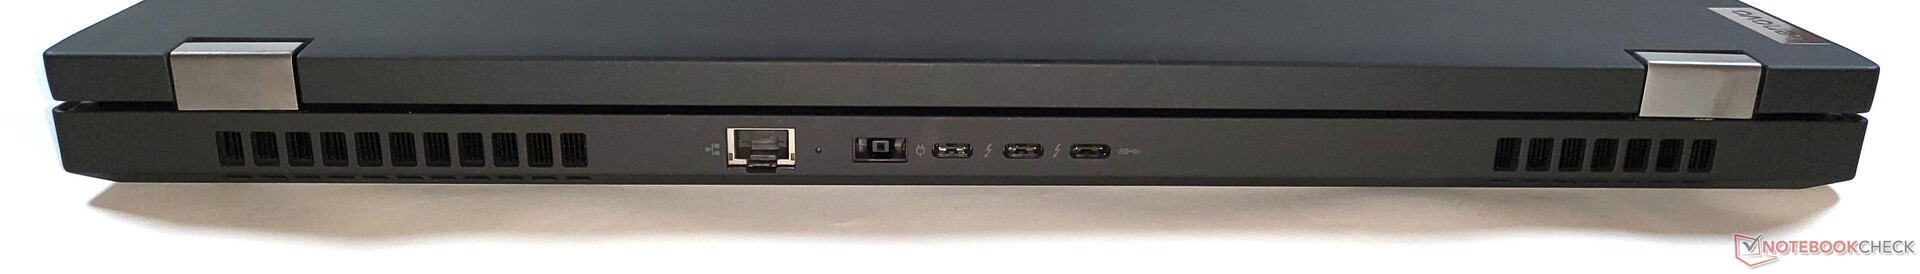
宽敞的外壳使联想能够包括众多的端口。也就是说,与ThinkPad P73相比,端口的选择略差,因为ThinkPad P17 G2少提供了一个USB-A端口。应该注意的是,这是第一款支持Thunderbolt 4的P系列笔记本电脑。
与所有P系列的ThinkPad工作站一样,ThinkPad P17 Gen 2通过专有的超薄尖端端口进行充电。虽然据称也支持USB-C电源传输,但它没有识别65W的USB-C充电器。不过,与较小的ThinkPad P1 G4一样,90W的USB-C充电器应该可以使用。
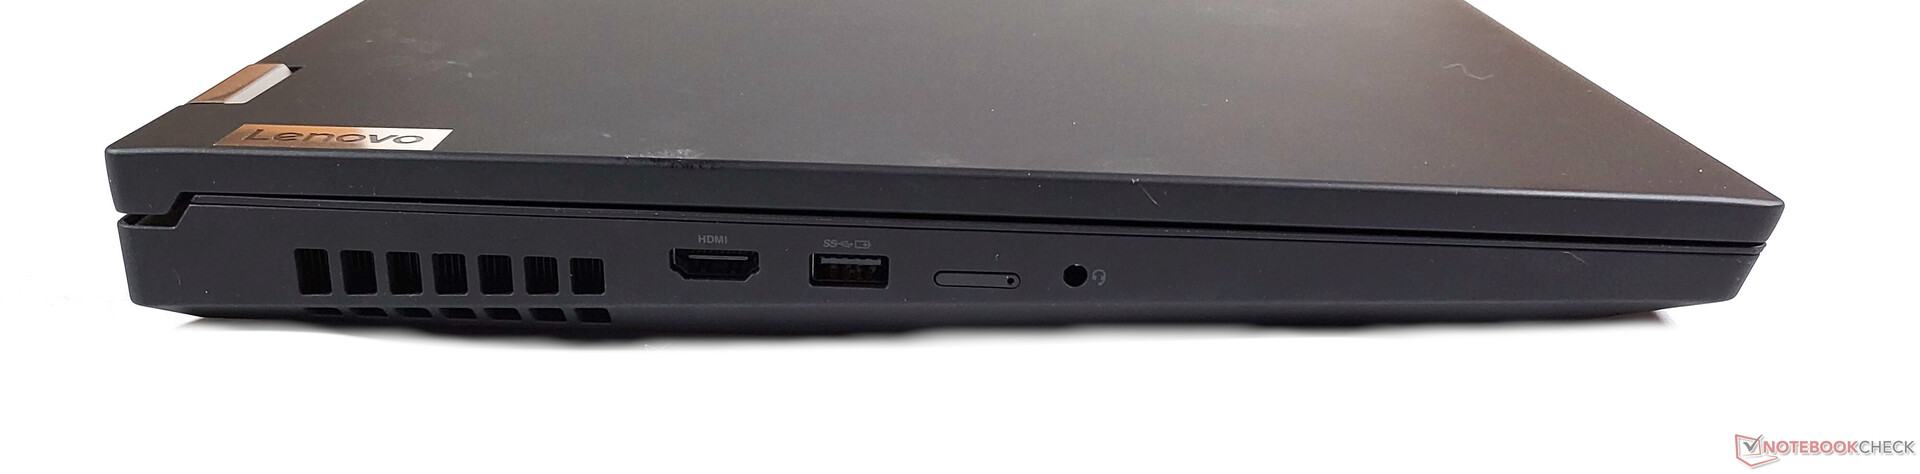
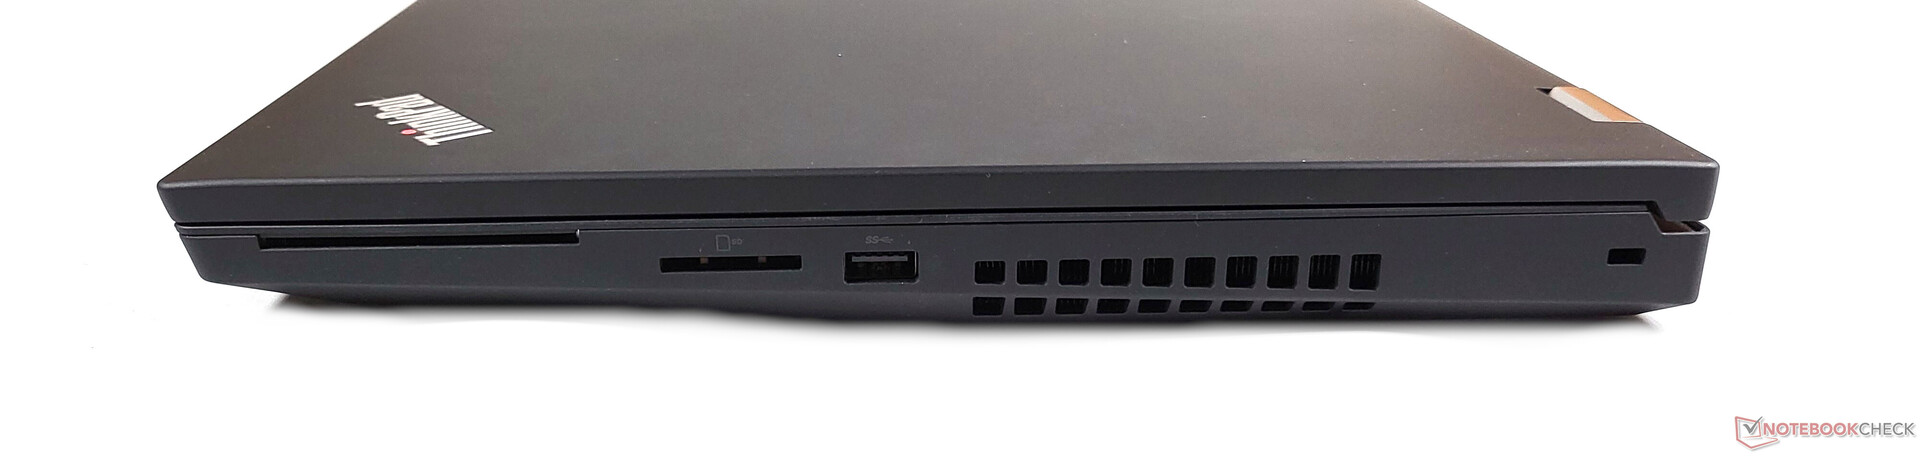
SD卡阅读器
用我们的128GB AV Pro microSD V60参考卡进行的基准测试显示了集成读卡器的快速速度。其性能与其他工作站笔记本电脑相当。当完全插入时,SD卡与边缘平齐。
| SD Card Reader | |
| average JPG Copy Test (av. of 3 runs) | |
| Lenovo ThinkPad P17 G2-20YU0025G (Toshiba Exceria Pro SDXC 64 GB UHS-II) | |
| Lenovo ThinkPad P73-20QR002DGE (Toshiba Exceria Pro SDXC 64 GB UHS-II) | |
| Asus ProArt StudioBook Pro 17 W700G3T (Toshiba Exceria Pro SDXC 64 GB UHS-II) | |
| HP ZBook Fury 17 G7 119W5EA (AV Pro 60) | |
| Dell Precision 5000 5750 P92F (Toshiba Exceria Pro SDXC 64 GB UHS-II) | |
| Average of class Workstation (49.6 - 681, n=14, last 2 years) | |
| maximum AS SSD Seq Read Test (1GB) | |
| Asus ProArt StudioBook Pro 17 W700G3T (Toshiba Exceria Pro SDXC 64 GB UHS-II) | |
| Average of class Workstation (87.6 - 1455, n=14, last 2 years) | |
| Lenovo ThinkPad P73-20QR002DGE (Toshiba Exceria Pro SDXC 64 GB UHS-II) | |
| Lenovo ThinkPad P17 G2-20YU0025G (Toshiba Exceria Pro SDXC 64 GB UHS-II) | |
| Dell Precision 5000 5750 P92F (Toshiba Exceria Pro SDXC 64 GB UHS-II) | |
| HP ZBook Fury 17 G7 119W5EA (AV Pro 60) | |
沟通
除了前面提到的RJ45以太网连接外,联想ThinkPad P17 G2当然也配备了Wi-Fi支持。通过全新的Wi-Fi 6E模块AX210,制造商在这里也依靠英特尔。稍微令人失望的是。虽然接收数据时的传输速度还不错,但传输速度却没有达到我们的预期。
我们的测试设备包括联想ThinkPad P17第二代可选的WWAN/LTE模块的必要内部设备。
| Networking | |
| iperf3 transmit AX12 | |
| Asus ProArt StudioBook Pro 17 W700G3T | |
| HP ZBook Fury 17 G7 119W5EA | |
| Average Intel Wi-Fi 6E AX210 (675 - 1602, n=27) | |
| Dell Precision 5000 5750 P92F | |
| Lenovo ThinkPad P17 G2-20YU0025G | |
| Lenovo ThinkPad P73-20QR002DGE | |
| iperf3 receive AX12 | |
| Asus ProArt StudioBook Pro 17 W700G3T | |
| HP ZBook Fury 17 G7 119W5EA | |
| Lenovo ThinkPad P17 G2-20YU0025G | |
| Average Intel Wi-Fi 6E AX210 (914 - 1716, n=27) | |
| Dell Precision 5000 5750 P92F | |
| Lenovo ThinkPad P73-20QR002DGE | |
网络摄像头
联想终于开始在特定的ThinkPad型号中加入1080p网络摄像头。不幸的是,ThinkPad P17 G2并没有入选。因此,集成的720p在质量方面没有提供什么,只够用于视频通话。


安全问题
无论你需要哪种安全功能,联想P17 G2都很有可能支持它。智能卡读卡器、指纹传感器和红外摄像头保证了认证的安全性。同时,有一个 "ThinkShutter "网络摄像头快门,可以更好地保护隐私,还有一个Kensington锁可以防止被盗。如果ThinkPad丢失,可以在BIOS的computrace功能帮助下找到它。
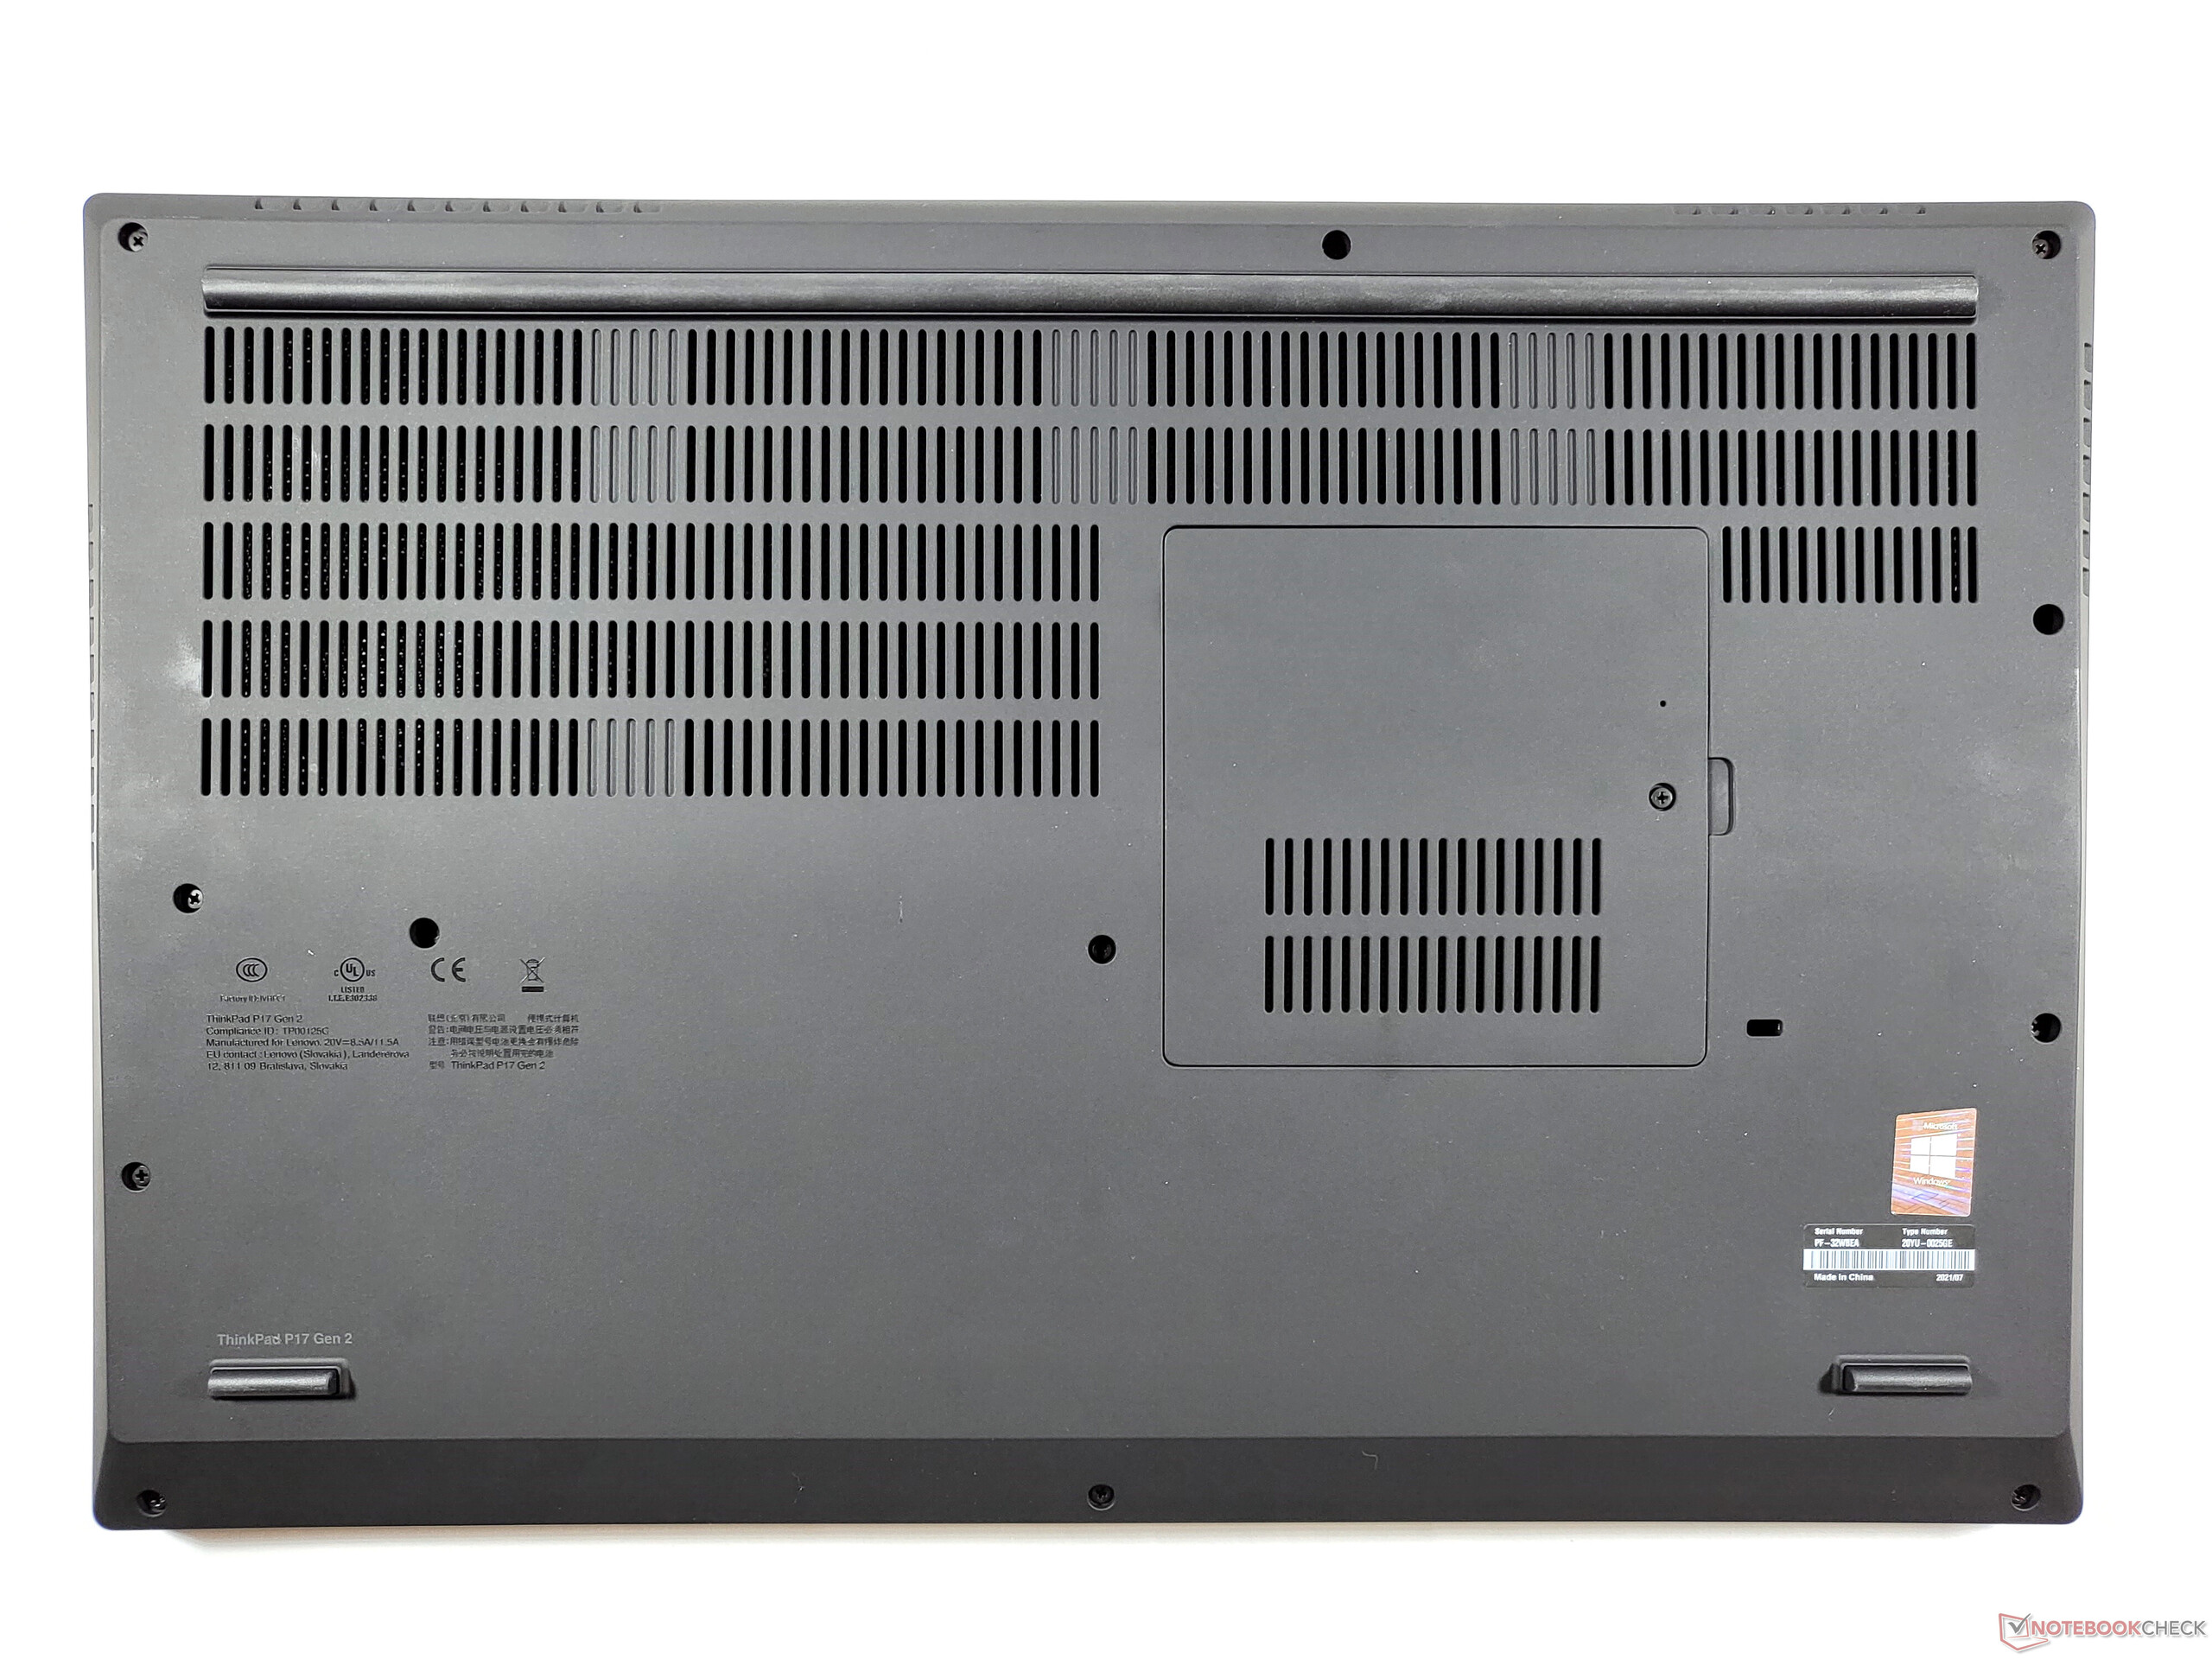
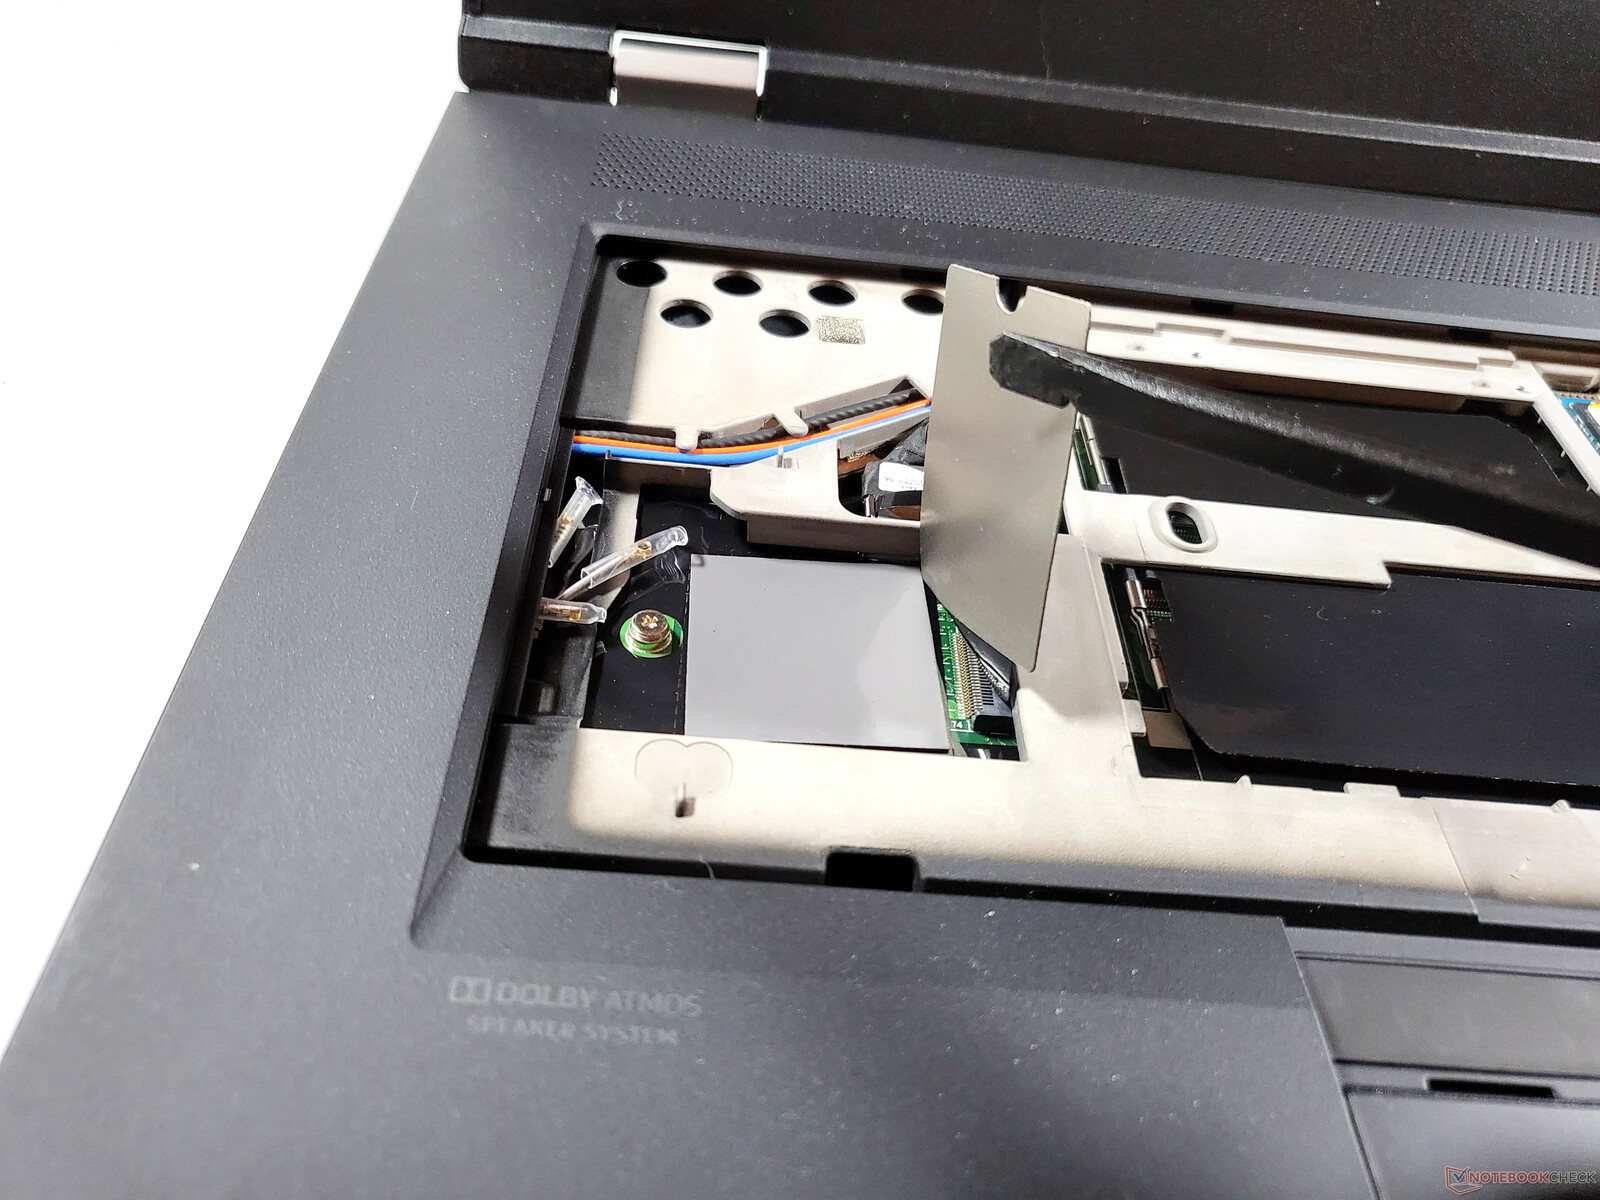
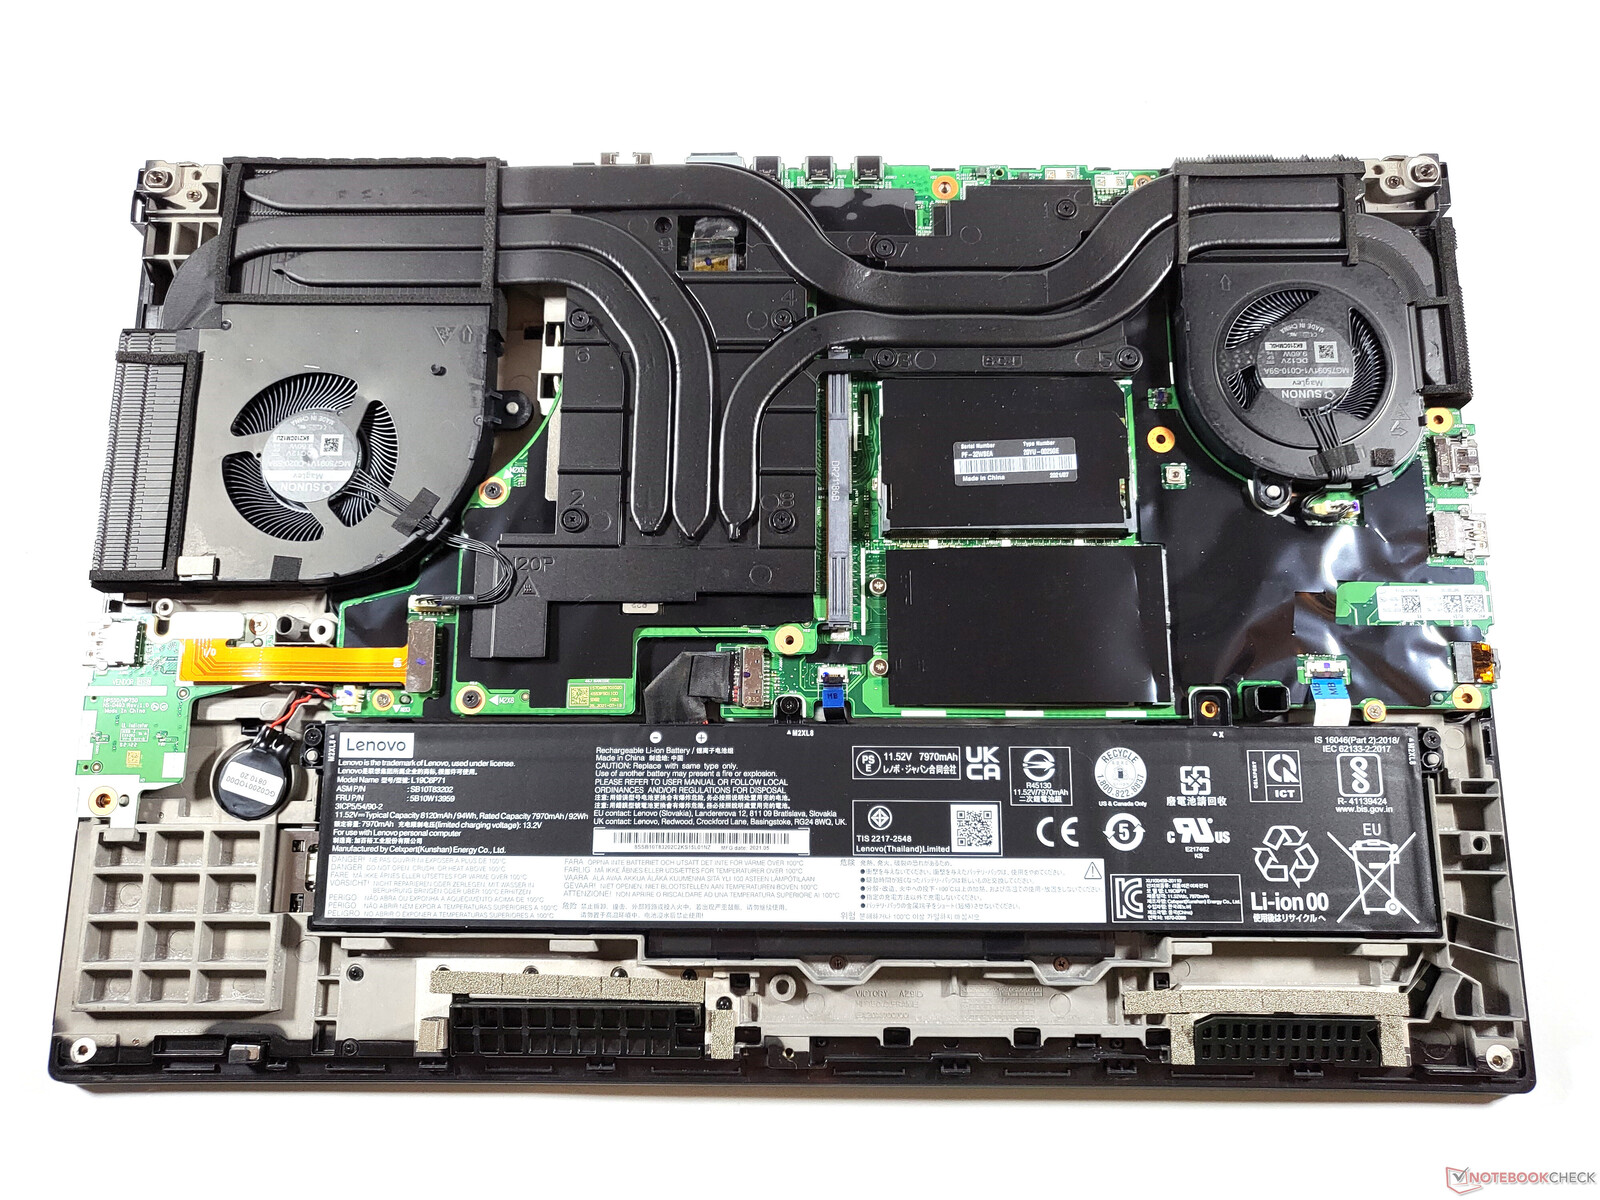
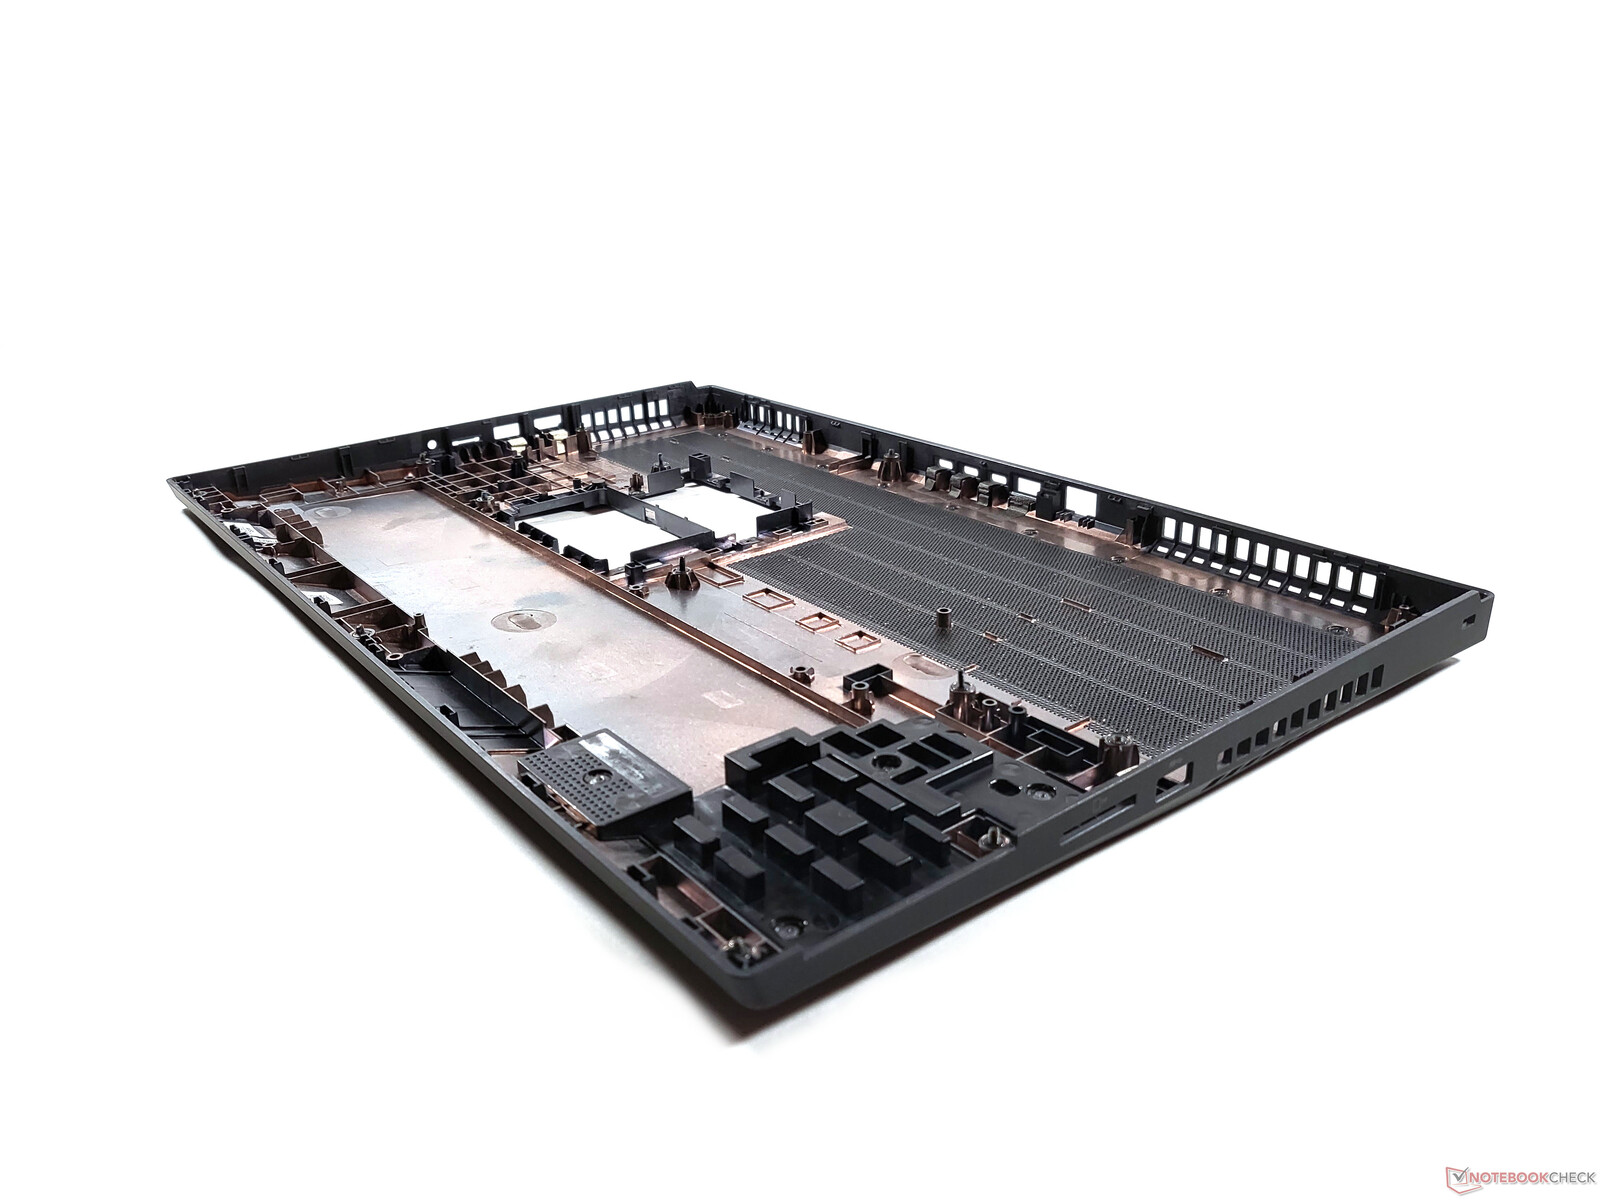
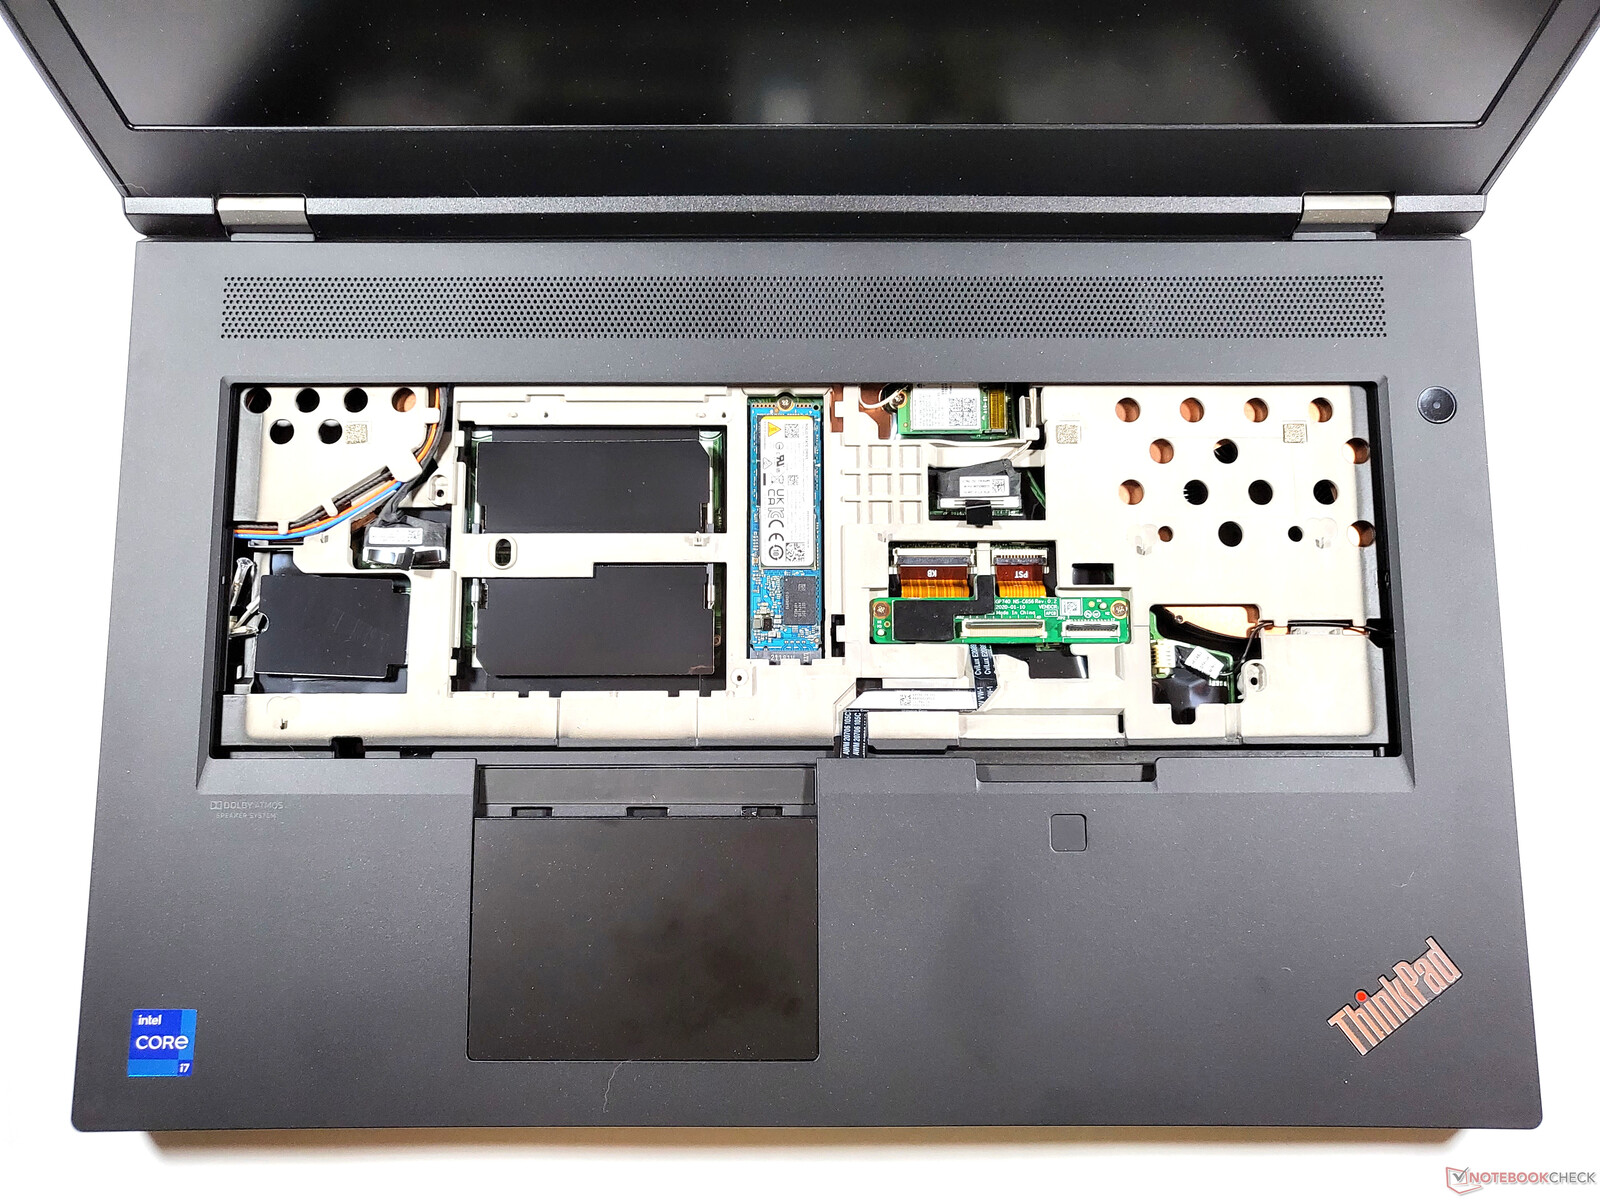
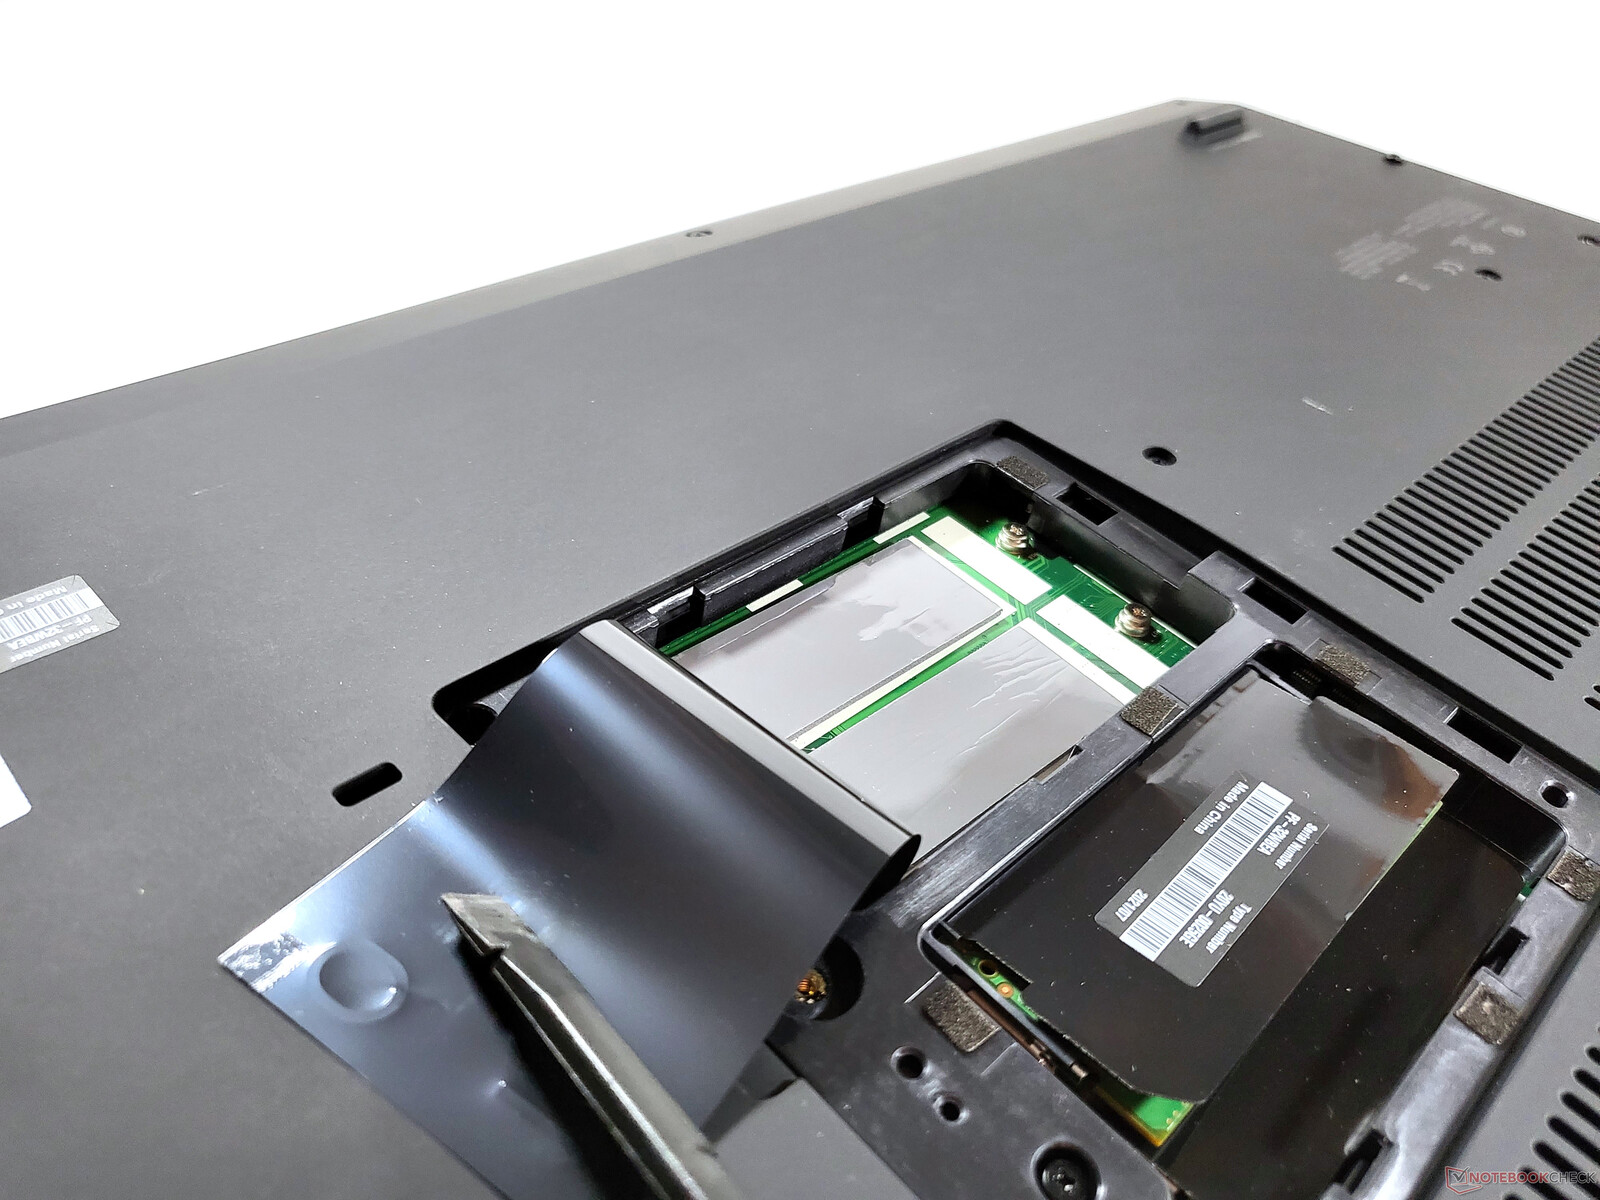
维护
许多可升级的部件,可能难以调换--这对大多数老式的P系列ThinkPad来说都是如此。例如,为了清洁ThinkPad P73的风扇,整个机箱包括镁质框架都必须被拆开。在新的ThinkPad P17上,这种情况不再存在。拆下底板就可以接触到电池和冷却解决方案。底板上有14颗螺丝,其中两颗隐藏在小的维护舱口下面。卸下螺丝后,底板仅由塑料夹子固定。
在小型服务舱门下面有两个SODIMM和两个未被占用的M.2插槽。主固态硬盘、另外两个SODIMM插槽和M.2-2242 WWAN插槽位于键盘下方,键盘也可以相当容易地被拆除。它只由底部的两个螺丝固定。与所有ThinkPad笔记本电脑一样,联想提供了一份hardware维护手册。.
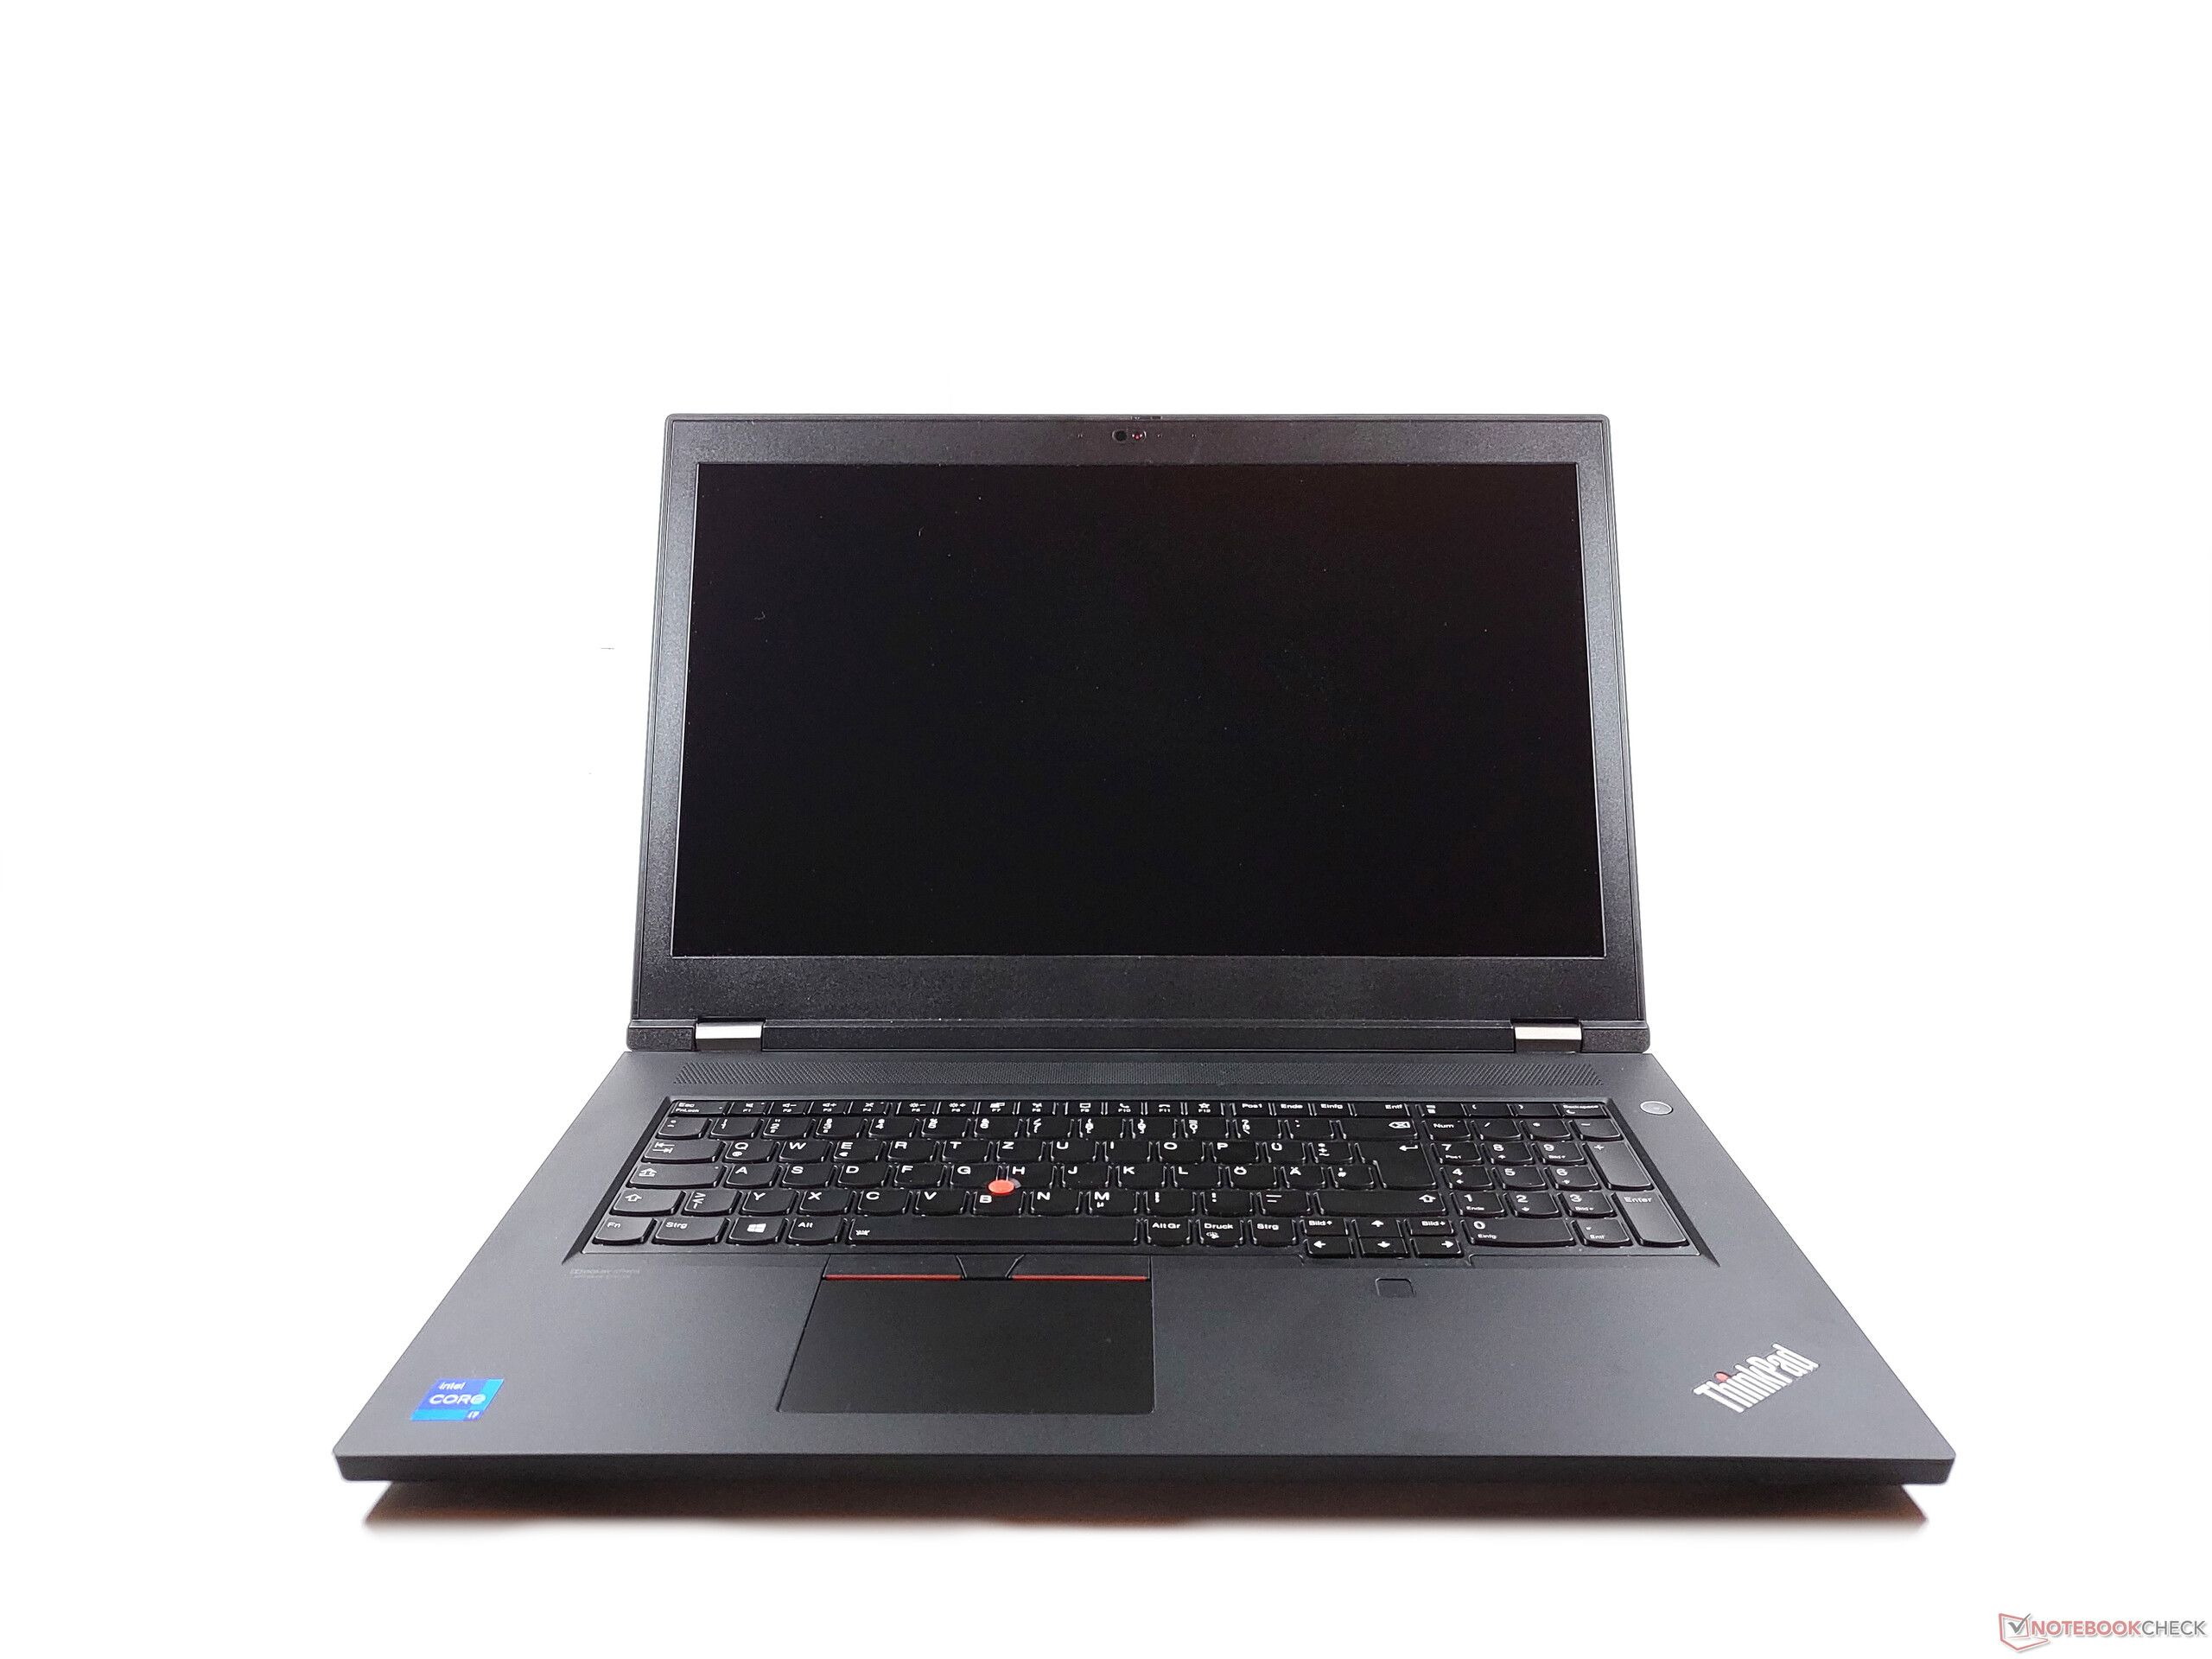
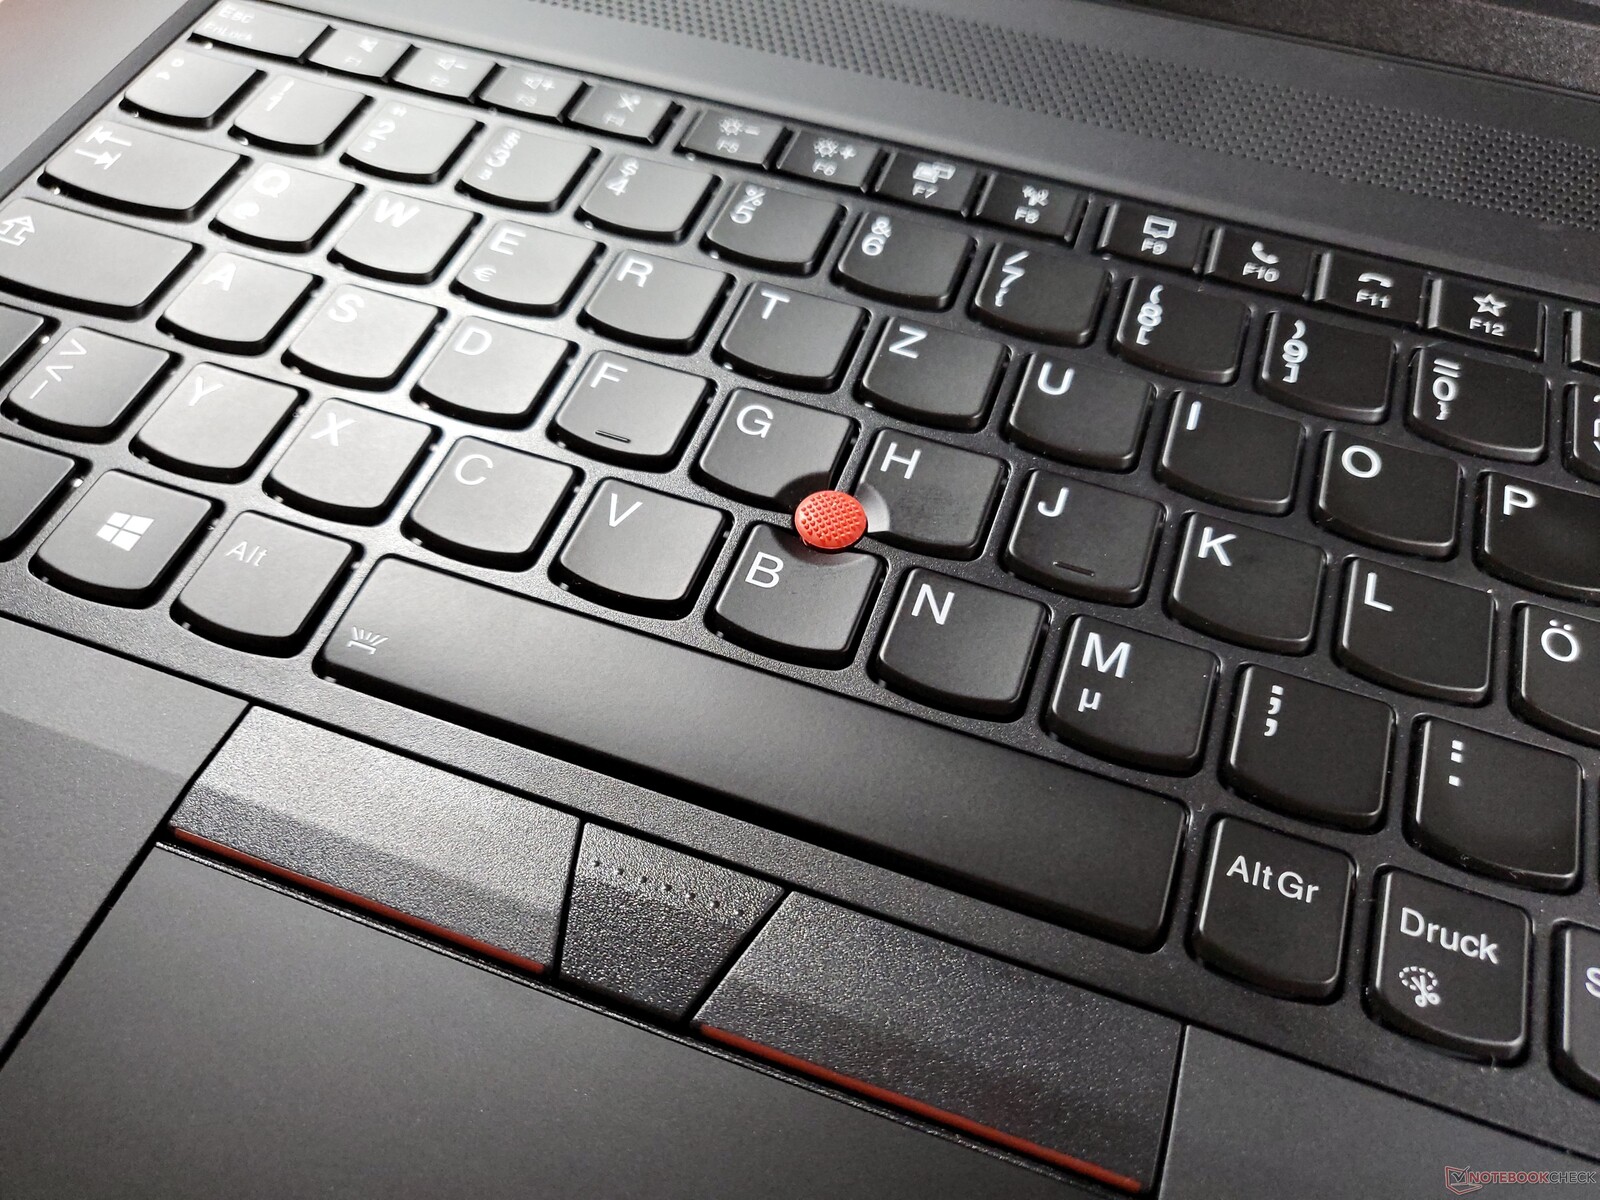
输入设备。ThinkPad P17 G2现在有了一个点击板
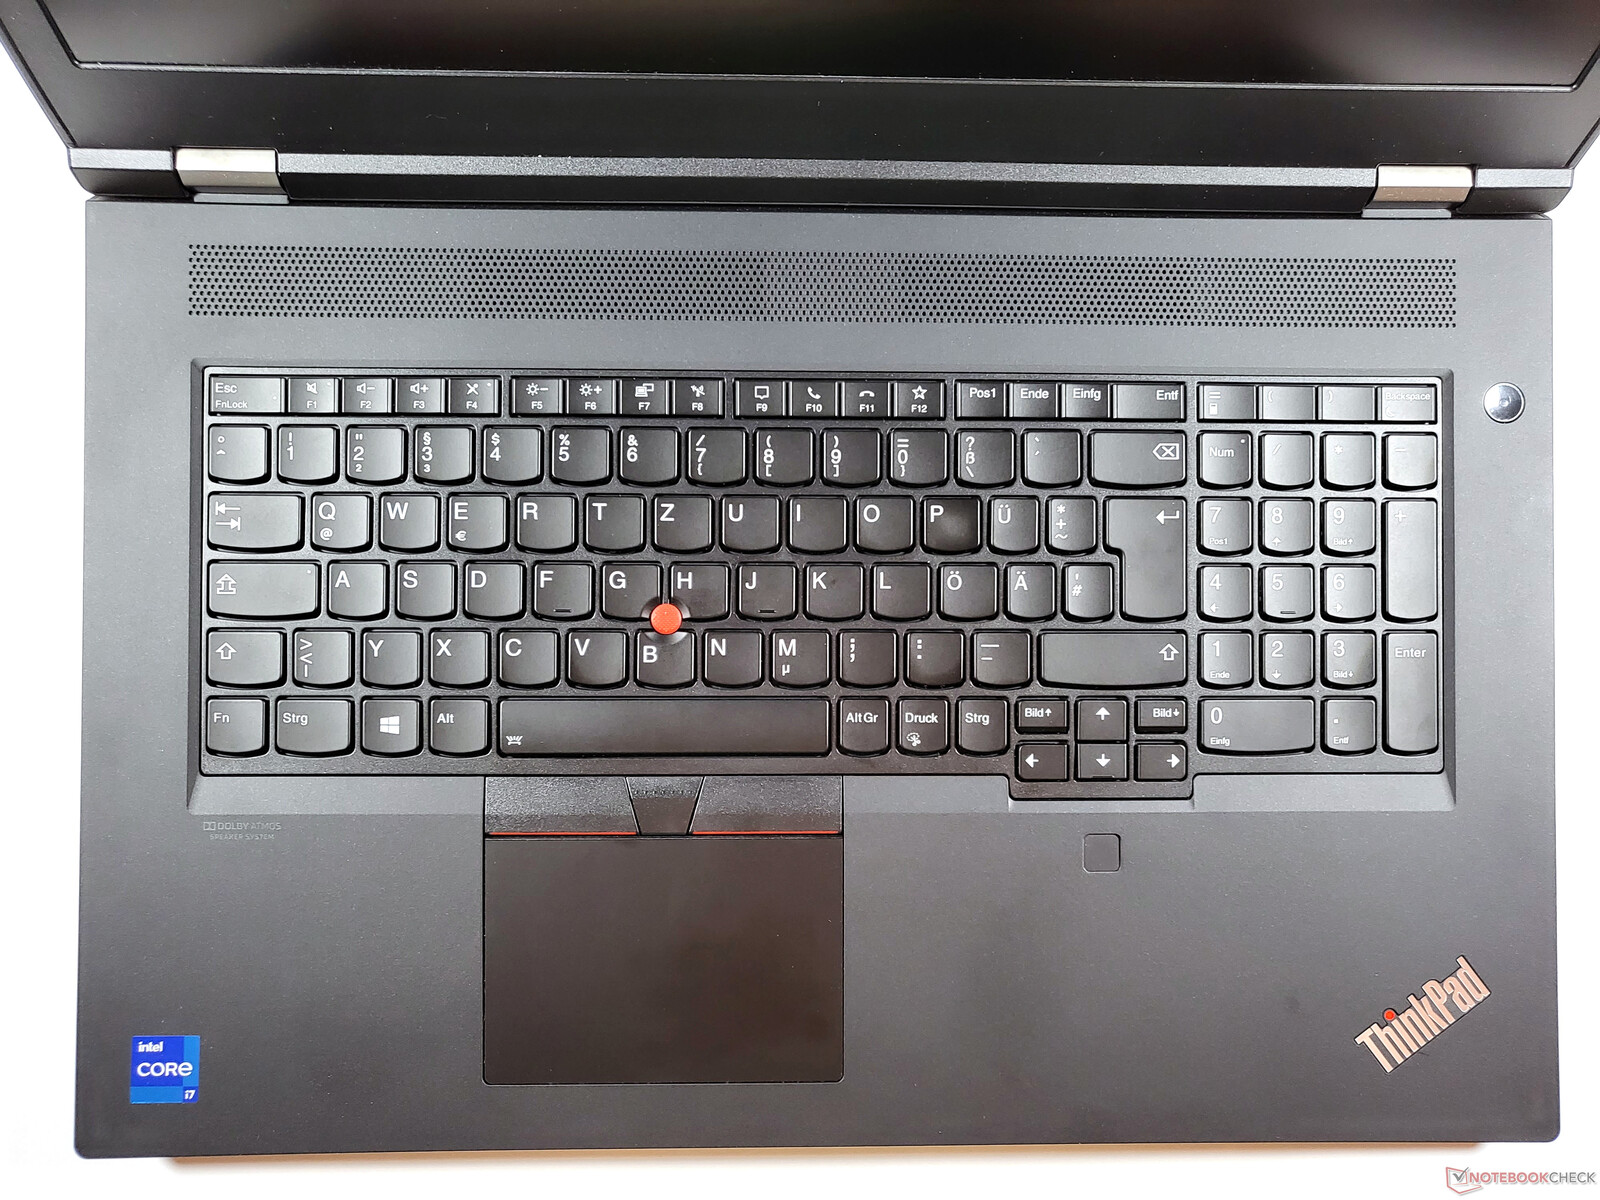
键盘
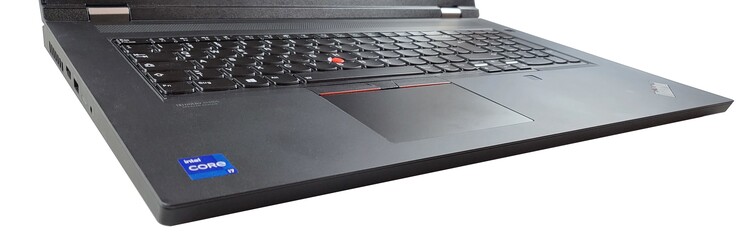
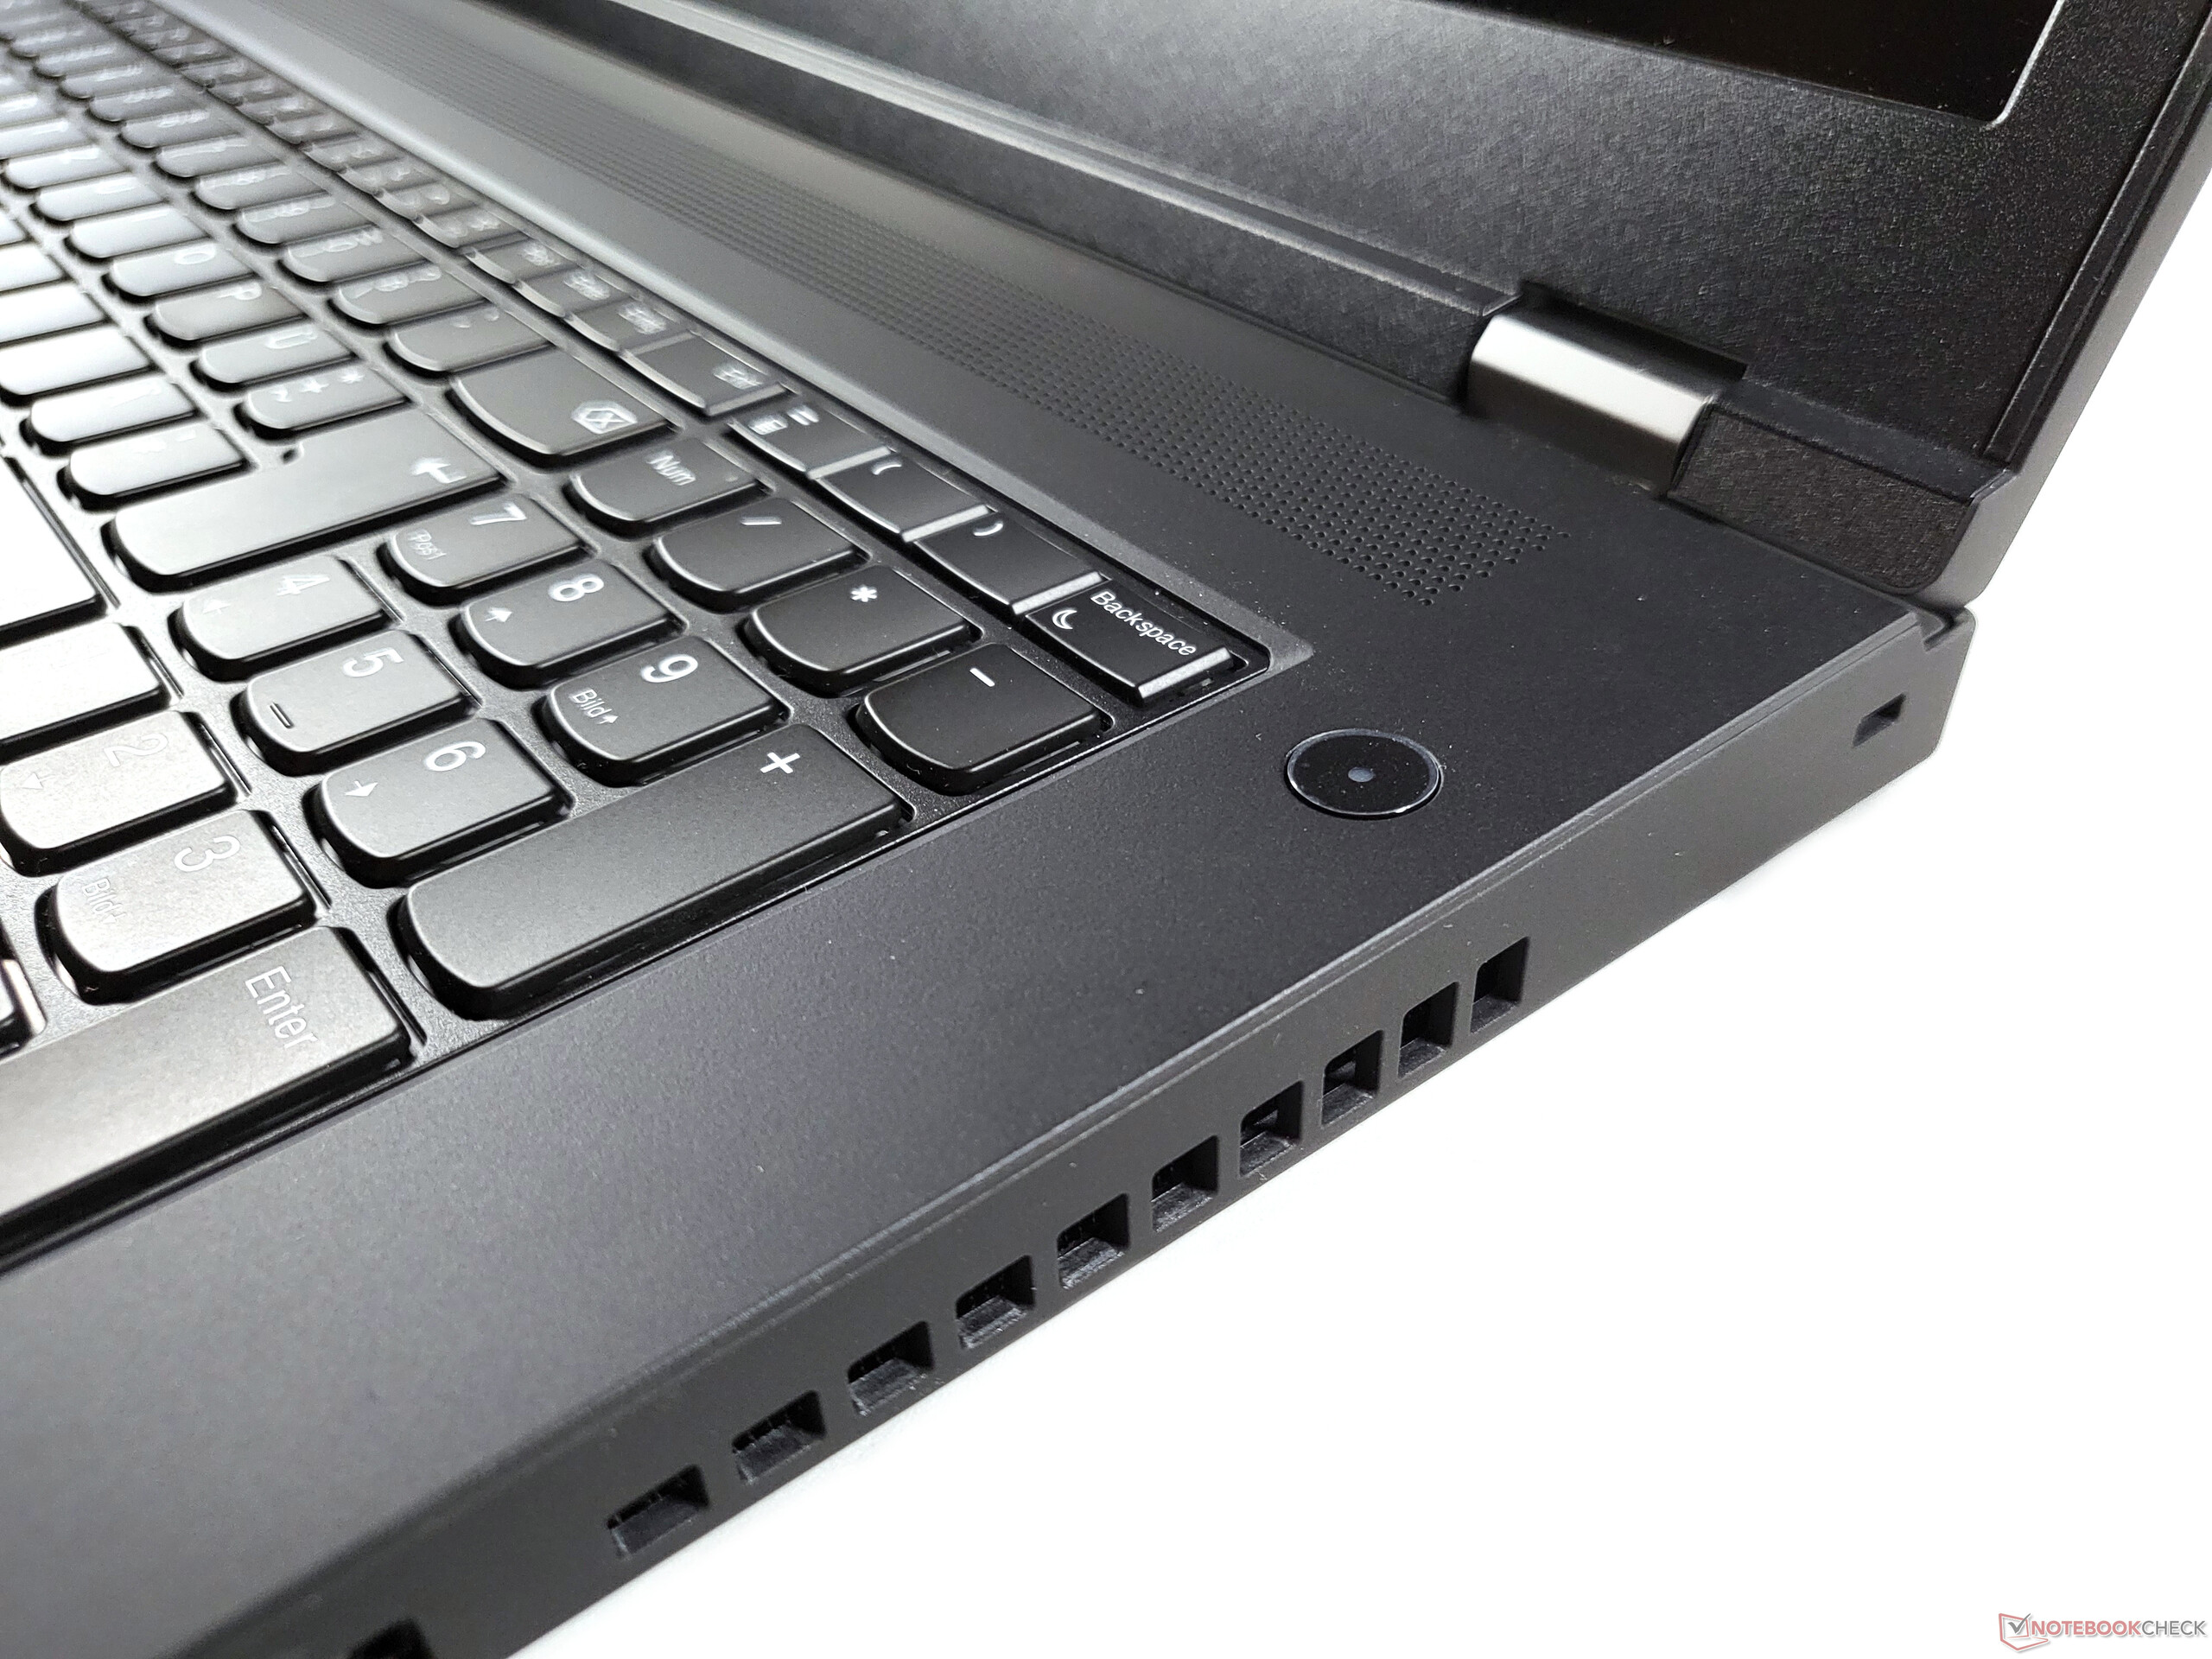
键盘方面没有任何变化,自ThinkPad P72以来,大部分都没有变化。平滑的按键带有两个亮度级别的背光,并有1.8毫米的行程,这比其他现代笔记本电脑明显多。长行程还是短行程更好,这是一个习惯和个人偏好的问题。在任何情况下,所安装的键盘都非常出色,无愧于ThinkPad的名字,反馈效果非常理想,既不会太软也不会太硬。联想Thinkpad P17第二代很适合甚至长时间的打字。与之不同的是 ThinkPad P15 G2键盘区域不会屈服。
与大多数大型工作站一样,在键盘区的右侧有一个小键盘,导致主键稍微向左偏移。键盘并没有完全伸展到底座的整个宽度上。此外,所有重要的功能都有专门的按键,包括导航,这使得工作流程更加高效。
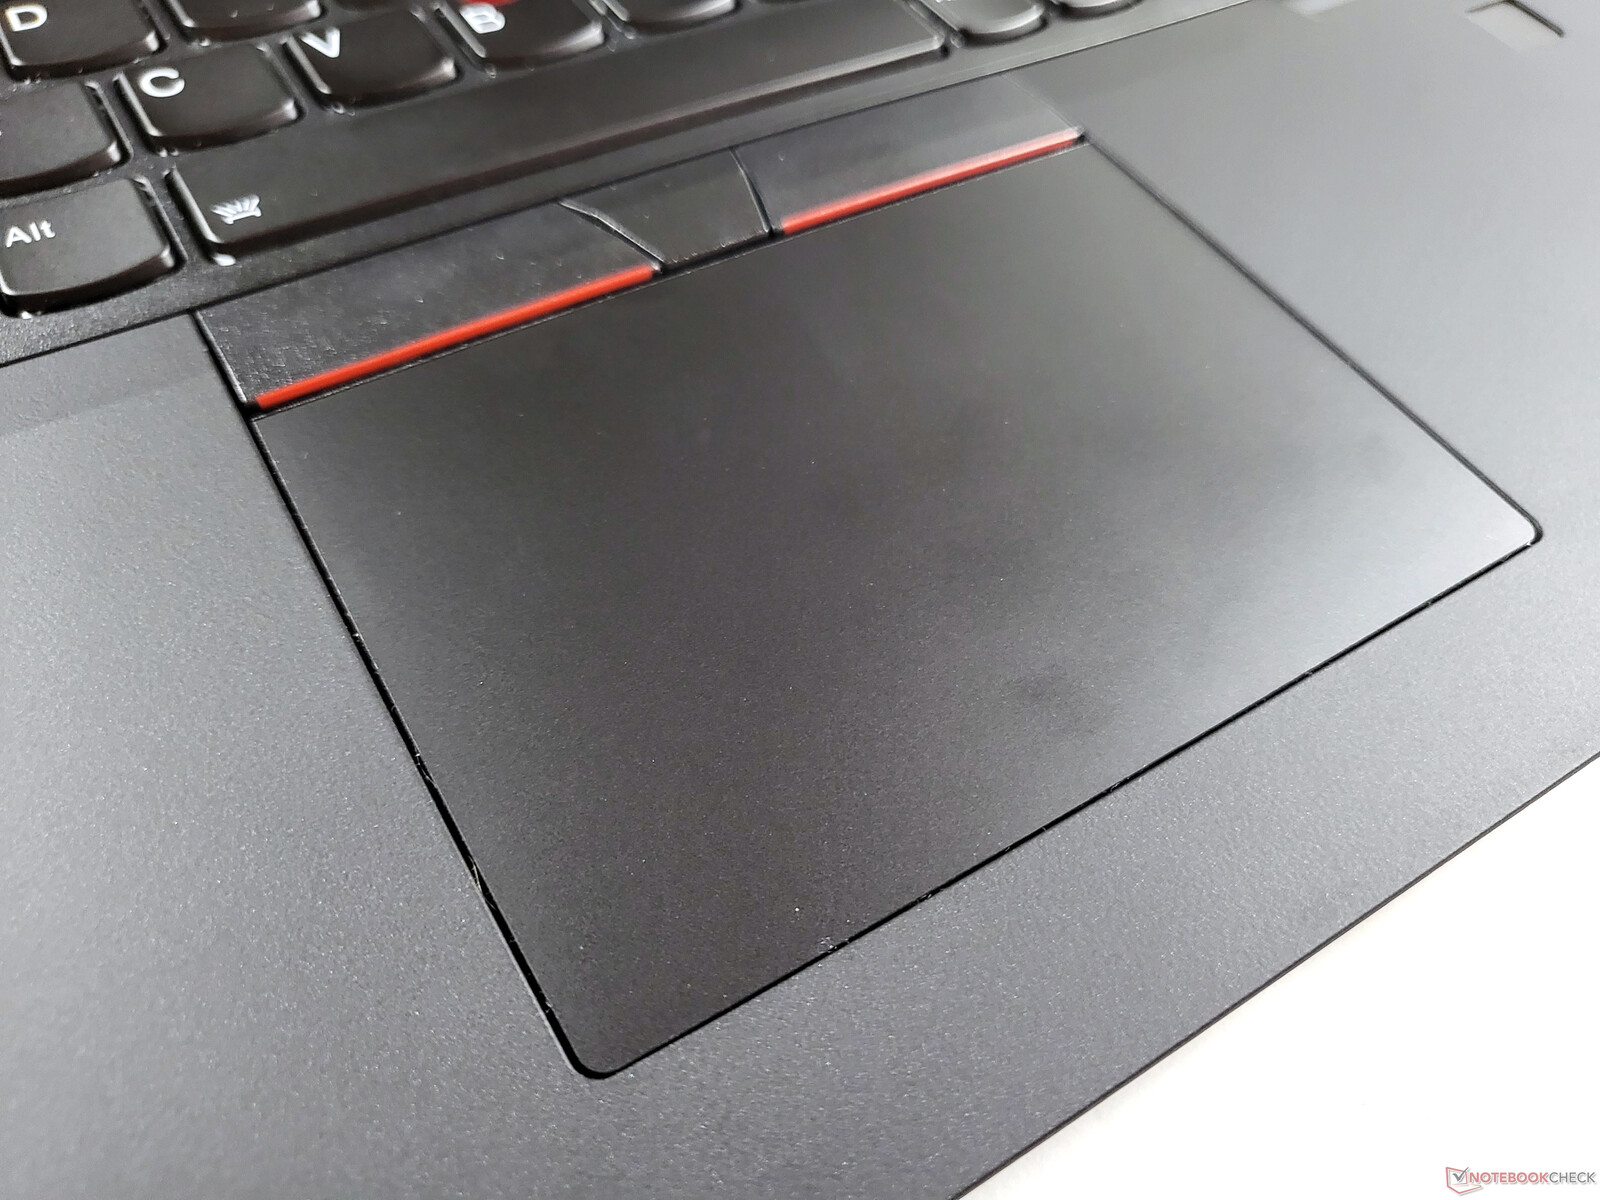
触摸板和TrackPoint
通过ThinkPad P17,联想将其没有专用按键的点击板引入了另一个产品系列。然而,联想抓住了这个机会,改用玻璃触摸板。塑料表面提供了平滑的滑行性能,并有沉闷的高质量点击。在10 x 7厘米(约3.94 x 2.76英寸)处,触摸板大小适中。Synaptics触摸板的软件实现不值得批评。
除了触摸板,联想ThinkPad P17 G2还提供了标志性的ThinkPad TrackPoint及其三个专用按钮。TrackPoint优于触摸板,特别是在拖放方面,它允许用户在打字时移动鼠标指针。总的来说,它是一个很好的鼠标替代品,尽管对初学者来说可能需要一些练习。
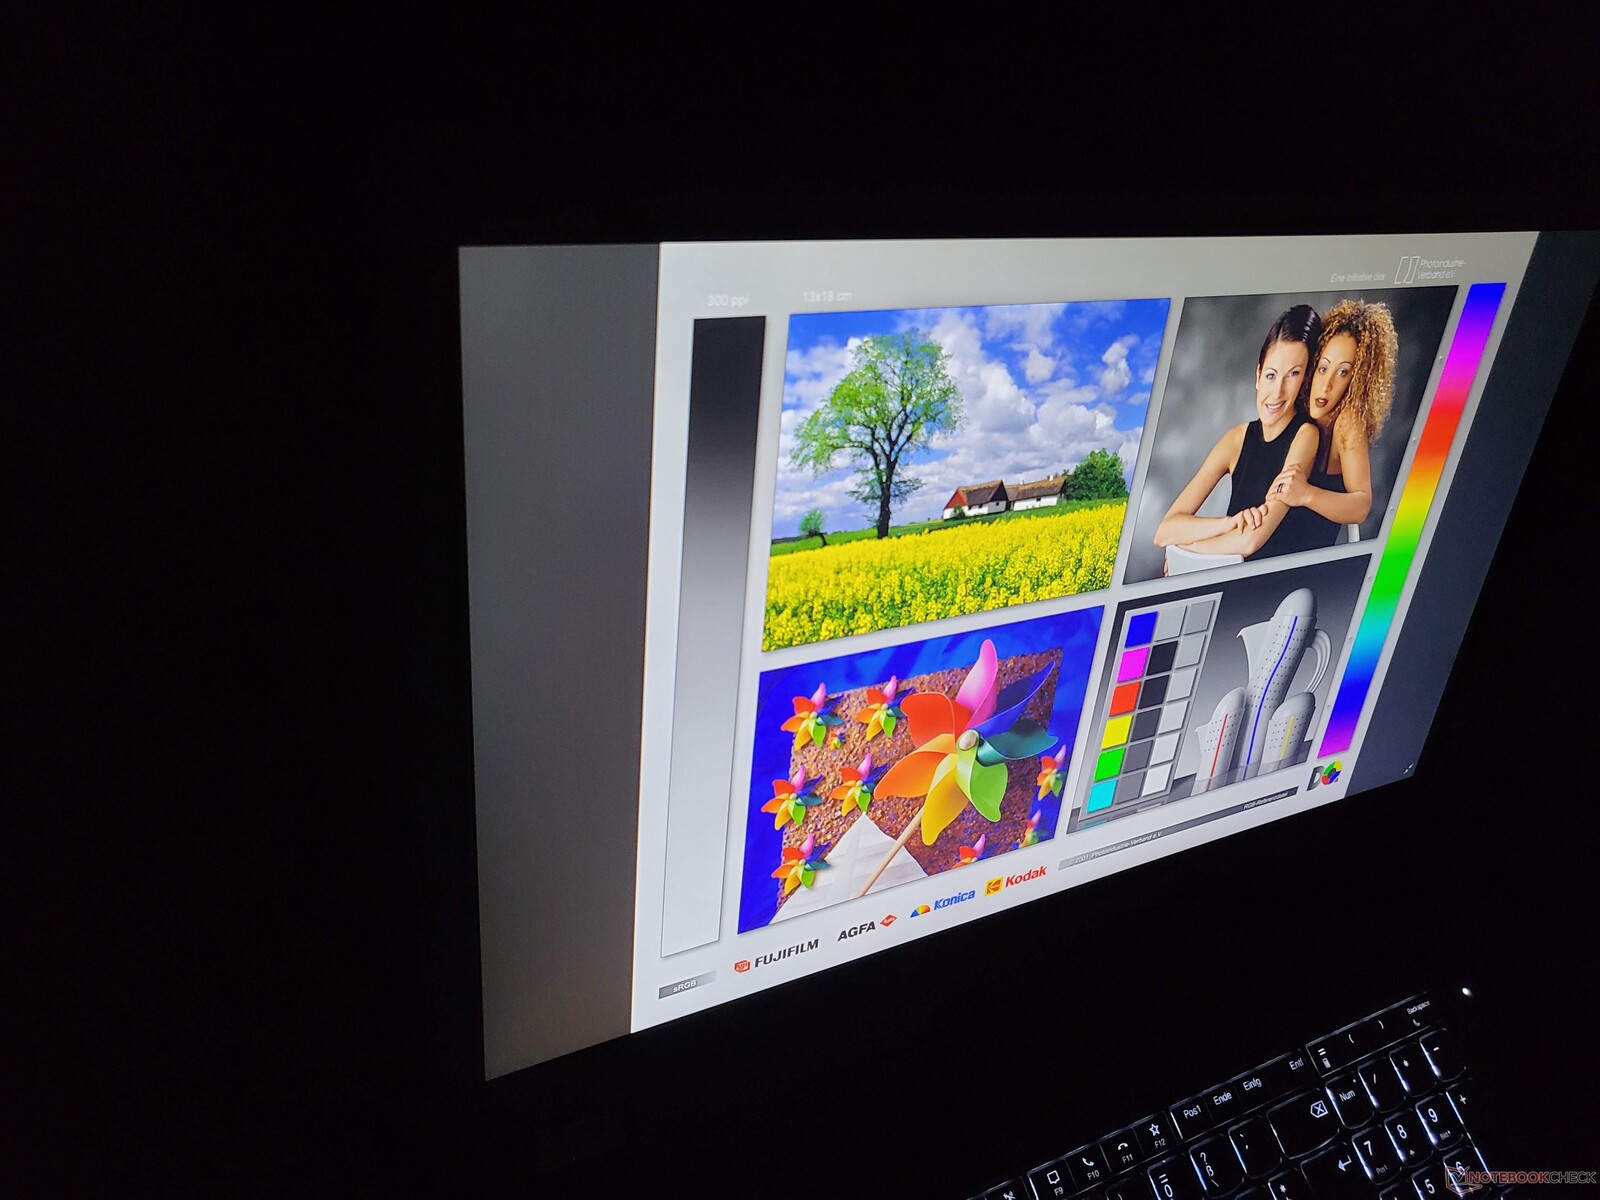
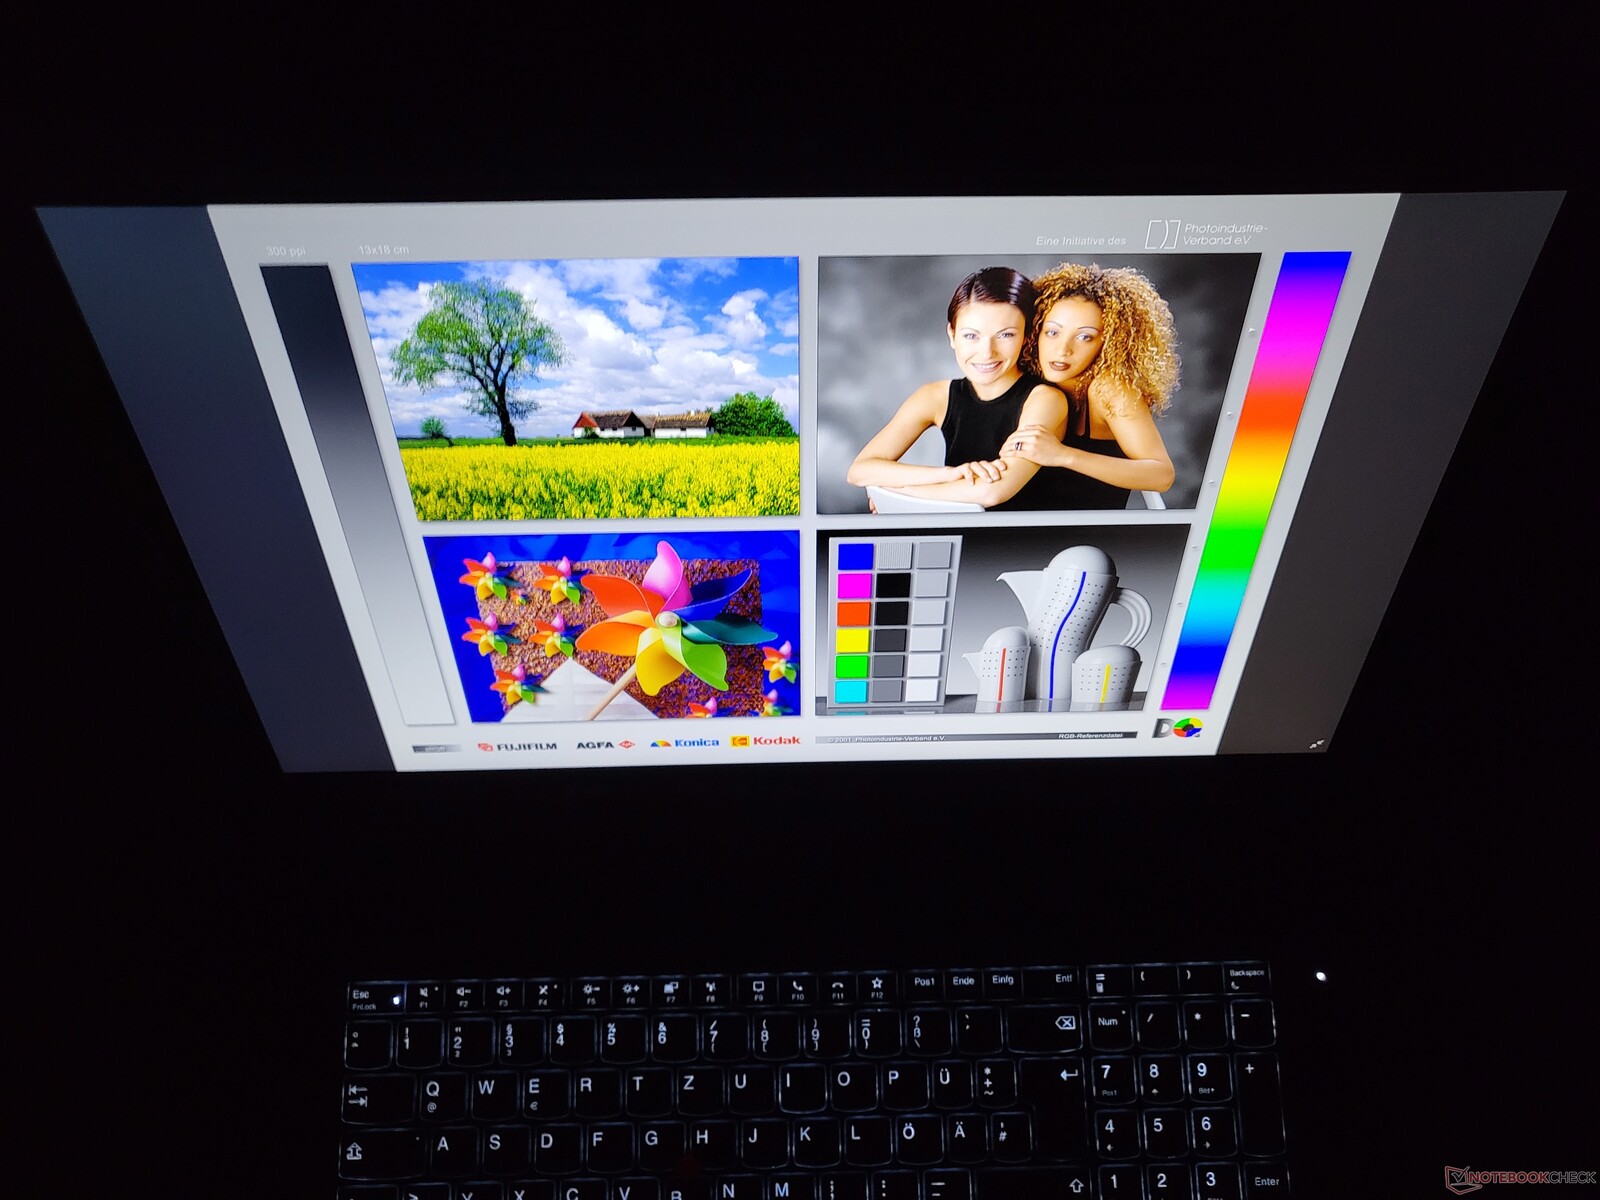
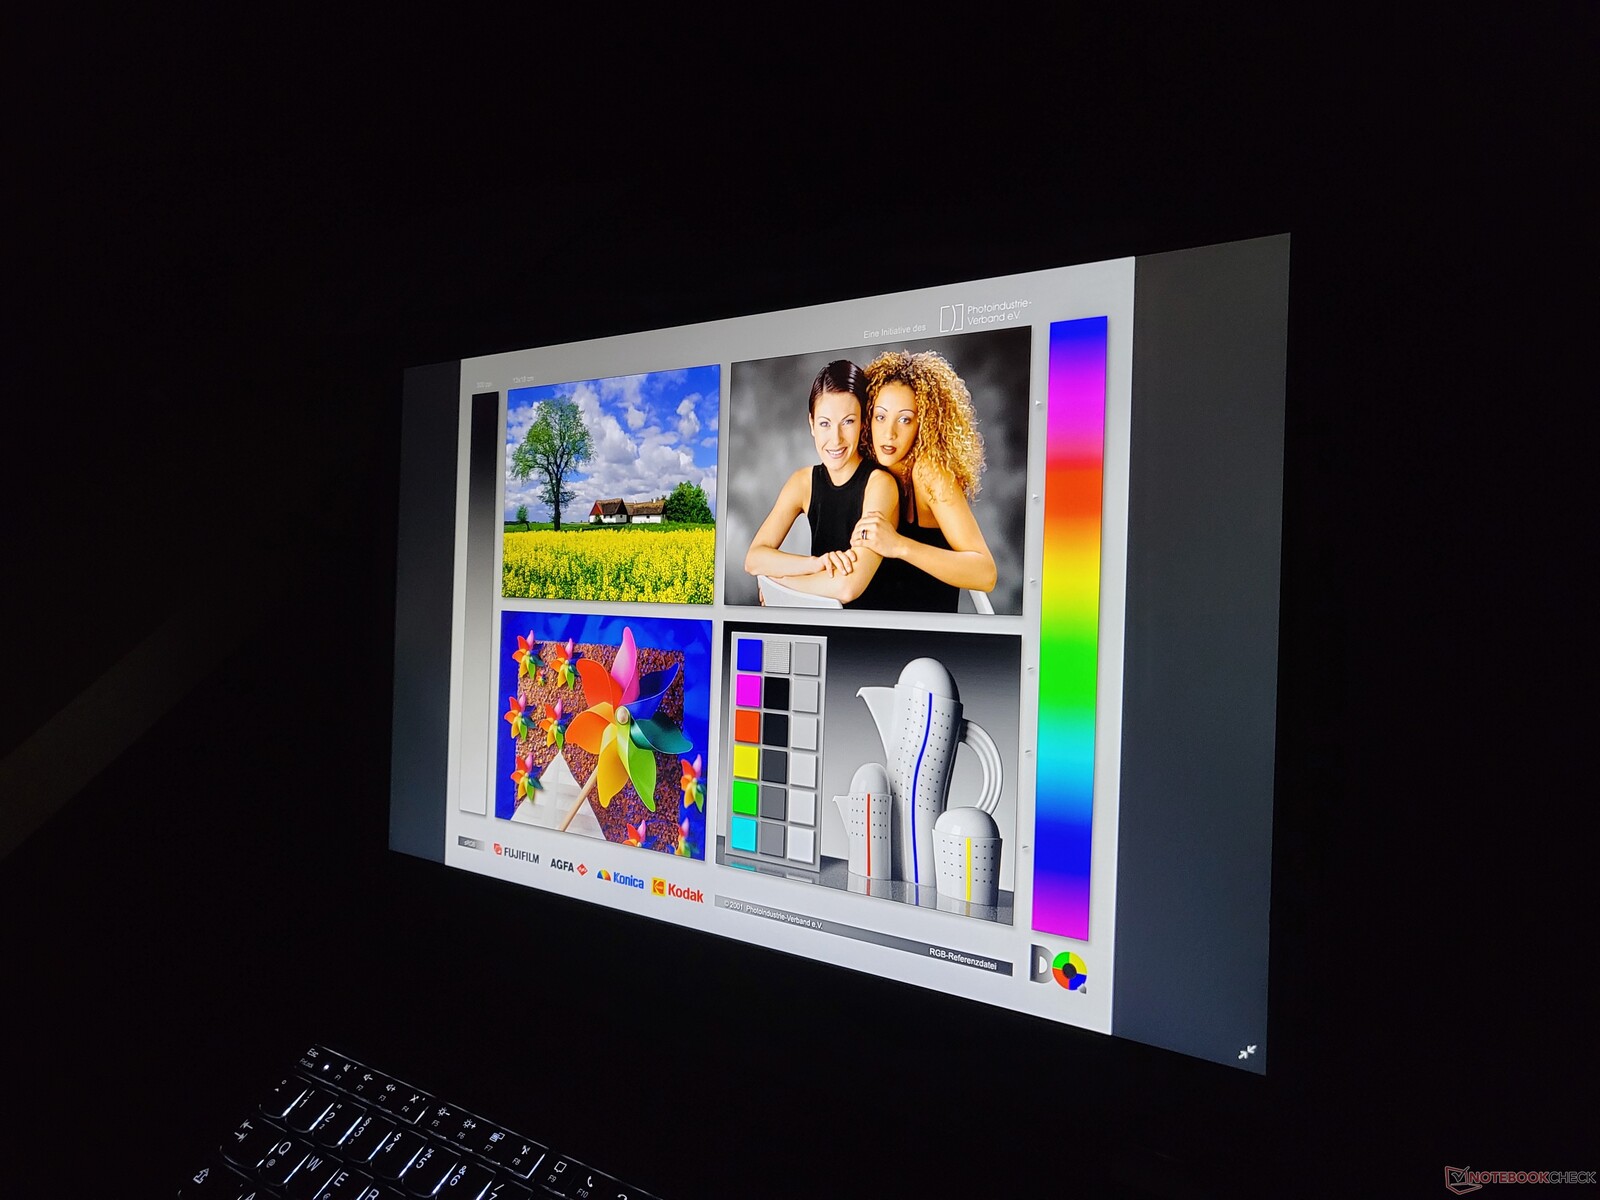
显示屏。ThinkPad采用令人失望的全高清液晶屏
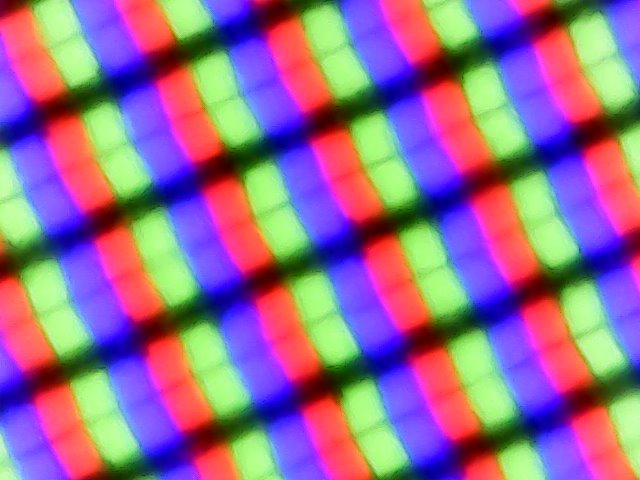
虽然16:9的形式因素还没有完全过时,但它现在几乎已经过时了。越来越多的笔记本电脑正在采用16:10或3:2的长宽比,尽管这一趋势似乎还没有对工作站领域产生多大影响。联想为ThinkPad P17第二代提供了两种17.3英寸16:9的显示屏选择,两种变体都是哑光IPS屏幕。触摸屏在这一型号上是不存在的,因为它们--连同OLED--都是较小的型号所独有的。 联想ThinkPad P15 G2.
- 全高清(1920 x 1080),300尼特,100 % sRGB
- 4K超高清(3840 x 2160),500尼特,100 % AdobeRGB
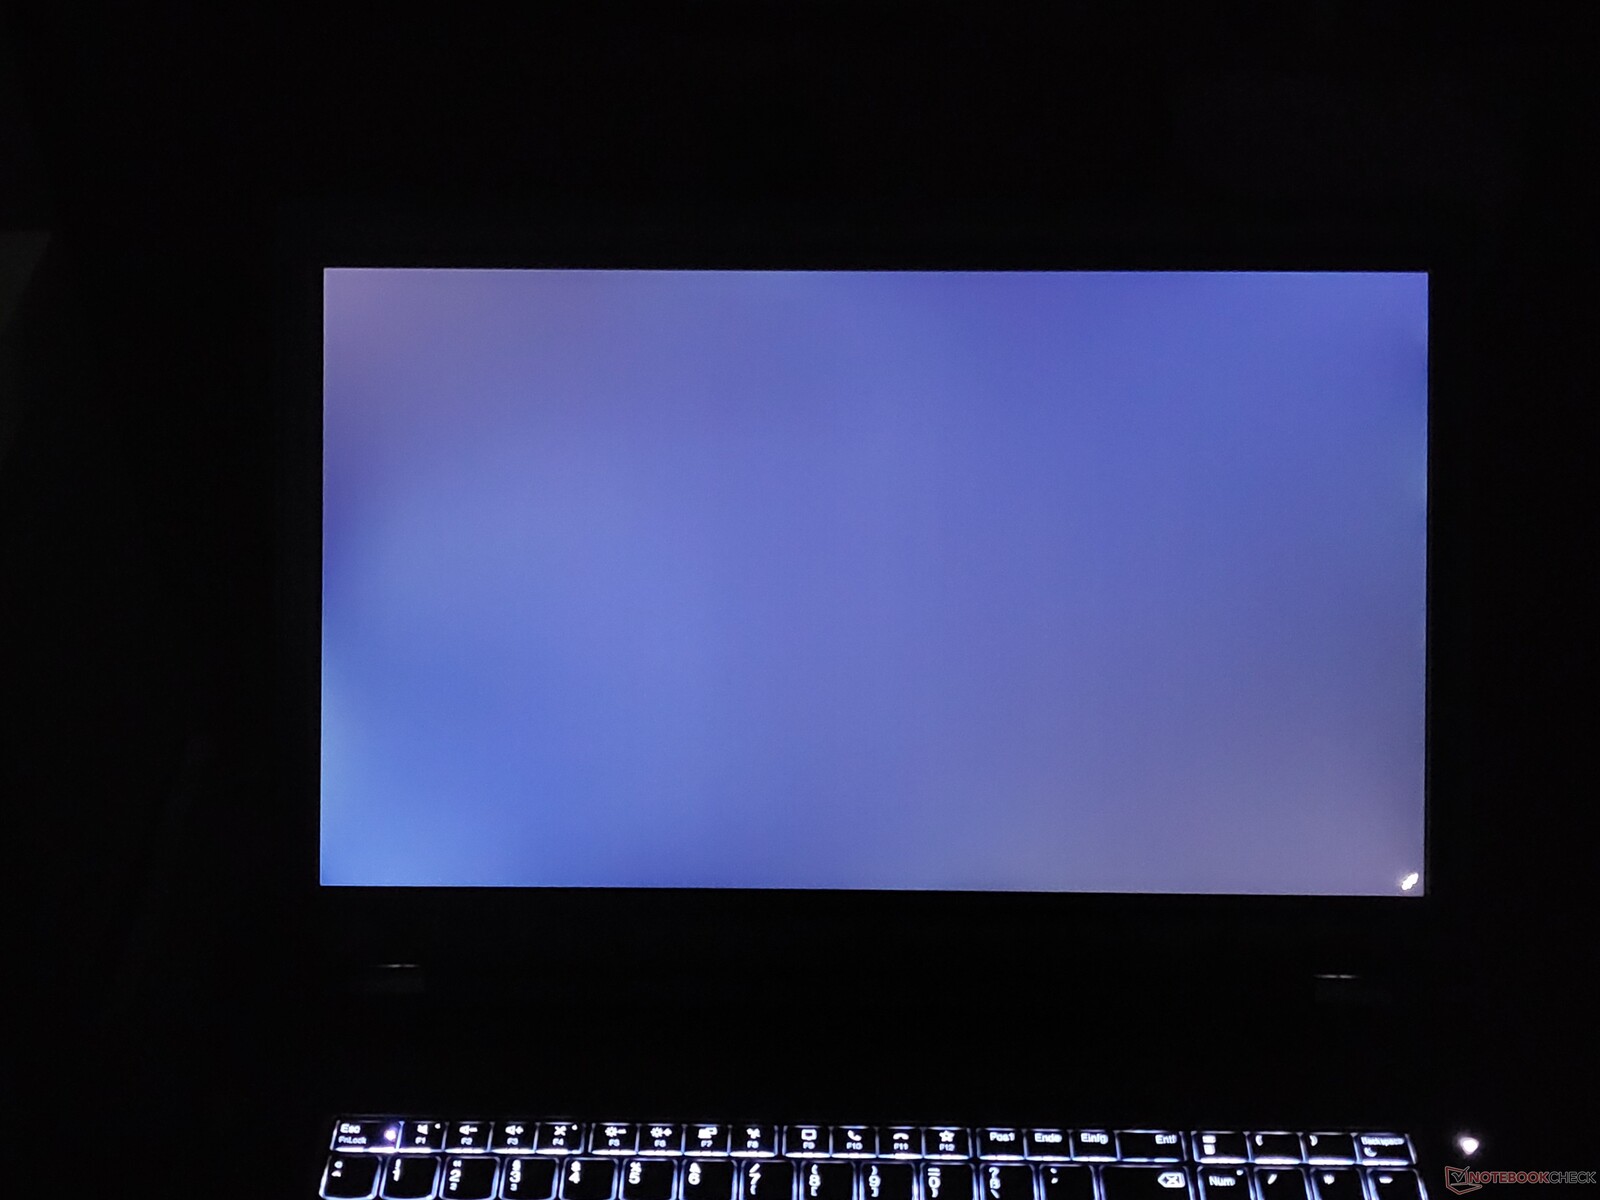
该显示器毫不费力地超过了宣传的300尼特的亮度水平,其平均测量亮度为334尼特。虽然它比去年的型号更亮,但ThinkPad P17 G2的基本显示选项不能完全与竞争的惠普和戴尔系统的4K UHD液晶显示器竞争。
总的来说,原生全高清分辨率对于17英寸笔记本电脑来说几乎太低了,尤其是在工作站领域。图像看起来有些粗糙,大型液晶屏感觉被浪费了。我们希望联想能在未来的机型中切换到2K或QHD显示屏。
| |||||||||||||||||||||||||
Brightness Distribution: 87 %
Center on Battery: 357 cd/m²
Contrast: 1031:1 (Black: 0.35 cd/m²)
ΔE ColorChecker Calman: 5.4 | ∀{0.5-29.43 Ø4.71}
calibrated: 3.2
ΔE Greyscale Calman: 6.5 | ∀{0.09-98 Ø4.96}
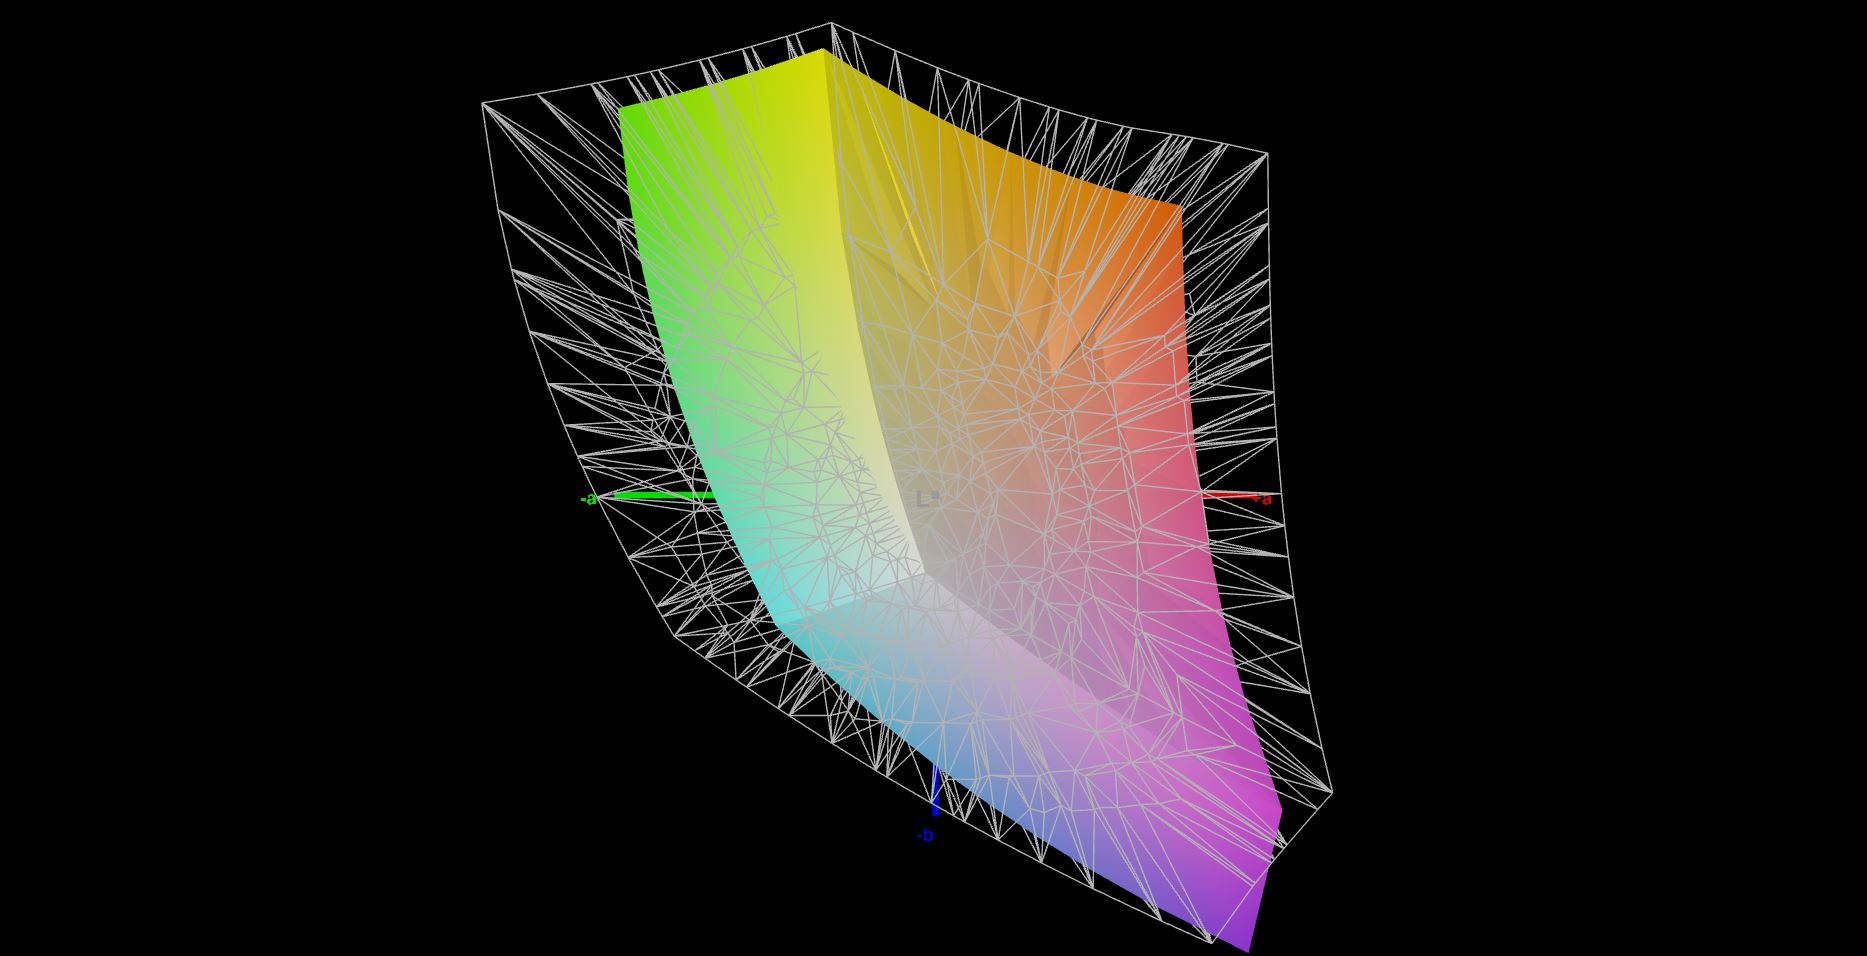
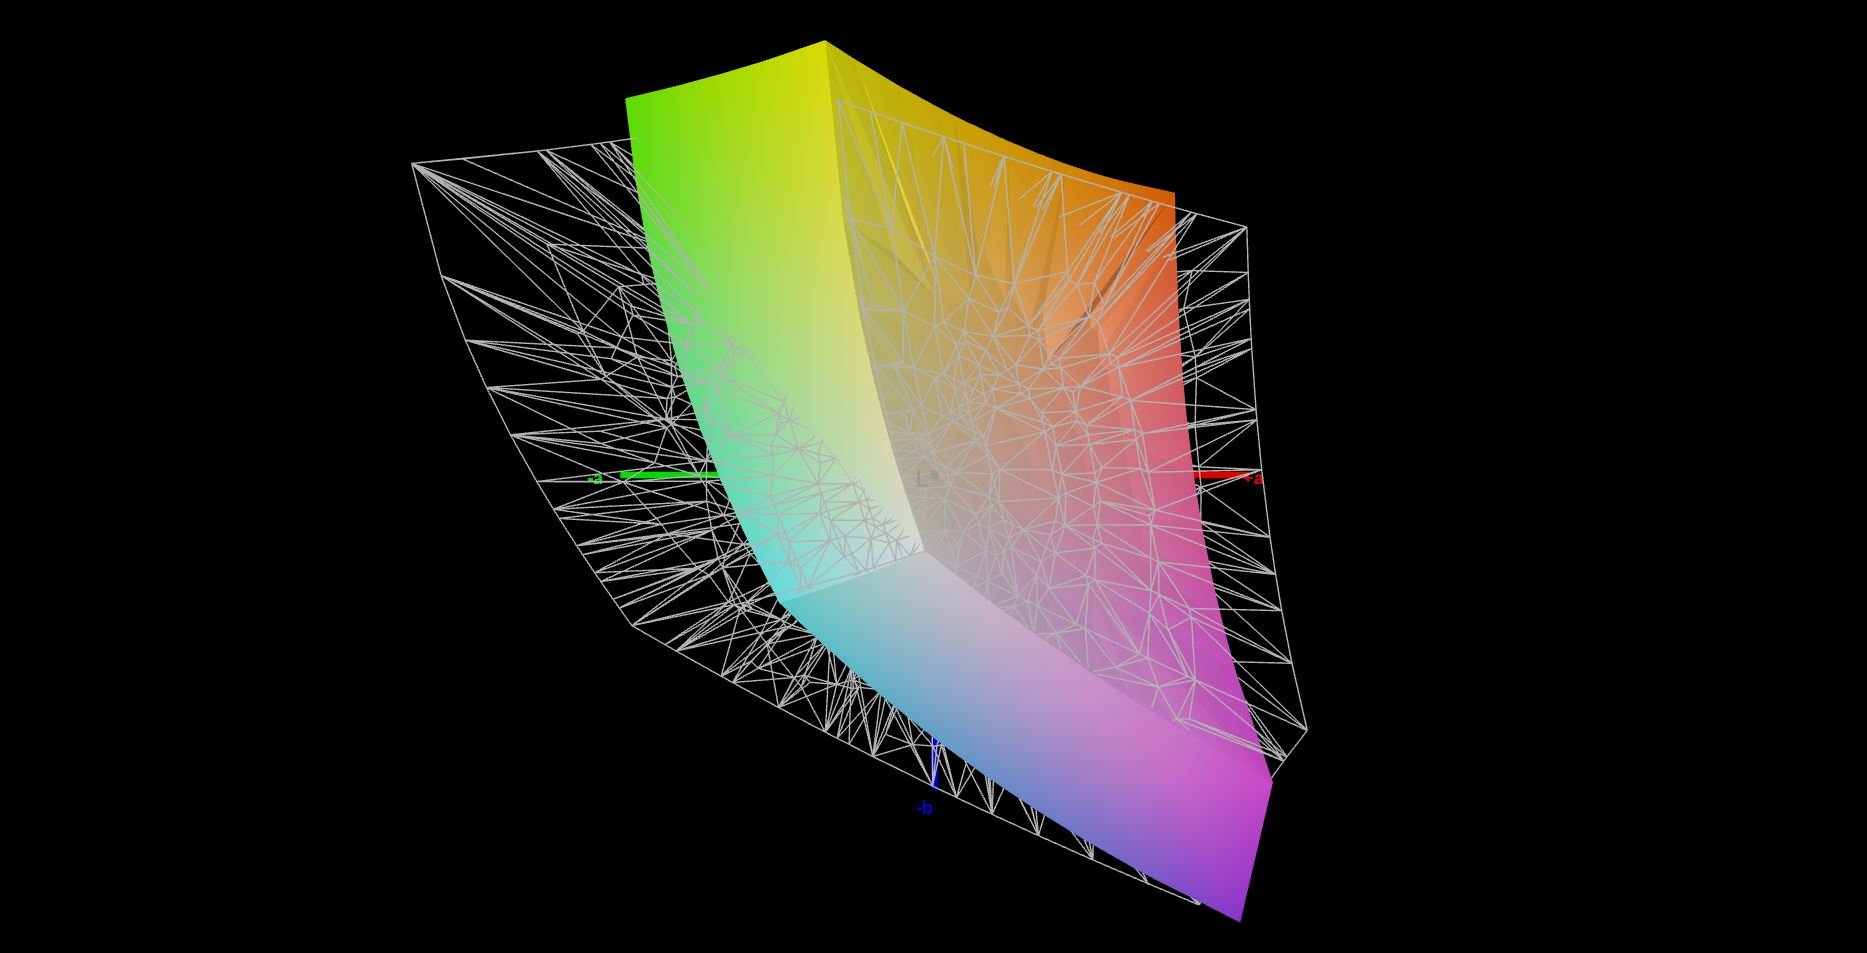
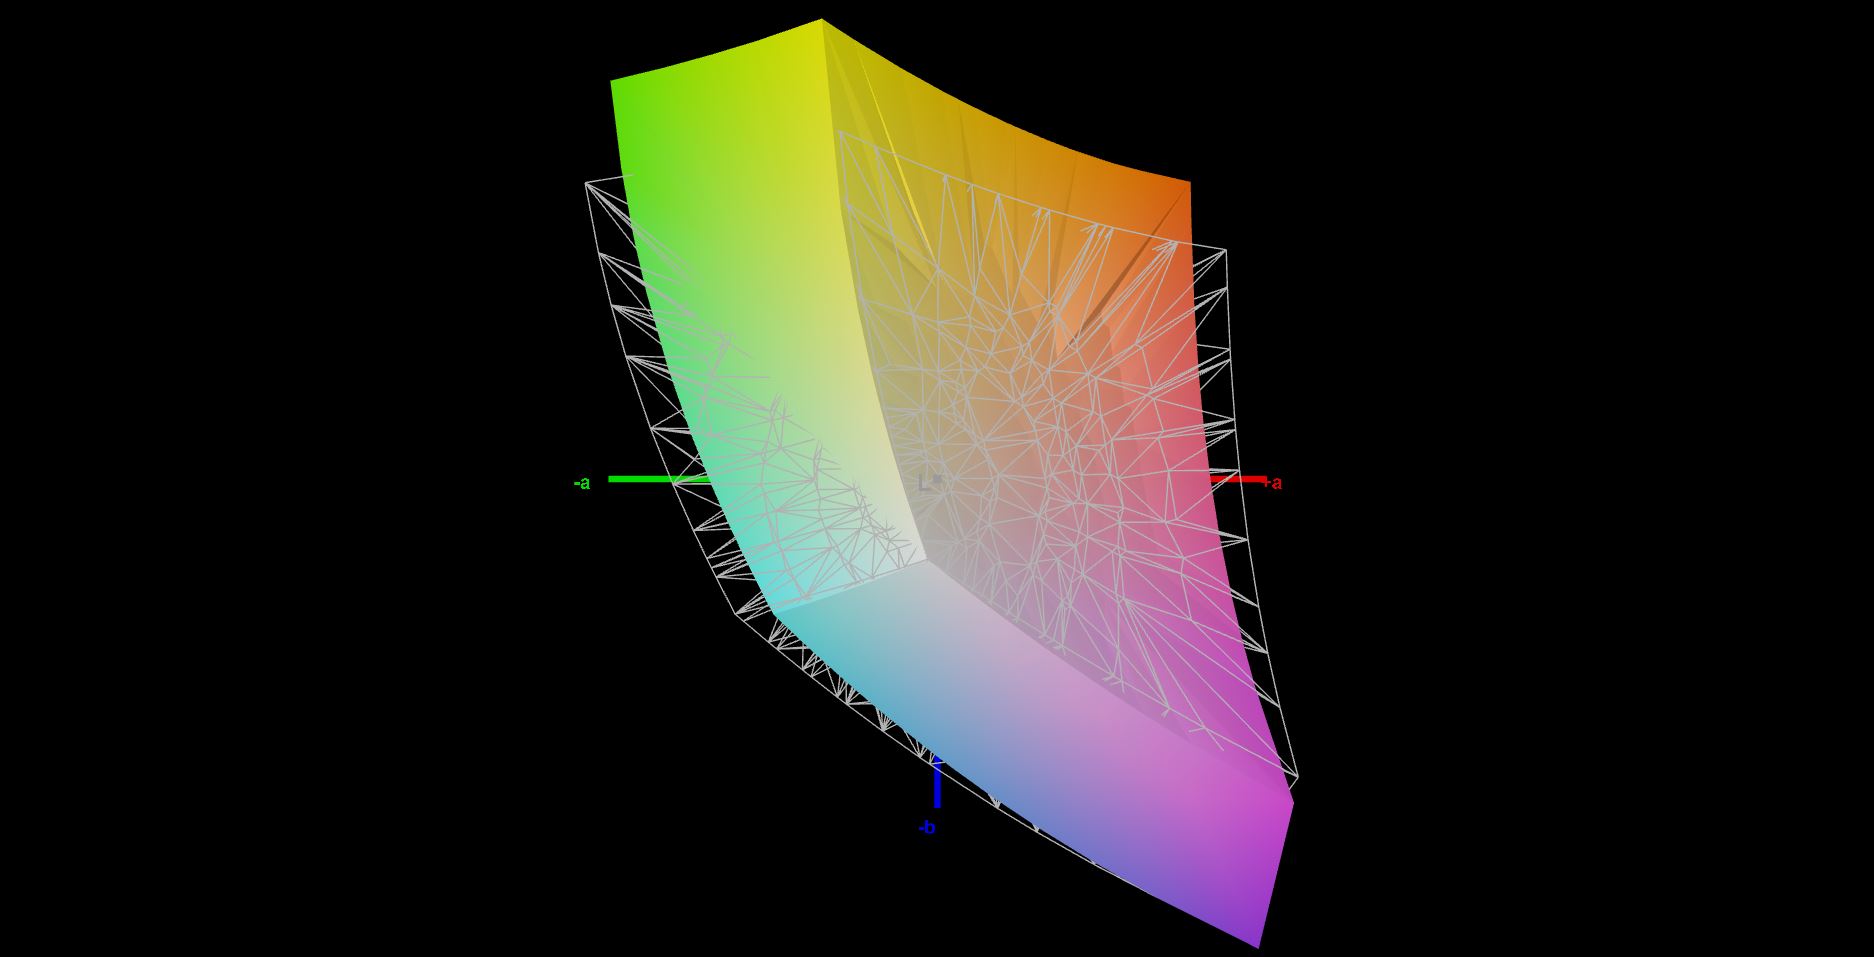
63.9% AdobeRGB 1998 (Argyll 3D)
87.3% sRGB (Argyll 3D)
67.9% Display P3 (Argyll 3D)
Gamma: 2.23
CCT: 7351 K
| Lenovo ThinkPad P17 G2-20YU0025G LP173WF4-SPF7, IPS LED, 1920x1080, 17.3" | Lenovo ThinkPad P73-20QR002DGE N173HCE-E31, IPS LED, 1920x1080, 17.3" | HP ZBook Fury 17 G7 119W5EA AUOCD8C, , 3840x2160, 17.3" | Dell Precision 5000 5750 P92F Sharp LQ170R1, IPS, 3840x2400, 17" | Asus ProArt StudioBook Pro 17 W700G3T 170PUW1-A00, IPS, 1920x1200, 17" | |
|---|---|---|---|---|---|
| Display | 4% | 32% | 30% | 30% | |
| Display P3 Coverage (%) | 67.9 | 67.5 -1% | 99.3 46% | 83.6 23% | 96.2 42% |
| sRGB Coverage (%) | 87.3 | 94.2 8% | 99.9 14% | 99.7 14% | 99.8 14% |
| AdobeRGB 1998 Coverage (%) | 63.9 | 67.8 6% | 86.9 36% | 97.7 53% | 84.7 33% |
| Response Times | -14% | -61% | -29% | -19% | |
| Response Time Grey 50% / Grey 80% * (ms) | 39.2 ? | 40 ? -2% | 56 ? -43% | 41.2 ? -5% | 41.2 ? -5% |
| Response Time Black / White * (ms) | 22.4 ? | 28 ? -25% | 40 ? -79% | 34 ? -52% | 29.6 ? -32% |
| PWM Frequency (Hz) | 25000 ? | ||||
| Screen | 6% | 48% | 16% | 31% | |
| Brightness middle (cd/m²) | 361 | 333 -8% | 573 59% | 483.8 34% | 323 -11% |
| Brightness (cd/m²) | 334 | 310 -7% | 586 75% | 457 37% | 308 -8% |
| Brightness Distribution (%) | 87 | 83 -5% | 91 5% | 90 3% | 88 1% |
| Black Level * (cd/m²) | 0.35 | 0.39 -11% | 0.38 -9% | 0.37 -6% | 0.36 -3% |
| Contrast (:1) | 1031 | 854 -17% | 1508 46% | 1308 27% | 897 -13% |
| Colorchecker dE 2000 * | 5.4 | 4.4 19% | 1.9 65% | 4.27 21% | 1.1 80% |
| Colorchecker dE 2000 max. * | 9.9 | 7.5 24% | 4.2 58% | 8.78 11% | 3.3 67% |
| Colorchecker dE 2000 calibrated * | 3.2 | 2 37% | 0.7 78% | 4.01 -25% | 0.8 75% |
| Greyscale dE 2000 * | 6.5 | 5.1 22% | 2.9 55% | 3.5 46% | 0.8 88% |
| Gamma | 2.23 99% | 2.39 92% | 2.1 105% | 2.43 91% | 2.23 99% |
| CCT | 7351 88% | 7061 92% | 6217 105% | 1741 373% | 6479 100% |
| Color Space (Percent of AdobeRGB 1998) (%) | 61.1 | 77.6 | 86.7 | 75.7 | |
| Color Space (Percent of sRGB) (%) | 94 | 100 | 99.9 | 99.8 | |
| Total Average (Program / Settings) | -1% /
3% | 6% /
29% | 6% /
13% | 14% /
23% |
* ... smaller is better
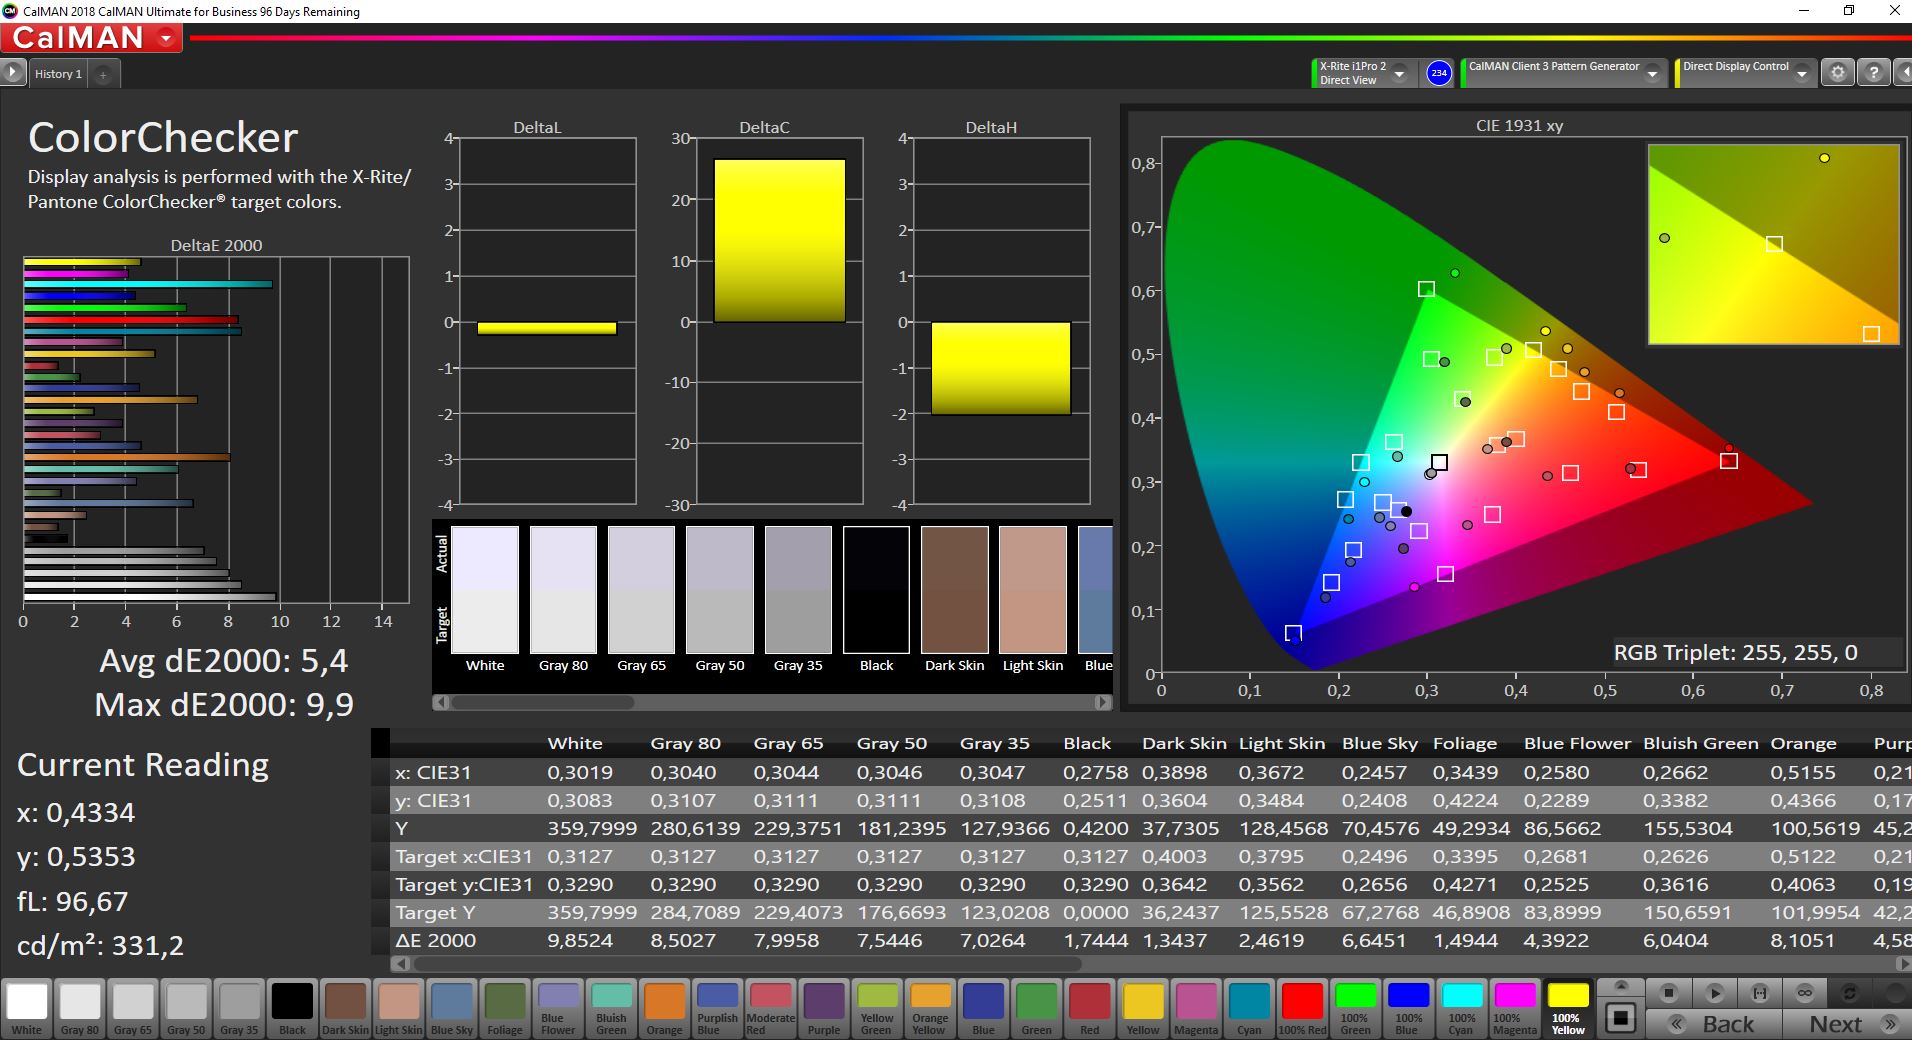
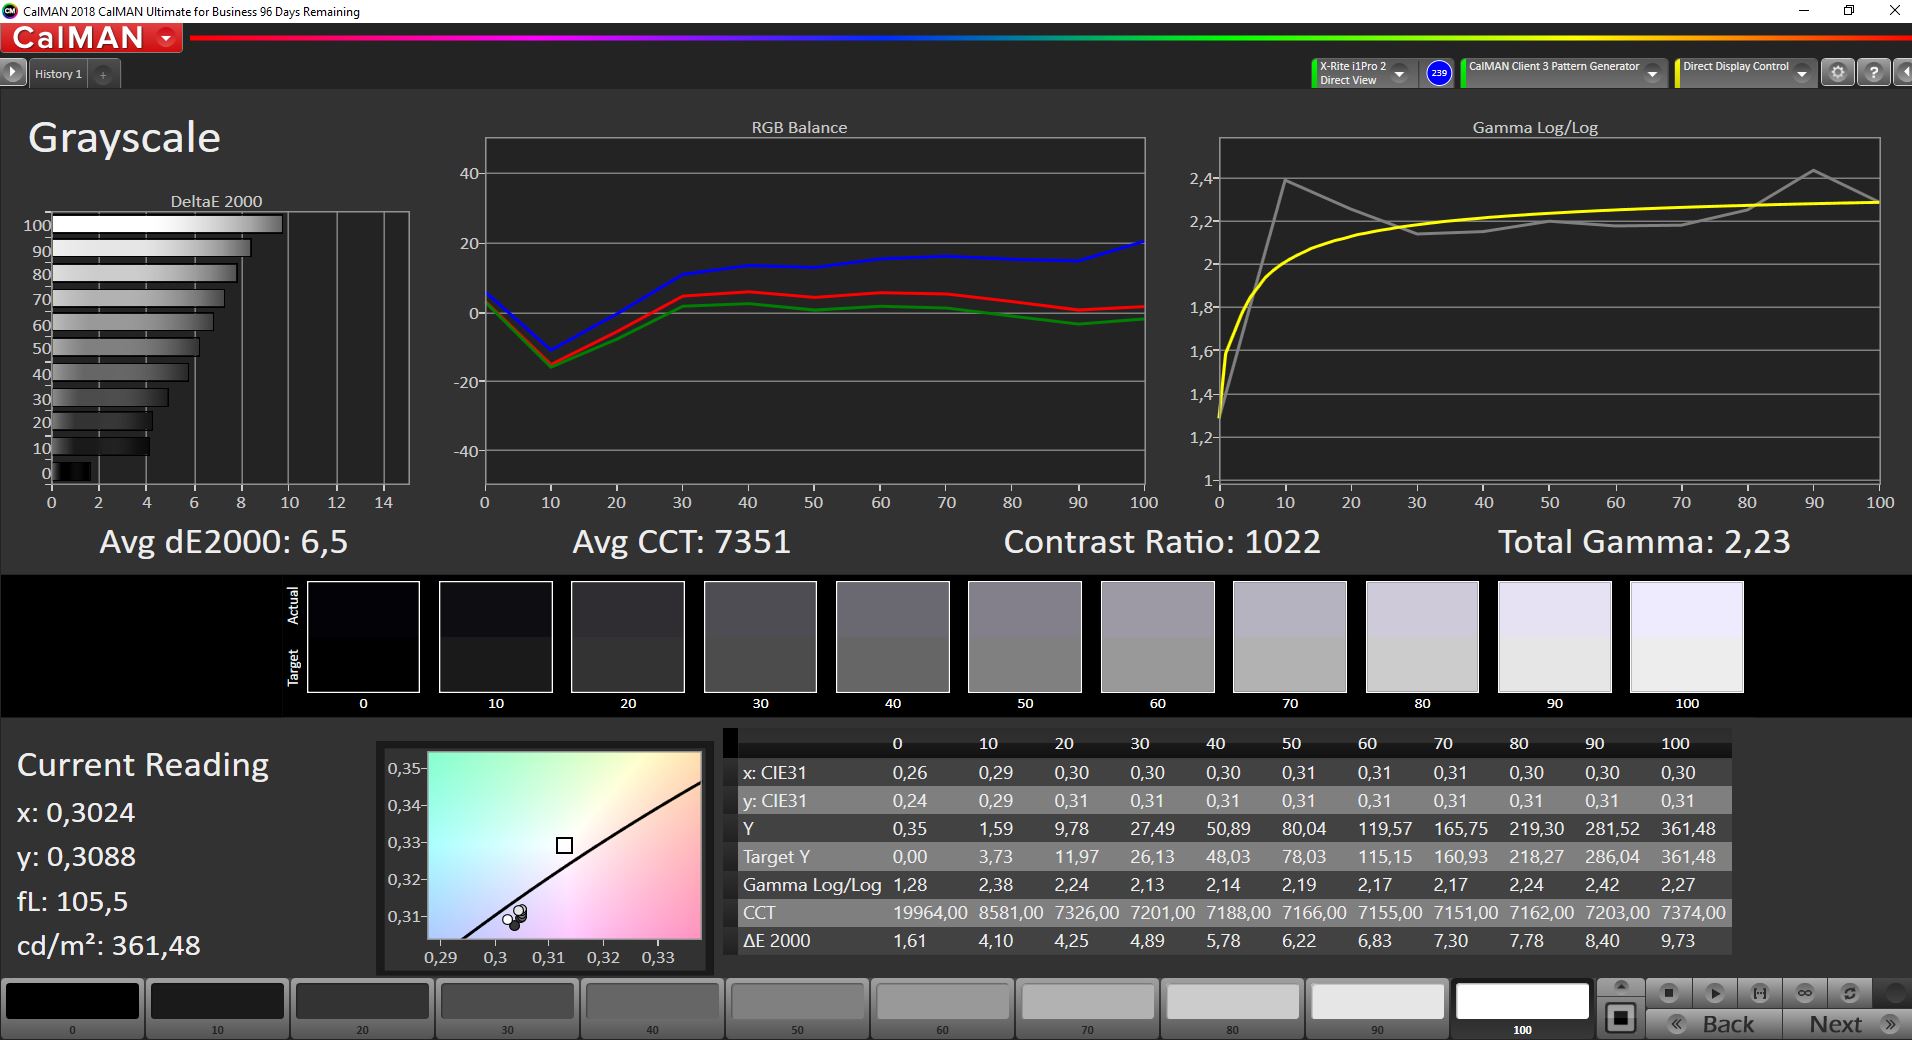
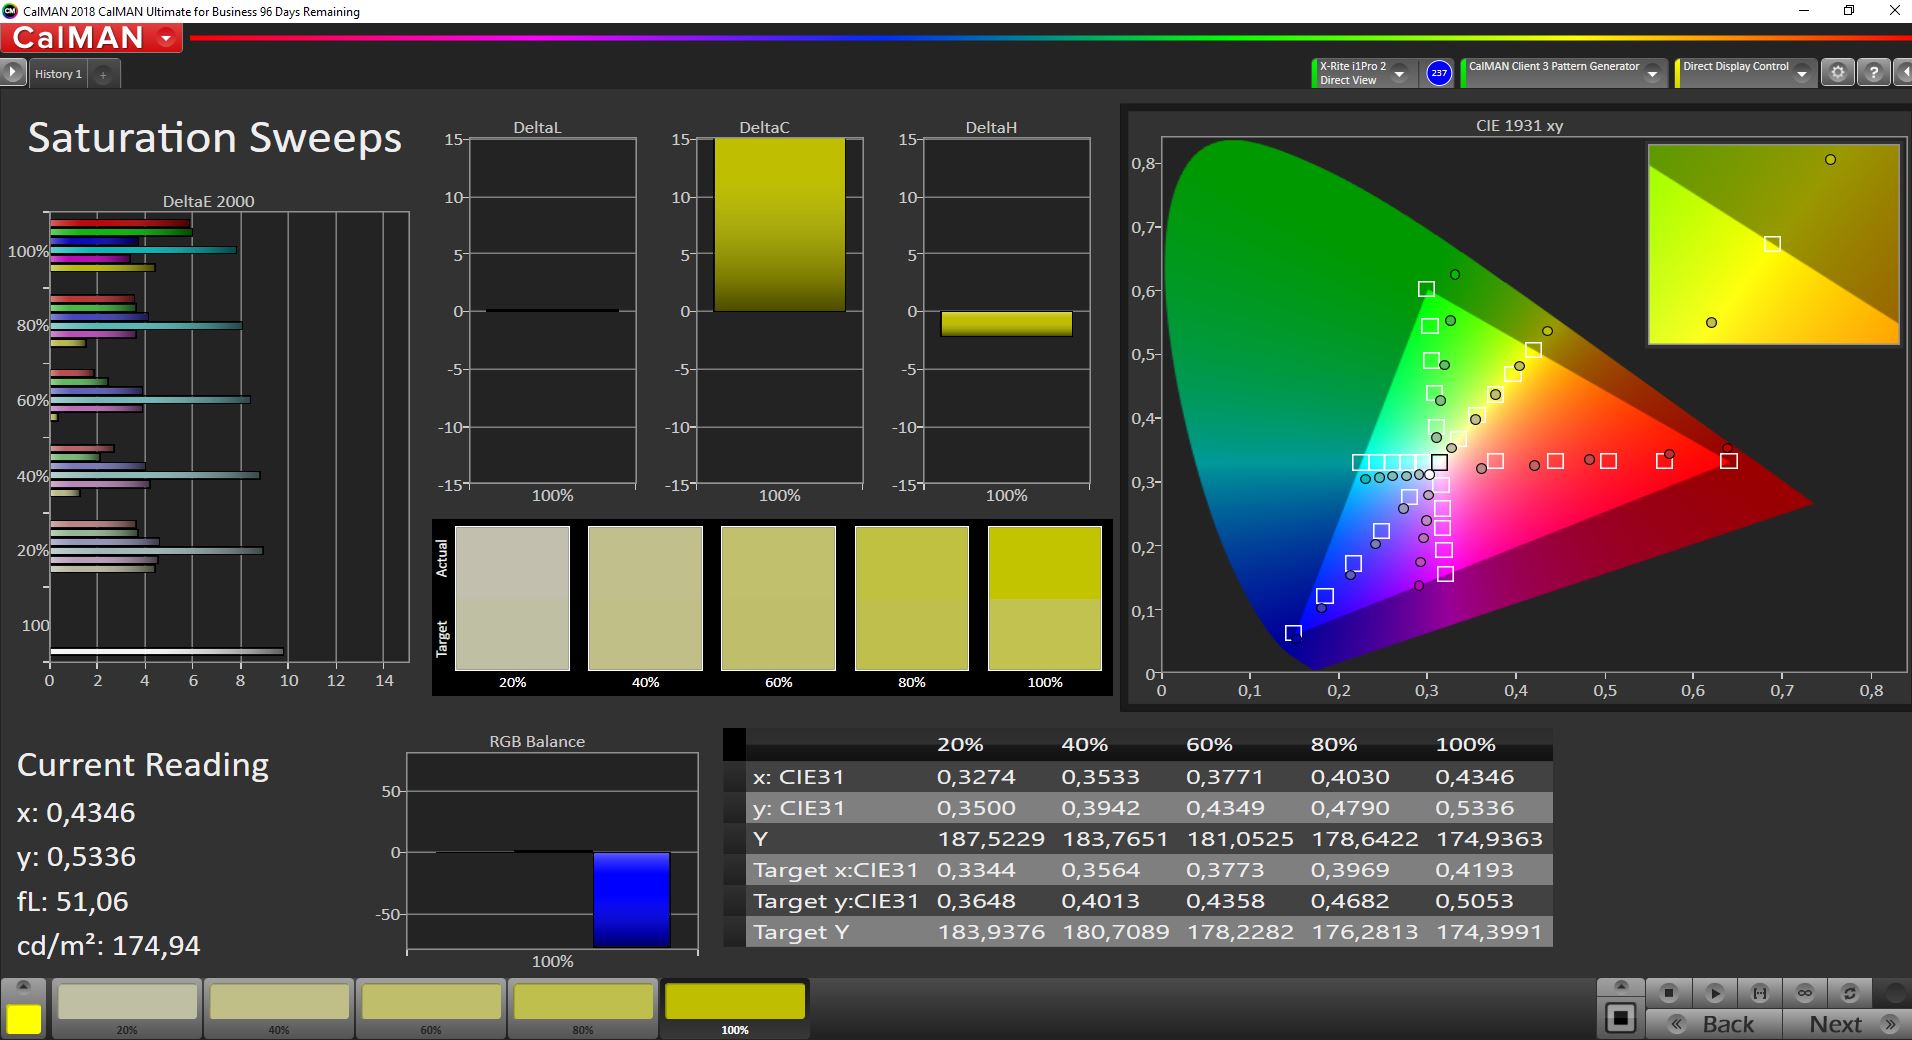

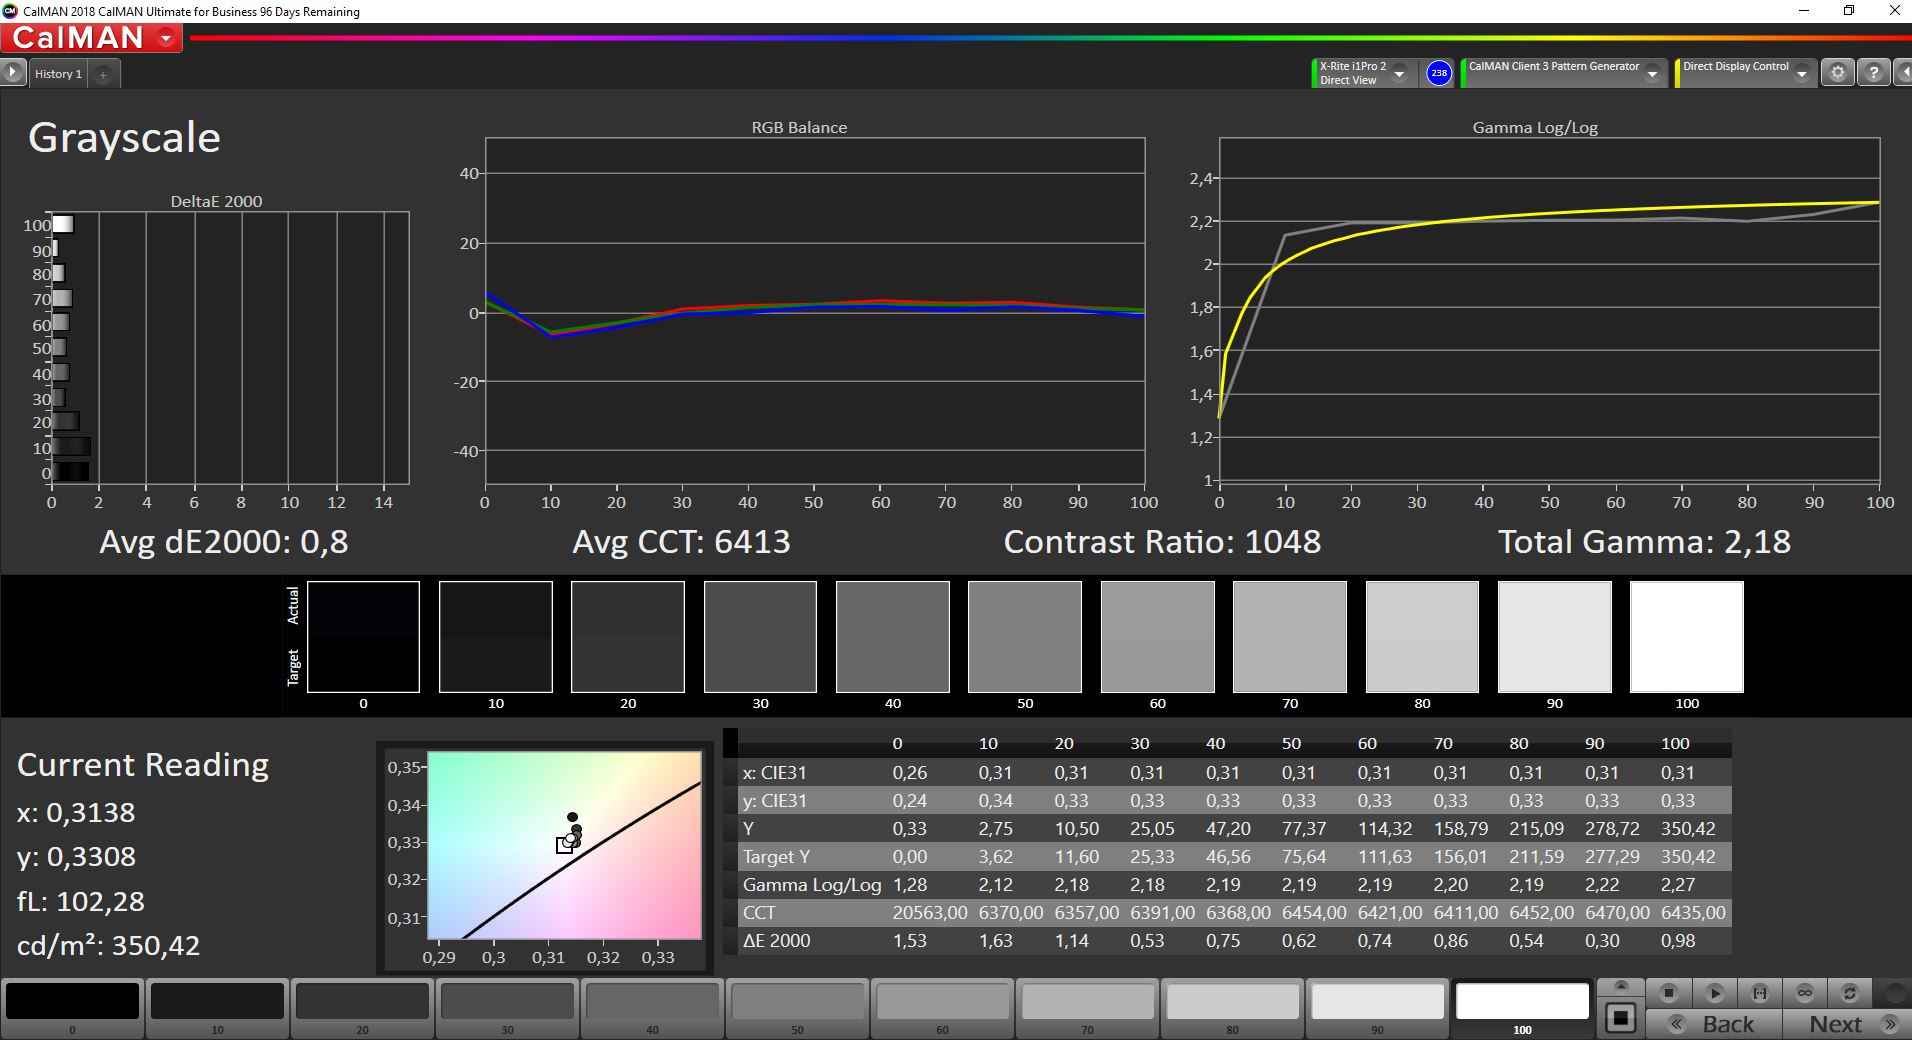
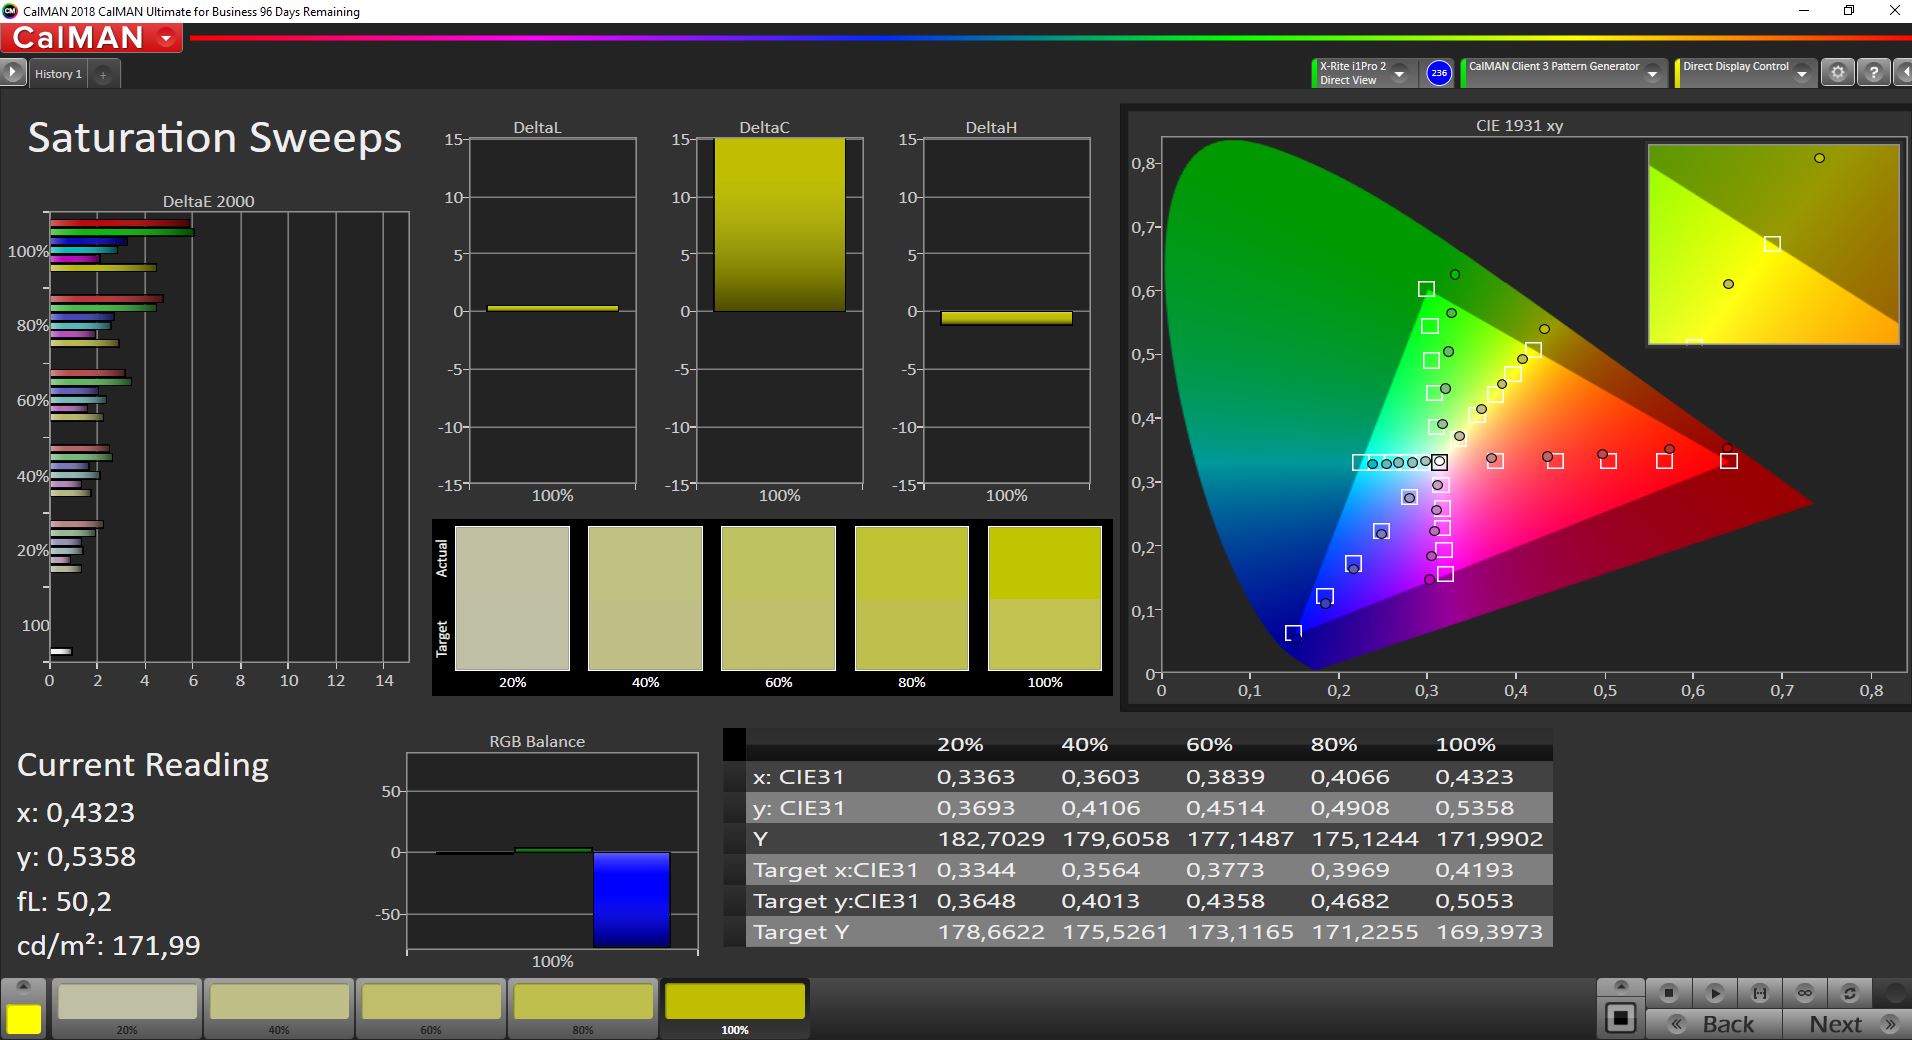
根据我们的X-Rite i1Pro 2色度计的CalMAN结果,LCD的色温在出厂时略微过冷。用X-Rite的iProfiler进行校准,大大改善了灰度,而颜色仍然不准确。即使有1031:1的对比度,也不能否认显示器的色彩准确性差。联想ThinkPad P17 G2的全高清显示屏并没有达到宣传的100%sRGB覆盖率。虽然87%并不是一个可怕的结果,但它绝对低于平均水平。对于专业的照片编辑,UHD液晶显示器应该是一个更好的选择。
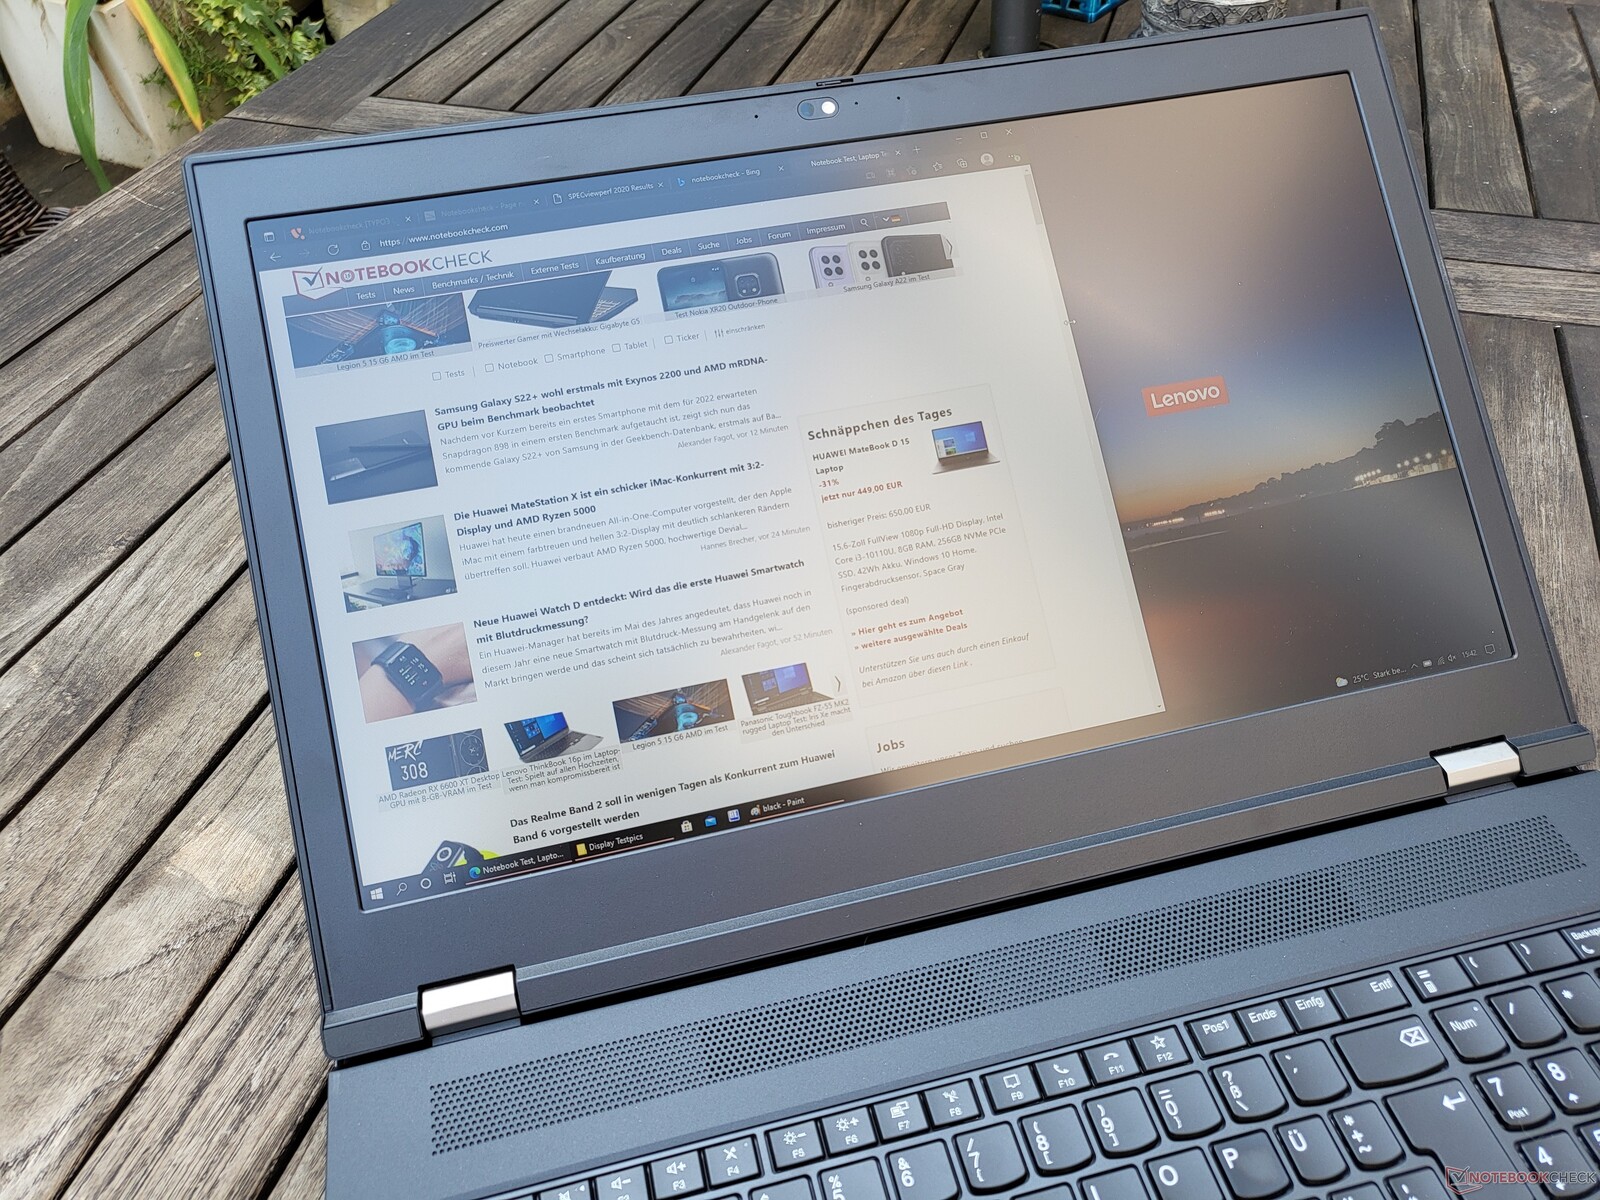
户外使用主要是通过屏幕的哑光层实现的。300尼特的亮度至少可以满足在阴凉处使用。
Display Response Times
| ↔ Response Time Black to White | ||
|---|---|---|
| 22.4 ms ... rise ↗ and fall ↘ combined | ↗ 11.6 ms rise | 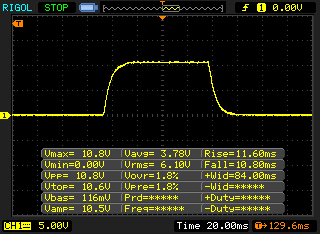 |
| ↘ 10.8 ms fall | ||
| The screen shows good response rates in our tests, but may be too slow for competitive gamers. In comparison, all tested devices range from 0.1 (minimum) to 240 (maximum) ms. » 51 % of all devices are better. This means that the measured response time is worse than the average of all tested devices (19.8 ms). | ||
| ↔ Response Time 50% Grey to 80% Grey | ||
| 39.2 ms ... rise ↗ and fall ↘ combined | ↗ 21.2 ms rise | 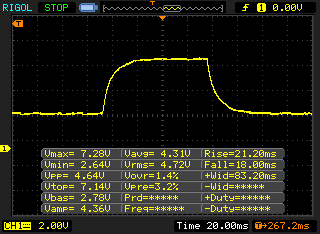 |
| ↘ 18 ms fall | ||
| The screen shows slow response rates in our tests and will be unsatisfactory for gamers. In comparison, all tested devices range from 0.165 (minimum) to 636 (maximum) ms. » 60 % of all devices are better. This means that the measured response time is worse than the average of all tested devices (31 ms). | ||
Screen Flickering / PWM (Pulse-Width Modulation)
| Screen flickering / PWM not detected | 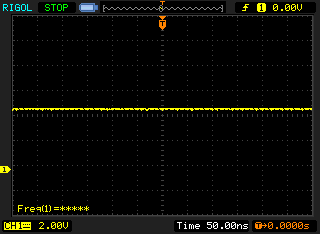 | ||
In comparison: 52 % of all tested devices do not use PWM to dim the display. If PWM was detected, an average of 7754 (minimum: 5 - maximum: 343500) Hz was measured. | |||
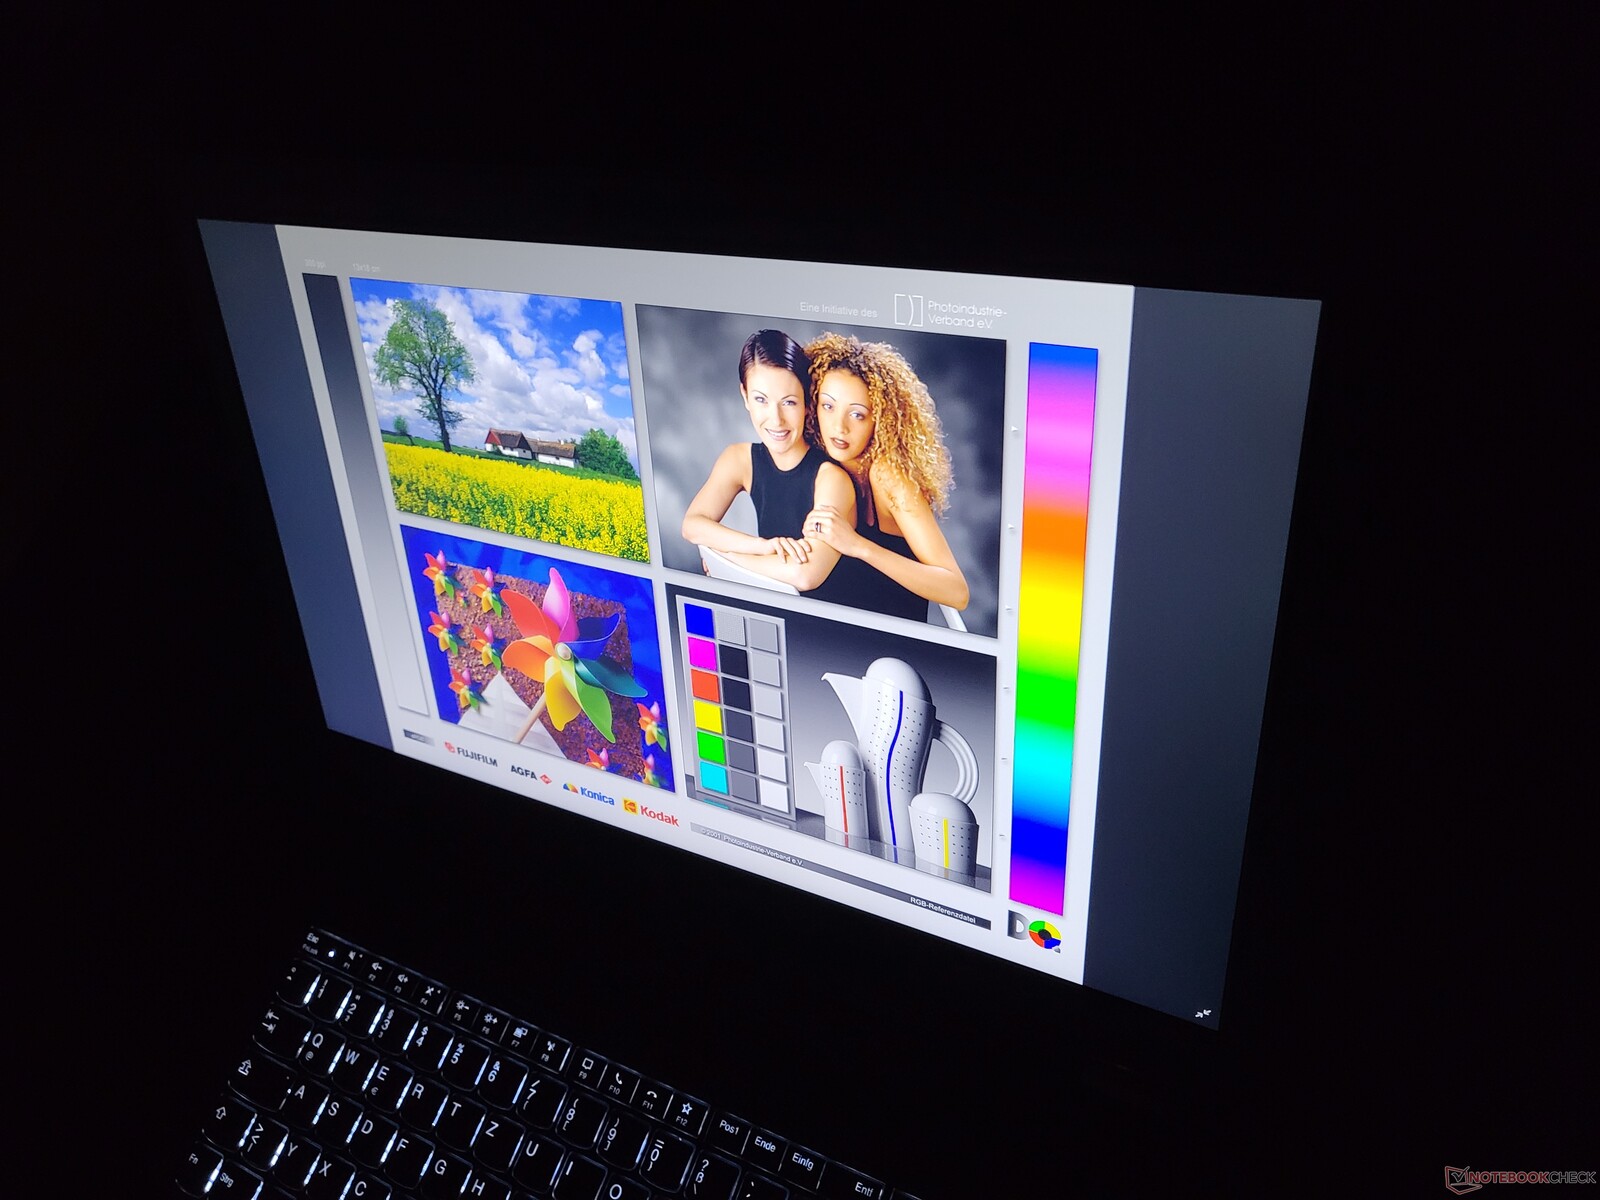
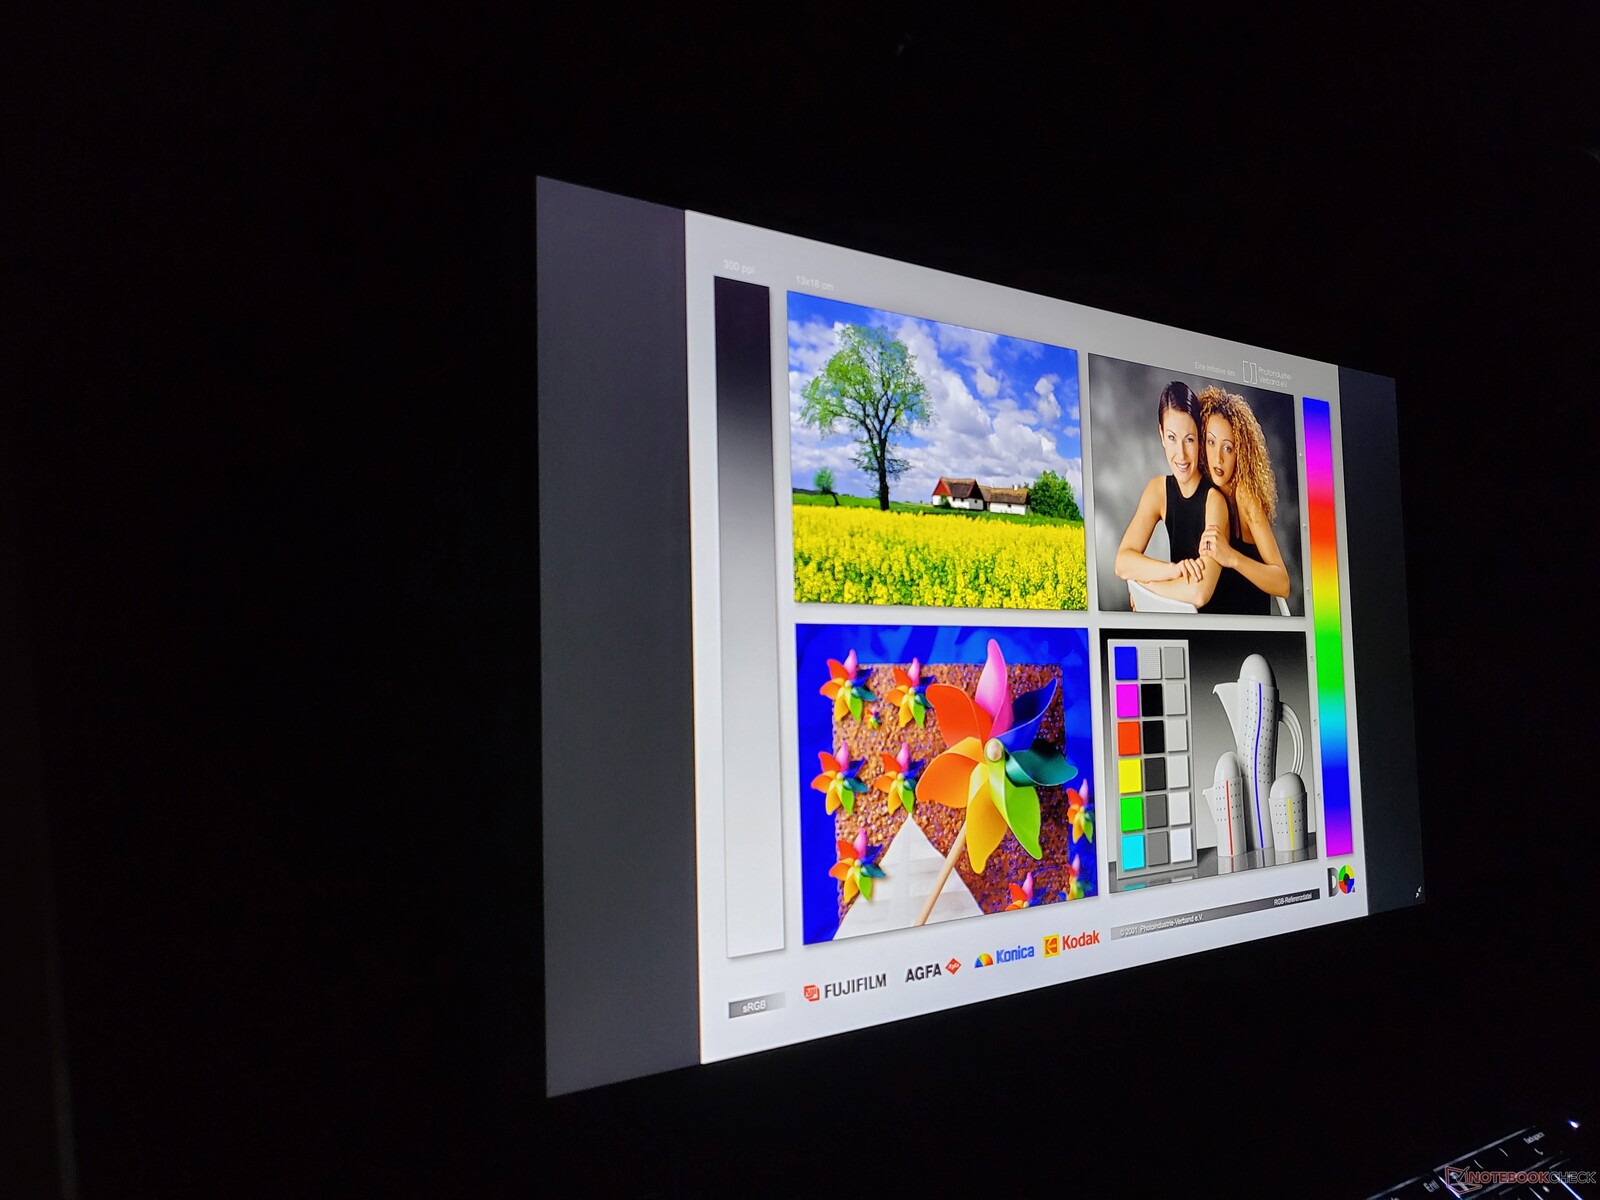
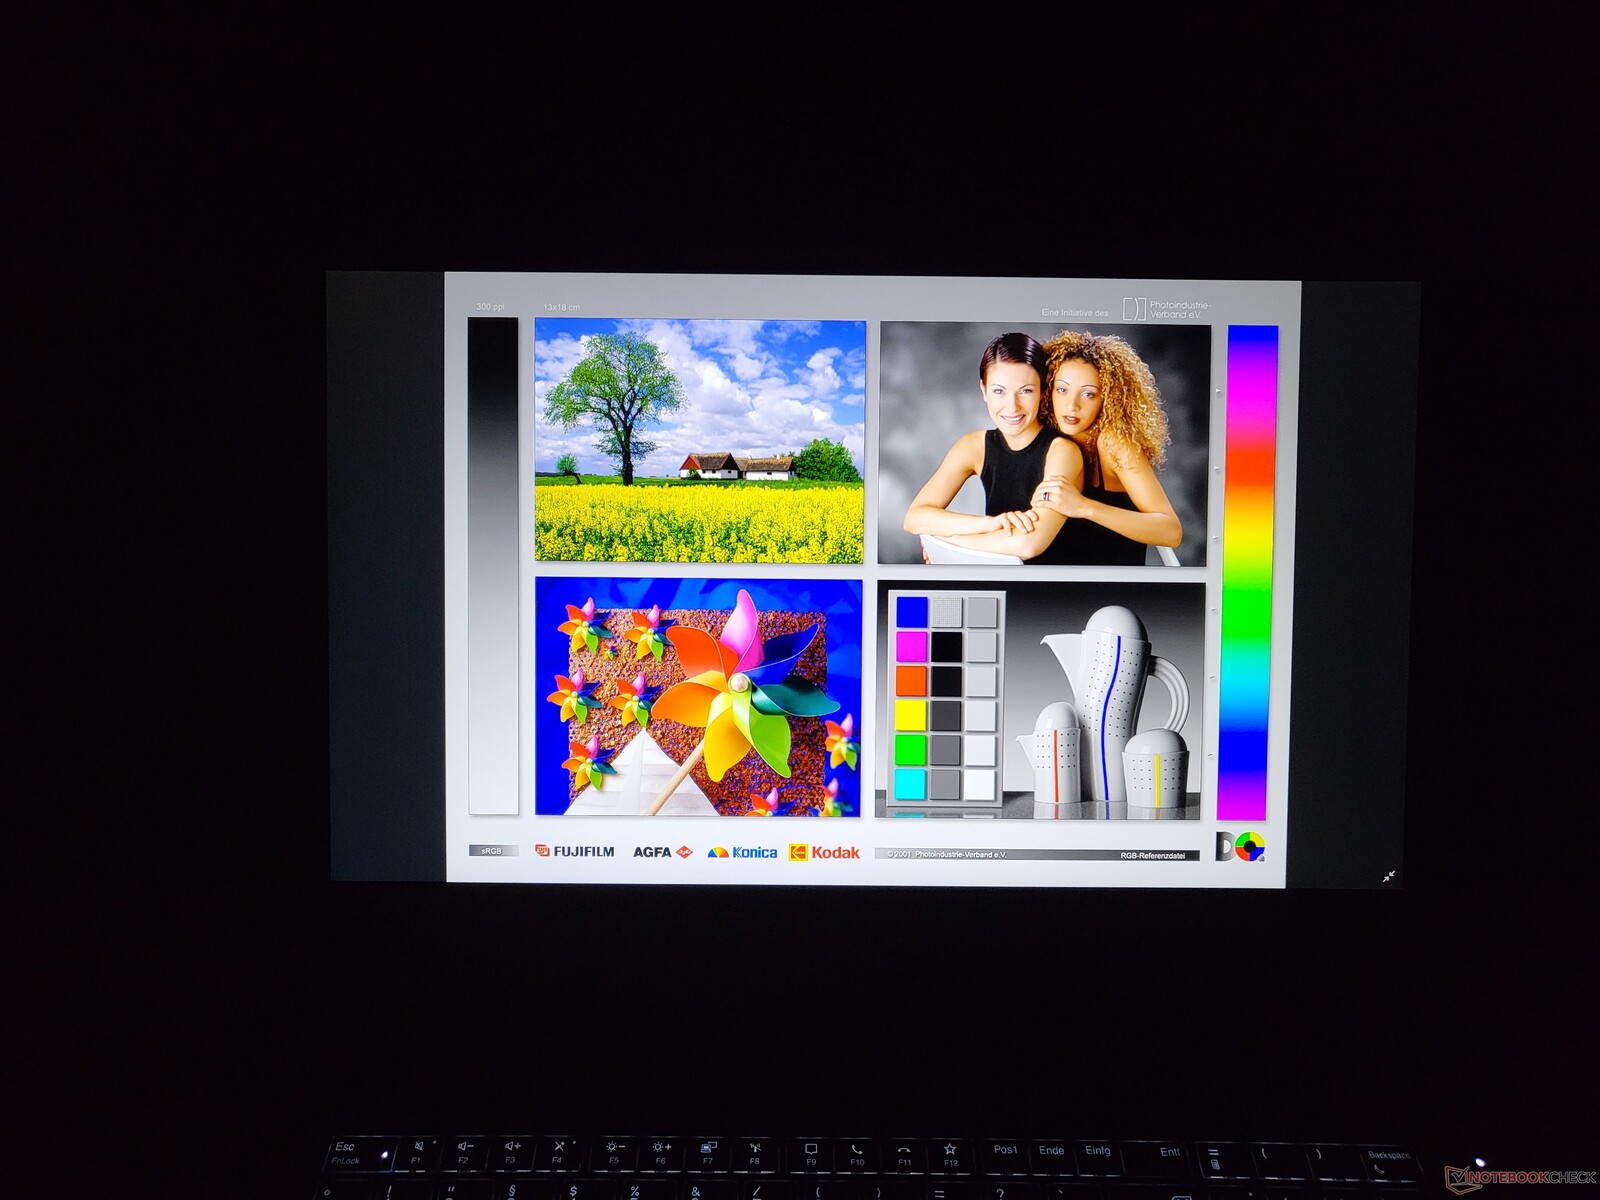
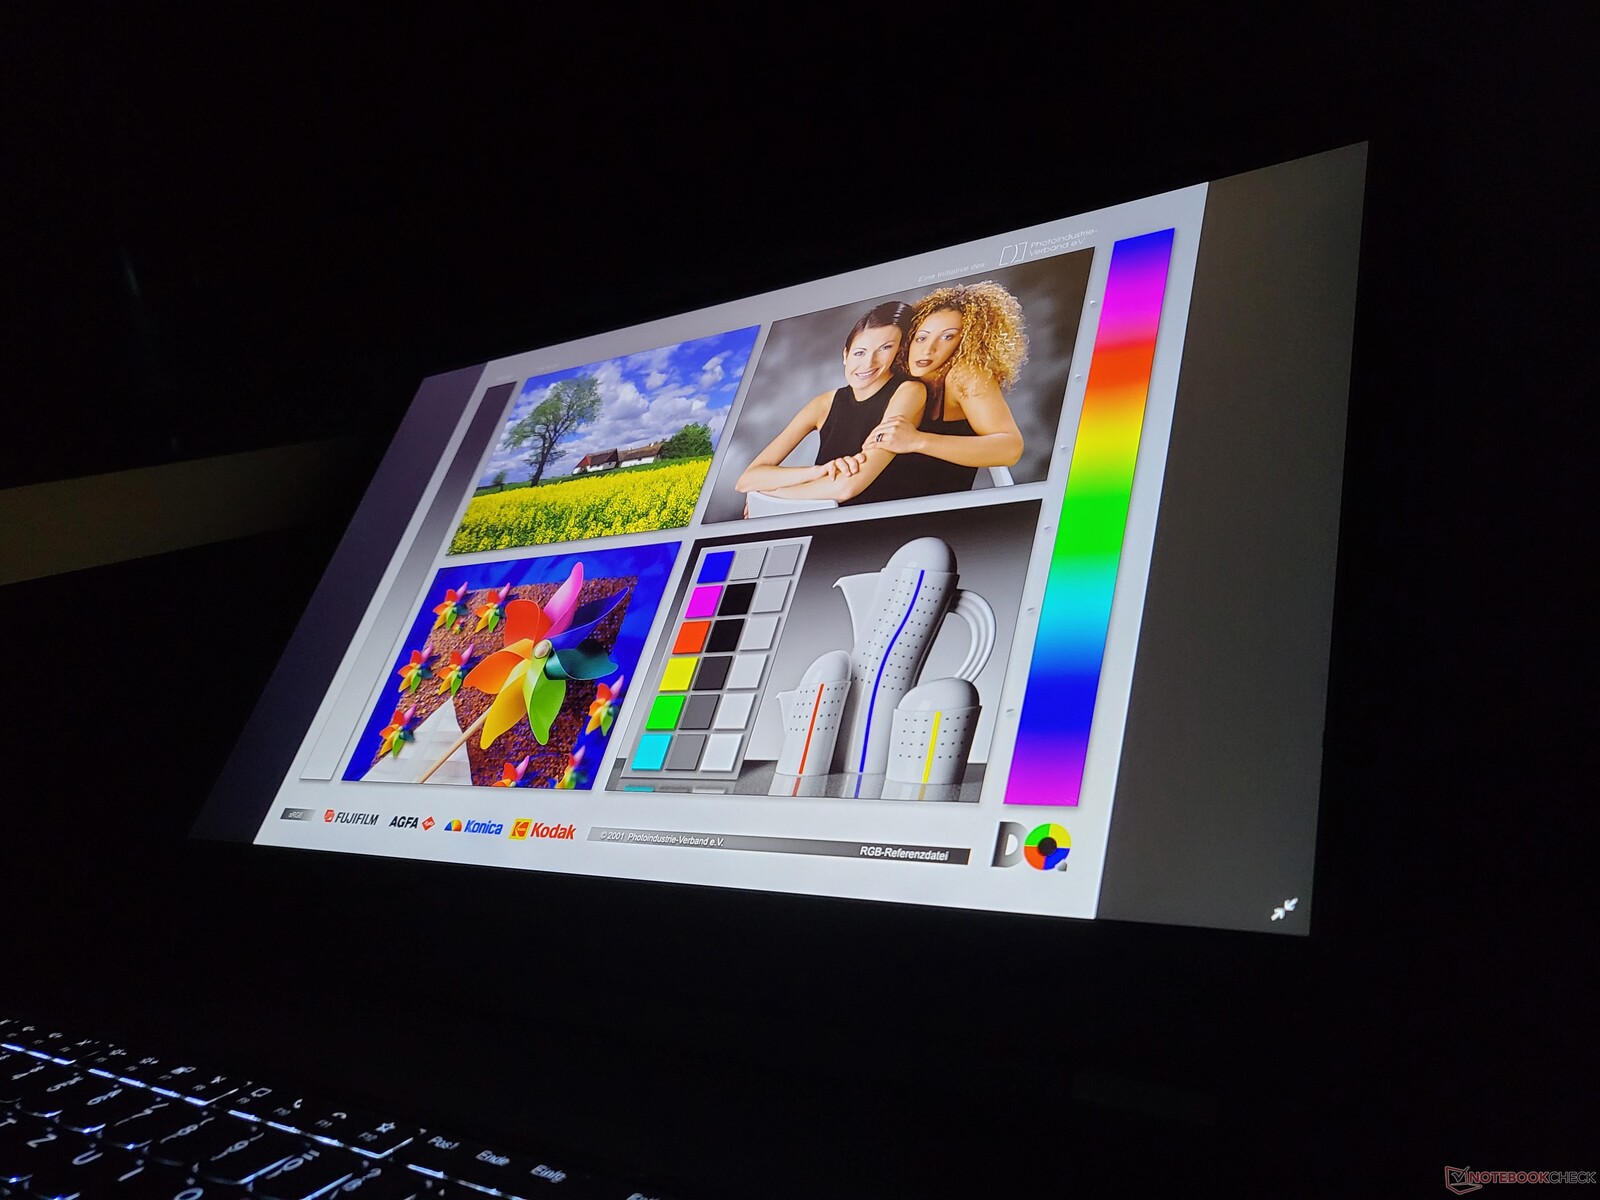
由于采用了基本的IPS技术,ThinkPad显示屏提供了很好的可视角度。
性能。联想ThinkPad P17 G2的得分很高
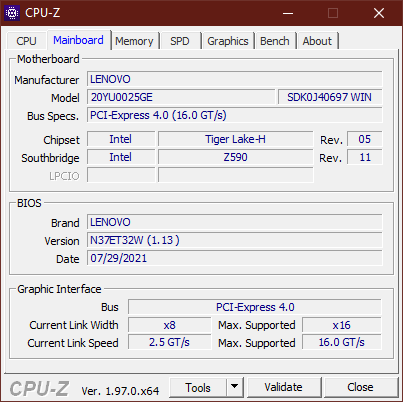
随着ThinkPad P17的推出,P系列变得比以往任何时候都更具可配置性,因为GPU占据了一个独立的子板。这允许任意的处理器和图形组合。可用的处理器如下。 酷睿i5-11500H, i7-11800H, i7-11850H, i9-11950H, Xeon W-11855M,以及 Xeon W-11955M.联想将这些CPU与 Nvidia T1200(60 W), Nvidia RTX A2000(60 W), RTX A3000(115 W),RTX A4000(115 W)或RTX A5000(115 W)。
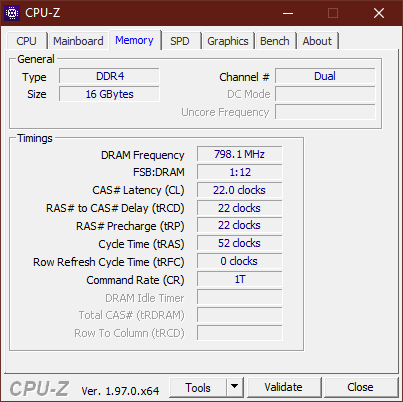
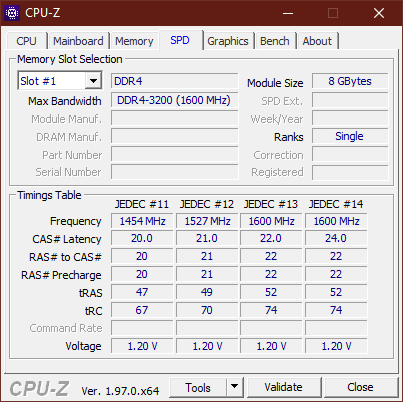
四个SODIMM插槽总共支持128GB的DDR4-3200内存,在配置至强选项时具有ECC功能。此外,联想ThinkPad P17第二代最多可以接受三块M.2-2280固态硬盘。
处理器
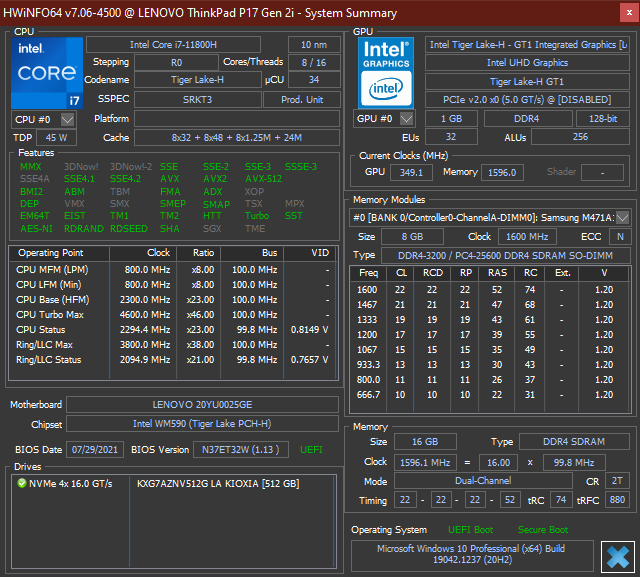
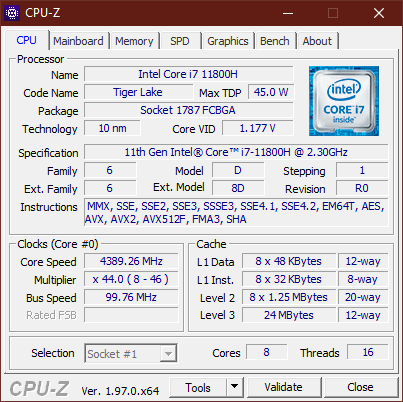
的 英特尔酷睿i7-11800H是英特尔第11代Tiger Lake 的H系列处理器,意味着10纳米的CPU终于被引入到ThinkPad P系列。H系列八核CPU的TDP为45W,时钟速度最高为4.6GHz。基本时钟位于2.3GHz。与其他处理器的比较可以在我们的 CPU比较页面.
联想ThinkPad P17 G2的最大功率限制被设定为出厂时的80瓦。在长时间的负载下,消耗量下降到70瓦,这仍然大大高于指定的TDP。高功率预算使我们的ThinkPad笔记本电脑在多线程性能方面轻松地超过了每一个采用老式英特尔CPU的竞争对手。同时,它的性能与 联想IdeaPad 5 Pro 16ACH差不多,后者配备的是AMD Cezanne-H CPU RyzenR7 5800H它需要更少的功率来达到相同的性能水平。
在电池模式下,CPU性能下降了约12%。
Cinebench R15 Multi Dauertest
Cinebench R23: Single Core | Multi Core
Cinebench R15: CPU Single 64Bit | CPU Multi 64Bit
Blender: v2.79 BMW27 CPU
7-Zip 18.03: 7z b 4 -mmt1 | 7z b 4
Geekbench 5.5: Single-Core | Multi-Core
HWBOT x265 Benchmark v2.2: 4k Preset
LibreOffice : 20 Documents To PDF
R Benchmark 2.5: Overall mean
| Cinebench R20 / CPU (Single Core) | |
| Average of class Workstation (671 - 857, n=23, last 2 years) | |
| Lenovo ThinkPad P17 G2-20YU0025G | |
| Average Intel Core i7-11800H (520 - 586, n=47) | |
| Lenovo IdeaPad 5 Pro 16ACH | |
| Dell Precision 5000 5750 P92F | |
| HP ZBook Fury 17 G7 119W5EA | |
| Asus ProArt StudioBook Pro 17 W700G3T | |
| Lenovo ThinkPad P73-20QR002DGE | |
| Cinebench R20 / CPU (Multi Core) | |
| Average of class Workstation (5760 - 15043, n=23, last 2 years) | |
| Lenovo ThinkPad P17 G2-20YU0025G | |
| Lenovo IdeaPad 5 Pro 16ACH | |
| Average Intel Core i7-11800H (2498 - 5408, n=50) | |
| Dell Precision 5000 5750 P92F | |
| HP ZBook Fury 17 G7 119W5EA | |
| Asus ProArt StudioBook Pro 17 W700G3T | |
| Lenovo ThinkPad P73-20QR002DGE | |
| Cinebench R23 / Single Core | |
| Average of class Workstation (1712 - 2228, n=23, last 2 years) | |
| Lenovo ThinkPad P17 G2-20YU0025G | |
| Average Intel Core i7-11800H (1386 - 1522, n=45) | |
| Lenovo IdeaPad 5 Pro 16ACH | |
| HP ZBook Fury 17 G7 119W5EA | |
| Cinebench R23 / Multi Core | |
| Average of class Workstation (14621 - 38520, n=23, last 2 years) | |
| Lenovo ThinkPad P17 G2-20YU0025G | |
| Lenovo IdeaPad 5 Pro 16ACH | |
| Average Intel Core i7-11800H (6508 - 14088, n=48) | |
| HP ZBook Fury 17 G7 119W5EA | |
| Cinebench R15 / CPU Single 64Bit | |
| Average of class Workstation (191.4 - 328, n=23, last 2 years) | |
| Lenovo ThinkPad P17 G2-20YU0025G | |
| Average Intel Core i7-11800H (201 - 231, n=46) | |
| Lenovo IdeaPad 5 Pro 16ACH | |
| Dell Precision 5000 5750 P92F | |
| HP ZBook Fury 17 G7 119W5EA | |
| Lenovo ThinkPad P73-20QR002DGE | |
| Asus ProArt StudioBook Pro 17 W700G3T | |
| Cinebench R15 / CPU Multi 64Bit | |
| Average of class Workstation (2489 - 5810, n=23, last 2 years) | |
| Lenovo ThinkPad P17 G2-20YU0025G | |
| Lenovo IdeaPad 5 Pro 16ACH | |
| Average Intel Core i7-11800H (1342 - 2173, n=50) | |
| Dell Precision 5000 5750 P92F | |
| HP ZBook Fury 17 G7 119W5EA | |
| Lenovo ThinkPad P73-20QR002DGE | |
| Asus ProArt StudioBook Pro 17 W700G3T | |
| Asus ProArt StudioBook Pro 17 W700G3T | |
| Blender / v2.79 BMW27 CPU | |
| Lenovo ThinkPad P73-20QR002DGE | |
| Asus ProArt StudioBook Pro 17 W700G3T | |
| HP ZBook Fury 17 G7 119W5EA | |
| Dell Precision 5000 5750 P92F | |
| Average Intel Core i7-11800H (217 - 454, n=46) | |
| Lenovo IdeaPad 5 Pro 16ACH | |
| Lenovo ThinkPad P17 G2-20YU0025G | |
| Average of class Workstation (91 - 222, n=23, last 2 years) | |
| 7-Zip 18.03 / 7z b 4 -mmt1 | |
| Average of class Workstation (5126 - 6960, n=23, last 2 years) | |
| HP ZBook Fury 17 G7 119W5EA | |
| Dell Precision 5000 5750 P92F | |
| Average Intel Core i7-11800H (5138 - 5732, n=46) | |
| Lenovo ThinkPad P17 G2-20YU0025G | |
| Lenovo IdeaPad 5 Pro 16ACH | |
| Lenovo ThinkPad P73-20QR002DGE | |
| Asus ProArt StudioBook Pro 17 W700G3T | |
| 7-Zip 18.03 / 7z b 4 | |
| Average of class Workstation (60489 - 116969, n=23, last 2 years) | |
| Lenovo IdeaPad 5 Pro 16ACH | |
| Lenovo ThinkPad P17 G2-20YU0025G | |
| Average Intel Core i7-11800H (33718 - 56758, n=46) | |
| Dell Precision 5000 5750 P92F | |
| HP ZBook Fury 17 G7 119W5EA | |
| Asus ProArt StudioBook Pro 17 W700G3T | |
| Lenovo ThinkPad P73-20QR002DGE | |
| Geekbench 5.5 / Single-Core | |
| Average of class Workstation (1783 - 2183, n=23, last 2 years) | |
| Average Intel Core i7-11800H (1429 - 1625, n=40) | |
| Lenovo ThinkPad P17 G2-20YU0025G | |
| Lenovo IdeaPad 5 Pro 16ACH | |
| Dell Precision 5000 5750 P92F | |
| HP ZBook Fury 17 G7 119W5EA | |
| Asus ProArt StudioBook Pro 17 W700G3T | |
| Lenovo ThinkPad P73-20QR002DGE | |
| Geekbench 5.5 / Multi-Core | |
| Average of class Workstation (11542 - 25554, n=23, last 2 years) | |
| Average Intel Core i7-11800H (4655 - 9851, n=40) | |
| Dell Precision 5000 5750 P92F | |
| Lenovo ThinkPad P17 G2-20YU0025G | |
| Lenovo IdeaPad 5 Pro 16ACH | |
| HP ZBook Fury 17 G7 119W5EA | |
| Asus ProArt StudioBook Pro 17 W700G3T | |
| Lenovo ThinkPad P73-20QR002DGE | |
| HWBOT x265 Benchmark v2.2 / 4k Preset | |
| Average of class Workstation (17.8 - 40.5, n=23, last 2 years) | |
| Lenovo ThinkPad P17 G2-20YU0025G | |
| Lenovo IdeaPad 5 Pro 16ACH | |
| Average Intel Core i7-11800H (7.38 - 17.4, n=46) | |
| Dell Precision 5000 5750 P92F | |
| HP ZBook Fury 17 G7 119W5EA | |
| Lenovo ThinkPad P73-20QR002DGE | |
| Asus ProArt StudioBook Pro 17 W700G3T | |
| LibreOffice / 20 Documents To PDF | |
| Asus ProArt StudioBook Pro 17 W700G3T | |
| HP ZBook Fury 17 G7 119W5EA | |
| Lenovo ThinkPad P17 G2-20YU0025G | |
| Average of class Workstation (37.1 - 74.7, n=23, last 2 years) | |
| Lenovo IdeaPad 5 Pro 16ACH | |
| Average Intel Core i7-11800H (38.6 - 59.9, n=45) | |
| Dell Precision 5000 5750 P92F | |
| R Benchmark 2.5 / Overall mean | |
| Asus ProArt StudioBook Pro 17 W700G3T | |
| HP ZBook Fury 17 G7 119W5EA | |
| Lenovo ThinkPad P17 G2-20YU0025G | |
| Dell Precision 5000 5750 P92F | |
| Average Intel Core i7-11800H (0.548 - 0.615, n=46) | |
| Lenovo IdeaPad 5 Pro 16ACH | |
| Average of class Workstation (0.3825 - 0.603, n=23, last 2 years) | |
* ... smaller is better
系统性能
正如预期的那样,高端硬件在PCMark 10中的表现异常出色。同样,日常性能也感觉很快。
| PCMark 10 / Score | |
| Average of class Workstation (6563 - 10409, n=19, last 2 years) | |
| Lenovo ThinkPad P17 G2-20YU0025G | |
| Average Intel Core i7-11800H, NVIDIA RTX A2000 Laptop GPU (n=1) | |
| Lenovo ThinkPad P73-20QR002DGE | |
| Dell Precision 5000 5750 P92F | |
| HP ZBook Fury 17 G7 119W5EA | |
| Asus ProArt StudioBook Pro 17 W700G3T | |
| PCMark 10 / Essentials | |
| Average of class Workstation (9622 - 11157, n=19, last 2 years) | |
| Dell Precision 5000 5750 P92F | |
| Lenovo ThinkPad P17 G2-20YU0025G | |
| Average Intel Core i7-11800H, NVIDIA RTX A2000 Laptop GPU (n=1) | |
| Lenovo ThinkPad P73-20QR002DGE | |
| Asus ProArt StudioBook Pro 17 W700G3T | |
| HP ZBook Fury 17 G7 119W5EA | |
| PCMark 10 / Productivity | |
| Average of class Workstation (8789 - 20616, n=19, last 2 years) | |
| Lenovo ThinkPad P17 G2-20YU0025G | |
| Average Intel Core i7-11800H, NVIDIA RTX A2000 Laptop GPU (n=1) | |
| Dell Precision 5000 5750 P92F | |
| Asus ProArt StudioBook Pro 17 W700G3T | |
| Lenovo ThinkPad P73-20QR002DGE | |
| HP ZBook Fury 17 G7 119W5EA | |
| PCMark 10 / Digital Content Creation | |
| Average of class Workstation (8108 - 15631, n=19, last 2 years) | |
| Lenovo ThinkPad P17 G2-20YU0025G | |
| Average Intel Core i7-11800H, NVIDIA RTX A2000 Laptop GPU (n=1) | |
| HP ZBook Fury 17 G7 119W5EA | |
| Lenovo ThinkPad P73-20QR002DGE | |
| Dell Precision 5000 5750 P92F | |
| Asus ProArt StudioBook Pro 17 W700G3T | |
| PCMark 10 Score | 6430 points | |
Help | ||
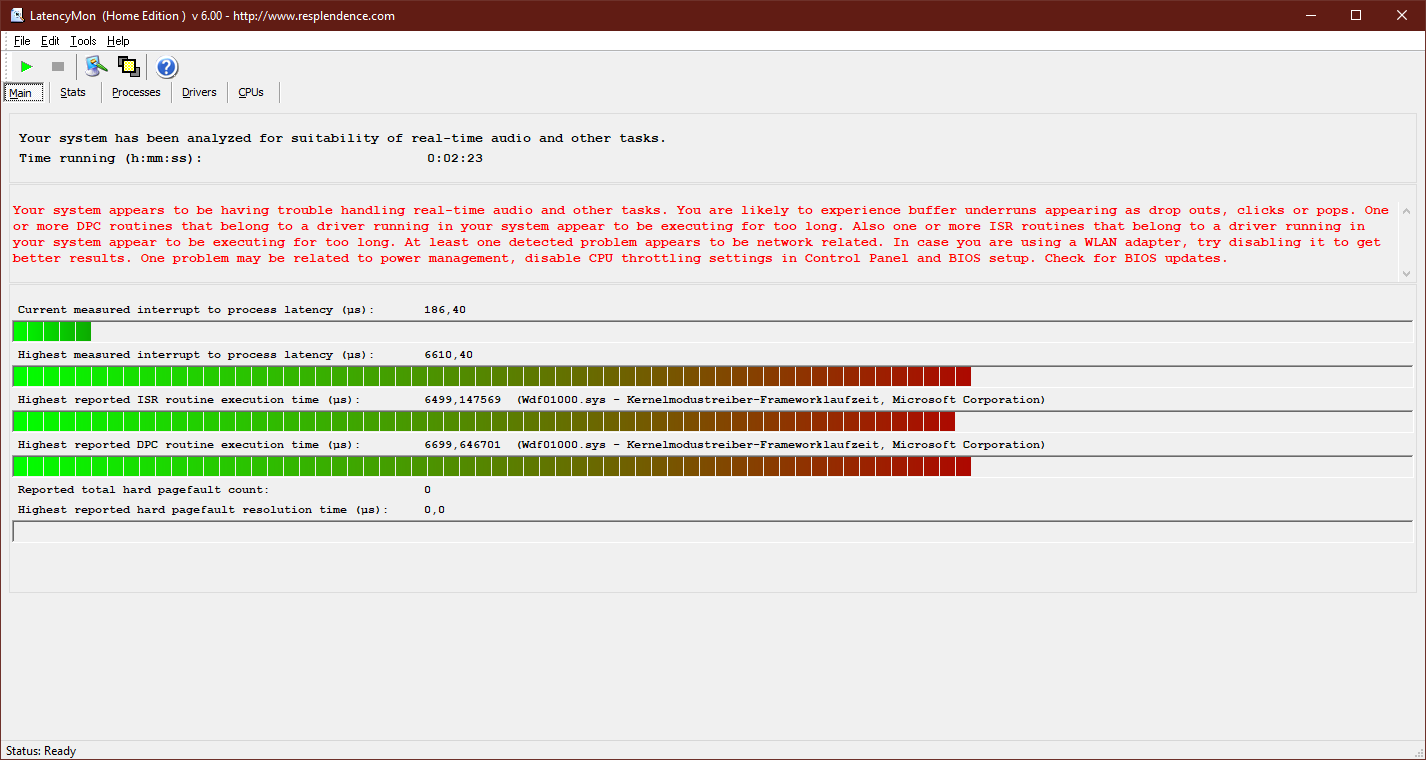
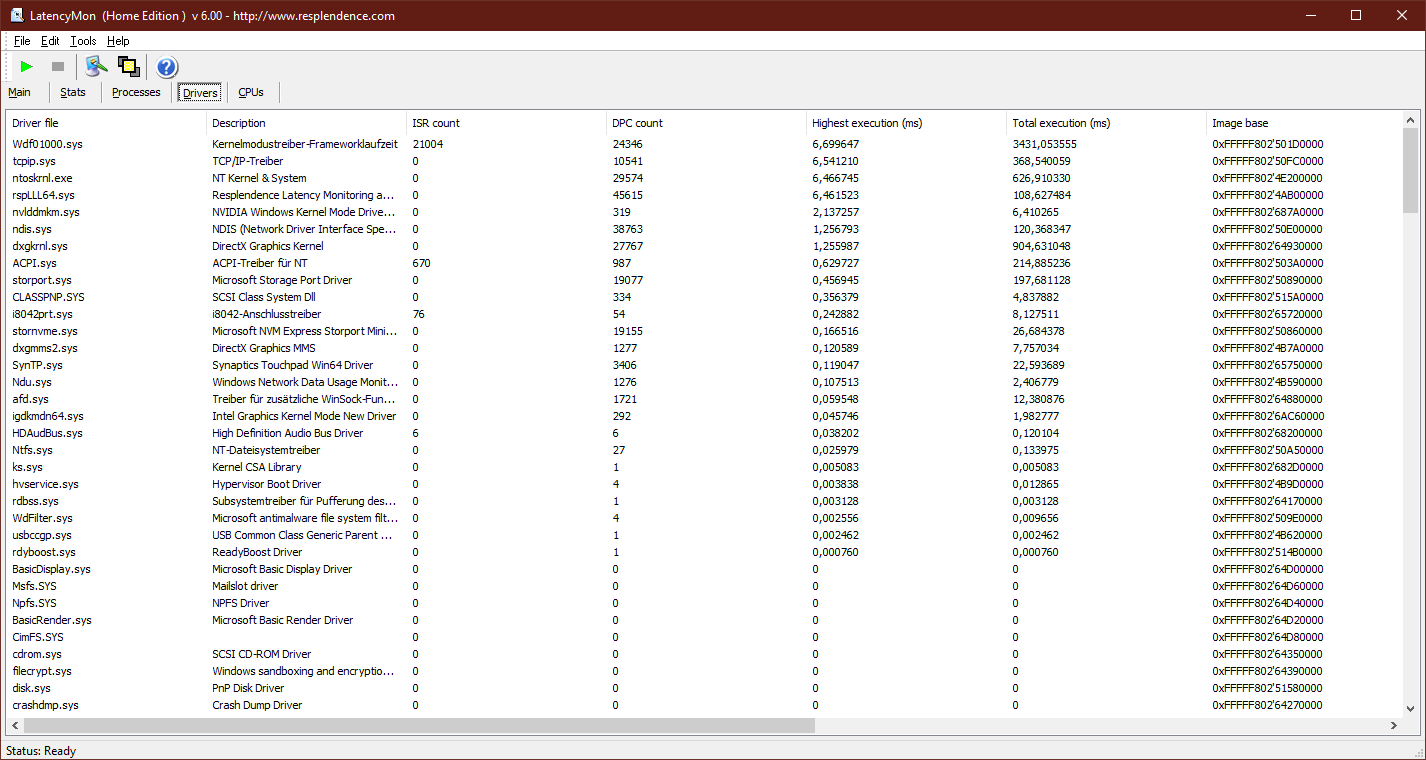
DPC延迟
不幸的是,联想ThinkPad P17 Gen 2显然在DPC延迟问题上挣扎。这可能会导致实时音频和视频编辑过程中的中断。唯一的解决办法是联想的驱动程序更新。
| DPC Latencies / LatencyMon - interrupt to process latency (max), Web, Youtube, Prime95 | |
| Lenovo ThinkPad P17 G2-20YU0025G | |
| HP ZBook Fury 17 G7 119W5EA | |
* ... smaller is better
存储解决方案
安装的512GB固态硬盘是由Kioxia制造的,以前被称为东芝内存。M.2-2280的Kioxia XG7固态硬盘比上一代的东芝XG6固态硬盘快。然而,这款NVMe PCIe 4.0固态硬盘不能完全匹配三星PM981。
| Lenovo ThinkPad P17 G2-20YU0025G Kioxia XG7 KXG7AZNV512G | Lenovo ThinkPad P73-20QR002DGE Intel SSD Pro 7600p SSDPEKKF512G8L | HP ZBook Fury 17 G7 119W5EA WDC PC SN730 SDBPNTY-1T00 | Dell Precision 5000 5750 P92F Toshiba Kioxia XG6 KXG60PNV1T02 | Asus ProArt StudioBook Pro 17 W700G3T Samsung SSD PM981 MZVLB1T0HALR | Average Kioxia XG7 KXG7AZNV512G | |
|---|---|---|---|---|---|---|
| AS SSD | -16% | 1% | -34% | 14% | 10% | |
| Seq Read (MB/s) | 3997 | 2693 -33% | 2423 -39% | 2025 -49% | 2958 -26% | 4551 ? 14% |
| Seq Write (MB/s) | 1049 | 1542 47% | 1203 15% | 1438 37% | 2350 124% | 1432 ? 37% |
| 4K Read (MB/s) | 44.96 | 62.6 39% | 42.24 -6% | 38.77 -14% | 56.6 26% | 46.2 ? 3% |
| 4K Write (MB/s) | 115.3 | 149.5 30% | 115.5 0% | 96.9 -16% | 106.1 -8% | 126.3 ? 10% |
| 4K-64 Read (MB/s) | 2160 | 871 -60% | 1630 -25% | 1105 -49% | 1836 -15% | 2136 ? -1% |
| 4K-64 Write (MB/s) | 1697 | 1006 -41% | 1979 17% | 1435 -15% | 1789 5% | 1700 ? 0% |
| Access Time Read * (ms) | 0.156 | 0.058 63% | 0.057 63% | 0.08 49% | 0.061 61% | 0.1105 ? 29% |
| Access Time Write * (ms) | 0.036 | 0.067 -86% | 0.033 8% | 0.116 -222% | 0.036 -0% | 0.033 ? 8% |
| Score Read (Points) | 2605 | 1203 -54% | 1915 -26% | 1347 -48% | 2189 -16% | 2638 ? 1% |
| Score Write (Points) | 1918 | 1309 -32% | 2215 15% | 1676 -13% | 2130 11% | 1970 ? 3% |
| Score Total (Points) | 5700 | 3088 -46% | 5047 -11% | 3686 -35% | 5411 -5% | 5793 ? 2% |
* ... smaller is better

Continuous read performance: DiskSpd Read Loop, Queue Depth 8
GPU性能
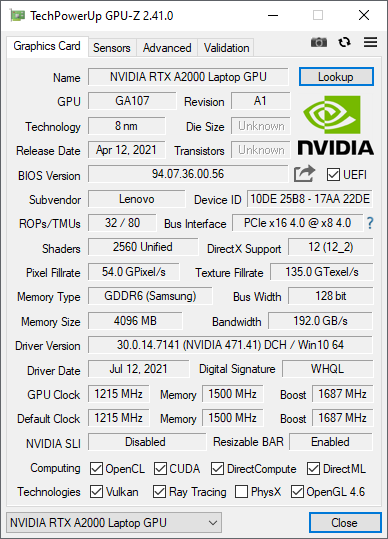
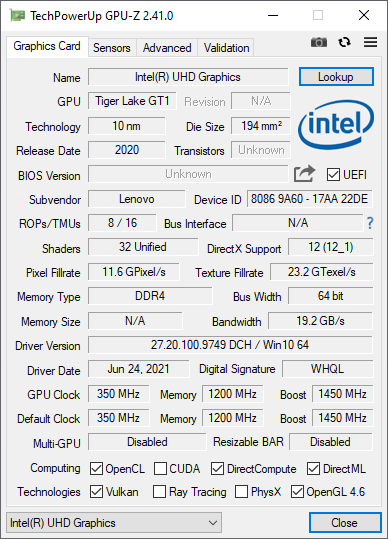
该 Nvidia RTX A2000是新的专业Nvidia GPU阵容的一部分,不再使用 "Quadro "名称。它基于Nvidia最新的安培架构,提供2560条流水线。与其他图形芯片的比较可以在我们专门的 GPU比较页面.
联想ThinkPad P17 G2的GPU可以通过128位总线访问4GB的专用GDDR6内存。联想笔记本电脑内的60瓦版本达到了一个可敬的性能水平,类似于 RTX 3000 Max-Q中的 戴尔Precision 5750中的RTX 3000 Max-Q,而比RTX 4000 Max-Q慢约20%。 RTX 4000 Max-Q中的 ZBook Fury 17这取决于基准测试。
在电池模式下,其性能受到严重限制。当没有连接到交流适配器时,GPU的性能下降了近40%。
| 3DMark 11 - 1280x720 Performance GPU | |
| Average of class Workstation (12535 - 69594, n=23, last 2 years) | |
| HP ZBook Fury 17 G7 119W5EA | |
| Dell Precision 5000 5750 P92F | |
| Lenovo ThinkPad P17 G2-20YU0025G | |
| Average NVIDIA RTX A2000 Laptop GPU (14831 - 19823, n=9) | |
| Lenovo ThinkPad P73-20QR002DGE | |
| Asus ProArt StudioBook Pro 17 W700G3T | |
| 3DMark | |
| 1920x1080 Fire Strike Graphics | |
| Average of class Workstation (8293 - 52560, n=23, last 2 years) | |
| HP ZBook Fury 17 G7 119W5EA | |
| Lenovo ThinkPad P17 G2-20YU0025G | |
| Dell Precision 5000 5750 P92F | |
| Lenovo ThinkPad P73-20QR002DGE | |
| Asus ProArt StudioBook Pro 17 W700G3T | |
| Average NVIDIA RTX A2000 Laptop GPU (10415 - 15988, n=9) | |
| 2560x1440 Time Spy Graphics | |
| Average of class Workstation (2725 - 24806, n=23, last 2 years) | |
| HP ZBook Fury 17 G7 119W5EA | |
| Lenovo ThinkPad P17 G2-20YU0025G | |
| Lenovo ThinkPad P73-20QR002DGE | |
| Dell Precision 5000 5750 P92F | |
| Average NVIDIA RTX A2000 Laptop GPU (4228 - 6108, n=9) | |
| Asus ProArt StudioBook Pro 17 W700G3T | |
| 3DMark 06 Standard Score | 36019 points | |
| 3DMark Vantage P Result | 63738 points | |
| 3DMark 11 Performance | 18193 points | |
| 3DMark Ice Storm Standard Score | 94347 points | |
| 3DMark Cloud Gate Standard Score | 42670 points | |
| 3DMark Fire Strike Score | 13170 points | |
| 3DMark Time Spy Score | 5904 points | |
Help | ||
游戏性能
联想ThinkPad P17 G2绝对不是为游戏而生,但游戏开发可能有意义。RTX A2000装备精良,可以处理现代游戏,尽管在最高设置下,在最新的游戏中实现稳定的60 FPS并不总是可能。对于4K游戏,建议使用更强大的联想ThinkPad P17 G2版本。
| The Witcher 3 - 1920x1080 High Graphics & Postprocessing (Nvidia HairWorks Off) | |
| Average of class Workstation (n=1last 2 years) | |
| HP ZBook Fury 17 G7 119W5EA | |
| Dell Precision 5000 5750 P92F | |
| Lenovo ThinkPad P73-20QR002DGE | |
| Asus ProArt StudioBook Pro 17 W700G3T | |
| Lenovo ThinkPad P17 G2-20YU0025G | |
| Average NVIDIA RTX A2000 Laptop GPU (45 - 108.6, n=9) | |
Witcher 3 FPS-Diagramm
| low | med. | high | ultra | |
|---|---|---|---|---|
| GTA V (2015) | 173 | 164 | 119 | 69.1 |
| The Witcher 3 (2015) | 256 | 160 | 95.8 | 54 |
| Dota 2 Reborn (2015) | 156 | 133 | 129 | 121 |
| Final Fantasy XV Benchmark (2018) | 131 | 76.3 | 51.6 | |
| X-Plane 11.11 (2018) | 115 | 97.9 | 78.5 | |
| Strange Brigade (2018) | 290 | 135 | 110 | 95.7 |
| Shadow of the Tomb Raider (2018) | 111 | 70.4 | 67.3 | 61.6 |
| Hunt Showdown (2020) | 169 | 81.2 | 68.6 | |
| Doom Eternal (2020) | 207 | 110 | ||
| Gears Tactics (2020) | 143 | 125 | 85.1 | 63.9 |
| Horizon Zero Dawn (2020) | 109 | 77.9 | 70.1 | 54.8 |
| Mafia Definitive Edition (2020) | 118 | 68.6 | 63.7 | |
| Outriders (2021) | 127 | 86.9 | 56 | |
| Days Gone (2021) | 123 | 85.5 | 76.6 | 57.7 |
| F1 2021 (2021) | 205 | 137 | 109 | 50.6 |
| Deathloop (2021) | 104 | 64.3 | 50.8 | 42.3 |
| New World (2021) | 83.2 | 68.6 | 63.5 | 52.4 |
排放。比ThinkPad P15 G2更少的热量和噪音
系统噪音
在空闲时,联想ThinkPad P17 G2的两个风扇都保持沉默。在我们的中值负载测试中,我们测得的最大噪音水平为38.1 dB(A),这已经相当明显了。在最大负荷下,风扇的速度进一步提高,在45 dB(A)时,接近可以承受的极限。至少,P17不会像其较小的兄弟姐妹那样吵闹,即 ThinkPad P15 G2它可以达到震耳欲聋的54.9分贝(A)。
我们没有注意到ThinkPad P17 G2的测试装置有任何线圈啸叫。
Noise level
| Idle |
| 26.4 / 26.4 / 26.4 dB(A) |
| Load |
| 38.1 / 45 dB(A) |
 | ||
30 dB silent 40 dB(A) audible 50 dB(A) loud |
||
min: | ||
温度
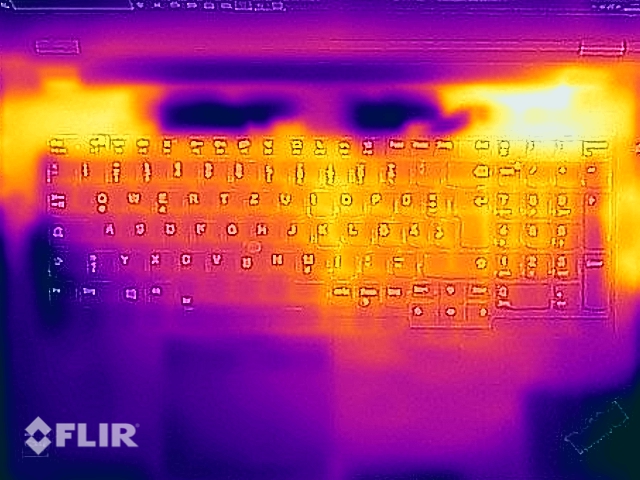
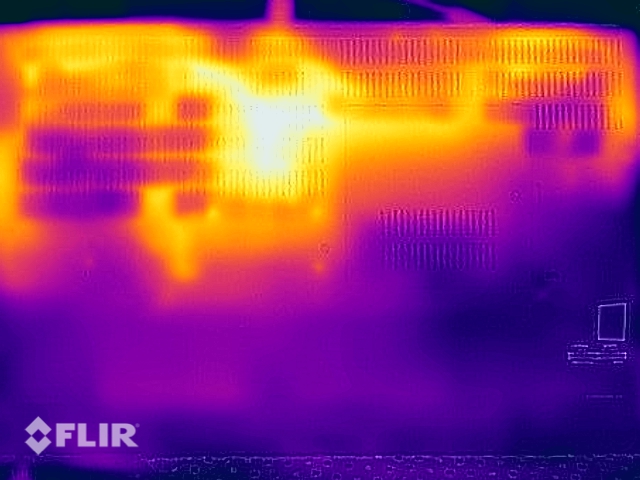
ThinkPad在空转时仍然很凉爽。在我们的压力测试中,热点位于底座的后角附近,而底部的热点则位于后角之间的中央。最热的记录温度是125.78°F。在我们的测试中,峰值温度为129.56°F,甚至更高。 Witcher 3测试中的峰值温度甚至更高。
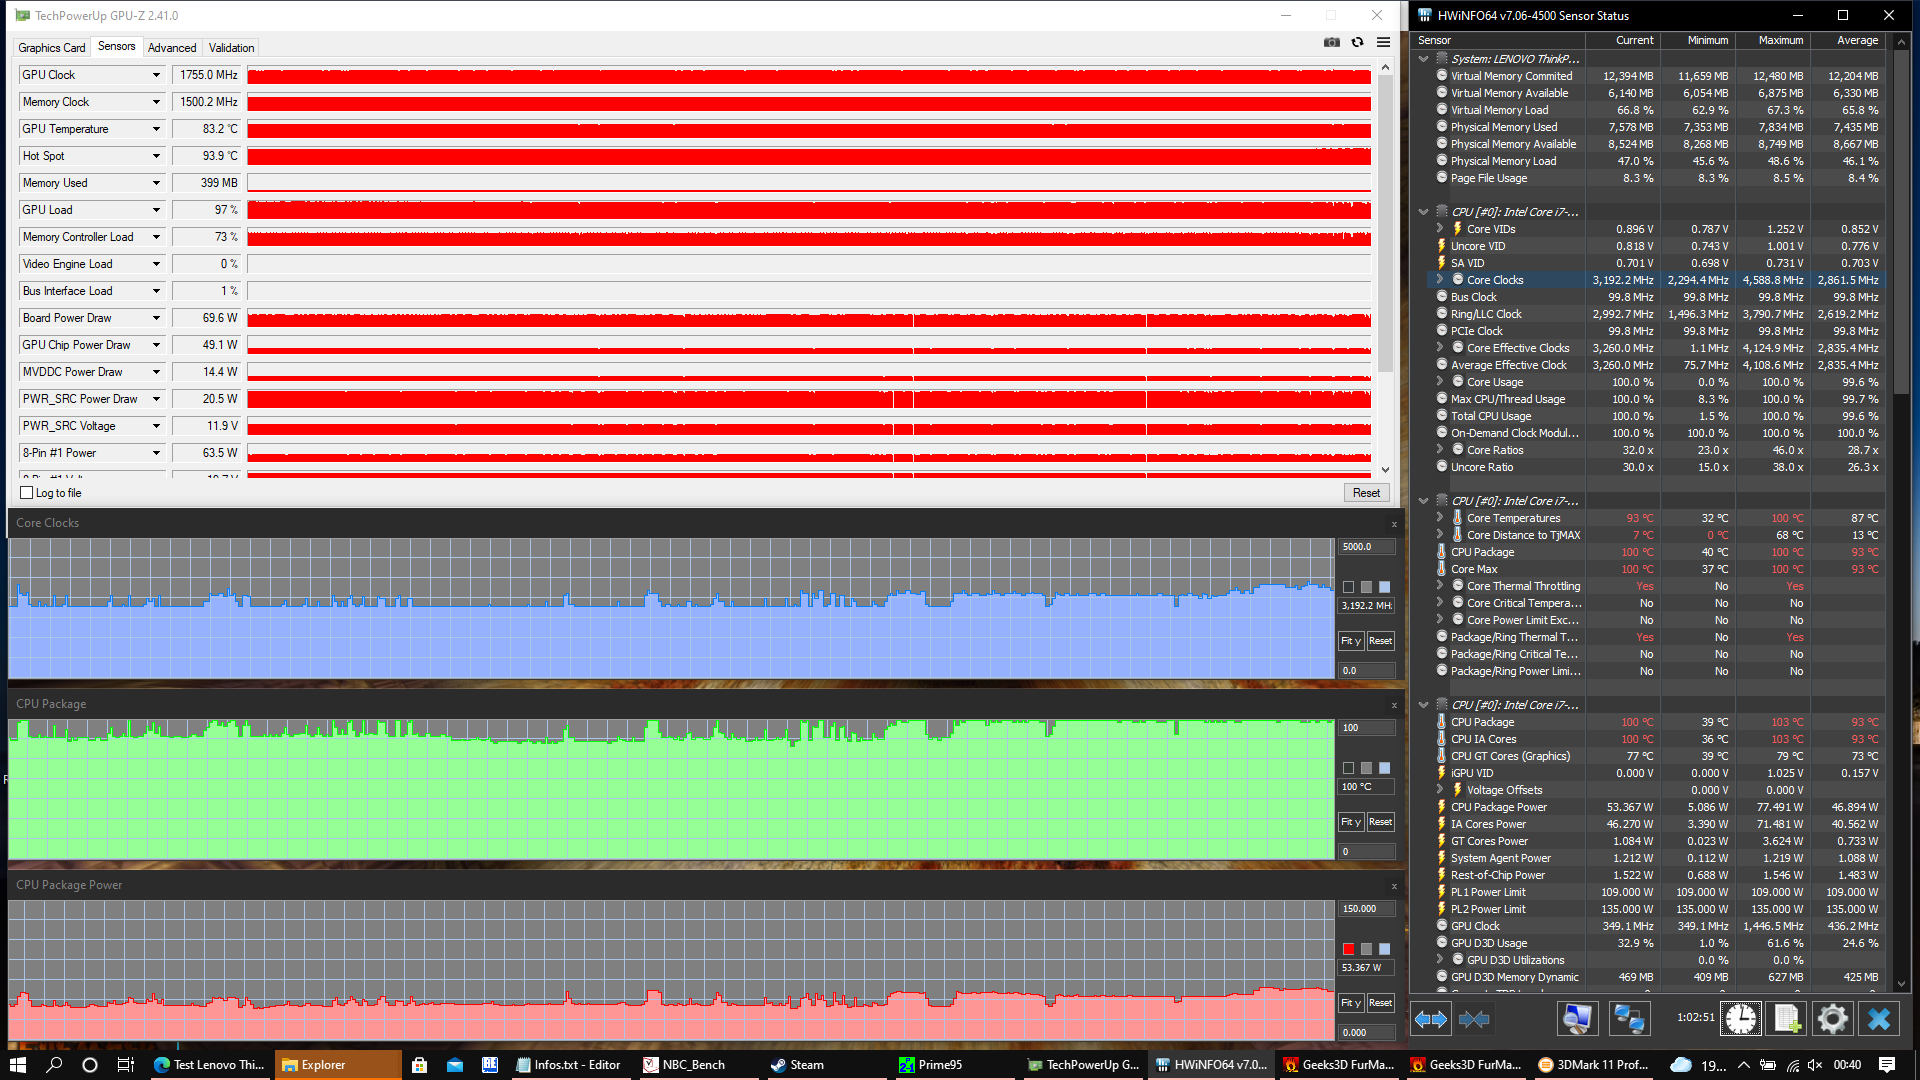
在压力测试期间,CPU和GPU的性能都要下降。一小时后,GPU的功耗停留在50瓦,而处理器的功率极限也在50瓦左右波动。尽管联想ThinkPad P17 G2随后不再以最大速度运行,但时钟速度仍然相对较高。在压力测试后直接进行的3DMark并没有产生明显的低分。在日常使用中,节流应该不会成为ThinkPad P17 G2用户的一个问题。
(-) The maximum temperature on the upper side is 49.6 °C / 121 F, compared to the average of 38.2 °C / 101 F, ranging from 22.2 to 69.8 °C for the class Workstation.
(-) The bottom heats up to a maximum of 52.1 °C / 126 F, compared to the average of 41.1 °C / 106 F
(+) In idle usage, the average temperature for the upper side is 25.3 °C / 78 F, compared to the device average of 32 °C / 90 F.
(±) Playing The Witcher 3, the average temperature for the upper side is 34.8 °C / 95 F, compared to the device average of 32 °C / 90 F.
(+) The palmrests and touchpad are cooler than skin temperature with a maximum of 30 °C / 86 F and are therefore cool to the touch.
(-) The average temperature of the palmrest area of similar devices was 27.8 °C / 82 F (-2.2 °C / -4 F).
发言人
与前代产品一样,联想将立体声扬声器置于ThinkPad P17 G2的键盘上方。虽然它们在低音、音量和平衡方面有所欠缺,但至少比上一代的同类产品要响亮。 联想ThinkPad P73.
然而,无论你选择扬声器还是耳机,外部解决方案都是首选。专用的3.5毫米音频插孔可以完美地工作。
Lenovo ThinkPad P17 G2-20YU0025G audio analysis
(±) | speaker loudness is average but good (76.6 dB)
Bass 100 - 315 Hz
(±) | reduced bass - on average 14.5% lower than median
(±) | linearity of bass is average (9.6% delta to prev. frequency)
Mids 400 - 2000 Hz
(±) | higher mids - on average 6.9% higher than median
(±) | linearity of mids is average (7.7% delta to prev. frequency)
Highs 2 - 16 kHz
(+) | balanced highs - only 2.6% away from median
(+) | highs are linear (6.6% delta to prev. frequency)
Overall 100 - 16.000 Hz
(±) | linearity of overall sound is average (20.1% difference to median)
Compared to same class
» 71% of all tested devices in this class were better, 6% similar, 23% worse
» The best had a delta of 7%, average was 17%, worst was 35%
Compared to all devices tested
» 52% of all tested devices were better, 8% similar, 40% worse
» The best had a delta of 4%, average was 23%, worst was 134%
HP ZBook Fury 17 G7 119W5EA audio analysis
(±) | speaker loudness is average but good (78.6 dB)
Bass 100 - 315 Hz
(±) | reduced bass - on average 7.9% lower than median
(±) | linearity of bass is average (11.1% delta to prev. frequency)
Mids 400 - 2000 Hz
(+) | balanced mids - only 2.8% away from median
(+) | mids are linear (3.9% delta to prev. frequency)
Highs 2 - 16 kHz
(+) | balanced highs - only 2.7% away from median
(+) | highs are linear (4.8% delta to prev. frequency)
Overall 100 - 16.000 Hz
(+) | overall sound is linear (10.9% difference to median)
Compared to same class
» 11% of all tested devices in this class were better, 4% similar, 85% worse
» The best had a delta of 7%, average was 17%, worst was 35%
Compared to all devices tested
» 6% of all tested devices were better, 2% similar, 92% worse
» The best had a delta of 4%, average was 23%, worst was 134%
Lenovo ThinkPad P73-20QR002DGE audio analysis
(-) | not very loud speakers (70.2 dB)
Bass 100 - 315 Hz
(±) | reduced bass - on average 14.5% lower than median
(±) | linearity of bass is average (14% delta to prev. frequency)
Mids 400 - 2000 Hz
(±) | higher mids - on average 7.3% higher than median
(+) | mids are linear (5.1% delta to prev. frequency)
Highs 2 - 16 kHz
(±) | reduced highs - on average 5.1% lower than median
(±) | linearity of highs is average (8% delta to prev. frequency)
Overall 100 - 16.000 Hz
(±) | linearity of overall sound is average (29.3% difference to median)
Compared to same class
» 96% of all tested devices in this class were better, 1% similar, 3% worse
» The best had a delta of 7%, average was 17%, worst was 35%
Compared to all devices tested
» 87% of all tested devices were better, 3% similar, 10% worse
» The best had a delta of 4%, average was 23%, worst was 134%
能源管理。小电池满足低耗能
能源消耗
联想ThinkPad P17 G2是我们比较中唯一配备最新的Tiger Lake CPU的17英寸工作站。似乎更高效的10纳米芯片消耗的功率略低,因为FHD和4K竞争对手在空闲时都会消耗更多的功率。
专有的细长型交流适配器的额定功率为170瓦。这几乎与联想ThinkPad P17 G2在负载下的消耗完全一致。由于这个原因,更强大的P17第二代机型配备了更大的230瓦交流适配器。
| Off / Standby | |
| Idle | |
| Load |
|
Key:
min: | |
| Lenovo ThinkPad P17 G2-20YU0025G i7-11800H, RTX A2000 Laptop GPU, Kioxia XG7 KXG7AZNV512G, IPS LED, 1920x1080, 17.3" | Lenovo ThinkPad P73-20QR002DGE i7-9850H, Quadro RTX 3000 (Laptop), Intel SSD Pro 7600p SSDPEKKF512G8L, IPS LED, 1920x1080, 17.3" | HP ZBook Fury 17 G7 119W5EA i9-10885H, Quadro RTX 4000 Max-Q, WDC PC SN730 SDBPNTY-1T00, , 3840x2160, 17.3" | Dell Precision 5000 5750 P92F W-10885M, Quadro RTX 3000 Max-Q, Toshiba Kioxia XG6 KXG60PNV1T02, IPS, 3840x2400, 17" | Asus ProArt StudioBook Pro 17 W700G3T i7-9750H, Quadro RTX 3000 Max-Q, Samsung SSD PM981 MZVLB1T0HALR, IPS, 1920x1200, 17" | Average NVIDIA RTX A2000 Laptop GPU | Average of class Workstation | |
|---|---|---|---|---|---|---|---|
| Power Consumption | -20% | -23% | -10% | -25% | -12% | -24% | |
| Idle Minimum * (Watt) | 6.1 | 8.9 -46% | 5.8 5% | 6.3 -3% | 11.3 -85% | 6.6 ? -8% | 9.11 ? -49% |
| Idle Average * (Watt) | 10.9 | 12.8 -17% | 14.8 -36% | 14.2 -30% | 16 -47% | 11.8 ? -8% | 13.8 ? -27% |
| Idle Maximum * (Watt) | 12.3 | 16.4 -33% | 17 -38% | 17.3 -41% | 16.8 -37% | 16.7 ? -36% | 17.9 ? -46% |
| Load Average * (Watt) | 106.3 | 108.4 -2% | 120.4 -13% | 121.2 -14% | 93.6 12% | 116.3 ? -9% | 96 ? 10% |
| Witcher 3 ultra * (Watt) | 124 | 153 -23% | 168.4 -36% | 115.4 7% | 106 15% | ||
| Load Maximum * (Watt) | 168.9 | 166 2% | 199.8 -18% | 130.7 23% | 186.6 -10% | 171.2 ? -1% | 180.3 ? -7% |
* ... smaller is better
Energieaufnahme Witcher 3 / Stresstest
电池寿命
与联想ThinkPad P73相比,电池容量从99Wh缩减到94。因此,尽管该系统的功耗较低,但电池寿命也有所下降。然而,对于一个不太可能在旅行中经常使用的工作站来说,近十个小时的Wi-Fi使用时间仍然是一个可敬的结果。
| Lenovo ThinkPad P17 G2-20YU0025G i7-11800H, RTX A2000 Laptop GPU, 94 Wh | Lenovo ThinkPad P73-20QR002DGE i7-9850H, Quadro RTX 3000 (Laptop), 99 Wh | HP ZBook Fury 17 G7 119W5EA i9-10885H, Quadro RTX 4000 Max-Q, 94 Wh | Dell Precision 5000 5750 P92F W-10885M, Quadro RTX 3000 Max-Q, 97 Wh | Asus ProArt StudioBook Pro 17 W700G3T i7-9750H, Quadro RTX 3000 Max-Q, 57 Wh | Average of class Workstation | |
|---|---|---|---|---|---|---|
| Battery runtime | 5% | 2% | 34% | -15% | -1% | |
| H.264 (h) | 9.5 | 9.8 3% | 10.3 8% | 6.9 -27% | 10.1 ? 6% | |
| WiFi v1.3 (h) | 9.8 | 11.1 13% | 7.6 -22% | 10.9 11% | 5.9 -40% | 8.55 ? -13% |
| Load (h) | 1.4 | 1.4 0% | 1.7 21% | 2.2 57% | 1.7 21% | 1.441 ? 3% |
Pros
Cons
结论。联想ThinkPad P17 G2在高端配置中是有意义的

工作站是为那些知道自己需要的人准备的。与ThinkPad P17 G2同属一类的系统不是为一般人使用的,而是为那些在CAD应用的帮助下设计建筑或产品的工程师准备的。
尽管牢记这一点很重要,但这并不是联想ThinkPad P17 G2的弱点的借口。过时的设计是一个明显的缺点:带有宽边框的16:9显示屏已不再具有时代性,尤其是当涉及到高端设备时。它们还使联想ThinkPad P17 G2变得不必要地大而重。另一个缺点。显示屏没有达到宣传的100% sRGB覆盖率,全高清分辨率对于17英寸屏幕来说感觉太低了。此外,有问题的DPC延迟也值得一提。
出色的输入设备、坚固的机身、多种多样的功能--P17 G2具有许多ThinkPad的典型优势。此外,还有一些特定型号的优势,如扩展性和性能。CPU的性能特别好,与较小的联想ThinkPad P15 G2不同,P17 G2的热量和噪音水平略低。在这里,宽敞的机箱绝对是有利的。
大而重,但也快而容易升级。联想ThinkPad P17 G2是一款传统的工作站。
虽然我们很乐意推荐ThinkPad P17 G2,但我们建议不要选择我们的测试配置。与更紧凑的工作站相比,这个低端型号根本没有提供足够的优势,例如 惠普ZBook Fury 17.ThinkPad系统最适合那些想要最高端配置并能利用ThinkPad P17 G2的最大规格的买家。
价格和可用性
我们的测试配置绝对不便宜,约为2500美元。如果你是学生或有资格参加联想的教育计划,联想ThinkPad P17 G2有折扣。亚马逊列出了基本配置配备Nvidia RTX A2000的ThinkPad基本配置约为2350美元。
Lenovo ThinkPad P17 G2-20YU0025G
- 10/01/2021 v7 (old)
Benjamin Herzig
Price comparison

