戴尔Precision 5560工作站回顾。Quadro RTX A2000的提升
戴尔Precision 5560是去年的Precision 5550的内部更新。这两款机型都是基于新的 XPS 15 9500/9510机箱,因此所有型号都带有类似的16:10面板和其他物理特征。因此,我们建议查看我们对 Precision 5550, XPS 15 9500, 或 XPS 15 9510因为我们的许多评论在这里仍然适用于Precision 5560。
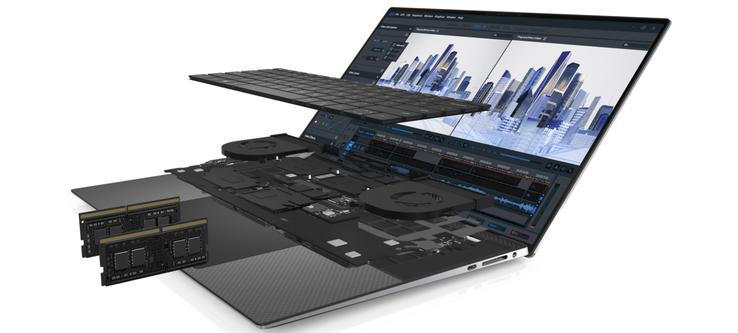
与Precision 5550相比,Precision 5560配备了第11代Tiger Lake-H CPU和Nvidia Ampere GPU,分别取代旧的第10代Comet Lake-H CPU和Turing GPU。SKU的范围从2000美元的基本酷睿i5-11500H与Quadro T1200显卡、1200p显示屏和8GB内存,到4000美元以上的i9-11950H或Xeon W-11955M vPro CPU与Quadro RTX A2000显卡、2400p触摸屏和64GB ECC内存。我们的具体测试装置是一个中档配置,零售价略高于3000美元。
这一领域的竞争对手包括其他15.6英寸移动工作站,如HP ZBook Studio 15 G8,华硕ProArt StudioBook Pro 15,联想ThinkPad P15 Gen 2,微星WS66, 或Razer Blade 15 Studio Edition 。我们的机型有一个17英寸的版本,叫做Precision 5750 ,基于XPS 17 。
更多戴尔的评论。
potential competitors in comparison
Rating | Date | Model | Weight | Height | Size | Resolution | Price |
|---|---|---|---|---|---|---|---|
| 88.3 % v7 (old) | 10 / 2021 | Dell Precision 5000 5560 i7-11850H, RTX A2000 Laptop GPU | 2 kg | 18 mm | 15.60" | 3840x2400 | |
| 87.2 % v7 (old) | 10 / 2021 | Lenovo ThinkPad P15 G2-20YQ001JGE i7-11800H, RTX A3000 Laptop GPU | 2.9 kg | 31.5 mm | 15.60" | 1920x1080 | |
| 87.8 % v7 (old) | 08 / 2021 | HP ZBook Studio 15 G8 i9-11950H, GeForce RTX 3070 Laptop GPU | 1.9 kg | 18 mm | 15.60" | 3840x2160 | |
| 83.1 % v7 (old) | Asus ProArt StudioBook Pro 15 W500G5T i7-9750H, Quadro RTX 5000 Max-Q | 2 kg | 18.9 mm | 15.60" | 3840x2160 | ||
| 87.8 % v7 (old) | 12 / 2020 | Dell Precision 7550 W-10885M, Quadro RTX 5000 Max-Q | 2.8 kg | 27.36 mm | 15.60" | 3840x2160 | |
| 86.3 % v7 (old) | 10 / 2020 | Dell Precision 5550 P91F i7-10875H, Quadro T2000 Max-Q | 2 kg | 18 mm | 15.60" | 3840x2400 | |
| 87 % v7 (old) | 08 / 2020 | Razer Blade 15 Studio Edition 2020 i7-10875H, Quadro RTX 5000 Max-Q | 2.2 kg | 13.98 mm | 15.60" | 3840x2160 |
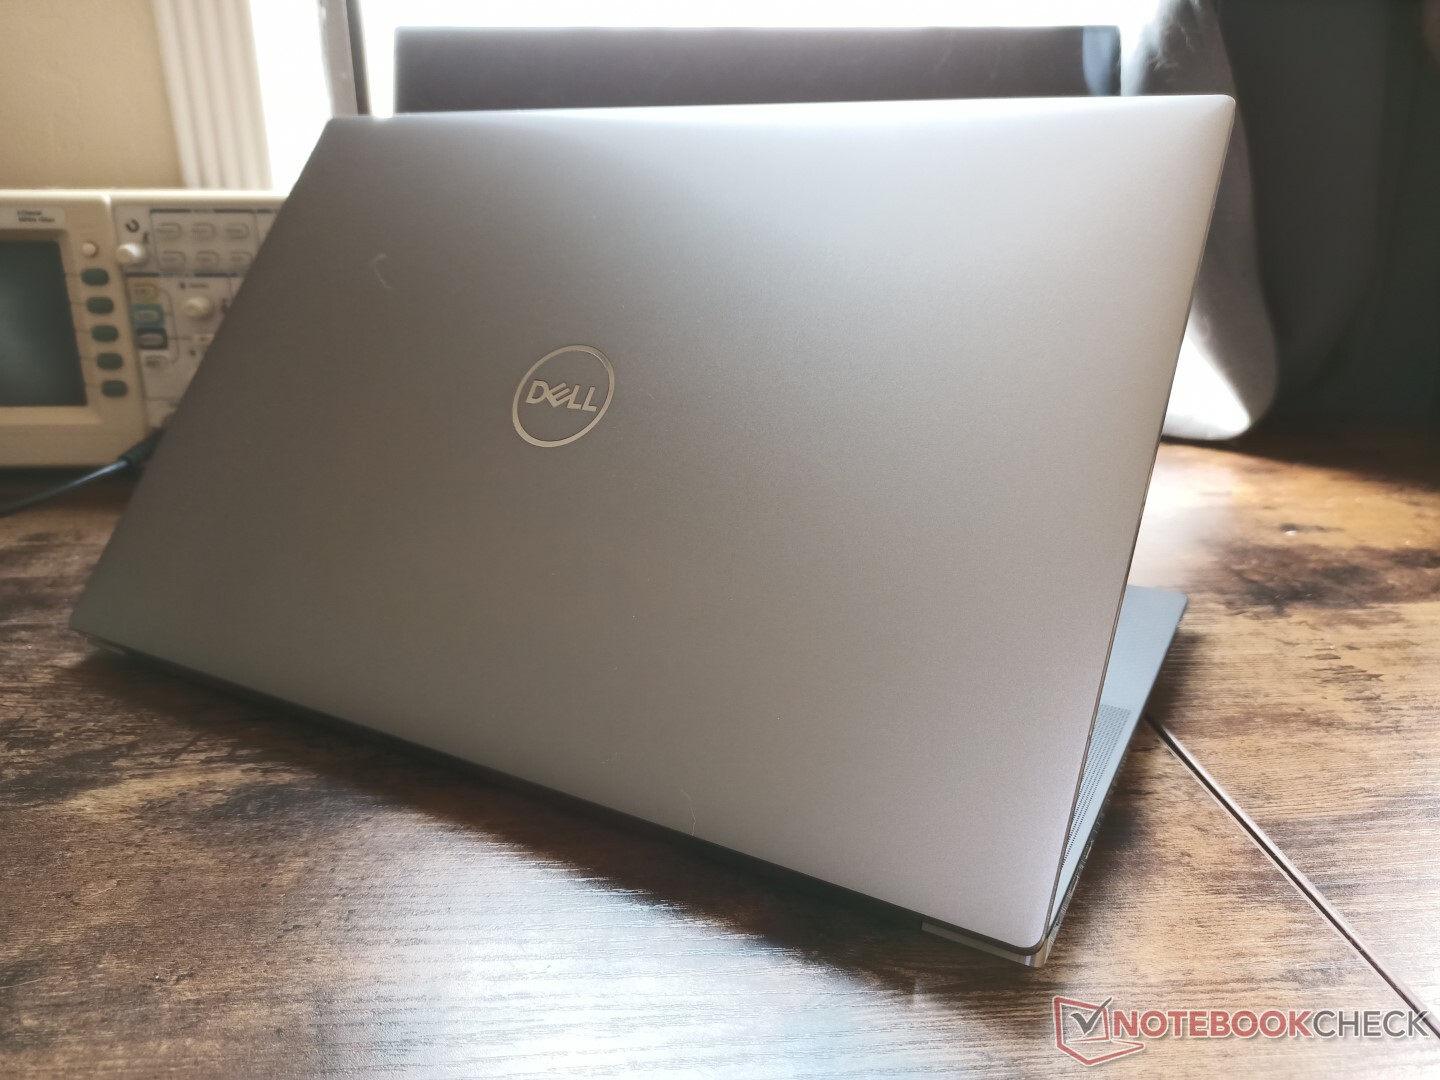
案例--专业XPS
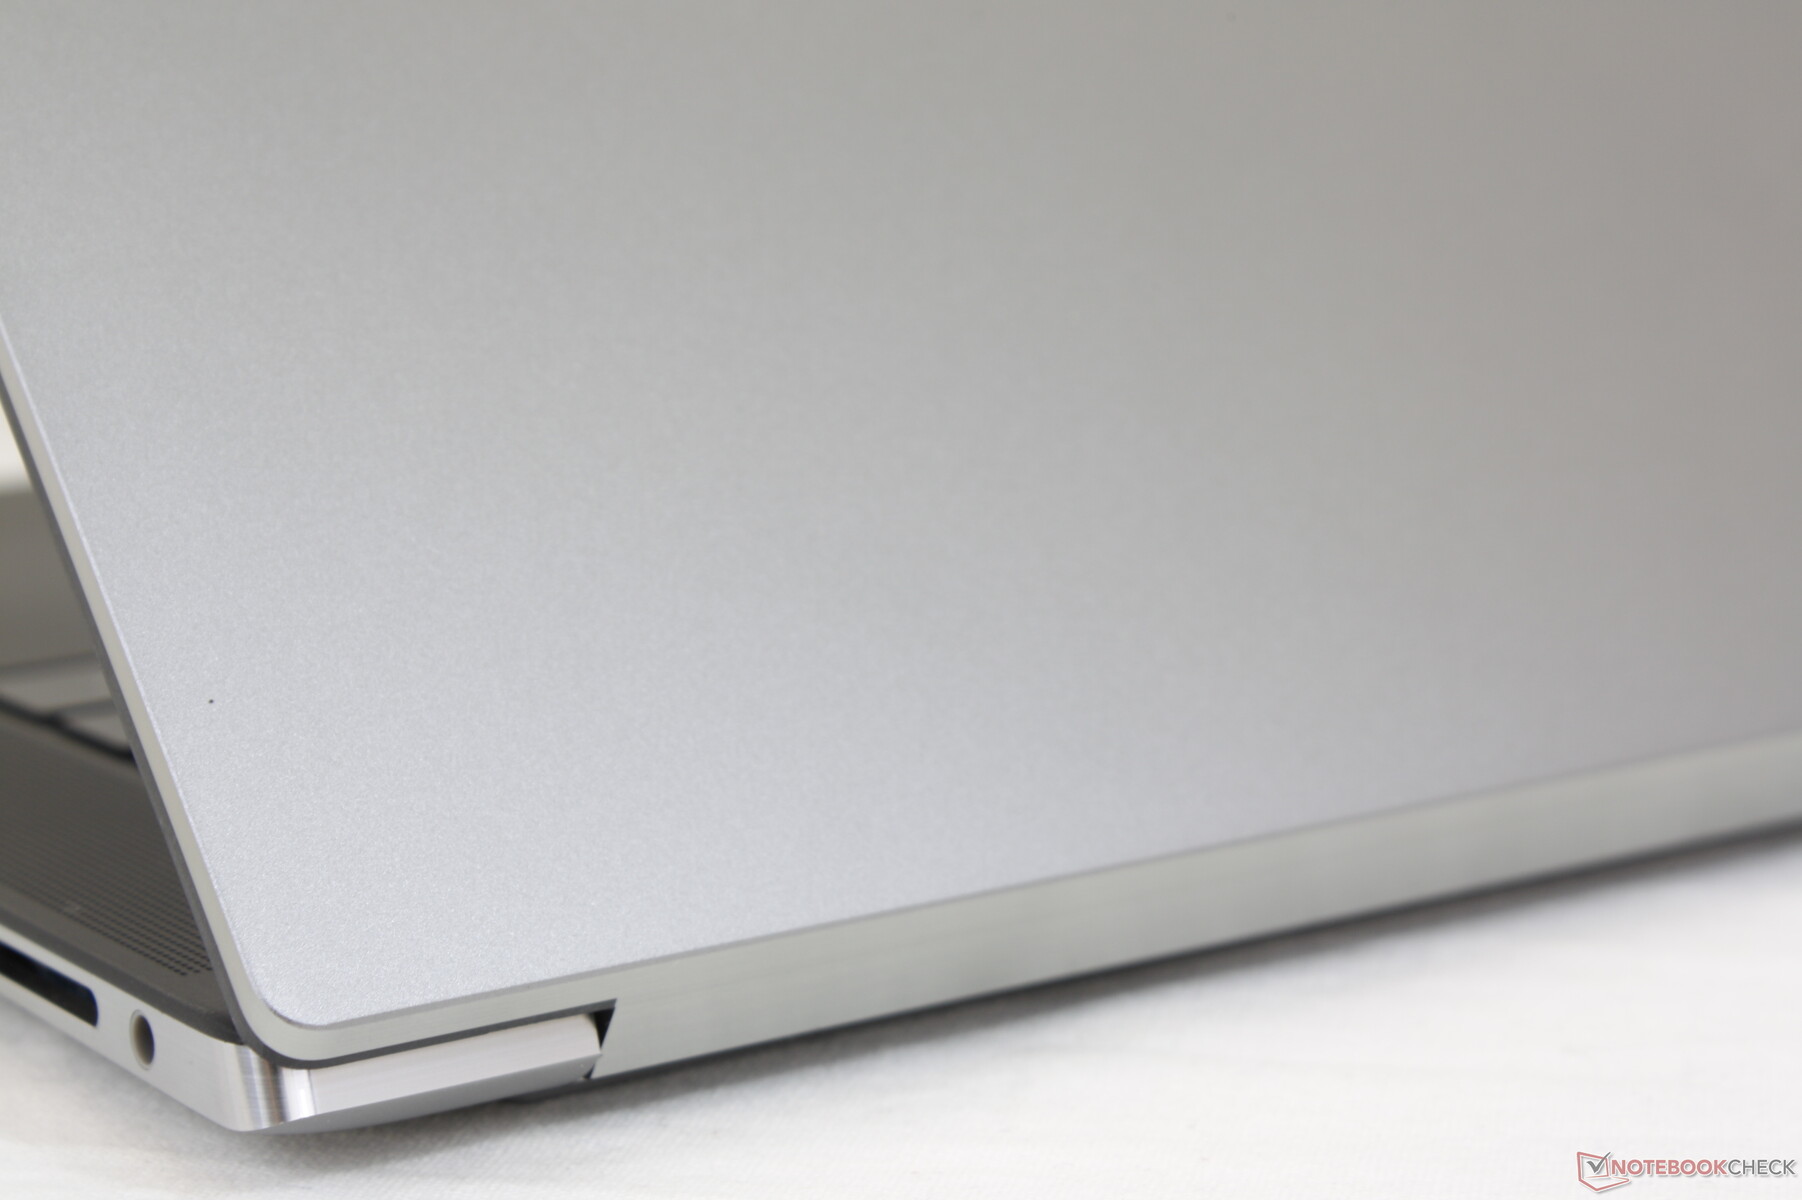
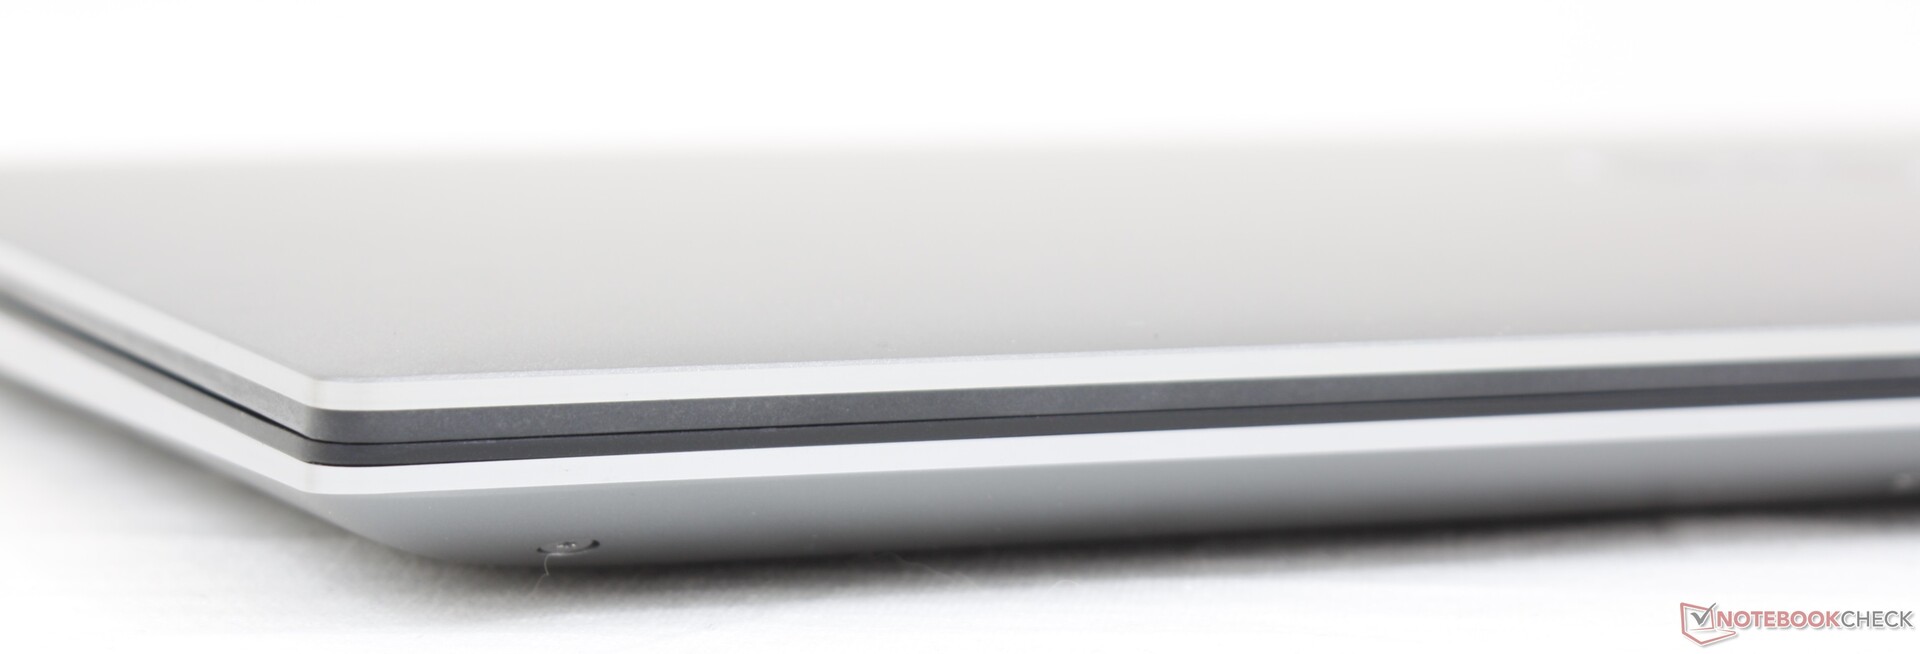
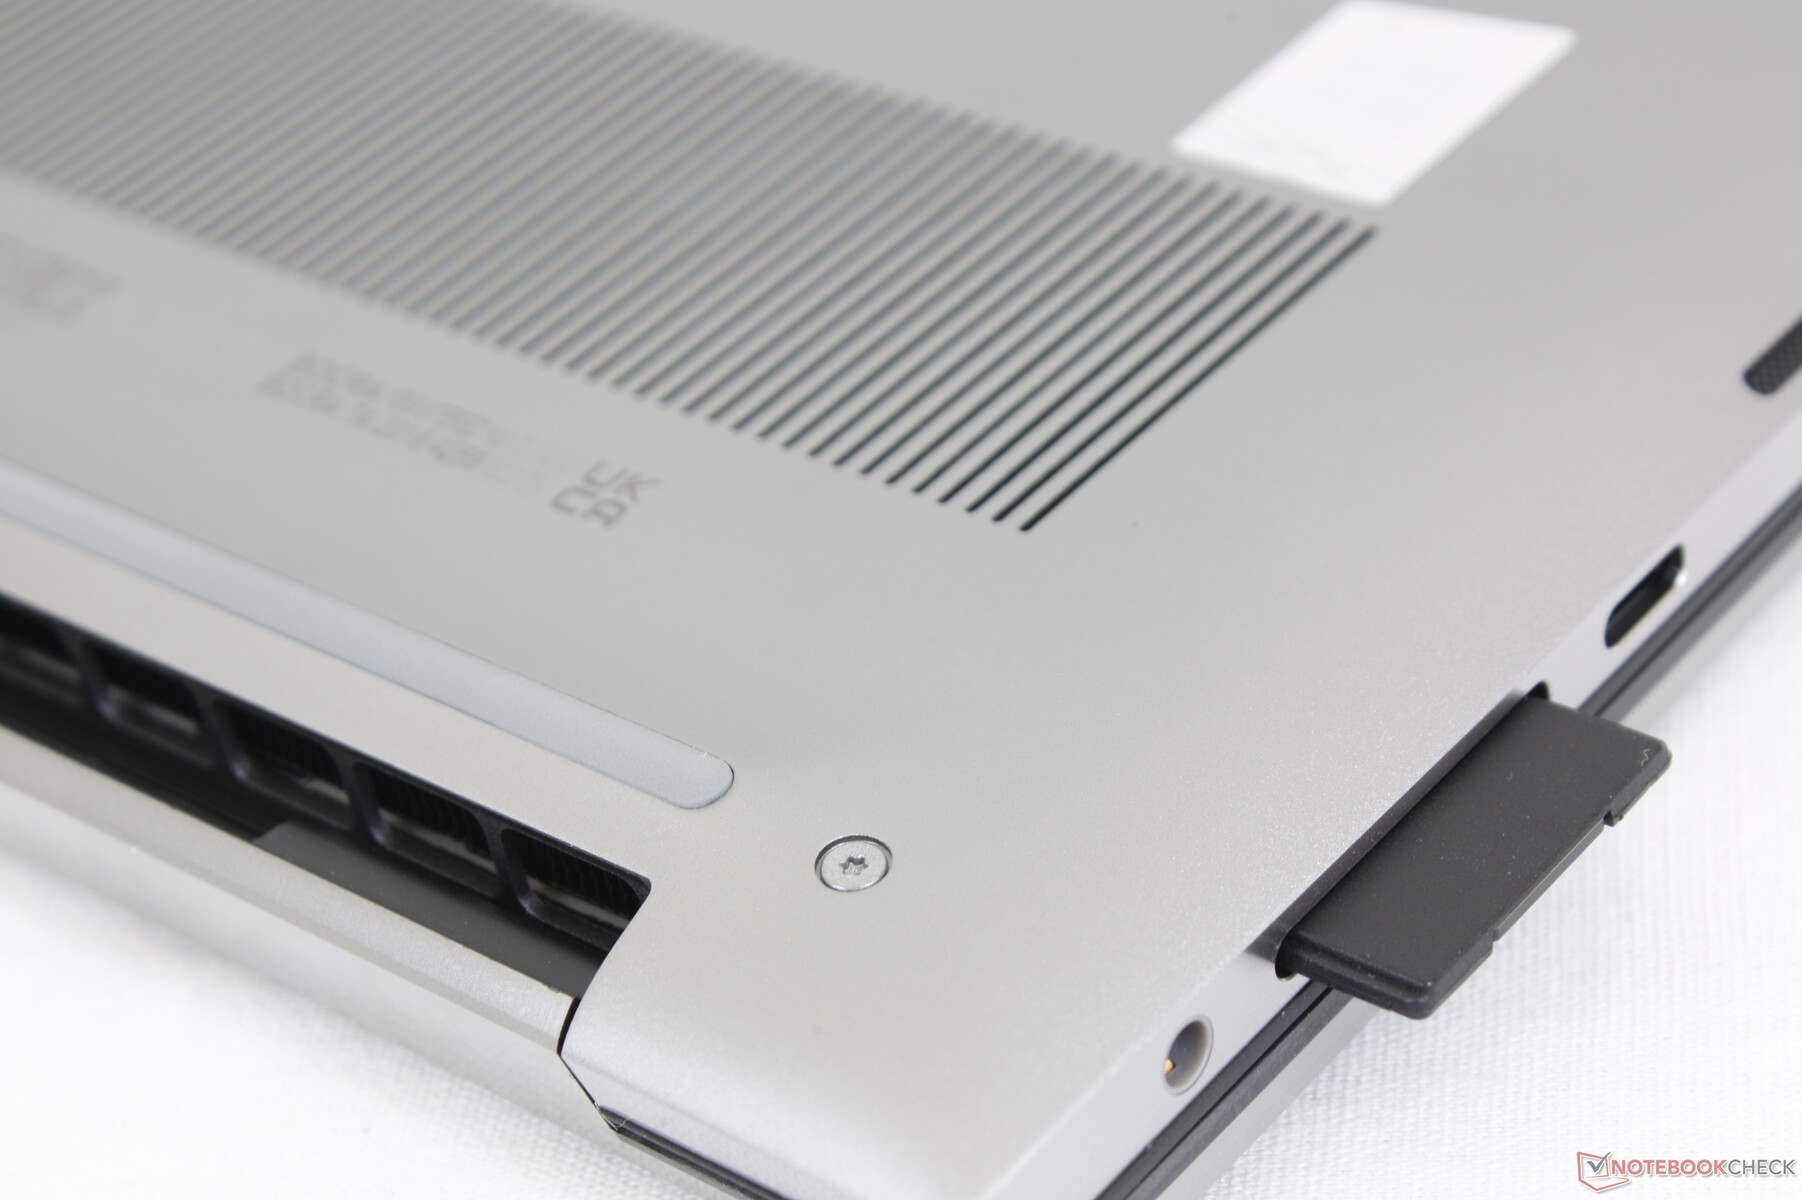
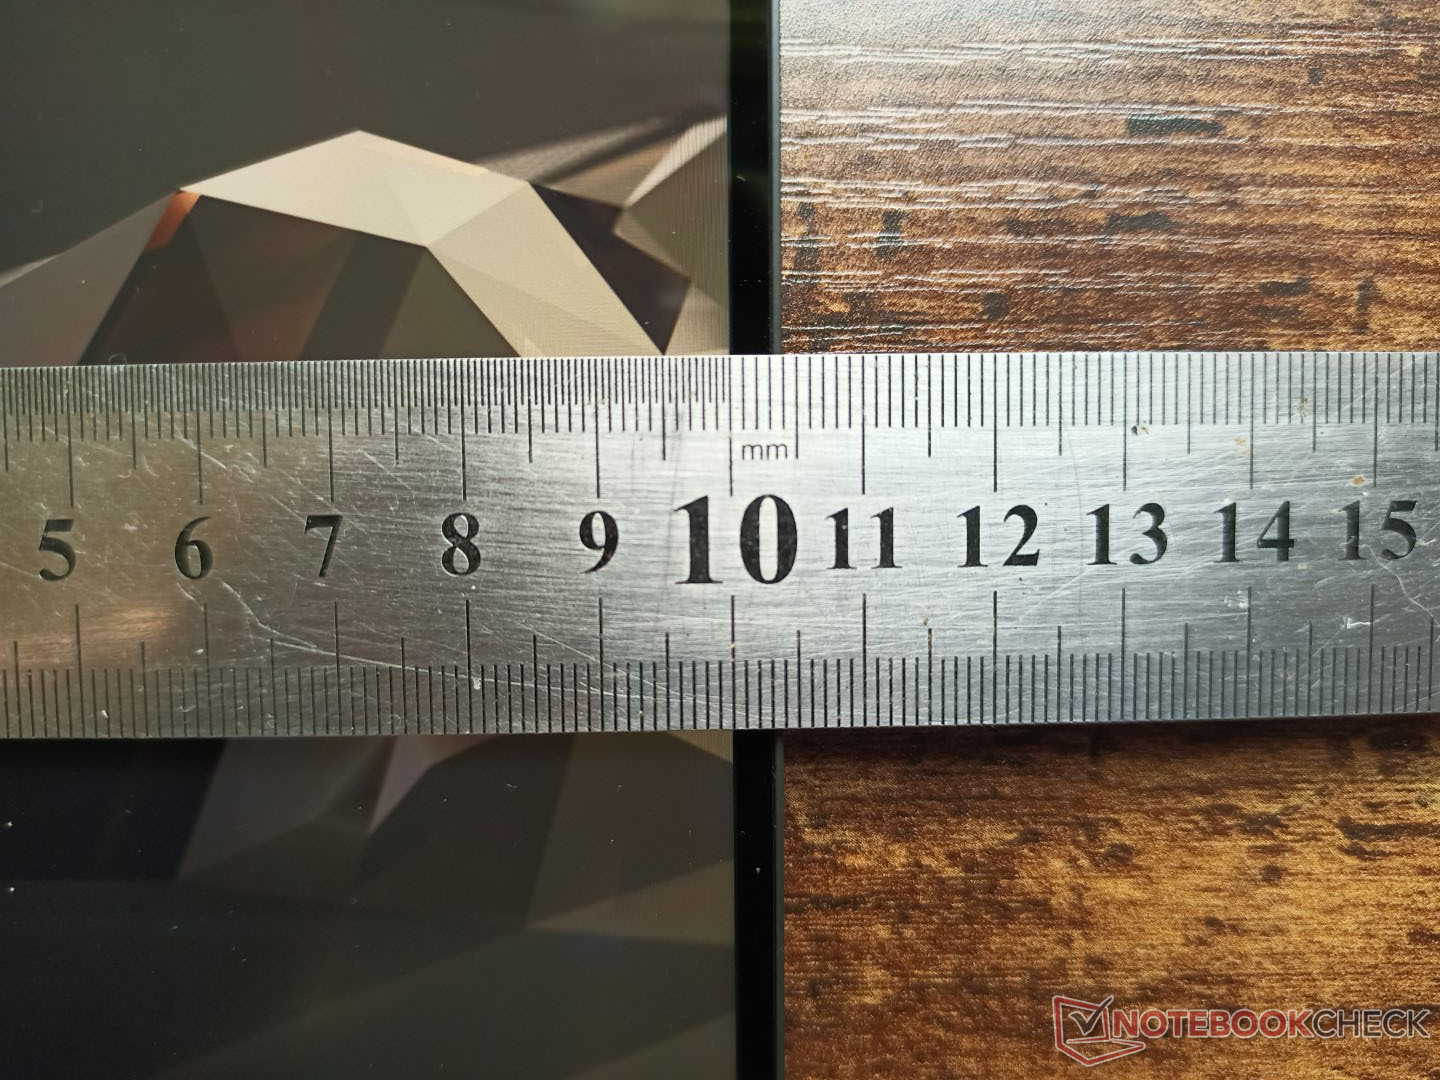
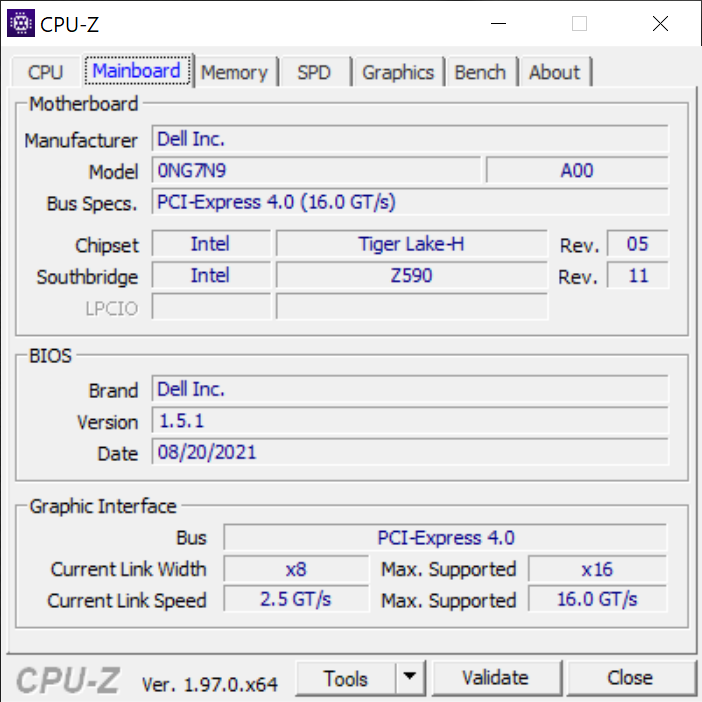
机箱和尺寸与XPS 15 9500或9510相同,为18 x 344.72 x 230.14毫米。然而,戴尔官方产品页面声称,Precision 5560的最厚处为11.64毫米,要薄很多,这绝对是错误的。我们怀疑戴尔已经改变了他们测量厚度的方式,这可能会对消费者产生很大的误导。 我们观察到相同的XPS 13 7390二合一和XPS 13 9310二合一之间也有
类似的厚度差异。 </span> 像往常一样。与典型的XPS 15相比,镁合金外盖的灰色调略深,以帮助从视觉上识别Precision 55x0系列与XPS 15系列。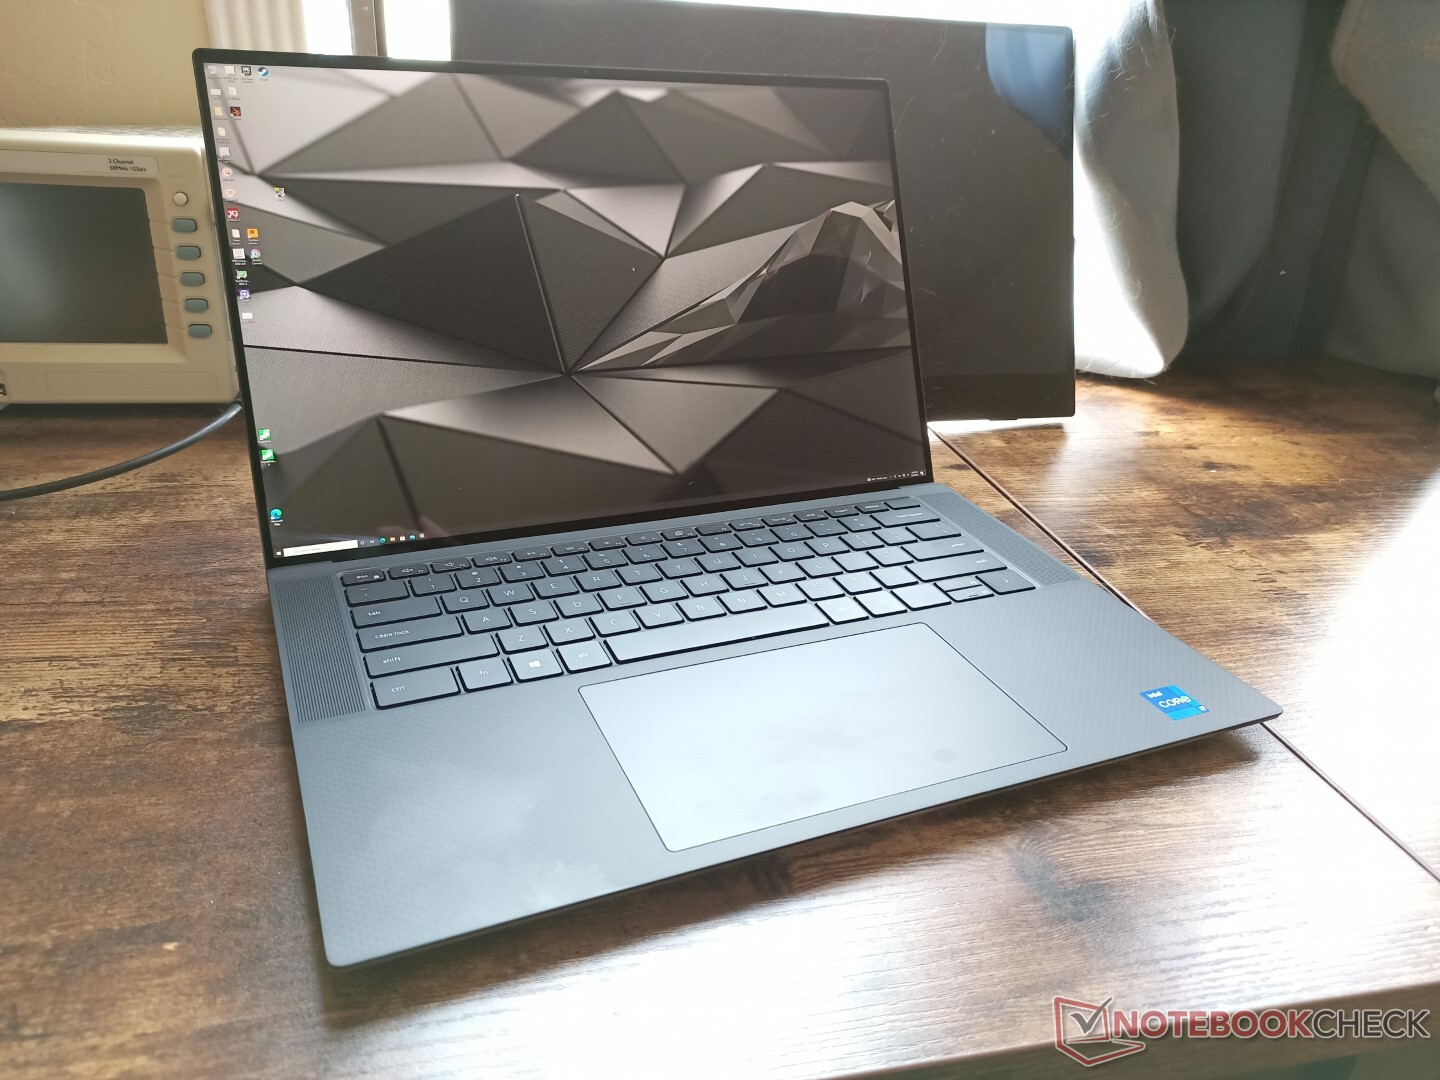
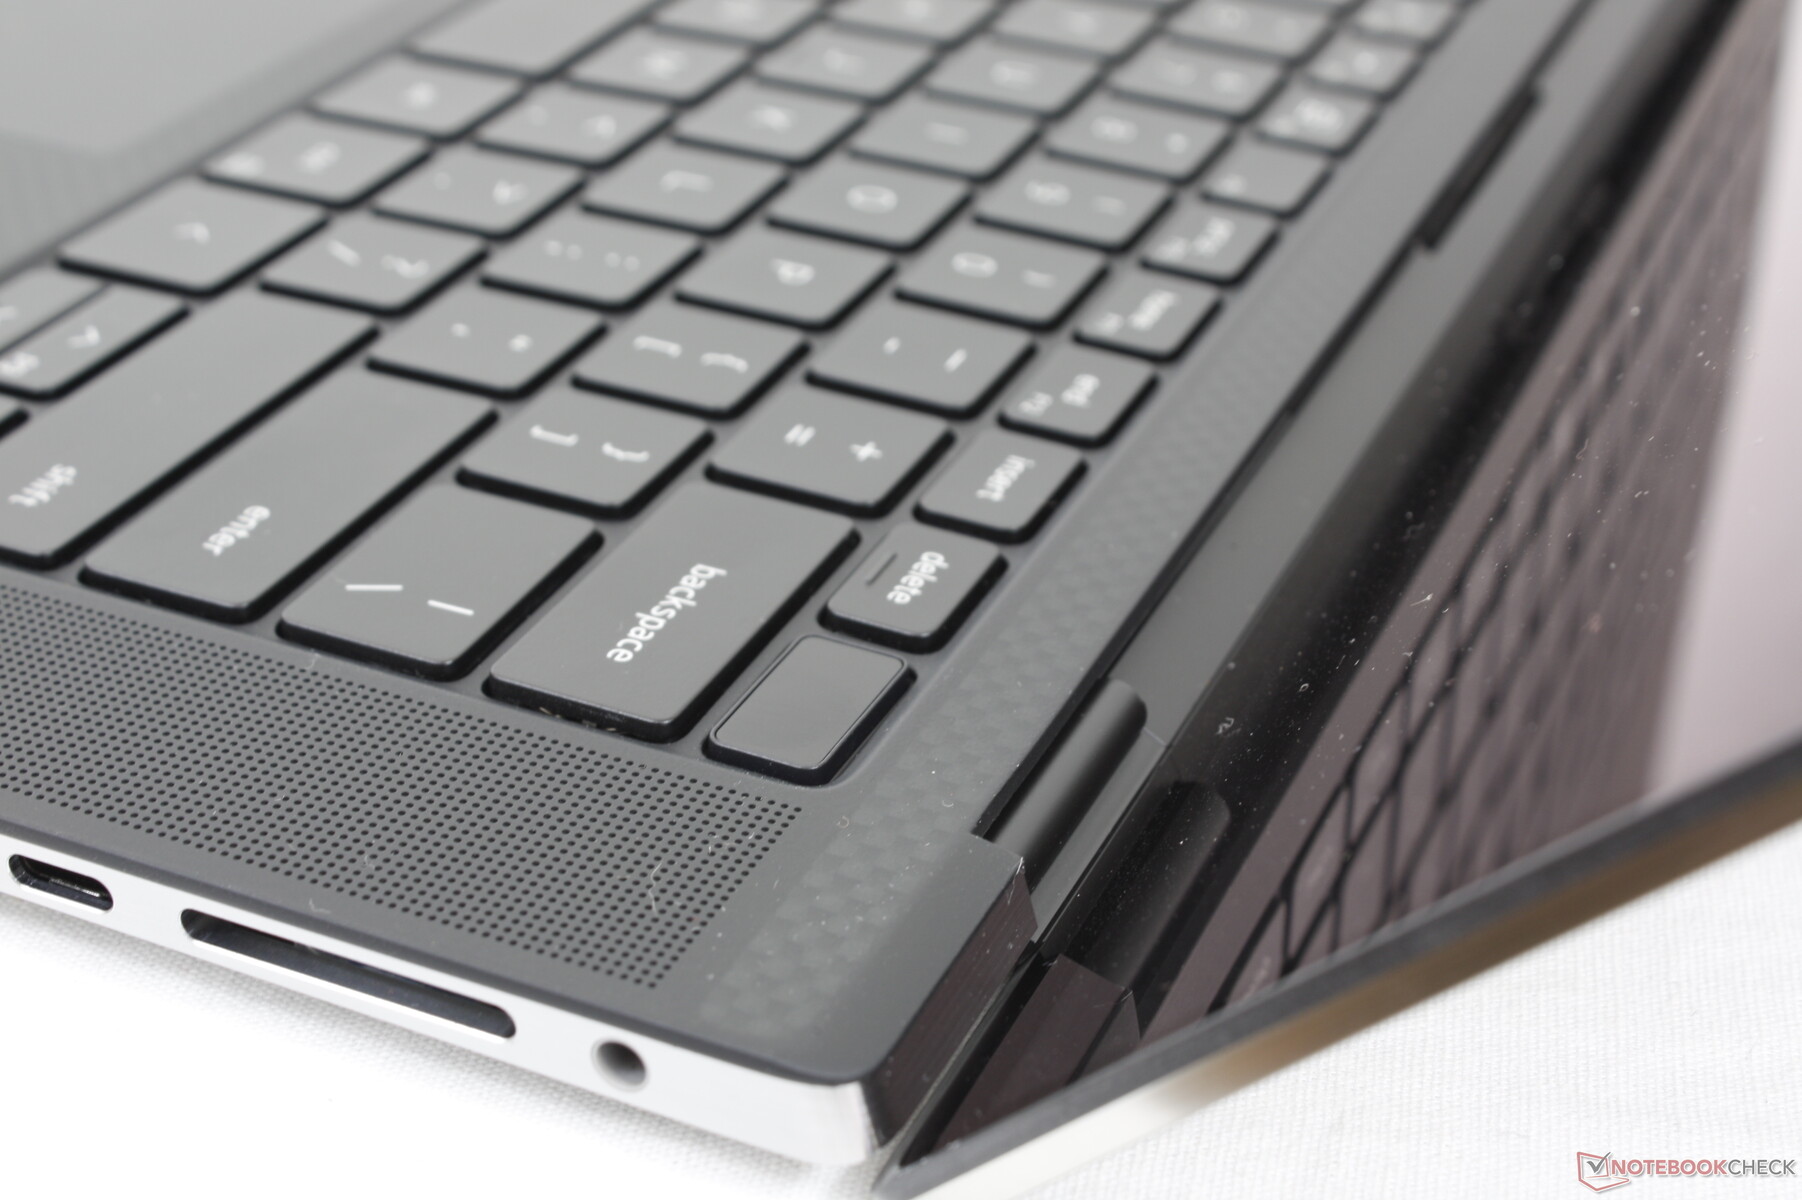
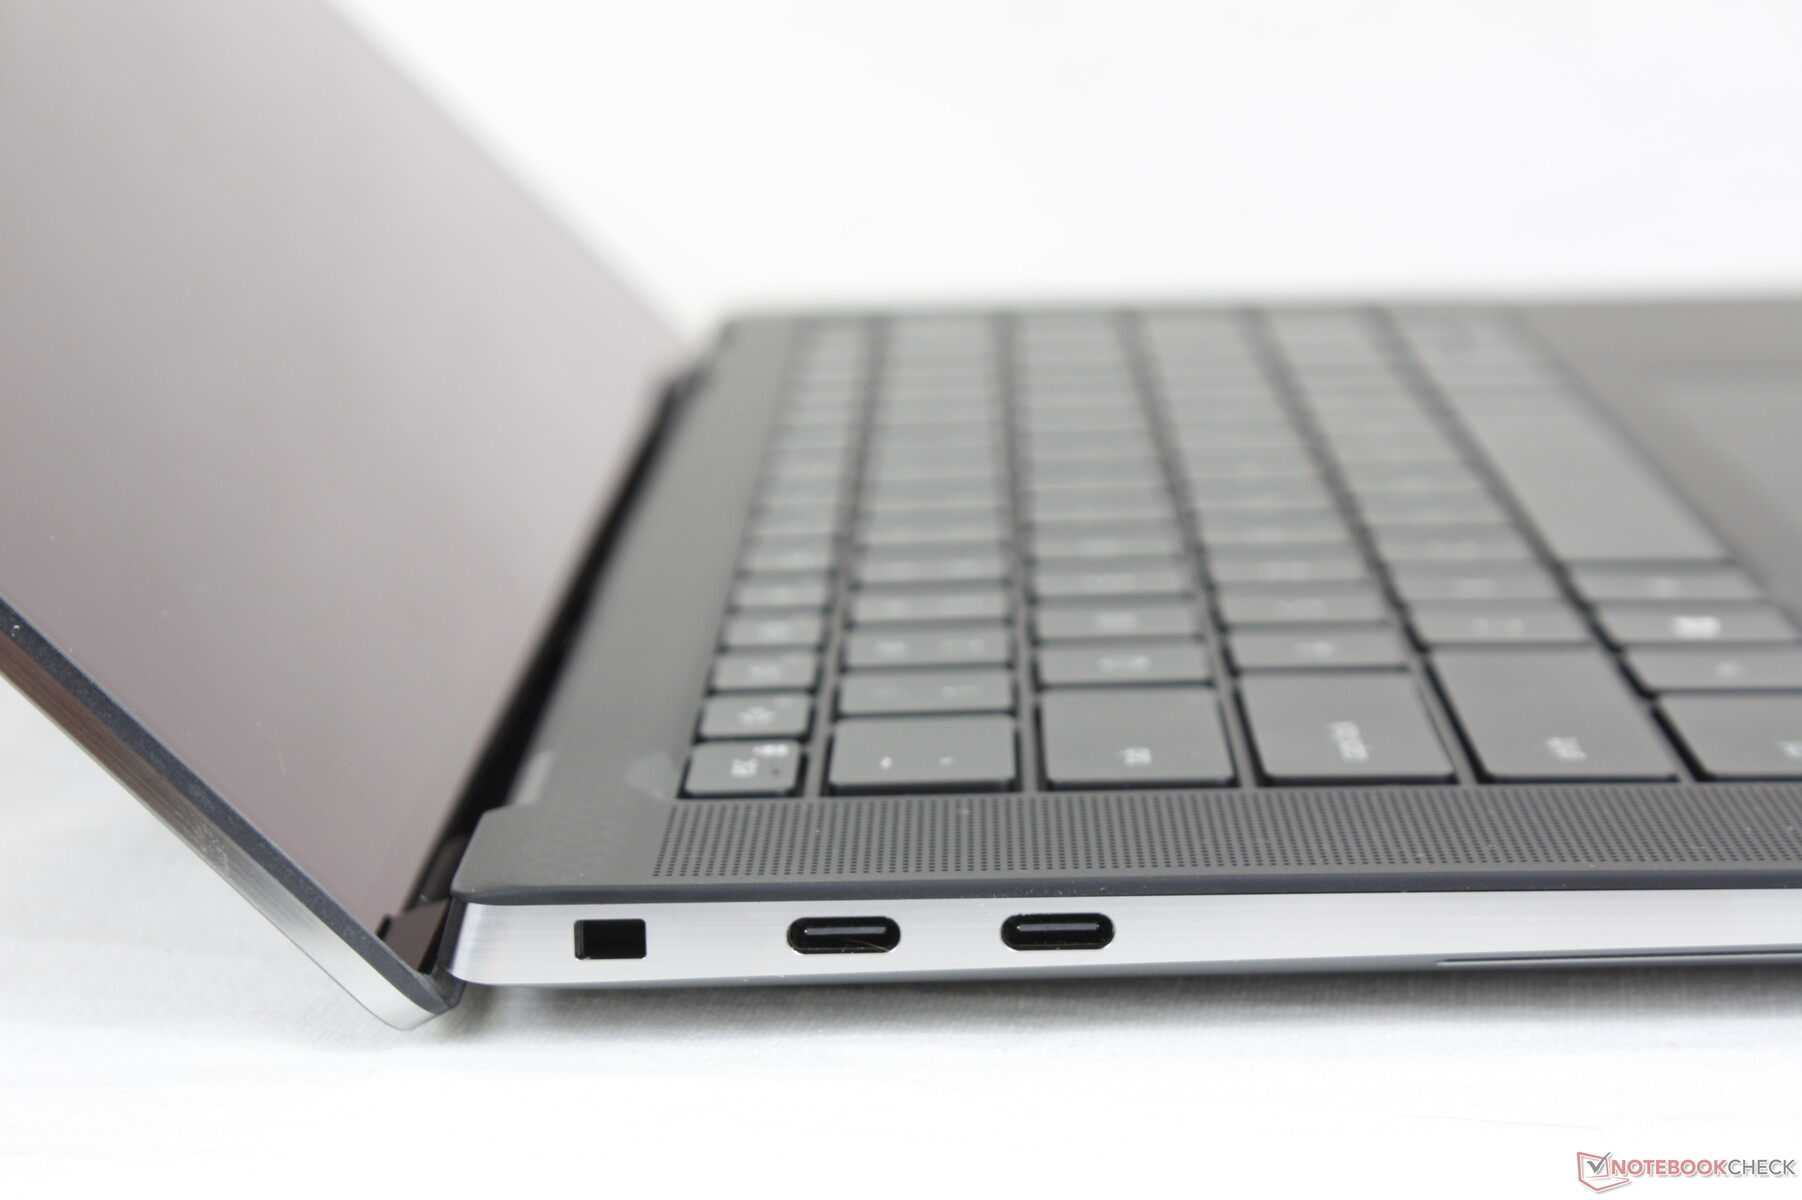
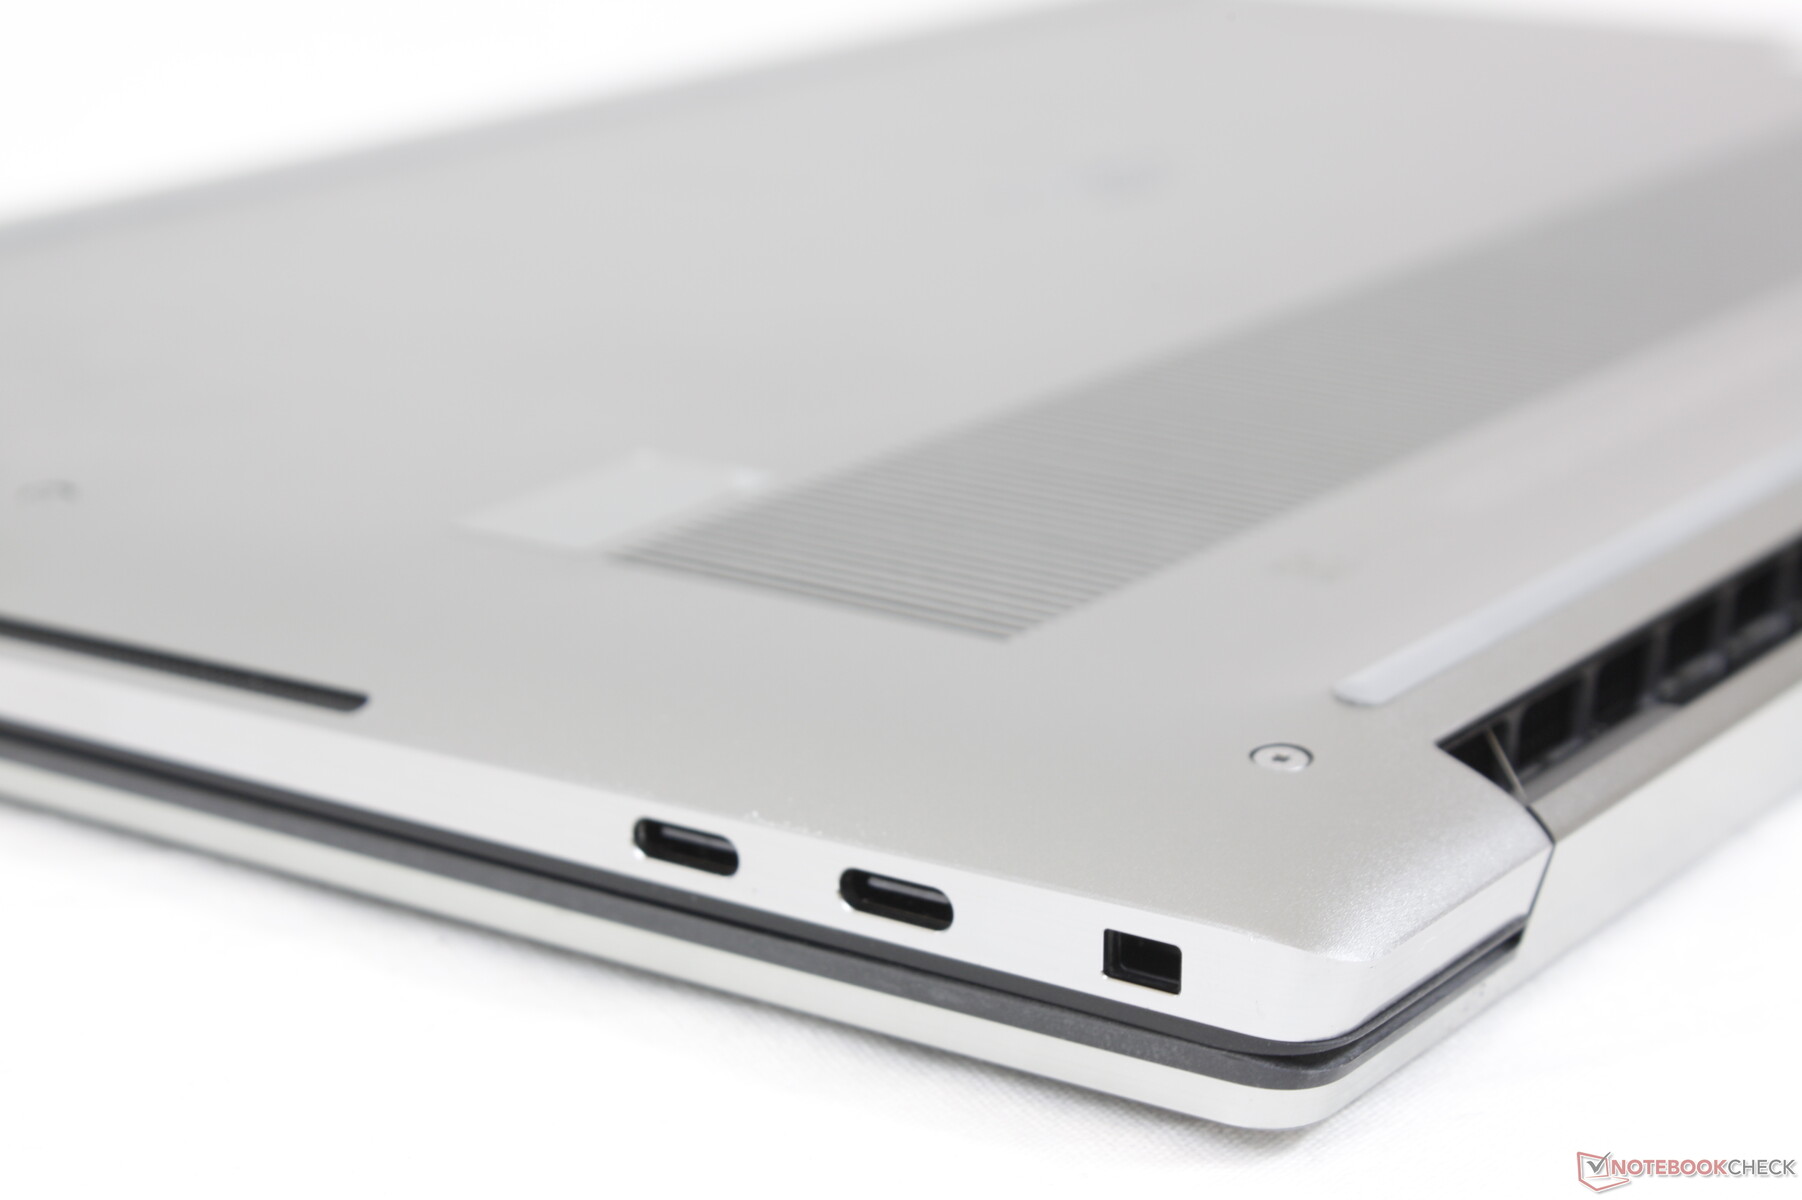
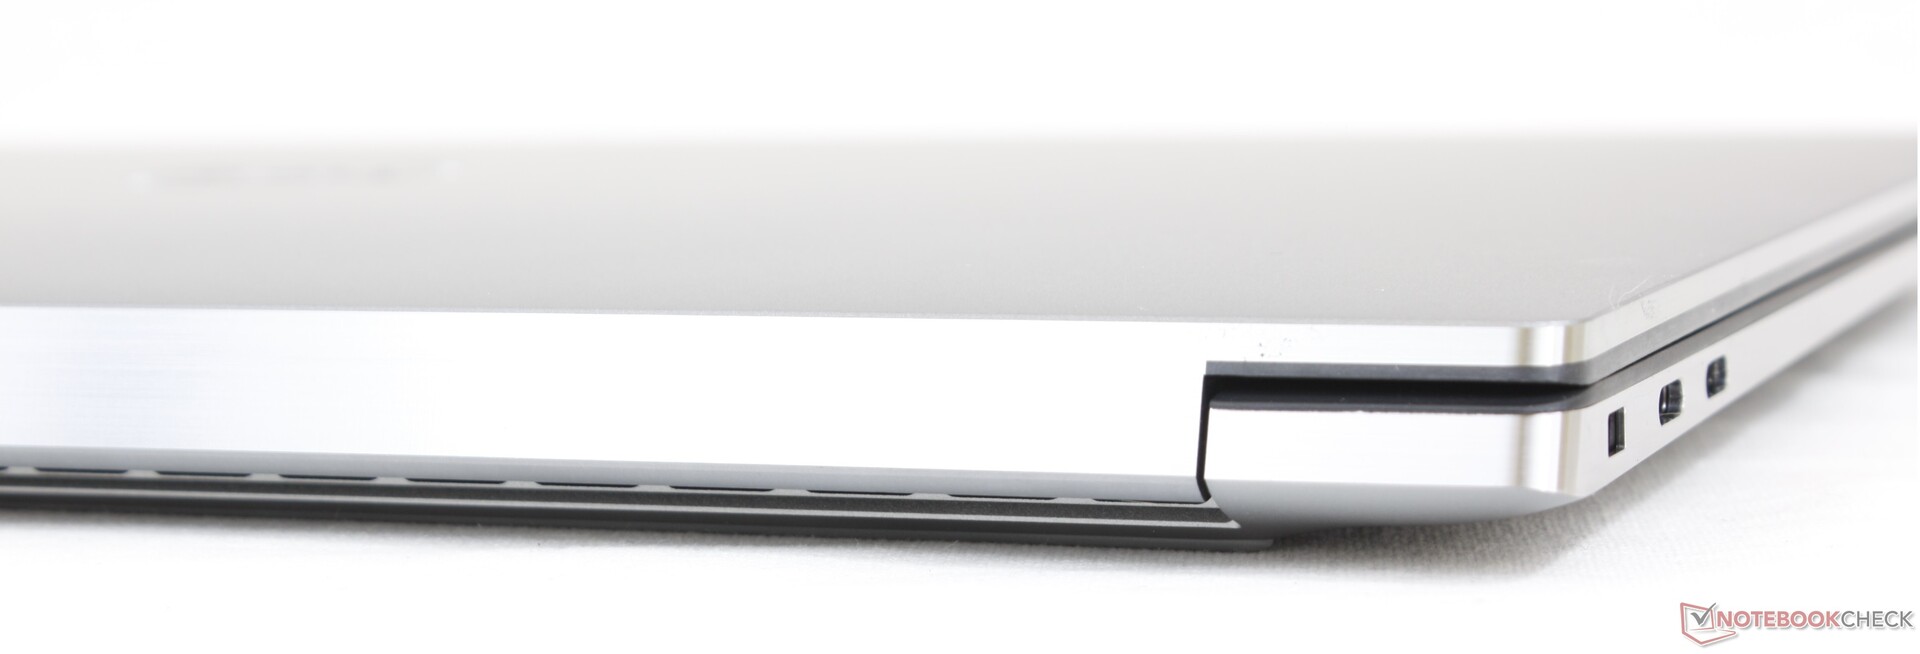
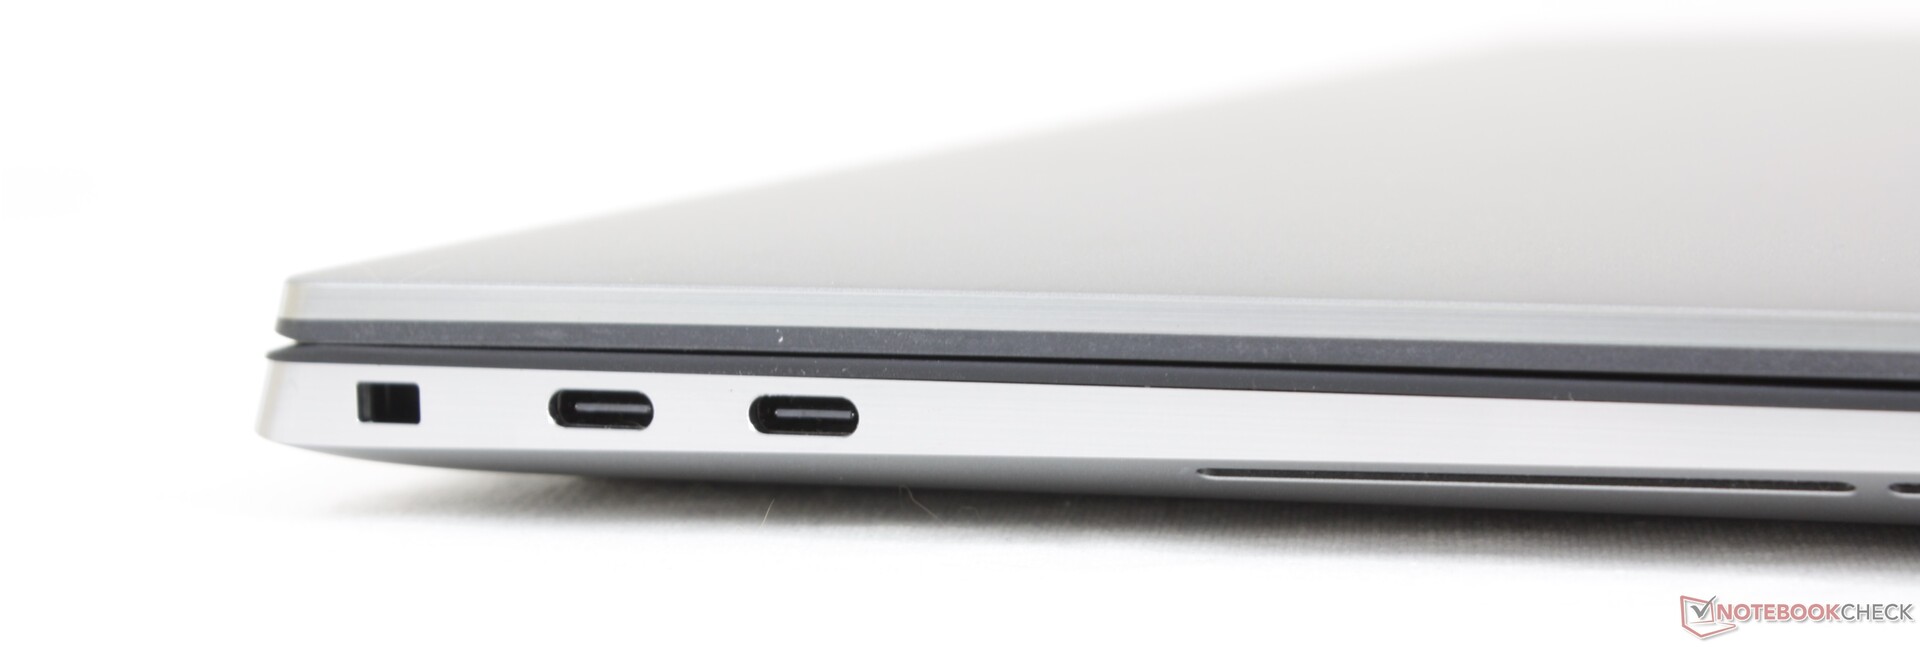
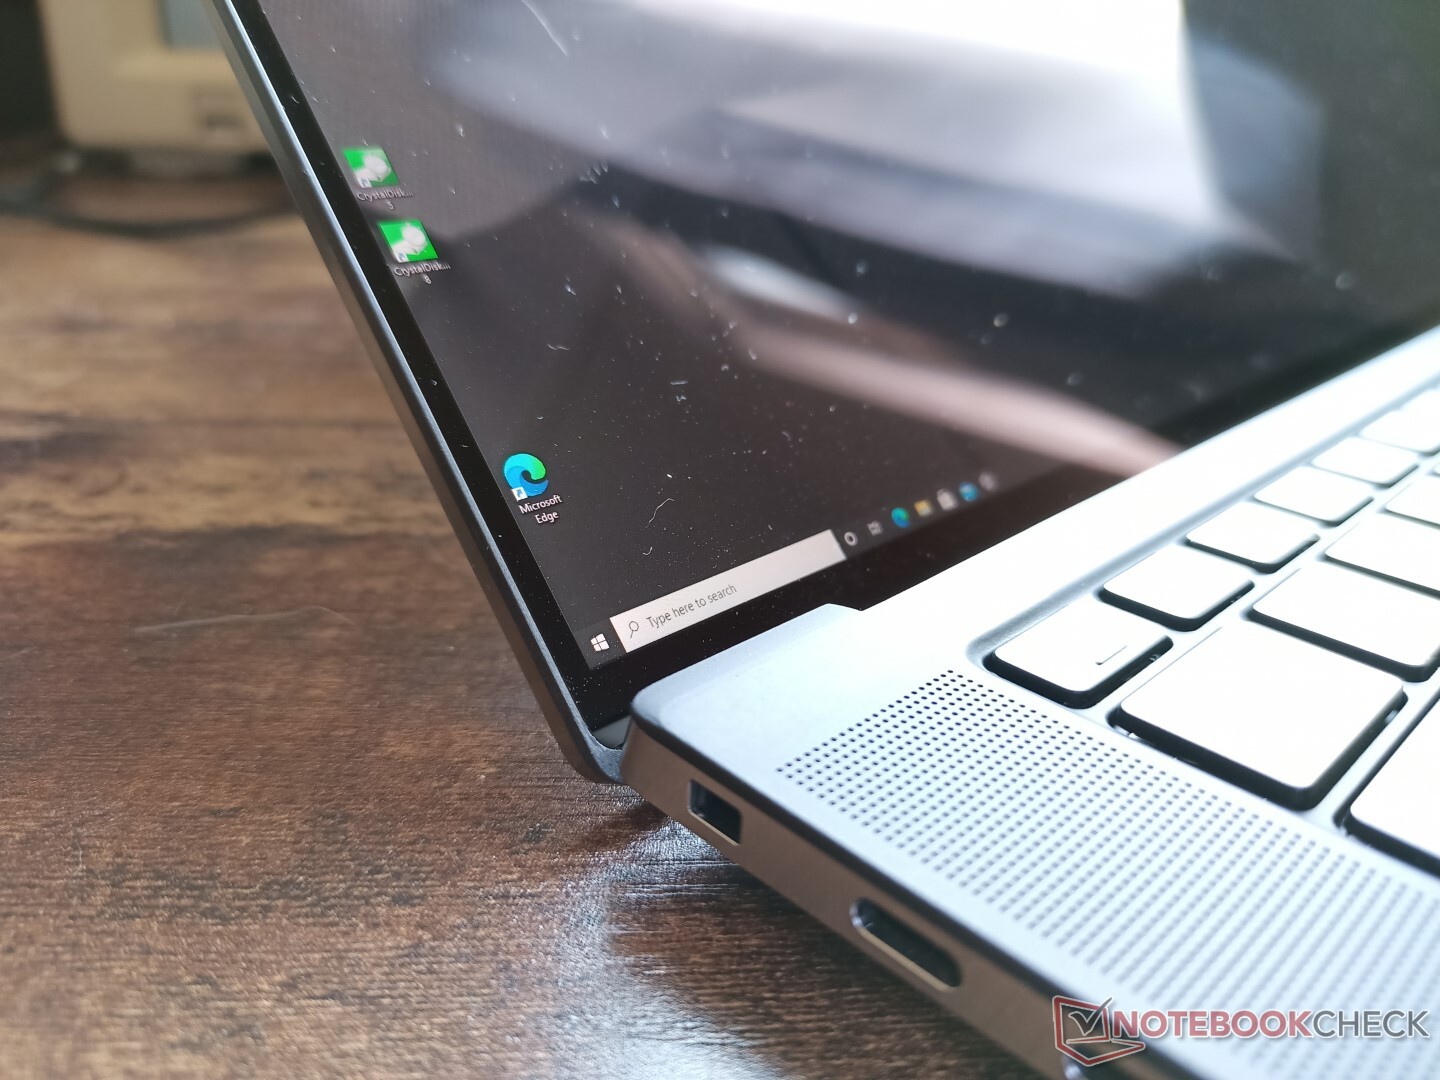
连接性 - Thunderbolt 4准备就绪
端口选项只包括USB-C,所以要准备好到处都有适配器。所有三个USB-C端口都支持DisplayPort和Power Delivery,但只有左边的两个USB-C端口支持Thunderbolt设备。特别是这两个端口已经从Precision 5550的Thunderbolt 3升级到Precision 5560的Thunderbolt 4。
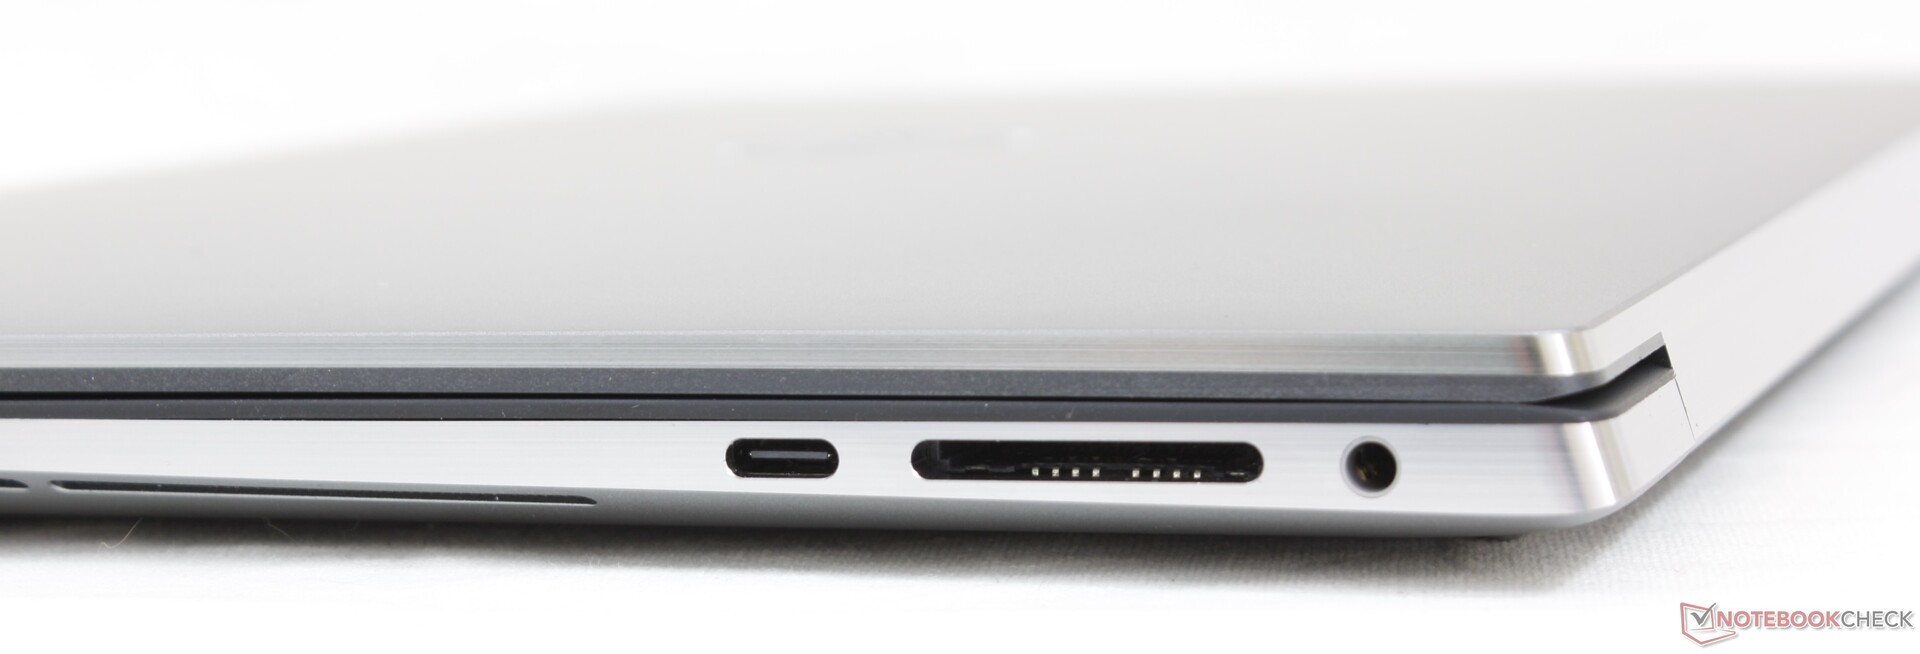
SD卡阅读器
在我们的UHS-II测试卡上,传输速度非常快,接近200MB/s。插槽不是弹簧式的,所以SD卡会在边缘突出来。
| SD Card Reader | |
| average JPG Copy Test (av. of 3 runs) | |
| Lenovo ThinkPad P15 G2-20YQ001JGE (AV Pro V60) | |
| Dell Precision 5000 5560 (AV Pro V60) | |
| Dell Precision 5550 P91F (Toshiba Exceria Pro SDXC 64 GB UHS-II) | |
| Dell Precision 7550 (Toshiba Exceria Pro SDXC 64 GB UHS-II) | |
| Razer Blade 15 Studio Edition 2020 (Toshiba Exceria Pro SDXC 64 GB UHS-II) | |
| HP ZBook Studio 15 G8 (AV Pro V60) | |
| maximum AS SSD Seq Read Test (1GB) | |
| Lenovo ThinkPad P15 G2-20YQ001JGE (AV Pro V60) | |
| Dell Precision 5000 5560 (AV Pro V60) | |
| Dell Precision 5550 P91F (Toshiba Exceria Pro SDXC 64 GB UHS-II) | |
| Dell Precision 7550 (Toshiba Exceria Pro SDXC 64 GB UHS-II) | |
| HP ZBook Studio 15 G8 (AV Pro V60) | |
沟通
| Networking | |
| iperf3 transmit AX12 | |
| Razer Blade 15 Studio Edition 2020 | |
| HP ZBook Studio 15 G8 | |
| Lenovo ThinkPad P15 G2-20YQ001JGE | |
| Asus ProArt StudioBook Pro 15 W500G5T | |
| Dell Precision 5550 P91F | |
| Dell Precision 7550 | |
| Dell Precision 5000 5560 | |
| iperf3 receive AX12 | |
| Lenovo ThinkPad P15 G2-20YQ001JGE | |
| Dell Precision 5550 P91F | |
| Dell Precision 5000 5560 | |
| Razer Blade 15 Studio Edition 2020 | |
| HP ZBook Studio 15 G8 | |
| Asus ProArt StudioBook Pro 15 W500G5T | |
| Dell Precision 7550 | |
网络摄像头--仍然没有隐私遮板


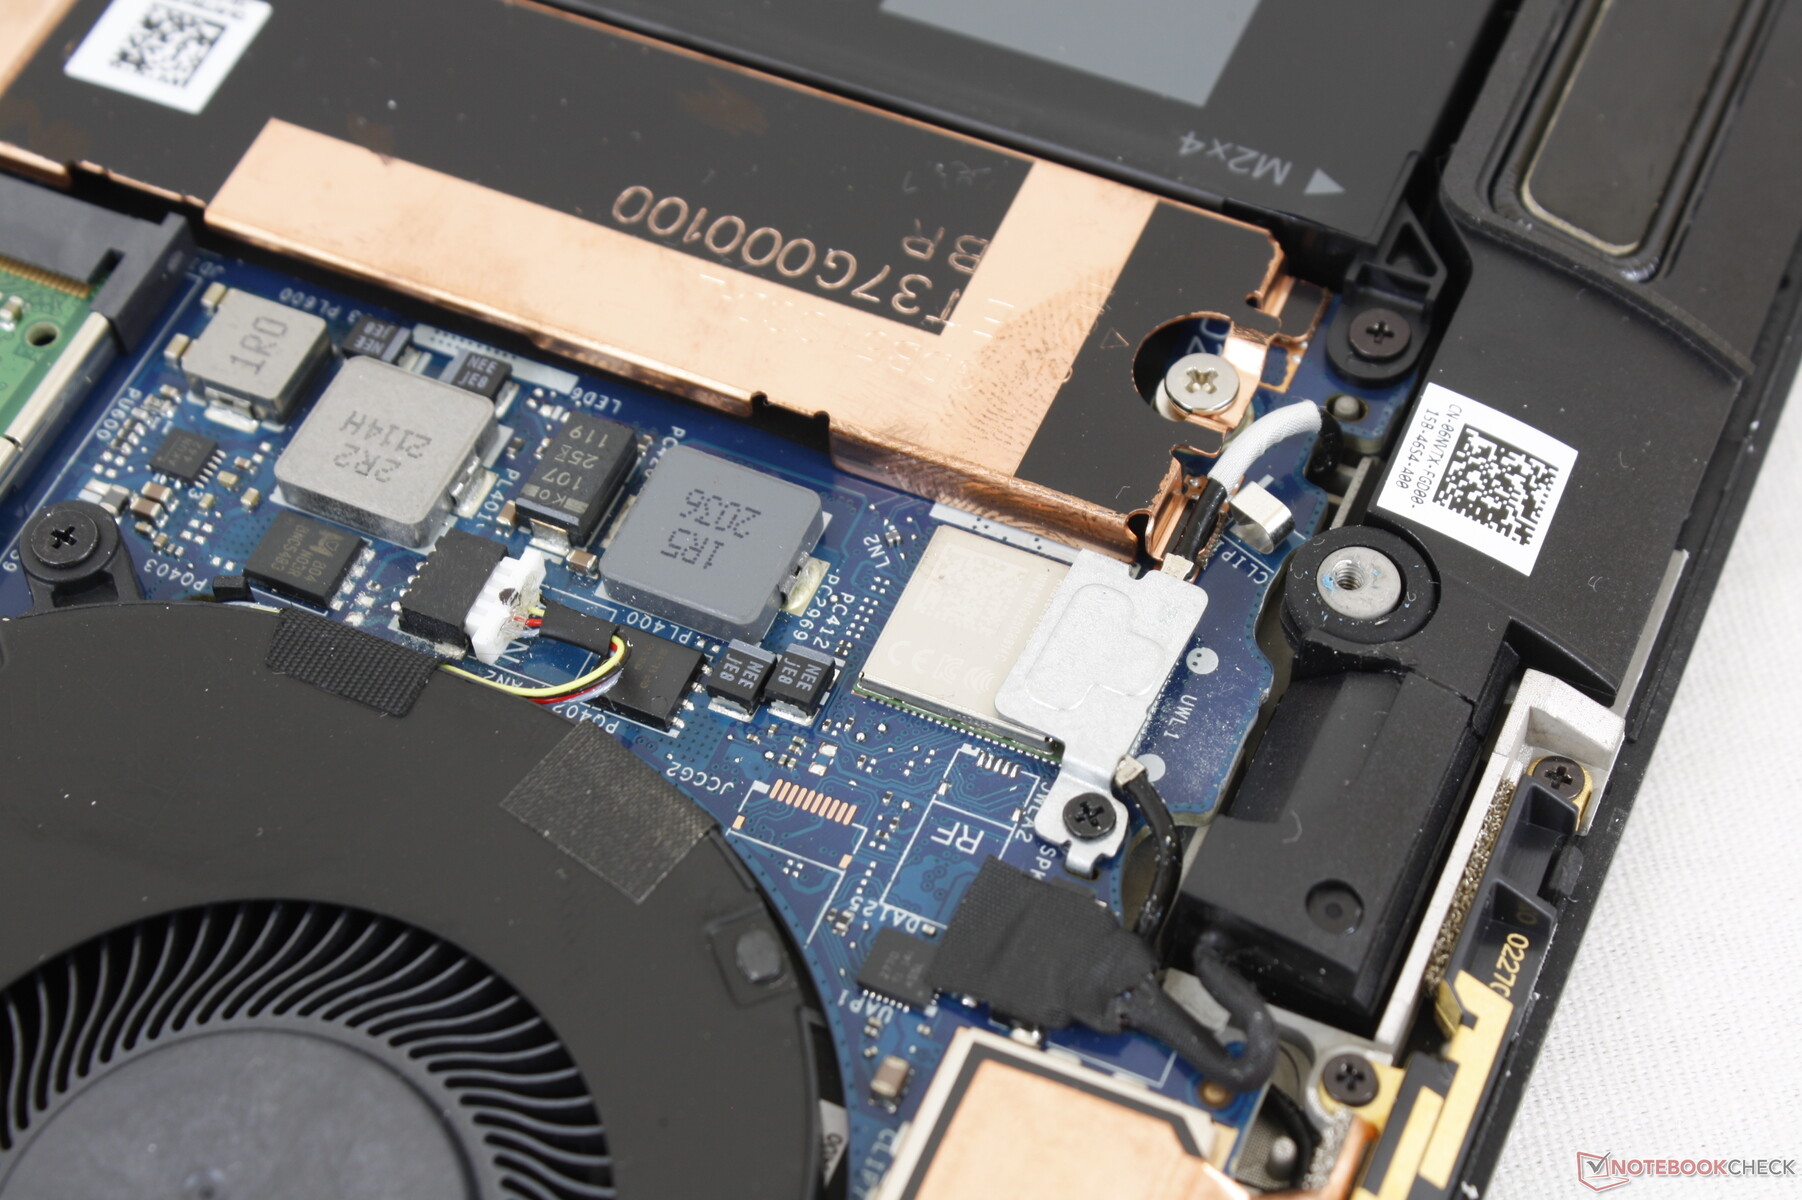
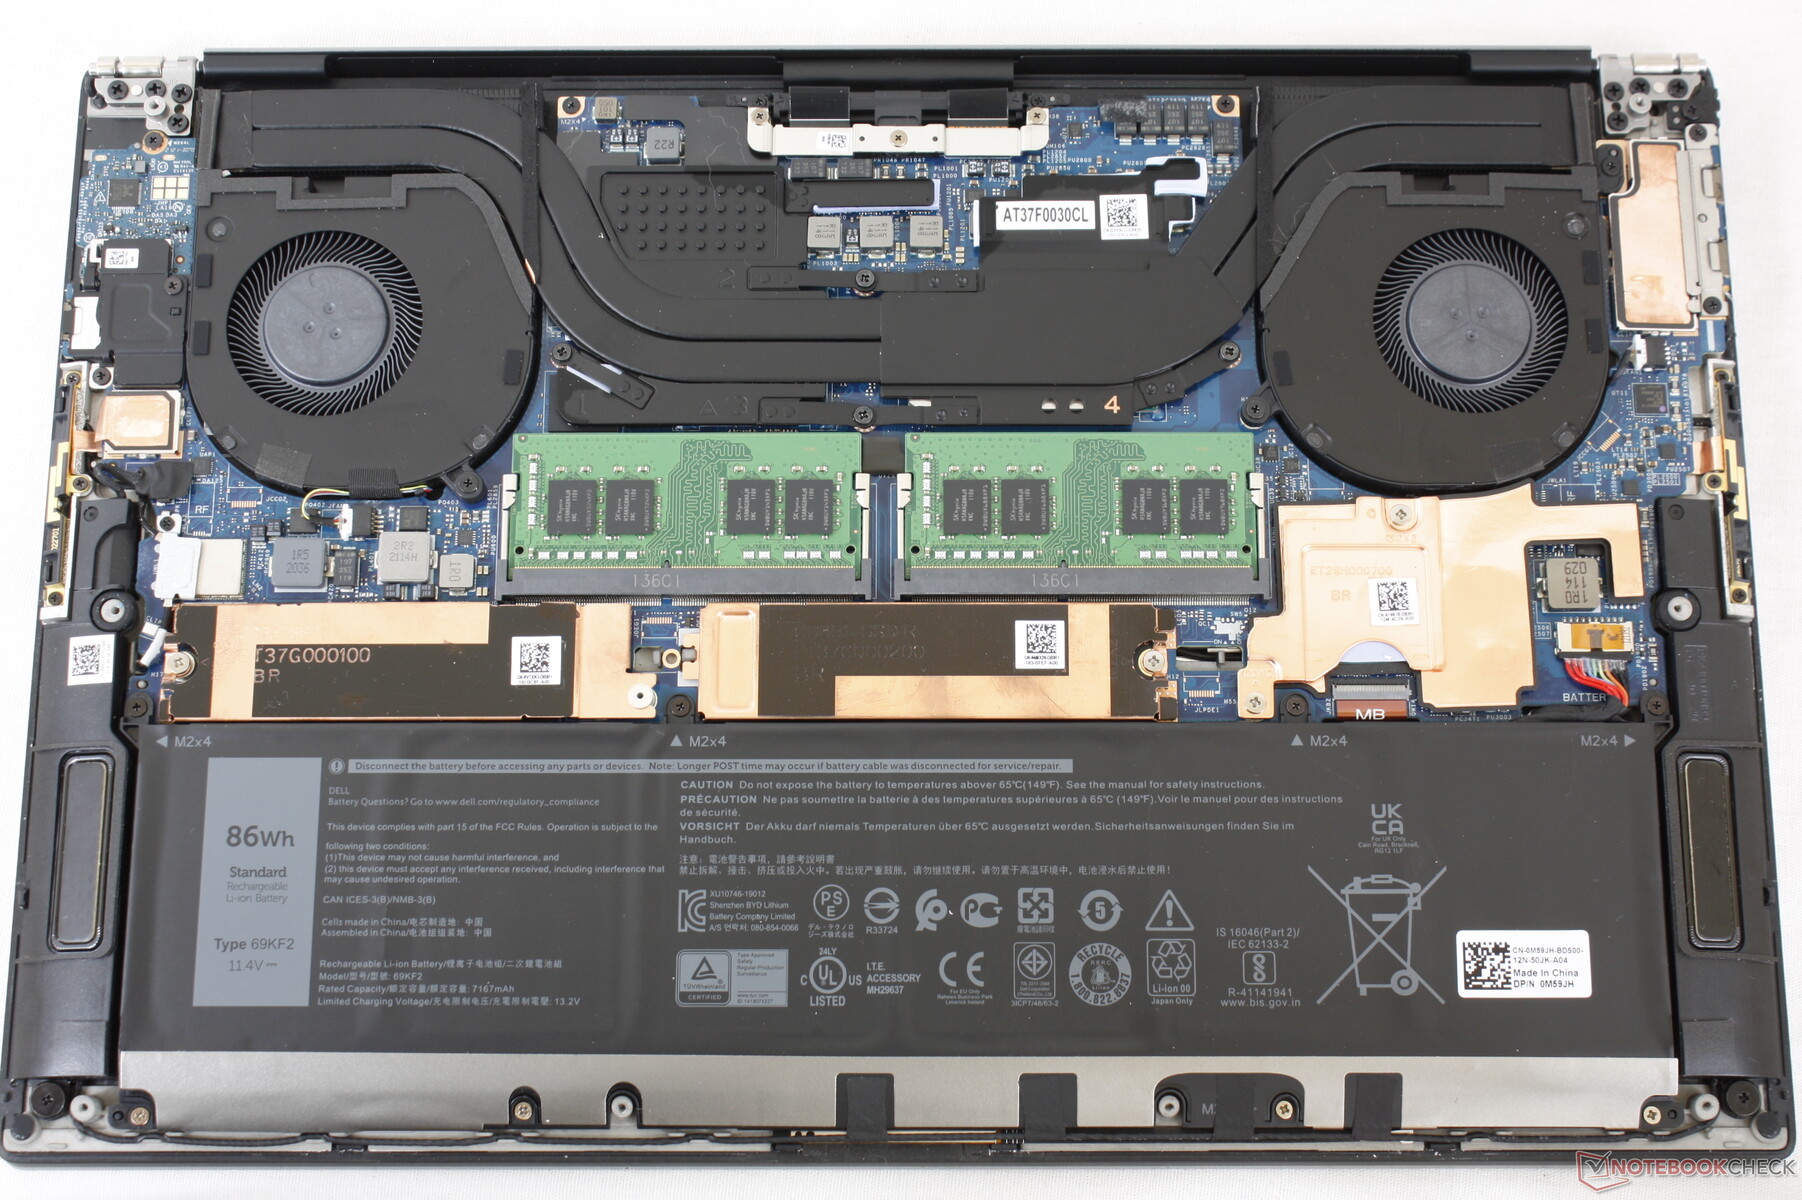
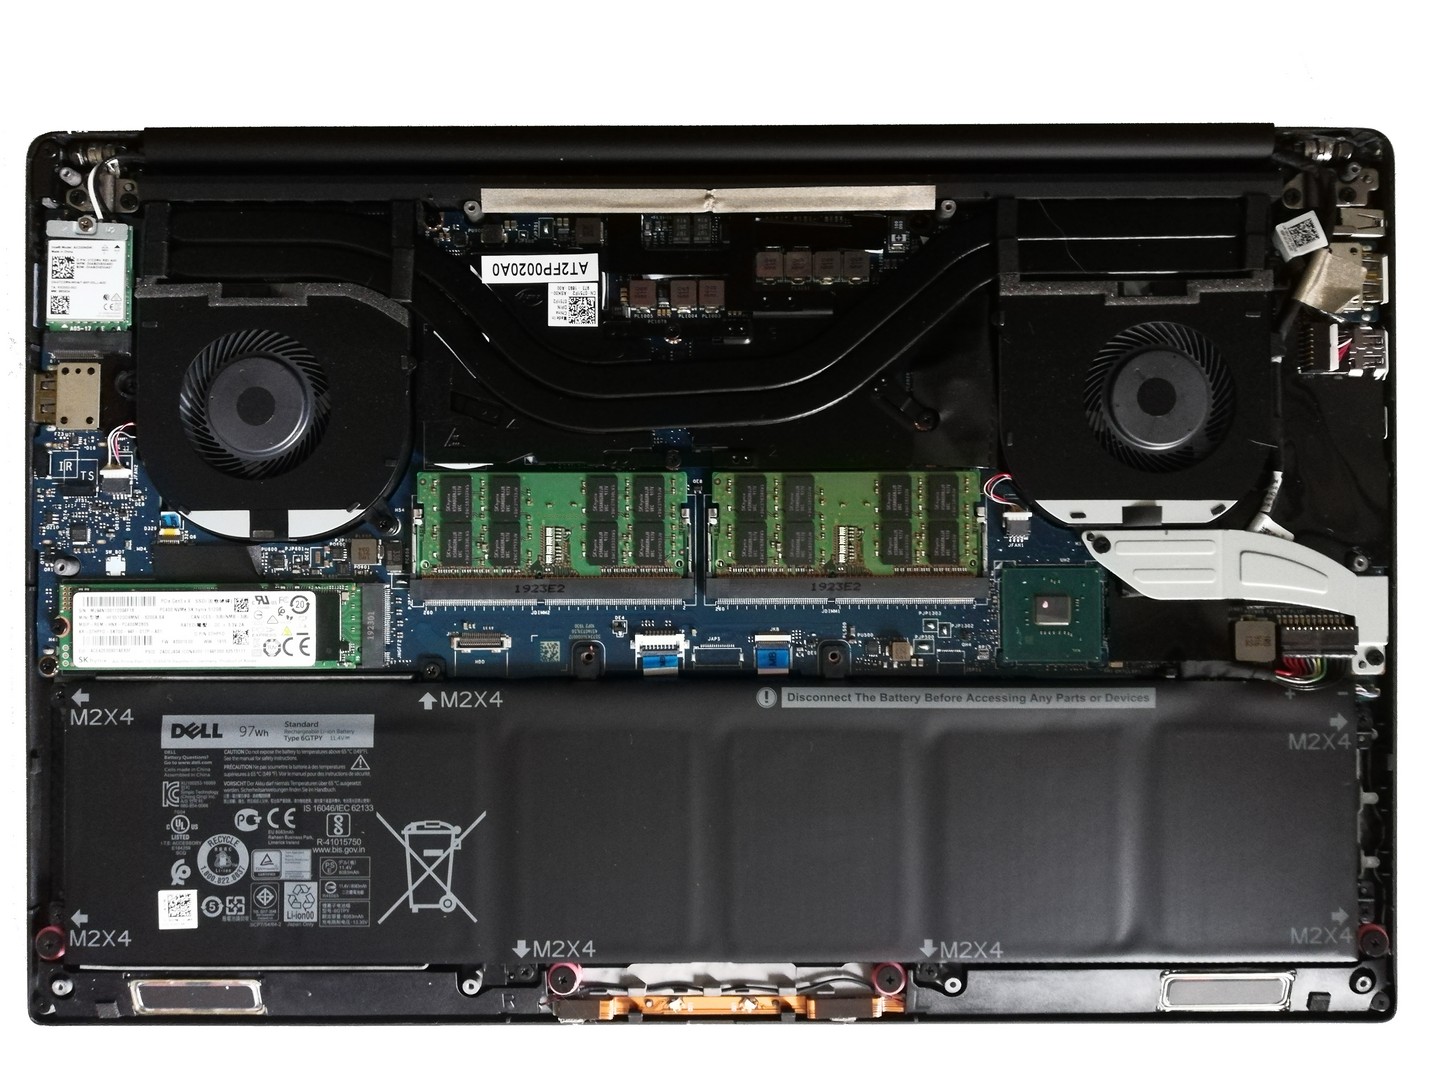
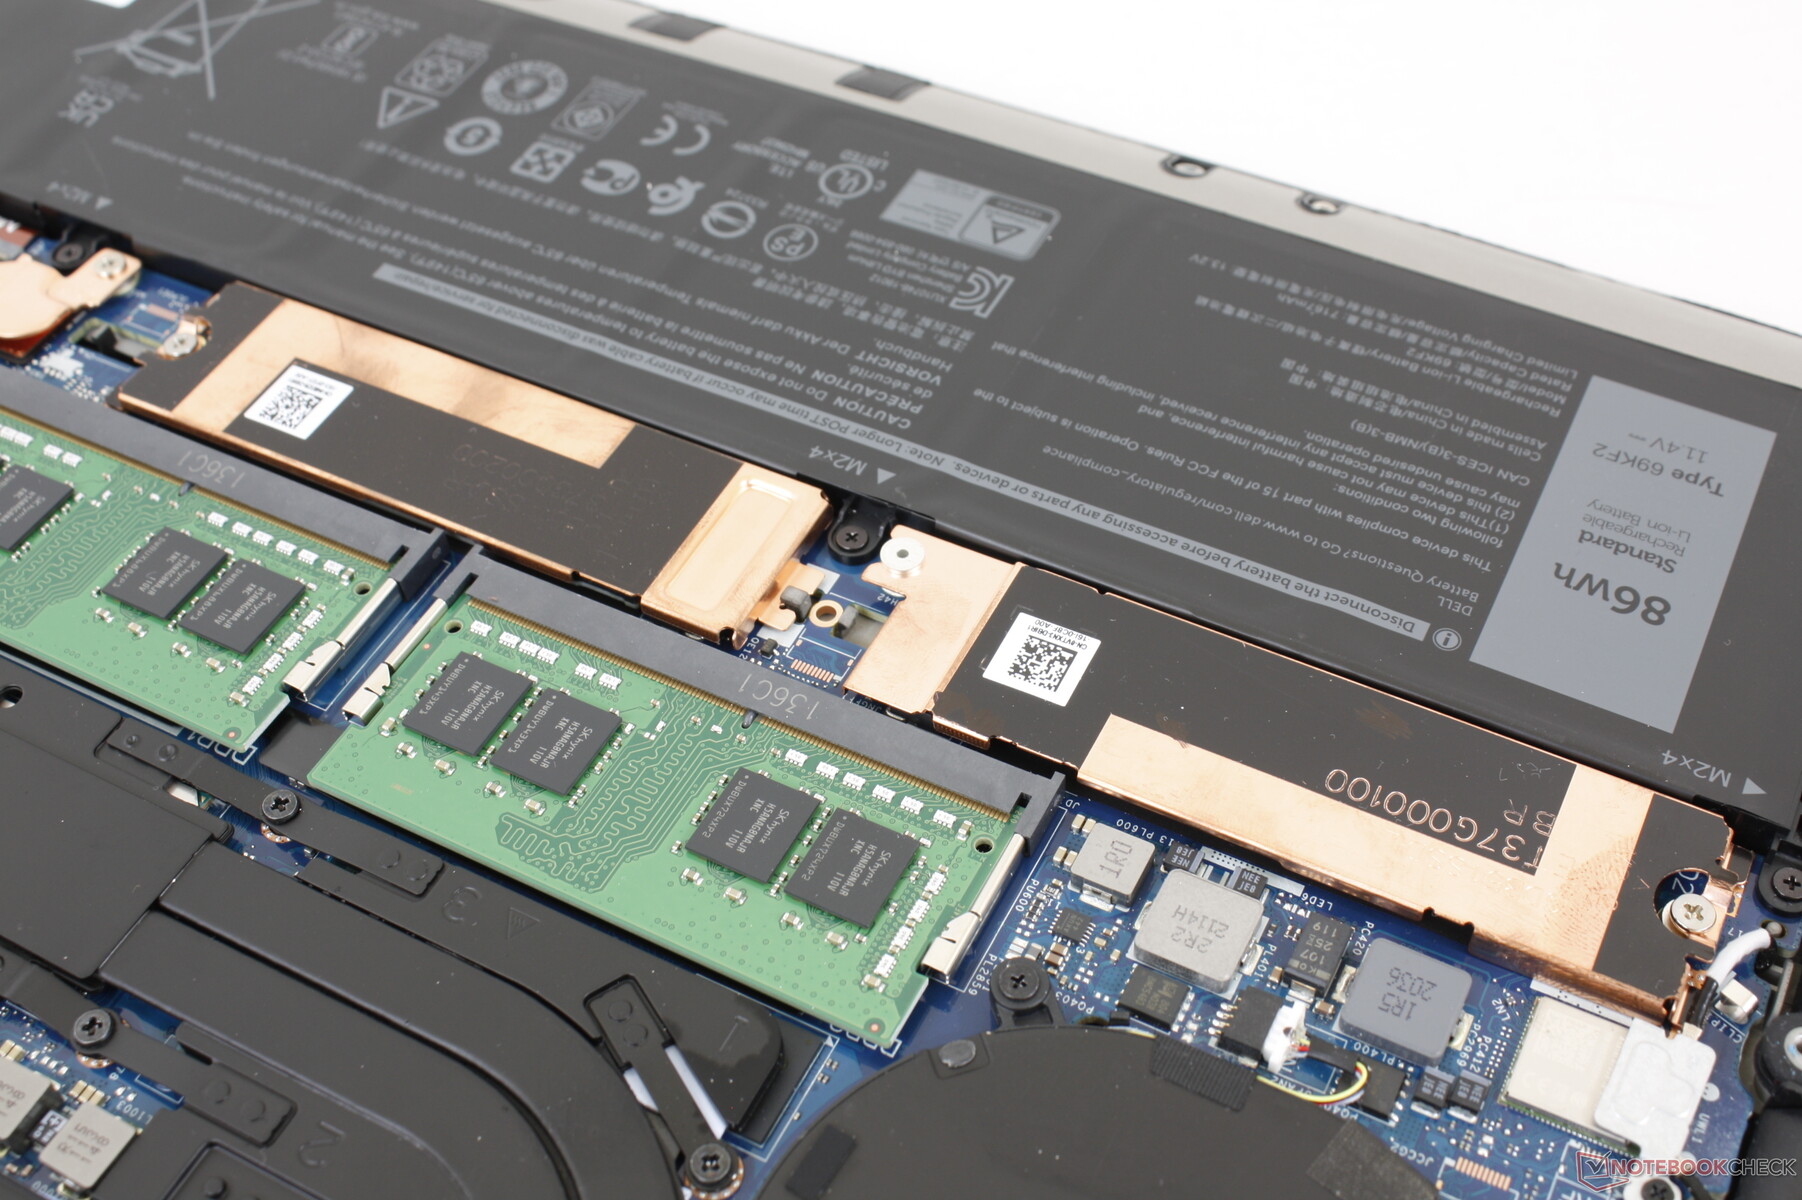
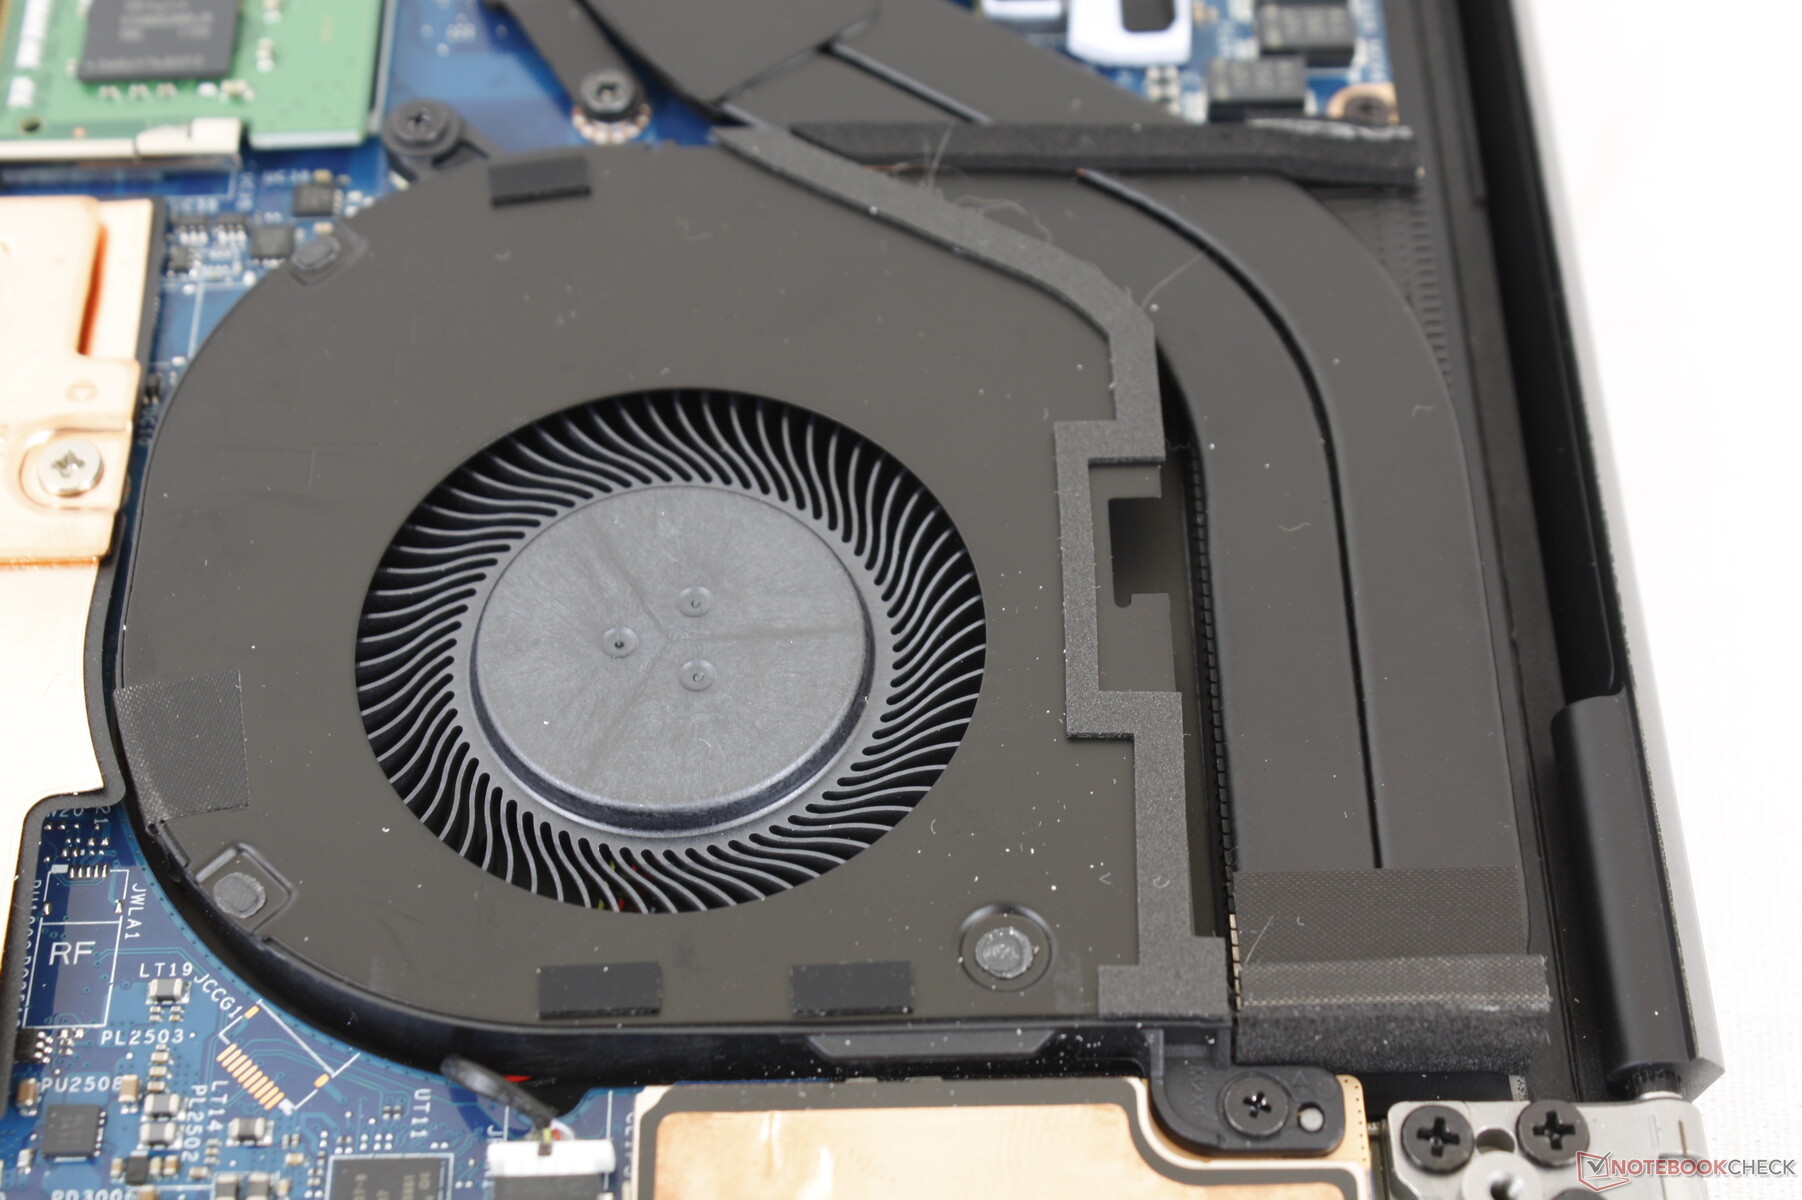
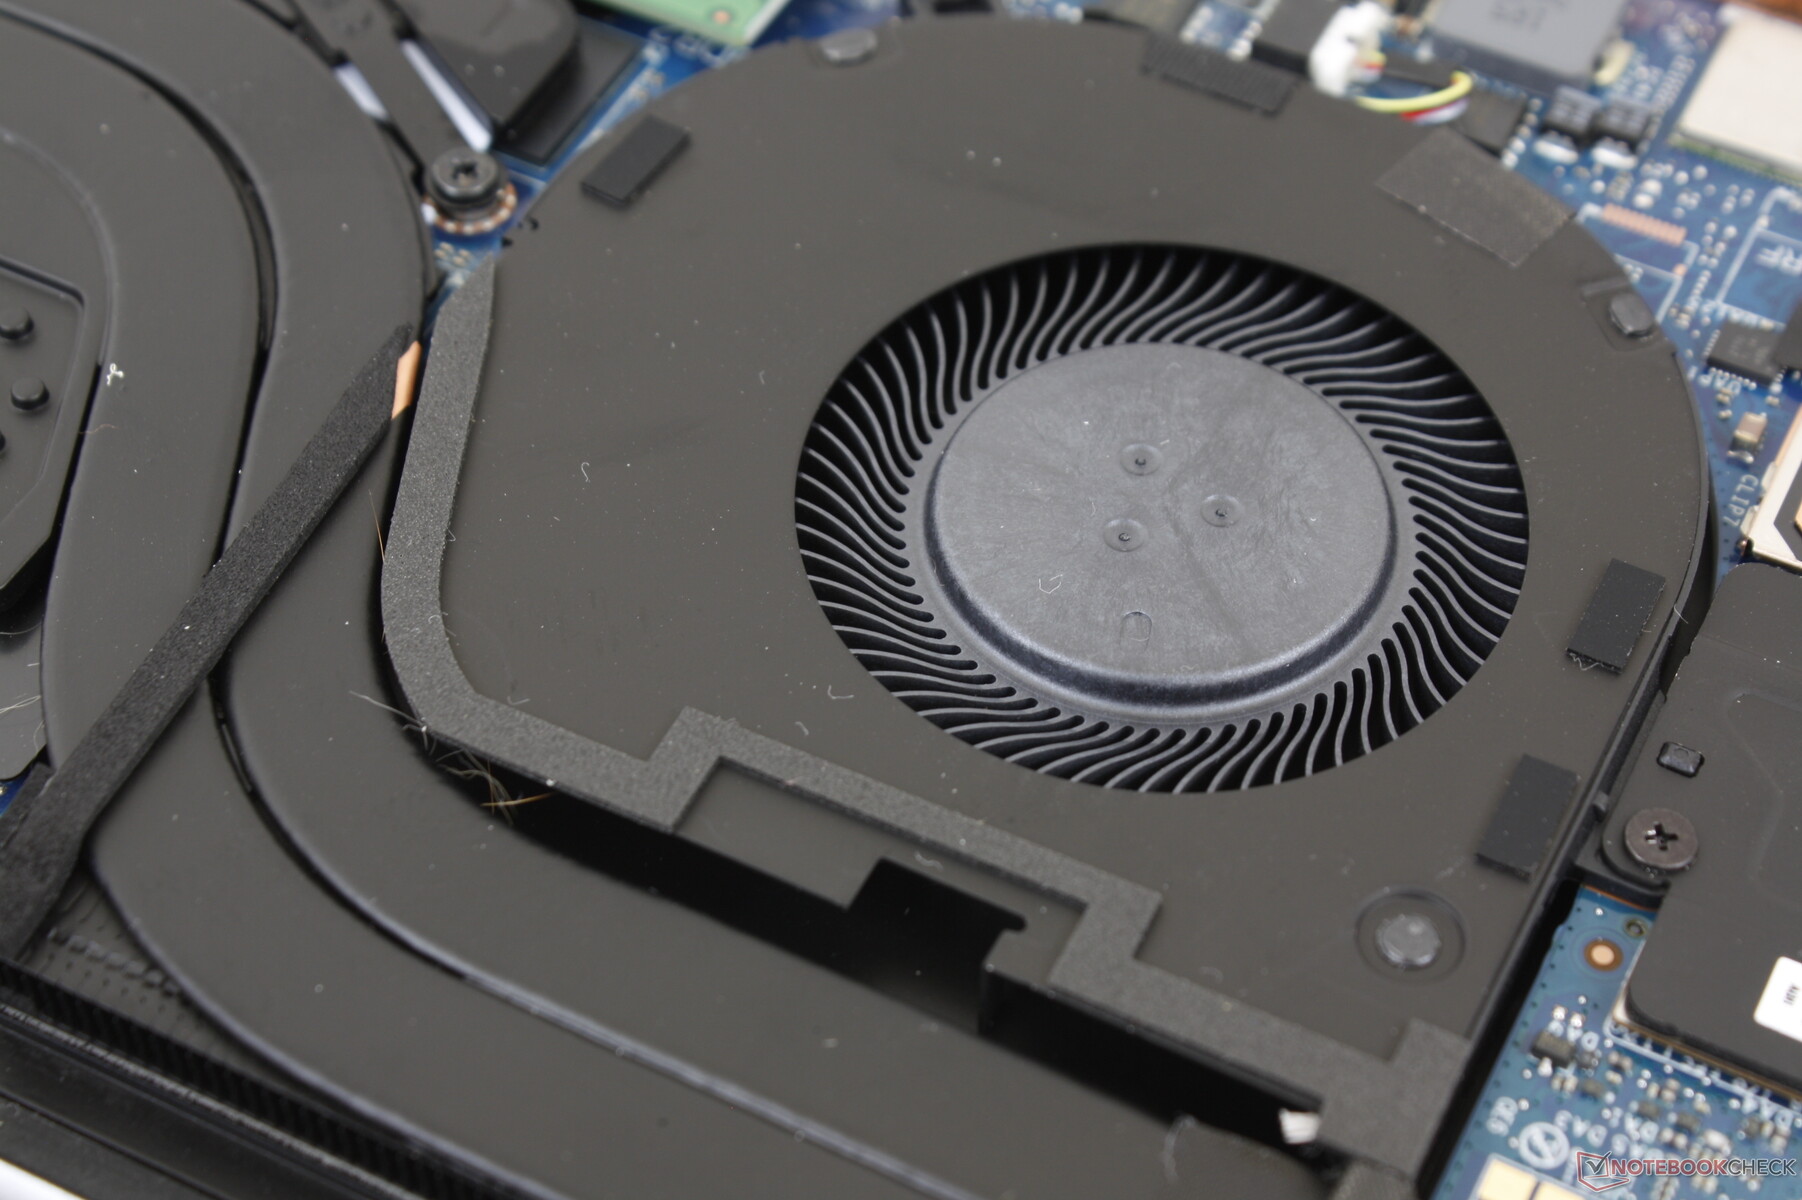
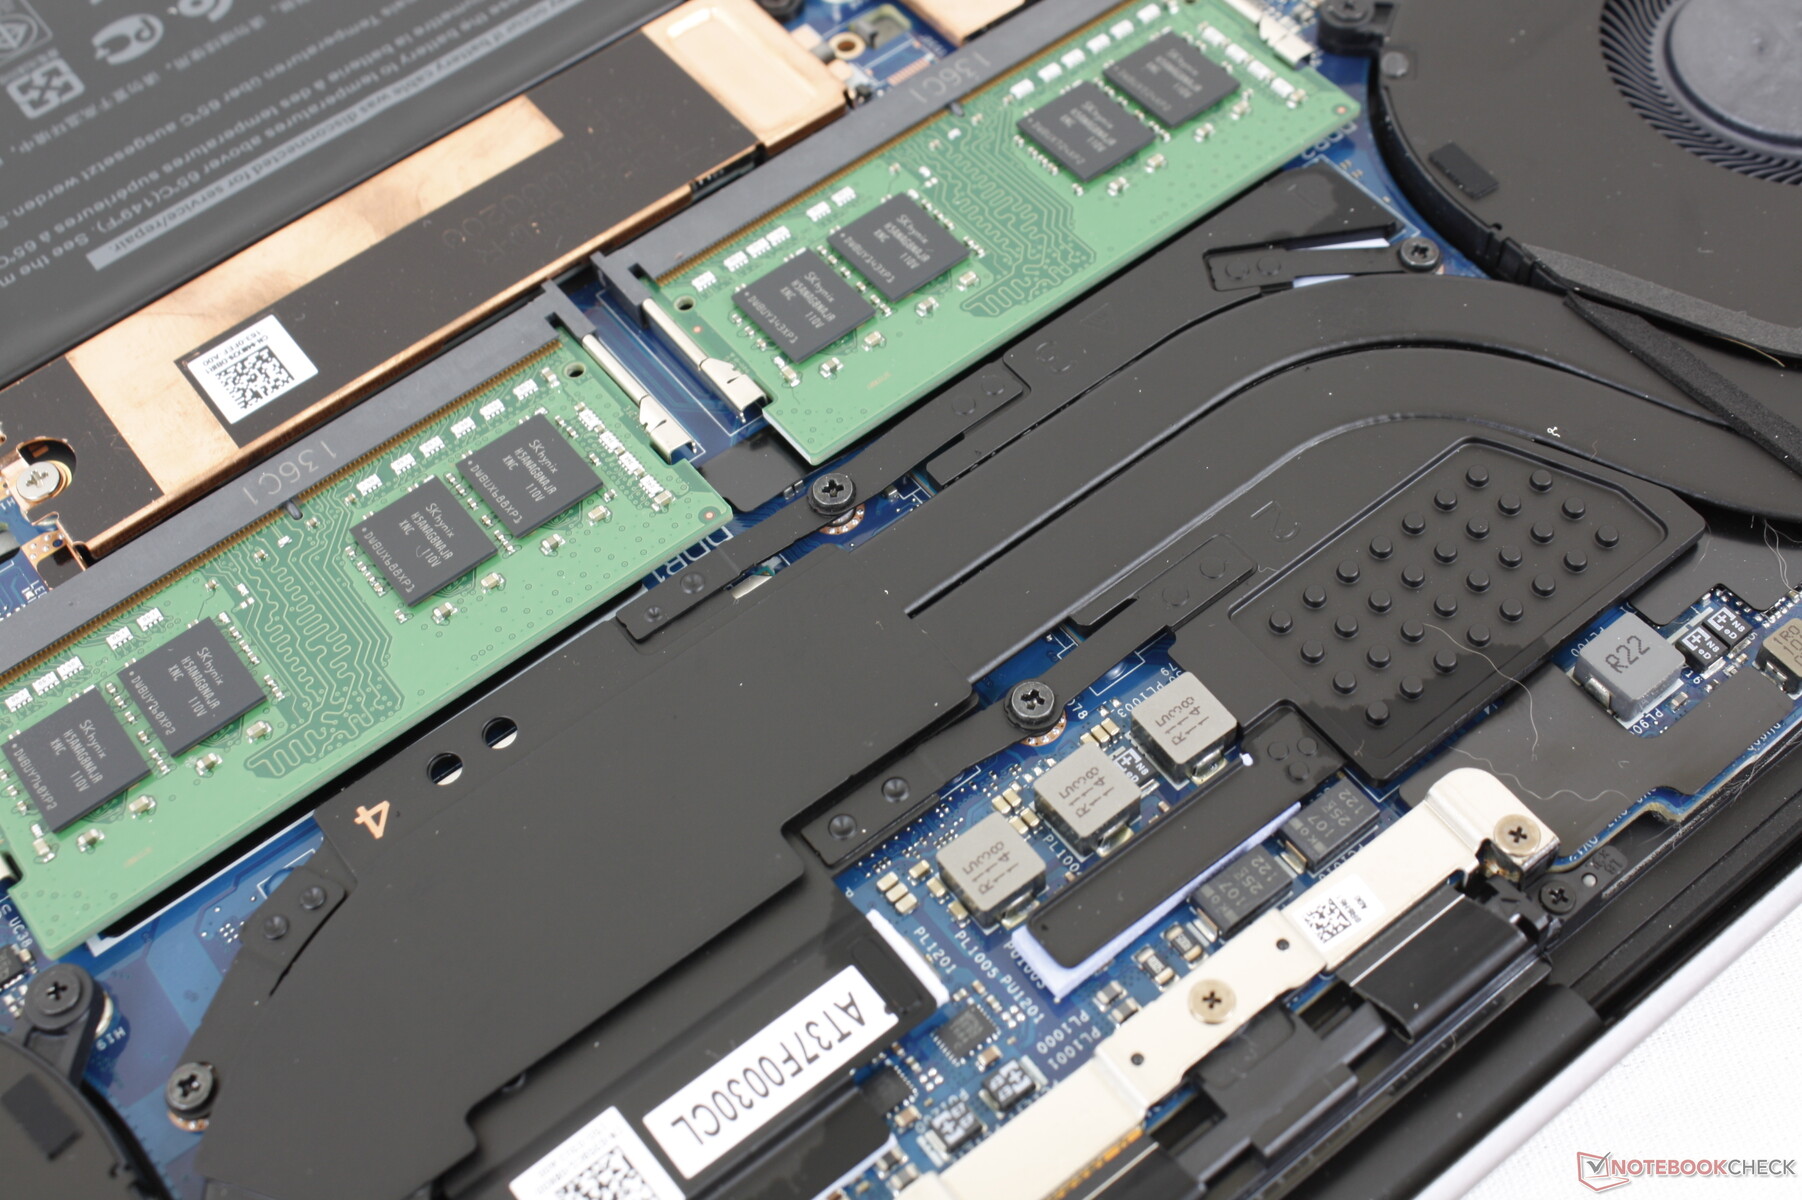
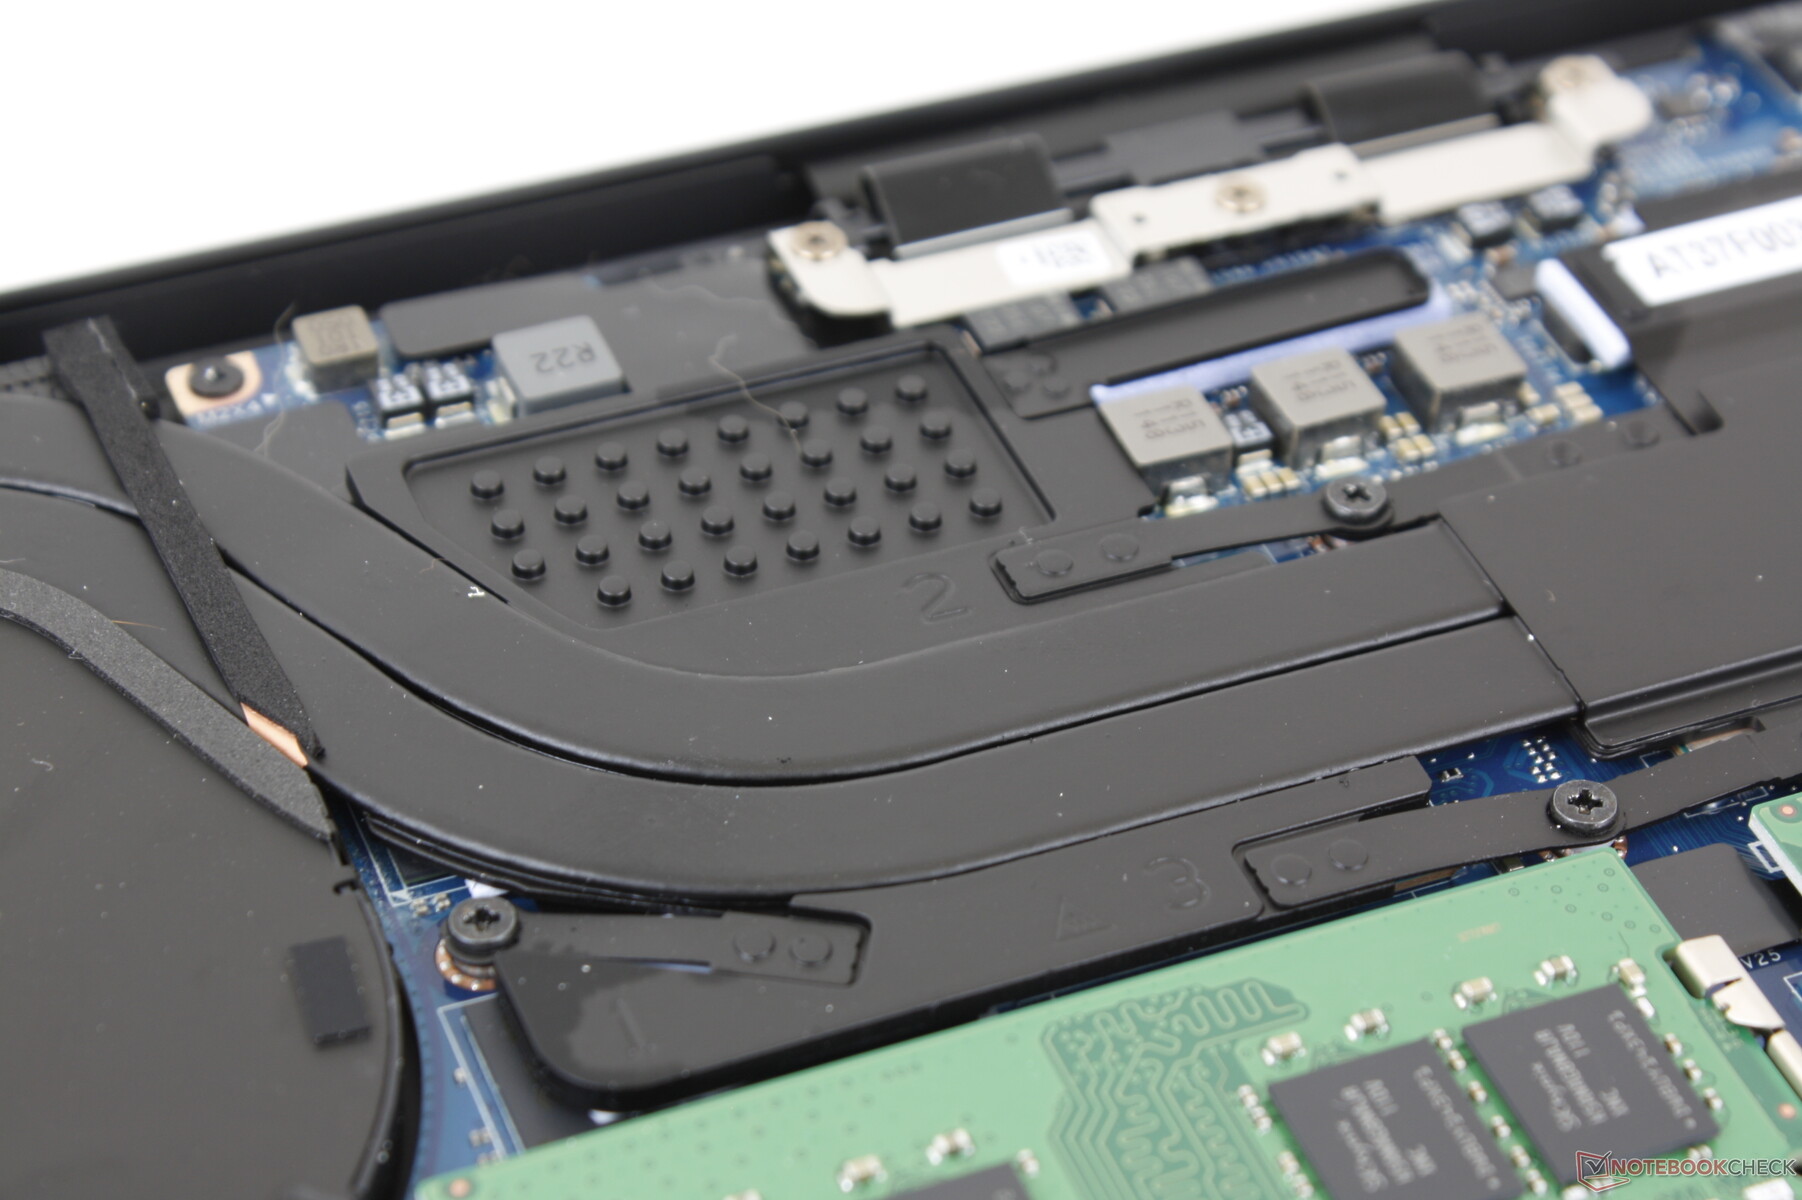
维护
与旧的Precision 5540设计相比,底部面板更难拆除。内部布局在其他方面与Precision 5550基本相同。
配件和保修
零售包装盒包括一个方便的USB-C转全尺寸USB-A和HDMI适配器,就像XPS 15一样。
令人失望的是,基本保修期只有一年,而不是许多其他移动工作站的两年或三年。用户将不得不升级到更高端的Precision 7000系列,以获得更长的基本保修。
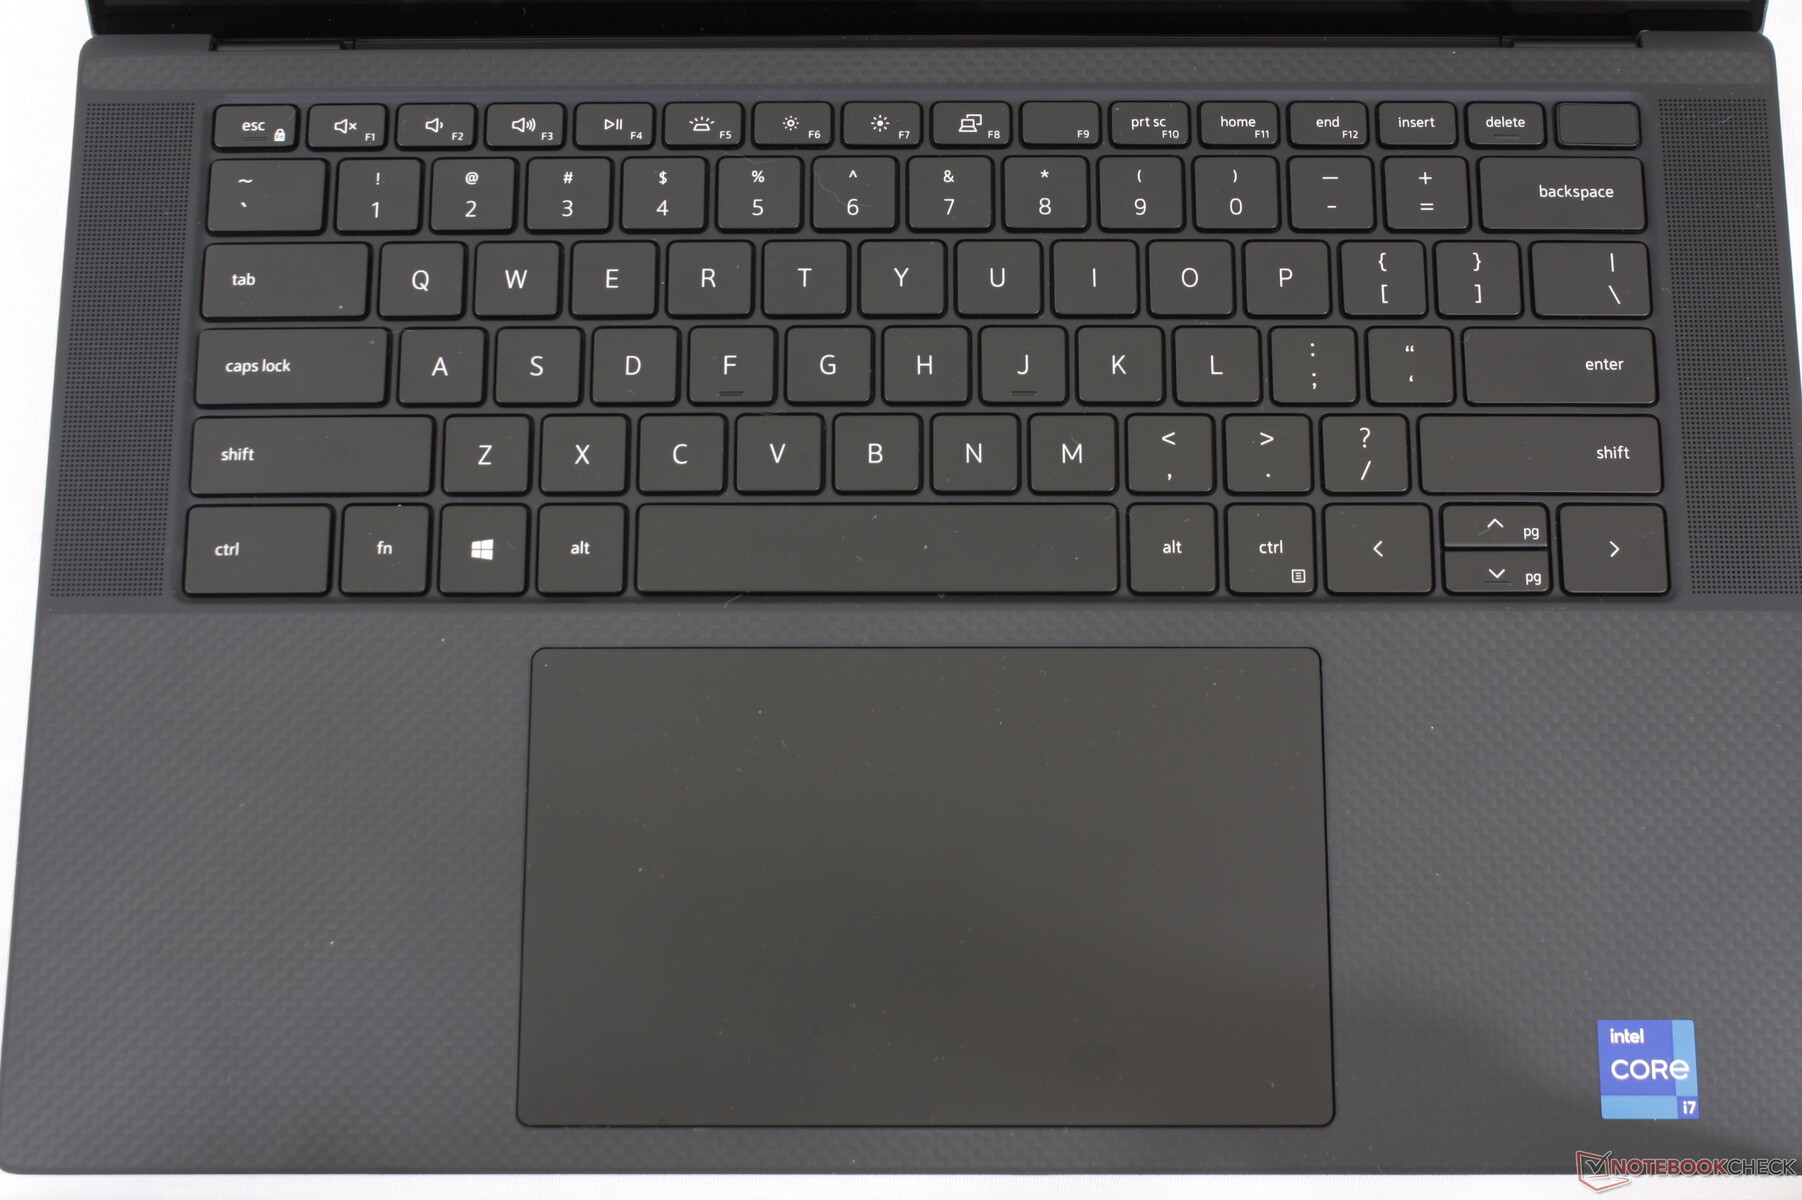
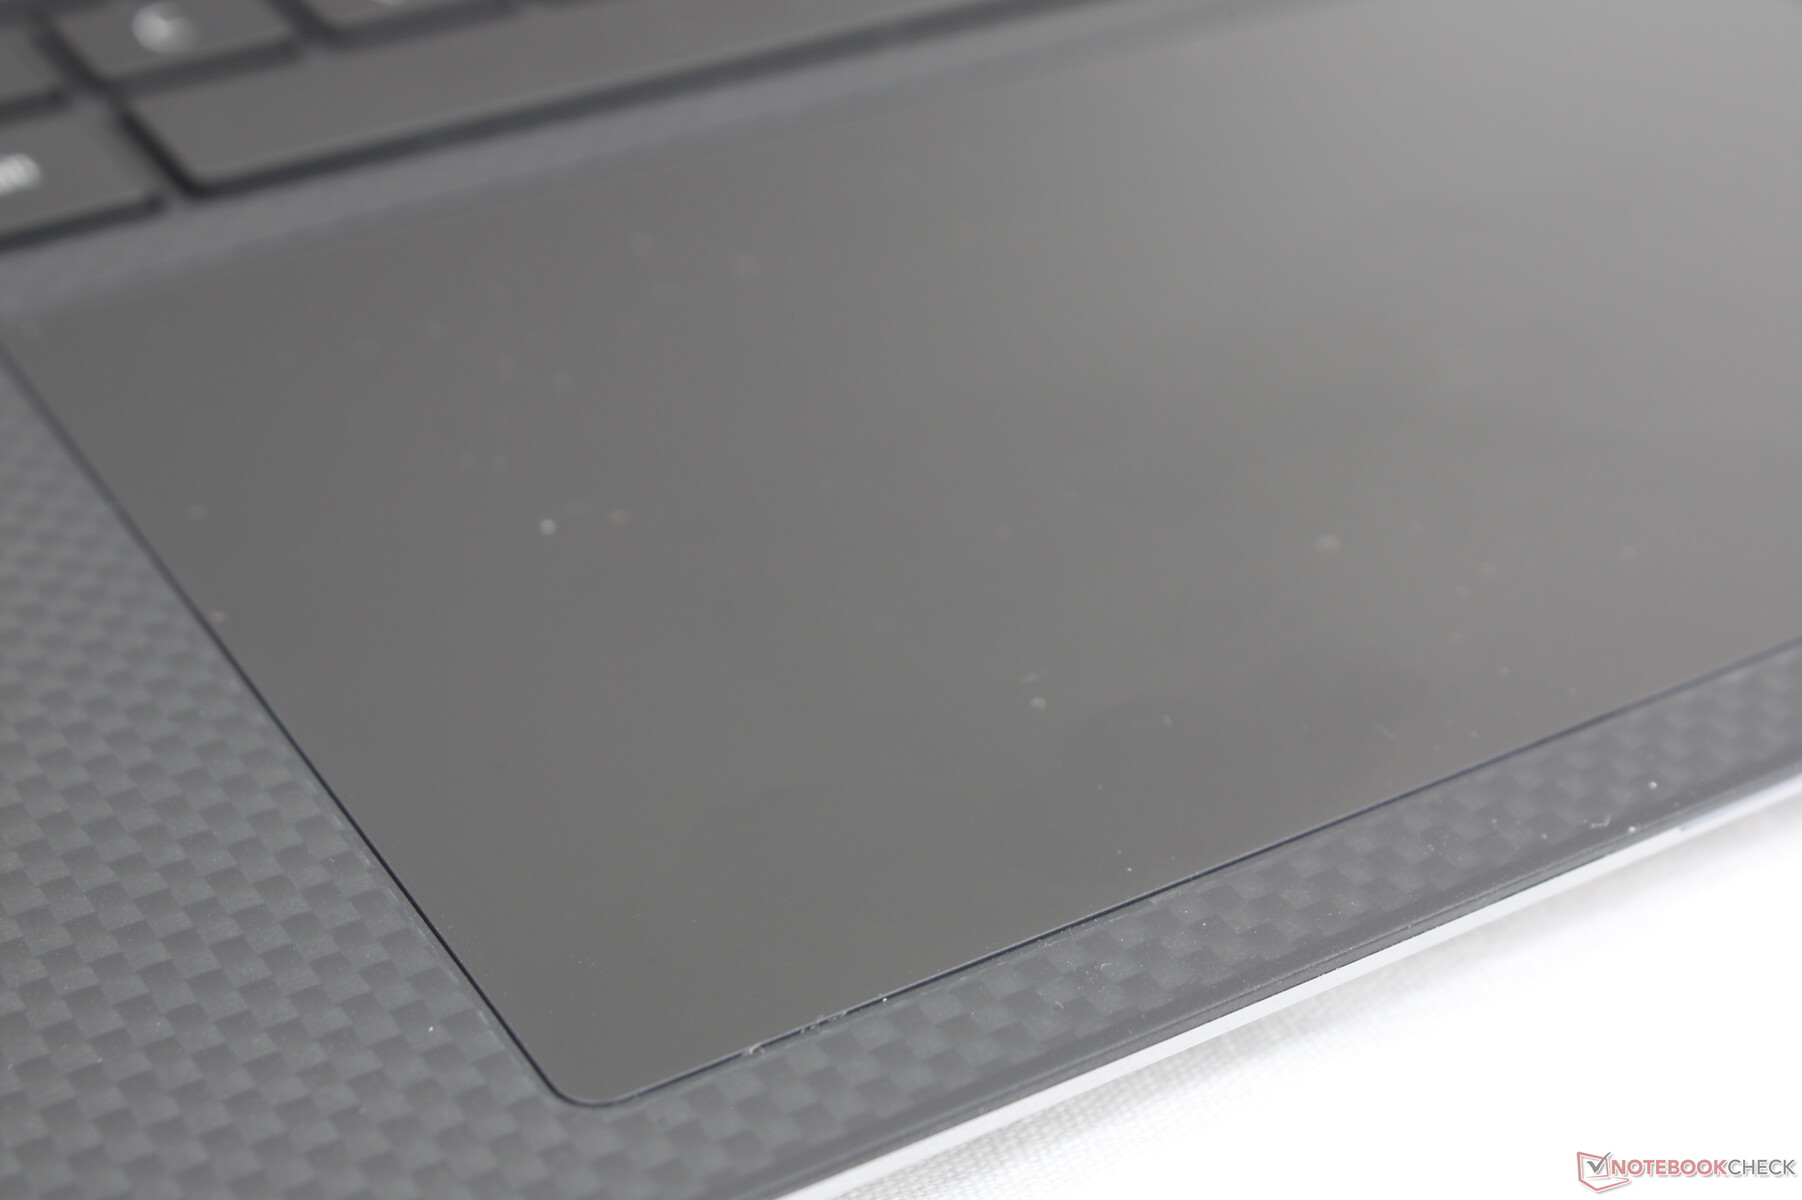
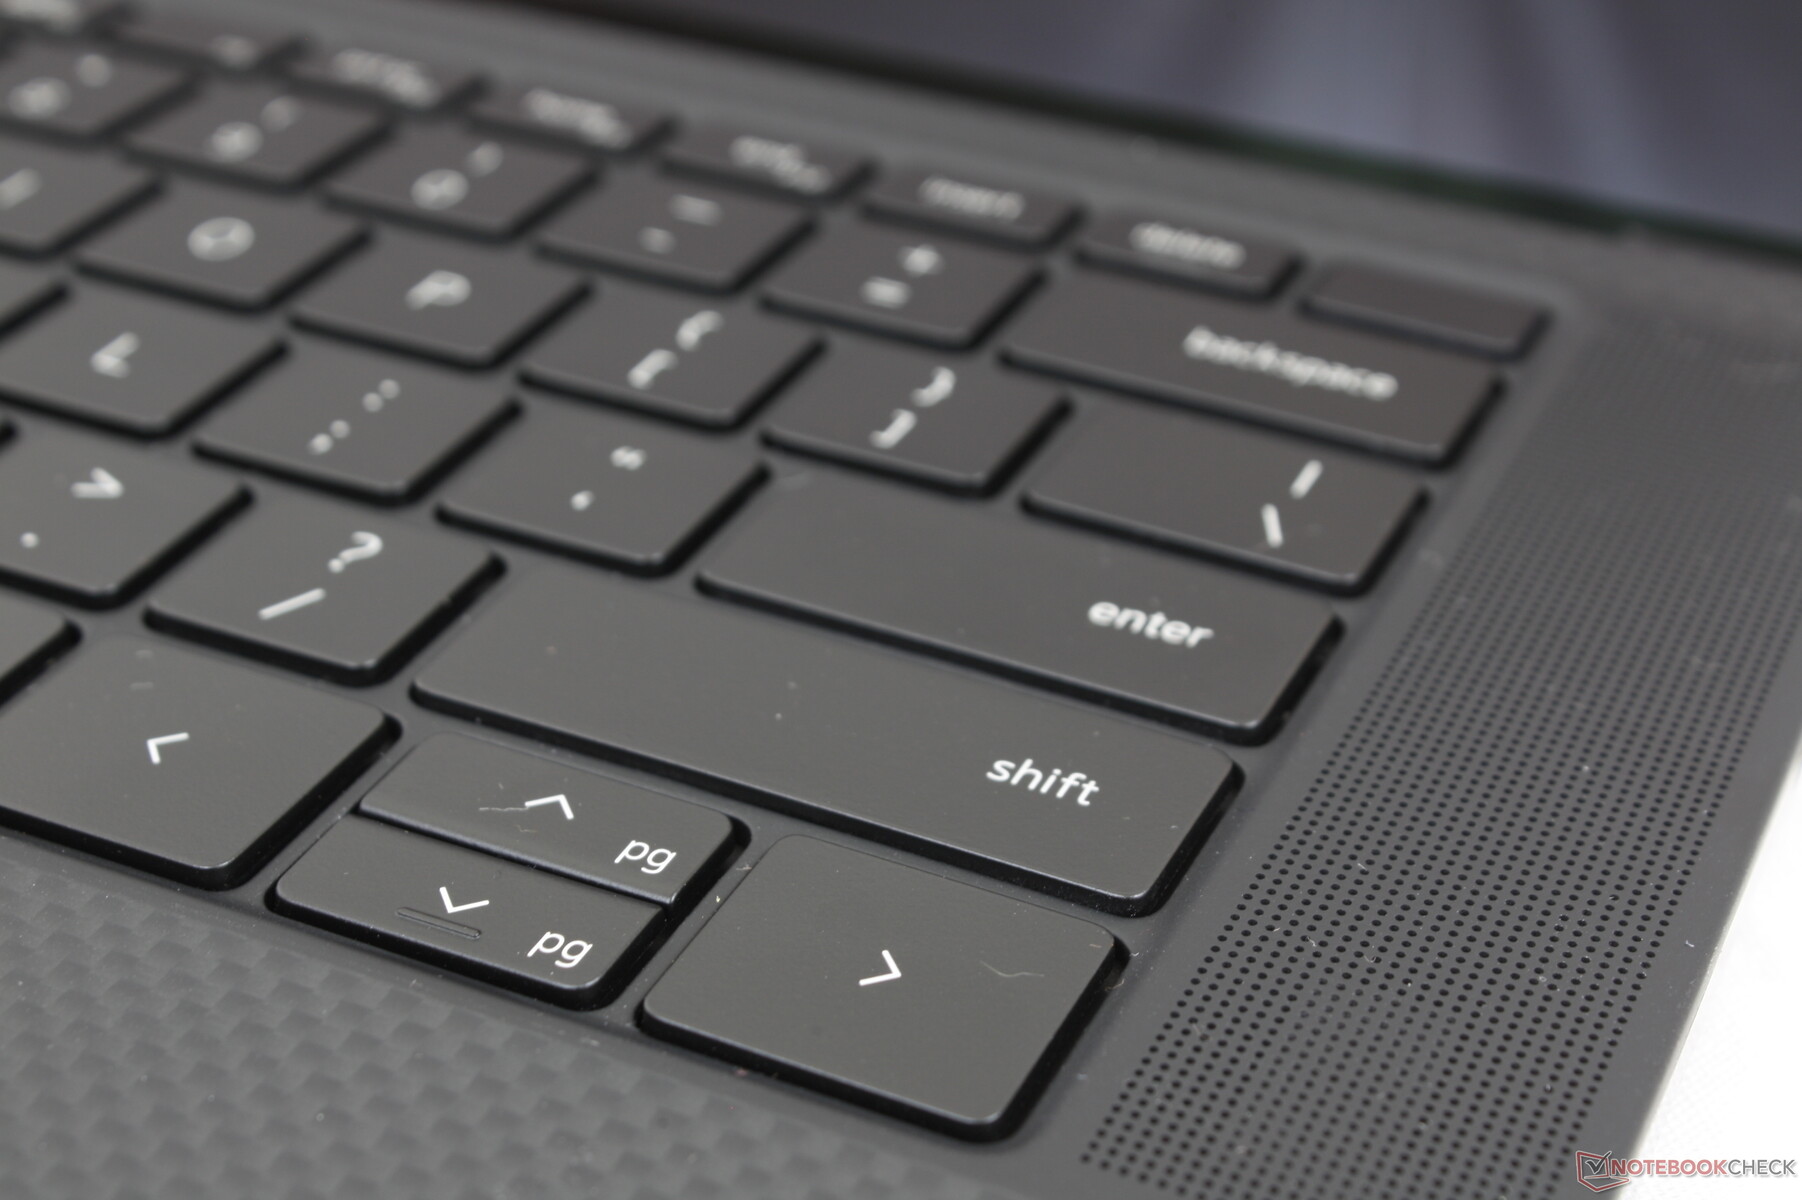
输入设备

显示
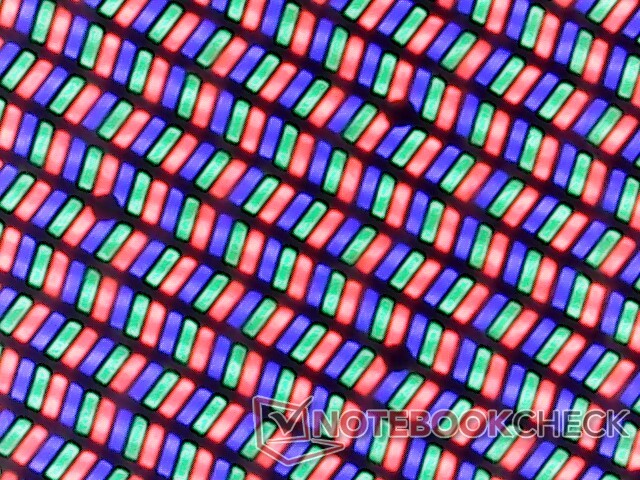
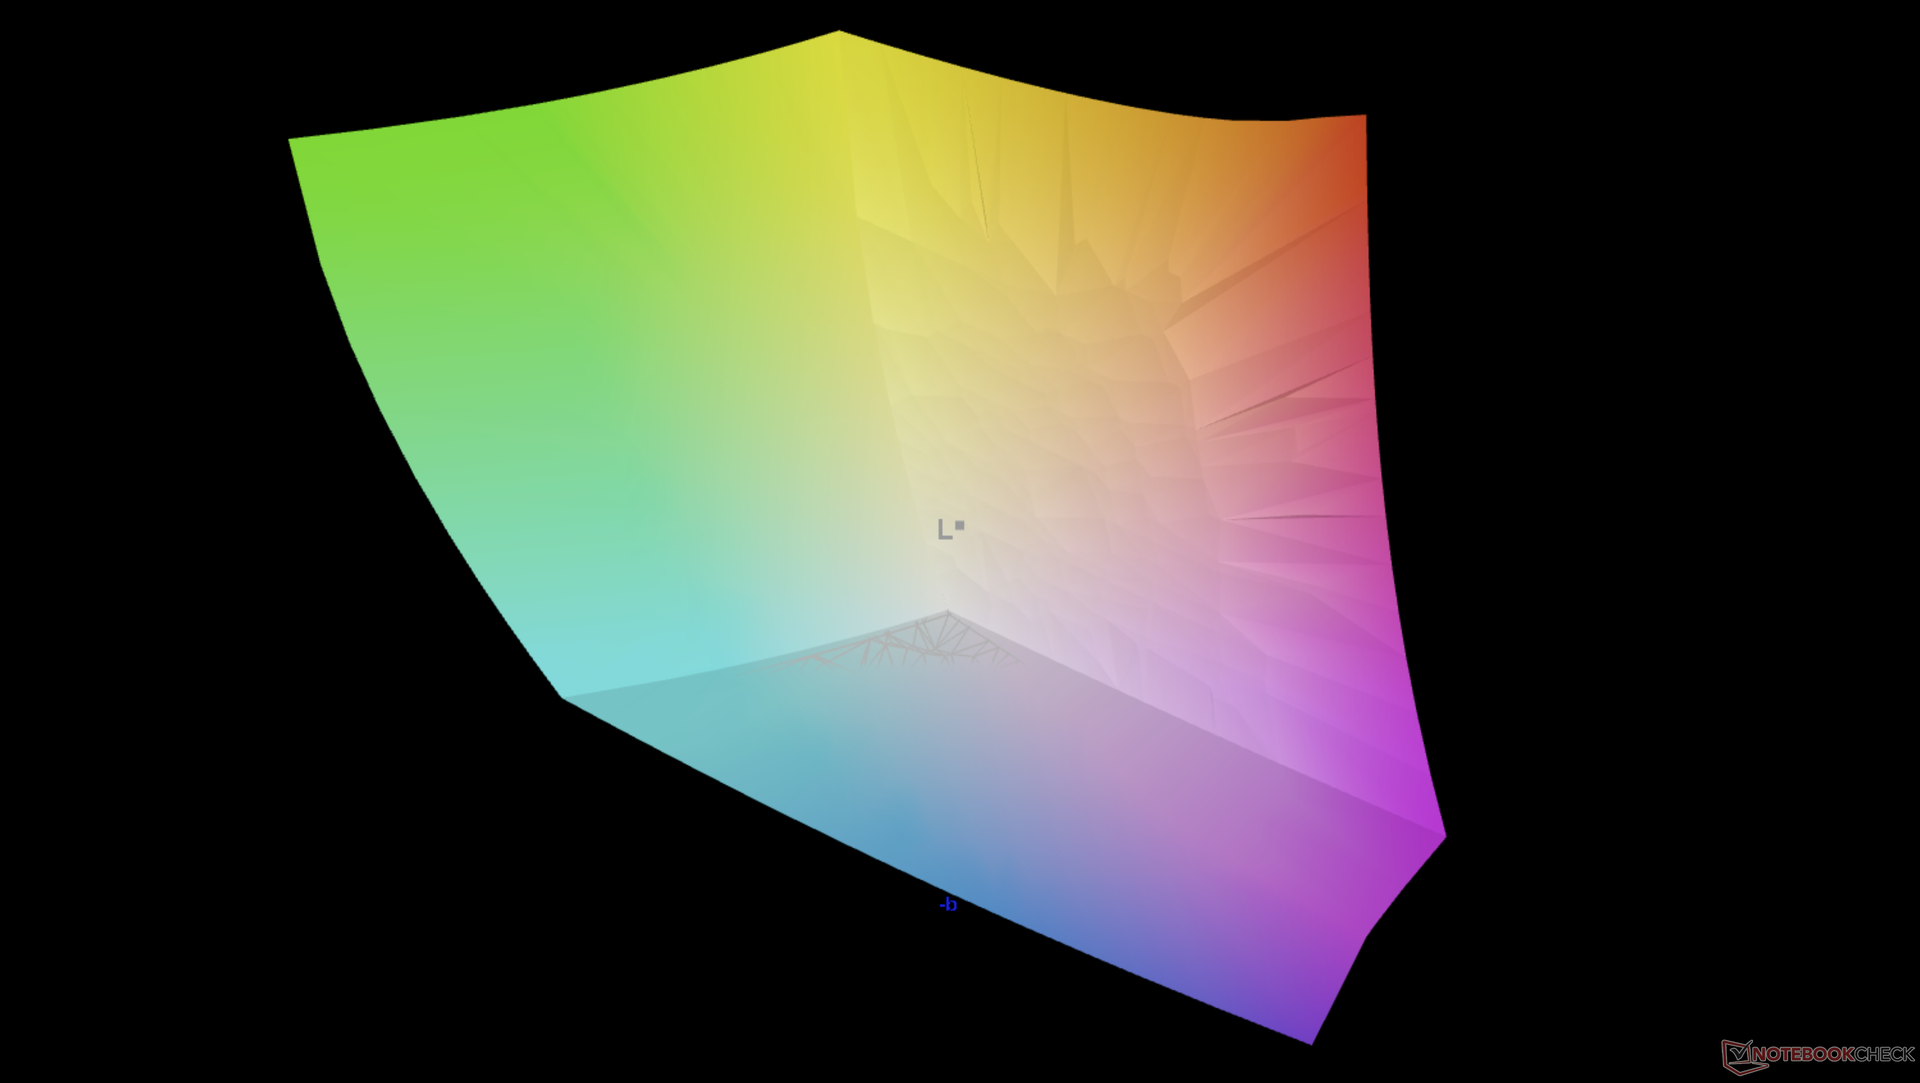
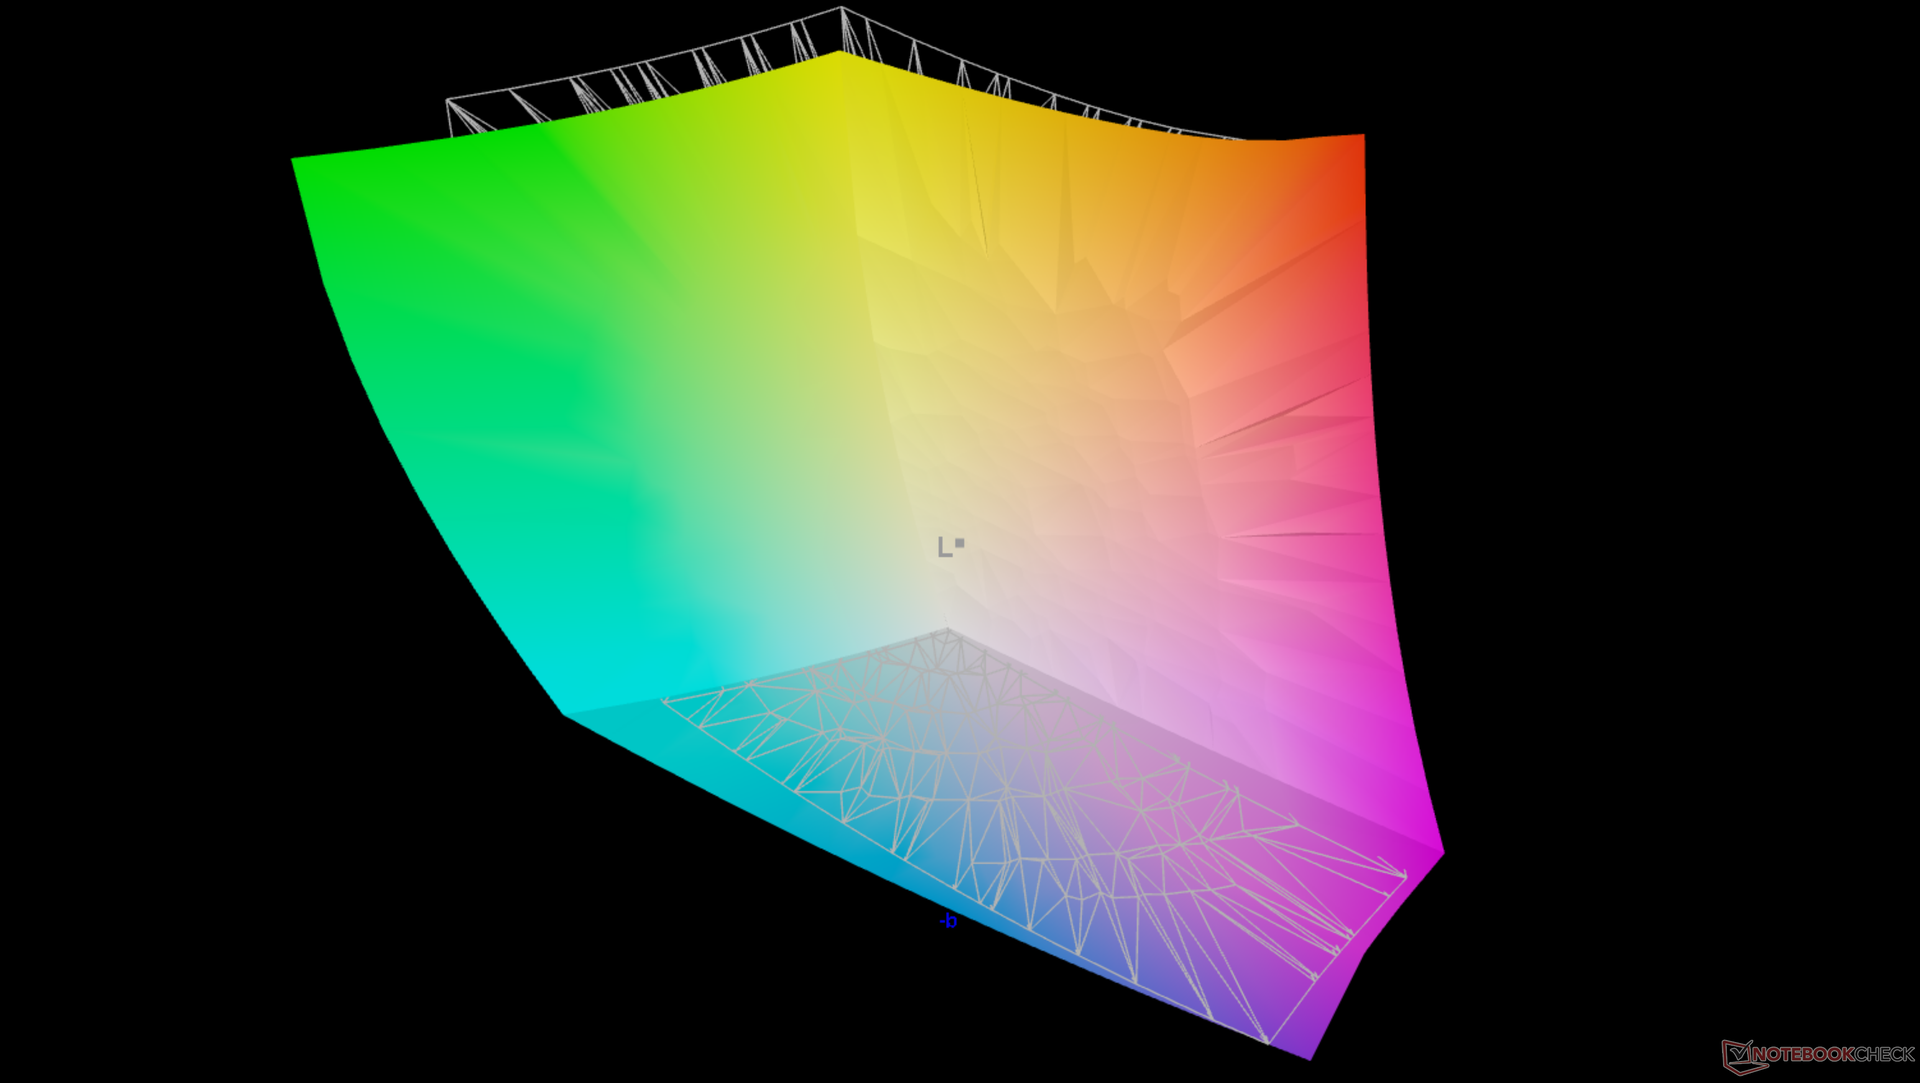
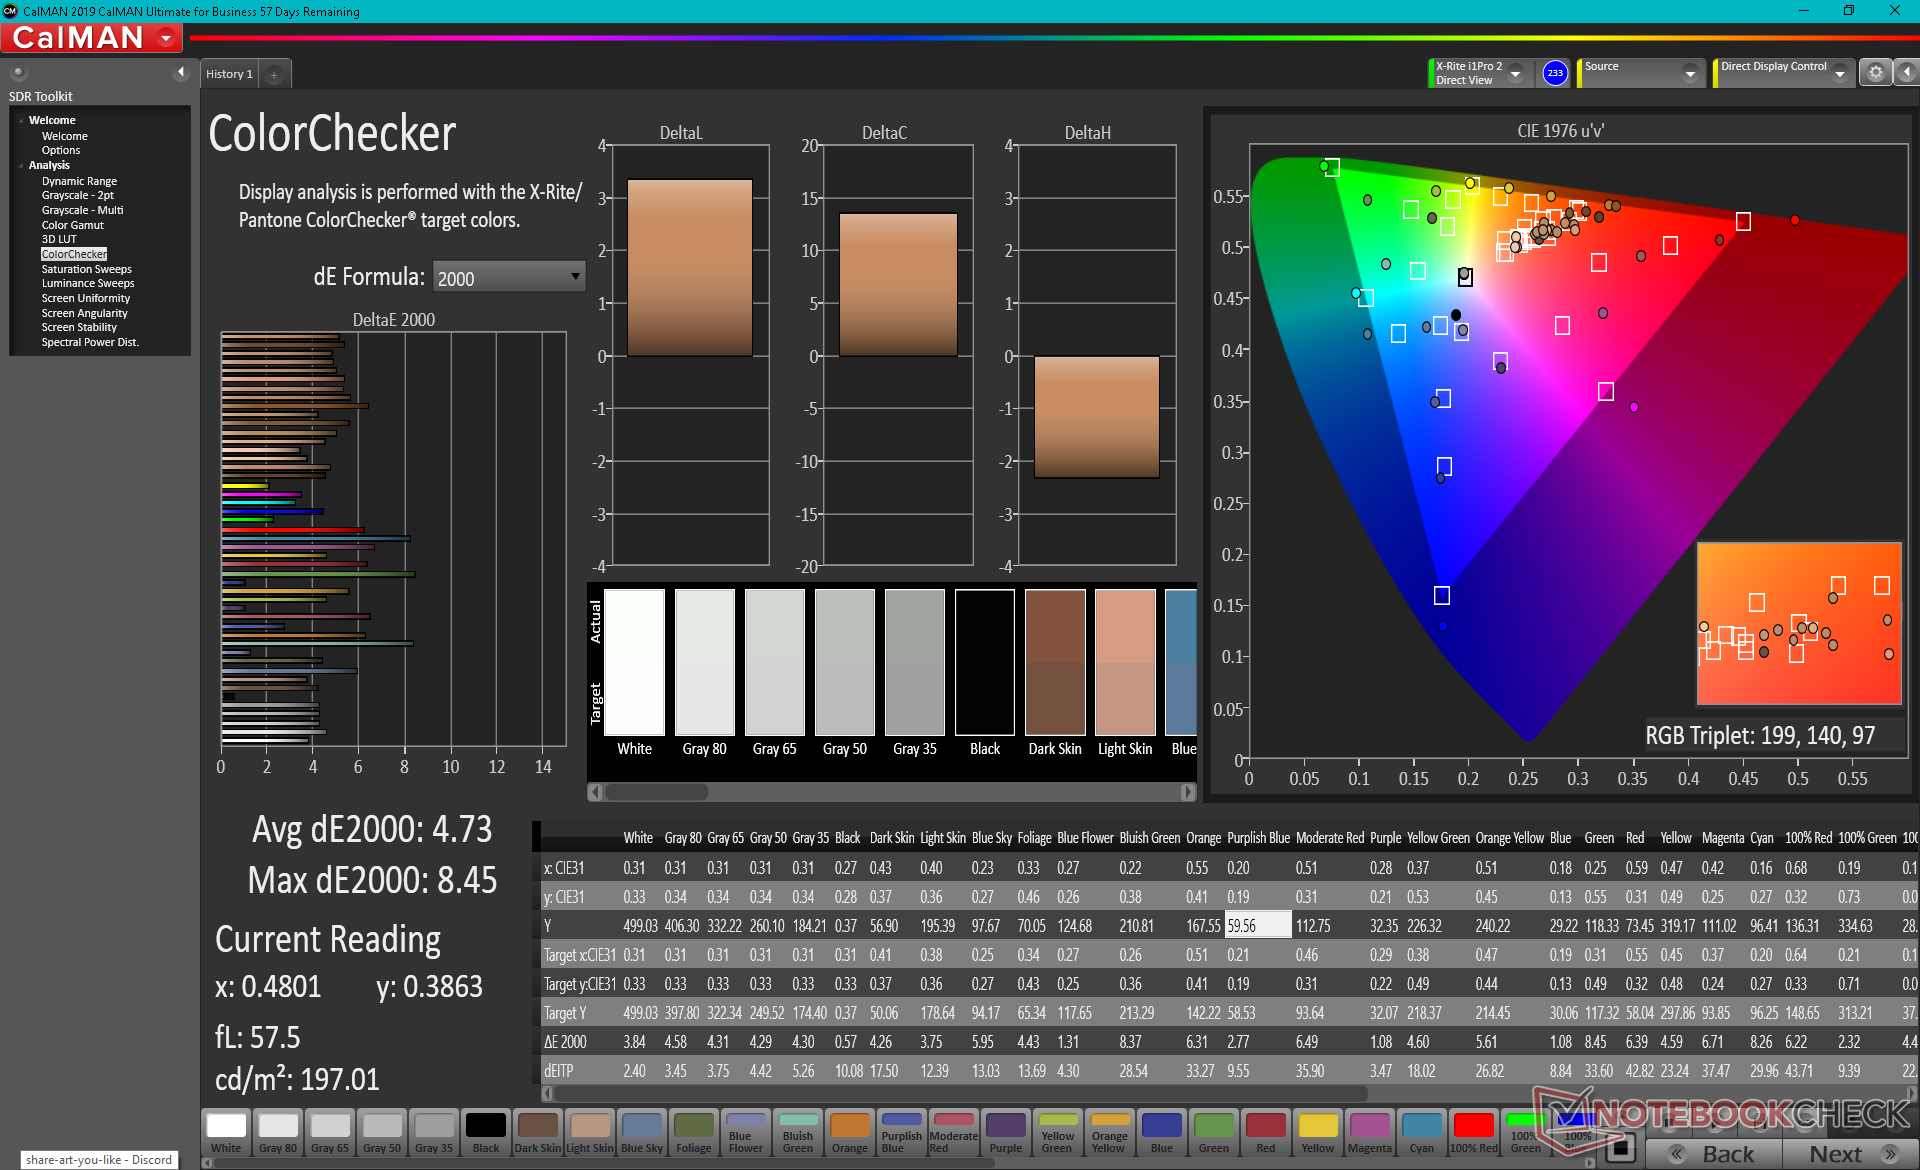
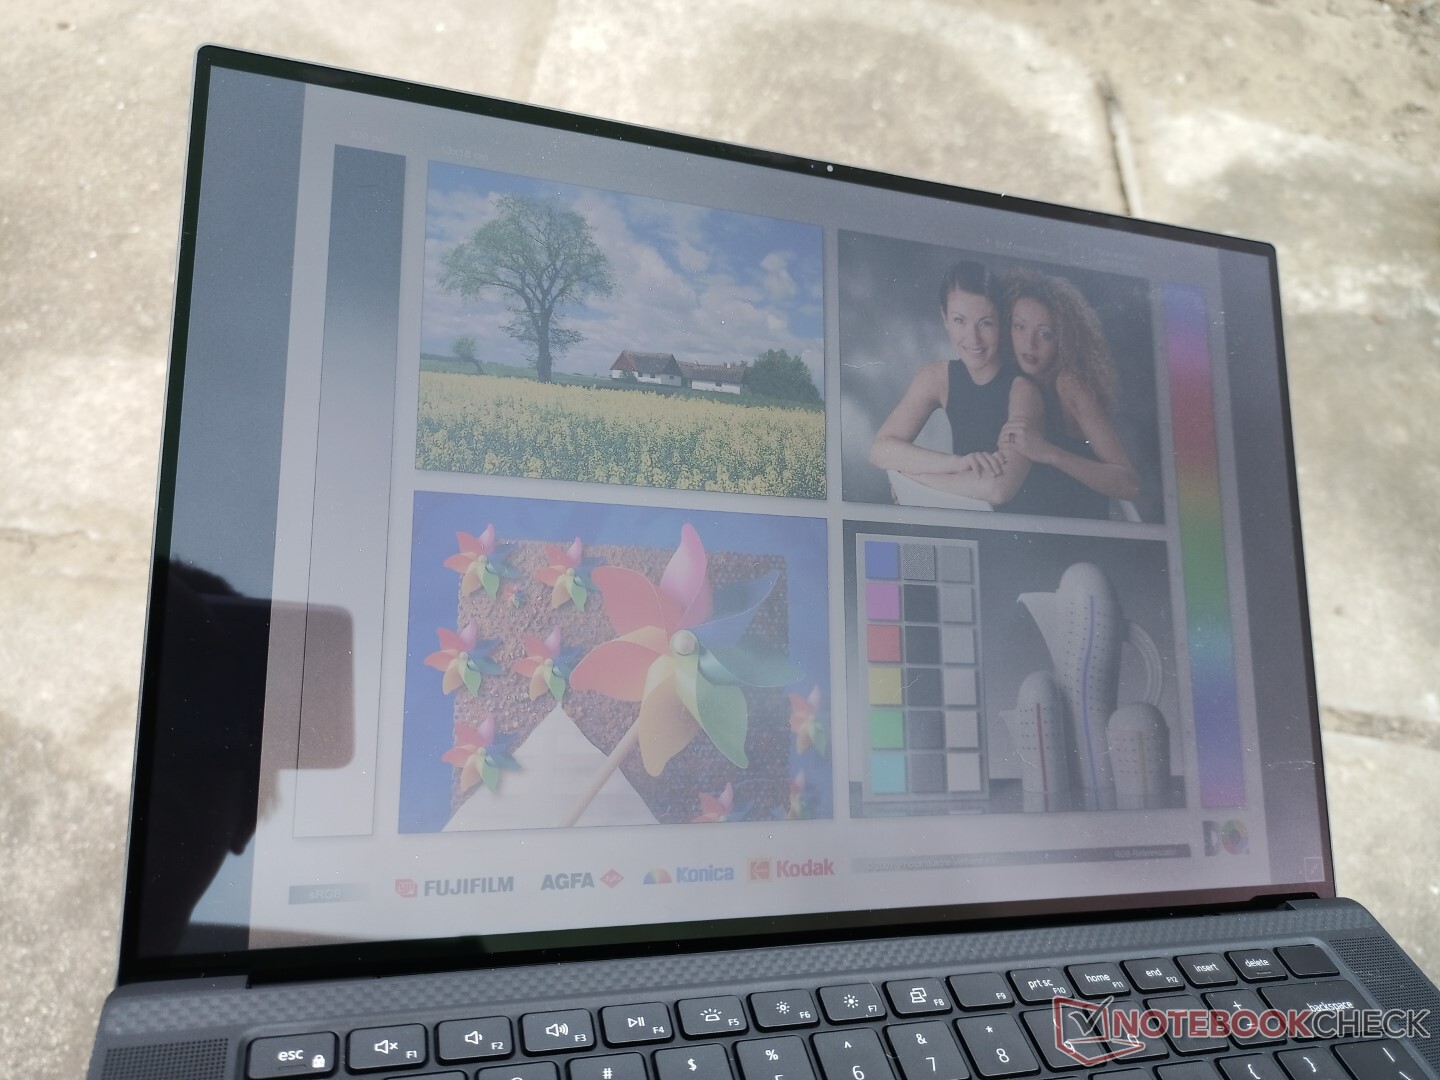
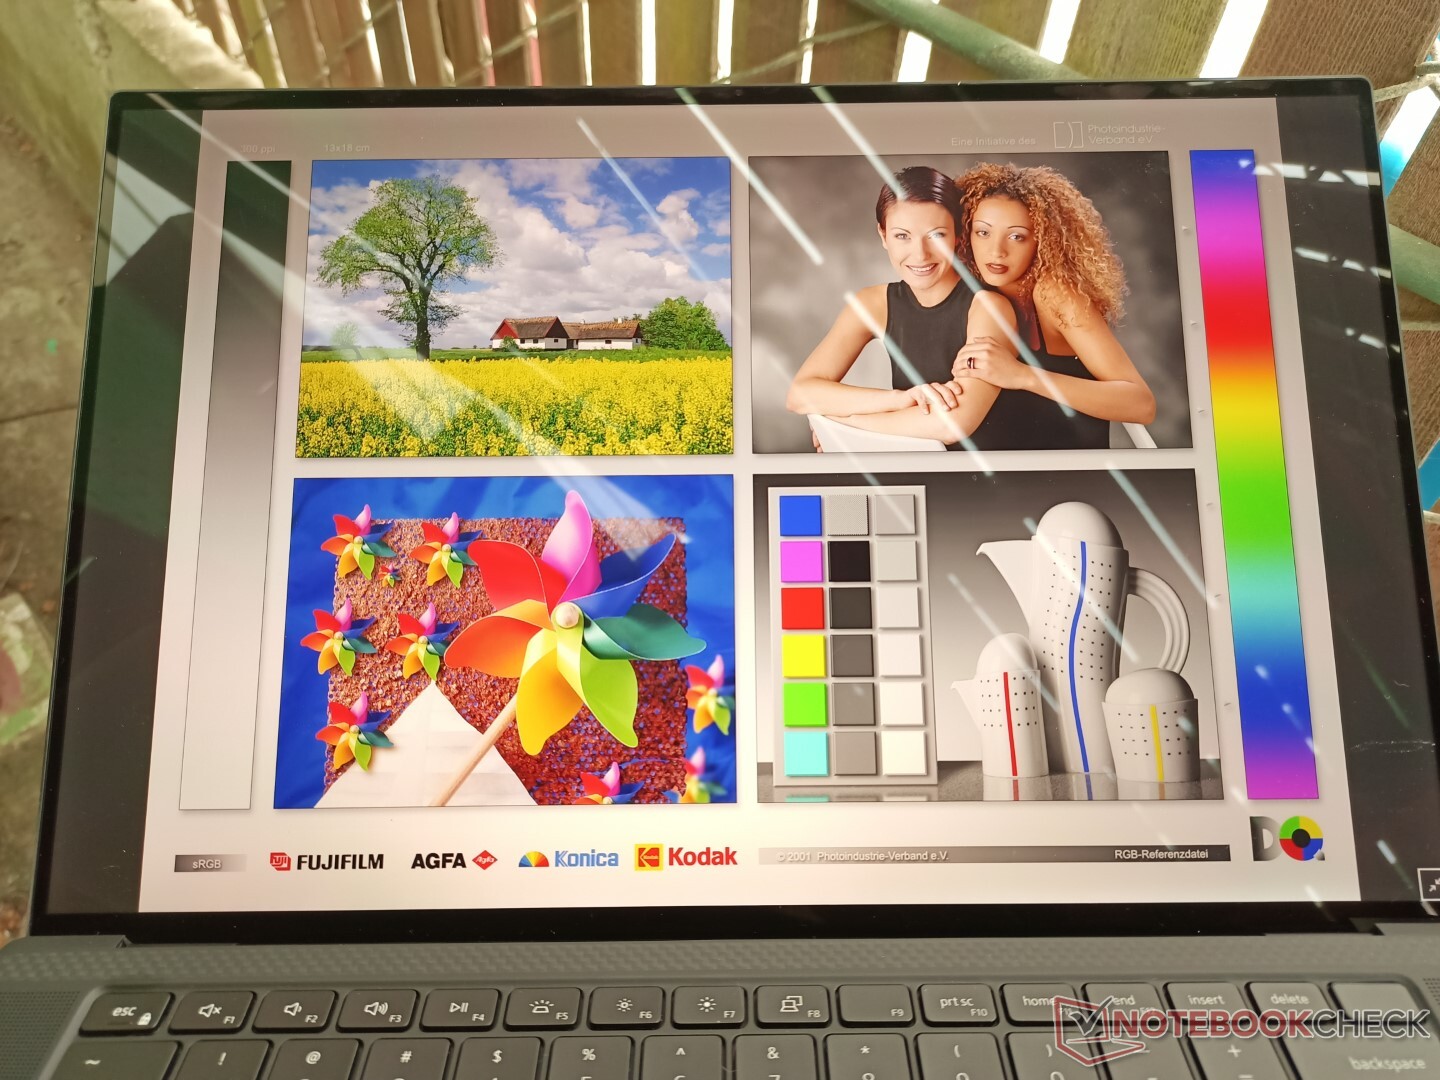
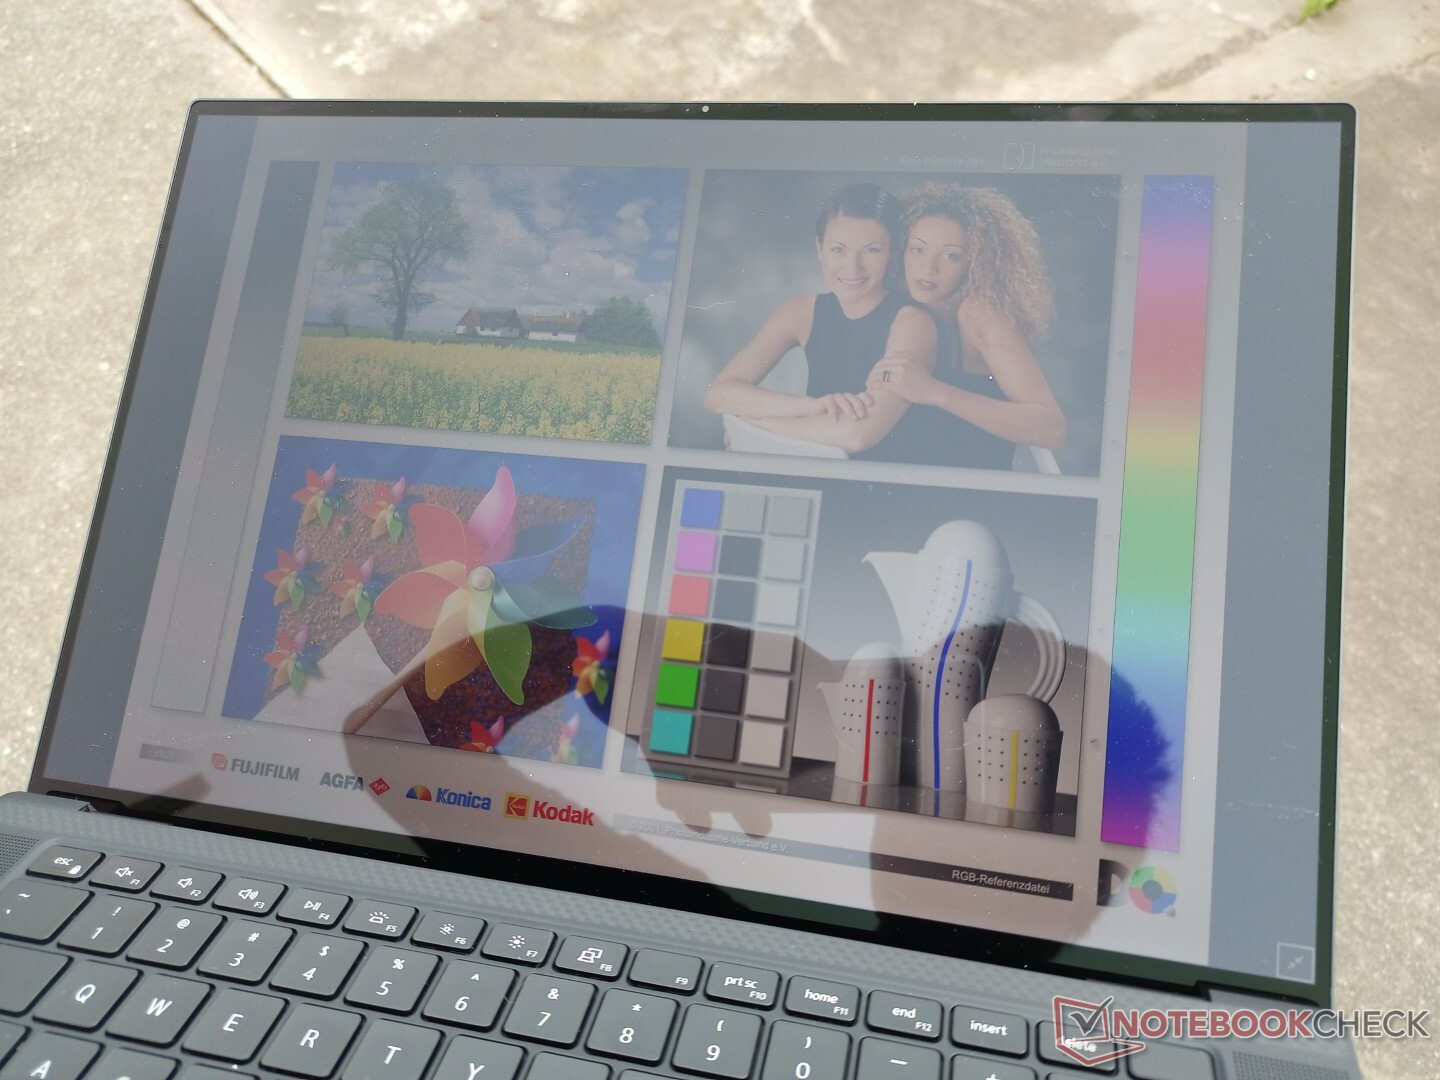
戴尔继续在其所有16:10的XPS 15和Precision 5550/5560 4K SKU上使用相同的夏普LQ156R1 IPS触摸屏,这很好,因为这仍然是一个高端面板,具有完整的AdobeRGB覆盖,高>1000:1的对比度,以及明亮的~500 nit背光。因此,最新的XPS 15和Precision 55x0型号之间的观看体验是一致的。就像XPS 15一样,一些SKU上有一个较小的哑光1200p非触摸显示屏,但OLED在Precision 5560上却被奇怪地省略了。
缓慢的黑白和灰白响应时间仍然是主要的缺点,这意味着重影非常明显,特别是与OLED相比。对于大多数CAD类型的应用,这不会是一个巨大的问题。
| |||||||||||||||||||||||||
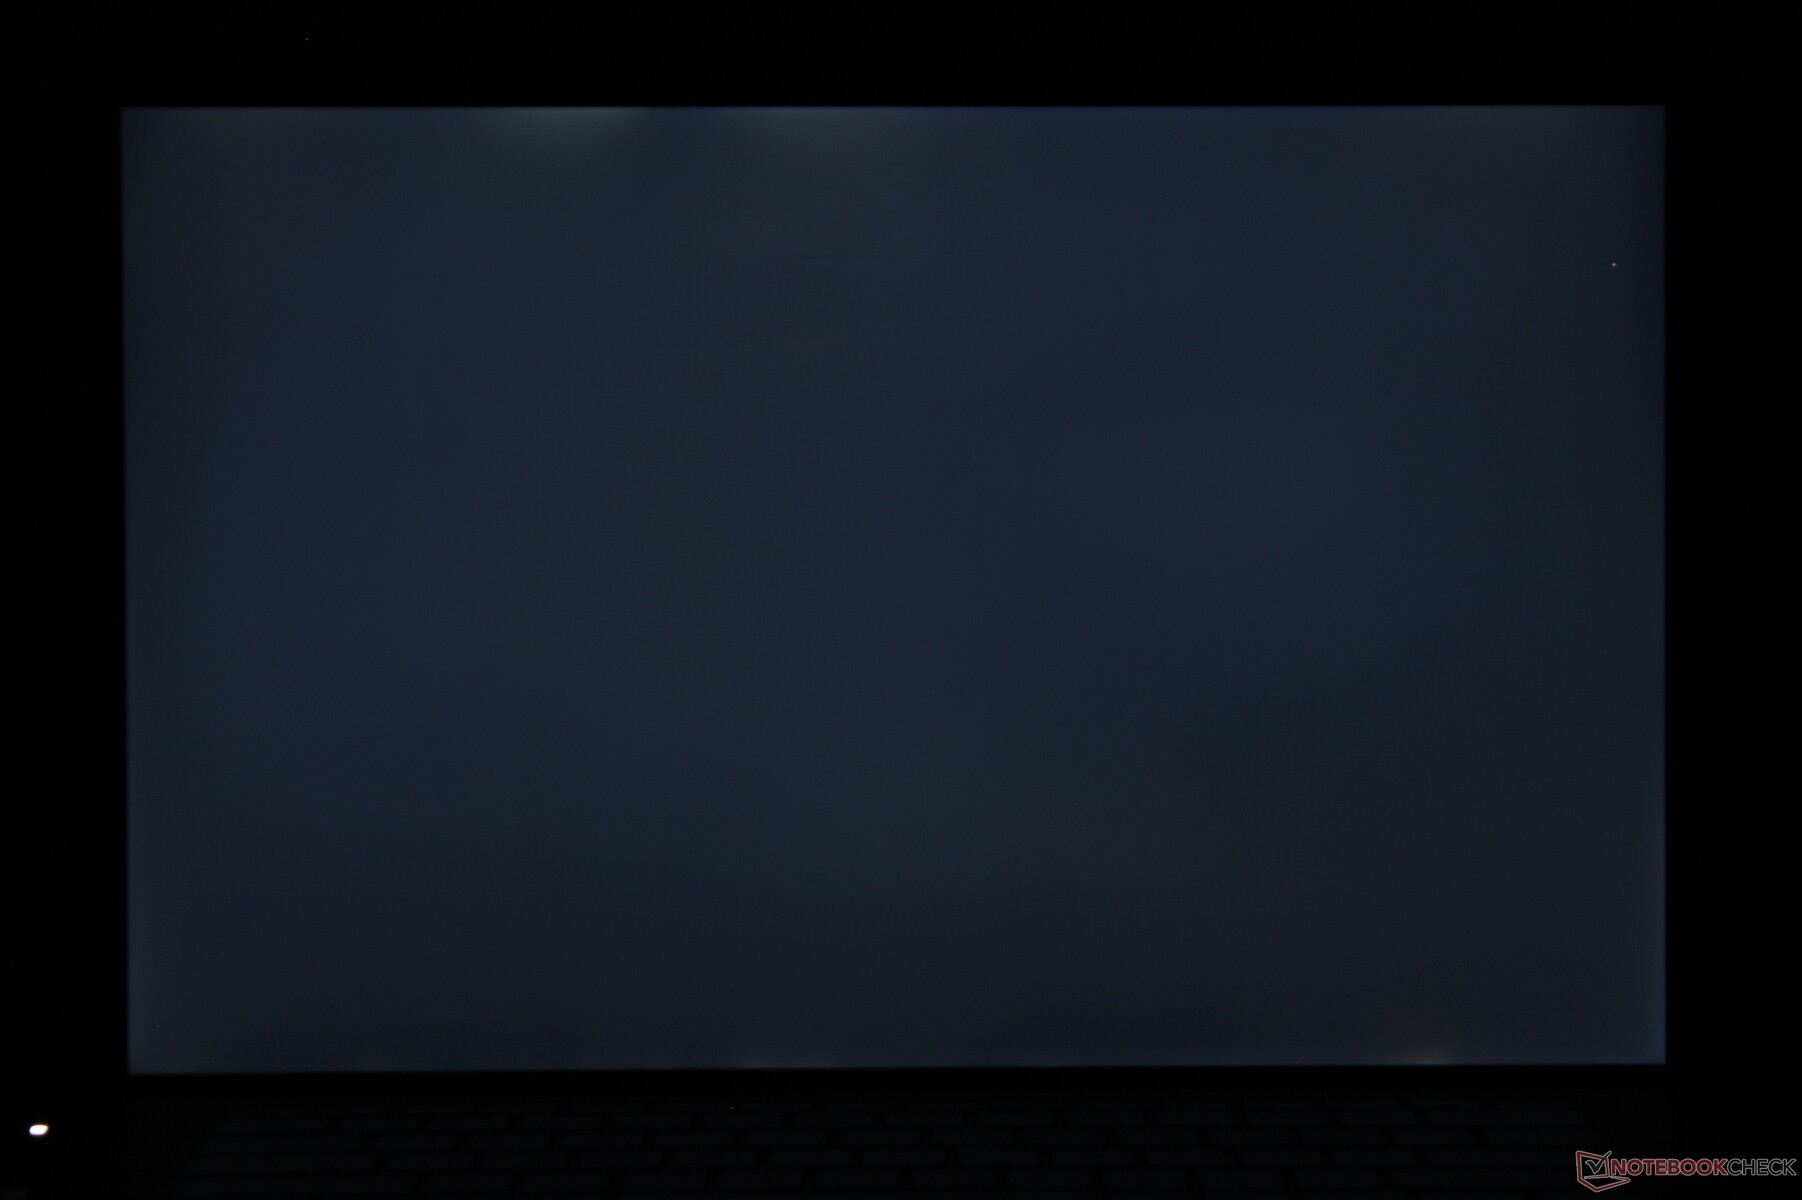
Brightness Distribution: 83 %
Center on Battery: 501.5 cd/m²
Contrast: 1140:1 (Black: 0.44 cd/m²)
ΔE ColorChecker Calman: 4.73 | ∀{0.5-29.43 Ø4.73}
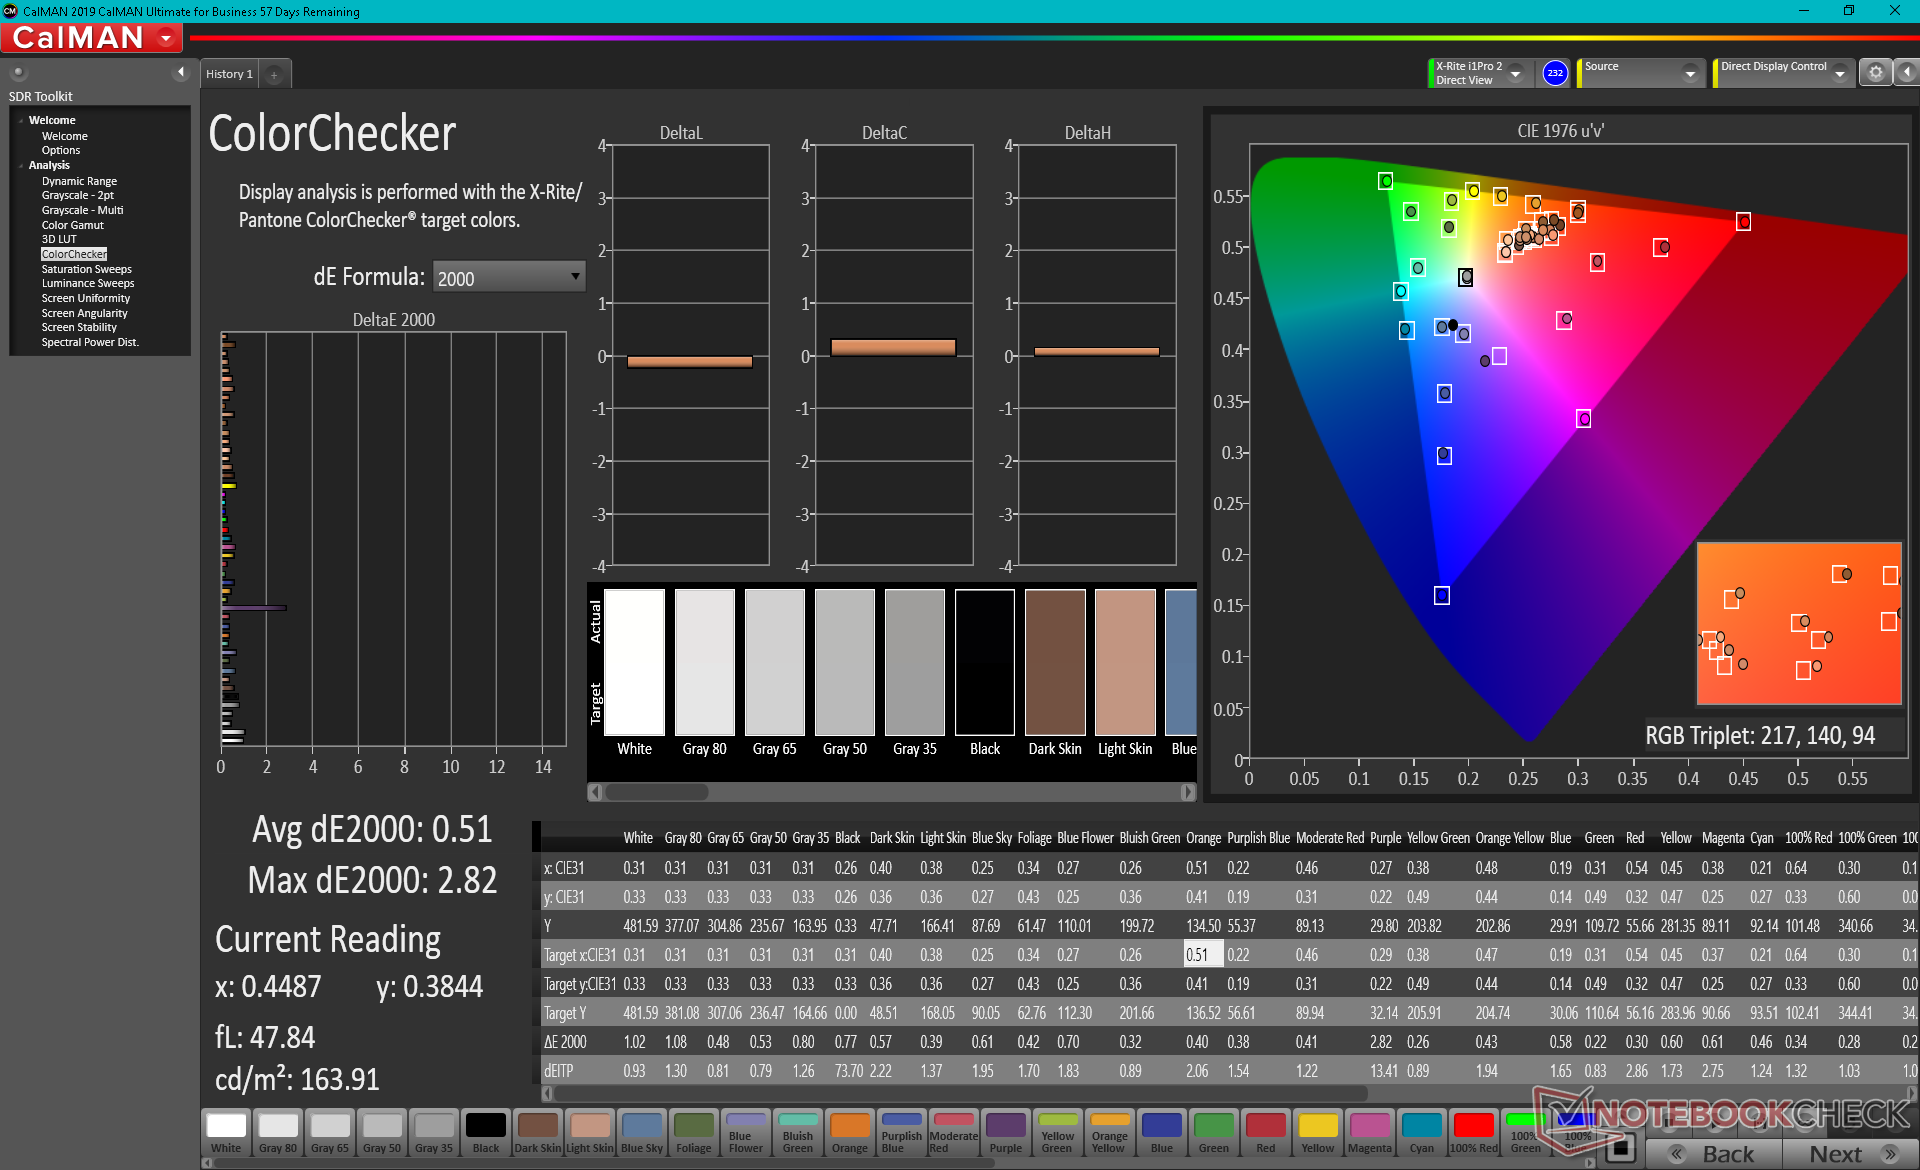
calibrated: 0.51
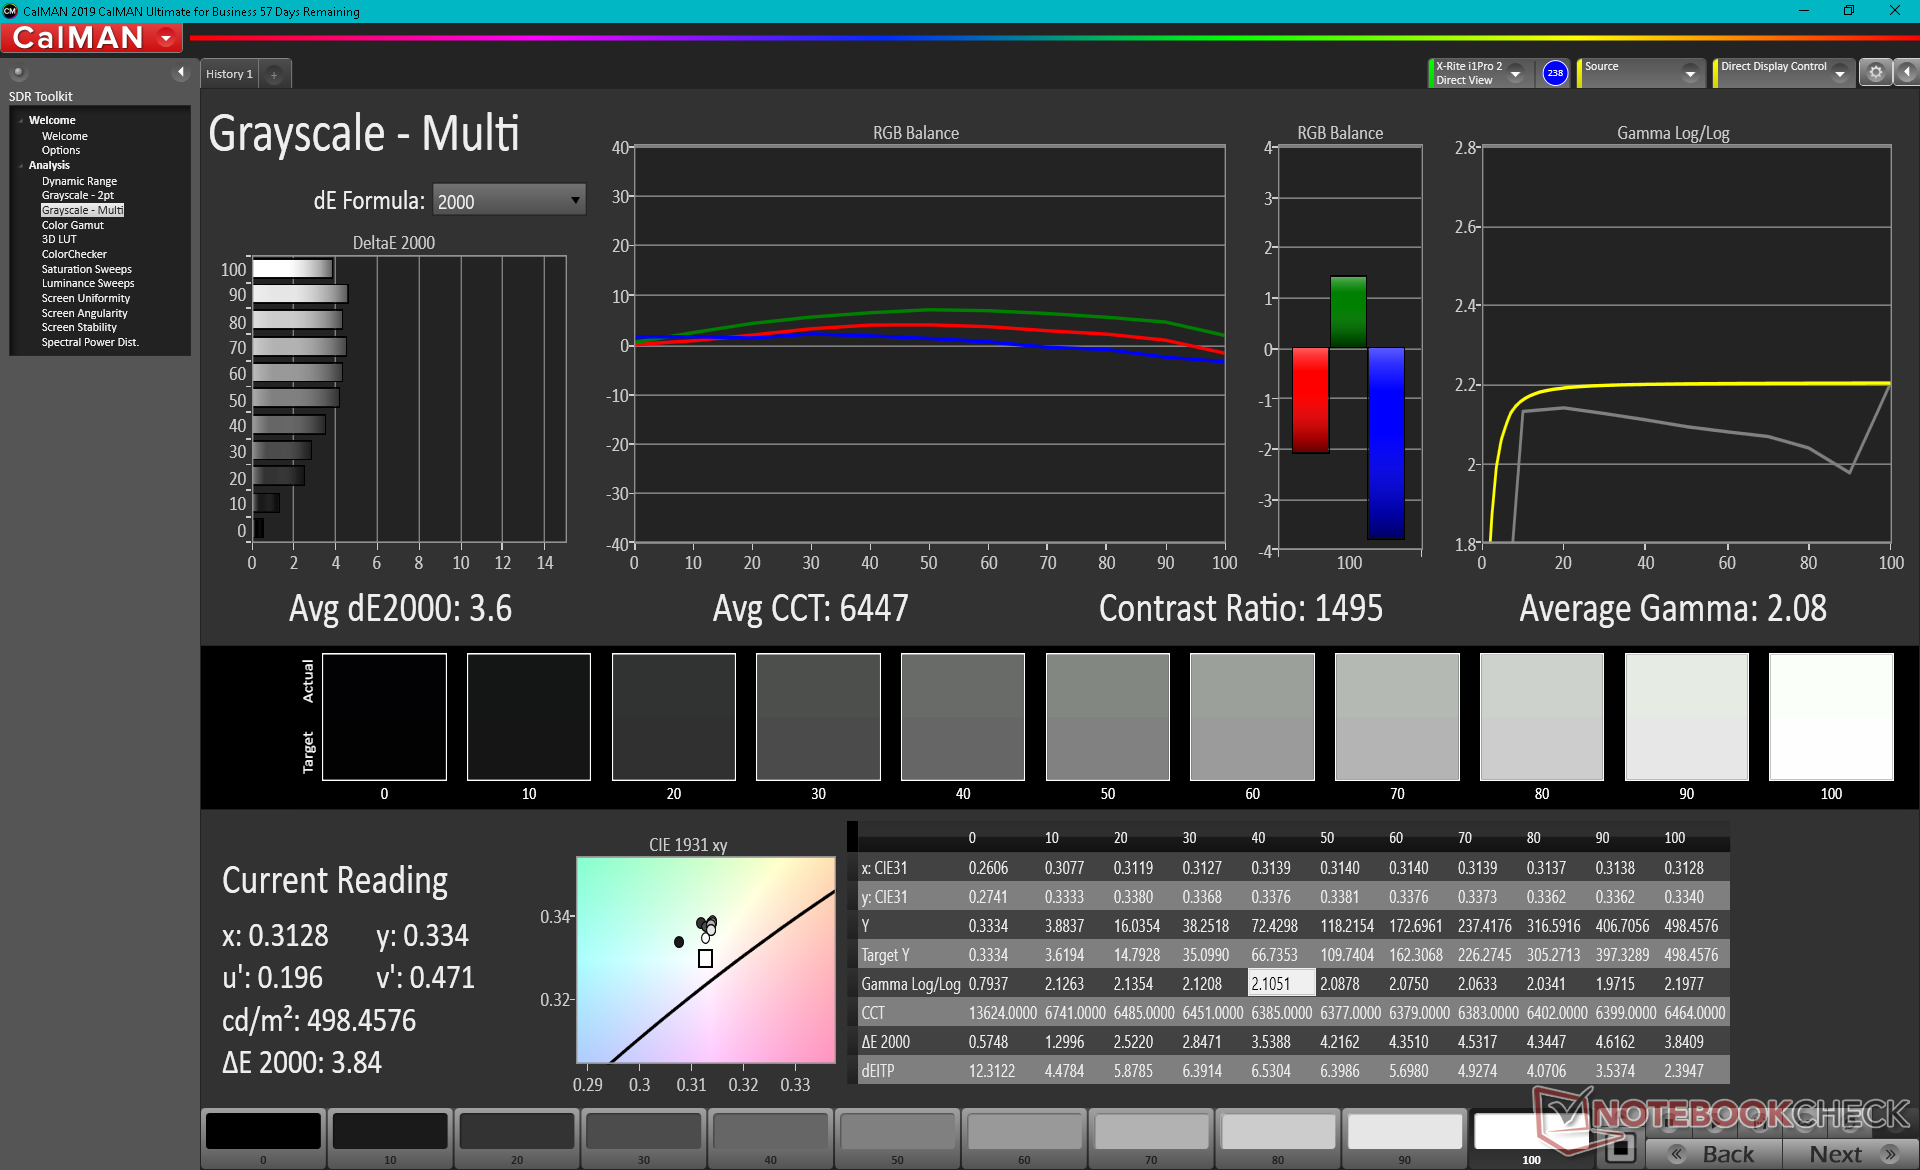
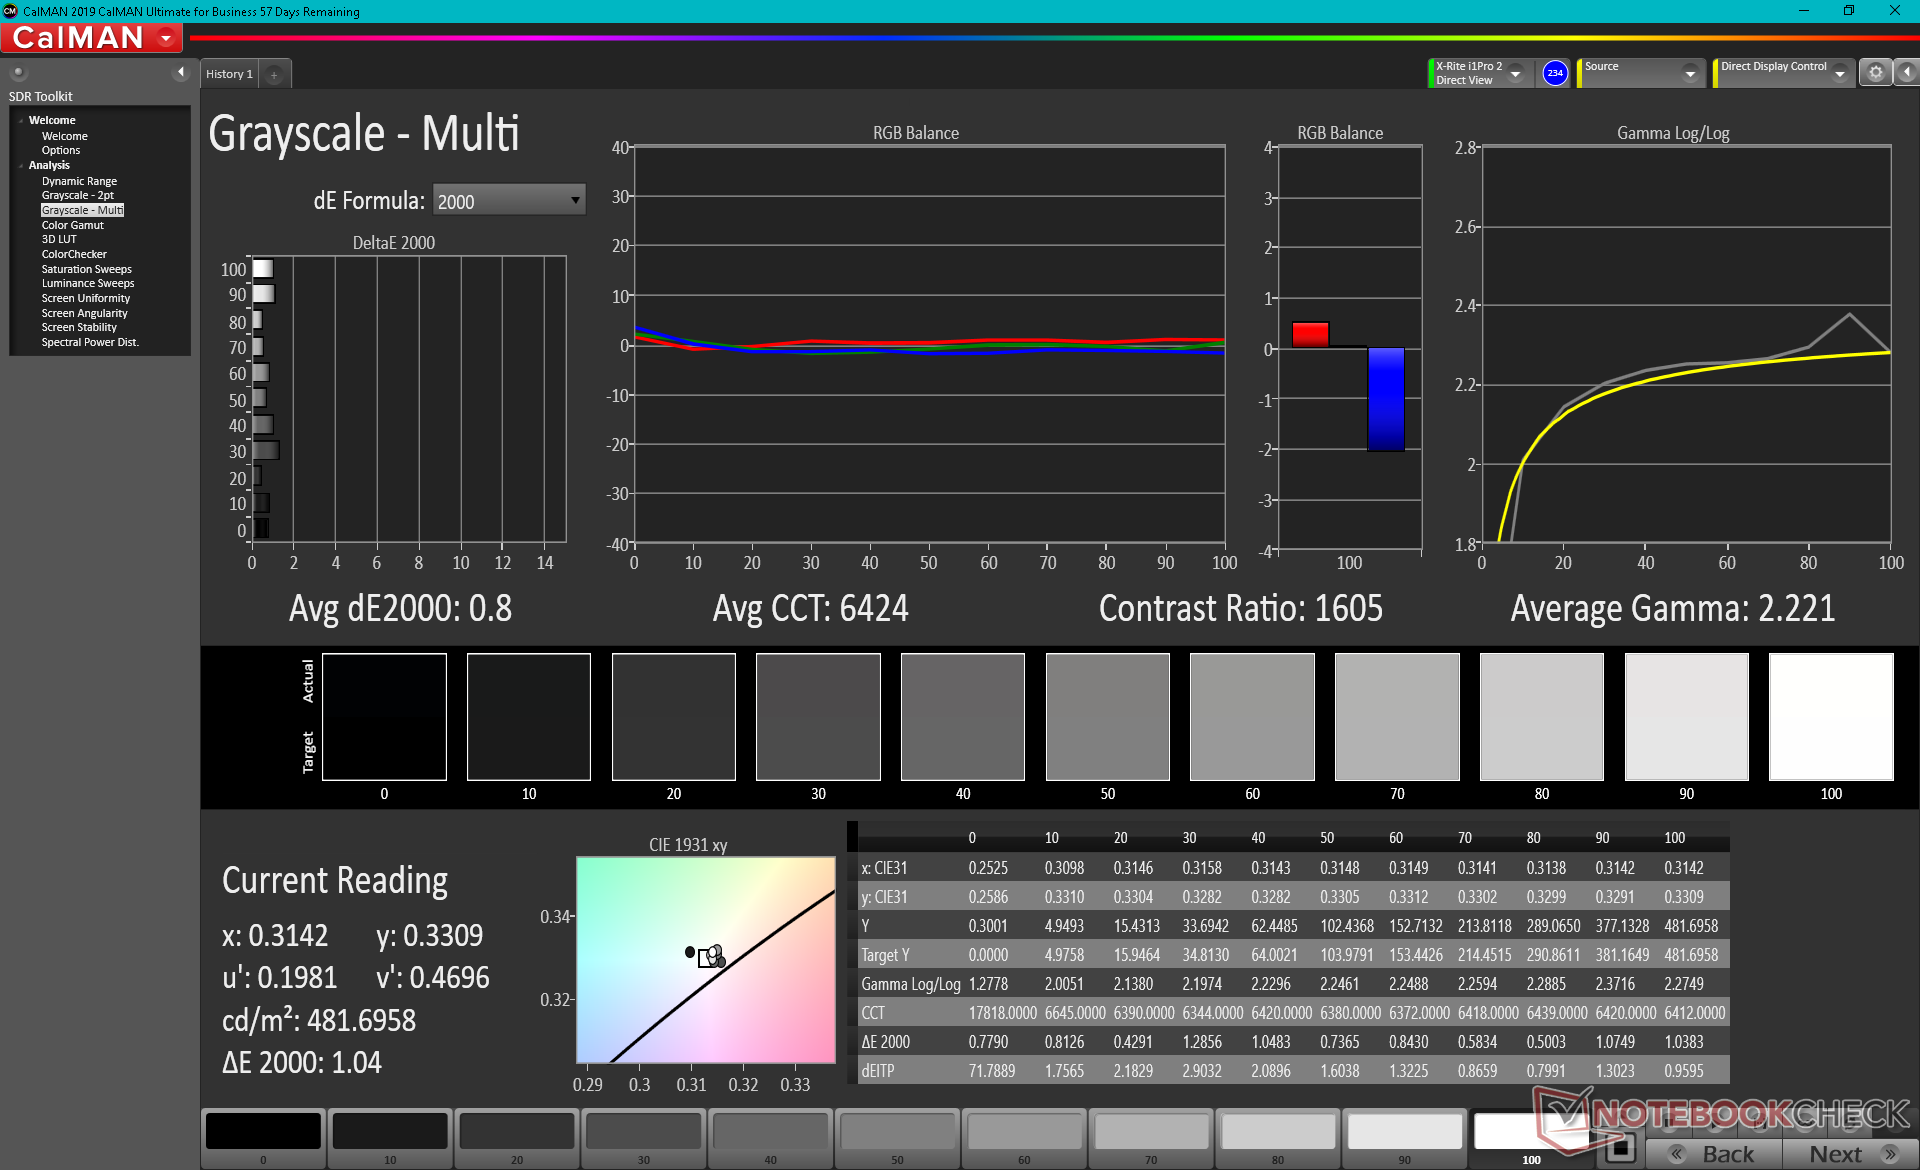
ΔE Greyscale Calman: 3.6 | ∀{0.09-98 Ø4.97}
100% AdobeRGB 1998 (Argyll 3D)
100% sRGB (Argyll 3D)
94.9% Display P3 (Argyll 3D)
Gamma: 2.08
CCT: 6447 K
| Dell Precision 5000 5560 Sharp LQ156R1, IPS, 15.6", 3840x2400 | Lenovo ThinkPad P15 G2-20YQ001JGE N156HCE_GN1, IPS, 15.6", 1920x1080 | HP ZBook Studio 15 G8 SDC4145, OLED, 15.6", 3840x2160 | Asus ProArt StudioBook Pro 15 W500G5T AU Optronics B156ZAN03.1, IPS, 15.6", 3840x2160 | Dell Precision 7550 AU Optronics B156ZAN, IPS, 15.6", 3840x2160 | Dell Precision 5550 P91F Sharp LQ156R1, IPS, 15.6", 3840x2400 | Razer Blade 15 Studio Edition 2020 Samsung SDCA029, OLED, 15.6", 3840x2160 | |
|---|---|---|---|---|---|---|---|
| Display | -19% | 0% | -7% | -5% | -2% | 1% | |
| Display P3 Coverage (%) | 94.9 | 68.6 -28% | 99.9 5% | 82.1 -13% | 82.1 -13% | 89.9 -5% | 99.9 5% |
| sRGB Coverage (%) | 100 | 99.8 0% | 100 0% | 97.6 -2% | 99.6 0% | 100 0% | 100 0% |
| AdobeRGB 1998 Coverage (%) | 100 | 70.6 -29% | 95.3 -5% | 95 -5% | 96.8 -3% | 99.9 0% | 97.3 -3% |
| Response Times | 34% | 94% | -19% | -10% | -5% | 90% | |
| Response Time Grey 50% / Grey 80% * (ms) | 47.2 ? | 37.6 ? 20% | 2.4 ? 95% | 58 ? -23% | 51.2 ? -8% | 46 ? 3% | 4 ? 92% |
| Response Time Black / White * (ms) | 30.4 ? | 16 ? 47% | 2.4 ? 92% | 35 ? -15% | 34 ? -12% | 34 ? -12% | 4 ? 87% |
| PWM Frequency (Hz) | 26040 ? | 240.4 ? | |||||
| Screen | 9% | -73% | 10% | -68% | -79% | 140% | |
| Brightness middle (cd/m²) | 501.5 | 498 -1% | 379.6 -24% | 344 -31% | 473.5 -6% | 469.8 -6% | 380 -24% |
| Brightness (cd/m²) | 467 | 490 5% | 380 -19% | 335 -28% | 461 -1% | 464 -1% | 388 -17% |
| Brightness Distribution (%) | 83 | 95 14% | 95 14% | 93 12% | 90 8% | 85 2% | 93 12% |
| Black Level * (cd/m²) | 0.44 | 0.39 11% | 0.37 16% | 0.55 -25% | 0.42 5% | 0.018 96% | |
| Contrast (:1) | 1140 | 1277 12% | 930 -18% | 861 -24% | 1119 -2% | 21111 1752% | |
| Colorchecker dE 2000 * | 4.73 | 2.1 56% | 5.15 -9% | 1.76 63% | 4.8 -1% | 5.16 -9% | 5.47 -16% |
| Colorchecker dE 2000 max. * | 8.45 | 5.6 34% | 7.79 8% | 4.31 49% | 8.73 -3% | 9.33 -10% | 8.19 3% |
| Colorchecker dE 2000 calibrated * | 0.51 | 0.8 -57% | 3.1 -508% | 3.08 -504% | 3.75 -635% | 3.04 -496% | |
| Greyscale dE 2000 * | 3.6 | 3.4 6% | 2.6 28% | 3.12 13% | 5.6 -56% | 5.5 -53% | 5.3 -47% |
| Gamma | 2.08 106% | 2.32 95% | 1.99 111% | 2.2 100% | 2.34 94% | 2 110% | 2.15 102% |
| CCT | 6447 101% | 7162 91% | 6166 105% | 6563 99% | 7549 86% | 6198 105% | 6128 106% |
| Color Space (Percent of AdobeRGB 1998) (%) | 85 | 86.4 | 89.2 | 86 | |||
| Color Space (Percent of sRGB) (%) | 98 | 99.7 | 100 | 100 | |||
| Total Average (Program / Settings) | 8% /
6% | 7% /
-27% | -5% /
1% | -28% /
-46% | -29% /
-52% | 77% /
103% |
* ... smaller is better
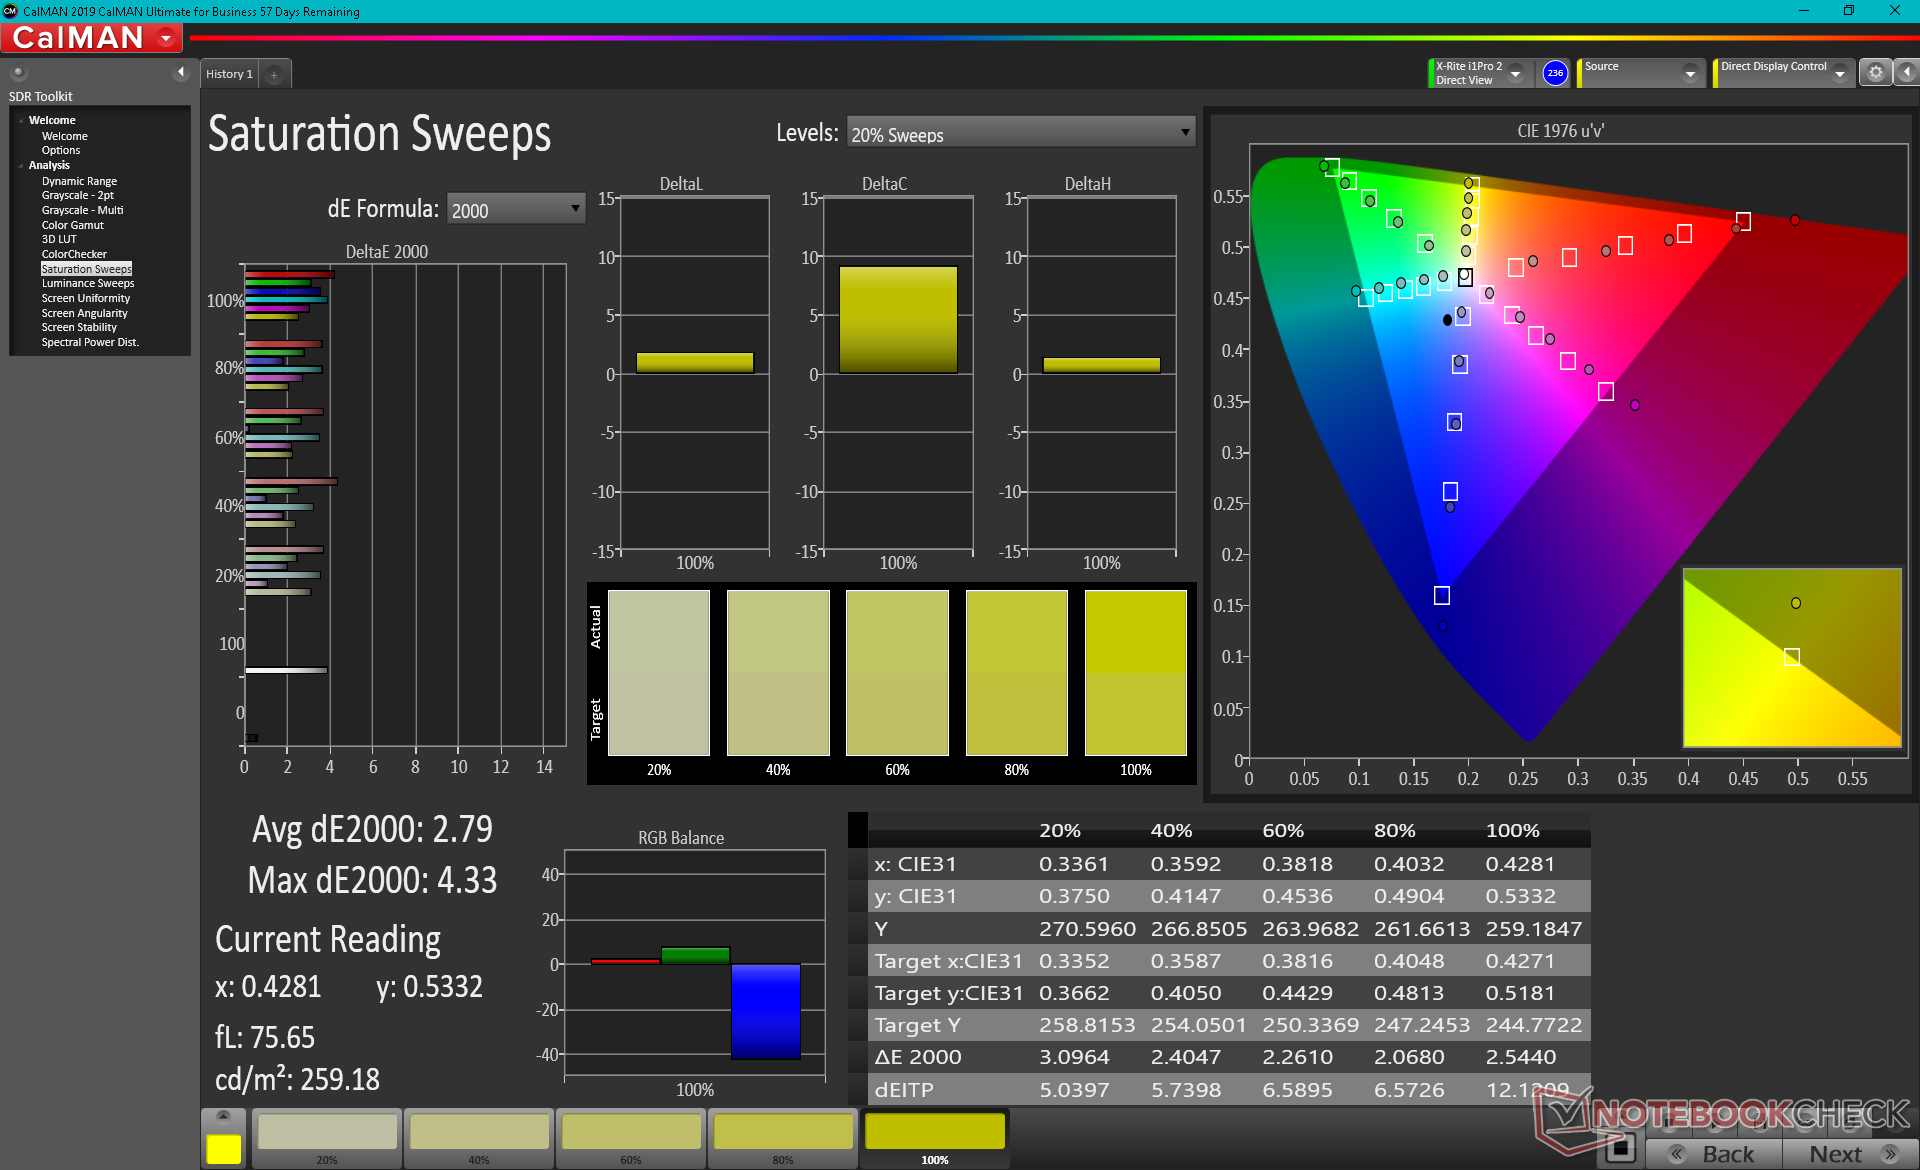
颜色可以在开箱后进行更好的校准,因为平均灰度和颜色deltaE值分别为3.6和4.73,还算不错。在用X-Rite色度计进行校准后,我们能够将这两个数值分别降到1以下。
Display Response Times
| ↔ Response Time Black to White | ||
|---|---|---|
| 30.4 ms ... rise ↗ and fall ↘ combined | ↗ 16.4 ms rise | 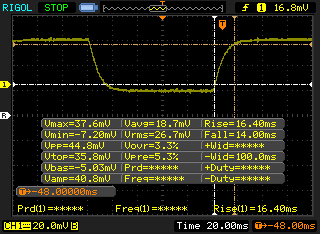 |
| ↘ 14 ms fall | ||
| The screen shows slow response rates in our tests and will be unsatisfactory for gamers. In comparison, all tested devices range from 0.1 (minimum) to 240 (maximum) ms. » 82 % of all devices are better. This means that the measured response time is worse than the average of all tested devices (19.9 ms). | ||
| ↔ Response Time 50% Grey to 80% Grey | ||
| 47.2 ms ... rise ↗ and fall ↘ combined | ↗ 25.2 ms rise | 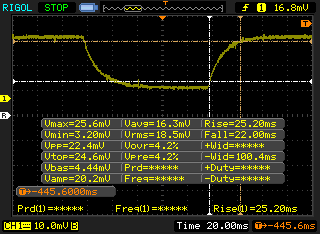 |
| ↘ 22 ms fall | ||
| The screen shows slow response rates in our tests and will be unsatisfactory for gamers. In comparison, all tested devices range from 0.165 (minimum) to 636 (maximum) ms. » 82 % of all devices are better. This means that the measured response time is worse than the average of all tested devices (31.1 ms). | ||
Screen Flickering / PWM (Pulse-Width Modulation)
| Screen flickering / PWM not detected | 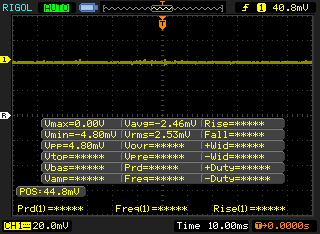 | ||
In comparison: 52 % of all tested devices do not use PWM to dim the display. If PWM was detected, an average of 7784 (minimum: 5 - maximum: 343500) Hz was measured. | |||
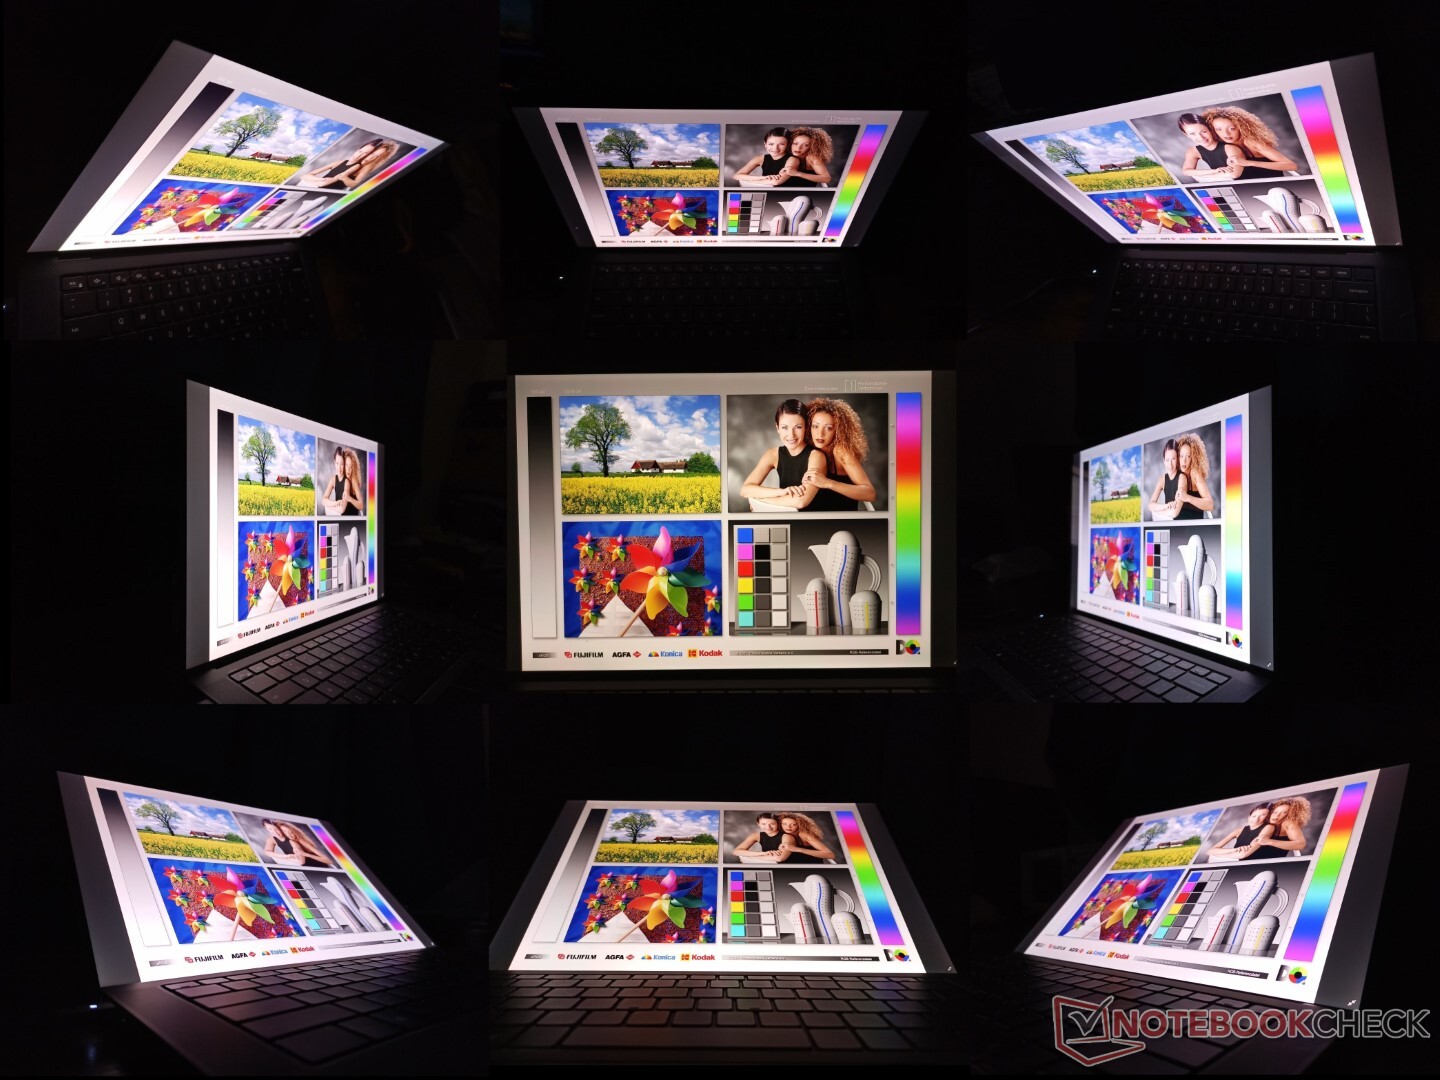
室外能见度比在 雷蛇刀片15工作室或华硕ProArt,因为我们的Precision 5560 上有更明亮的背光。然而,一些眩光将始终存在于光面的覆盖物上。用户可能要考虑用哑光1200p显示屏选项来代替,以减少眩光。
性能 - 45 W TGP Quadro RTX显卡
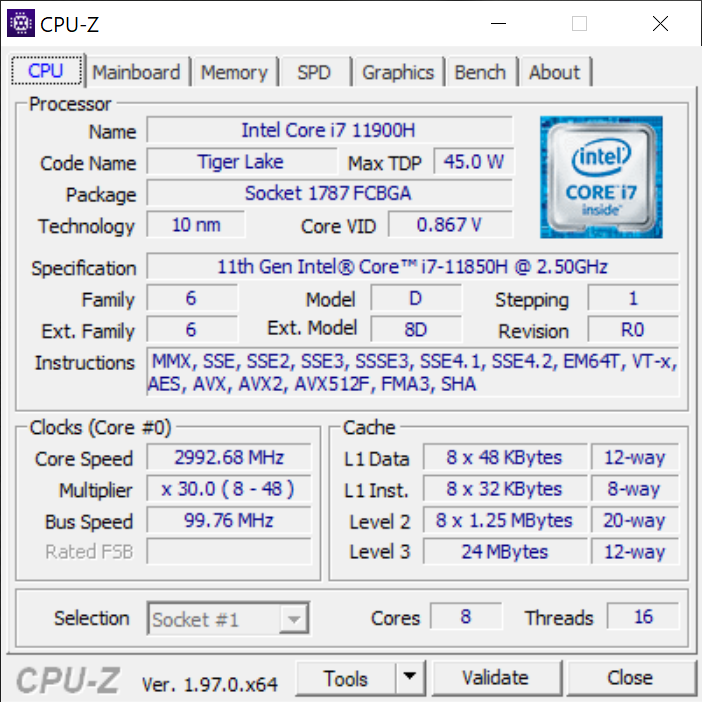
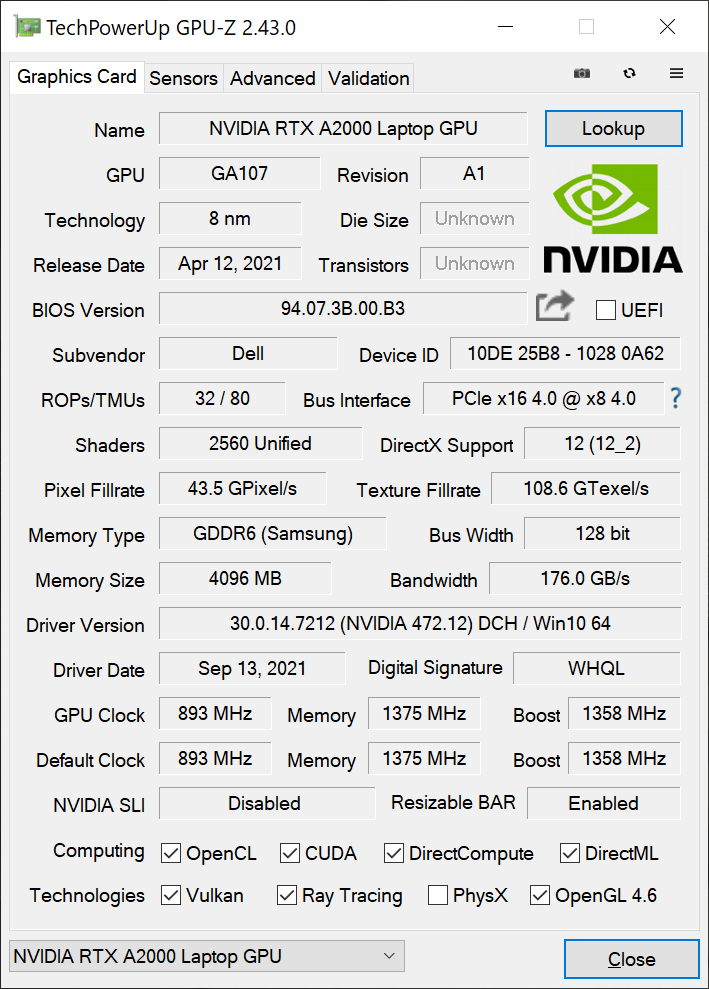
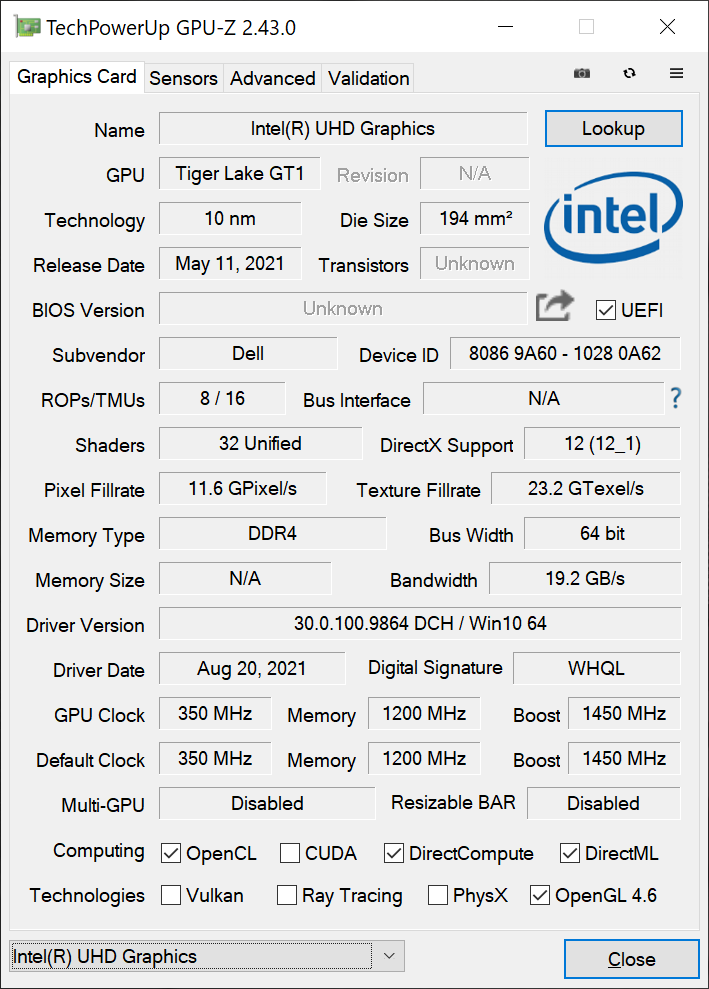
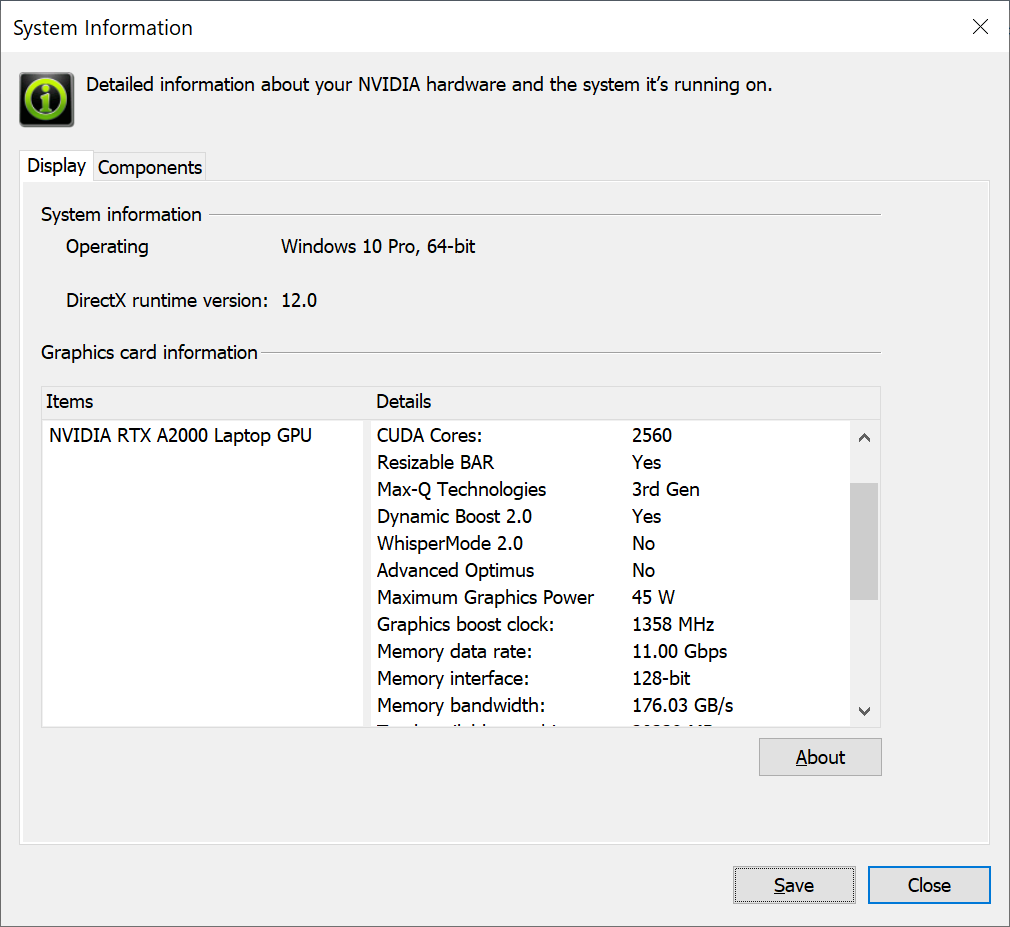
戴尔同时提供非vPro (i5-11500H, i7-11800H)和vPro (i7-11850H, i9-11950H, Xeon W-11955M)Tiger Lake-H选项,以及Nvidia Quadro GPU (NVIDIA T1200, RTX A2000) 几乎适用于所有配置。这些GPU、vPro CPU和相关的可选ECC内存是将Precision 5560与消费级的XPS 15系列区分开来的原因。
我们测试装置上的Quadro RTX A2000 GPU支持可调整栏和动态提升2.0,但不支持高级优化或WhisperMode 2.0。在只有45W的TGP下,这在技术上是一个Max-Q GPU,即使Max-Q不在名字中。相比之下,Precision 5550中的旧版Quadro T2000 Max-Q估计在40 W TGP范围内。
在运行以下基准测试之前,我们的设备通过戴尔电源管理器软件被设置为超性能模式,以获得尽可能高的分数。
处理器
整体多线程性能比酷睿i7-11800H慢15%左右,这是为集成vPro支持付出的代价。根据我们的经验,升级到酷睿i9-11950H后,多线程性能有望提高20%。 惠普ZBook Studio 15 G8.然而,单线程性能几乎保持不变。
正如下面一致的CineBench R15 xT结果所示,性能的可持续性很好。
Cinebench R15 Multi Loop
Cinebench R23: Multi Core | Single Core
Cinebench R15: CPU Multi 64Bit | CPU Single 64Bit
Blender: v2.79 BMW27 CPU
7-Zip 18.03: 7z b 4 -mmt1 | 7z b 4
Geekbench 5.5: Single-Core | Multi-Core
HWBOT x265 Benchmark v2.2: 4k Preset
LibreOffice : 20 Documents To PDF
R Benchmark 2.5: Overall mean
| Cinebench R20 / CPU (Multi Core) | |
| Lenovo Legion 5 15ACH-82JU00C6GE-FL | |
| HP ZBook Studio 15 G8 | |
| Lenovo ThinkPad P15 G2-20YQ001JGE | |
| Average Intel Core i7-11850H (3826 - 4663, n=2) | |
| MSI WS66 10TMT-207US | |
| Dell Precision 7550 | |
| Dell Precision 5000 5560 | |
| HP ZBook Studio G7 | |
| Dell Precision 5550 P91F | |
| Lenovo ThinkPad P15 Gen1-20ST000DGE | |
| Asus ProArt StudioBook Pro 15 W500G5T | |
| Lenovo ThinkPad P15s Gen2-20W6000GGE | |
| Lenovo ThinkPad P15s Gen1-20T4000JGE | |
| Cinebench R20 / CPU (Single Core) | |
| HP ZBook Studio 15 G8 | |
| Average Intel Core i7-11850H (583 - 607, n=2) | |
| Dell Precision 5000 5560 | |
| Lenovo ThinkPad P15 G2-20YQ001JGE | |
| Lenovo ThinkPad P15s Gen2-20W6000GGE | |
| Lenovo Legion 5 15ACH-82JU00C6GE-FL | |
| HP ZBook Studio G7 | |
| MSI WS66 10TMT-207US | |
| Dell Precision 5550 P91F | |
| Lenovo ThinkPad P15 Gen1-20ST000DGE | |
| Dell Precision 7550 | |
| Lenovo ThinkPad P15s Gen1-20T4000JGE | |
| Asus ProArt StudioBook Pro 15 W500G5T | |
| Cinebench R23 / Multi Core | |
| Lenovo Legion 5 15ACH-82JU00C6GE-FL | |
| HP ZBook Studio 15 G8 | |
| Lenovo ThinkPad P15 G2-20YQ001JGE | |
| Average Intel Core i7-11850H (9779 - 11935, n=2) | |
| HP ZBook Studio G7 | |
| Dell Precision 5000 5560 | |
| Lenovo ThinkPad P15 Gen1-20ST000DGE | |
| Lenovo ThinkPad P15s Gen2-20W6000GGE | |
| Cinebench R23 / Single Core | |
| HP ZBook Studio 15 G8 | |
| Average Intel Core i7-11850H (1513 - 1552, n=2) | |
| Dell Precision 5000 5560 | |
| Lenovo ThinkPad P15 G2-20YQ001JGE | |
| Lenovo ThinkPad P15s Gen2-20W6000GGE | |
| Lenovo Legion 5 15ACH-82JU00C6GE-FL | |
| HP ZBook Studio G7 | |
| Lenovo ThinkPad P15 Gen1-20ST000DGE | |
| Cinebench R15 / CPU Multi 64Bit | |
| Lenovo Legion 5 15ACH-82JU00C6GE-FL | |
| Lenovo ThinkPad P15 G2-20YQ001JGE | |
| HP ZBook Studio 15 G8 | |
| Average Intel Core i7-11850H (1547 - 1988, n=2) | |
| HP ZBook Studio G7 | |
| MSI WS66 10TMT-207US | |
| Dell Precision 7550 | |
| Dell Precision 5000 5560 | |
| Dell Precision 5550 P91F | |
| Lenovo ThinkPad P15 Gen1-20ST000DGE | |
| Asus ProArt StudioBook Pro 15 W500G5T | |
| Lenovo ThinkPad P15s Gen2-20W6000GGE | |
| Lenovo ThinkPad P15s Gen1-20T4000JGE | |
| Cinebench R15 / CPU Single 64Bit | |
| HP ZBook Studio 15 G8 | |
| Average Intel Core i7-11850H (232 - 233, n=2) | |
| Dell Precision 5000 5560 | |
| Lenovo ThinkPad P15 G2-20YQ001JGE | |
| Lenovo Legion 5 15ACH-82JU00C6GE-FL | |
| Lenovo ThinkPad P15s Gen2-20W6000GGE | |
| HP ZBook Studio G7 | |
| MSI WS66 10TMT-207US | |
| Dell Precision 7550 | |
| Lenovo ThinkPad P15 Gen1-20ST000DGE | |
| Dell Precision 5550 P91F | |
| Asus ProArt StudioBook Pro 15 W500G5T | |
| Lenovo ThinkPad P15s Gen1-20T4000JGE | |
| Blender / v2.79 BMW27 CPU | |
| Lenovo ThinkPad P15s Gen1-20T4000JGE | |
| Lenovo ThinkPad P15s Gen2-20W6000GGE | |
| Asus ProArt StudioBook Pro 15 W500G5T | |
| Lenovo ThinkPad P15 Gen1-20ST000DGE | |
| Dell Precision 5550 P91F | |
| Dell Precision 5000 5560 | |
| Average Intel Core i7-11850H (257 - 313, n=2) | |
| HP ZBook Studio G7 | |
| Dell Precision 7550 | |
| MSI WS66 10TMT-207US | |
| Lenovo ThinkPad P15 G2-20YQ001JGE | |
| HP ZBook Studio 15 G8 | |
| Lenovo Legion 5 15ACH-82JU00C6GE-FL | |
| 7-Zip 18.03 / 7z b 4 -mmt1 | |
| HP ZBook Studio 15 G8 | |
| Average Intel Core i7-11850H (5727 - 5762, n=2) | |
| Dell Precision 5000 5560 | |
| HP ZBook Studio G7 | |
| Dell Precision 7550 | |
| Lenovo ThinkPad P15 G2-20YQ001JGE | |
| Lenovo Legion 5 15ACH-82JU00C6GE-FL | |
| Lenovo ThinkPad P15s Gen2-20W6000GGE | |
| Dell Precision 5550 P91F | |
| MSI WS66 10TMT-207US | |
| Lenovo ThinkPad P15 Gen1-20ST000DGE | |
| Asus ProArt StudioBook Pro 15 W500G5T | |
| Lenovo ThinkPad P15s Gen1-20T4000JGE | |
| 7-Zip 18.03 / 7z b 4 | |
| Lenovo Legion 5 15ACH-82JU00C6GE-FL | |
| HP ZBook Studio 15 G8 | |
| Lenovo ThinkPad P15 G2-20YQ001JGE | |
| MSI WS66 10TMT-207US | |
| Dell Precision 7550 | |
| Average Intel Core i7-11850H (44890 - 50552, n=2) | |
| Dell Precision 5000 5560 | |
| HP ZBook Studio G7 | |
| Dell Precision 5550 P91F | |
| Lenovo ThinkPad P15 Gen1-20ST000DGE | |
| Asus ProArt StudioBook Pro 15 W500G5T | |
| Lenovo ThinkPad P15s Gen2-20W6000GGE | |
| Lenovo ThinkPad P15s Gen1-20T4000JGE | |
| Geekbench 5.5 / Single-Core | |
| HP ZBook Studio 15 G8 | |
| Average Intel Core i7-11850H (1659 - 1686, n=2) | |
| Lenovo ThinkPad P15 G2-20YQ001JGE | |
| Lenovo ThinkPad P15s Gen2-20W6000GGE | |
| Lenovo Legion 5 15ACH-82JU00C6GE-FL | |
| HP ZBook Studio G7 | |
| MSI WS66 10TMT-207US | |
| Dell Precision 7550 | |
| Dell Precision 5550 P91F | |
| Lenovo ThinkPad P15 Gen1-20ST000DGE | |
| Asus ProArt StudioBook Pro 15 W500G5T | |
| Lenovo ThinkPad P15s Gen1-20T4000JGE | |
| Geekbench 5.5 / Multi-Core | |
| Average Intel Core i7-11850H (9049 - 9451, n=2) | |
| Lenovo ThinkPad P15 G2-20YQ001JGE | |
| Dell Precision 5550 P91F | |
| Dell Precision 7550 | |
| MSI WS66 10TMT-207US | |
| HP ZBook Studio G7 | |
| Lenovo Legion 5 15ACH-82JU00C6GE-FL | |
| HP ZBook Studio 15 G8 | |
| Lenovo ThinkPad P15 Gen1-20ST000DGE | |
| Asus ProArt StudioBook Pro 15 W500G5T | |
| Lenovo ThinkPad P15s Gen2-20W6000GGE | |
| Lenovo ThinkPad P15s Gen1-20T4000JGE | |
| HWBOT x265 Benchmark v2.2 / 4k Preset | |
| Lenovo Legion 5 15ACH-82JU00C6GE-FL | |
| HP ZBook Studio 15 G8 | |
| Lenovo ThinkPad P15 G2-20YQ001JGE | |
| Average Intel Core i7-11850H (12.6 - 14.4, n=2) | |
| Dell Precision 7550 | |
| MSI WS66 10TMT-207US | |
| Dell Precision 5000 5560 | |
| HP ZBook Studio G7 | |
| Lenovo ThinkPad P15 Gen1-20ST000DGE | |
| Dell Precision 5550 P91F | |
| Asus ProArt StudioBook Pro 15 W500G5T | |
| Lenovo ThinkPad P15s Gen2-20W6000GGE | |
| Lenovo ThinkPad P15s Gen1-20T4000JGE | |
| LibreOffice / 20 Documents To PDF | |
| Lenovo Legion 5 15ACH-82JU00C6GE-FL | |
| Lenovo ThinkPad P15s Gen1-20T4000JGE | |
| Asus ProArt StudioBook Pro 15 W500G5T | |
| HP ZBook Studio G7 | |
| Lenovo ThinkPad P15 Gen1-20ST000DGE | |
| HP ZBook Studio 15 G8 | |
| Lenovo ThinkPad P15 G2-20YQ001JGE | |
| Dell Precision 5000 5560 | |
| Average Intel Core i7-11850H (45.8 - 48, n=2) | |
| Dell Precision 7550 | |
| Lenovo ThinkPad P15s Gen2-20W6000GGE | |
| MSI WS66 10TMT-207US | |
| Dell Precision 5550 P91F | |
| R Benchmark 2.5 / Overall mean | |
| Asus ProArt StudioBook Pro 15 W500G5T | |
| Lenovo ThinkPad P15s Gen1-20T4000JGE | |
| Lenovo ThinkPad P15 Gen1-20ST000DGE | |
| Dell Precision 5550 P91F | |
| MSI WS66 10TMT-207US | |
| Dell Precision 7550 | |
| Lenovo ThinkPad P15 G2-20YQ001JGE | |
| HP ZBook Studio G7 | |
| Lenovo ThinkPad P15s Gen2-20W6000GGE | |
| HP ZBook Studio 15 G8 | |
| Dell Precision 5000 5560 | |
| Average Intel Core i7-11850H (0.541 - 0.543, n=2) | |
| Lenovo Legion 5 15ACH-82JU00C6GE-FL | |
Cinebench R23: Multi Core | Single Core
Cinebench R15: CPU Multi 64Bit | CPU Single 64Bit
Blender: v2.79 BMW27 CPU
7-Zip 18.03: 7z b 4 -mmt1 | 7z b 4
Geekbench 5.5: Single-Core | Multi-Core
HWBOT x265 Benchmark v2.2: 4k Preset
LibreOffice : 20 Documents To PDF
R Benchmark 2.5: Overall mean
* ... smaller is better
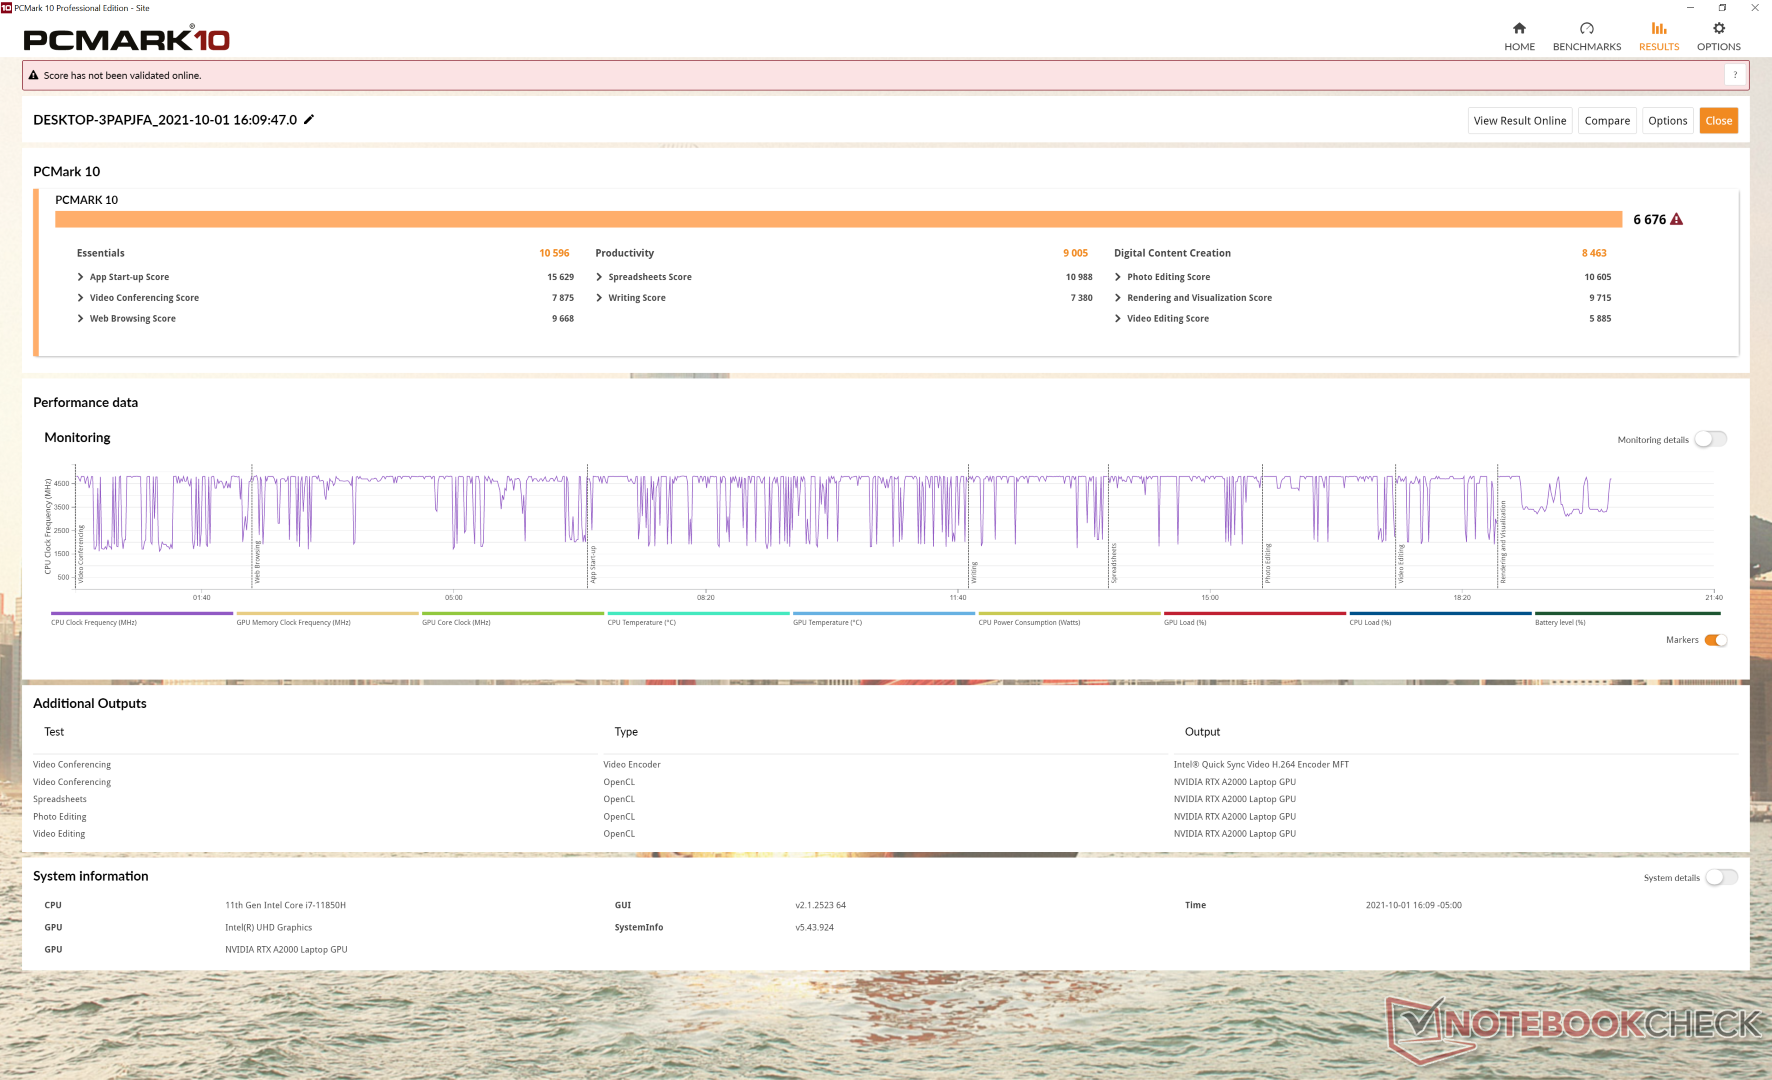
系统性能
PCMark得分一直高于Precision 5550,特别是在GPU重的数字内容创作基准中,RTX A2000可以比Quadro T2000 Max-Q灵活。
| PCMark 10 / Score | |
| HP ZBook Studio 15 G8 | |
| Dell Precision 5000 5560 | |
| Average Intel Core i7-11850H, NVIDIA RTX A2000 Laptop GPU (n=1) | |
| Lenovo ThinkPad P15 G2-20YQ001JGE | |
| Dell Precision 7550 | |
| Dell Precision 5550 P91F | |
| Razer Blade 15 Studio Edition 2020 | |
| Asus ProArt StudioBook Pro 15 W500G5T | |
| PCMark 10 / Essentials | |
| Dell Precision 5000 5560 | |
| Average Intel Core i7-11850H, NVIDIA RTX A2000 Laptop GPU (n=1) | |
| Lenovo ThinkPad P15 G2-20YQ001JGE | |
| HP ZBook Studio 15 G8 | |
| Dell Precision 5550 P91F | |
| Dell Precision 7550 | |
| Razer Blade 15 Studio Edition 2020 | |
| Asus ProArt StudioBook Pro 15 W500G5T | |
| PCMark 10 / Productivity | |
| Dell Precision 5000 5560 | |
| Average Intel Core i7-11850H, NVIDIA RTX A2000 Laptop GPU (n=1) | |
| HP ZBook Studio 15 G8 | |
| Lenovo ThinkPad P15 G2-20YQ001JGE | |
| Razer Blade 15 Studio Edition 2020 | |
| Dell Precision 7550 | |
| Dell Precision 5550 P91F | |
| Asus ProArt StudioBook Pro 15 W500G5T | |
| PCMark 10 / Digital Content Creation | |
| HP ZBook Studio 15 G8 | |
| Lenovo ThinkPad P15 G2-20YQ001JGE | |
| Dell Precision 5000 5560 | |
| Average Intel Core i7-11850H, NVIDIA RTX A2000 Laptop GPU (n=1) | |
| Dell Precision 7550 | |
| Dell Precision 5550 P91F | |
| Asus ProArt StudioBook Pro 15 W500G5T | |
| Razer Blade 15 Studio Edition 2020 | |
| PCMark 10 Score | 6676 points | |
Help | ||
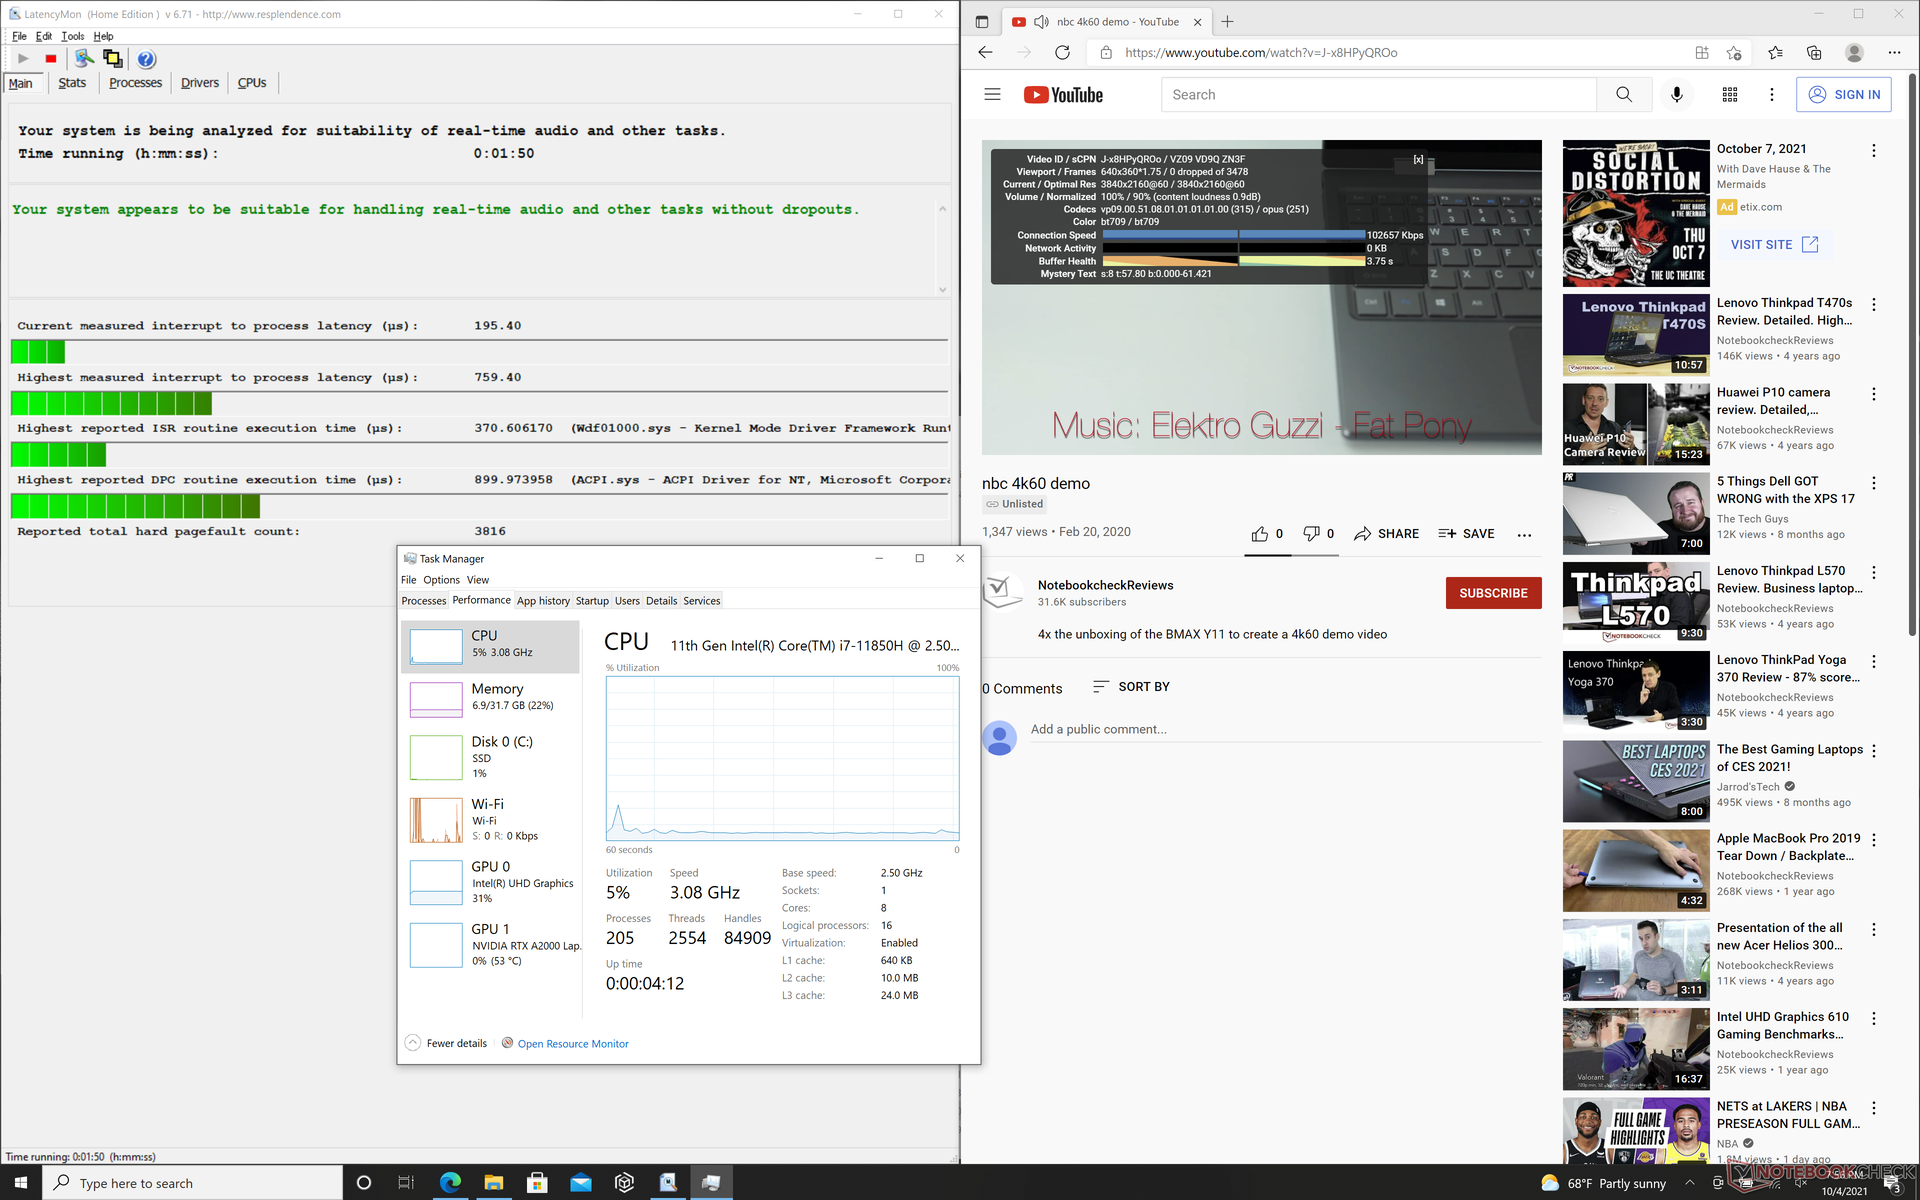
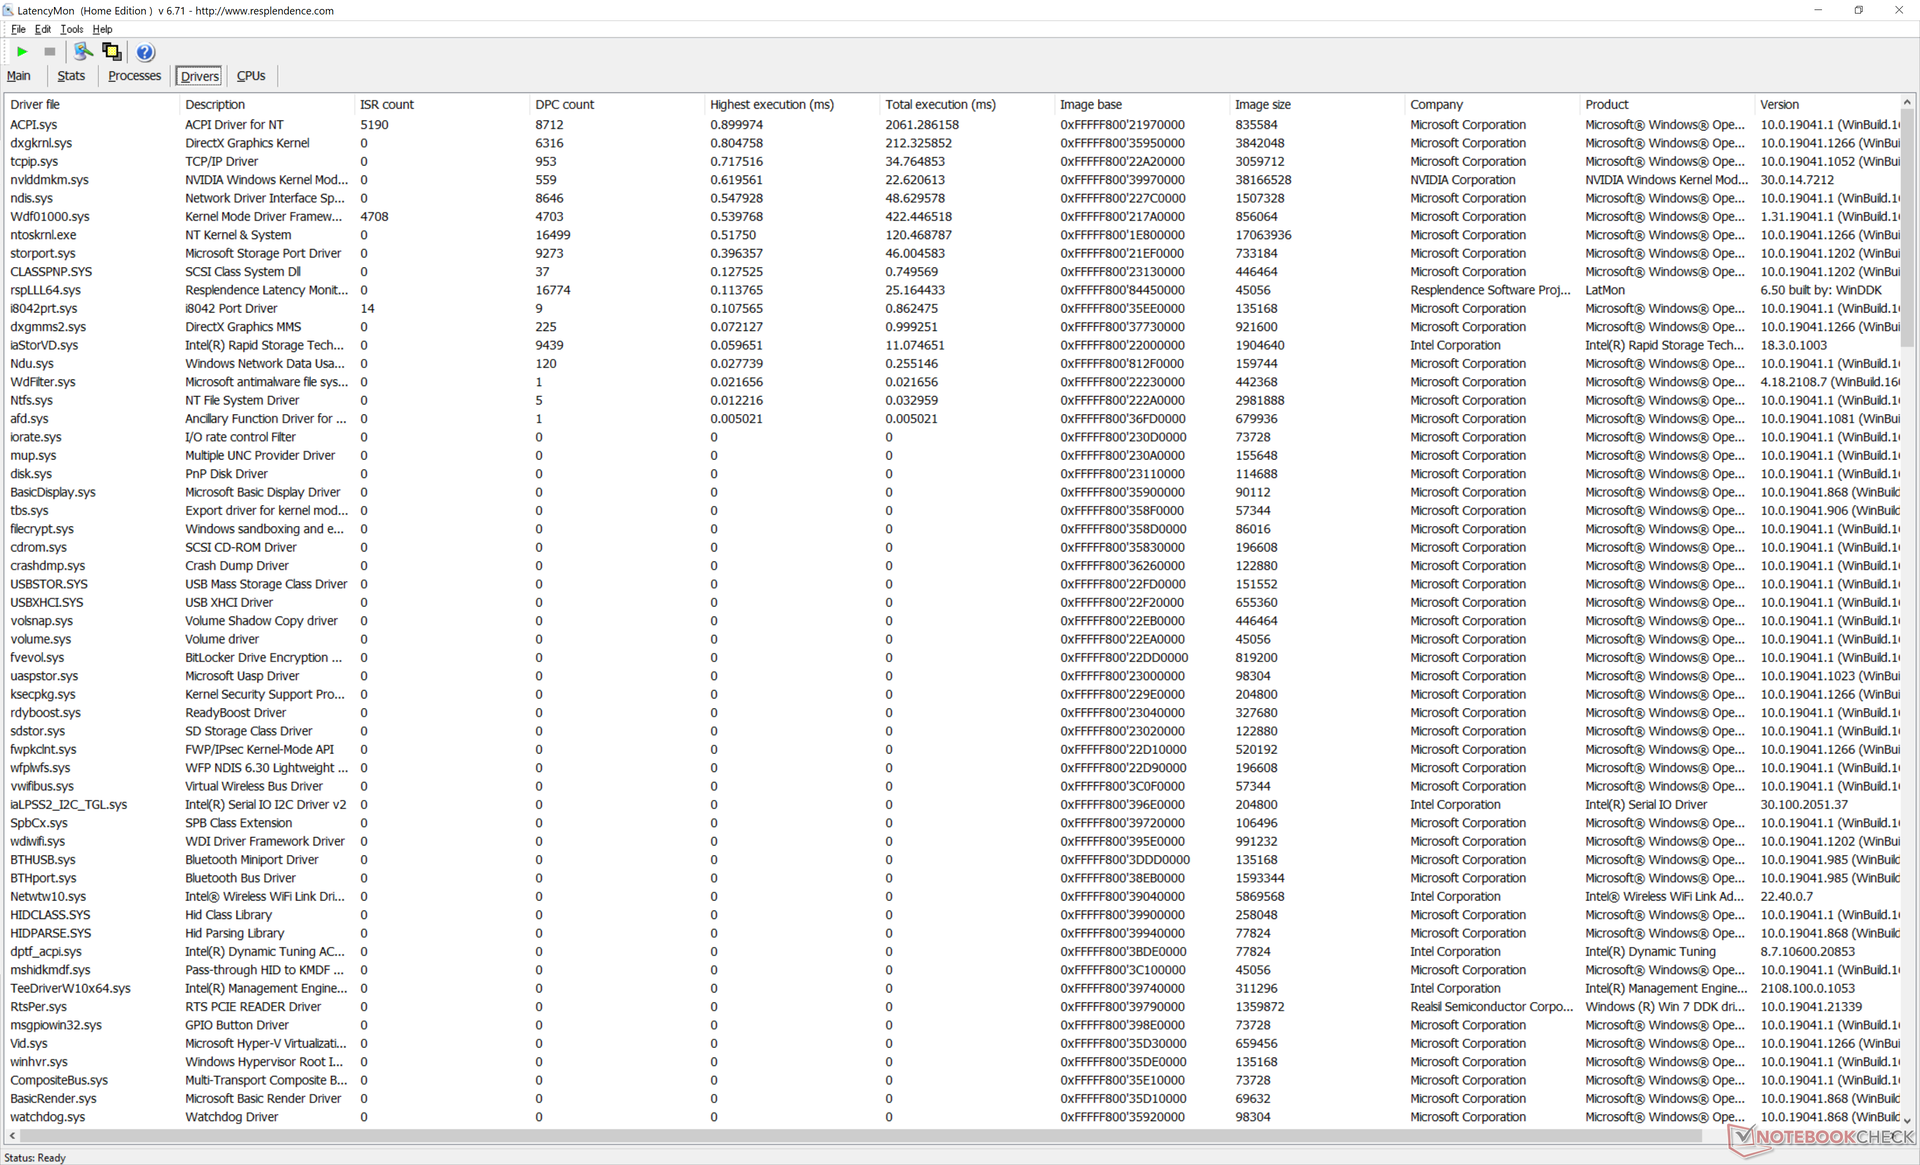
DPC延时
LatencyMon显示在打开多个浏览器标签或运行Prime95时没有DPC延迟问题。在60FPS下的4K视频播放也是完全流畅的,没有丢帧。我们对任何工作站的期望都不低。
| DPC Latencies / LatencyMon - interrupt to process latency (max), Web, Youtube, Prime95 | |
| Dell Precision 7550 | |
| Lenovo ThinkPad P15 G2-20YQ001JGE | |
| Asus ProArt StudioBook Pro 15 W500G5T | |
| HP ZBook Studio 15 G8 | |
| Dell Precision 5000 5560 | |
| Razer Blade 15 Studio Edition 2020 | |
| Dell Precision 5550 P91F | |
* ... smaller is better
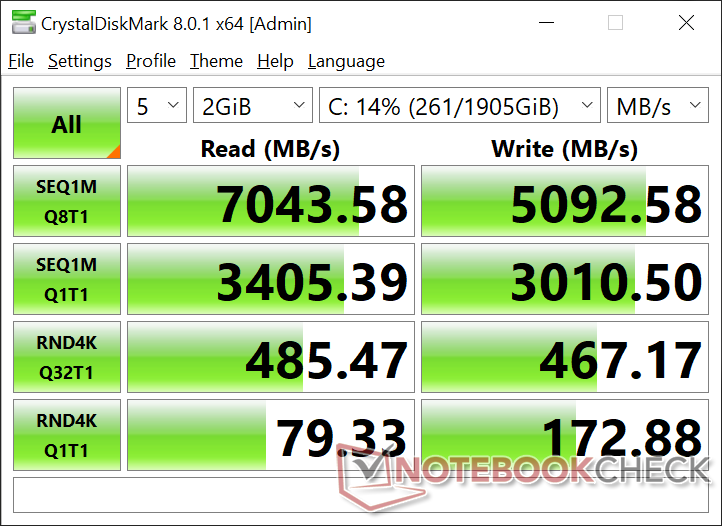
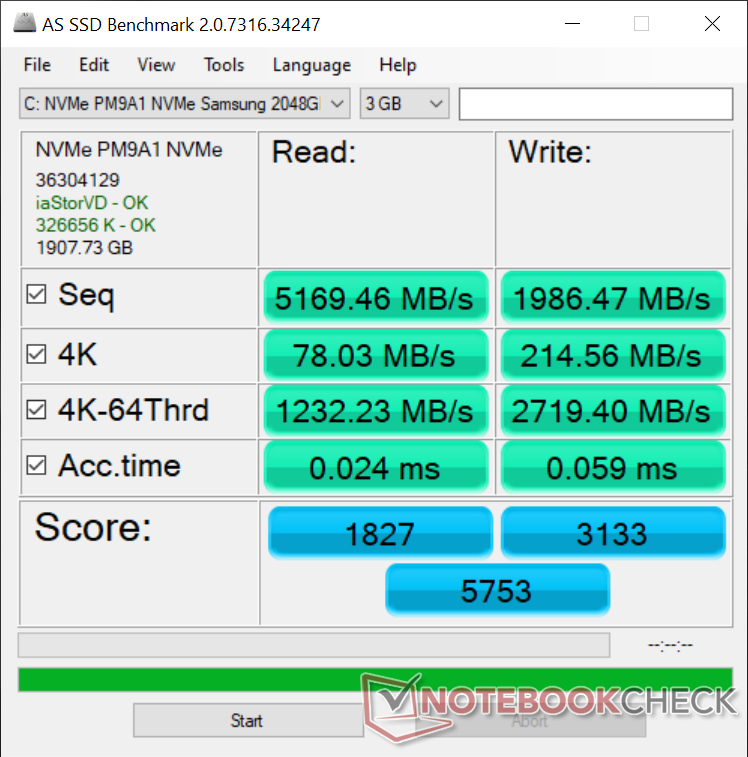
存储设备
戴尔已经向我们证实,两个M.2存储托架都支持PCIe4 x4固态硬盘,而Precision 5550上只有PCIe3。即使是 Alienware x17 R1也只能支持一个PCIe4 x4 SSD,尽管有两个M.2 SSD插槽。我们的测试设备配备了一个 三星PM9A1这是目前最快的消费级PCIe4固态硬盘之一,因此它的性能比去年型号的SK海力士PC601A有了巨大的提升。
| Dell Precision 5000 5560 Samsung PM9A1 MZVL22T0HBLB | Lenovo ThinkPad P15 G2-20YQ001JGE Kioxia XG7 KXG7AZNV512G | HP ZBook Studio 15 G8 Samsung PM981a MZVLB2T0HALB | Asus ProArt StudioBook Pro 15 W500G5T Samsung SSD PM981 MZVLB1T0HALR | Dell Precision 7550 SK Hynix PC601A NVMe 1TB | Dell Precision 5550 P91F SK Hynix PC601A NVMe 1TB | Razer Blade 15 Studio Edition 2020 Samsung PM981a MZVLB1T0HBLR | |
|---|---|---|---|---|---|---|---|
| AS SSD | -8% | -16% | -16% | -42% | -142% | -33% | |
| Seq Read (MB/s) | 5169 | 5105 -1% | 2953 -43% | 2702 -48% | 2028 -61% | 2039 -61% | 1982 -62% |
| Seq Write (MB/s) | 1986 | 1815 -9% | 1691 -15% | 2348 18% | 1193 -40% | 1376 -31% | 2252 13% |
| 4K Read (MB/s) | 78 | 47.46 -39% | 43.98 -44% | 37.59 -52% | 42.31 -46% | 44.11 -43% | 47.13 -40% |
| 4K Write (MB/s) | 214.6 | 137.3 -36% | 105.4 -51% | 107.1 -50% | 105.5 -51% | 113.3 -47% | 88.2 -59% |
| 4K-64 Read (MB/s) | 1232 | 2112 71% | 1065 -14% | 1491 21% | 1128 -8% | 1094 -11% | 1481 20% |
| 4K-64 Write (MB/s) | 2719 | 1702 -37% | 1957 -28% | 1794 -34% | 1537 -43% | 1630 -40% | 1842 -32% |
| Access Time Read * (ms) | 0.024 | 0.065 -171% | 0.04 -67% | 0.046 -92% | 0.069 -188% | 0.059 -146% | 0.087 -262% |
| Access Time Write * (ms) | 0.059 | 0.03 49% | 0.105 -78% | 0.034 42% | 0.106 -80% | 0.99 -1578% | 0.04 32% |
| Score Read (Points) | 1827 | 2670 46% | 1404 -23% | 1798 -2% | 1373 -25% | 1342 -27% | 1726 -6% |
| Score Write (Points) | 3133 | 2021 -35% | 2232 -29% | 2136 -32% | 1762 -44% | 1881 -40% | 2155 -31% |
| Score Total (Points) | 5753 | 5885 2% | 4297 -25% | 4835 -16% | 3801 -34% | 3883 -33% | 4781 -17% |
| Copy ISO MB/s (MB/s) | 3201 | 2054 -36% | 2474 -23% | 2302 -28% | 1768 -45% | 2489 -22% | 1982 -38% |
| Copy Program MB/s (MB/s) | 415.8 | 714 72% | 1074 158% | 564 36% | 627 51% | 682 64% | 501 20% |
| Copy Game MB/s (MB/s) | 1212 | 1431 18% | 1929 59% | 1336 10% | 1477 22% | 1515 25% | 1140 -6% |
| CrystalDiskMark 5.2 / 6 | -9% | -29% | 38% | -35% | -36% | -26% | |
| Write 4K (MB/s) | 172.4 | 141.1 -18% | 110.5 -36% | 1107 542% | 121 -30% | 122.6 -29% | 132.9 -23% |
| Read 4K (MB/s) | 78.8 | 58.8 -25% | 51.8 -34% | 43.38 -45% | 42.16 -46% | 42.4 -46% | 46.73 -41% |
| Write Seq (MB/s) | 2991 | 3320 11% | 2071 -31% | 2387 -20% | 2150 -28% | 2167 -28% | 2214 -26% |
| Read Seq (MB/s) | 3351 | 2994 -11% | 2505 -25% | 2431 -27% | 1755 -48% | 1747 -48% | 2018 -40% |
| Write 4K Q32T1 (MB/s) | 459.2 | 626 36% | 429.8 -6% | 340.7 -26% | 395.3 -14% | 388.8 -15% | 478.9 4% |
| Read 4K Q32T1 (MB/s) | 484.3 | 401.8 -17% | 418.3 -14% | 397.8 -18% | 381.8 -21% | 367.3 -24% | 540 12% |
| Write Seq Q32T1 (MB/s) | 4761 | 3742 -21% | 3060 -36% | 2390 -50% | 2730 -43% | 2629 -45% | 2975 -38% |
| Read Seq Q32T1 (MB/s) | 7071 | 5097 -28% | 3539 -50% | 3502 -50% | 3468 -51% | 3460 -51% | 3195 -55% |
| Total Average (Program / Settings) | -9% /
-8% | -23% /
-21% | 11% /
4% | -39% /
-40% | -89% /
-103% | -30% /
-31% |
* ... smaller is better

Disk Throttling: DiskSpd Read Loop, Queue Depth 8
GPU性能
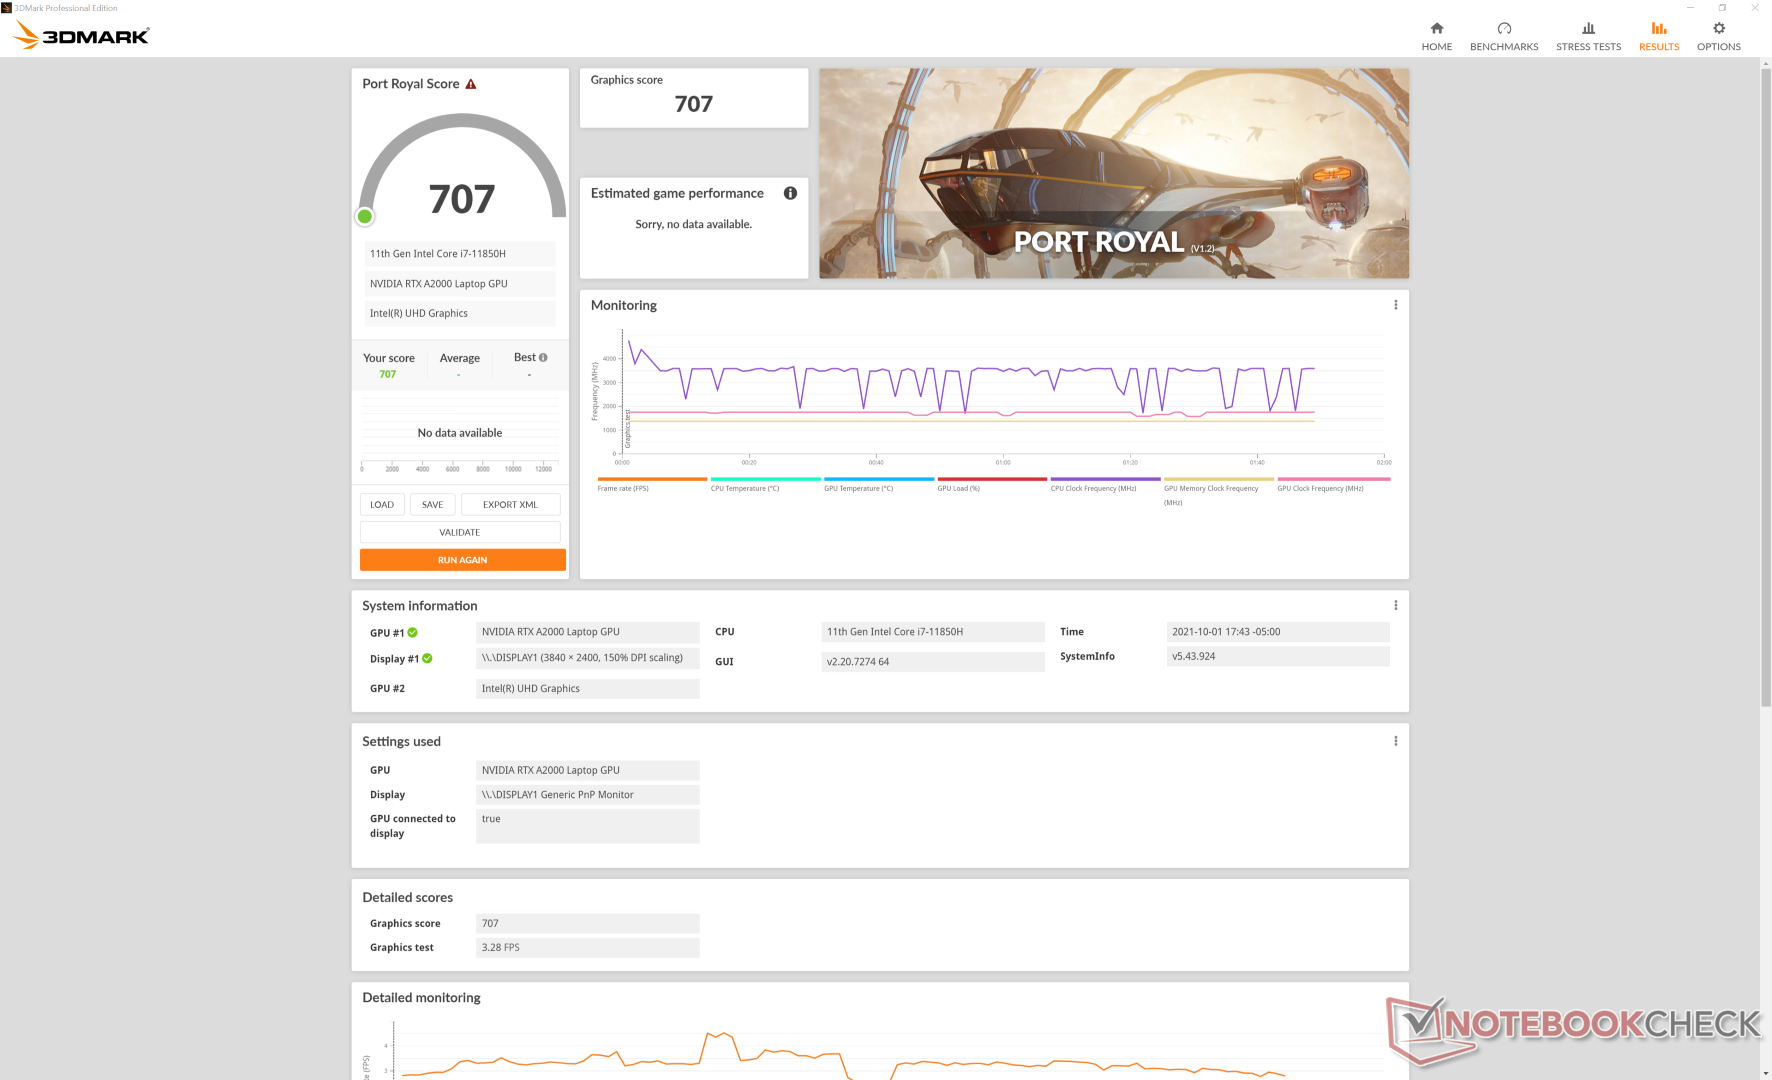
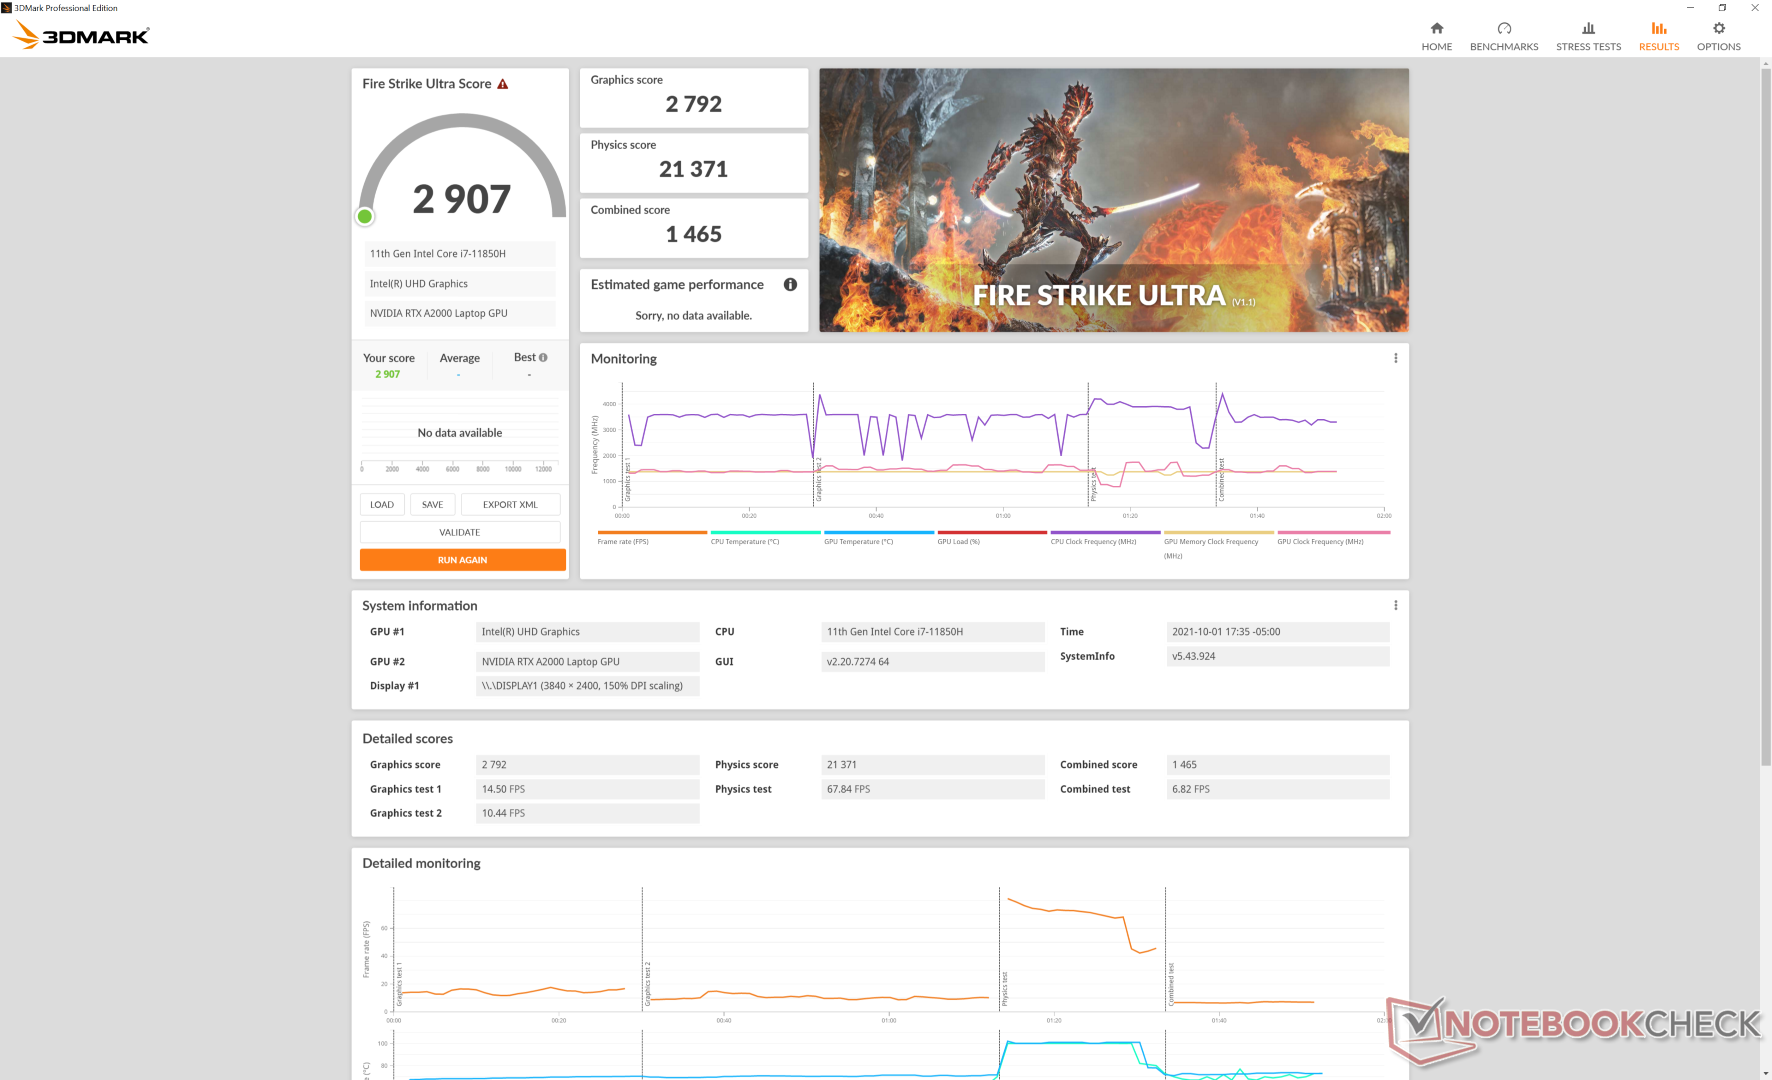
原始图形性能来自 芯片的原始图形性能舒适地介于消费者的 GeForce GTX 1650 Ti和 GTX 1660 Ti或比老款的 Quadro RTX 3000 Max-Q.与Quadro T2000 Max-Q相比,性能提升更为显著,为40%至50%。 Quadro T2000 Max-Q Precision 升级到Quadro RTX A3000 ,这在Precision 5560系列上是不存在的,可以比我们的Quadro RTX A2000带来30%至40%的性能提升。
有趣的是,SpecViewPerf分数在我们的RTX A2000和上一代Quadro RTX 3000 Max-Q之间比预期的更接近,尽管更耗电的旧版图灵GPU表明我们的安培GPU在工作站类型的负载中得到了改进的优化。
如果是游戏,预计性能会比GTX 1660 Ti慢20%至30%左右,因为Quadro GPU没有针对游戏进行优化。例如,《奇异旅团》有时会在基准测试一两分钟后崩溃。
| 3DMark 11 | |
| 1280x720 Performance GPU | |
| Razer Blade 15 Advanced (Mid 2021) | |
| Lenovo Legion 5 15ACH-82JU00C6GE-FL | |
| HP ZBook Studio 15 G8 | |
| Lenovo ThinkPad P15 G2-20YQ001JGE | |
| Dell Precision 7550 | |
| Asus ROG Zephyrus M15 GU502LU-BI7N4 | |
| Average NVIDIA RTX A2000 Laptop GPU (14831 - 19823, n=9) | |
| HP ZBook Studio G7 | |
| Dell Precision 5000 5560 | |
| Lenovo ThinkBook 15p Gen1 4K | |
| Dell Precision 5550 P91F | |
| Lenovo ThinkPad P15 Gen1-20ST000DGE | |
| Lenovo ThinkPad P15s Gen2-20W6000GGE | |
| Lenovo ThinkPad P15s Gen1-20T4000JGE | |
| 1280x720 Performance Combined | |
| Razer Blade 15 Advanced (Mid 2021) | |
| Lenovo ThinkPad P15 G2-20YQ001JGE | |
| Average NVIDIA RTX A2000 Laptop GPU (10821 - 18570, n=9) | |
| HP ZBook Studio G7 | |
| Lenovo Legion 5 15ACH-82JU00C6GE-FL | |
| Asus ROG Zephyrus M15 GU502LU-BI7N4 | |
| Lenovo ThinkPad P15 Gen1-20ST000DGE | |
| Lenovo ThinkBook 15p Gen1 4K | |
| Dell Precision 5550 P91F | |
| Dell Precision 7550 | |
| HP ZBook Studio 15 G8 | |
| Dell Precision 5000 5560 | |
| Lenovo ThinkPad P15s Gen2-20W6000GGE | |
| Lenovo ThinkPad P15s Gen1-20T4000JGE | |
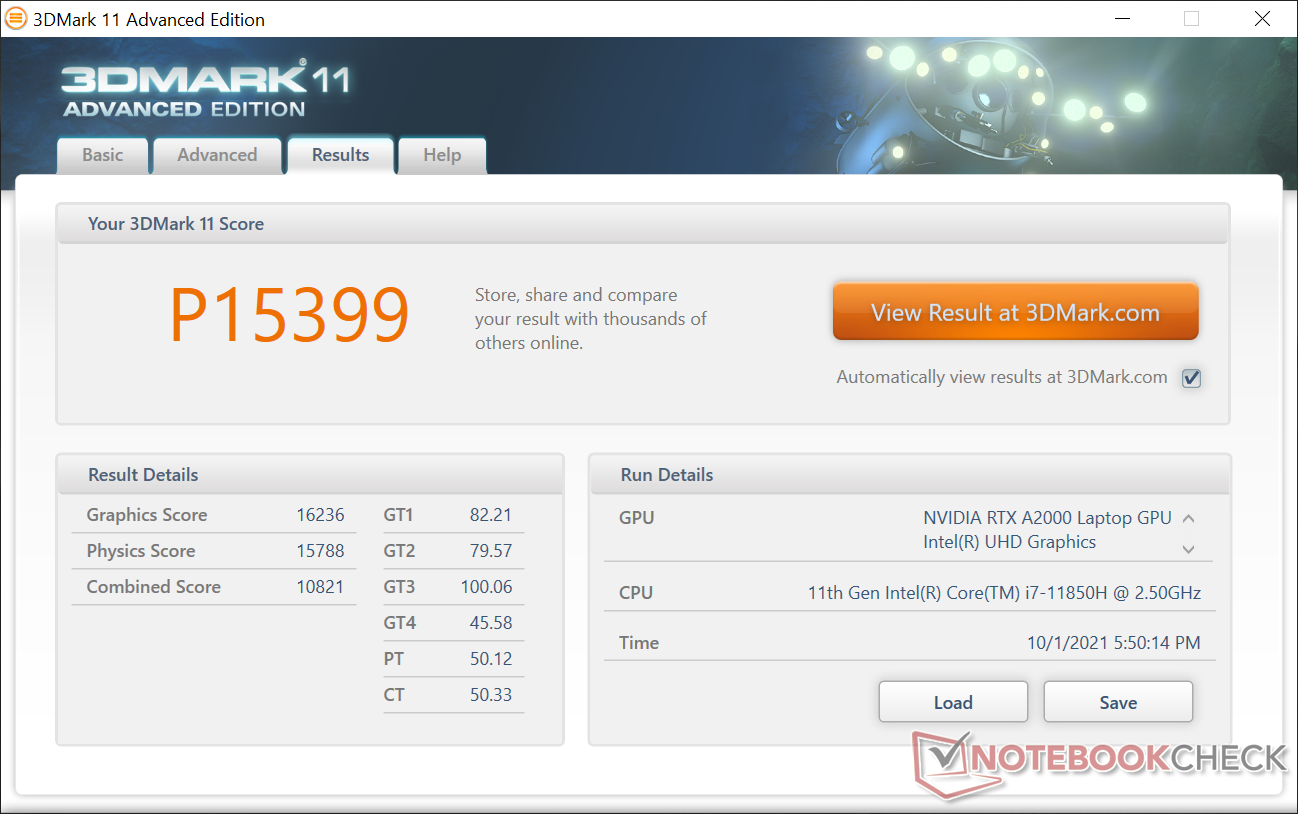
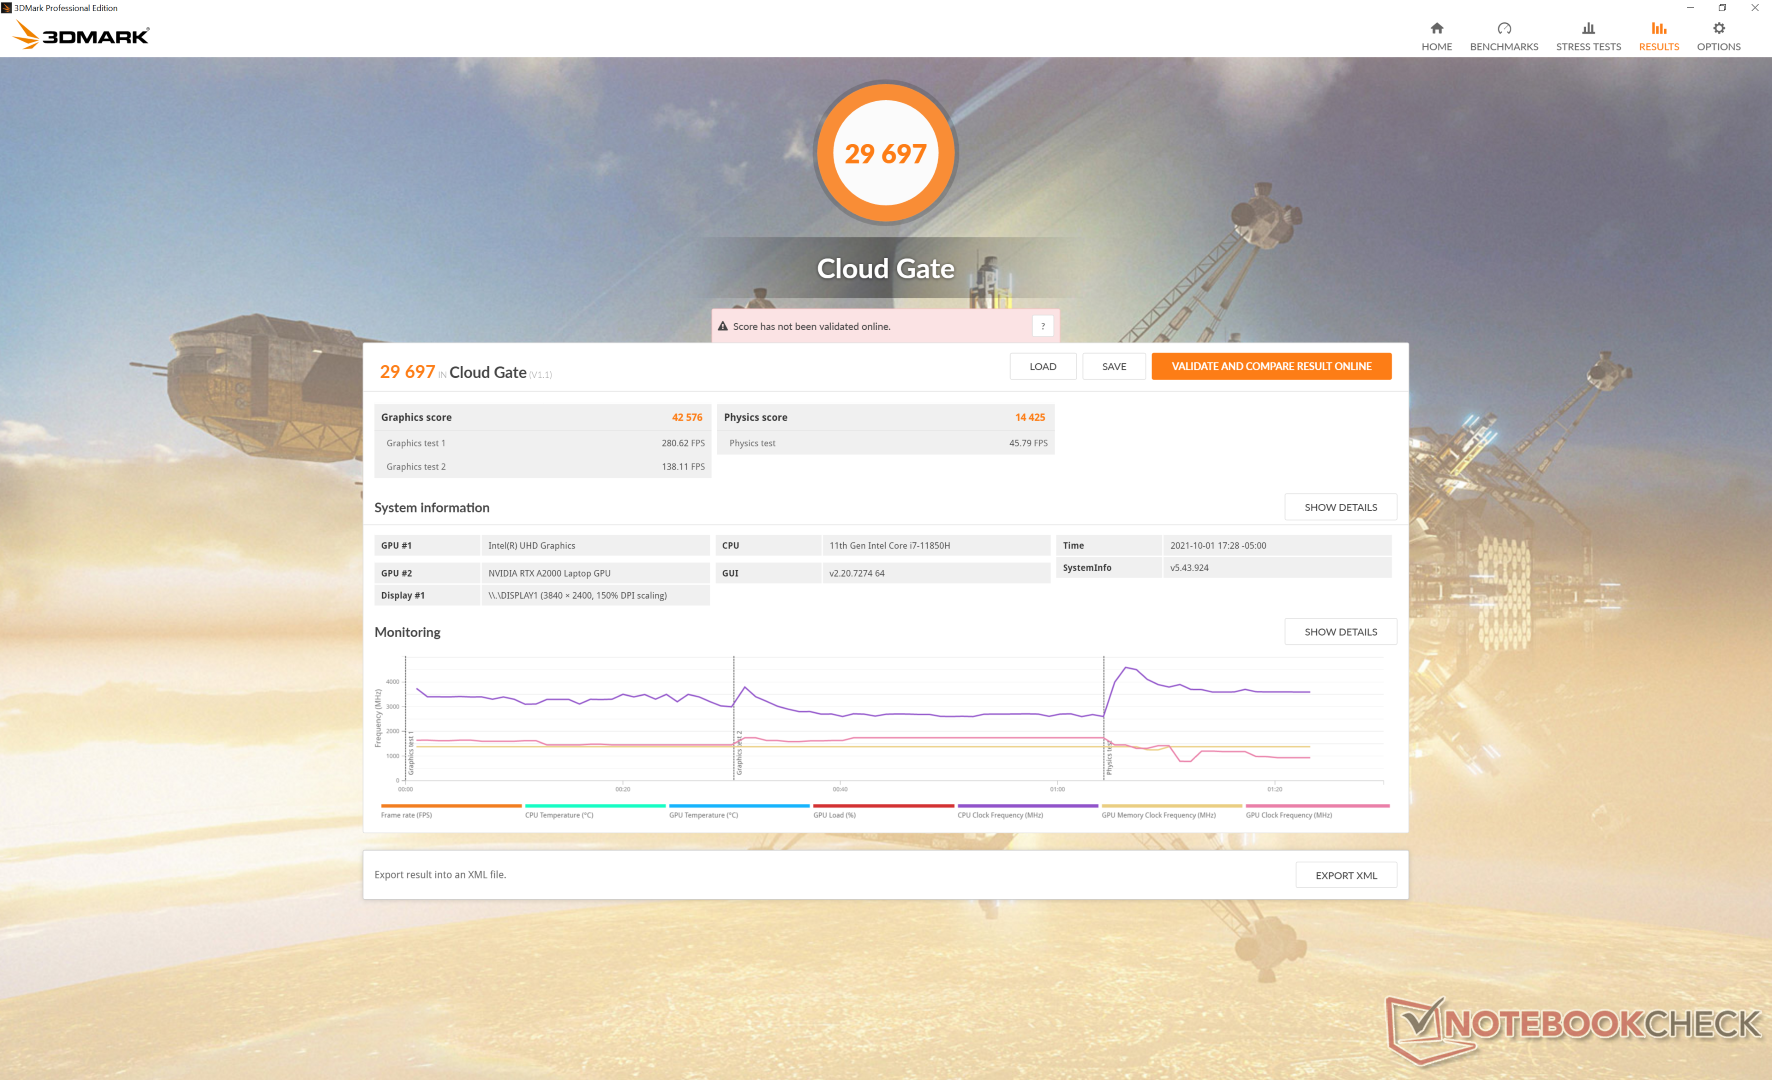
| 3DMark 11 Performance | 15399 points | |
| 3DMark Cloud Gate Standard Score | 29697 points | |
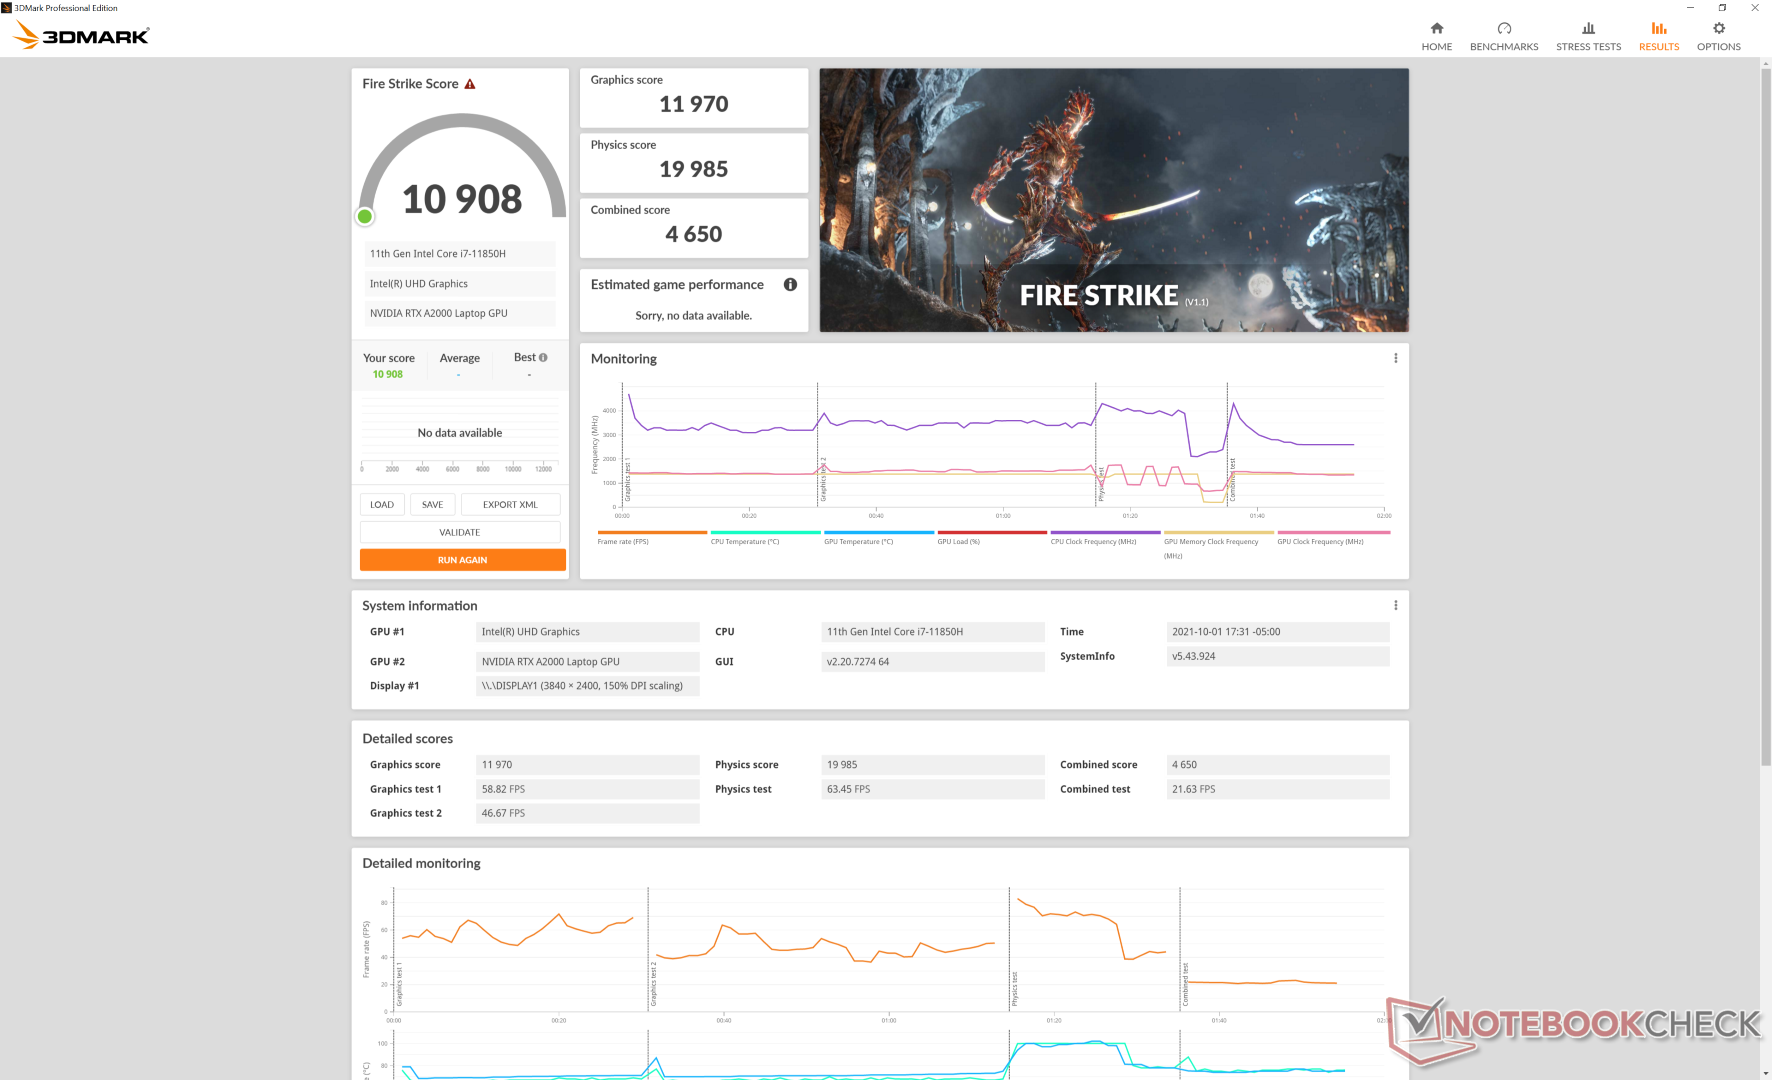
| 3DMark Fire Strike Score | 10908 points | |
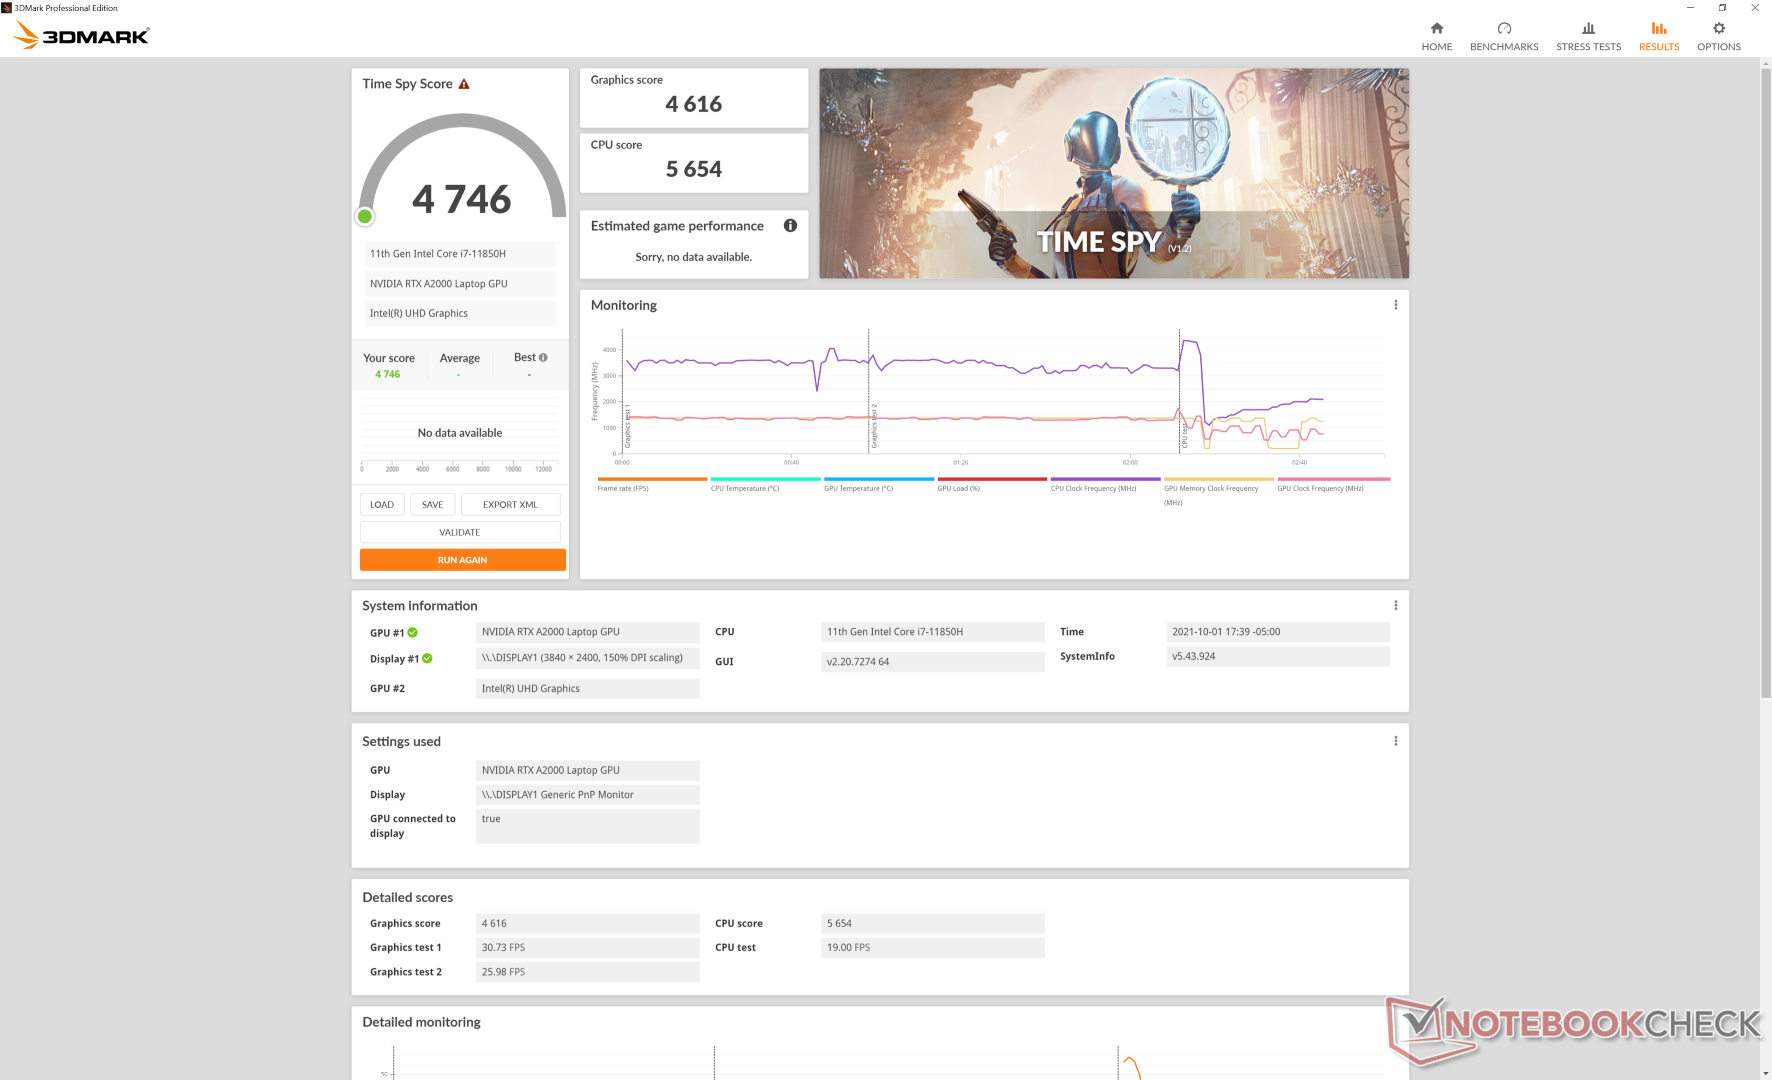
| 3DMark Time Spy Score | 4746 points | |
Help | ||
| Strange Brigade - 1280x720 lowest AF:1 | |
| Razer Blade 15 Advanced (Mid 2021) | |
| Lenovo ThinkPad P15 G2-20YQ001JGE | |
| Asus ROG Zephyrus M15 GU502LU-BI7N4 | |
| Average NVIDIA RTX A2000 Laptop GPU (238 - 353, n=9) | |
| Dell Precision 5000 5560 | |
| Lenovo ThinkPad P15s Gen2-20W6000GGE | |
Witcher 3 FPS Chart
| low | med. | high | ultra | QHD | 4K | |
|---|---|---|---|---|---|---|
| GTA V (2015) | 179 | 170 | 112 | 57.8 | 42.9 | |
| The Witcher 3 (2015) | 259.8 | 151.9 | 92.4 | 50 | 33.1 | |
| Dota 2 Reborn (2015) | 173 | 155 | 130 | 119 | 62.9 | |
| Final Fantasy XV Benchmark (2018) | 86.9 | 63.2 | 46.6 | 34.4 | 19.3 | |
| X-Plane 11.11 (2018) | 112 | 89.2 | 75.1 | 45.3 | ||
| Far Cry 5 (2018) | 120 | 82 | 77 | 69 | 49 | |
| Strange Brigade (2018) | 251 | 60.4 | ||||
| Shadow of the Tomb Raider (2018) | 107 | 62 | 58 | 55 | 40 | 17 |
| Far Cry New Dawn (2019) | 106 | 72 | 71 | 59 | 49 | |
| Metro Exodus (2019) | 110.4 | 55.1 | 42.3 | 34.9 | 27 | |
| Borderlands 3 (2019) | 115.5 | 60.7 | 46.2 | 36 | ||
| Gears Tactics (2020) | 104.3 | 113.7 | 77.5 | 53.4 | 37.3 | |
| Horizon Zero Dawn (2020) | 81 | 60 | 55 | 49 | 41 | |
| Watch Dogs Legion (2020) | 86 | 62 | 51 | 29 | 20 | |
| Dirt 5 (2020) | 86.3 | 68 | 54.6 | 41.9 | 34 | |
| Assassin´s Creed Valhalla (2020) | 80 | 55 | 39 | 32 | 27 | |
| Immortals Fenyx Rising (2020) | 107 | 80 | 72 | 64 | 53 | |
| Hitman 3 (2021) | 166.6 | 83.4 | 78.6 | 73.9 | 48.4 | |
| F1 2021 (2021) | 114 | 120 | 104 | 37 | 24 |
Emissions
系统噪音
有趣的是,风扇噪音明显比我们在Precision 5550上观察到的要安静。虽然Precision 5550的风扇噪音可以达到50dB(A)以上,但在我们的Precision 5560上,即使在相同的压力条件下,最大也只能达到41.4dB(A)。这种较低的风扇上限是值得赞赏的,它实际上有助于该系统成为市场上最安静的超薄移动工作站之一,但这是以较高的核心温度为代价的。我们下面的压力测试部分将显示两台笔记本电脑在运行Prime95时的CPU温度相差16C。
| Dell Precision 5000 5560 RTX A2000 Laptop GPU, i7-11850H, Samsung PM9A1 MZVL22T0HBLB | Lenovo ThinkPad P15 G2-20YQ001JGE RTX A3000 Laptop GPU, i7-11800H, Kioxia XG7 KXG7AZNV512G | HP ZBook Studio 15 G8 GeForce RTX 3070 Laptop GPU, i9-11950H, Samsung PM981a MZVLB2T0HALB | Asus ProArt StudioBook Pro 15 W500G5T Quadro RTX 5000 Max-Q, i7-9750H, Samsung SSD PM981 MZVLB1T0HALR | Dell Precision 7550 Quadro RTX 5000 Max-Q, W-10885M, SK Hynix PC601A NVMe 1TB | Dell Precision 5550 P91F Quadro T2000 Max-Q, i7-10875H, SK Hynix PC601A NVMe 1TB | Razer Blade 15 Studio Edition 2020 Quadro RTX 5000 Max-Q, i7-10875H, Samsung PM981a MZVLB1T0HBLR | |
|---|---|---|---|---|---|---|---|
| Noise | -25% | -18% | -26% | -27% | -17% | -28% | |
| off / environment * (dB) | 23.4 | 24.3 -4% | 23.5 -0% | 25.2 -8% | 25.8 -10% | 26.2 -12% | 30.1 -29% |
| Idle Minimum * (dB) | 23.6 | 24.3 -3% | 25.3 -7% | 27.9 -18% | 25.8 -9% | 26.2 -11% | 30.1 -28% |
| Idle Average * (dB) | 23.6 | 24.3 -3% | 25.3 -7% | 27.9 -18% | 25.8 -9% | 26.2 -11% | 30.1 -28% |
| Idle Maximum * (dB) | 23.6 | 28.6 -21% | 25.3 -7% | 27.9 -18% | 25.9 -10% | 26.2 -11% | 30.1 -28% |
| Load Average * (dB) | 25.8 | 47.5 -84% | 41.2 -60% | 47 -82% | 51.2 -98% | 39.2 -52% | 42.3 -64% |
| Witcher 3 ultra * (dB) | 40.1 | 49.4 -23% | 51.9 -29% | 39 3% | 48.2 -20% | ||
| Load Maximum * (dB) | 41.4 | 54.9 -33% | 49.4 -19% | 46.9 -13% | 51.9 -25% | 50.6 -22% | 42.1 -2% |
* ... smaller is better
Noise level
| Idle |
| 23.6 / 23.6 / 23.6 dB(A) |
| Load |
| 25.8 / 41.4 dB(A) |
 | ||
30 dB silent 40 dB(A) audible 50 dB(A) loud |
||
min: | ||
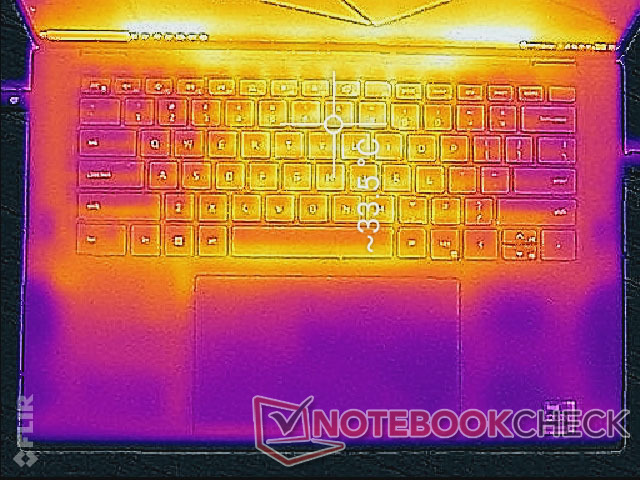
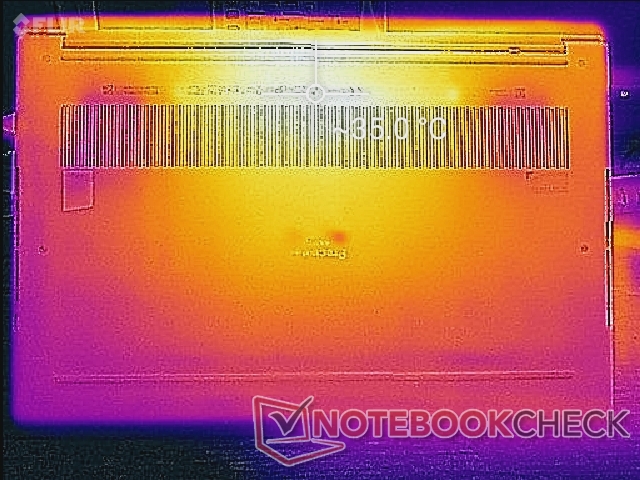
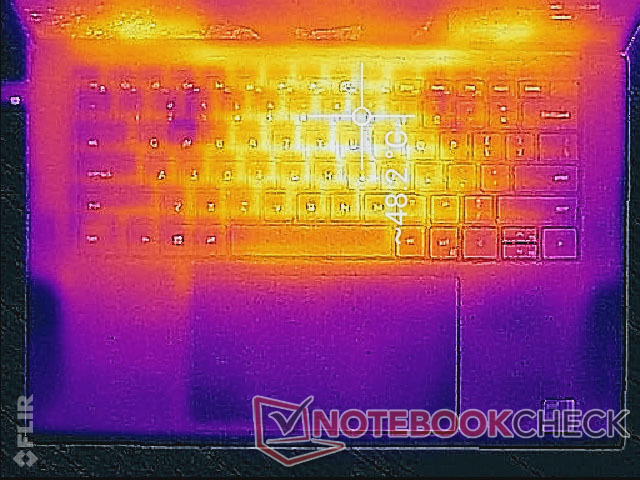
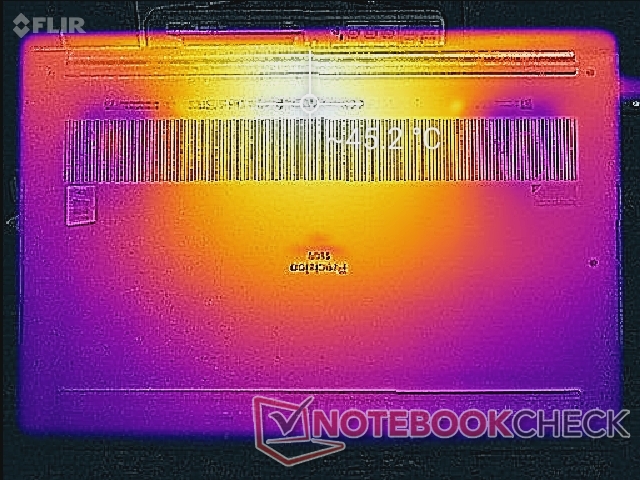
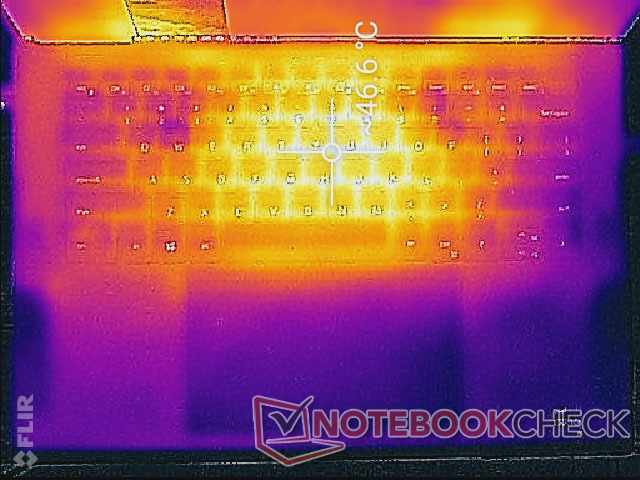
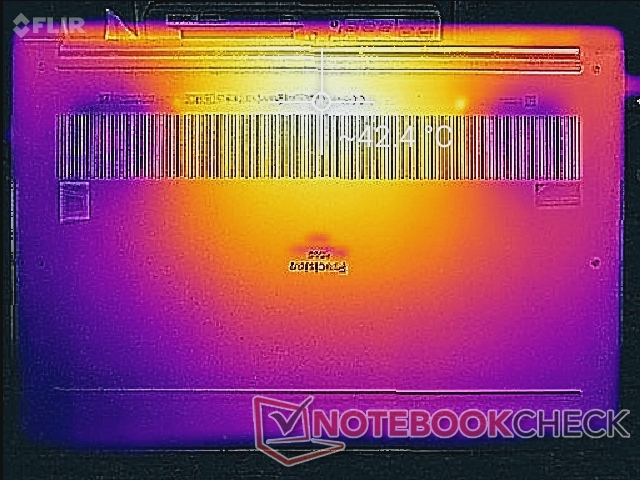
温度
负载下的表面温度与我们在Precision 5550上记录的相似,顶部和底部的热点分别接近49℃和45℃。由于内部的对称冷却方案,温度的发展在很大程度上是对称的,因此键盘中心的温度会比掌托或边缘的温度高很多。该ThinkPad P15 Gen 2是一个比我们的Precision 5560更强大的移动工作站,但其热点会因此而变得更热,超过63℃。
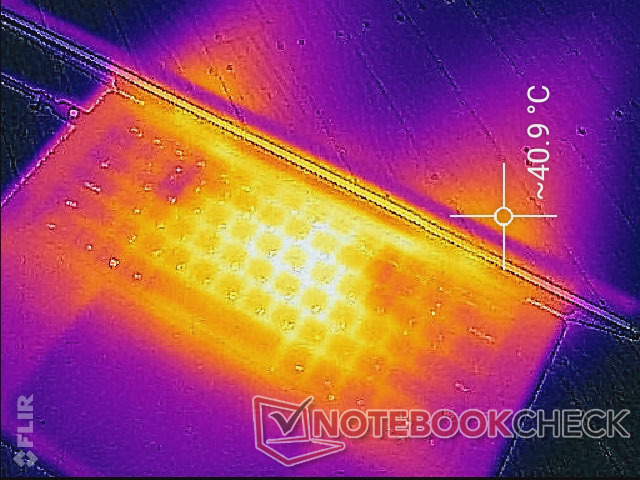
(-) The maximum temperature on the upper side is 48.2 °C / 119 F, compared to the average of 38.2 °C / 101 F, ranging from 22.2 to 69.8 °C for the class Workstation.
(±) The bottom heats up to a maximum of 42.6 °C / 109 F, compared to the average of 41.1 °C / 106 F
(+) In idle usage, the average temperature for the upper side is 30.6 °C / 87 F, compared to the device average of 32 °C / 90 F.
(±) Playing The Witcher 3, the average temperature for the upper side is 35.4 °C / 96 F, compared to the device average of 32 °C / 90 F.
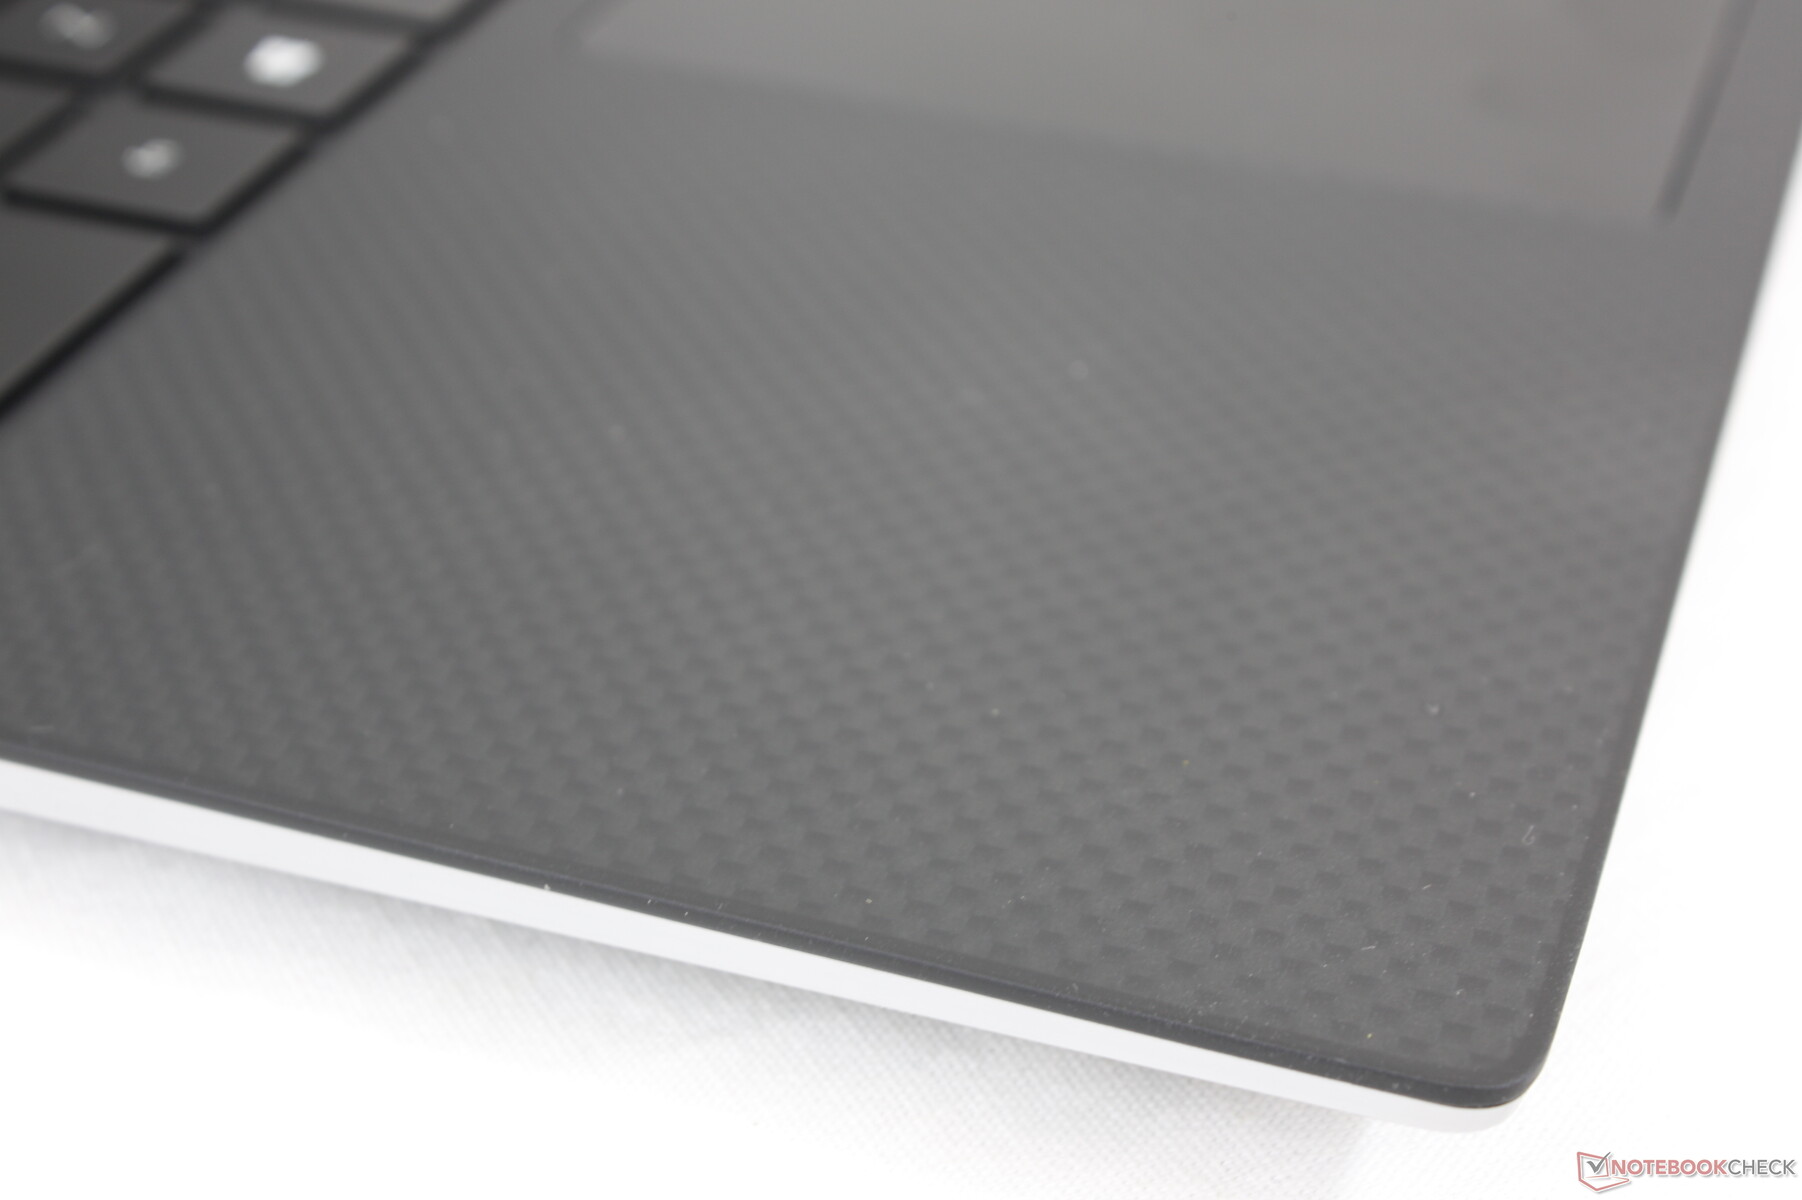
(+) The palmrests and touchpad are cooler than skin temperature with a maximum of 30.8 °C / 87.4 F and are therefore cool to the touch.
(-) The average temperature of the palmrest area of similar devices was 27.8 °C / 82 F (-3 °C / -5.4 F).
压力测试
当运行Prime95时,CPU在达到100C的核心温度之前的头几秒钟会提升到3.8GHz。然后时钟速率会在接下来的一分钟左右下降到2.8至3.0GHz的范围,然后进一步下降到2.5至2.8GHz的范围。核心温度最终将稳定在90℃左右,而惠普ZBook Studio 15 G8的温度为98℃,Precision 5550的温度仅为74℃。
当运行 Witcher 3代表压力负荷时,CPU和GPU将分别稳定在69摄氏度和75摄氏度,而Precision 5550则为66摄氏度和67摄氏度。实时GPU板的功耗将稳定在45W,而Precision 5550的功耗为40W,这可能部分解释了我们的Precision 5560的GPU温度略高。
用电池供电运行会影响性能。在电池上进行的3DMark 11测试将返回物理和图形分数,分别为14330和12191分,而在电源上则为15788和16236分。
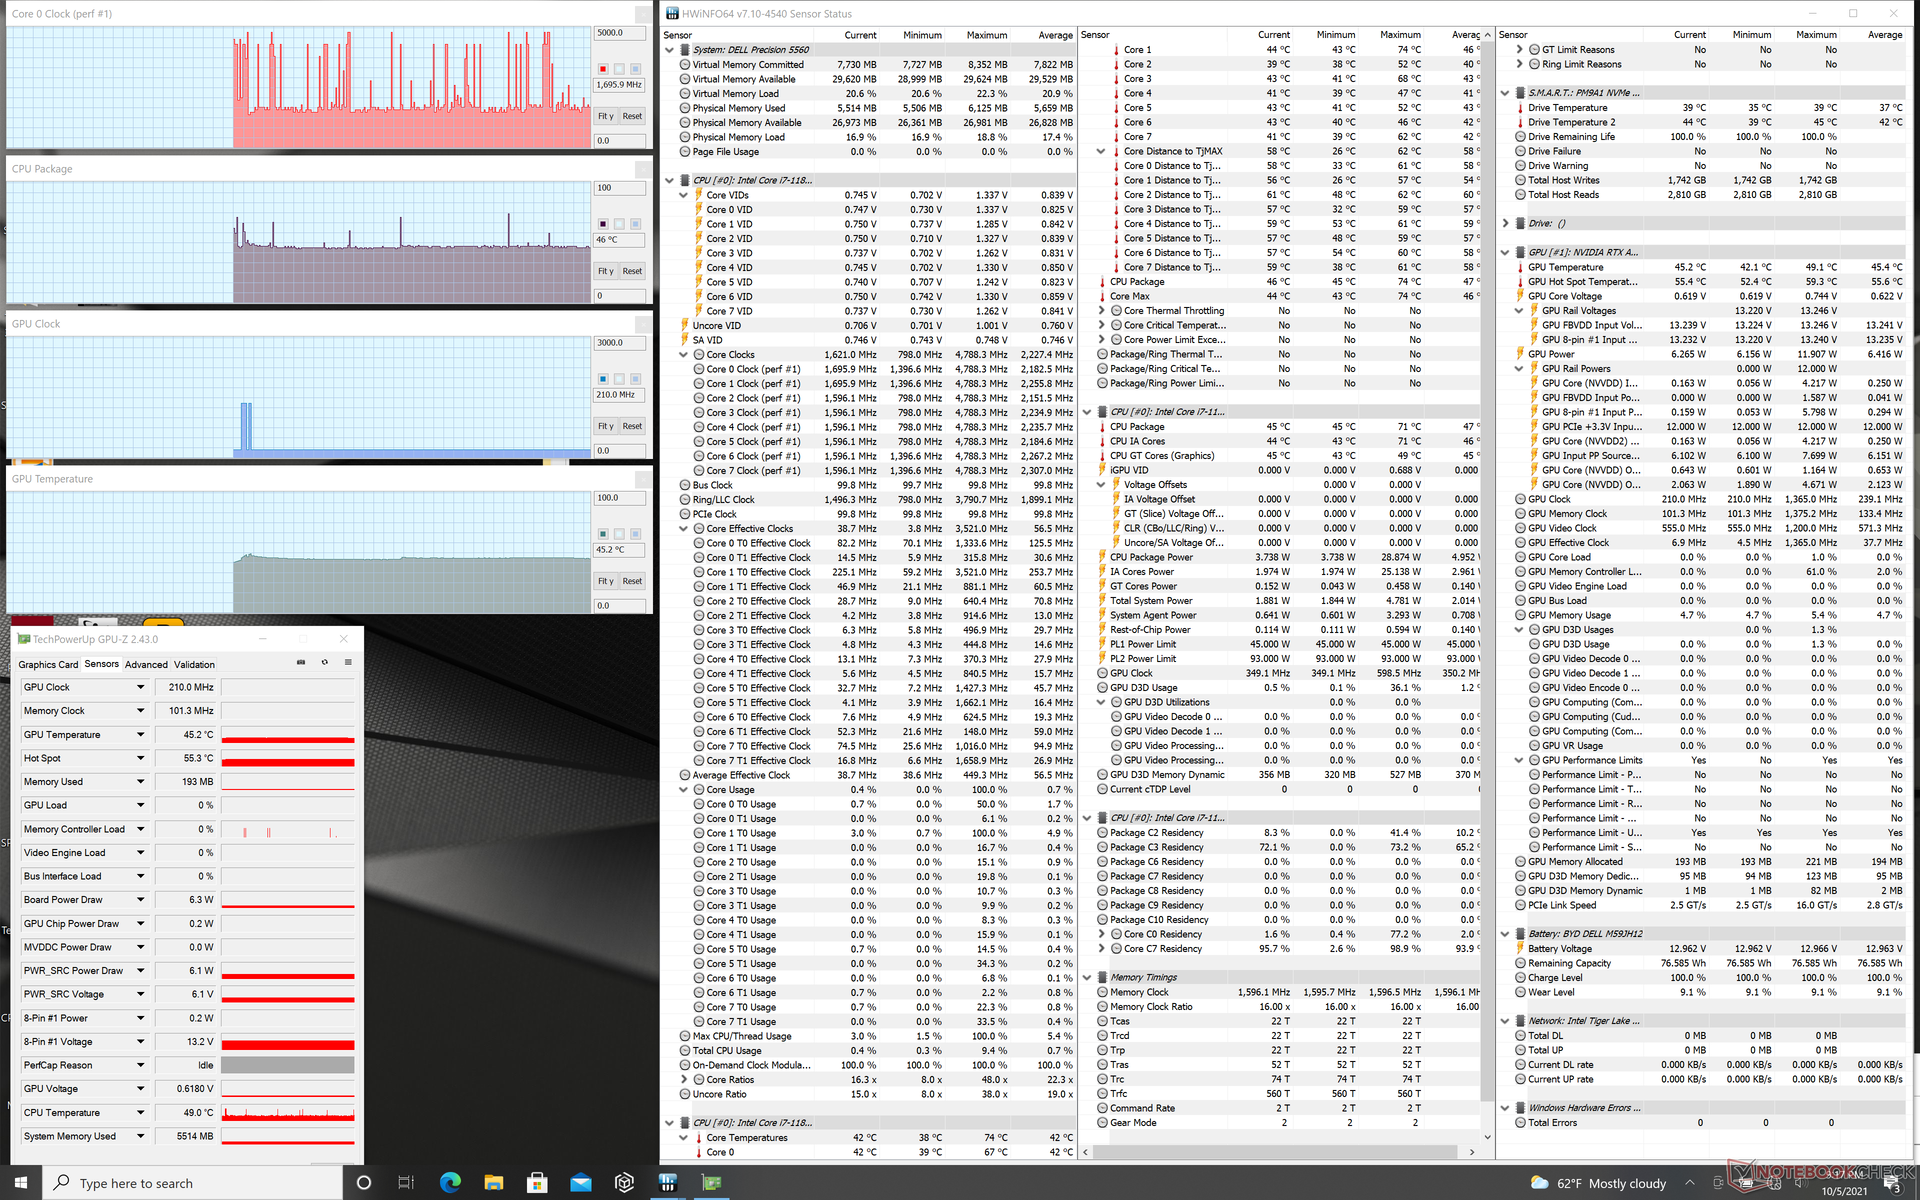
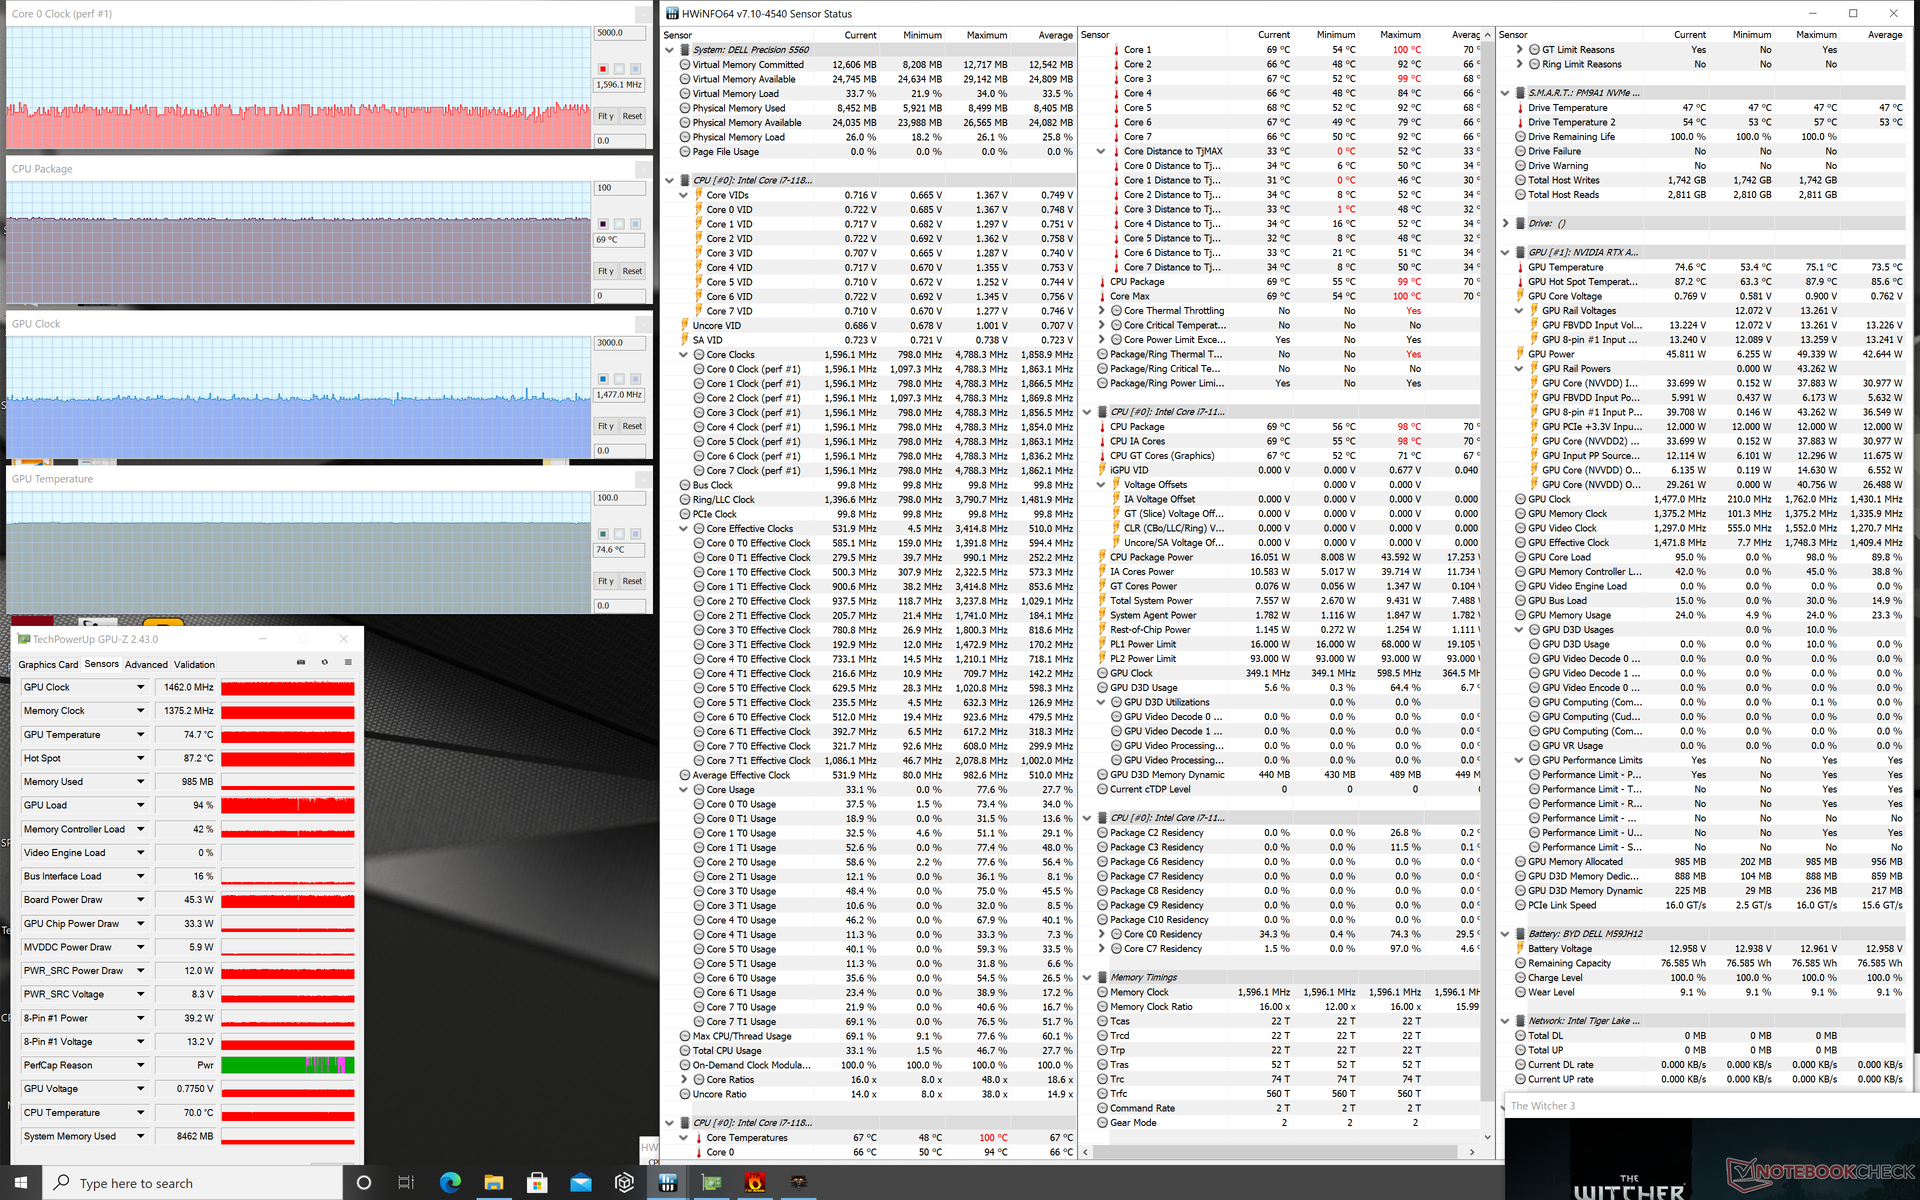
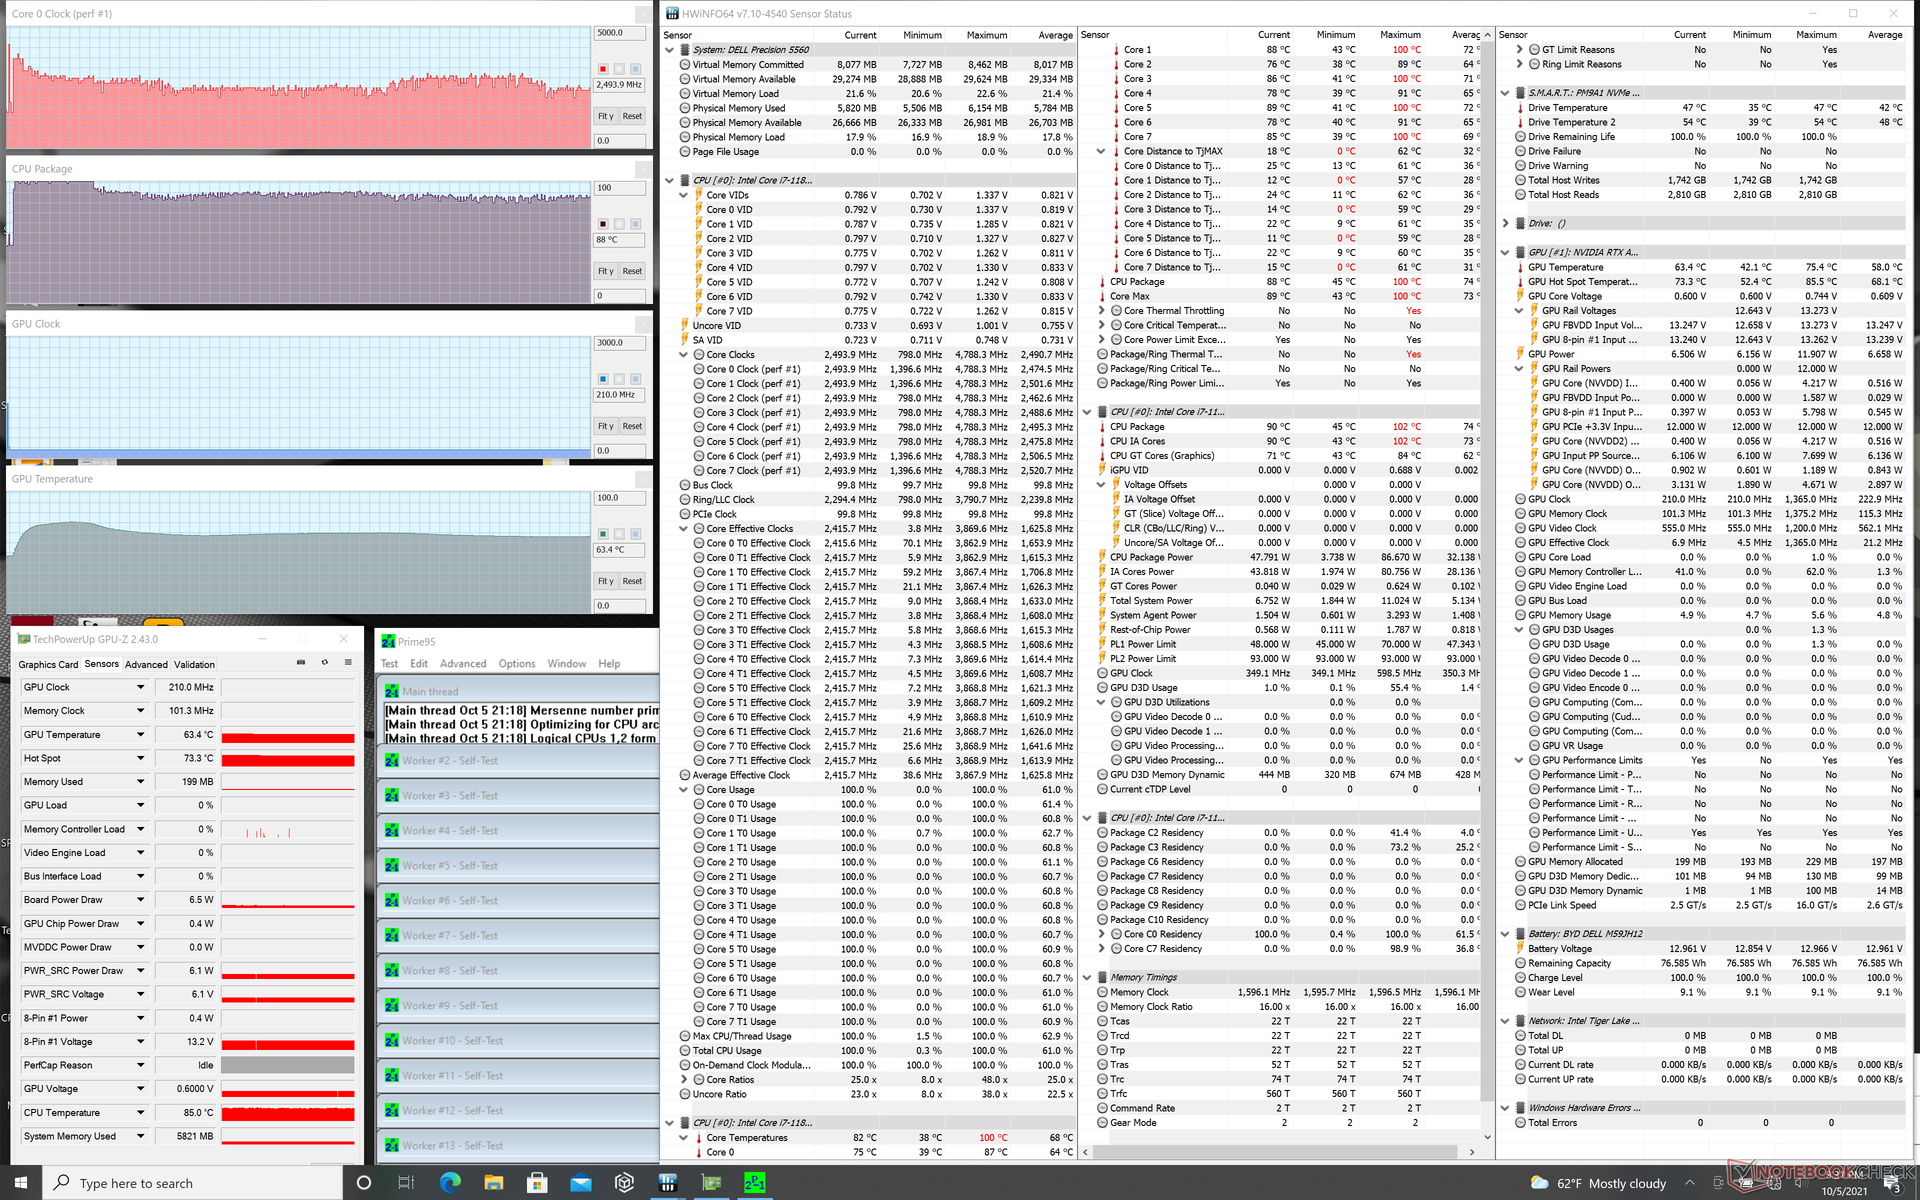
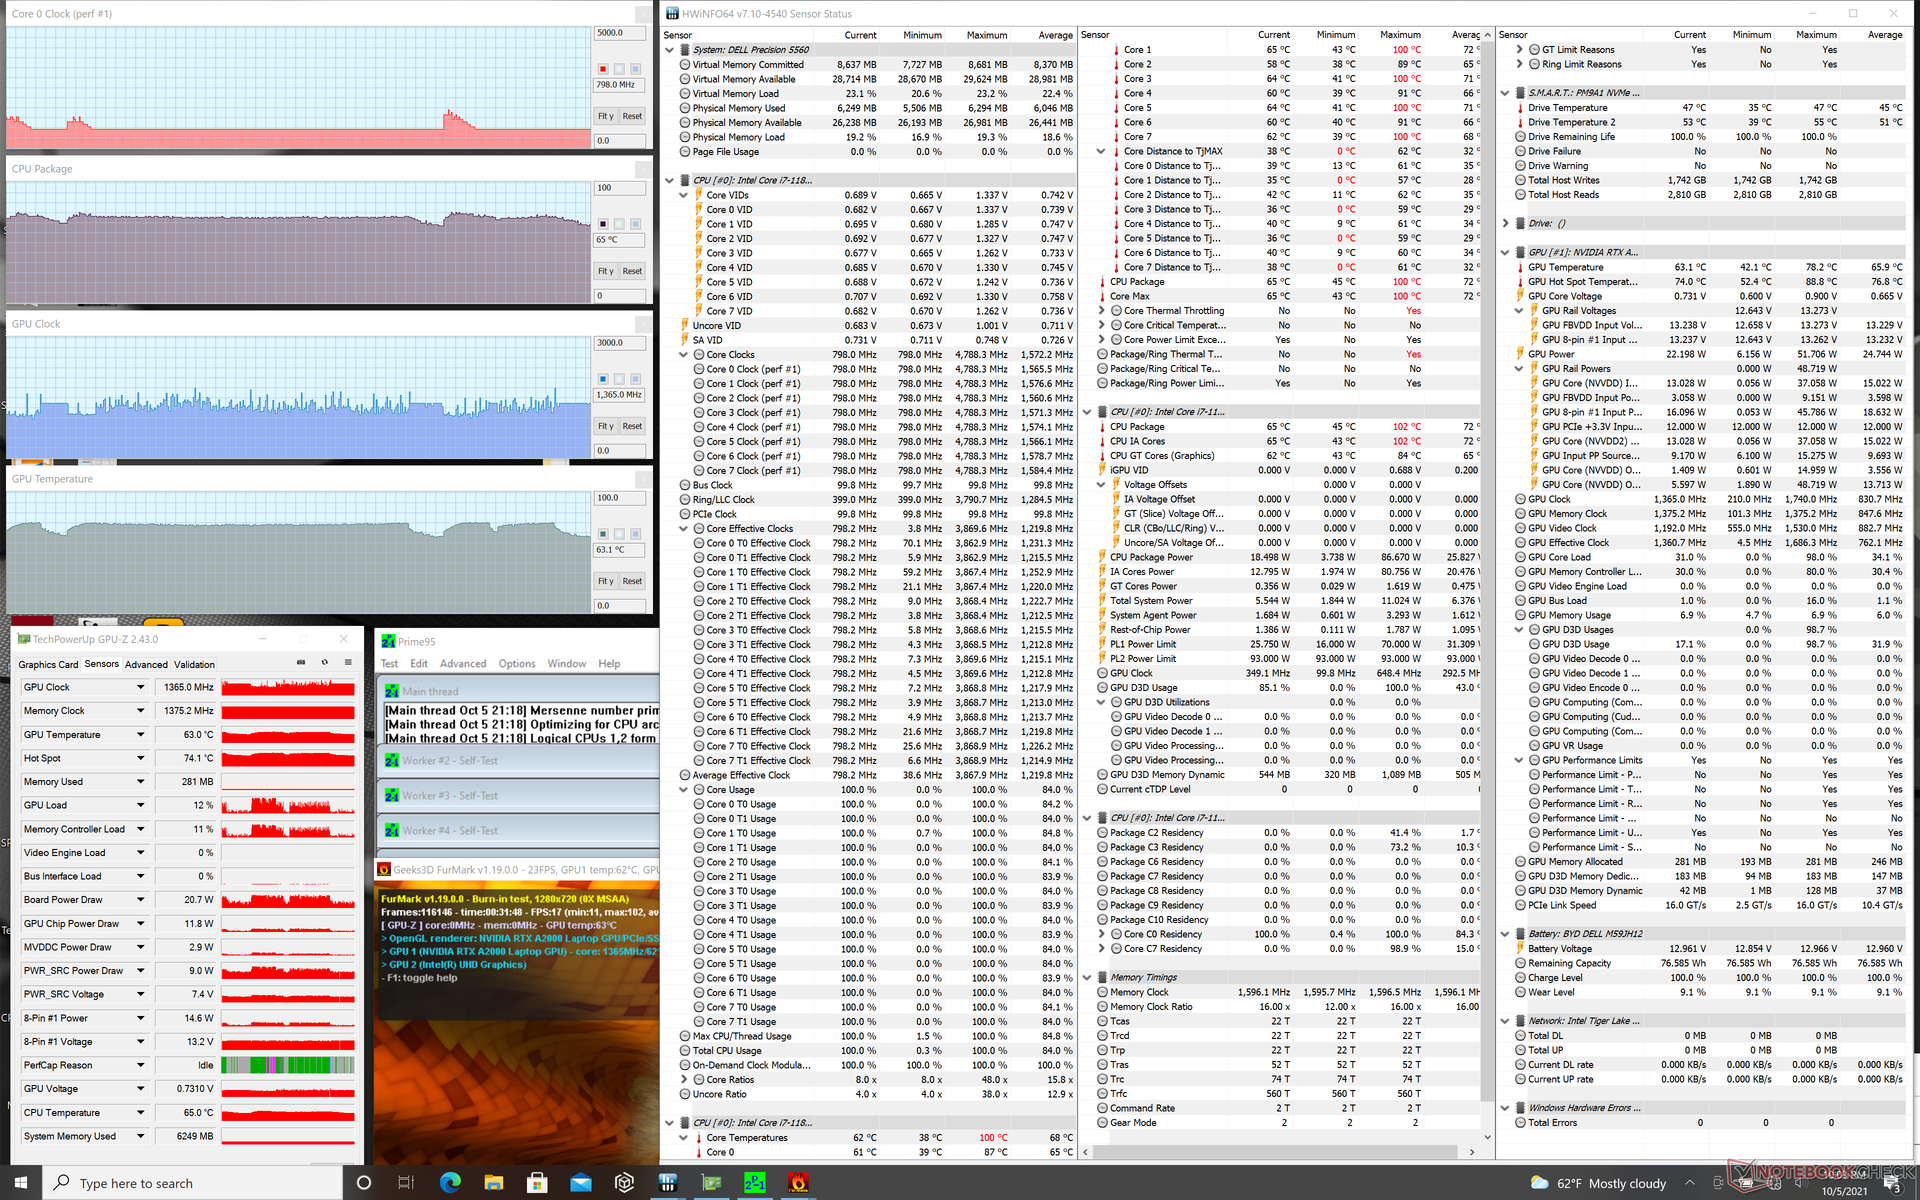
| CPU时钟(GHz) | GPU时钟(MHz) | CPU平均温度(℃) | GPU平均温度(℃) | |
| 系统空闲 | -- | -- | 46 | 45 |
| Prime95压力 | 2.5 - 2.8 | -- | ~90 | 63 |
| Prime95 + FurMark 压力 | 0.8 - 1.4 | 1000 - 1400 | 64 - 75 | 63 - 75 |
| Witcher 3 Stress | ~1.6 | 1462 | 69 | 75 |
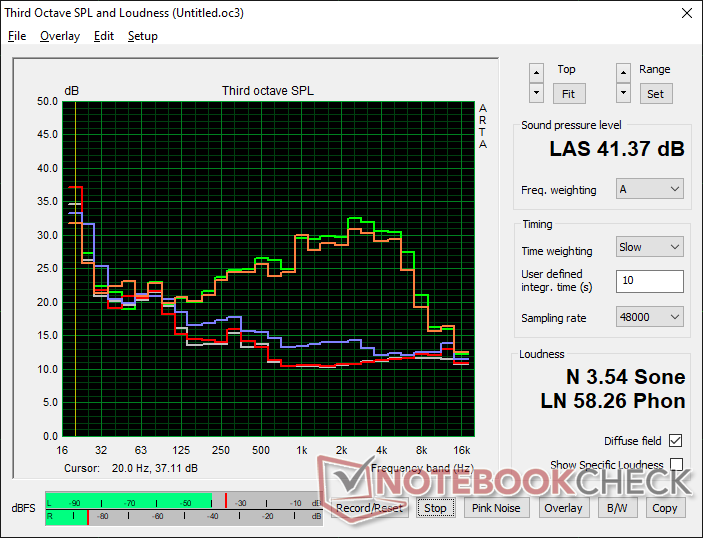
发言人

Dell Precision 5000 5560 audio analysis
(±) | speaker loudness is average but good (75.2 dB)
Bass 100 - 315 Hz
(±) | reduced bass - on average 9.8% lower than median
(±) | linearity of bass is average (8.8% delta to prev. frequency)
Mids 400 - 2000 Hz
(±) | higher mids - on average 5.7% higher than median
(+) | mids are linear (3.7% delta to prev. frequency)
Highs 2 - 16 kHz
(+) | balanced highs - only 2.7% away from median
(+) | highs are linear (6.4% delta to prev. frequency)
Overall 100 - 16.000 Hz
(+) | overall sound is linear (14.8% difference to median)
Compared to same class
» 33% of all tested devices in this class were better, 6% similar, 61% worse
» The best had a delta of 7%, average was 17%, worst was 35%
Compared to all devices tested
» 20% of all tested devices were better, 4% similar, 76% worse
» The best had a delta of 4%, average was 24%, worst was 134%
Apple MacBook 12 (Early 2016) 1.1 GHz audio analysis
(+) | speakers can play relatively loud (83.6 dB)
Bass 100 - 315 Hz
(±) | reduced bass - on average 11.3% lower than median
(±) | linearity of bass is average (14.2% delta to prev. frequency)
Mids 400 - 2000 Hz
(+) | balanced mids - only 2.4% away from median
(+) | mids are linear (5.5% delta to prev. frequency)
Highs 2 - 16 kHz
(+) | balanced highs - only 2% away from median
(+) | highs are linear (4.5% delta to prev. frequency)
Overall 100 - 16.000 Hz
(+) | overall sound is linear (10.2% difference to median)
Compared to same class
» 7% of all tested devices in this class were better, 2% similar, 91% worse
» The best had a delta of 5%, average was 18%, worst was 53%
Compared to all devices tested
» 5% of all tested devices were better, 1% similar, 94% worse
» The best had a delta of 4%, average was 24%, worst was 134%
Energy Management
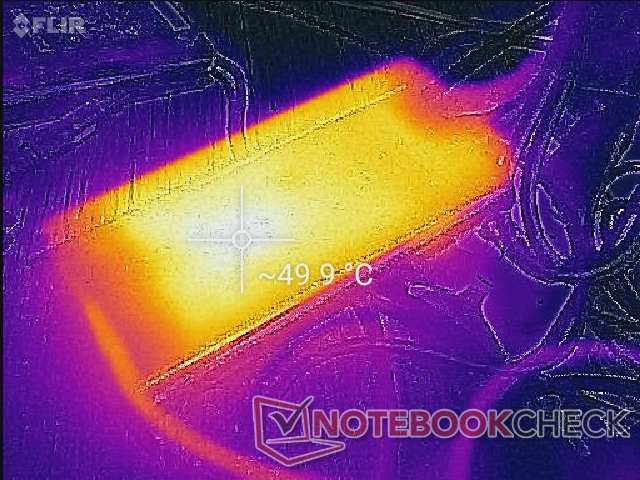
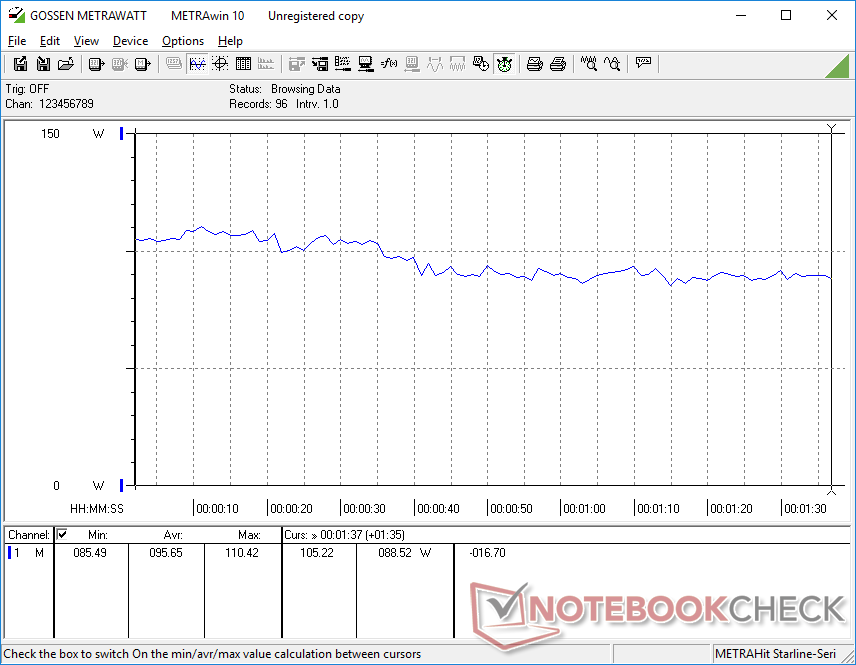
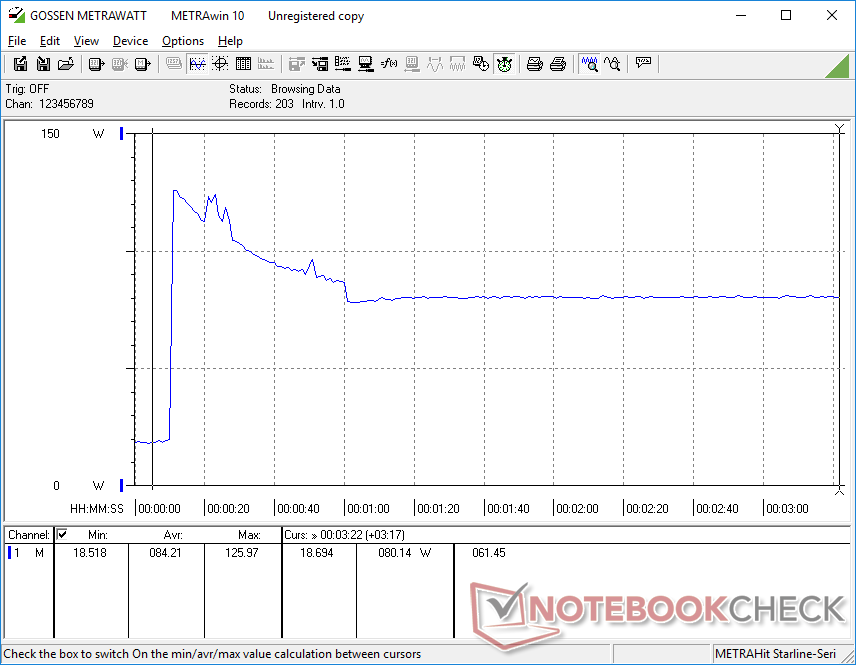
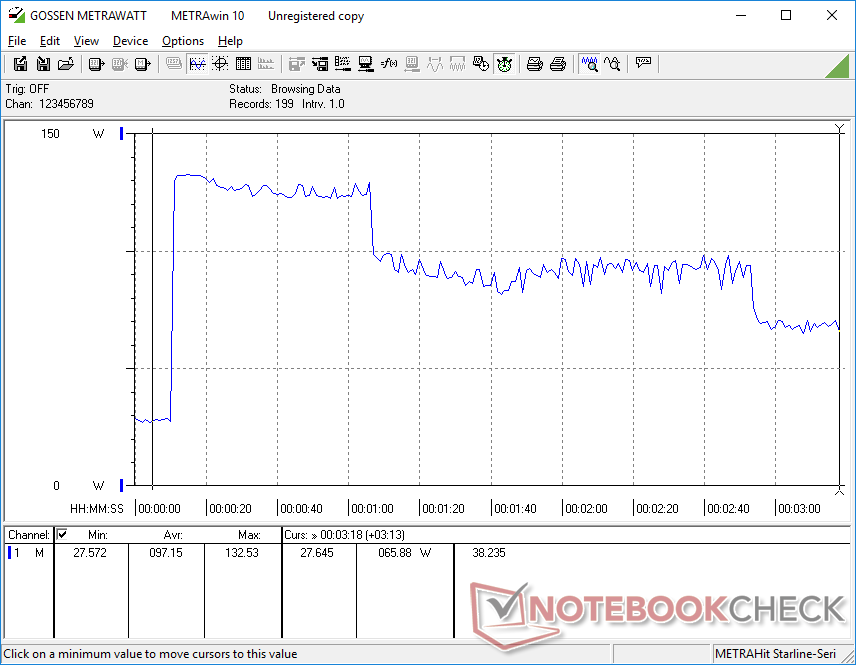
消耗功率
电源消耗是一个混合的袋子。在较低的负载下,我们的设备会比Precision 5550更耗电(6瓦至24瓦,而5瓦至19瓦),这可能是我们下一节中电池寿命较短的原因。另一方面,尽管我们的CPU和GPU可以比Core i7-10875H和Quadro T2000 Max-Q分别快15%和50%,但在运行游戏等高负荷时,功耗会与Precision 5550几乎相同。因此,在运行高要求的应用程序时,每瓦性能同比更高。
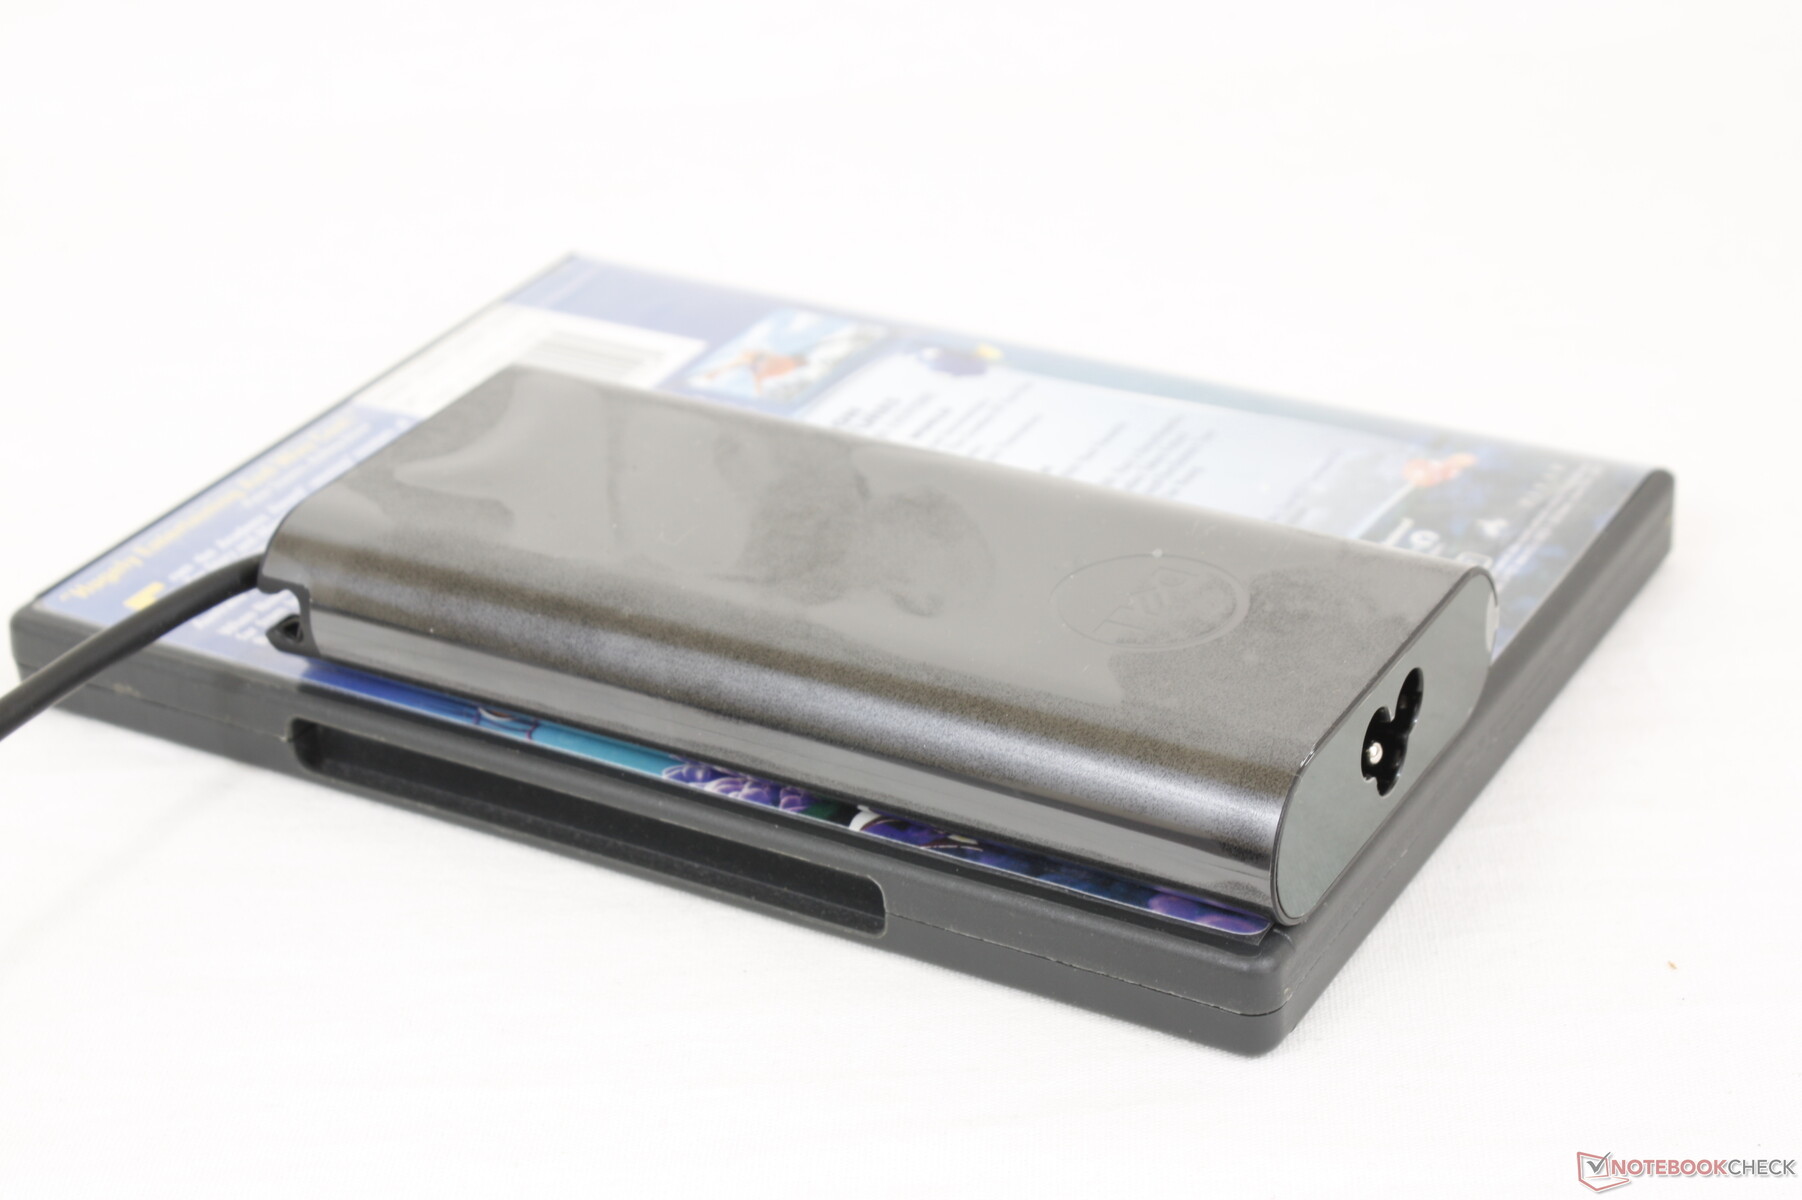
我们能够从小型(约14.3 x 6.5 x 2.2厘米)的130瓦USB-C交流适配器记录到133瓦的临时最大消耗。由于热限制,消耗量随着时间的推移而下降,正如我们下面的图表所示。当连接到主电源时,电池不会耗尽,这在一些早期的 5750机型上是不存在的。 一些早期的Precision 5750型号.

| Off / Standby | |
| Idle | |
| Load |
|
Key:
min: | |
| Dell Precision 5000 5560 i7-11850H, RTX A2000 Laptop GPU, Samsung PM9A1 MZVL22T0HBLB, IPS, 3840x2400, 15.6" | Lenovo ThinkPad P15 G2-20YQ001JGE i7-11800H, RTX A3000 Laptop GPU, Kioxia XG7 KXG7AZNV512G, IPS, 1920x1080, 15.6" | HP ZBook Studio 15 G8 i9-11950H, GeForce RTX 3070 Laptop GPU, Samsung PM981a MZVLB2T0HALB, OLED, 3840x2160, 15.6" | Asus ProArt StudioBook Pro 15 W500G5T i7-9750H, Quadro RTX 5000 Max-Q, Samsung SSD PM981 MZVLB1T0HALR, IPS, 3840x2160, 15.6" | Dell Precision 7550 W-10885M, Quadro RTX 5000 Max-Q, SK Hynix PC601A NVMe 1TB, IPS, 3840x2160, 15.6" | Dell Precision 5550 P91F i7-10875H, Quadro T2000 Max-Q, SK Hynix PC601A NVMe 1TB, IPS, 3840x2400, 15.6" | Razer Blade 15 Studio Edition 2020 i7-10875H, Quadro RTX 5000 Max-Q, Samsung PM981a MZVLB1T0HBLR, OLED, 3840x2160, 15.6" | |
|---|---|---|---|---|---|---|---|
| Power Consumption | -11% | -43% | -30% | -38% | 7% | -44% | |
| Idle Minimum * (Watt) | 6.2 | 6.3 -2% | 11 -77% | 11.6 -87% | 8.2 -32% | 5.6 10% | 13.4 -116% |
| Idle Average * (Watt) | 13.9 | 10.7 23% | 18.8 -35% | 19 -37% | 16.8 -21% | 11.2 19% | 18 -29% |
| Idle Maximum * (Watt) | 23.8 | 11.6 51% | 31.7 -33% | 20.6 13% | 24.4 -3% | 18.4 23% | 26.1 -10% |
| Load Average * (Watt) | 95.7 | 99.3 -4% | 105.2 -10% | 102 -7% | 131 -37% | 114 -19% | 115 -20% |
| Witcher 3 ultra * (Watt) | 87 | 154 -77% | 148 -70% | 156.6 -80% | 76.7 12% | 145 -67% | |
| Load Maximum * (Watt) | 132.6 | 210 -58% | 171.8 -30% | 178 -34% | 201.8 -52% | 134.2 -1% | 165 -24% |
* ... smaller is better
Power Consumption Witcher 3 / Stresstest
电池寿命
运行时间通常比我们在去年的Precision 5550上记录的时间要短。实际的WLAN使用只能持续6.5小时左右,而老款机型则为9小时,即使两者都设置为相同的平衡电源配置文件,且Optimus处于激活状态。
从空电到满电大约需要2小时。我们赞赏该系统可以通过其三个USB-C端口中的任何一个进行充电,而一些笔记本电脑只支持一个USB-C端口的充电。同样的戴尔充电器也可用于为现代XPS笔记本电脑充电。
| Dell Precision 5000 5560 i7-11850H, RTX A2000 Laptop GPU, 86 Wh | Lenovo ThinkPad P15 G2-20YQ001JGE i7-11800H, RTX A3000 Laptop GPU, 94 Wh | HP ZBook Studio 15 G8 i9-11950H, GeForce RTX 3070 Laptop GPU, 83 Wh | Asus ProArt StudioBook Pro 15 W500G5T i7-9750H, Quadro RTX 5000 Max-Q, 76 Wh | Dell Precision 7550 W-10885M, Quadro RTX 5000 Max-Q, 95 Wh | Dell Precision 5550 P91F i7-10875H, Quadro T2000 Max-Q, 86 Wh | Razer Blade 15 Studio Edition 2020 i7-10875H, Quadro RTX 5000 Max-Q, 80 Wh | |
|---|---|---|---|---|---|---|---|
| Battery runtime | 15% | 2% | -25% | -3% | 36% | -9% | |
| Reader / Idle (h) | 12 | 12.9 8% | 11.1 -7% | 22.6 88% | 8.8 -27% | ||
| WiFi v1.3 (h) | 6.3 | 9.9 57% | 6.2 -2% | 4.7 -25% | 8.9 41% | 9 43% | 5.7 -10% |
| Load (h) | 1.8 | 1.3 -28% | 1.8 0% | 1 -44% | 1.4 -22% | 2 11% |
Pros
Cons
结论 - 相同的外观,更快的图形
为什么要购买Precision 5560,因为它在视觉上与 5550完全相同。 Precision 5550?GPU功率的跃升将是考虑较新机型而非较旧机型的主要原因。Nvidia的Quadro RTX A2000比Quadro T2000 Max-Q领先一代,在功耗、电池寿命、重量、表面温度、甚至风扇噪音方面的成本最低,提供高达50%的GPU性能。仅仅是每瓦性能的提高就有助于使该系统的性能比其超薄的外形所显示的要快。用户也将获得CPU性能的提升,尽管幅度小得多。
与Precision 5550相比,GPU功率有了巨大的提升。然而,如果你对Quadro RTX A2000不感兴趣,那么你可能想考虑去年视觉上相同的型号。
不管是什么原因,我们的Precision 5560无法达到我们在5550上经历的最大风扇噪音上限。这有可能是制造商为了降低风扇噪音而故意为之,但它确实对核心温度有一定的影响。
知道自己可以从图形能力的提升中获益的用户将希望跳过Precision 5550,而选择5560。否则,5550在物理功能和显示方面可以提供相同的用户体验。竞争者如 微星WS66, Razer Blade 15 Studio, 或 联想ThinkPad P15 G2这些产品略微厚一些,但它们携带的Quadro RTX A3000及以上版本的GPU速度更快,而这些GPU在Precision 5000系列上是没有的。
价格和可用性
我们的Core i7和Quadro RTX A2000配置可以在Newegg 和 沃尔玛 从2800美元到3400美元不等。其他SKU也有,包括在 亚马逊.为了获得最多选择,用户可以直接从Dell.com订购。.
Dell Precision 5000 5560
- 10/06/2021 v7 (old)
Allen Ngo
Price comparison

