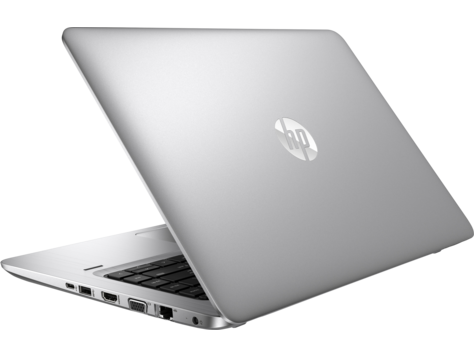
惠普 ProBook 440 G4 (酷睿i7, 全高清) 笔记本电脑简短评测
| SD Card Reader | |
| average JPG Copy Test (av. of 3 runs) | |
| Dell Latitude 14 E5470 | |
| HP ProBook 430 G4-Y8B47EA | |
| HP ProBook 440 G4-Y8B51EA | |
| HP ProBook 450 G4 Y8B60EA | |
| Lenovo ThinkPad E470-20H2S00400 | |
| Acer TravelMate X3 X349-M-7261 | |
| maximum AS SSD Seq Read Test (1GB) | |
| Dell Latitude 14 E5470 | |
| HP ProBook 450 G4 Y8B60EA | |
| HP ProBook 430 G4-Y8B47EA | |
| HP ProBook 440 G4-Y8B51EA | |
| Lenovo ThinkPad E470-20H2S00400 | |
| Acer TravelMate X3 X349-M-7261 | |
| Networking | |
| iperf Server (receive) TCP 1 m | |
| Lenovo ThinkPad E470-20H2S00400 | |
| HP ProBook 450 G4 Y8B60EA | |
| Acer TravelMate X3 X349-M-7261 (jseb) | |
| HP ProBook 440 G4-Y8B51EA | |
| HP ProBook 430 G4-Y8B47EA | |
| iperf Client (transmit) TCP 1 m | |
| Acer TravelMate X3 X349-M-7261 (jseb) | |
| HP ProBook 450 G4 Y8B60EA | |
| HP ProBook 440 G4-Y8B51EA | |
| Lenovo ThinkPad E470-20H2S00400 | |
| HP ProBook 430 G4-Y8B47EA | |
| |||||||||||||||||||||||||
Brightness Distribution: 83 %
Center on Battery: 214 cd/m²
Contrast: 460:1 (Black: 0.47 cd/m²)
ΔE ColorChecker Calman: 8.98 | ∀{0.5-29.43 Ø4.71}
ΔE Greyscale Calman: 9.61 | ∀{0.09-98 Ø4.96}
56.7% sRGB (Argyll 1.6.3 3D)
35.9% AdobeRGB 1998 (Argyll 1.6.3 3D)
38.85% AdobeRGB 1998 (Argyll 3D)
56.6% sRGB (Argyll 3D)
37.6% Display P3 (Argyll 3D)
Gamma: 2.63
CCT: 11265 K
| HP ProBook 440 G4-Y8B51EA AUO1E3D, , 1920x1080, 14" | Lenovo ThinkPad E470-20H2S00400 N140HCA-EAB, , 1920x1080, 14" | Dell Latitude 14 E5470 LG Philips LGD04B1 140WHU, , 1366x768, 14" | Acer TravelMate X3 X349-M-7261 AU Optronics B140HAN02.1, , 1920x1080, 14" | |
|---|---|---|---|---|
| Display | 9% | 7% | -2% | |
| Display P3 Coverage (%) | 37.6 | 41.23 10% | 40.06 7% | 36.97 -2% |
| sRGB Coverage (%) | 56.6 | 61.4 8% | 60.3 7% | 55.6 -2% |
| AdobeRGB 1998 Coverage (%) | 38.85 | 42.67 10% | 41.42 7% | 38.2 -2% |
| Response Times | -10% | -25% | -6% | |
| Response Time Grey 50% / Grey 80% * (ms) | 43.2 ? | 40.8 ? 6% | 56.8 ? -31% | 42 ? 3% |
| Response Time Black / White * (ms) | 24.4 ? | 30.4 ? -25% | 28.8 ? -18% | 28 ? -15% |
| PWM Frequency (Hz) | ||||
| Screen | 19% | -11% | 36% | |
| Brightness middle (cd/m²) | 216 | 244 13% | 229 6% | 230 6% |
| Brightness (cd/m²) | 203 | 231 14% | 207 2% | 226 11% |
| Brightness Distribution (%) | 83 | 89 7% | 80 -4% | 86 4% |
| Black Level * (cd/m²) | 0.47 | 0.37 21% | 0.69 -47% | 0.2 57% |
| Contrast (:1) | 460 | 659 43% | 332 -28% | 1150 150% |
| Colorchecker dE 2000 * | 8.98 | 6.41 29% | 10.16 -13% | 5.07 44% |
| Colorchecker dE 2000 max. * | 14.07 | 13.4 5% | 17.18 -22% | 10.07 28% |
| Greyscale dE 2000 * | 9.61 | 5.94 38% | 10.87 -13% | 3.64 62% |
| Gamma | 2.63 84% | 2.28 96% | 2.41 91% | 2.46 89% |
| CCT | 11265 58% | 6101 107% | 12881 50% | 6521 100% |
| Color Space (Percent of AdobeRGB 1998) (%) | 35.9 | 39.3 9% | 38.4 7% | 35 -3% |
| Color Space (Percent of sRGB) (%) | 56.7 | 61.1 8% | 60.4 7% | 55 -3% |
| Total Average (Program / Settings) | 6% /
13% | -10% /
-9% | 9% /
23% |
* ... smaller is better
Display Response Times
| ↔ Response Time Black to White | ||
|---|---|---|
| 24.4 ms ... rise ↗ and fall ↘ combined | ↗ 7.2 ms rise | 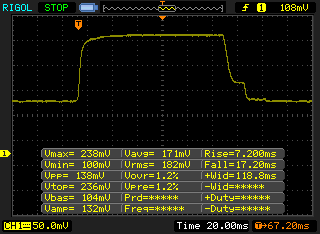 |
| ↘ 17.2 ms fall | ||
| The screen shows good response rates in our tests, but may be too slow for competitive gamers. In comparison, all tested devices range from 0.1 (minimum) to 240 (maximum) ms. » 58 % of all devices are better. This means that the measured response time is worse than the average of all tested devices (19.8 ms). | ||
| ↔ Response Time 50% Grey to 80% Grey | ||
| 43.2 ms ... rise ↗ and fall ↘ combined | ↗ 21.2 ms rise | 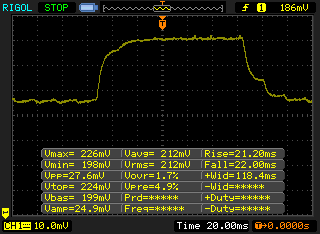 |
| ↘ 22 ms fall | ||
| The screen shows slow response rates in our tests and will be unsatisfactory for gamers. In comparison, all tested devices range from 0.165 (minimum) to 636 (maximum) ms. » 72 % of all devices are better. This means that the measured response time is worse than the average of all tested devices (31 ms). | ||
Screen Flickering / PWM (Pulse-Width Modulation)
| Screen flickering / PWM not detected | ||
In comparison: 52 % of all tested devices do not use PWM to dim the display. If PWM was detected, an average of 7754 (minimum: 5 - maximum: 343500) Hz was measured. | ||
| PCMark 7 Score | 5394 points | |
| PCMark 8 Home Score Accelerated v2 | 3614 points | |
| PCMark 8 Creative Score Accelerated v2 | 4554 points | |
| PCMark 8 Work Score Accelerated v2 | 4837 points | |
Help | ||
| HP ProBook 440 G4-Y8B51EA SanDisk SD8SNAT256G1002 | Lenovo ThinkPad E470-20H2S00400 SanDisk X400 SED 256GB, SATA (SD8TB8U-256G) | Dell Latitude 14 E5470 Liteon L8H-256V2G | Acer TravelMate X3 X349-M-7261 Liteonit CV3-8D512 | HP ProBook 430 G4-Y8B47EA SanDisk SD8SNAT256G1002 | |
|---|---|---|---|---|---|
| CrystalDiskMark 3.0 | 25% | 25% | 40% | 3% | |
| Read Seq (MB/s) | 491.2 | 476.5 -3% | 508 3% | 484.1 -1% | 505 3% |
| Write Seq (MB/s) | 322.2 | 458.7 42% | 360.6 12% | 449.8 40% | 328.9 2% |
| Read 512 (MB/s) | 310.1 | 346.4 12% | 374.1 21% | 399.1 29% | 313.6 1% |
| Write 512 (MB/s) | 276 | 291.1 5% | 300.2 9% | 355.1 29% | 301 9% |
| Read 4k (MB/s) | 19.57 | 35.15 80% | 31.98 63% | 33.44 71% | 21.69 11% |
| Write 4k (MB/s) | 77.8 | 78.8 1% | 93.1 20% | 67.5 -13% | 80.4 3% |
| Read 4k QD32 (MB/s) | 146.3 | 276 89% | 274.7 88% | 368.5 152% | 132.2 -10% |
| Write 4k QD32 (MB/s) | 241.4 | 178.3 -26% | 205.6 -15% | 280.6 16% | 258.8 7% |

| 3DMark 11 - 1280x720 Performance GPU | |
| Lenovo ThinkPad E470-20H2S00400 | |
| HP ProBook 440 G4-Y8B51EA | |
| HP ProBook 450 G4 Y8B60EA | |
| Acer TravelMate X3 X349-M-7261 | |
| HP ProBook 430 G4-Y8B47EA | |
| Dell Latitude 14 E5470 | |
| 3DMark 06 Standard Score | 12695 points | |
| 3DMark Vantage P Result | 8062 points | |
| 3DMark 11 Performance | 2342 points | |
| 3DMark Ice Storm Standard Score | 49921 points | |
| 3DMark Cloud Gate Standard Score | 7001 points | |
| 3DMark Fire Strike Score | 1444 points | |
Help | ||
| low | med. | high | ultra | |
|---|---|---|---|---|
| Tomb Raider (2013) | 134.6 | 62.3 | 34.9 | 17.7 |
| BioShock Infinite (2013) | 97.3 | 52.8 | 42.9 | 14.6 |
| Metro: Last Light (2013) | 49.1 | 37.4 | 22.3 | 11.2 |
| Battlefield 4 (2013) | 66.6 | 46.4 | 30.9 | 11.9 |
| Thief (2014) | 46.9 | 27.5 | 21.5 | 10 |
| Dirt Rally (2015) | 156.1 | 58.7 | 31.1 | 13 |
| The Witcher 3 (2015) | 30.1 | 18.3 | 10.2 | |
| Batman: Arkham Knight (2015) | 28 | 24 | 11 | |
| Star Wars Battlefront (2015) | 54 | 32.5 | 14.8 | 12.5 |
| Rainbow Six Siege (2015) | 69.3 | 39.8 | 21.1 | 14 |
| Just Cause 3 (2015) | 38.3 | 29.5 | 15.9 | |
| Rise of the Tomb Raider (2016) | 34.9 | 20.1 | 10.9 | |
| Doom (2016) | 37.6 | 29.2 | 15 | |
| Deus Ex Mankind Divided (2016) | 22.4 | 15.3 | 7.9 | |
| Battlefield 1 (2016) | 45.5 | 29.7 | 13.4 | 12 |
| Titanfall 2 (2016) | 61.6 | 50.2 | 27.9 | 22.8 |
| Call of Duty Infinite Warfare (2016) | 28.2 | 25.6 | ||
| Dishonored 2 (2016) | 23.6 | 19.7 |
Noise level
| Idle |
| 29 / 29 / 29 dB(A) |
| HDD |
| 30.1 dB(A) |
| Load |
| 37.4 / 39 dB(A) |
 | ||
30 dB silent 40 dB(A) audible 50 dB(A) loud |
||
min: | ||
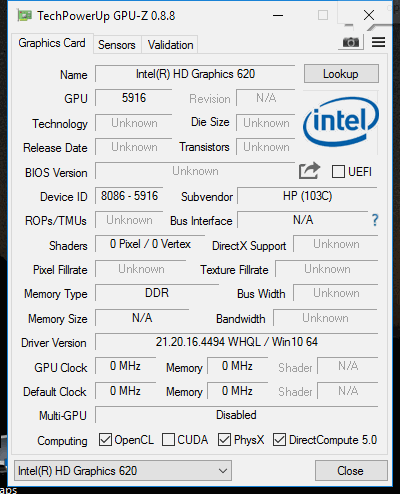
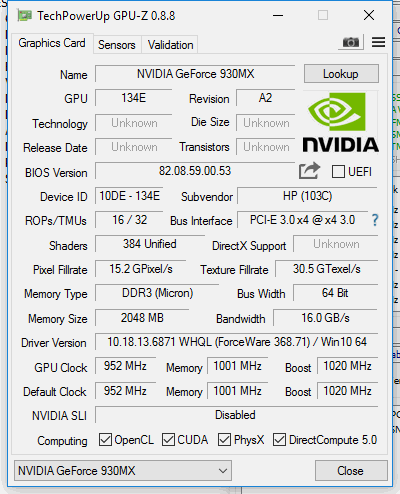
| HP ProBook 440 G4-Y8B51EA NVIDIA GeForce 930MX, Intel Core i7-7500U | Lenovo ThinkPad E470-20H2S00400 NVIDIA GeForce 940MX, Intel Core i5-7200U | Dell Latitude 14 E5470 Intel HD Graphics 520, Intel Core i5-6300U | Acer TravelMate X3 X349-M-7261 Intel HD Graphics 520, Intel Core i7-6500U | HP ProBook 450 G4 Y8B60EA NVIDIA GeForce 930MX, Intel Core i7-7500U | HP ProBook 430 G4-Y8B47EA Intel HD Graphics 620, Intel Core i7-7500U | |
|---|---|---|---|---|---|---|
| Noise | 1% | 3% | -1% | -9% | 3% | |
| off / environment * (dB) | 29 | 29 -0% | 29.2 -1% | 31.15 -7% | 31.6 -9% | 29.1 -0% |
| Idle Minimum * (dB) | 29 | 29 -0% | 29.2 -1% | 31.5 -9% | 32.6 -12% | 29.1 -0% |
| Idle Average * (dB) | 29 | 29 -0% | 29.2 -1% | 31.5 -9% | 32.6 -12% | 29.1 -0% |
| Idle Maximum * (dB) | 29 | 29 -0% | 29.2 -1% | 31.5 -9% | 33 -14% | 29.1 -0% |
| Load Average * (dB) | 37.4 | 35.6 5% | 32.1 14% | 31.7 15% | 38.9 -4% | 33.4 11% |
| Load Maximum * (dB) | 39 | 38.5 1% | 36.8 6% | 34.1 13% | 38.9 -0% | 36 8% |
* ... smaller is better
(±) The maximum temperature on the upper side is 41.5 °C / 107 F, compared to the average of 34.3 °C / 94 F, ranging from 21.2 to 62.5 °C for the class Office.
(+) The bottom heats up to a maximum of 38.1 °C / 101 F, compared to the average of 36.8 °C / 98 F
(+) In idle usage, the average temperature for the upper side is 26.5 °C / 80 F, compared to the device average of 29.5 °C / 85 F.
(+) The palmrests and touchpad are cooler than skin temperature with a maximum of 26 °C / 78.8 F and are therefore cool to the touch.
(±) The average temperature of the palmrest area of similar devices was 27.5 °C / 81.5 F (+1.5 °C / 2.7 F).
HP ProBook 440 G4-Y8B51EA audio analysis
(+) | speakers can play relatively loud (83.6 dB)
Bass 100 - 315 Hz
(-) | nearly no bass - on average 20% lower than median
(-) | bass is not linear (15.2% delta to prev. frequency)
Mids 400 - 2000 Hz
(+) | balanced mids - only 4.2% away from median
(±) | linearity of mids is average (7.4% delta to prev. frequency)
Highs 2 - 16 kHz
(+) | balanced highs - only 3.6% away from median
(+) | highs are linear (3% delta to prev. frequency)
Overall 100 - 16.000 Hz
(±) | linearity of overall sound is average (17% difference to median)
Compared to same class
» 24% of all tested devices in this class were better, 7% similar, 68% worse
» The best had a delta of 7%, average was 21%, worst was 53%
Compared to all devices tested
» 31% of all tested devices were better, 8% similar, 61% worse
» The best had a delta of 4%, average was 23%, worst was 134%
Lenovo ThinkPad E470-20H2S00400 audio analysis
(+) | speakers can play relatively loud (84.8 dB)
Bass 100 - 315 Hz
(-) | nearly no bass - on average 15.7% lower than median
(±) | linearity of bass is average (11.2% delta to prev. frequency)
Mids 400 - 2000 Hz
(±) | higher mids - on average 9% higher than median
(±) | linearity of mids is average (11.1% delta to prev. frequency)
Highs 2 - 16 kHz
(±) | higher highs - on average 5.1% higher than median
(±) | linearity of highs is average (10.5% delta to prev. frequency)
Overall 100 - 16.000 Hz
(±) | linearity of overall sound is average (23.8% difference to median)
Compared to same class
» 68% of all tested devices in this class were better, 8% similar, 23% worse
» The best had a delta of 7%, average was 21%, worst was 53%
Compared to all devices tested
» 71% of all tested devices were better, 6% similar, 22% worse
» The best had a delta of 4%, average was 23%, worst was 134%
| Off / Standby | |
| Idle | |
| Load |
|
Key:
min: | |
| HP ProBook 440 G4-Y8B51EA i7-7500U, GeForce 930MX, 1920x1080, 14" | Lenovo ThinkPad E470-20H2S00400 i5-7200U, GeForce 940MX, 1920x1080, 14" | Dell Latitude 14 E5470 6300U, HD Graphics 520, 1366x768, 14" | Acer TravelMate X3 X349-M-7261 6500U, HD Graphics 520, 1920x1080, 14" | |
|---|---|---|---|---|
| Power Consumption | -4% | 12% | -15% | |
| Idle Minimum * (Watt) | 3 | 2.7 10% | 3.5 -17% | 4.9 -63% |
| Idle Average * (Watt) | 5.4 | 5.5 -2% | 5.3 2% | 7.3 -35% |
| Idle Maximum * (Watt) | 6.3 | 6.5 -3% | 6 5% | 9.4 -49% |
| Load Average * (Watt) | 37.5 | 44.2 -18% | 26.3 30% | 26 31% |
| Load Maximum * (Watt) | 61.1 | 65.2 -7% | 36.6 40% | 36 41% |
* ... smaller is better
| HP ProBook 440 G4-Y8B51EA i7-7500U, GeForce 930MX, 48 Wh | Lenovo ThinkPad E470-20H2S00400 i5-7200U, GeForce 940MX, 45 Wh | Dell Latitude 14 E5470 6300U, HD Graphics 520, 62 Wh | Acer TravelMate X3 X349-M-7261 6500U, HD Graphics 520, 48.9 Wh | |
|---|---|---|---|---|
| Battery runtime | -14% | 28% | -25% | |
| Reader / Idle (h) | 18.1 | 17.4 -4% | 21.7 20% | 11.3 -38% |
| H.264 (h) | 9.5 | 8.4 -12% | 10.8 14% | 6.7 -29% |
| WiFi v1.3 (h) | 6.9 | 5.4 -22% | 11.1 61% | 6.5 -6% |
| Load (h) | 2.5 | 2.1 -16% | 2.9 16% | 1.8 -28% |
Pros
Cons
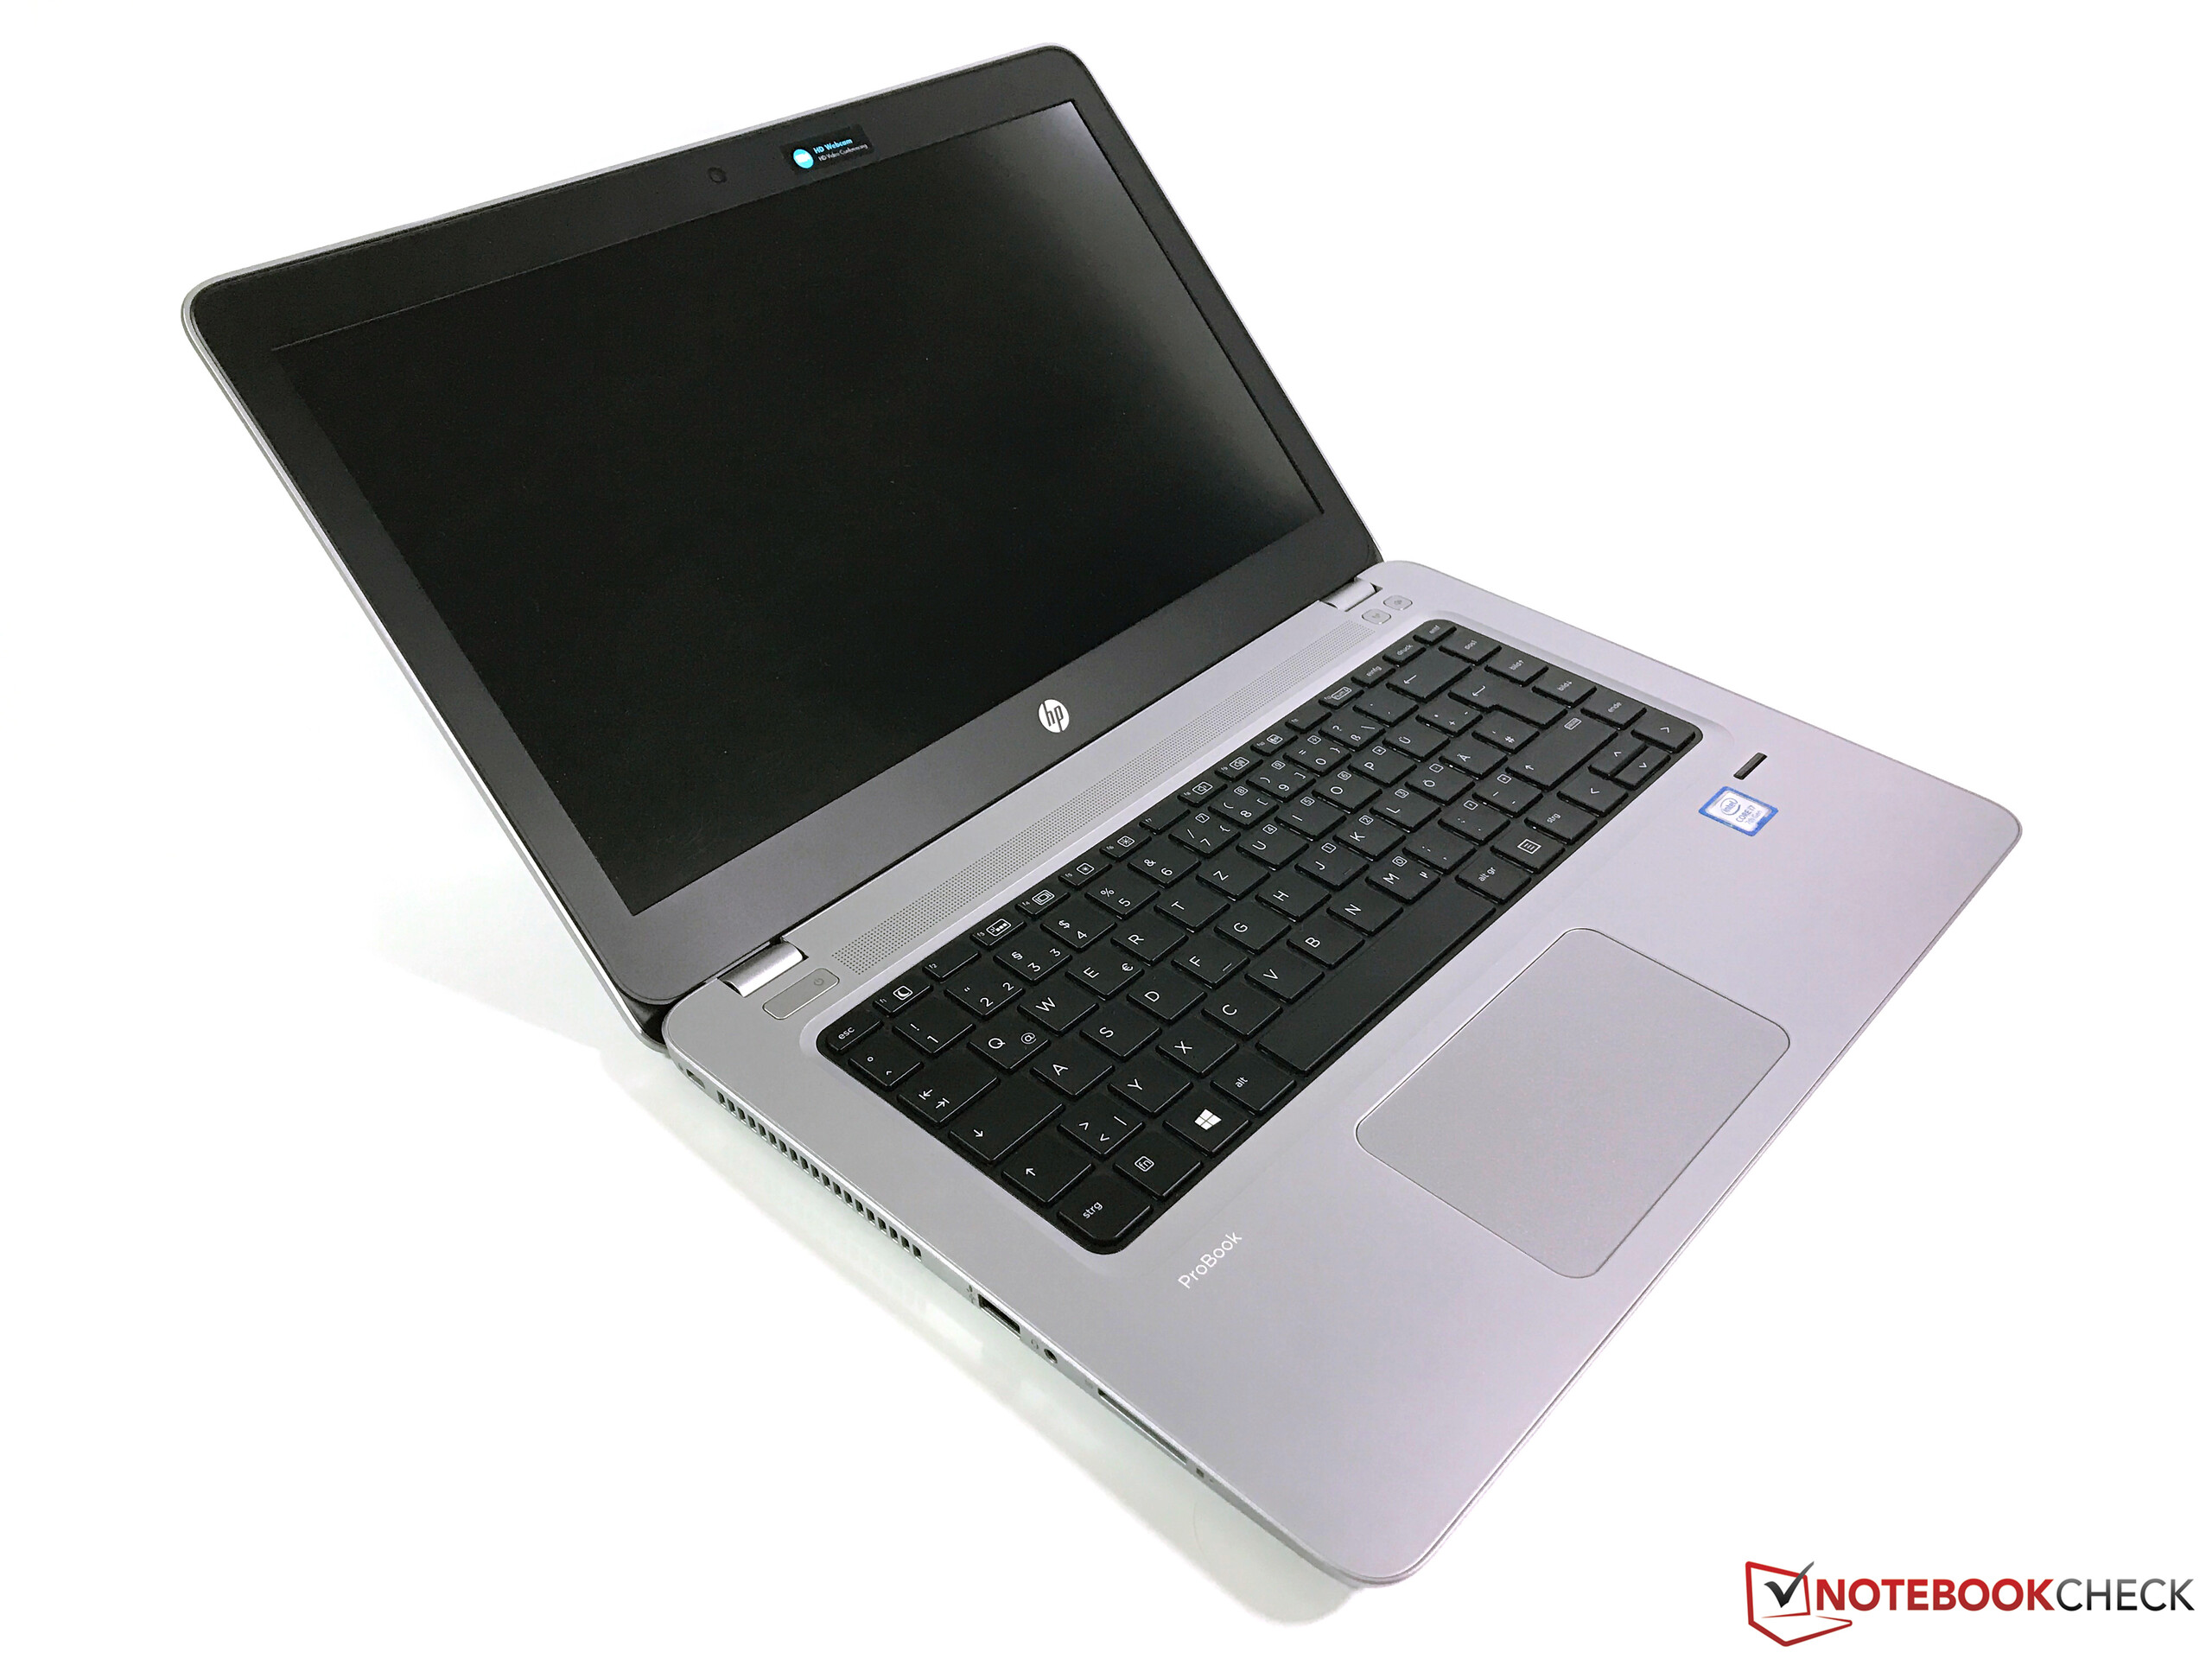
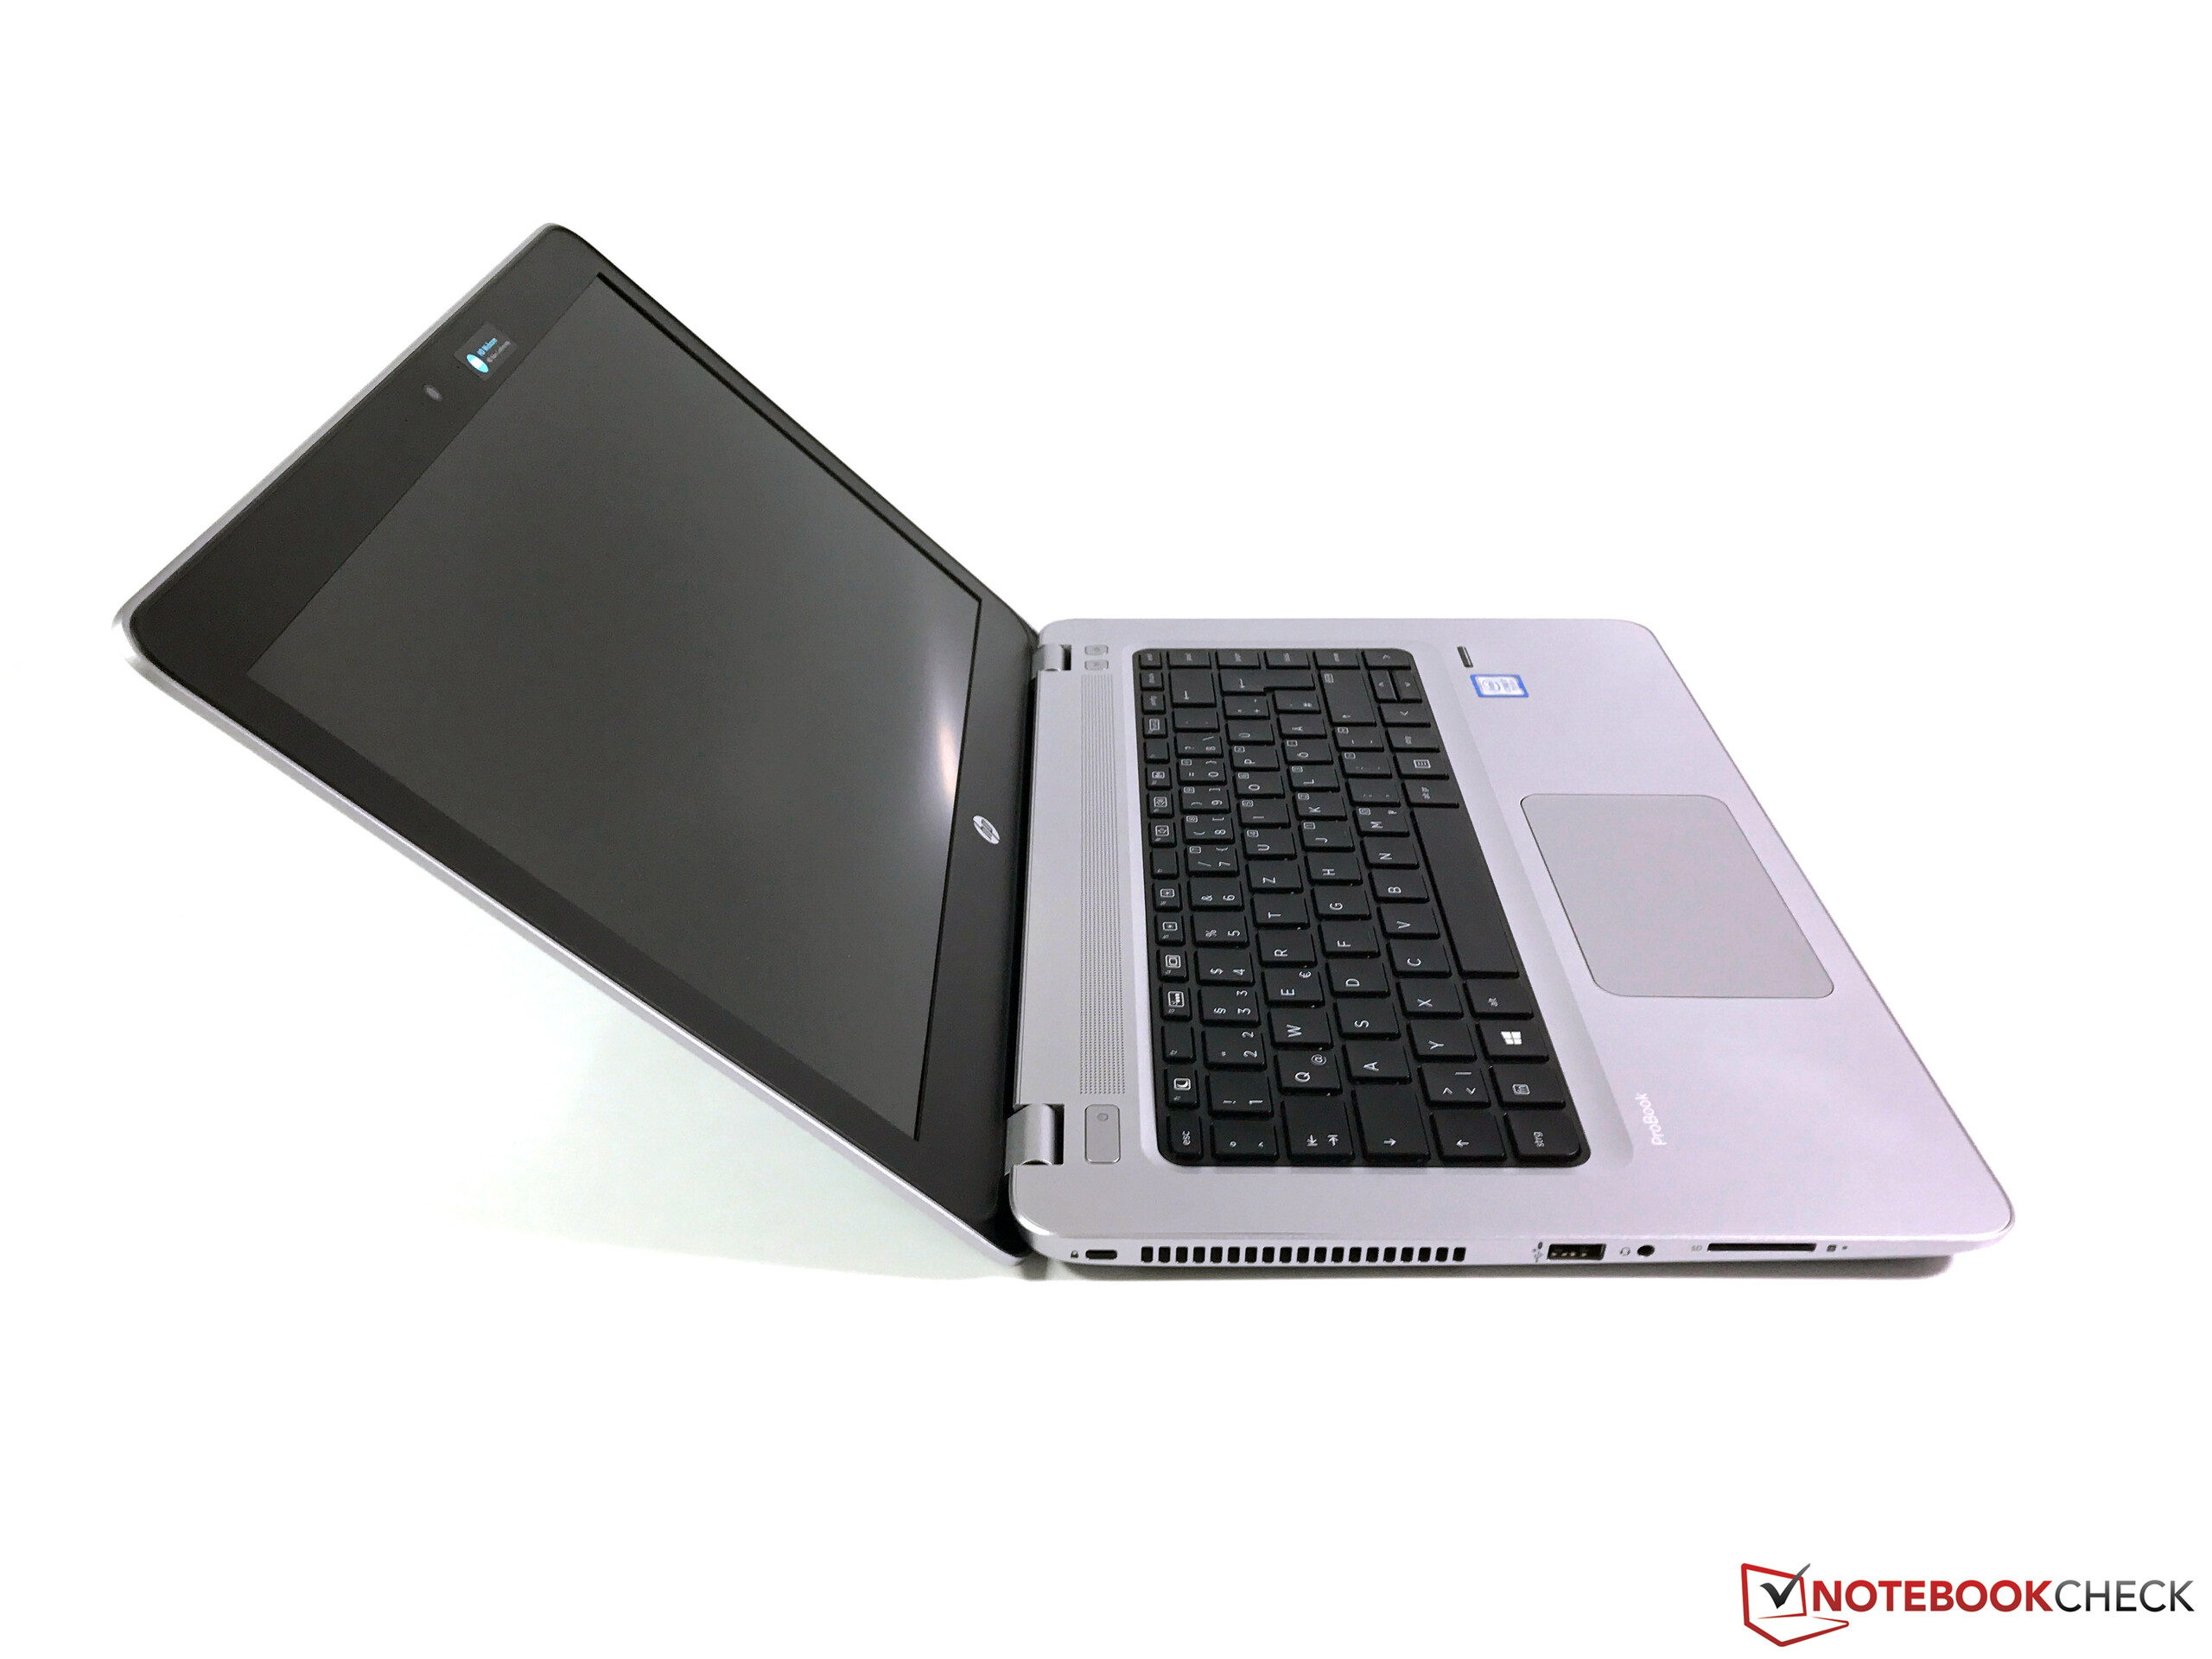
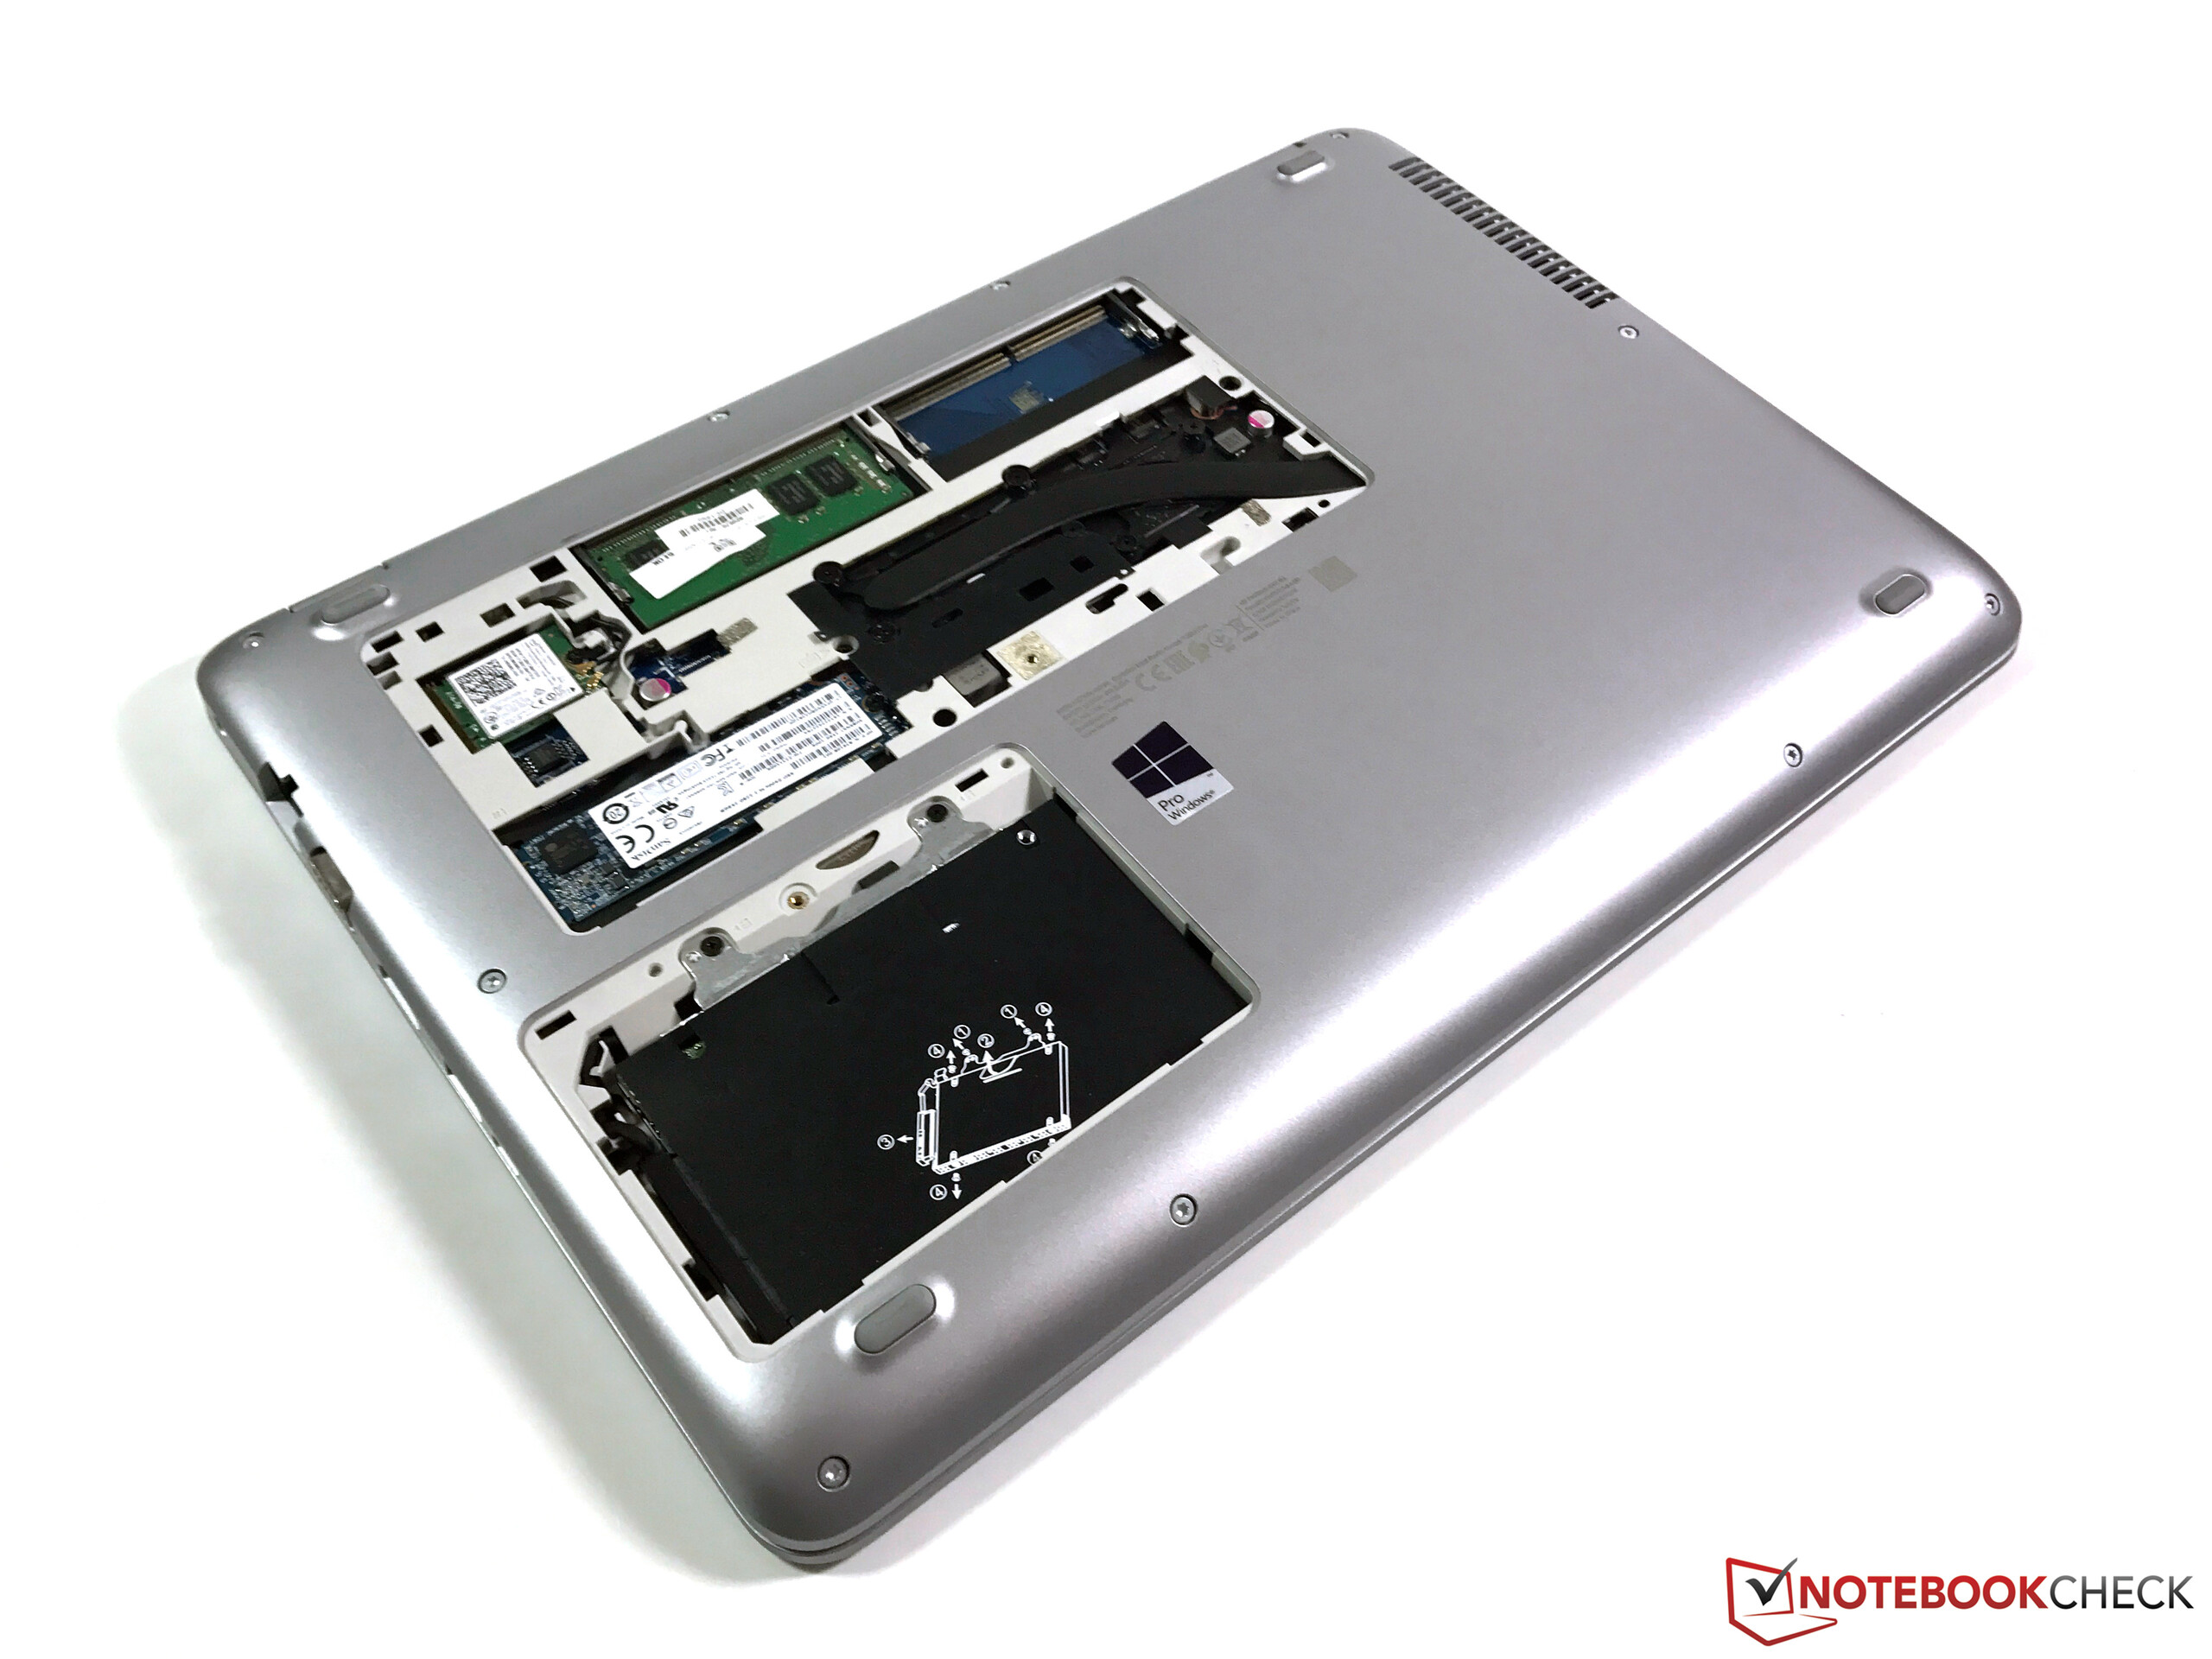
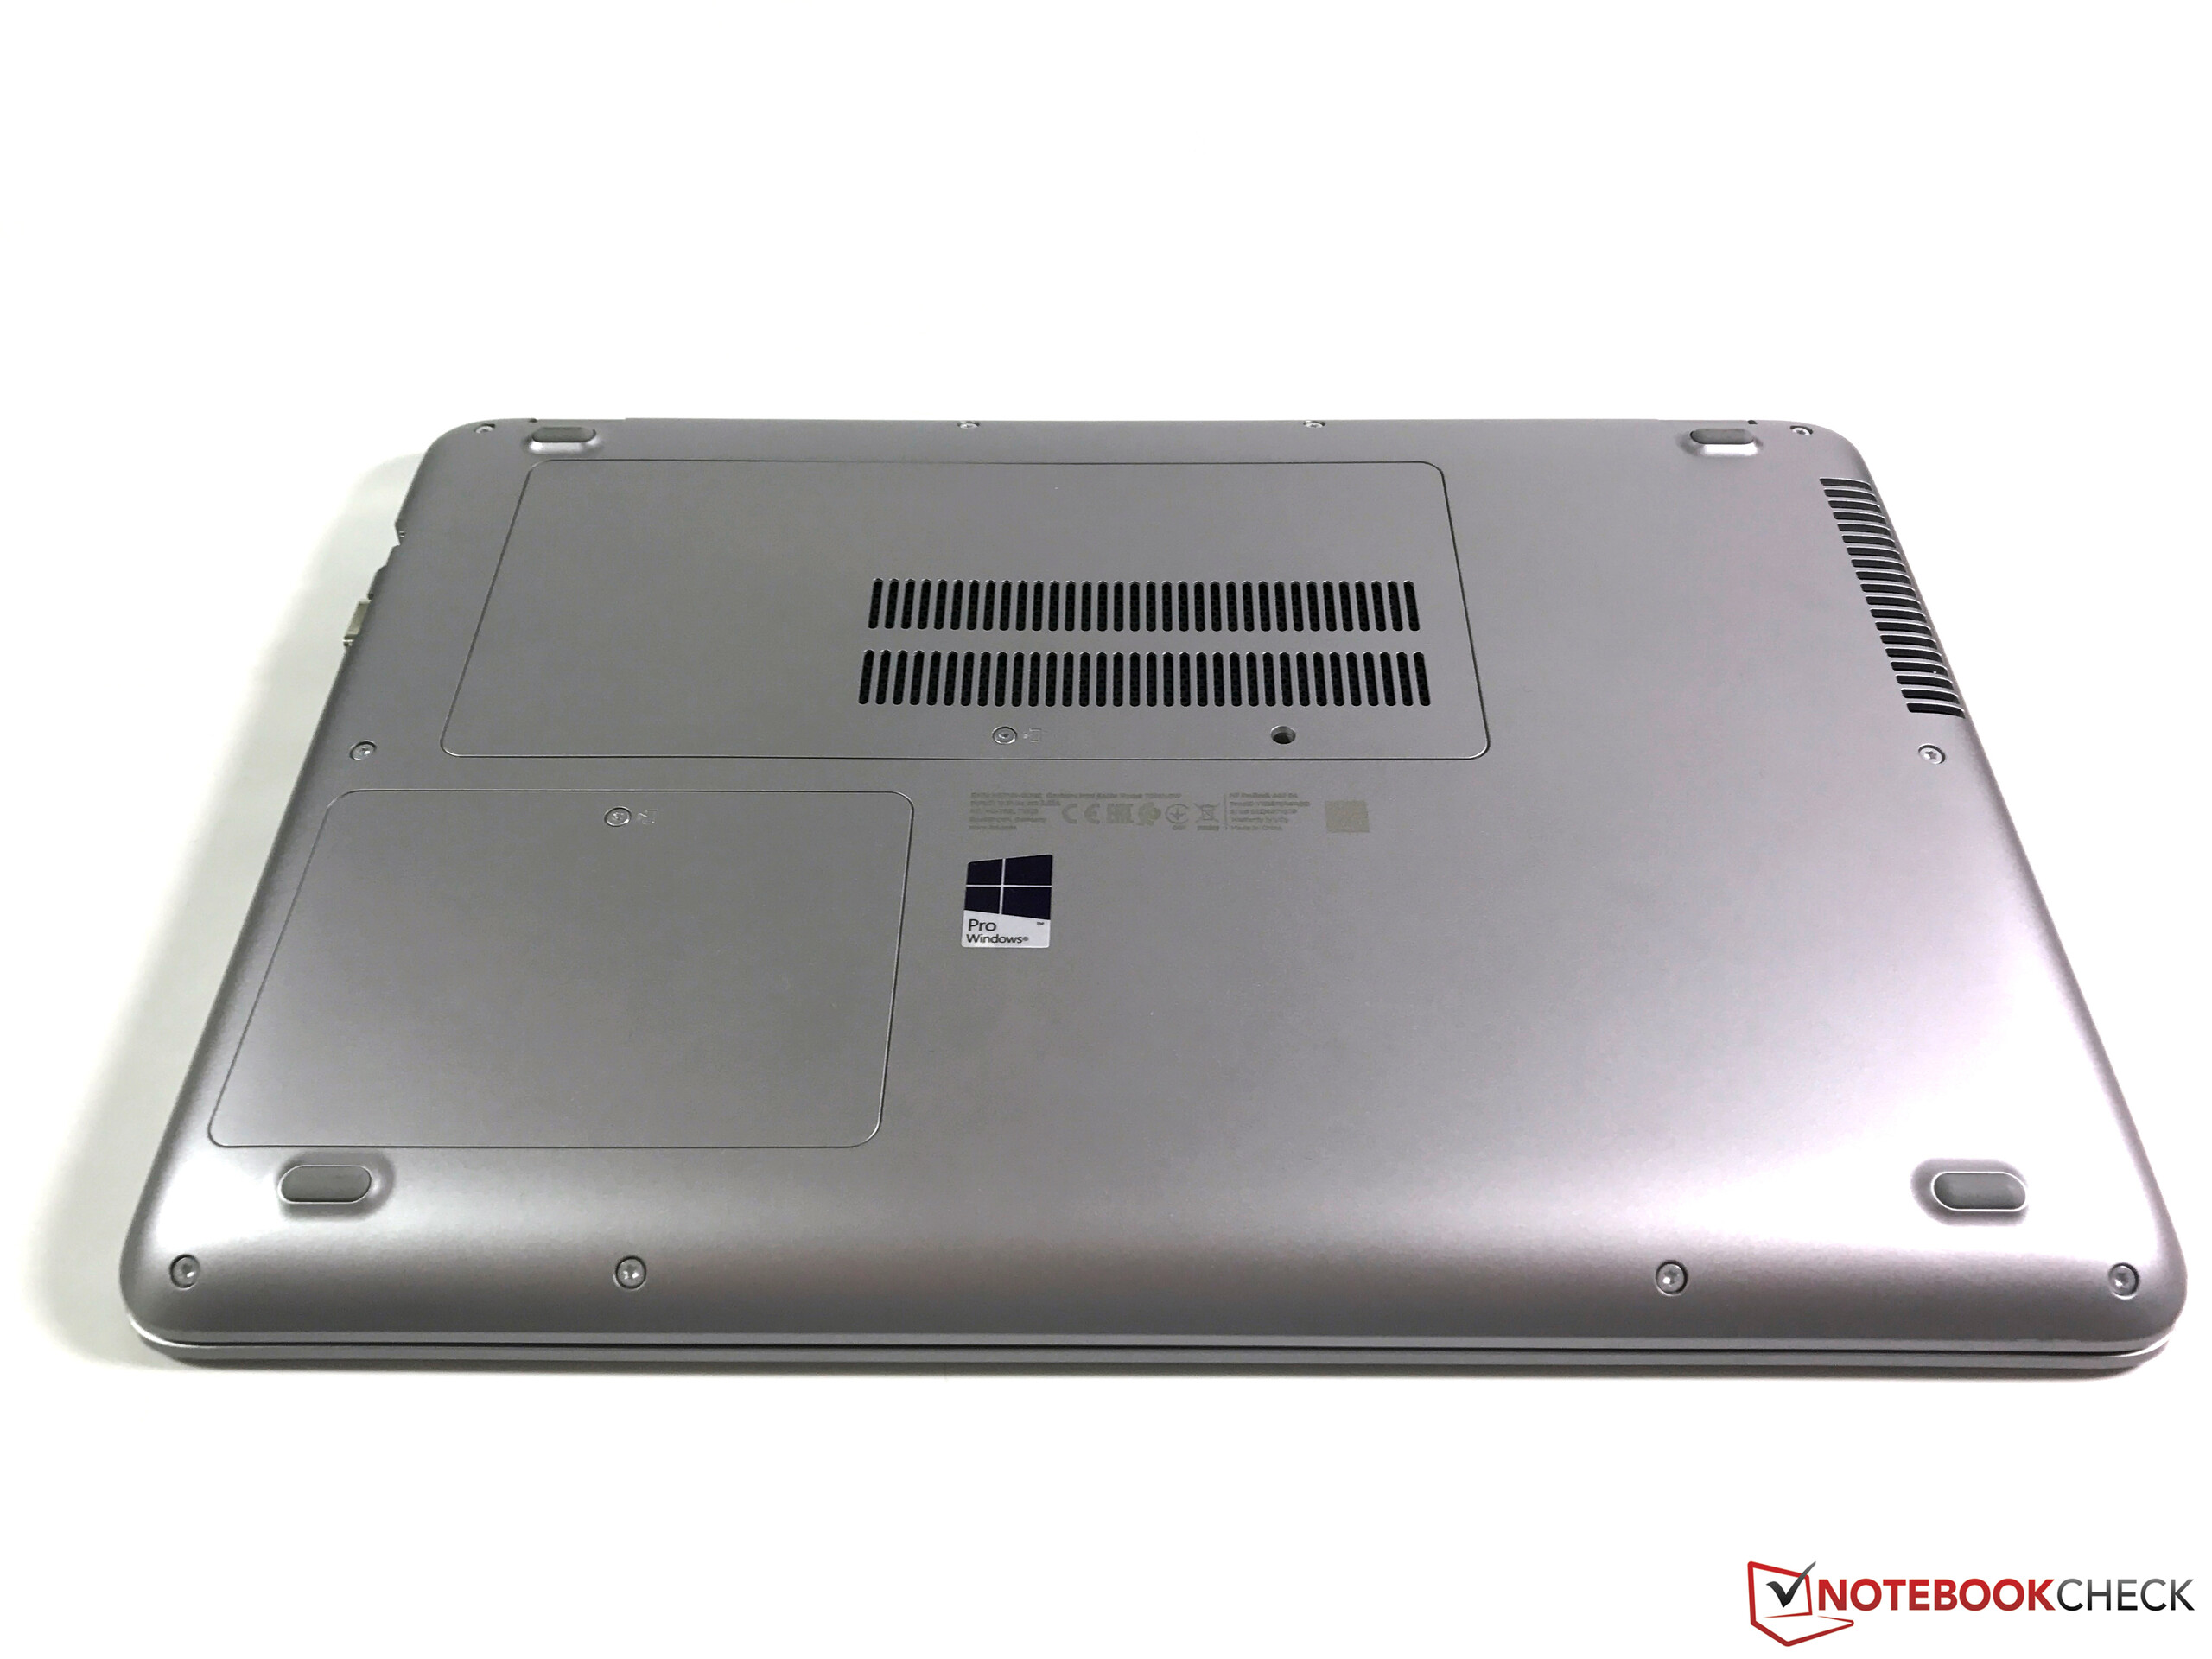
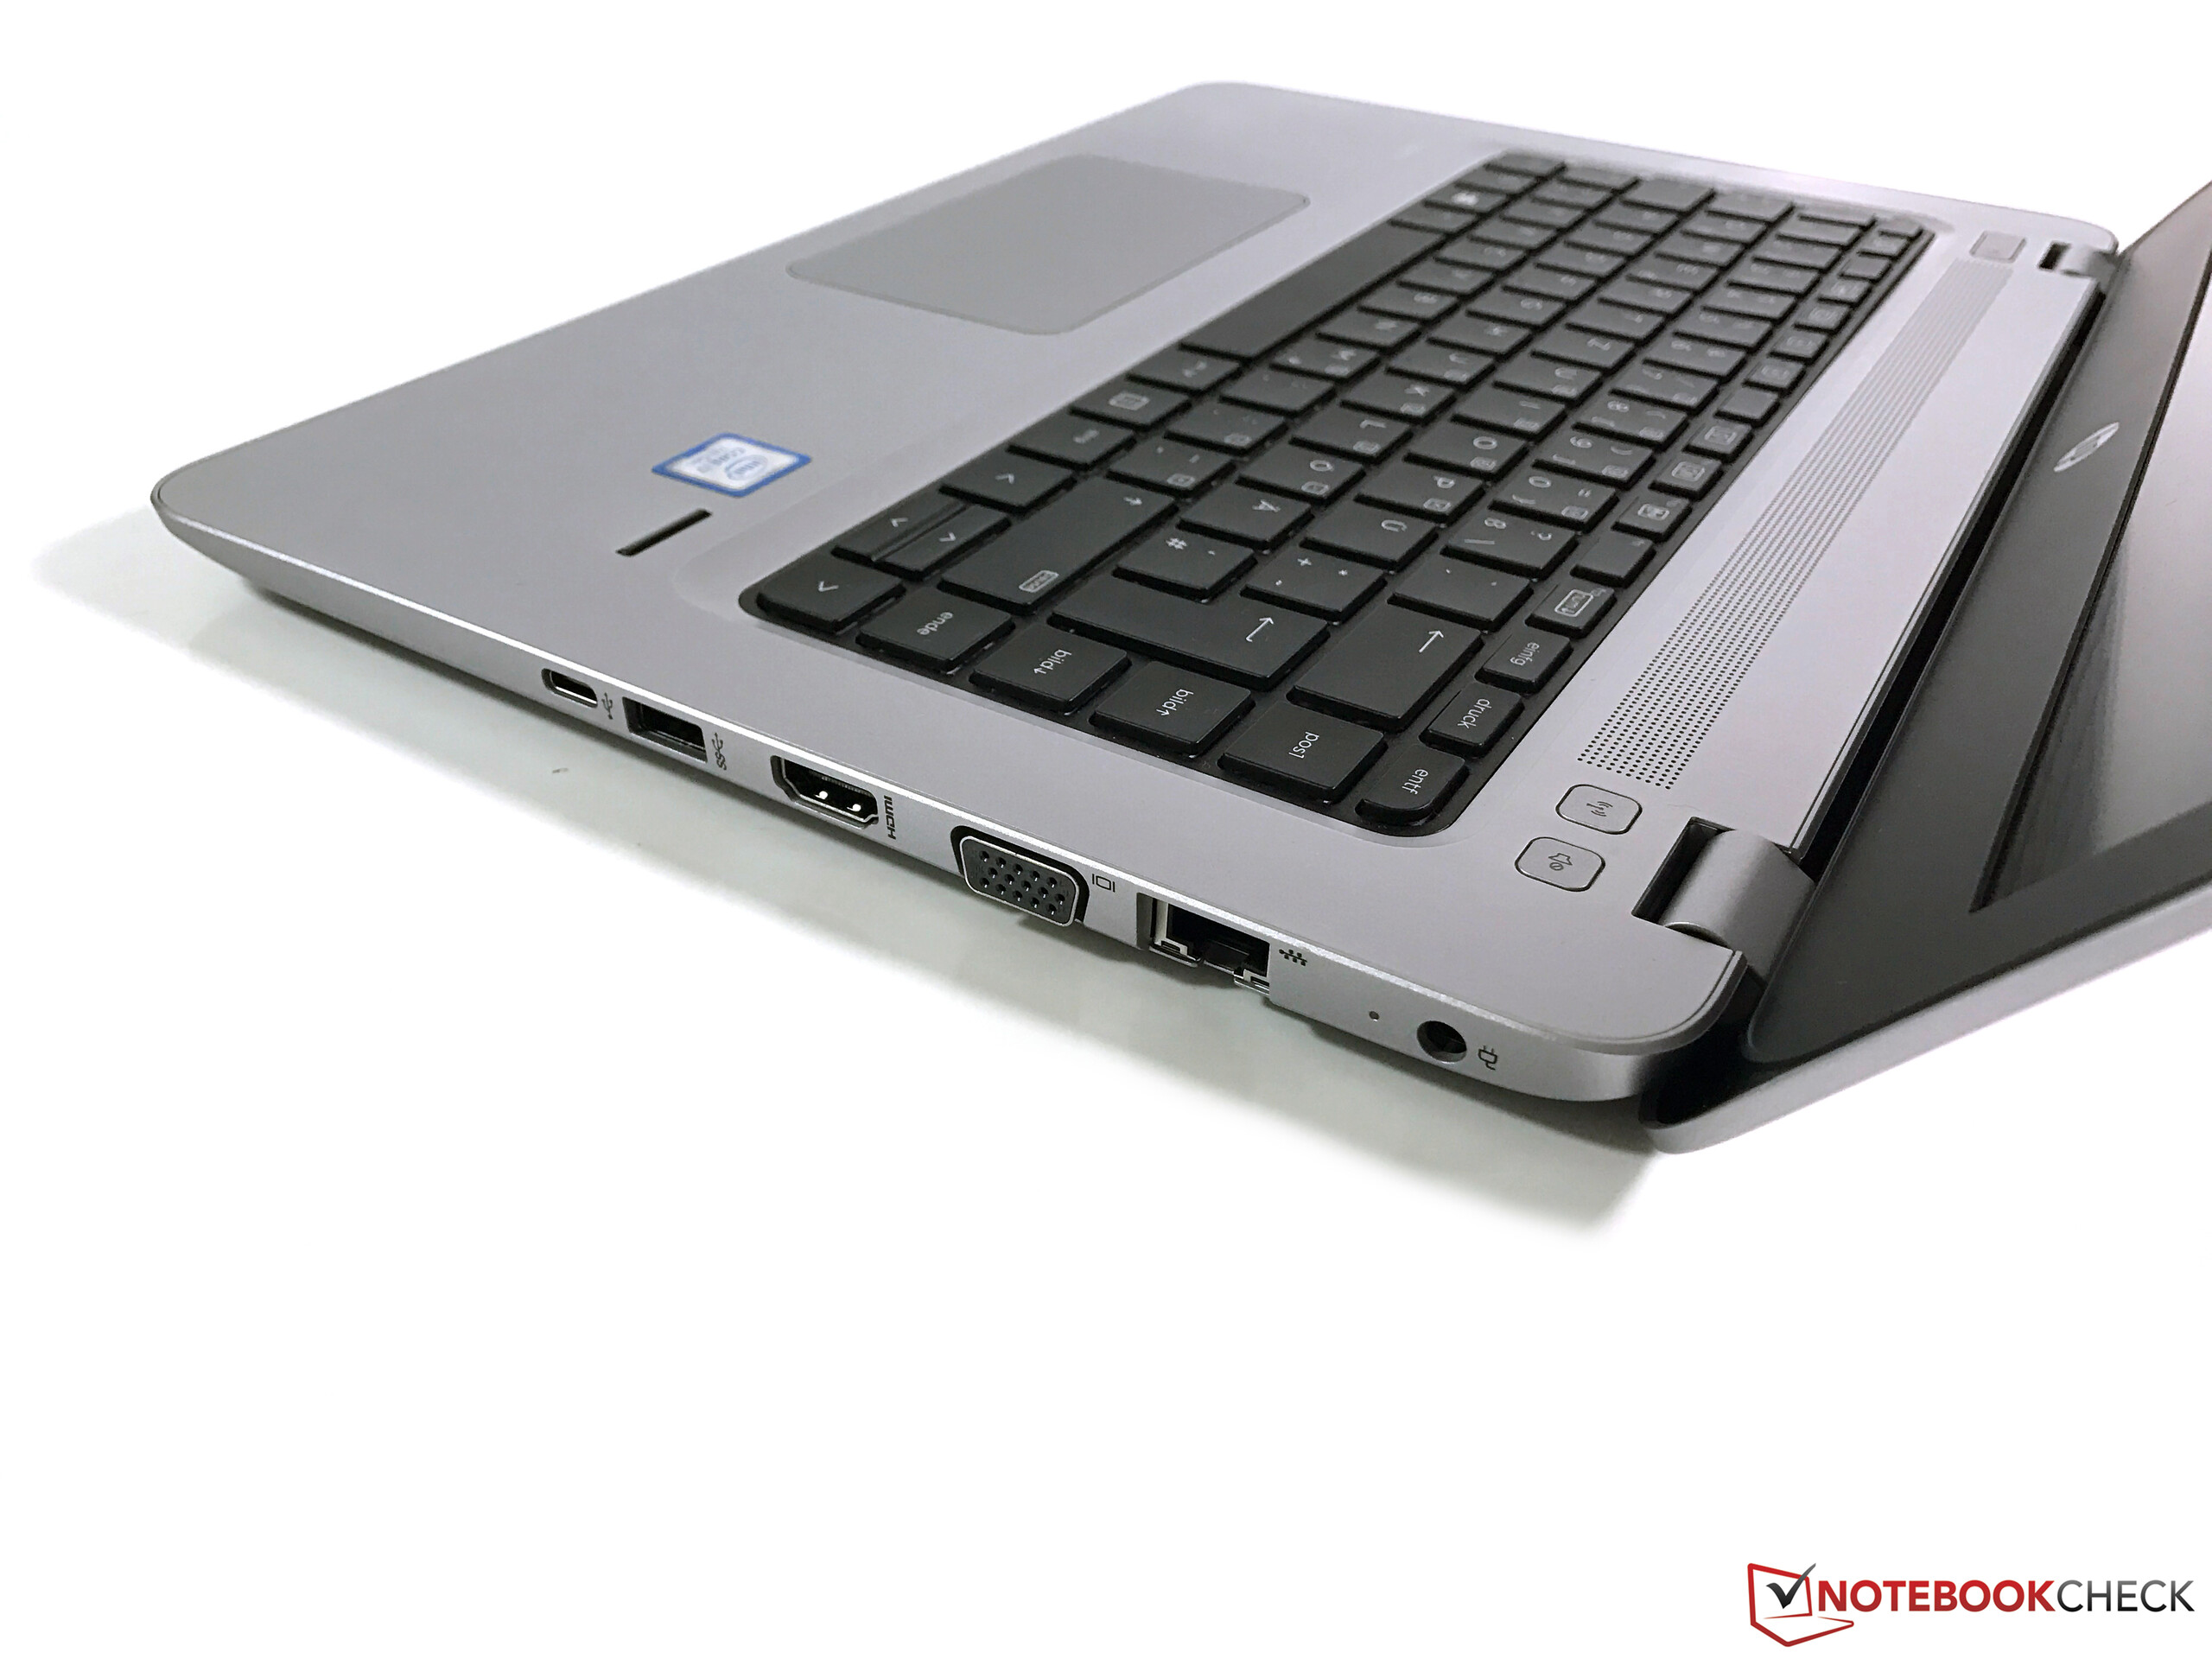
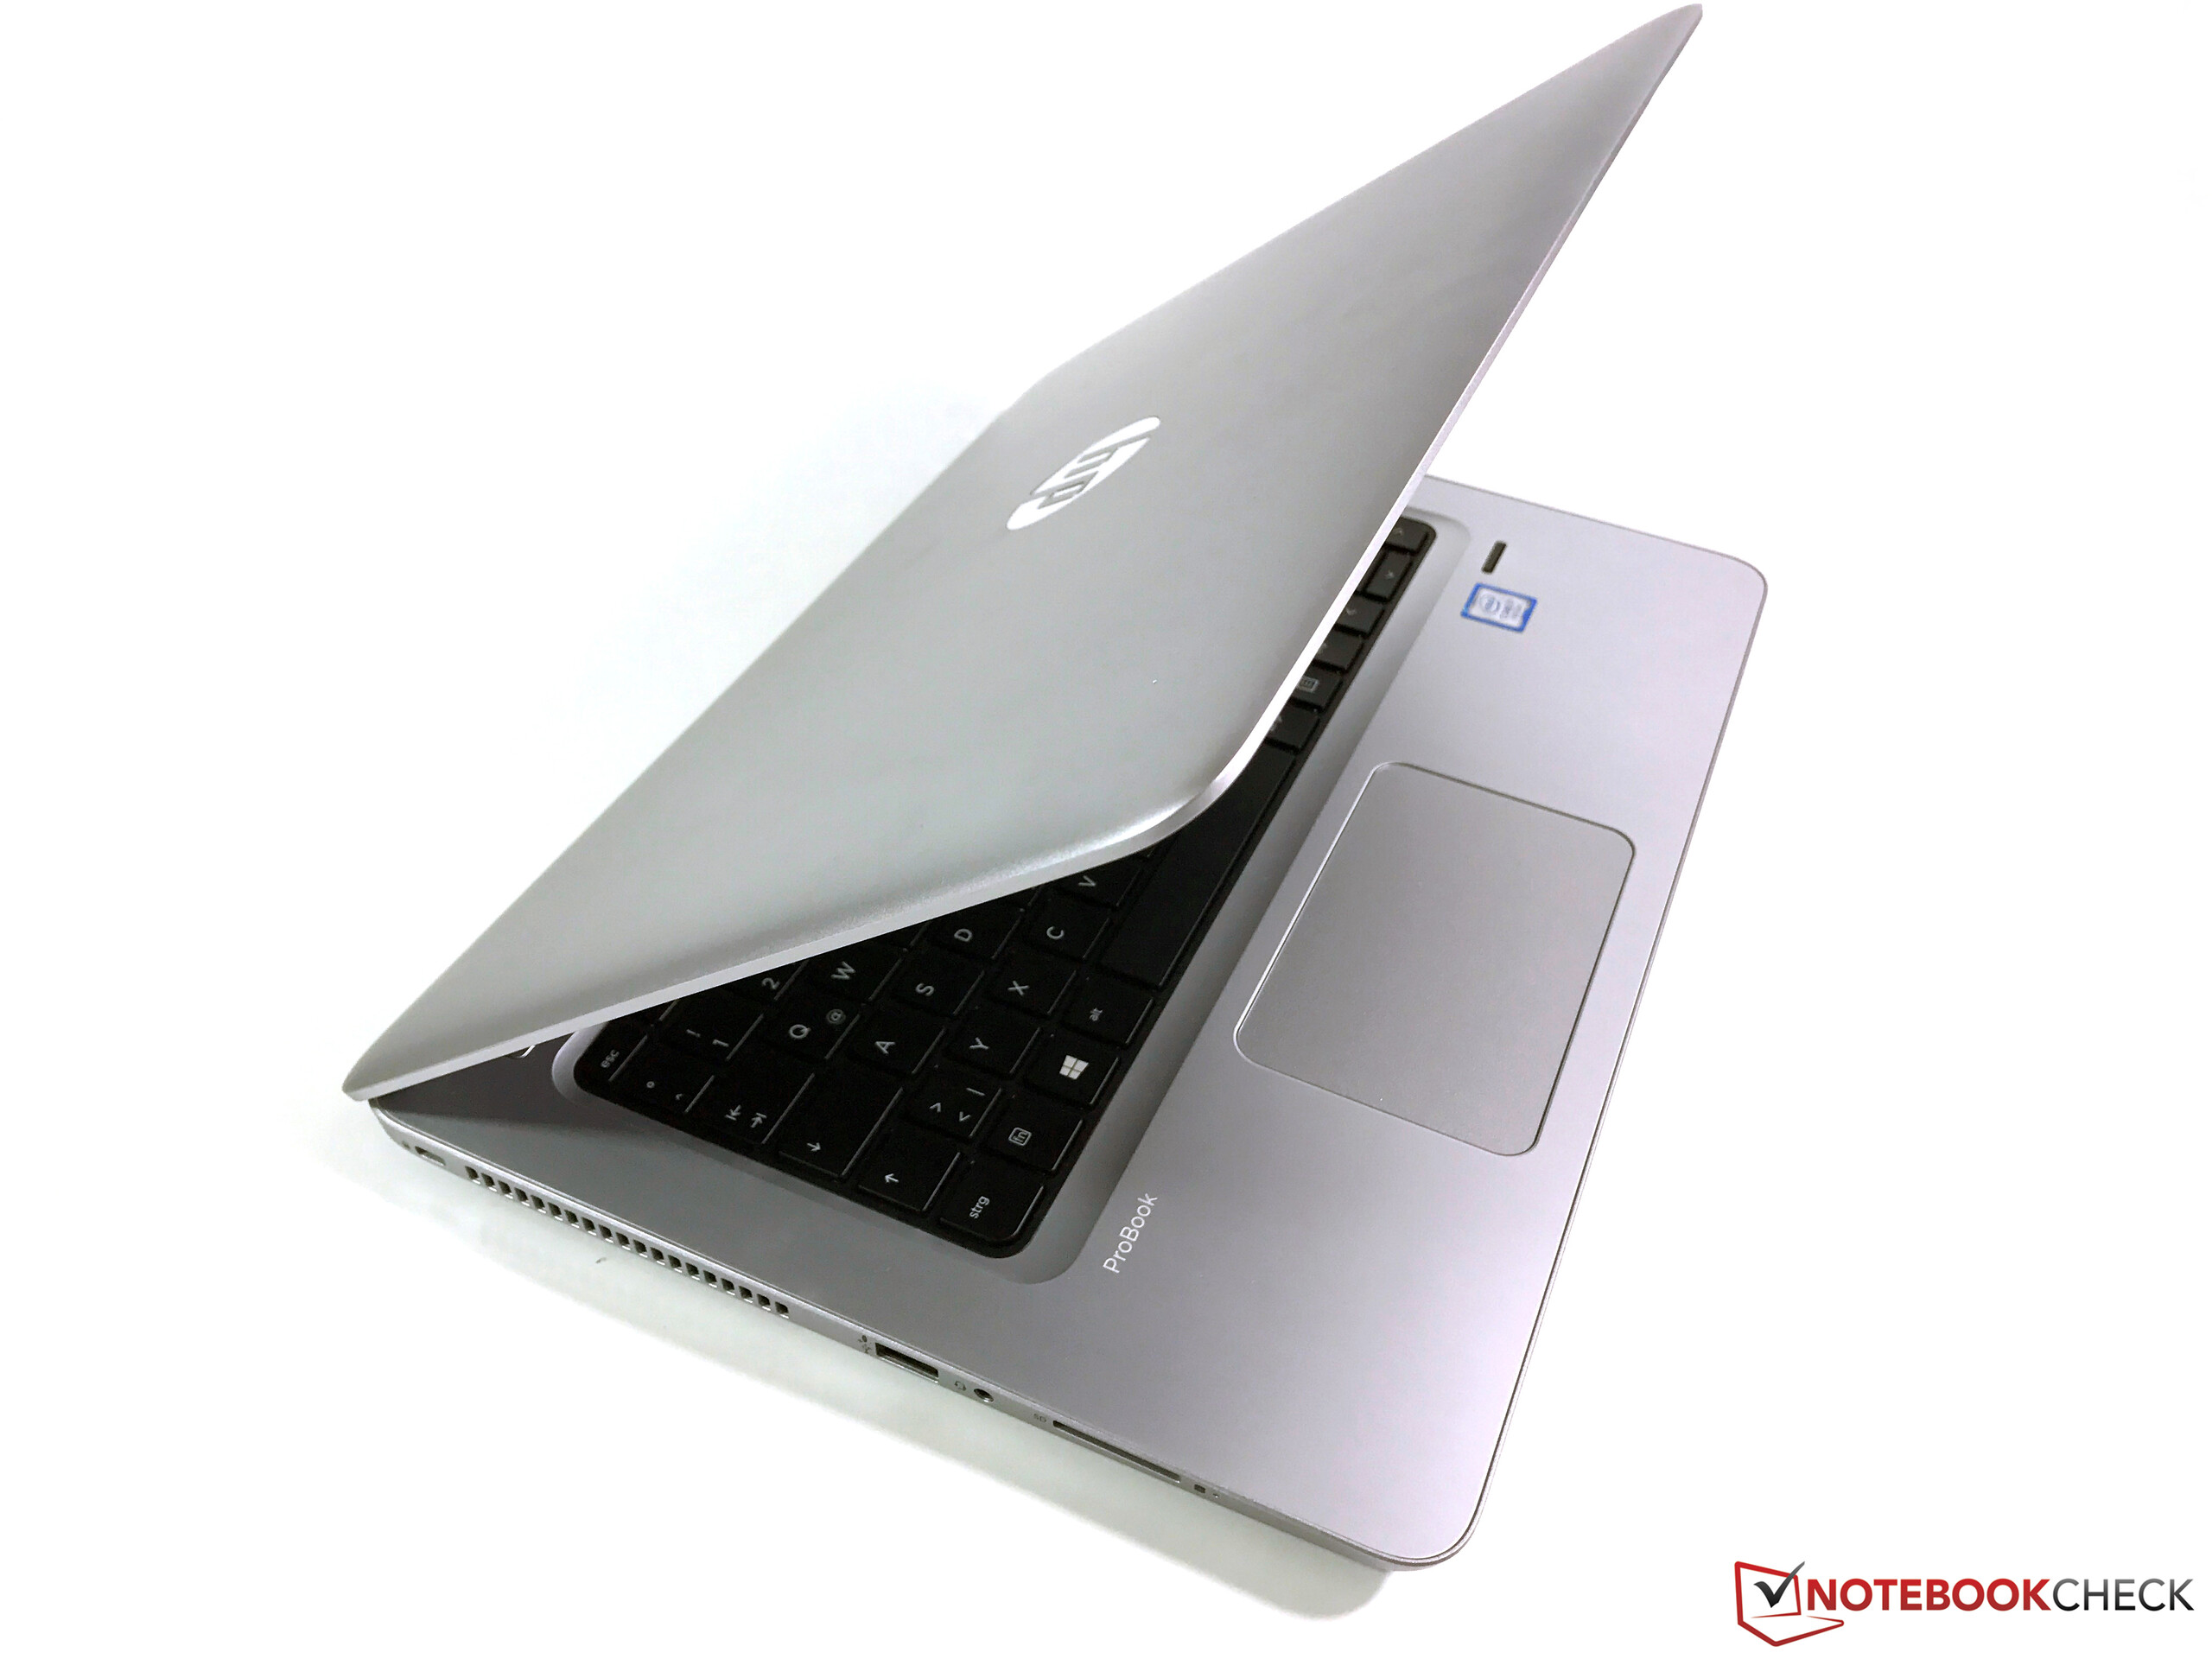
惠普ProBook 440 G4非常类似于它的兄弟姐妹,其中包括优缺点。它是一个入门级的商用设备,所以你必须忍受一些妥协。 这包括一些功能的缺失,如SmartCard读卡器或对接端口。在外壳质量和端口种类上,ProBook也落后于更昂贵的产品,例如惠普自家的EliteBooks。
然而,ProBook 440 G4的最大的问题是屏幕。我们的测试机已经配备了你所能获得的这个机型的“最好”屏幕,但我们仍然感到失望。我们不明白为什么惠普甚至不提供IPS面板作为选择。在过去,我们也评测了更好的TN面板。
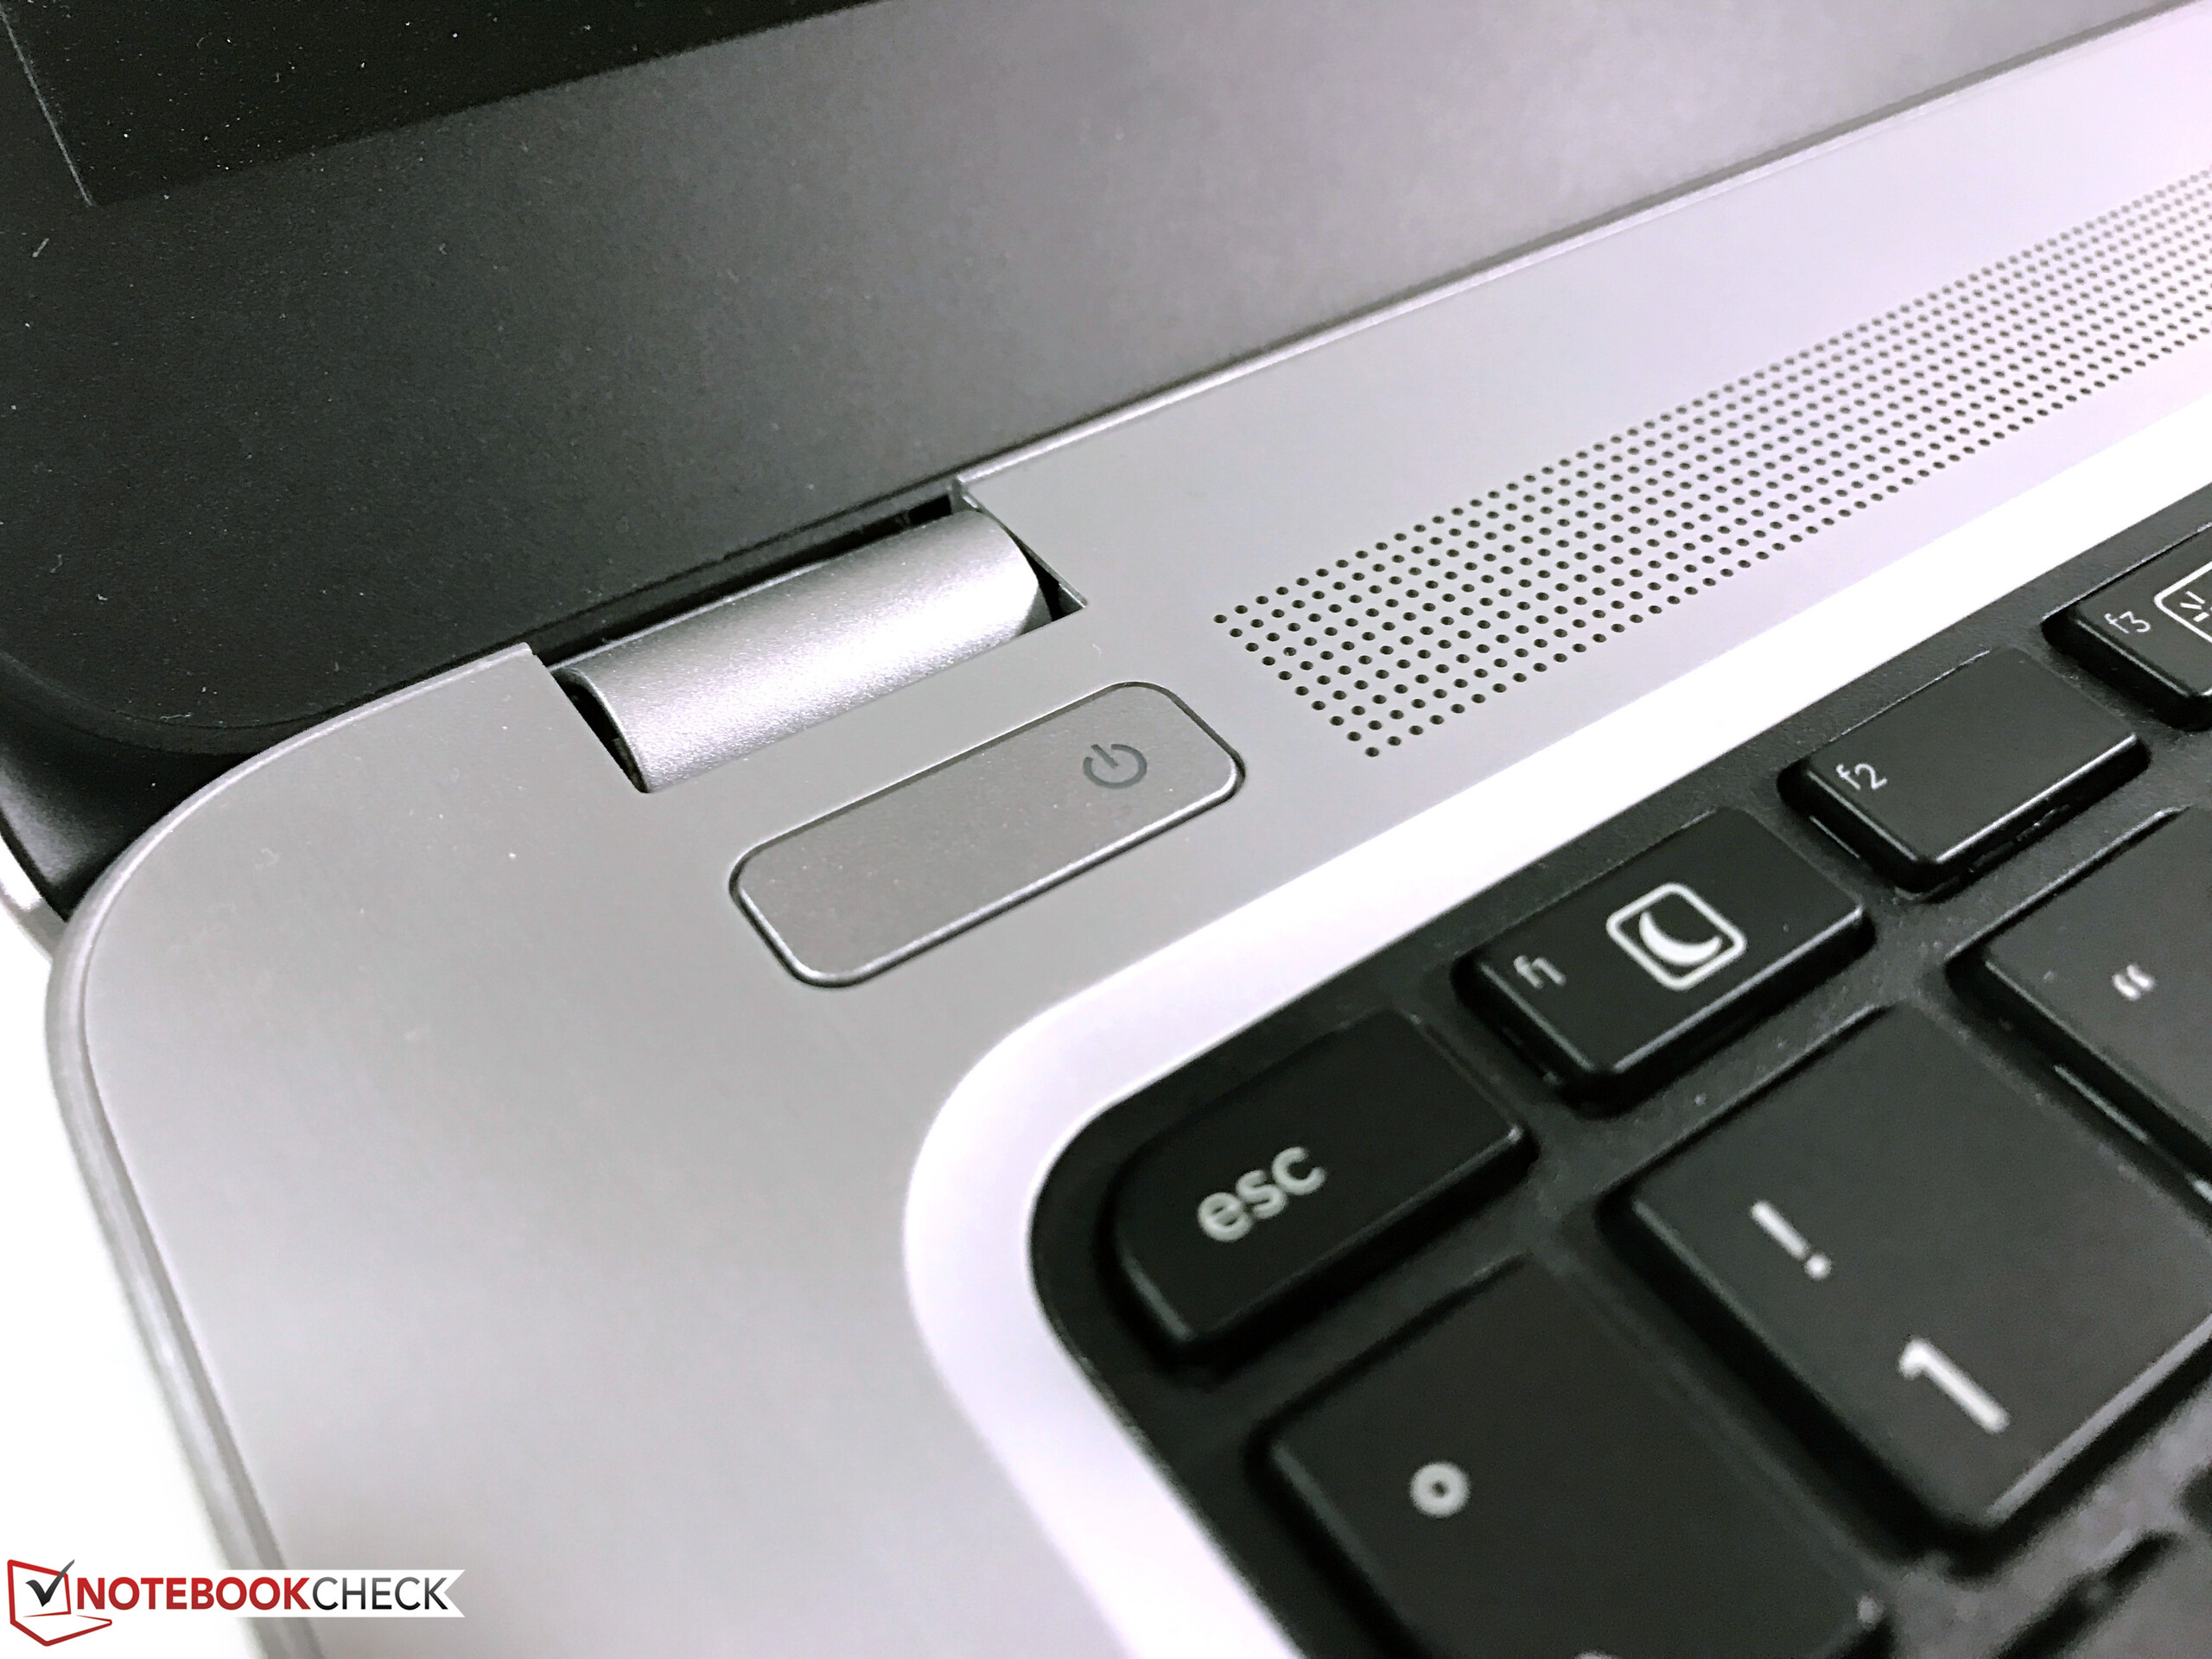
惠普 ProBook 440 G4速度快,提供良好机身和舒适键盘,但显示器难以匹配超过1000欧元(约1074美元)的价格。
更新后的ProBook 440 G4的性能并不令人失望,益于快速处理器和固态硬盘,系统可以处理许多应用程序。另一个问题是:是否可以从专用的图形处理器中获益。它显然比集成显卡更强大,但这是主要体现在你玩游戏时。如果你想节省一些钱,你一定可以选择一个有酷睿 i5和集成显卡的产品。由于令人失望的显示效果,我们仍然很难推荐的14英寸版本的ProBook给所有用户。
注:本文是基于完整评测的缩减版本,阅读完整的英文评测,请点击这里。
HP ProBook 440 G4-Y8B51EA
- 01/12/2017 v6 (old)
Andreas Osthoff
Price comparison
