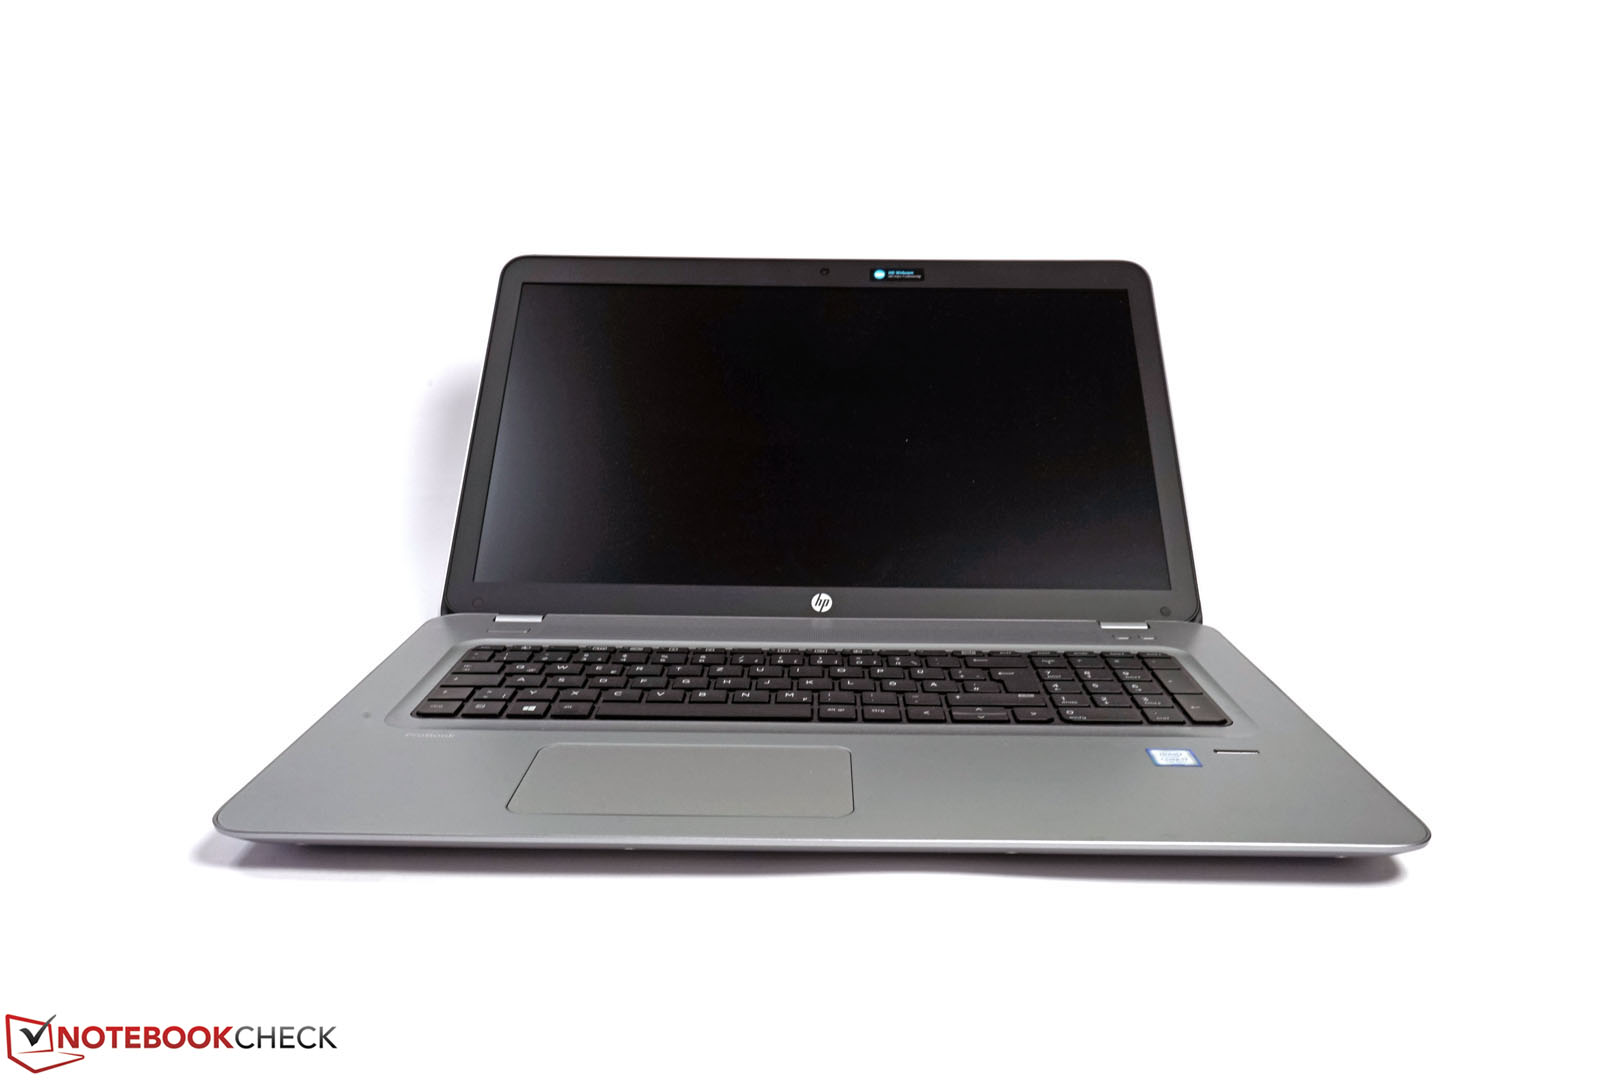
惠普 ProBook 470 G4 笔记本电脑简短评测
HP ProBook 470 G4 (ProBook 470 Series)
Processor
Intel Core i7-7500U 2c/4t 2 x 2.7 - 3.5 GHz, Kaby Lake
Graphics adapter
NVIDIA GeForce 930MX - 2048 MB VRAM, Core: 1019 MHz, RAM: 1000 MHz, Forceware 368.71, Nvidia Optimus Intel HD Graphics 620 + Nvidia Geforce 930MX
Memory
8 GB
, 1x 8 GB PC4-2400, 1 空余插槽
Display
17.30 inch 16:9, 1920 x 1080 pixel 141 PPI, AUO109D, LED IPS, glossy: no
Mainboard
Intel Kaby Lake-U Premium PCH
Storage
SanDisk Z400s SD8SNAT-256G, 256 GB
, 东芝 MQ01ABD100 (1000 GB, 5400 RPM, SATA-II)
Weight
2.77 kg, Power Supply: 350 g
Price
1070 Euro
Links
Note: The manufacturer may use components from different suppliers including display panels, drives or memory sticks with similar specifications.
| SD Card Reader | |
| average JPG Copy Test (av. of 3 runs) | |
| HP ProBook 470 G4 | |
| maximum AS SSD Seq Read Test (1GB) | |
| HP ProBook 470 G4 | |
| Networking | |
| Wi-Fi Client 1m | |
| Wi-Fi Server 1m |
| |||||||||||||||||||||||||
AUO109D tested with X-Rite i1Pro 2
Maximum: 361 cd/m² (Nits) Average: 322 cd/m² Minimum: 21.5 cd/m²Brightness Distribution: 84 %
Center on Battery: 361 cd/m²
Contrast: 1504:1 (Black: 0.24 cd/m²)
ΔE ColorChecker Calman: 3.4 | ∀{0.5-29.43 Ø4.71}
ΔE Greyscale Calman: 4 | ∀{0.09-98 Ø4.96}
93.7% sRGB (Calman 2D)
91.6% sRGB (Argyll 1.6.3 3D)
59.6% AdobeRGB 1998 (Argyll 1.6.3 3D)
65.7% AdobeRGB 1998 (Argyll 3D)
92% sRGB (Argyll 3D)
64.1% Display P3 (Argyll 3D)
Gamma: 2.17
CCT: 6879 K
| HP ProBook 470 G4 AUO109D, , 1920x1080, 17.3" | Acer Aspire E5-774-54HJ AU Optronics B173HTN01.1, , 1920x1080, 17.3" | Dell Inspiron 17 7778 LG Philips LGD 0513 / 173WF4, , 1920x1080, 17.3" | Lenovo ThinkPad P70 LEN4123, , 3840x2160, 17.3" | Dell Precision 7710 SDC8151, VHN17_173HL, , 1920x1080, 17.3" | |
|---|---|---|---|---|---|
| Display | 4% | -2% | 27% | 4% | |
| Display P3 Coverage (%) | 64.1 | 71.3 11% | 67.4 5% | 90.8 42% | 66.6 4% |
| sRGB Coverage (%) | 92 | 91.7 0% | 86.3 -6% | 100 9% | 96.9 5% |
| AdobeRGB 1998 Coverage (%) | 65.7 | 67.1 2% | 63.1 -4% | 85.4 30% | 68.6 4% |
| Response Times | 9% | 17% | -3% | -26% | |
| Response Time Grey 50% / Grey 80% * (ms) | 44 ? | 42 ? 5% | 36 ? 18% | 44 ? -0% | 50 ? -14% |
| Response Time Black / White * (ms) | 26 ? | 23 ? 12% | 22 ? 15% | 27.6 ? -6% | 36 ? -38% |
| PWM Frequency (Hz) | 1000 ? | 228 ? | 198 ? | ||
| Screen | -44% | -35% | -14% | -7% | |
| Brightness middle (cd/m²) | 361 | 353 -2% | 327 -9% | 365 1% | 332 -8% |
| Brightness (cd/m²) | 322 | 320 -1% | 314 -2% | 341 6% | 307 -5% |
| Brightness Distribution (%) | 84 | 82 -2% | 87 4% | 85 1% | 83 -1% |
| Black Level * (cd/m²) | 0.24 | 0.38 -58% | 0.3 -25% | 0.4 -67% | 0.33 -38% |
| Contrast (:1) | 1504 | 929 -38% | 1090 -28% | 913 -39% | 1006 -33% |
| Colorchecker dE 2000 * | 3.4 | 5.07 -49% | 6.75 -99% | 3.8 -12% | 3 12% |
| Colorchecker dE 2000 max. * | 6.6 | 10.12 -53% | 11.82 -79% | ||
| Greyscale dE 2000 * | 4 | 13.38 -235% | 7.91 -98% | 6.09 -52% | 4 -0% |
| Gamma | 2.17 101% | 2.69 82% | 2.31 95% | 2.3 96% | 2 110% |
| CCT | 6879 94% | 15991 41% | 7642 85% | 6332 103% | 7089 92% |
| Color Space (Percent of AdobeRGB 1998) (%) | 59.6 | 60.1 1% | 57 -4% | 76.01 28% | 62 4% |
| Color Space (Percent of sRGB) (%) | 91.6 | 91.6 0% | 86 -6% | 99.97 9% | 97 6% |
| Total Average (Program / Settings) | -10% /
-27% | -7% /
-21% | 3% /
-4% | -10% /
-7% |
* ... smaller is better
Display Response Times
ℹ
Display response times show how fast the screen is able to change from one color to the next. Slow response times can lead to afterimages and can cause moving objects to appear blurry (ghosting). Gamers of fast-paced 3D titles should pay special attention to fast response times.| ↔ Response Time Black to White | ||
|---|---|---|
| 26 ms ... rise ↗ and fall ↘ combined | ↗ 7 ms rise | 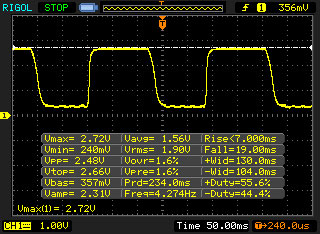 |
| ↘ 19 ms fall | ||
| The screen shows relatively slow response rates in our tests and may be too slow for gamers. In comparison, all tested devices range from 0.1 (minimum) to 240 (maximum) ms. » 63 % of all devices are better. This means that the measured response time is worse than the average of all tested devices (19.8 ms). | ||
| ↔ Response Time 50% Grey to 80% Grey | ||
| 44 ms ... rise ↗ and fall ↘ combined | ↗ 15 ms rise | 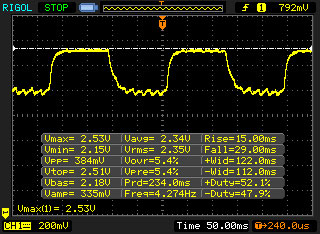 |
| ↘ 29 ms fall | ||
| The screen shows slow response rates in our tests and will be unsatisfactory for gamers. In comparison, all tested devices range from 0.165 (minimum) to 636 (maximum) ms. » 73 % of all devices are better. This means that the measured response time is worse than the average of all tested devices (30.9 ms). | ||
Screen Flickering / PWM (Pulse-Width Modulation)
ℹ
To dim the screen, some notebooks will simply cycle the backlight on and off in rapid succession - a method called Pulse Width Modulation (PWM) . This cycling frequency should ideally be undetectable to the human eye. If said frequency is too low, users with sensitive eyes may experience strain or headaches or even notice the flickering altogether.| Screen flickering / PWM not detected | 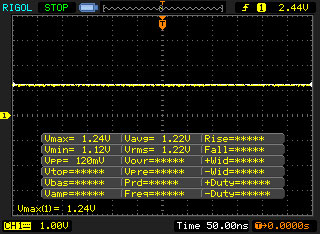 | ||
In comparison: 52 % of all tested devices do not use PWM to dim the display. If PWM was detected, an average of 7748 (minimum: 5 - maximum: 343500) Hz was measured. | |||
| PCMark 8 | |
| Home Score Accelerated v2 | |
| Dell Inspiron 17 7778 | |
| HP ProBook 470 G4 | |
| HP ProBook 470 G3 | |
| Lenovo ThinkPad P70 | |
| Acer Aspire E5-774-54HJ | |
| Work Score Accelerated v2 | |
| HP ProBook 470 G4 | |
| Dell Inspiron 17 7778 | |
| Lenovo ThinkPad P70 | |
| HP ProBook 470 G3 | |
| PCMark 8 Home Score Accelerated v2 | 3626 points | |
| PCMark 8 Creative Score Accelerated v2 | 4576 points | |
| PCMark 8 Work Score Accelerated v2 | 4823 points | |
Help | ||
| HP ProBook 470 G4 SanDisk Z400s SD8SNAT-256G | Acer Aspire E5-774-54HJ Western Digital Scorpio Blue WD5000LPCX-24C6HT0 | Dell Inspiron 17 7778 Liteonit CV3-CE512 | Lenovo ThinkPad P70 Samsung SSD PM871 MZNLN512HCJH | HP ProBook 470 G3 WDC Scorpio Blue WD10JPVX-75JC3T0 | MSI CX72-7QLi581 WDC Scorpio Blue WD10JPVX-22JC3T0 | |
|---|---|---|---|---|---|---|
| CrystalDiskMark 3.0 | -93% | 42% | 60% | -89% | -91% | |
| Read Seq (MB/s) | 472 | 88.9 -81% | 486.4 3% | 509 8% | 111.4 -76% | 102.8 -78% |
| Write Seq (MB/s) | 323 | 70.9 -78% | 438.4 36% | 457.8 42% | 107.7 -67% | 100.2 -69% |
| Read 4k (MB/s) | 16.9 | 0.381 -98% | 32.3 91% | 29.88 77% | 0.434 -97% | 0.422 -98% |
| Write 4k (MB/s) | 81.4 | 1.117 -99% | 65.8 -19% | 104.1 28% | 1.281 -98% | 1.063 -99% |
| Read 4k QD32 (MB/s) | 148 | 0.891 -99% | 334.4 126% | 391.8 165% | 1.126 -99% | 0.918 -99% |
| Write 4k QD32 (MB/s) | 254 | 1.13 -100% | 289.5 14% | 350.4 38% | 1.313 -99% | 1.064 -100% |

SanDisk Z400s SD8SNAT-256G
Sequential Read:
472 MB/s
Sequential Write:
323 MB/s
4K Read:
16.9 MB/s
4K Write:
81.4 MB/s
4K QD32 Read:
148 MB/s
4K QD32 Write:
254 MB/s
| 3DMark 11 - 1280x720 Performance GPU | |
| Lenovo ThinkPad P70 | |
| Dell Inspiron 17 7778 | |
| MSI CX72-7QLi581 | |
| HP ProBook 470 G4 | |
| HP ProBook 470 G3 | |
| Lenovo Yoga 710-14IKB 80V4002HGE | |
| Acer Aspire E5-774-54HJ | |
| 3DMark | |
| 1280x720 Cloud Gate Standard Graphics | |
| Lenovo ThinkPad P70 | |
| Dell Inspiron 17 7778 | |
| HP ProBook 470 G4 | |
| Lenovo Yoga 710-14IKB 80V4002HGE | |
| HP ProBook 470 G3 | |
| 1920x1080 Fire Strike Graphics | |
| Lenovo ThinkPad P70 | |
| Dell Inspiron 17 7778 | |
| HP ProBook 470 G4 | |
| HP ProBook 470 G3 | |
| Lenovo Yoga 710-14IKB 80V4002HGE | |
| 3DMark 11 Performance | 2336 points | |
| 3DMark Ice Storm Standard Score | 51249 points | |
| 3DMark Cloud Gate Standard Score | 7050 points | |
| 3DMark Fire Strike Score | 1407 points | |
Help | ||
| low | med. | high | ultra | |
|---|---|---|---|---|
| Metro: Last Light (2013) | 50 | 39 | 22 | 11 |
| Dirt Rally (2015) | 161 | 58 | 31 | 13 |
| The Witcher 3 (2015) | 27 | 20 | 8 |
Noise level
| Idle |
| 29.7 / 31.7 / 31.7 dB(A) |
| HDD |
| 31.7 dB(A) |
| Load |
| 37.8 / 45.9 dB(A) |
 | ||
30 dB silent 40 dB(A) audible 50 dB(A) loud |
||
min: | ||
(+) The average temperature for the upper side under maximal load is 30.5 °C / 87 F, compared to the average of 29.5 °C / 85 F for the devices in the class Office.
(±) The maximum temperature on the upper side is 40 °C / 104 F, compared to the average of 34.3 °C / 94 F, ranging from 21.2 to 62.5 °C for the class Office.
(-) The bottom heats up to a maximum of 46 °C / 115 F, compared to the average of 36.8 °C / 98 F
(+) In idle usage, the average temperature for the upper side is 27 °C / 81 F, compared to the device average of 29.5 °C / 85 F.
(+) The palmrests and touchpad are cooler than skin temperature with a maximum of 27.4 °C / 81.3 F and are therefore cool to the touch.
(±) The average temperature of the palmrest area of similar devices was 27.6 °C / 81.7 F (+0.2 °C / 0.4 F).
Power Consumption
| Off / Standby | |
| Idle | |
| Load |
|
Key:
min: | |
| HP ProBook 470 G4 i7-7500U, GeForce 930MX, SanDisk Z400s SD8SNAT-256G, LED IPS, 1920x1080, 17.3" | HP ProBook 470 G3 6500U, Radeon R7 M340, WDC Scorpio Blue WD10JPVX-75JC3T0, UWVA TN LED, 1920x1080, 17.3" | Dell Inspiron 17 7778 6500U, GeForce 940MX, Liteonit CV3-CE512, IPS, 1920x1080, 17.3" | Acer Aspire E5-774-54HJ i5-7200U, HD Graphics 620, Western Digital Scorpio Blue WD5000LPCX-24C6HT0, TN LED, 1920x1080, 17.3" | |
|---|---|---|---|---|
| Power Consumption | -18% | -12% | 4% | |
| Idle Minimum * (Watt) | 4.3 | 5.7 -33% | 5.6 -30% | 5.3 -23% |
| Idle Average * (Watt) | 8.8 | 11.3 -28% | 11.2 -27% | 10.1 -15% |
| Idle Maximum * (Watt) | 9.4 | 12.2 -30% | 11.9 -27% | 10.5 -12% |
| Load Average * (Watt) | 51.2 | 44.8 13% | 46 10% | 34.3 33% |
| Load Maximum * (Watt) | 60.5 | 66.3 -10% | 53 12% | 37 39% |
* ... smaller is better
| HP ProBook 470 G4 i7-7500U, GeForce 930MX, 48 Wh | Acer Aspire E5-774-54HJ i5-7200U, HD Graphics 620, 41 Wh | Dell Inspiron 17 7778 6500U, GeForce 940MX, 56 Wh | HP ProBook 470 G3 6500U, Radeon R7 M340, 44 Wh | MSI CX72-7QLi581 i5-7200U, GeForce 940MX, 41 Wh | Acer Aspire E5-575G-549D i5-7200U, GeForce GTX 950M, 62 Wh | |
|---|---|---|---|---|---|---|
| Battery runtime | -27% | -7% | -43% | -37% | -17% | |
| Reader / Idle (h) | 14.5 | 13.5 -7% | 8.2 -43% | 12.8 -12% | ||
| H.264 (h) | 8.8 | 4.5 -49% | 7.7 -12% | |||
| WiFi v1.3 (h) | 7.3 | 5.3 -27% | 8.3 14% | 4.6 -37% | 4.6 -37% | 7.5 3% |
| Load (h) | 2.5 | 1.8 -28% | 1.4 -44% | 1.3 -48% |
Pros
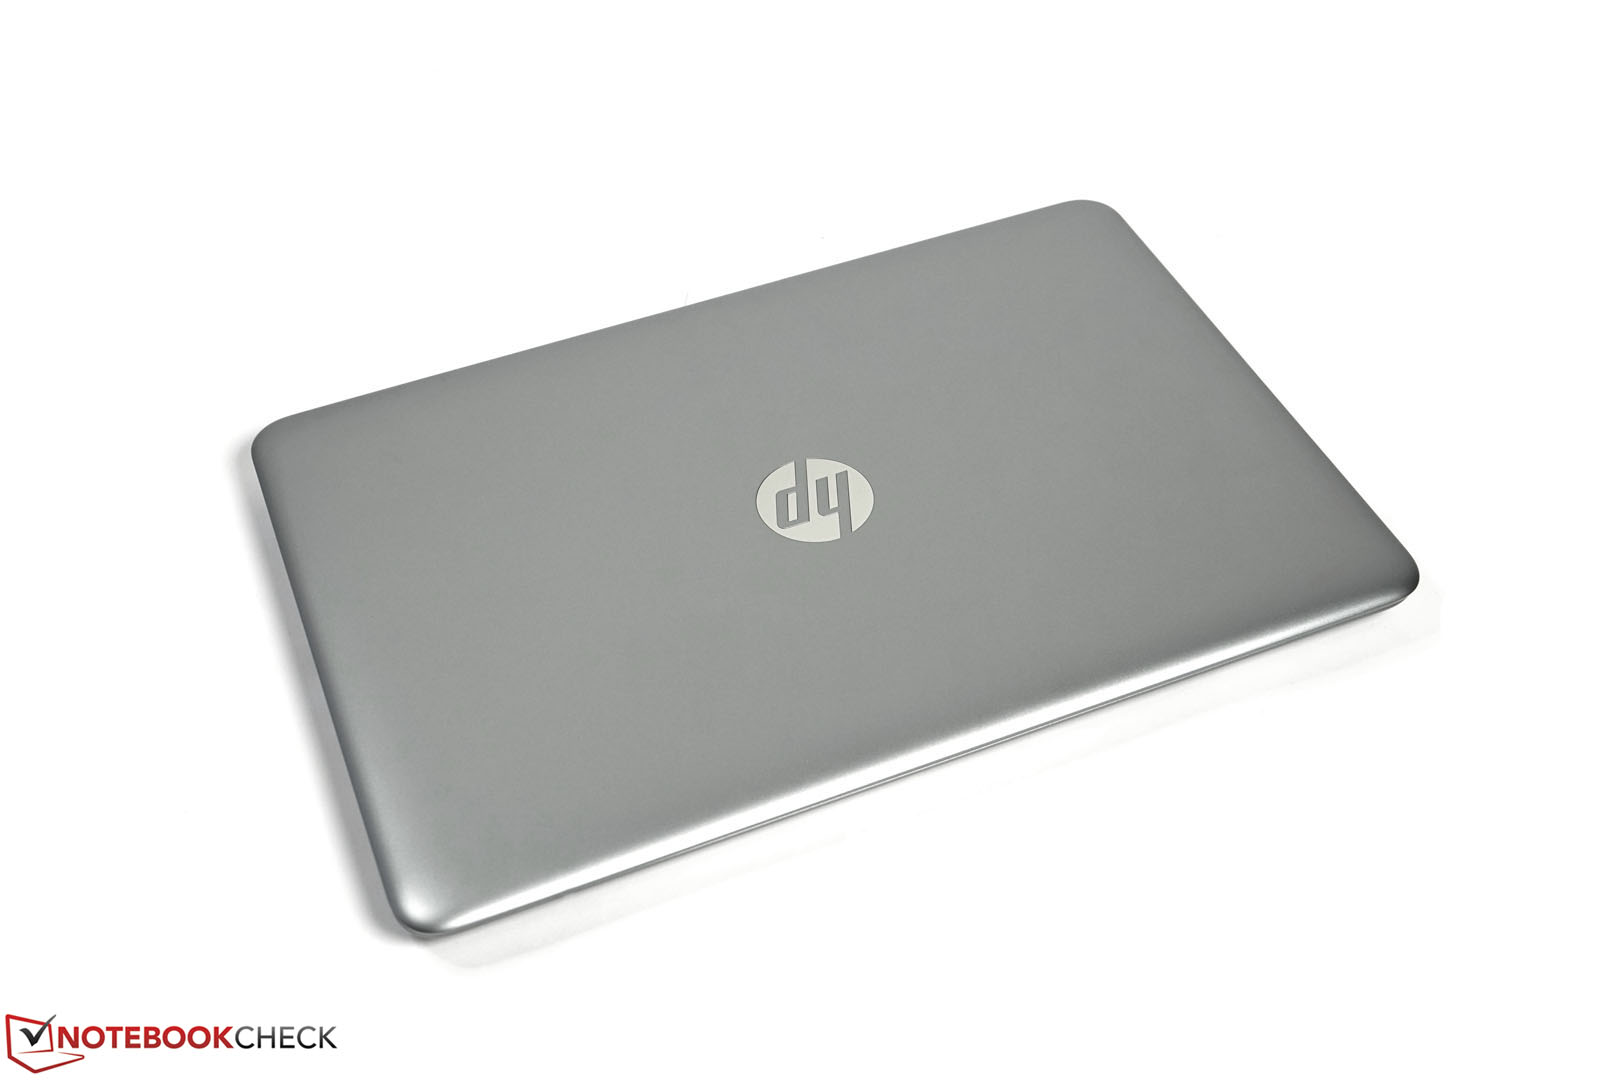
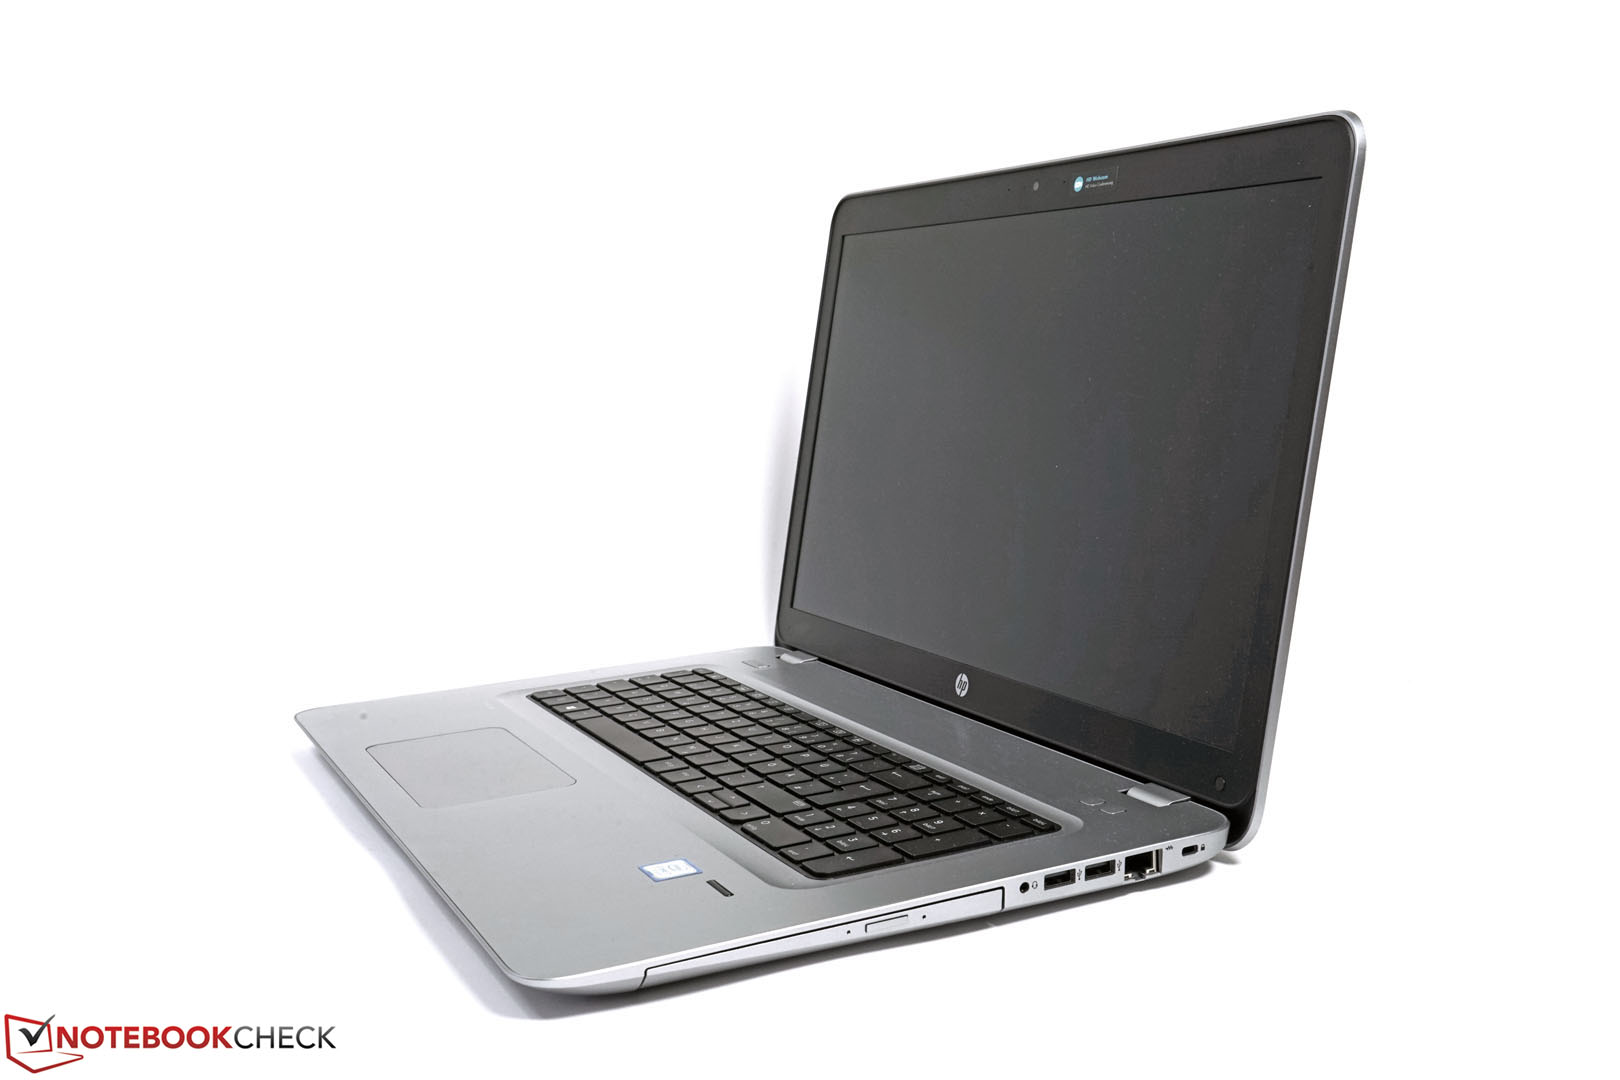
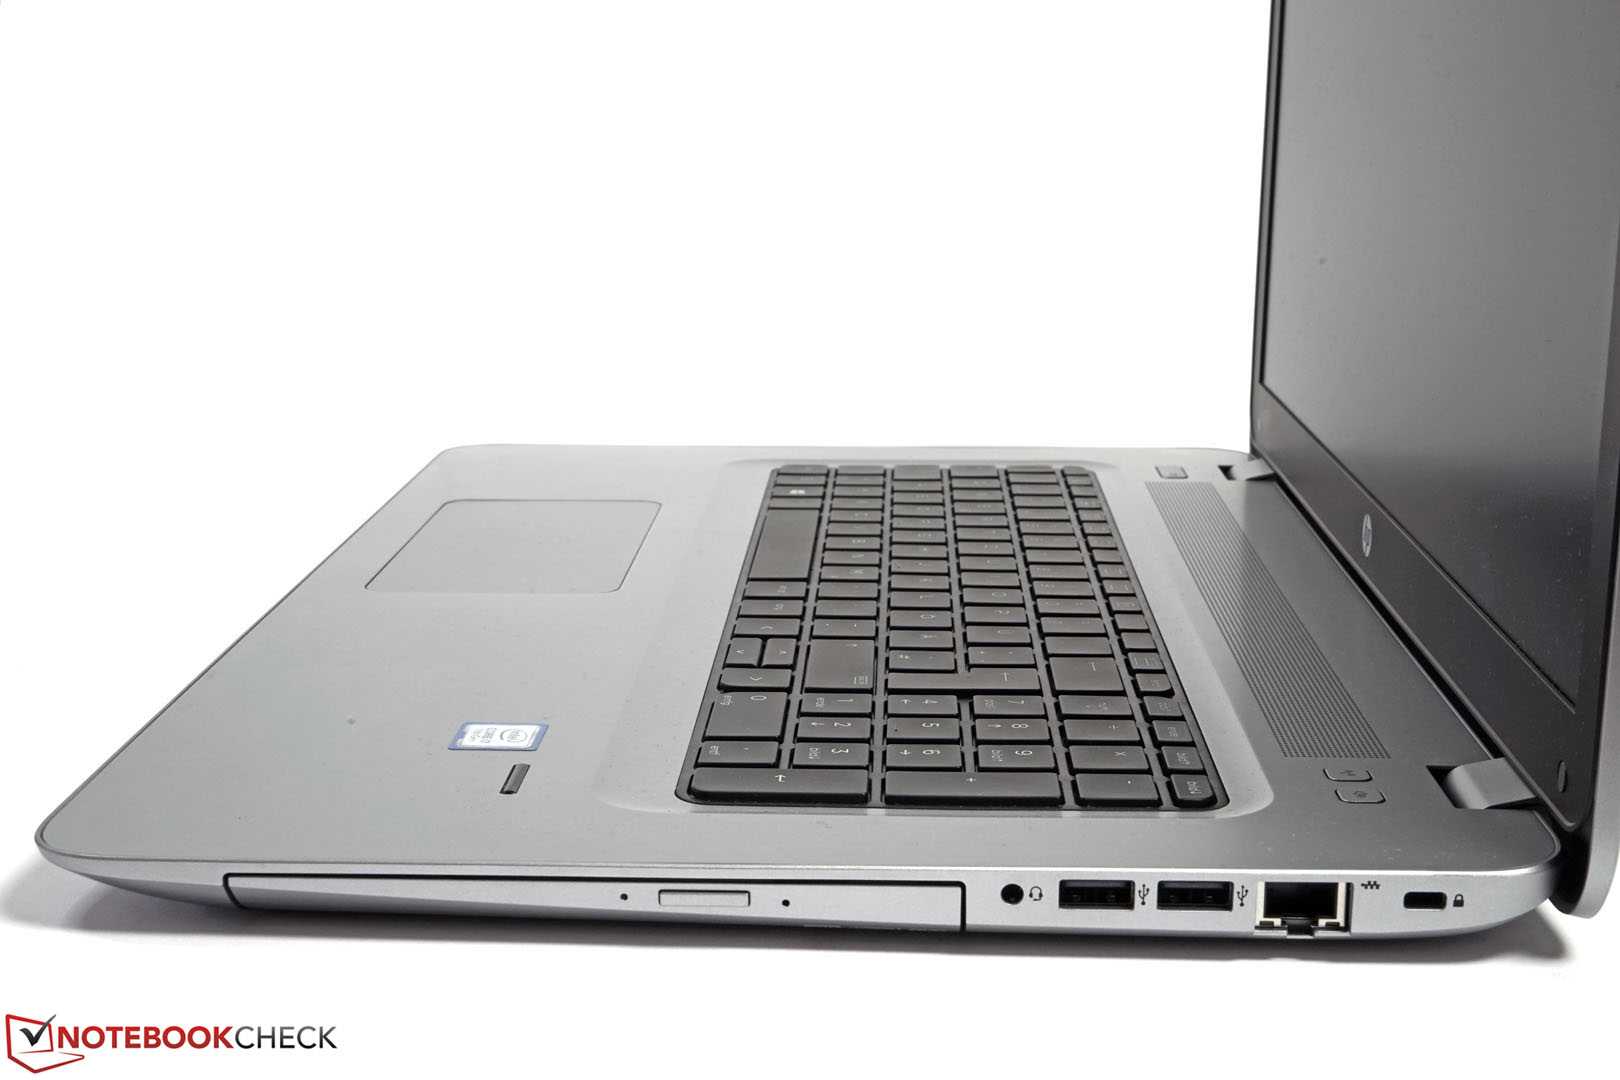
+ 机身
+ 屏幕
+ 配置
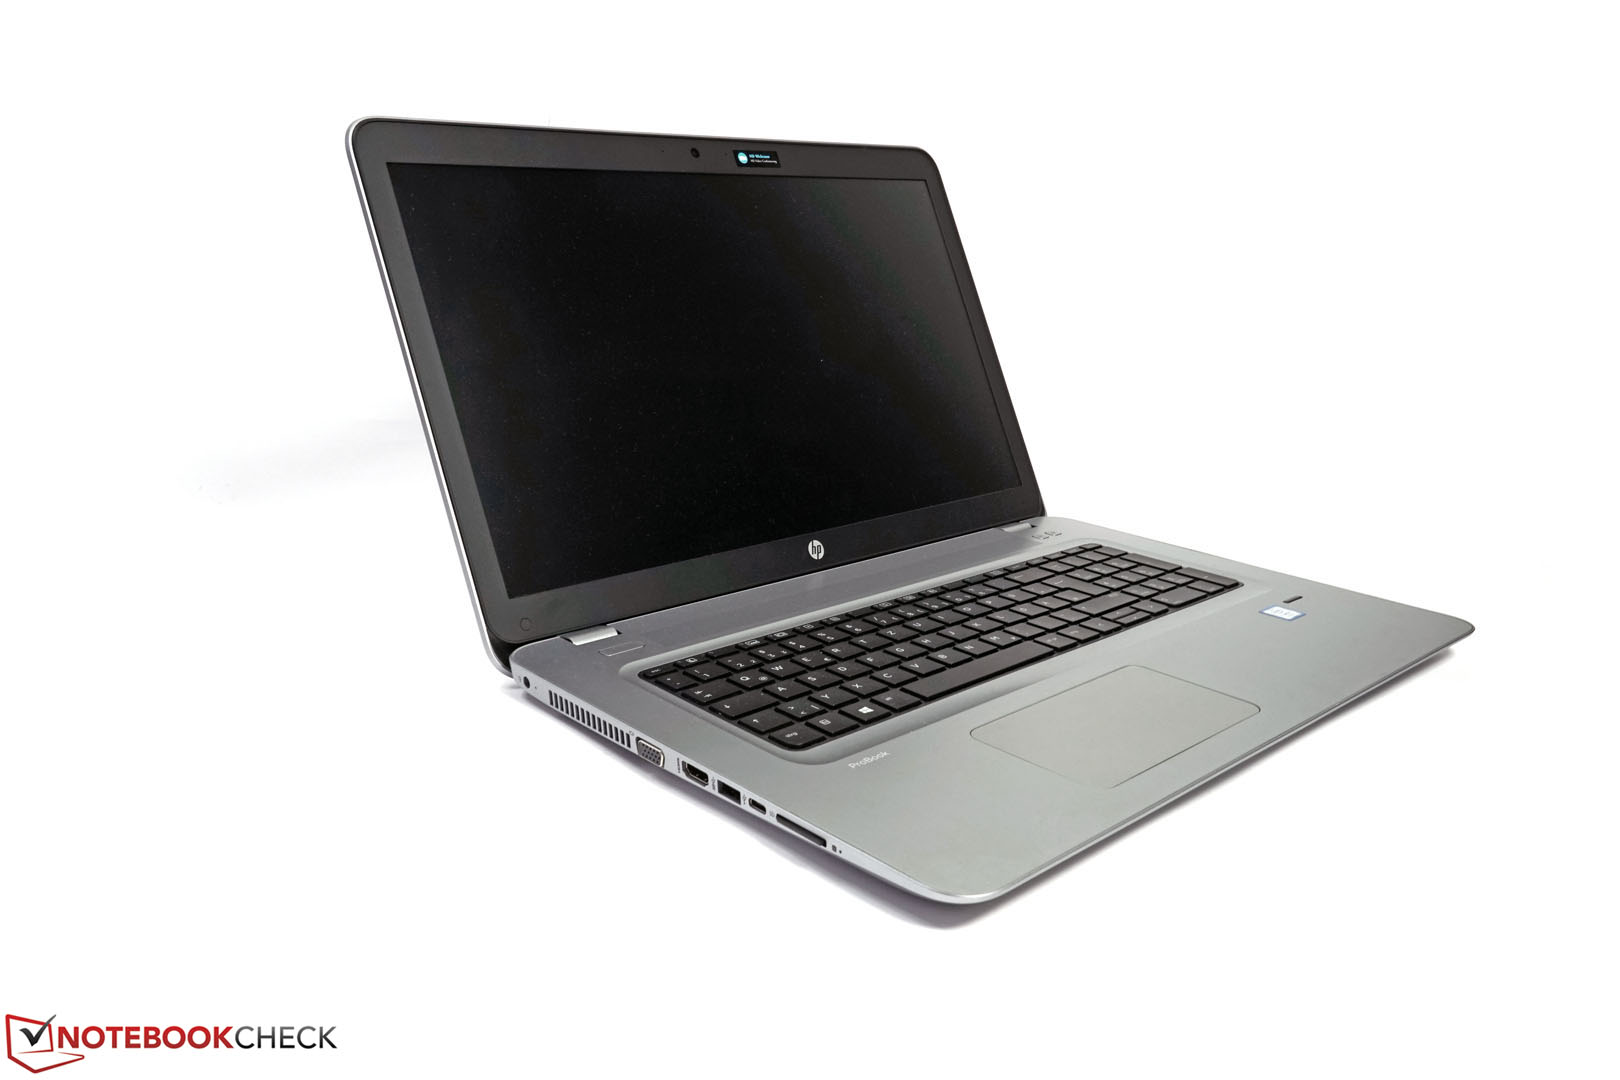
+ 输入设备
+ 散热噪音
+ 维护升级空间
+ 系统性能
Cons
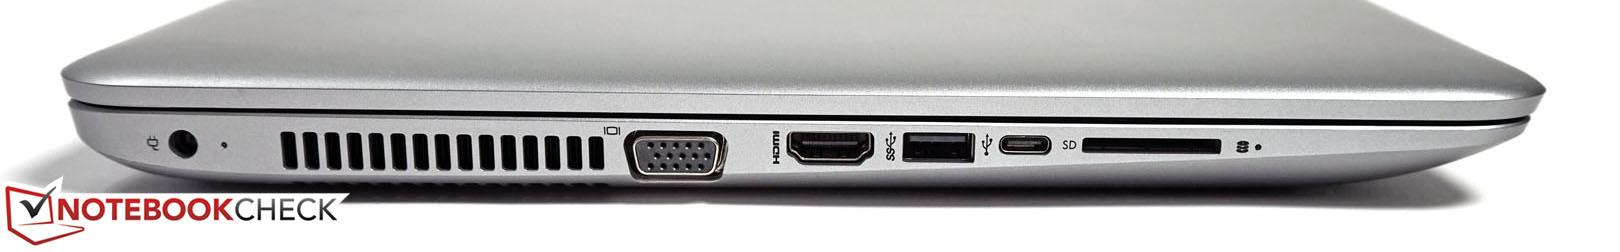
- 处理器性能无法完全发挥
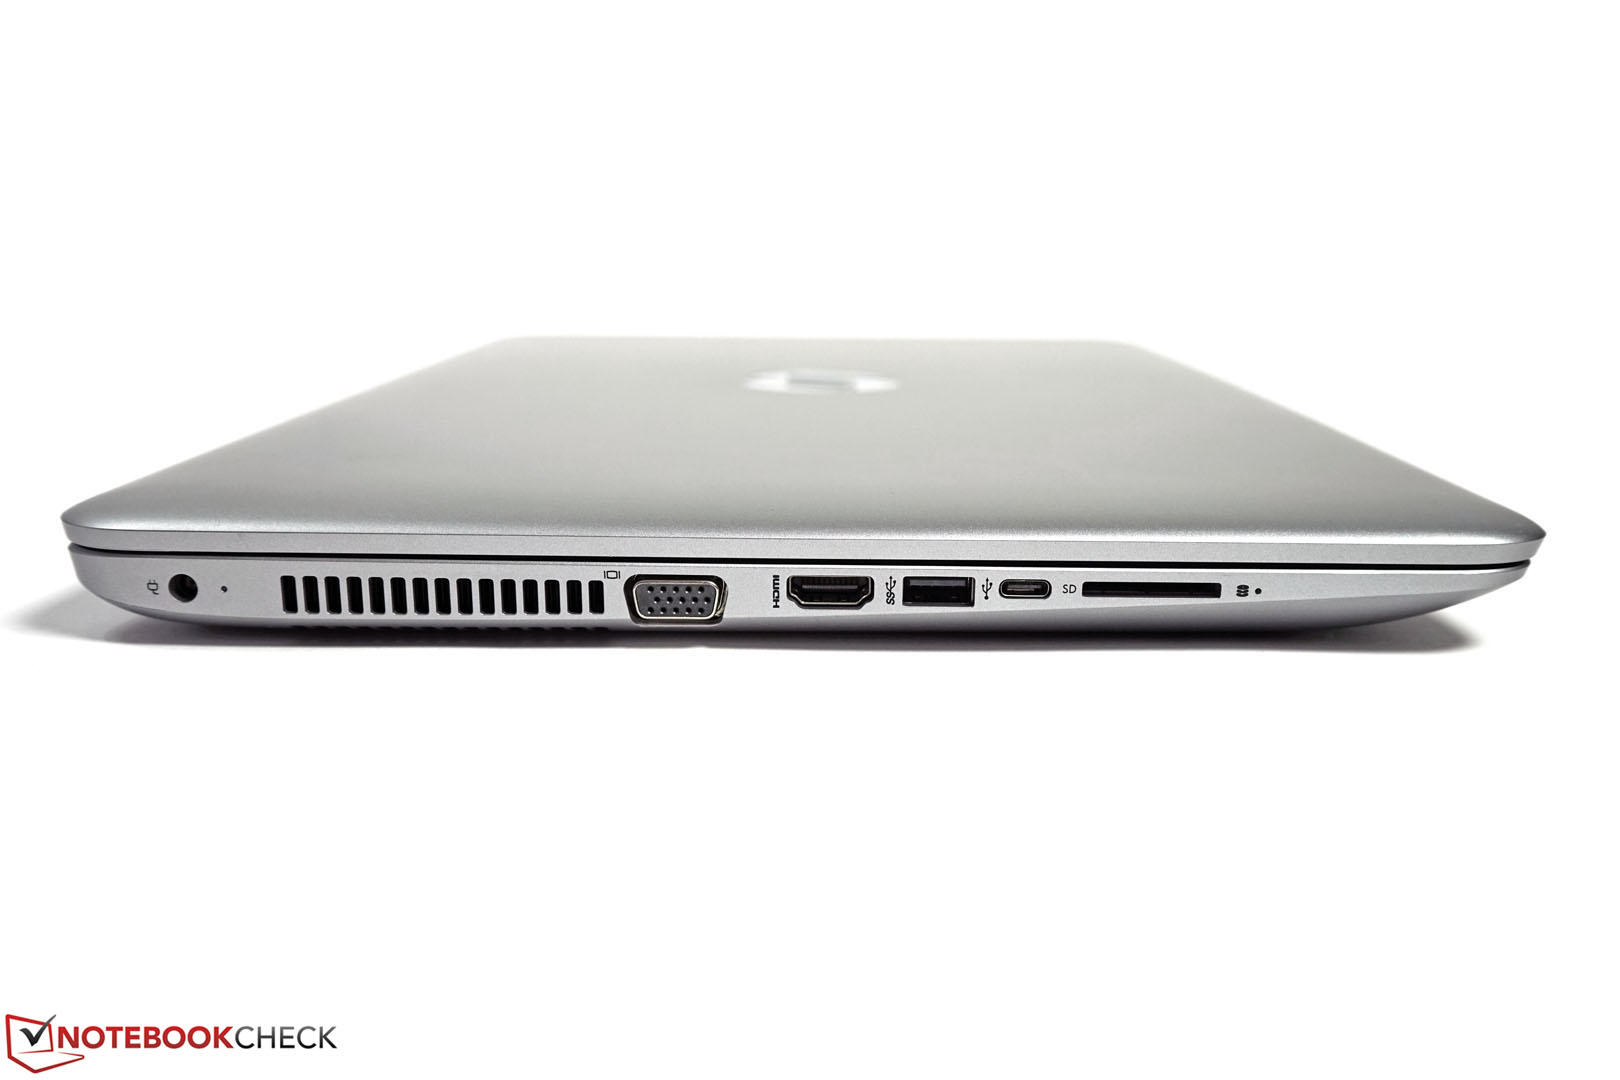
- 不支持60赫兹UHD显示器
惠普的ProBook 470 G4是一台难得一见的17寸出色商务笔记本电脑。用户可以在合理的价位上得到一个非常优秀的键盘,一块非常优秀的屏幕和美观的机身。归功于超长电池续航,它的充电器甚至可以留在家里不带出门。这也略微弥补了大尺寸带来的较低便携性。
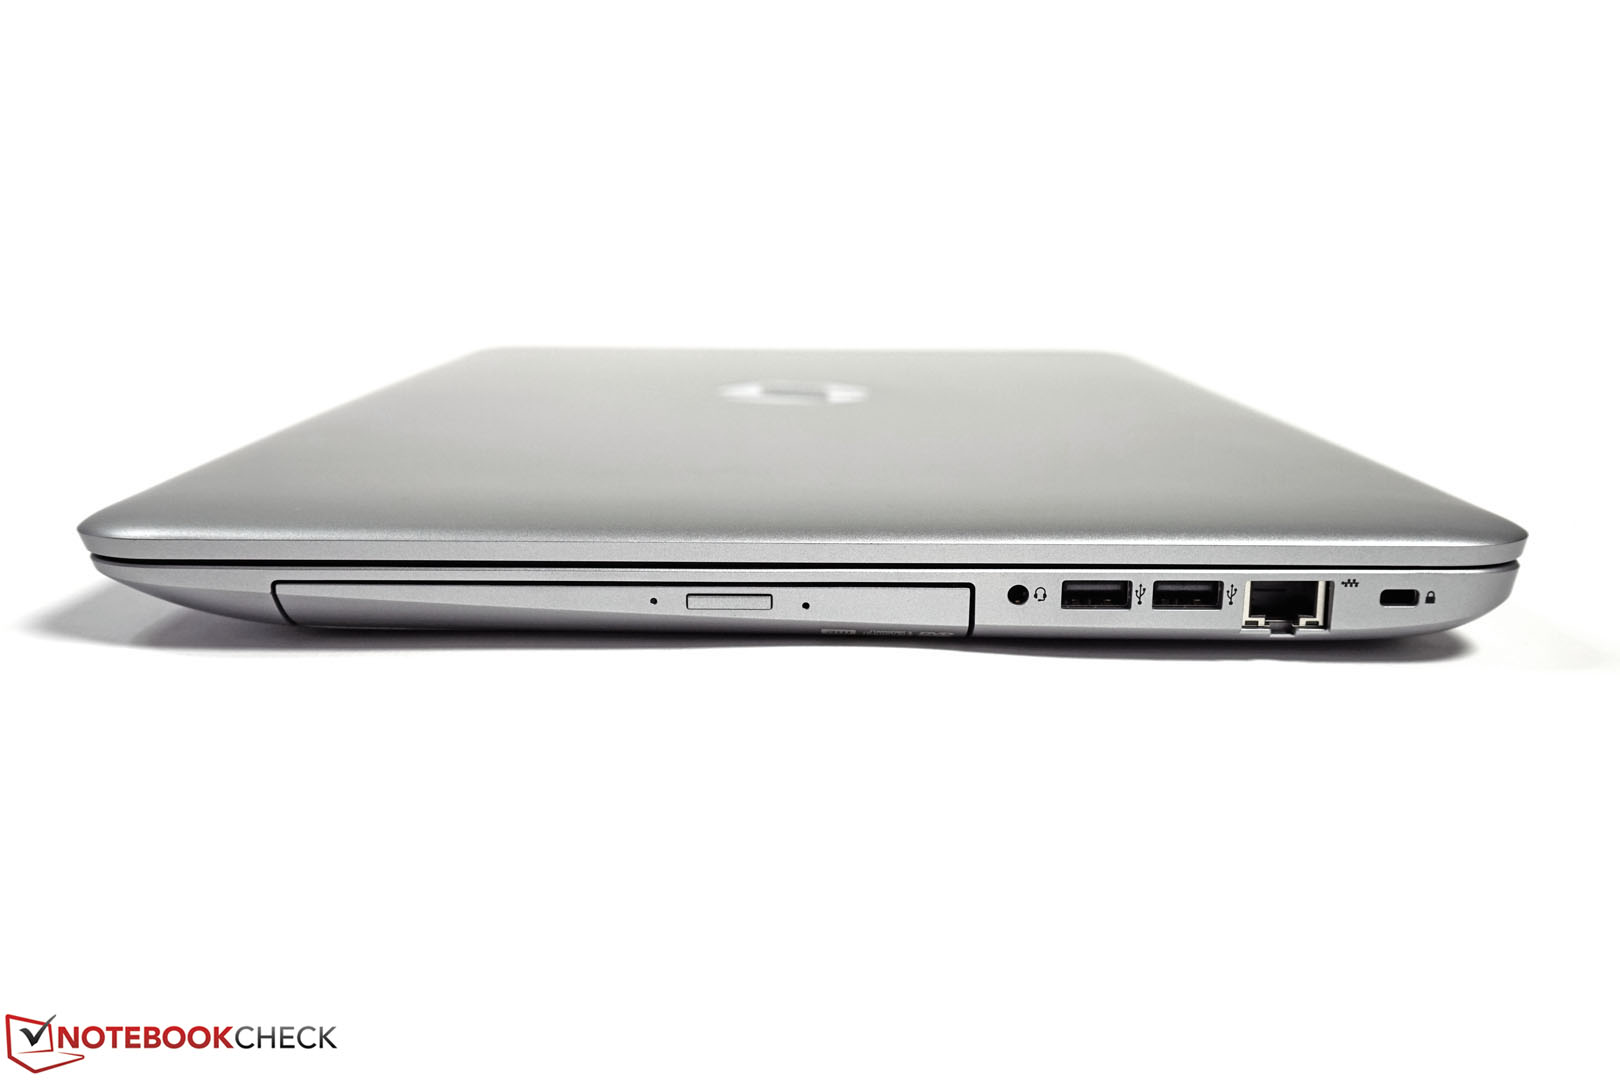
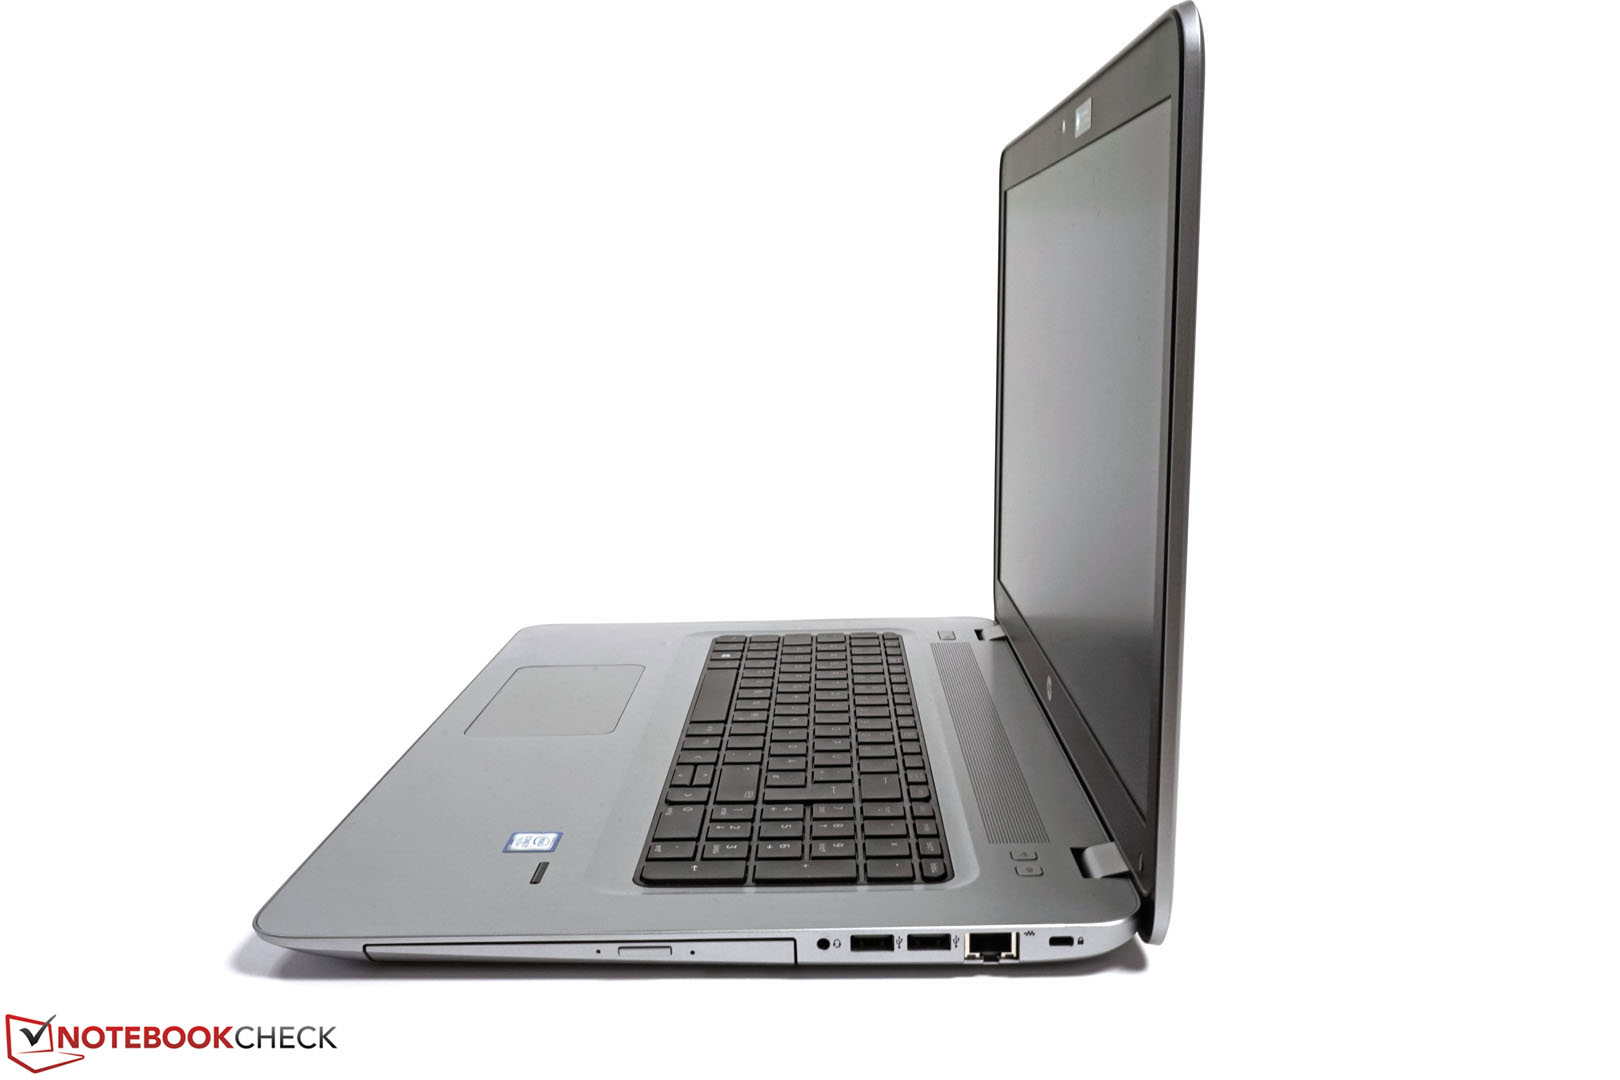
测试机的性能配置十分合理,为许多用途都提供了优秀的性能。尽管它处理器的性能在负载下还无法全部发挥潜能,同时缺少一些实用的接口,但这对于它的潜在用户群来说应该只是一个小问题。
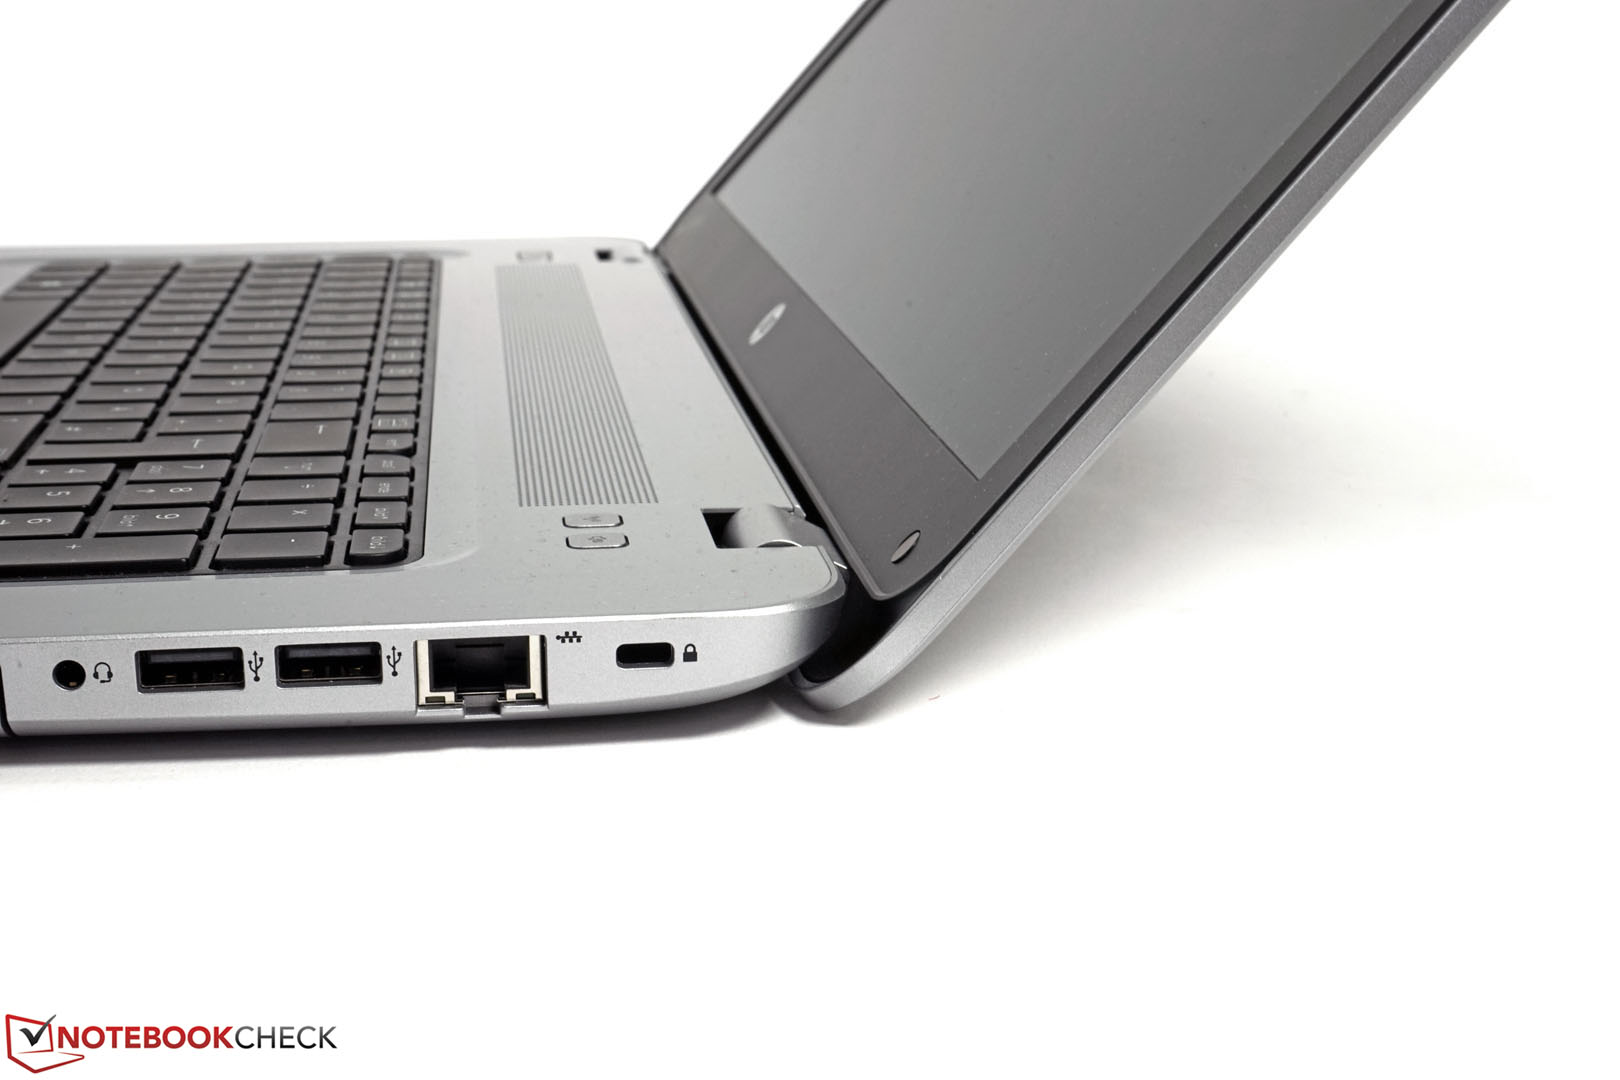
另一方面,无法连接60赫兹UHD显示器则是个不小的问题,且影响的不仅是商务用户。“仅因”缺少相应的接口而为用户带来了使用中的限制的设计让人感到十分难以理解。
不过,惠普ProBook 470 G4的设计理念仍然全面合理,而市场上较少的同类产品也让它的几乎不存在竞争。它也可能会适合一些家庭用户的需要。
注:本文是基于完整评测的缩减版本,阅读完整的英文评测,请点击这里。
HP ProBook 470 G4
- 11/26/2016 v5.1 (old)
Tobias Winkler
Office - Weighted Average