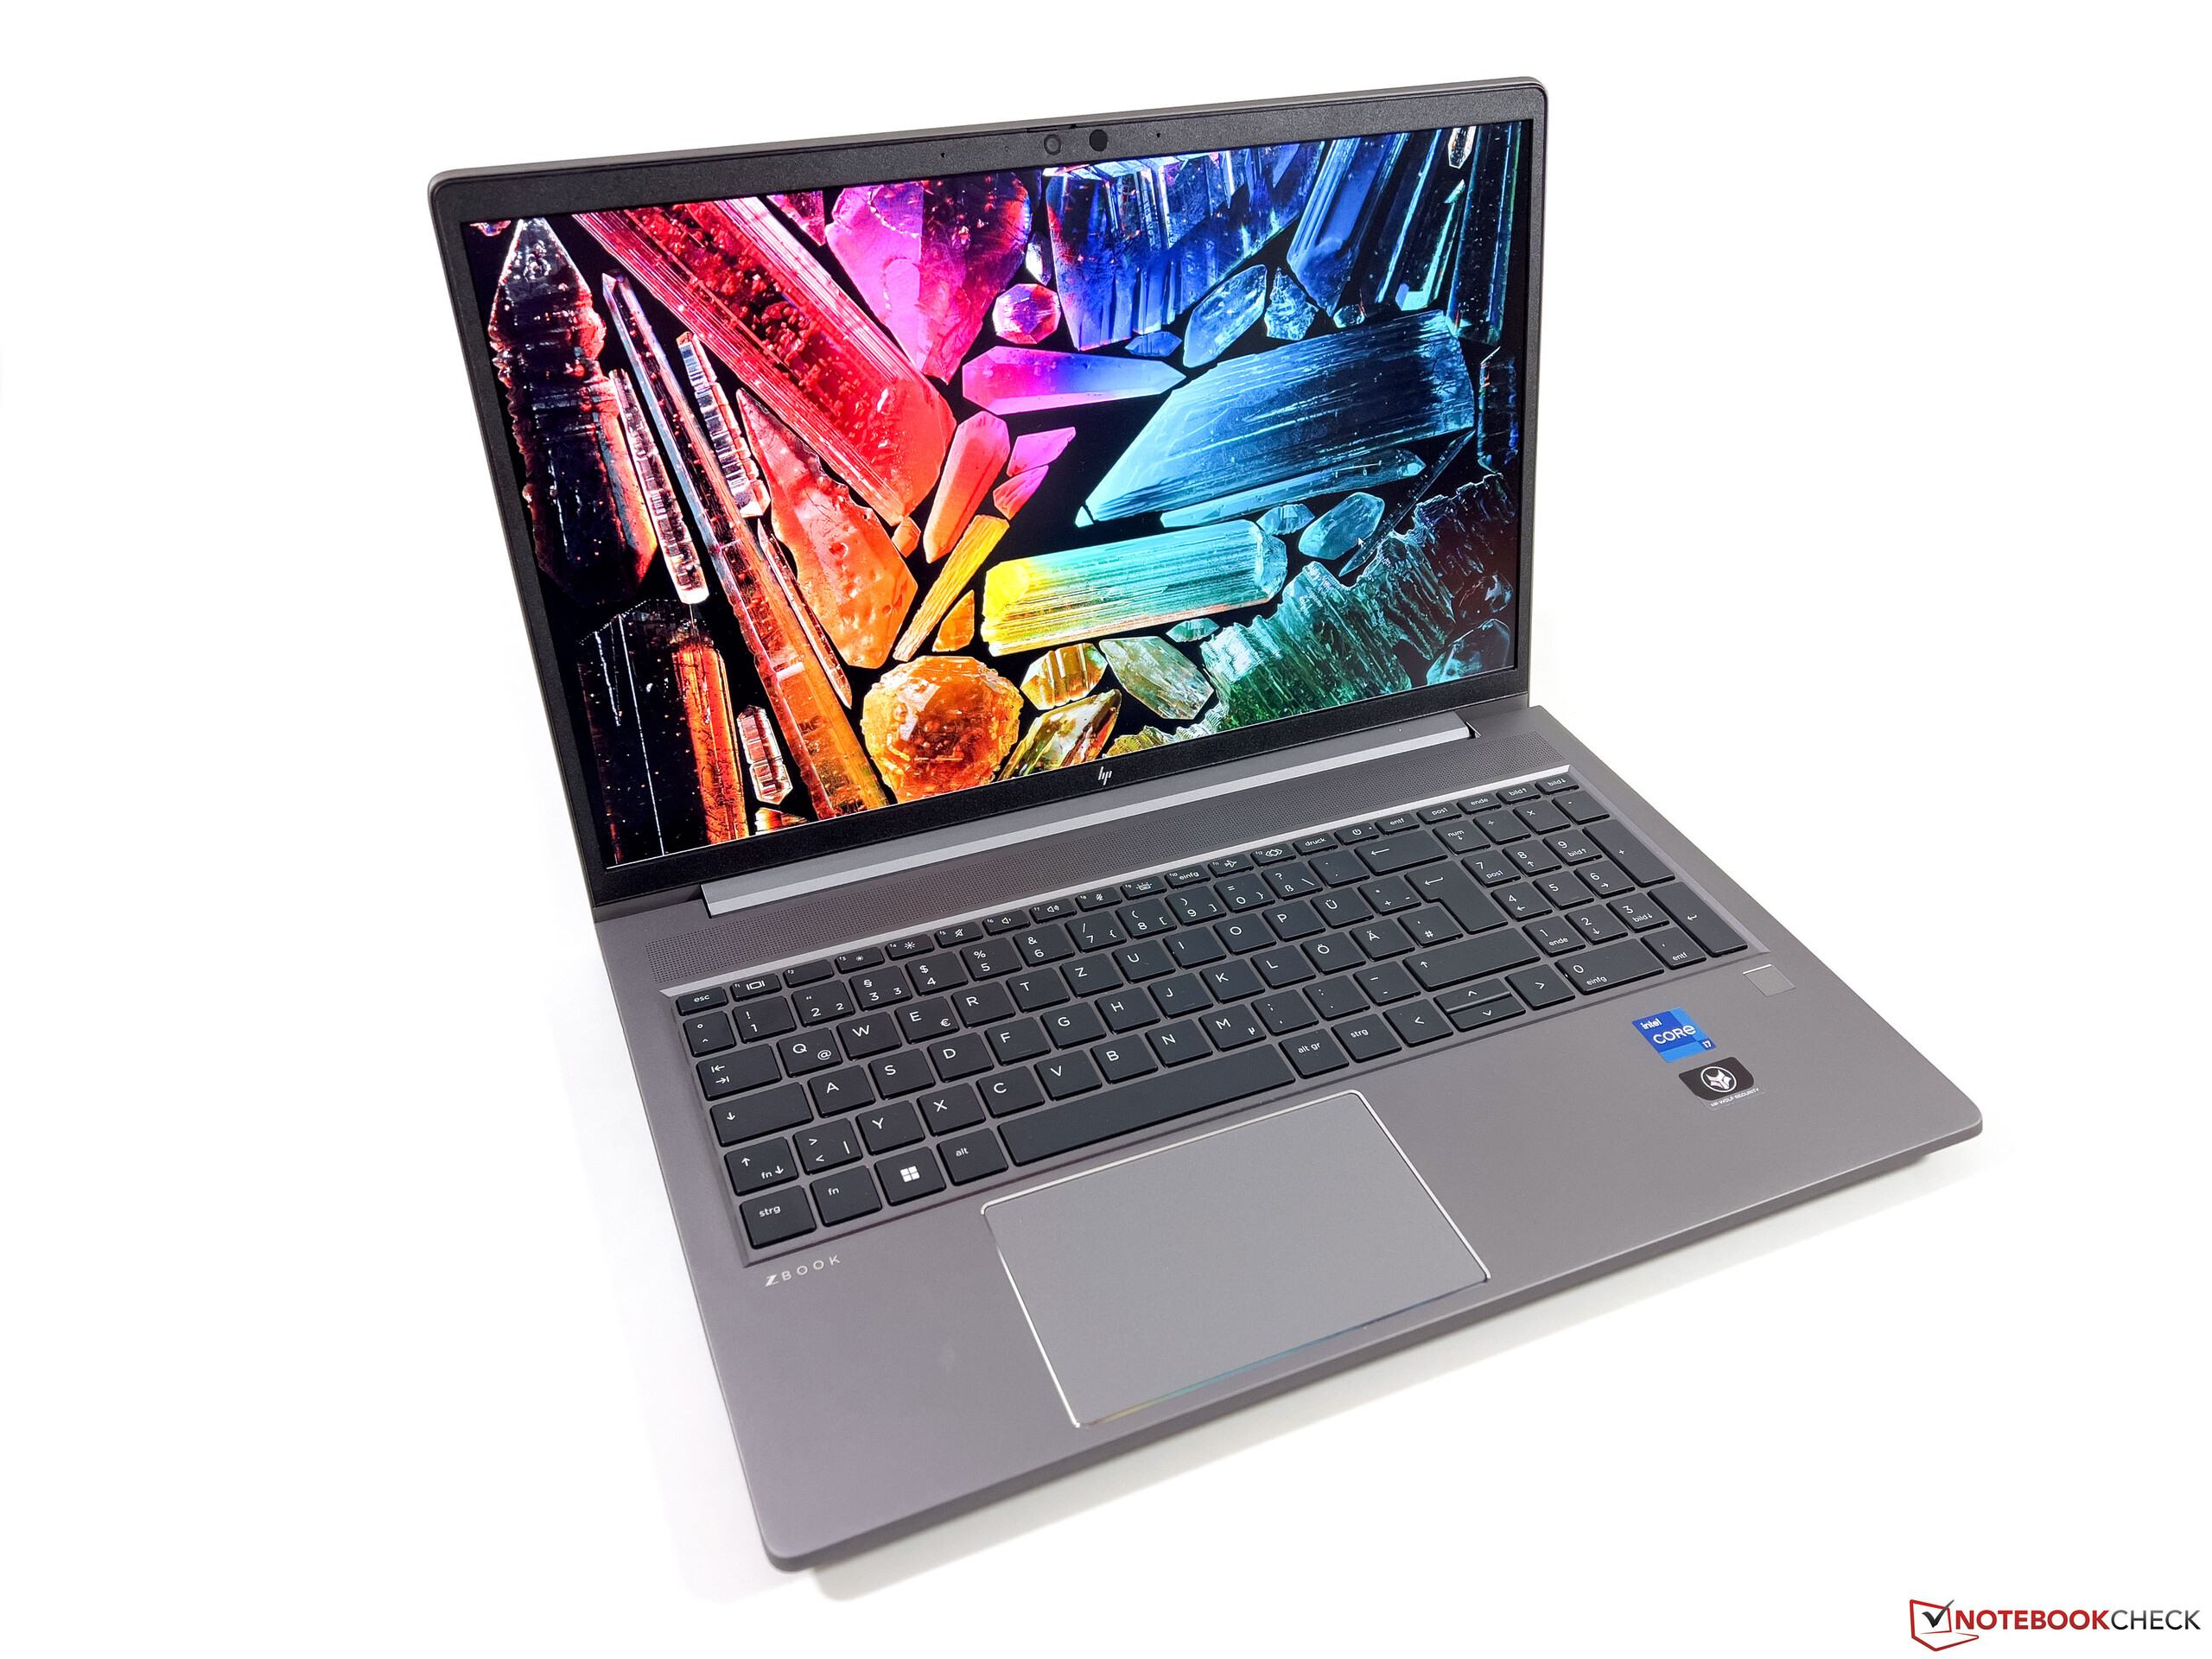
惠普 ZBook Power 15 G10 工作站评测:ThinkPad P15v 的绝佳替代品

惠普 ZBook Power 15 G10 取代了去年的 ZBook Power 15 G9,将 Alder Lake 12 代英特尔 CPU 换成了更新的 Raptor Lake 13 代和 AMD Ryzen Zen 4。机箱在其他方面与 ZBook Power 15 G9或 ZBook Power 15 G8因此,我们建议您查看我们的旧版评测,了解该机型的更多物理特性。
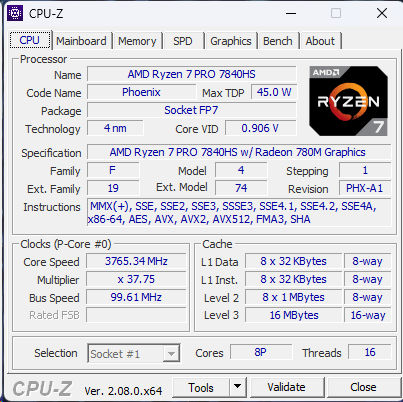
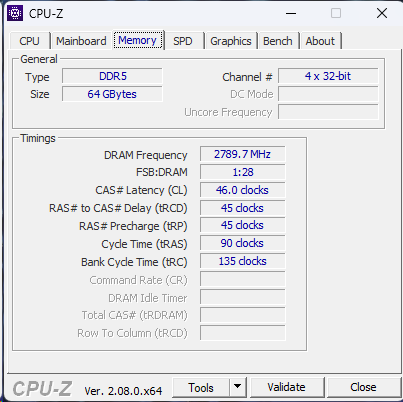
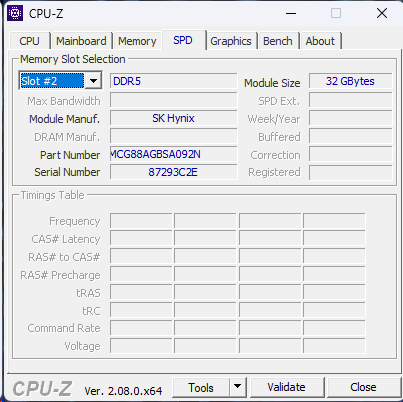
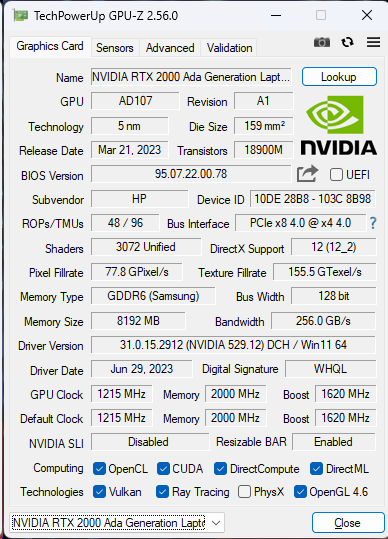
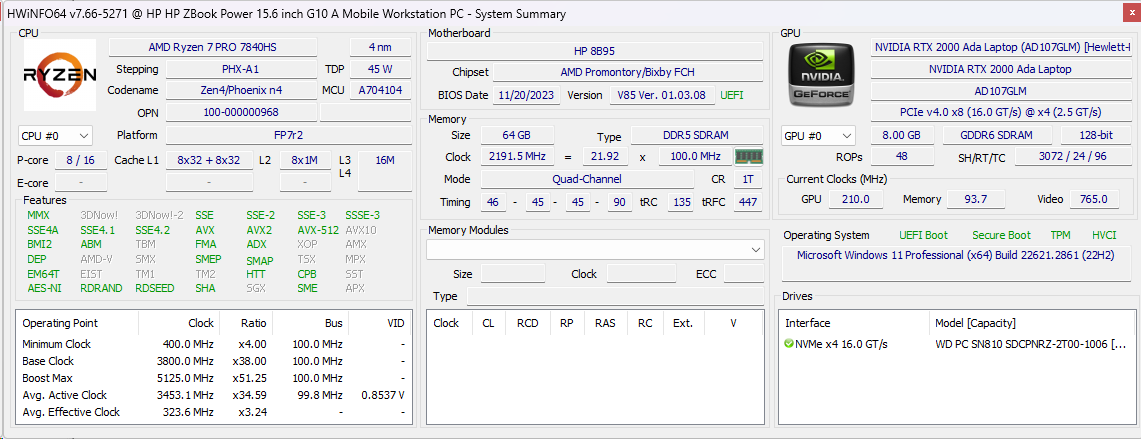
我们的具体评测机型是 AMD 的最高端配置,配备 Ryzen 7 Pro 7940HS CPU、Nvidia RTX 2000 Ada GPU、1440p IPS 显示屏和 64GB DDR5-5600 内存,售价约为 2600 美元。从 Ryzen 5 7640HS、1080p 显示屏和集成显卡开始的较低 SKU 也可低至 1600 美元。请注意,配备英特尔 CPU 的配置称为 ZBook Power 15 G10,而配备 AMD CPU 的配置称为 ZBook Power 15 G10 A。
ZBook Power 15 G10 的替代产品包括其他超薄工作站,如戴尔Precision 5560,联想 ThinkPad P15v G3, 或华硕 ExpertBook B6 Flip 。
更多惠普评论:
潜在的竞争对手比较
Rating | Date | Model | Weight | Height | Size | Resolution | Price |
|---|---|---|---|---|---|---|---|
| 88.9 % v7 (old) | 12 / 2023 | HP ZBook Power 15 G10 R7 PRO 7840HS, RTX 2000 Ada Generation Laptop | 2 kg | 22.9 mm | 15.60" | 2560x1440 | |
| 87.4 % v7 (old) | 01 / 2023 | HP ZBook Power 15 G9 6B8C4EA i7-12700H, RTX A2000 Laptop GPU | 2 kg | 22.8 mm | 15.60" | 3840x2160 | |
| 87.8 % v7 (old) | 04 / 2023 | Lenovo ThinkPad P15v G3 21EM001AGE R7 PRO 6850H, RTX A2000 Laptop GPU | 2.2 kg | 22.7 mm | 15.60" | 3840x2160 | |
| 88.3 % v7 (old) | 10 / 2021 | Dell Precision 5000 5560 i7-11850H, RTX A2000 Laptop GPU | 2 kg | 18 mm | 15.60" | 3840x2400 | |
| 91.7 % v7 (old) | 10 / 2023 | Lenovo ThinkPad P1 G6-21FV000DGE i9-13900H, RTX 2000 Ada Generation Laptop | 1.9 kg | 17.5 mm | 16.00" | 2560x1600 | |
| 89.6 % v7 (old) | 01 / 2023 | Asus ExpertBook B6 Flip B6602FC2 i9-12950HX, RTX A2000 Laptop GPU | 2.8 kg | 27.2 mm | 16.00" | 2560x1600 |
案例
交流
| Networking | |
| iperf3 transmit AX12 | |
| Dell Precision 5000 5560 | |
| iperf3 receive AX12 | |
| Dell Precision 5000 5560 | |
| iperf3 transmit AXE11000 | |
| HP ZBook Power 15 G10 | |
| Lenovo ThinkPad P1 G6-21FV000DGE | |
| Asus ExpertBook B6 Flip B6602FC2 | |
| Lenovo ThinkPad P15v G3 21EM001AGE | |
| iperf3 receive AXE11000 | |
| Lenovo ThinkPad P1 G6-21FV000DGE | |
| Lenovo ThinkPad P15v G3 21EM001AGE | |
| Asus ExpertBook B6 Flip B6602FC2 | |
| HP ZBook Power 15 G10 | |
| iperf3 transmit AXE11000 6GHz | |
| HP ZBook Power 15 G9 6B8C4EA | |
| HP ZBook Power 15 G10 | |
| Asus ExpertBook B6 Flip B6602FC2 | |
| Lenovo ThinkPad P15v G3 21EM001AGE | |
| iperf3 receive AXE11000 6GHz | |
| HP ZBook Power 15 G9 6B8C4EA | |
| Asus ExpertBook B6 Flip B6602FC2 | |
| Lenovo ThinkPad P15v G3 21EM001AGE | |
| HP ZBook Power 15 G10 | |
网络摄像头
我们的 ZBook Power G9 配置了一个 100 万像素的网络摄像头,而 Power G10 则配备了一个 500 万像素的网络摄像头,画面更加清晰。红外和物理快门功能保持不变。


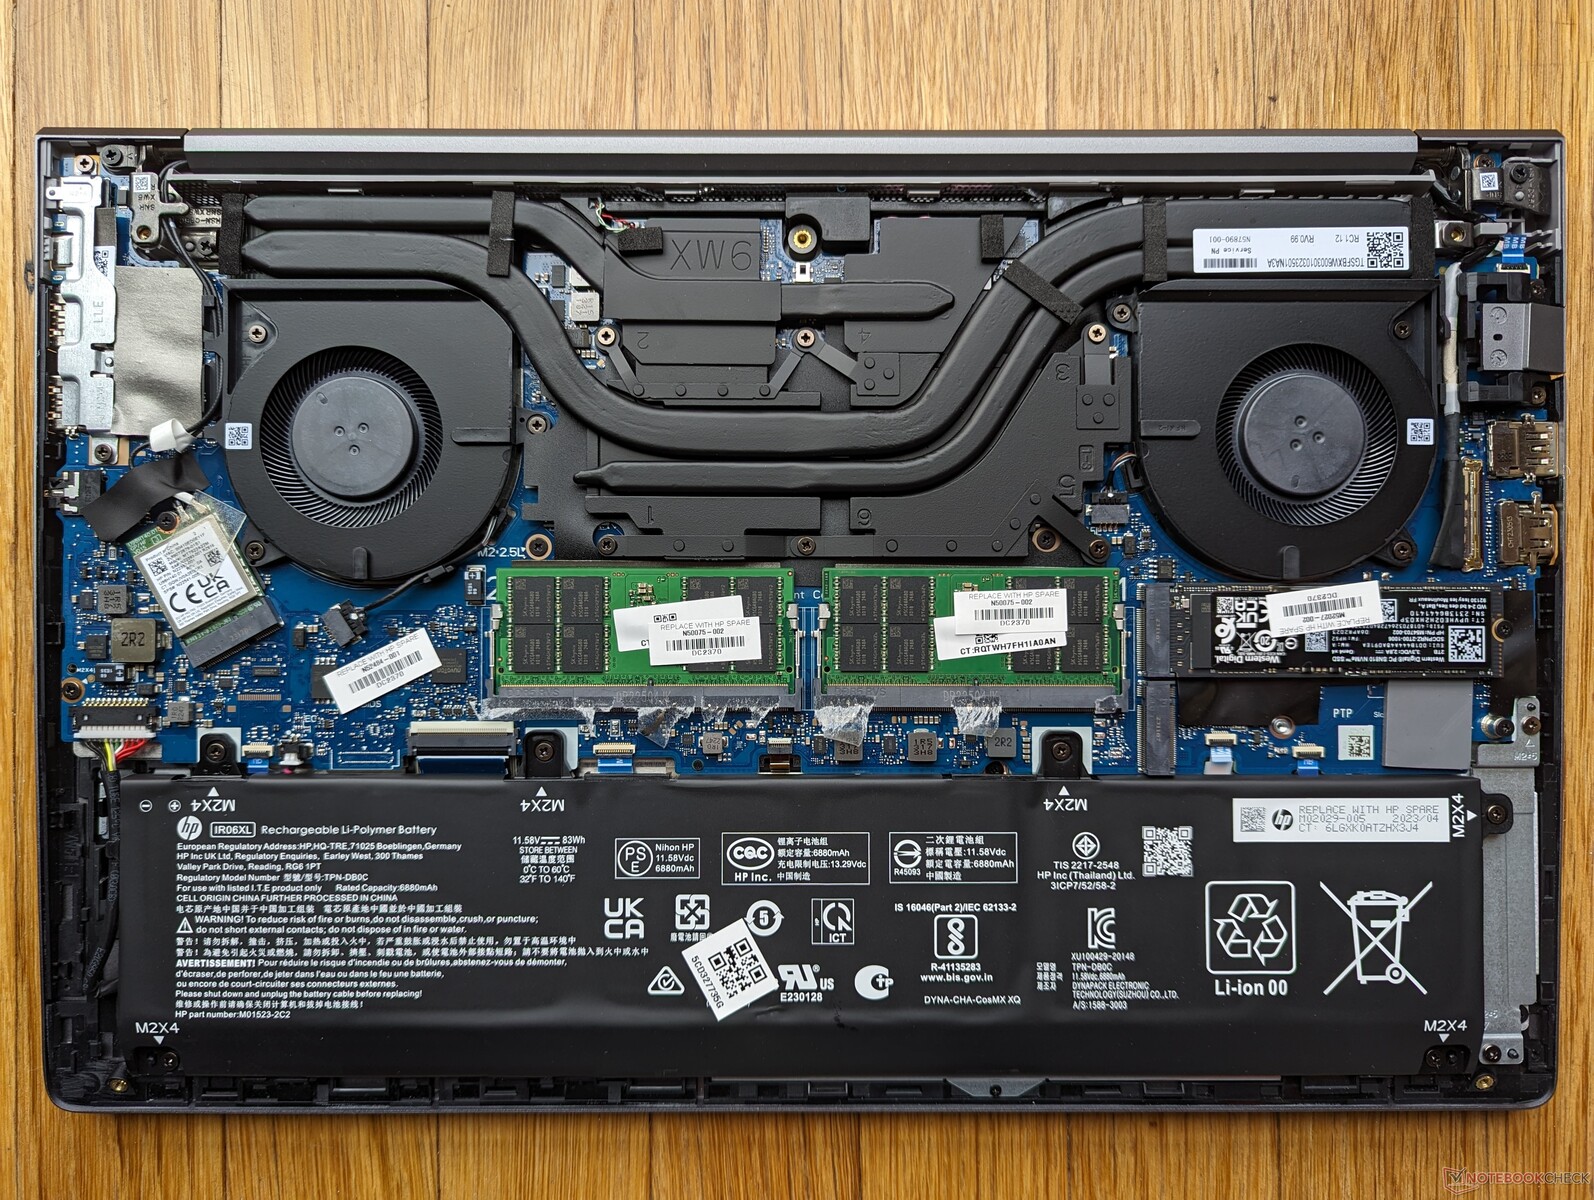
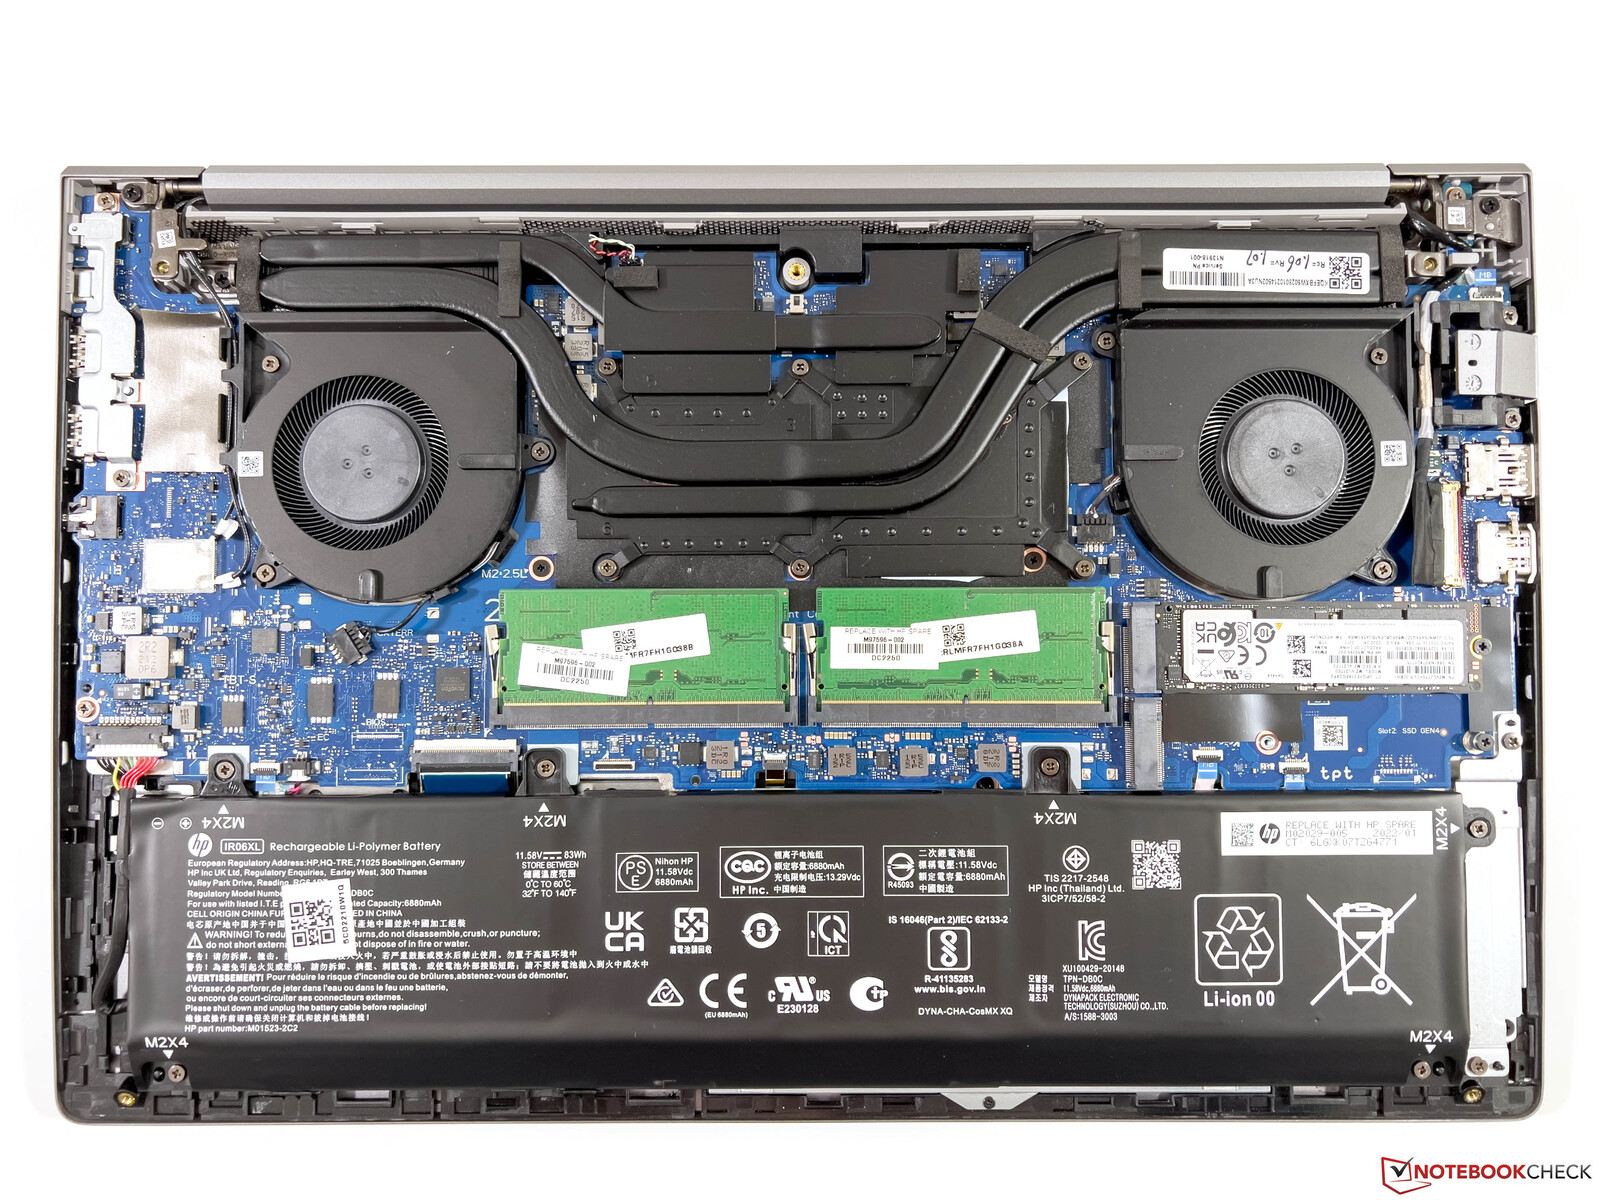
维护
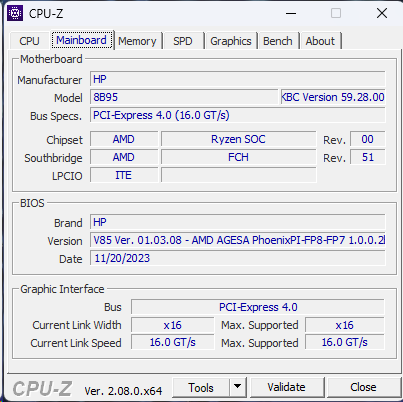
惠普做了一个微小但值得注意的改动:M.2 WLAN 模块现在可以更换,而去年的 ZBook Power 15 G9 则是焊接的。包括两个 DDR5 SODIMM 插槽和两个 M.2 PCIe4 x4 插槽在内的其他大部分配置都没有改变。
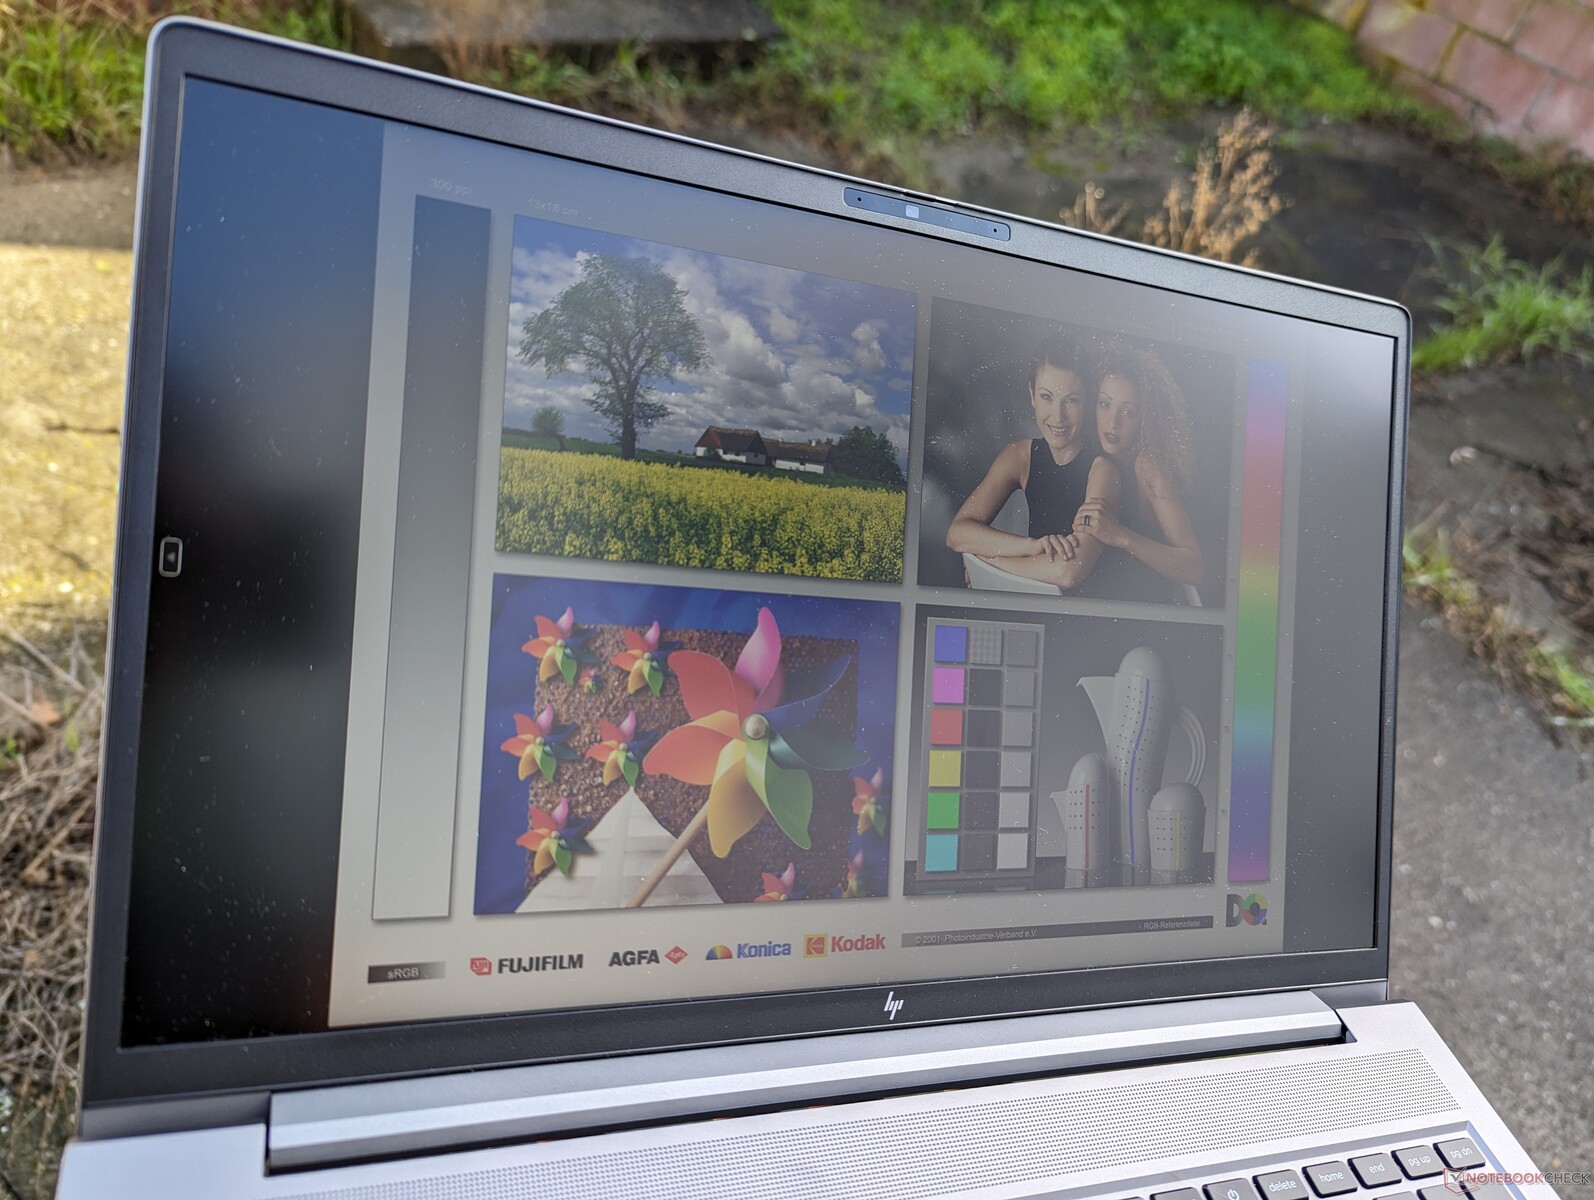
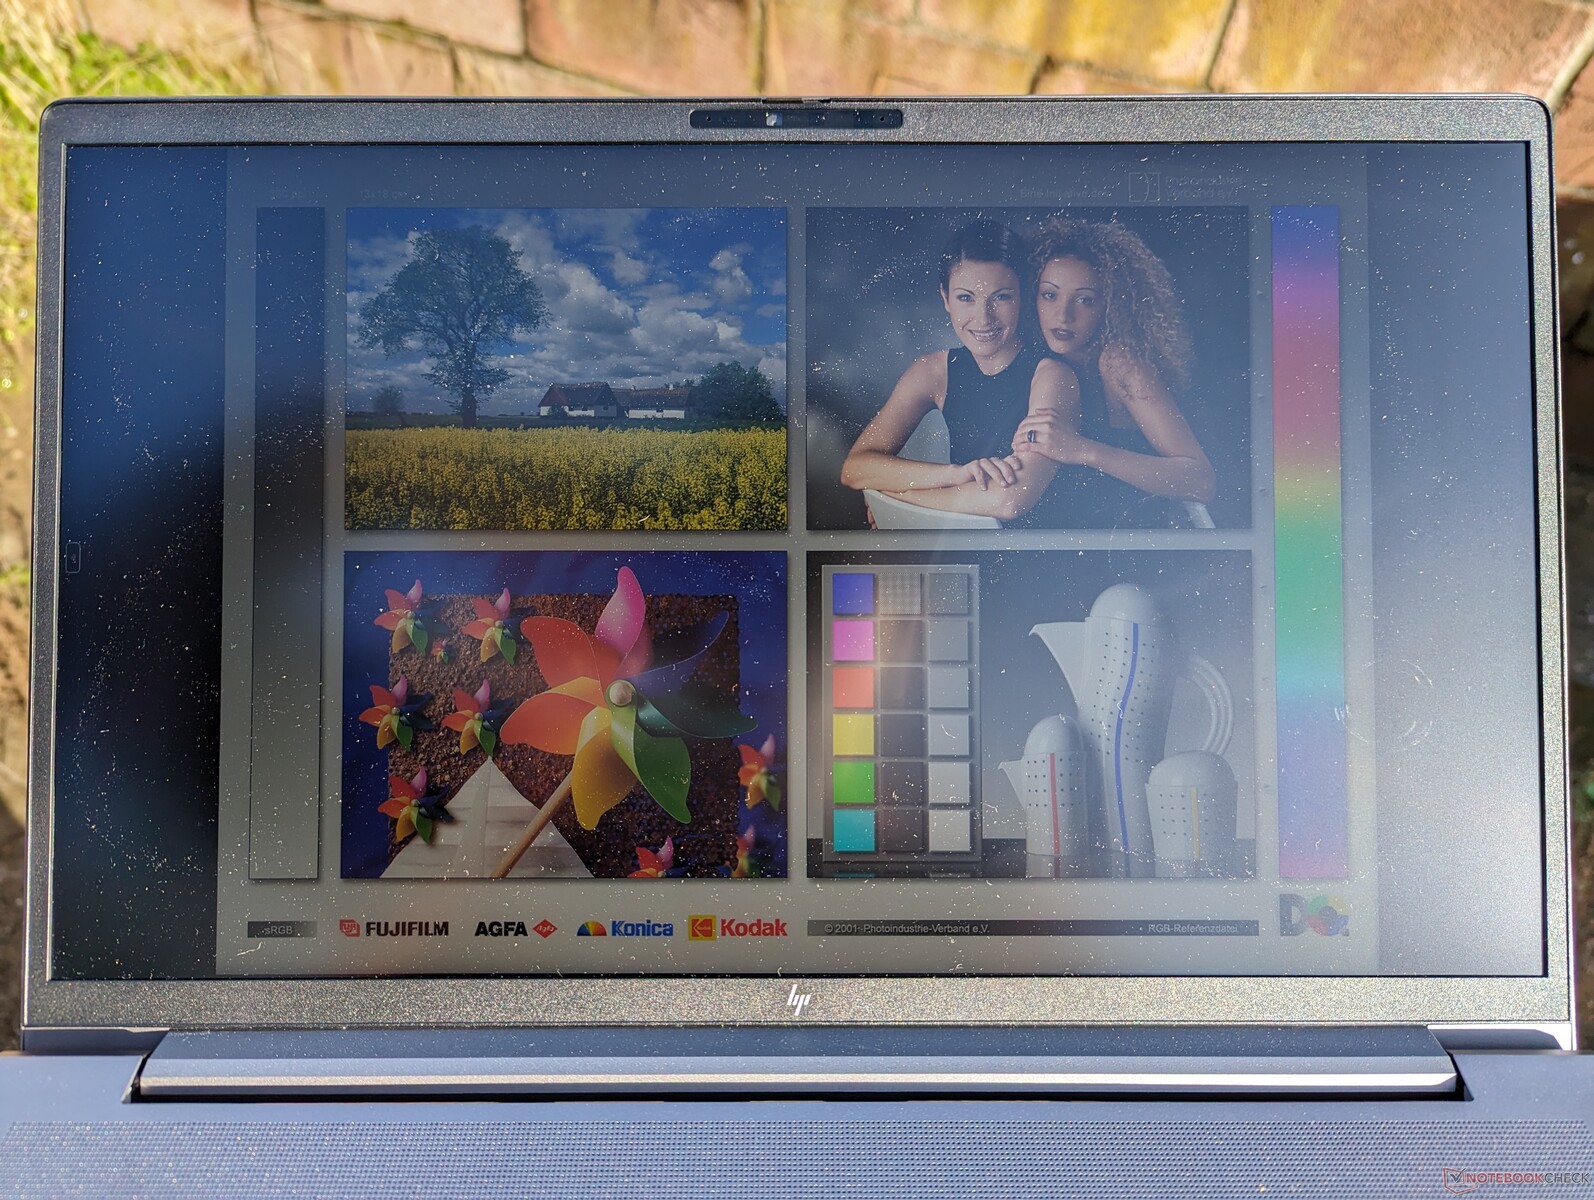
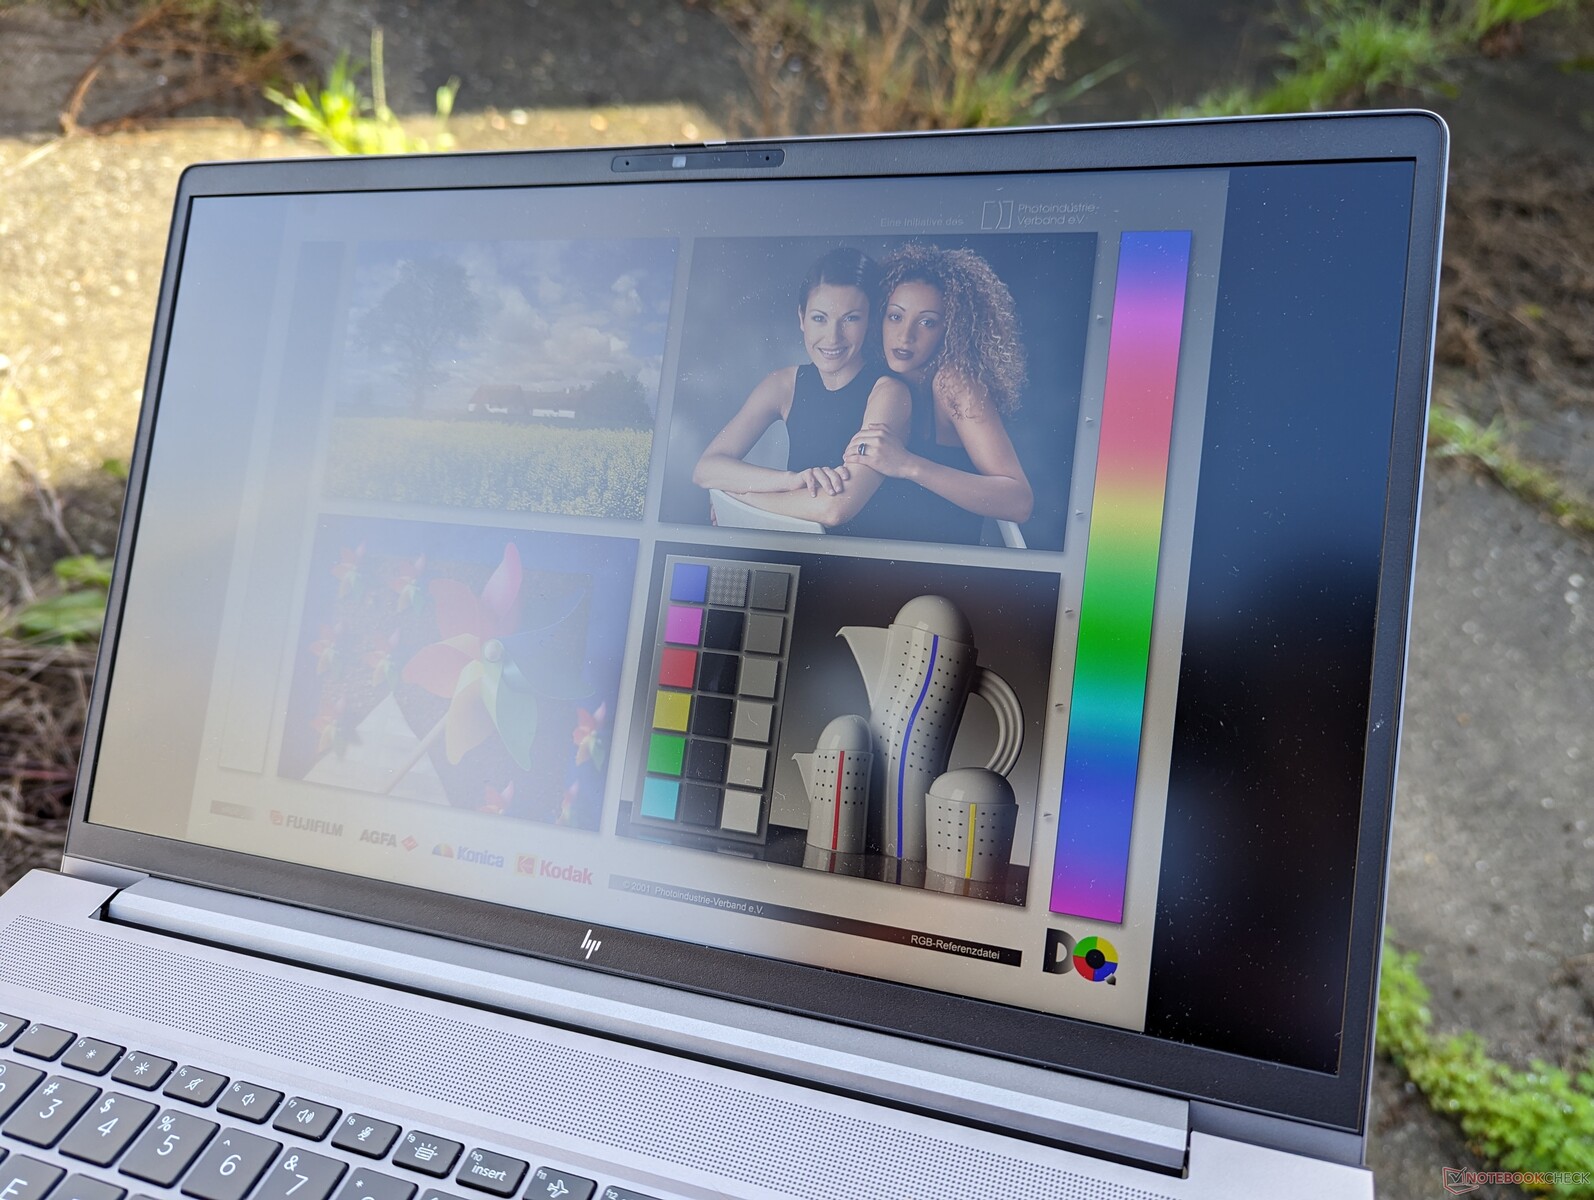
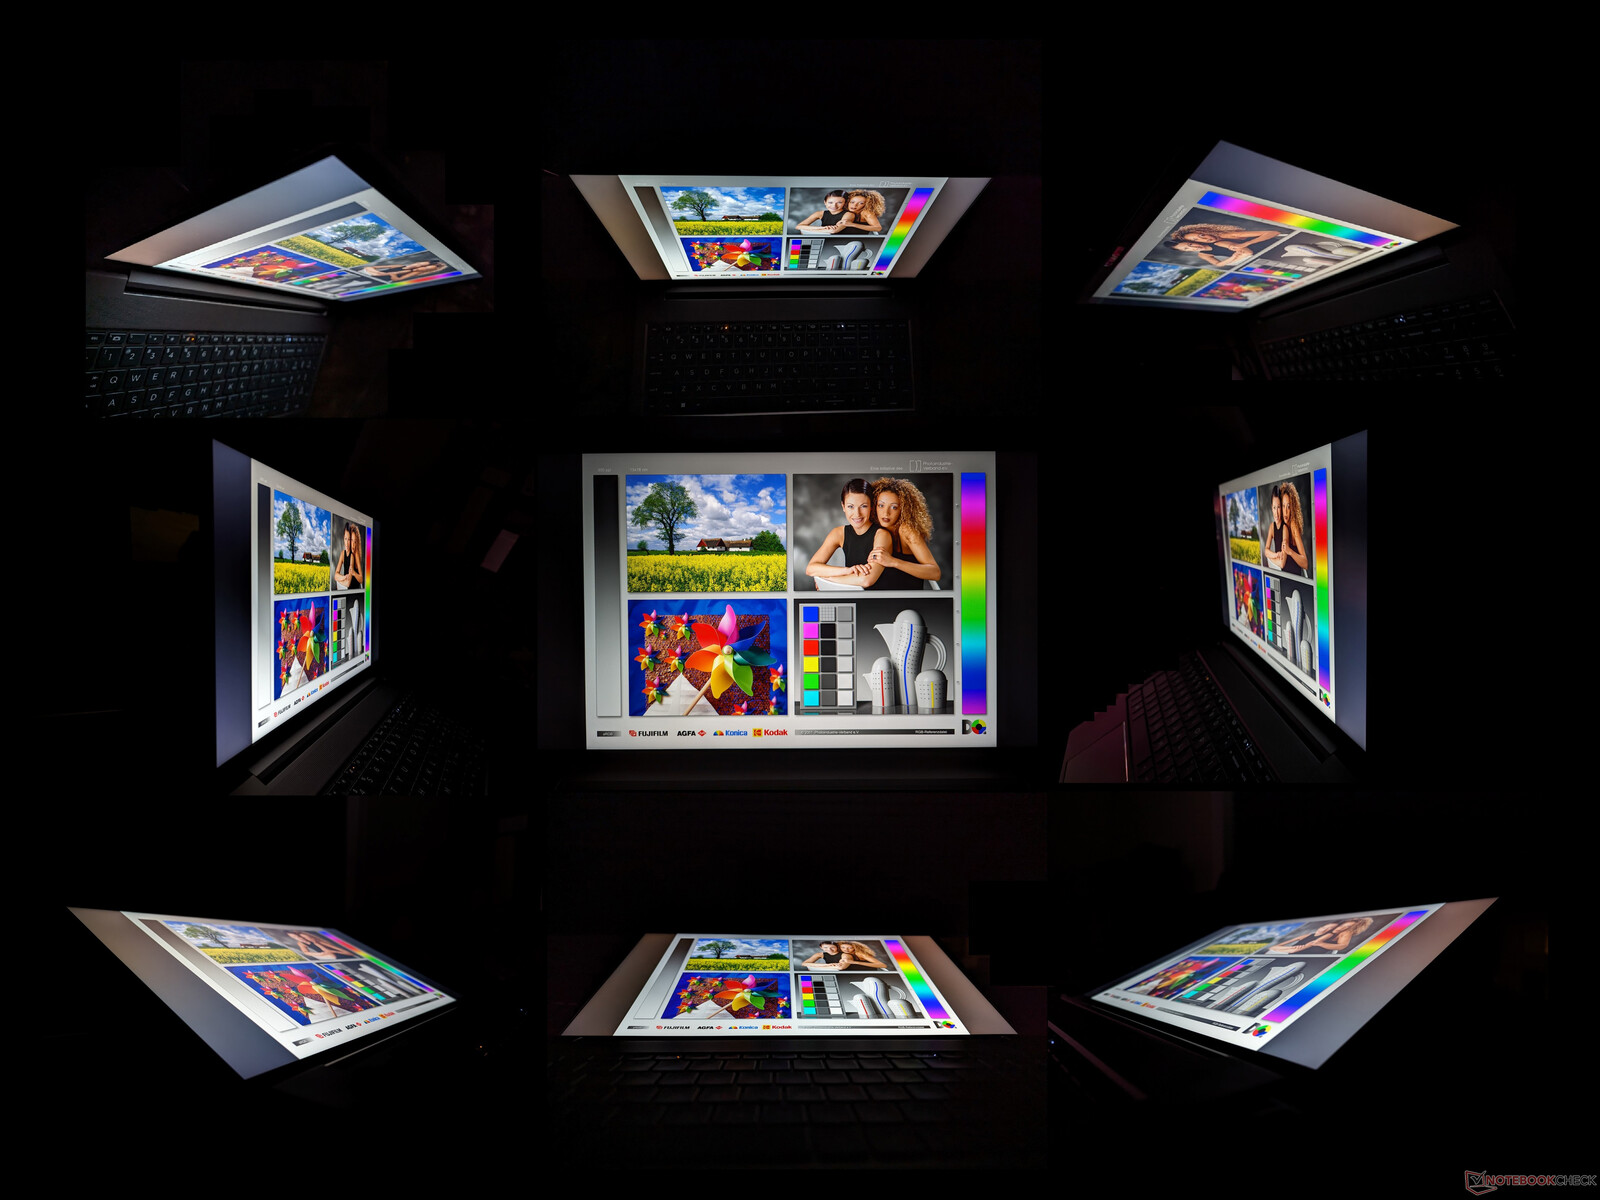
显示屏
该机型提供以下四种哑光显示屏选项:
- 1080p,250 尼特,60% sRGB,触摸屏
- 1080p,250 尼特,60% sRGB,非触摸屏
- 1080p,400 尼特,100% sRGB,非触摸屏
- 1440p,300 尼特,100% sRGB,非触摸屏,120 赫兹
除非必须使用触摸屏,否则我们建议避免使用两个 250 尼特的选项,因为它们都只覆盖 NTSC 的 45%,色彩明显较浅。
由于不明原因,惠普没有为任何 ZBook Power G10 配置提供 4K 选件,尽管 ZBook Power G9 以前就有。我们怀疑这可能是由于供应问题,因为制造商目前正在从 16:9 15.6 英寸面板转向 16:10 16 英寸面板。
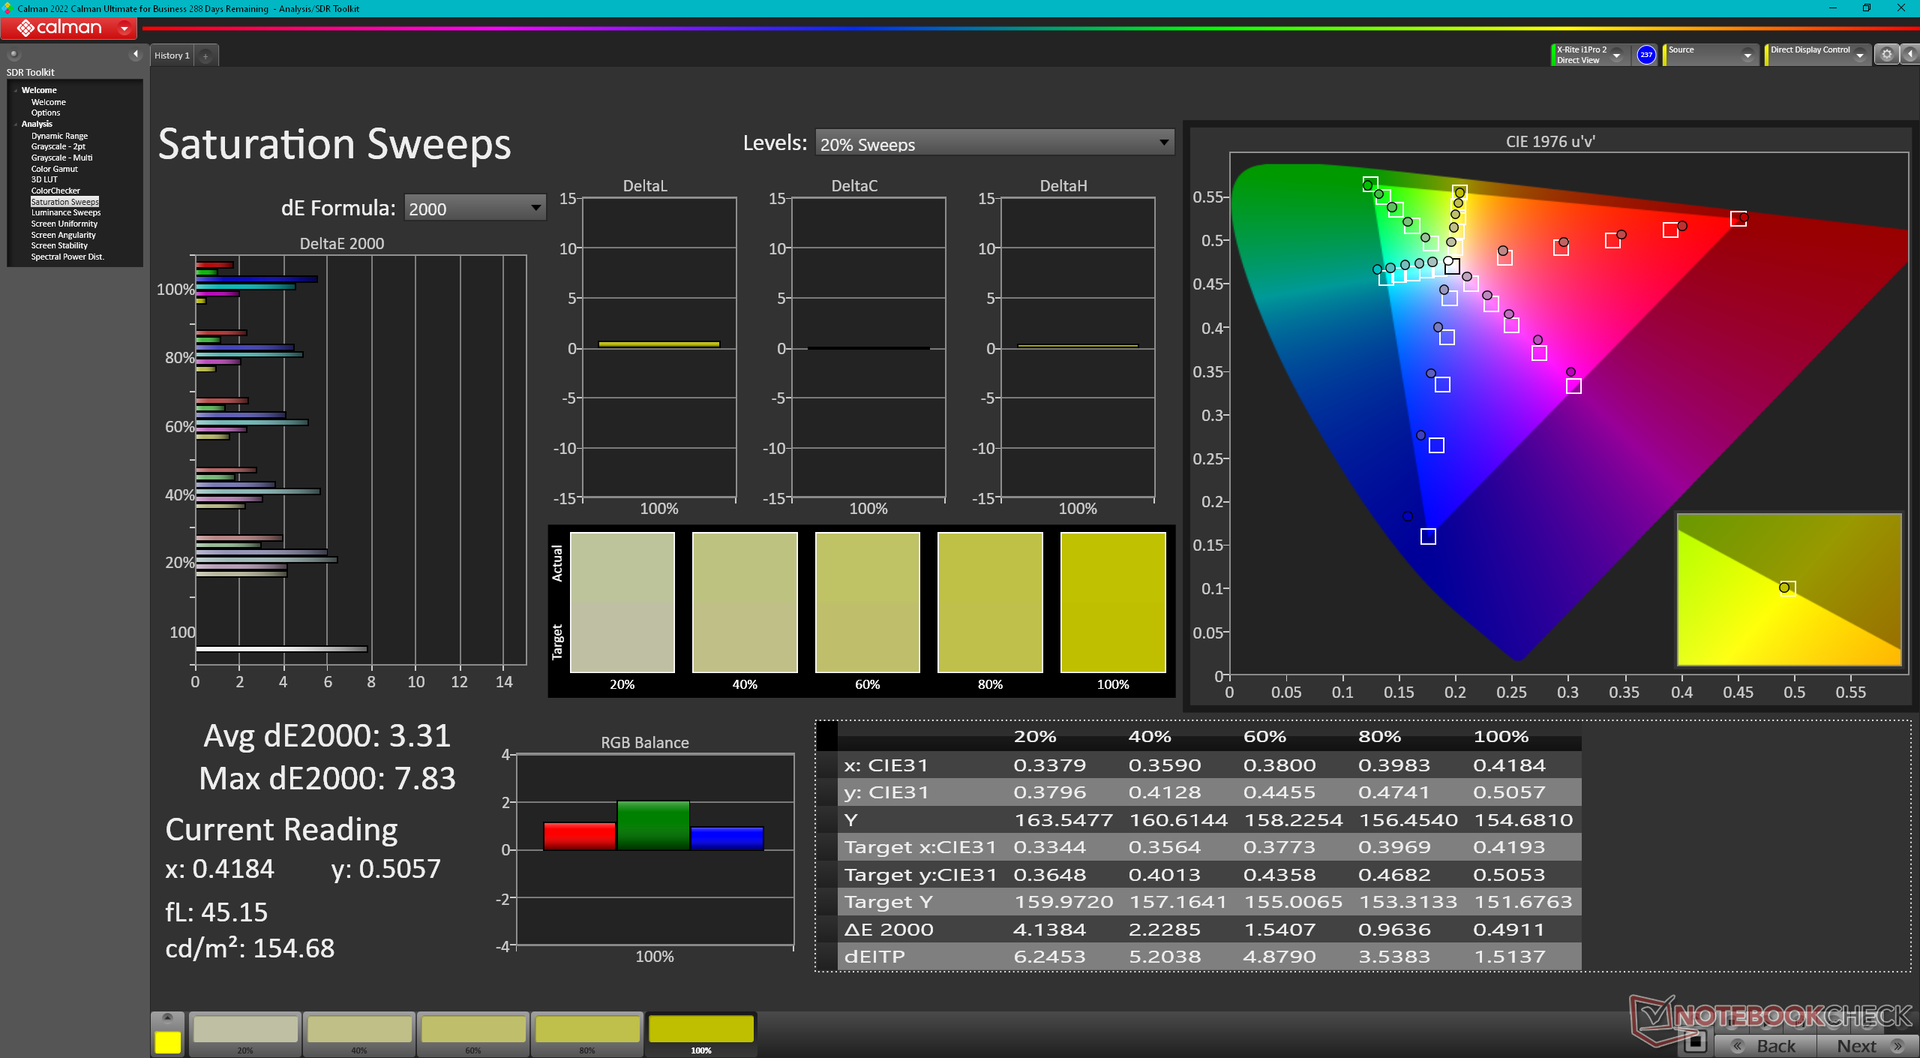
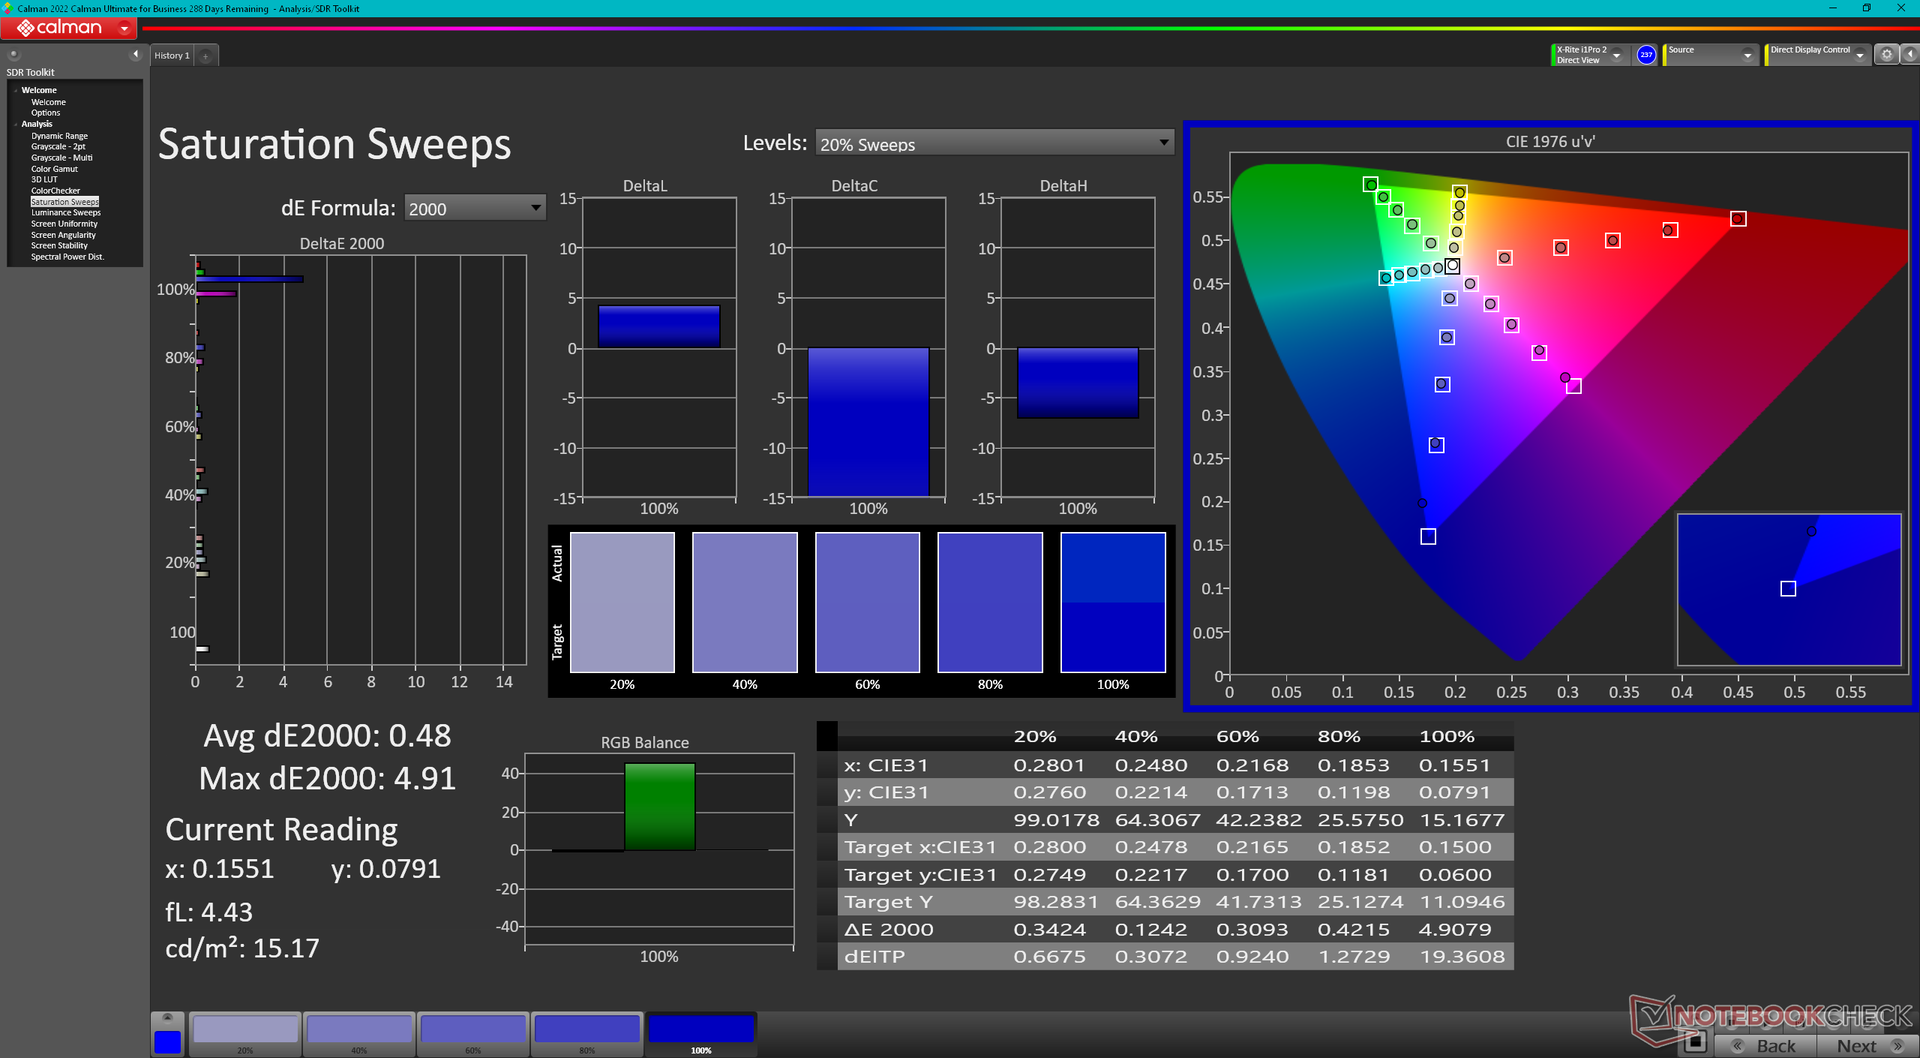
尽管如此,我们的 1440p 面板仍然非常出色,刷新率快、响应时间快、sRGB 色彩准确,适合内容制作甚至游戏。它可能不是 OLED 或 4K,但它仍然是 15.6 英寸 IPS 显示屏中较好的一款。


| |||||||||||||||||||||||||
Brightness Distribution: 83 %
Center on Battery: 313.8 cd/m²
Contrast: 1082:1 (Black: 0.29 cd/m²)
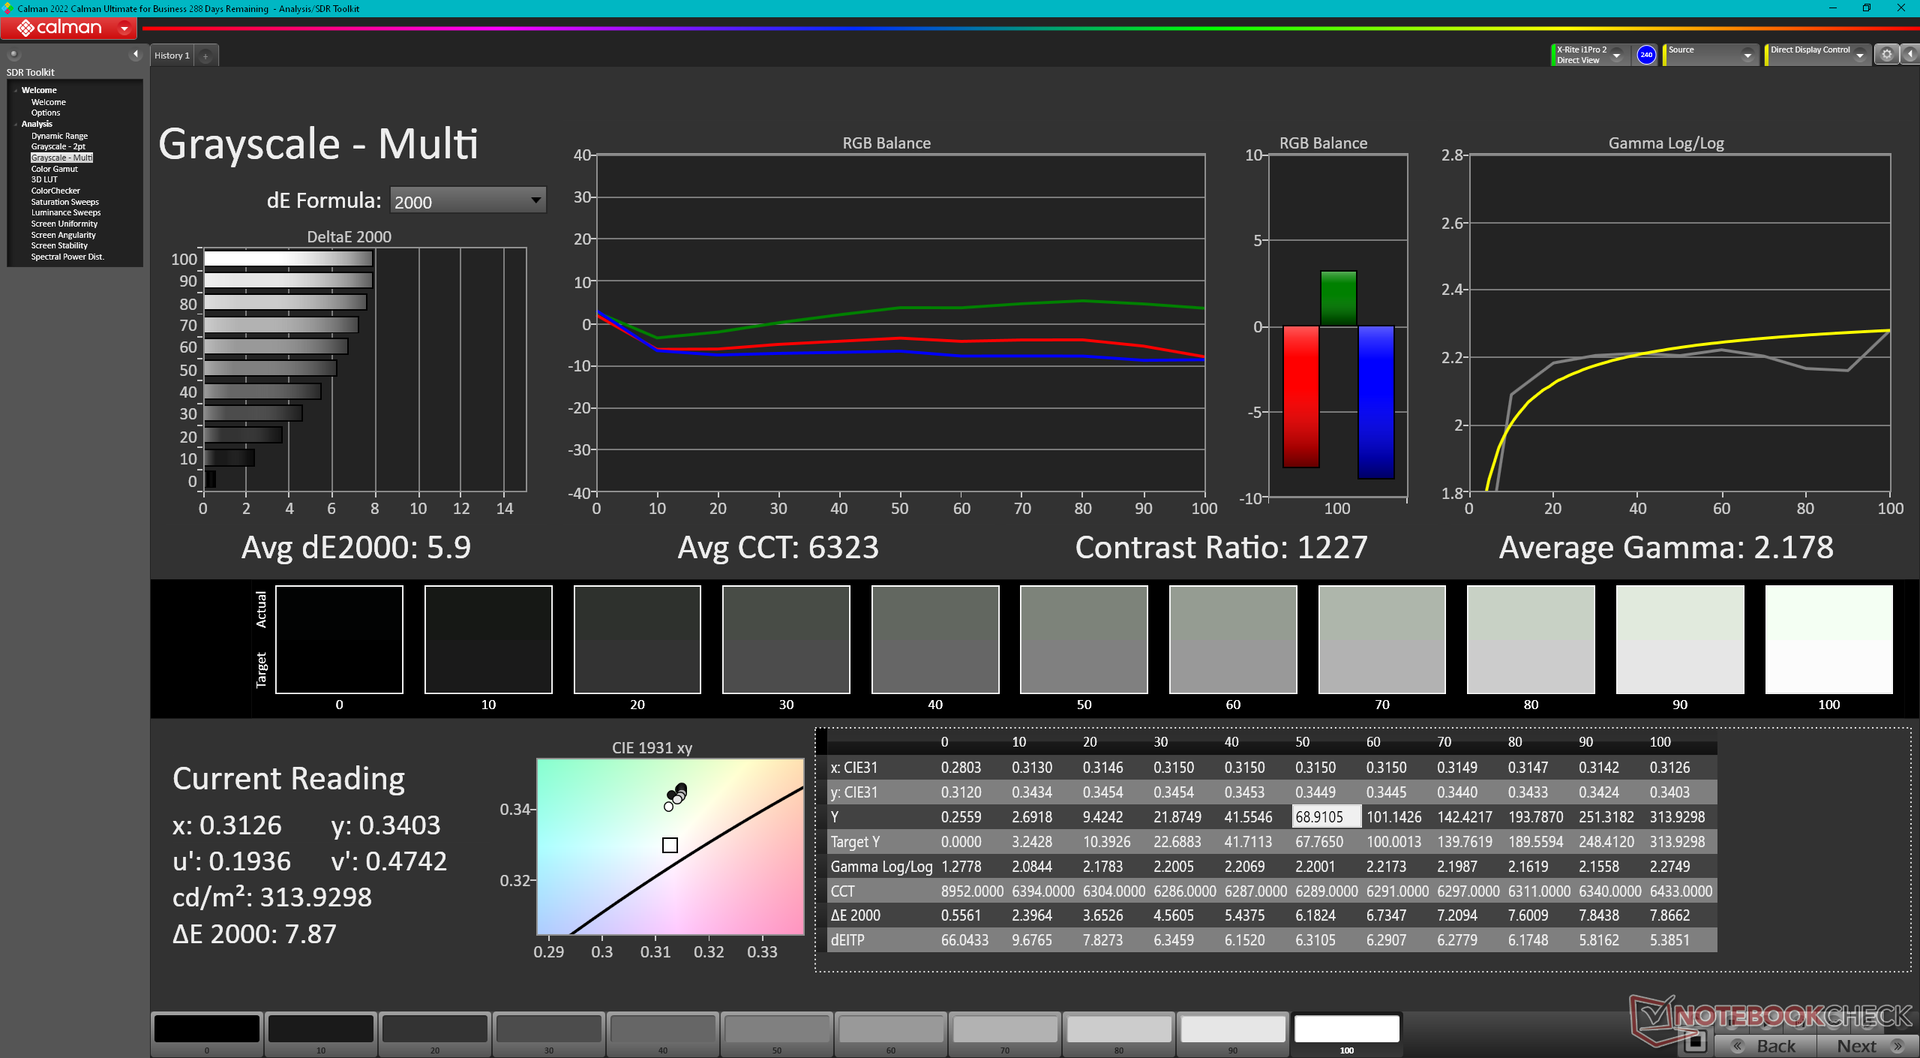
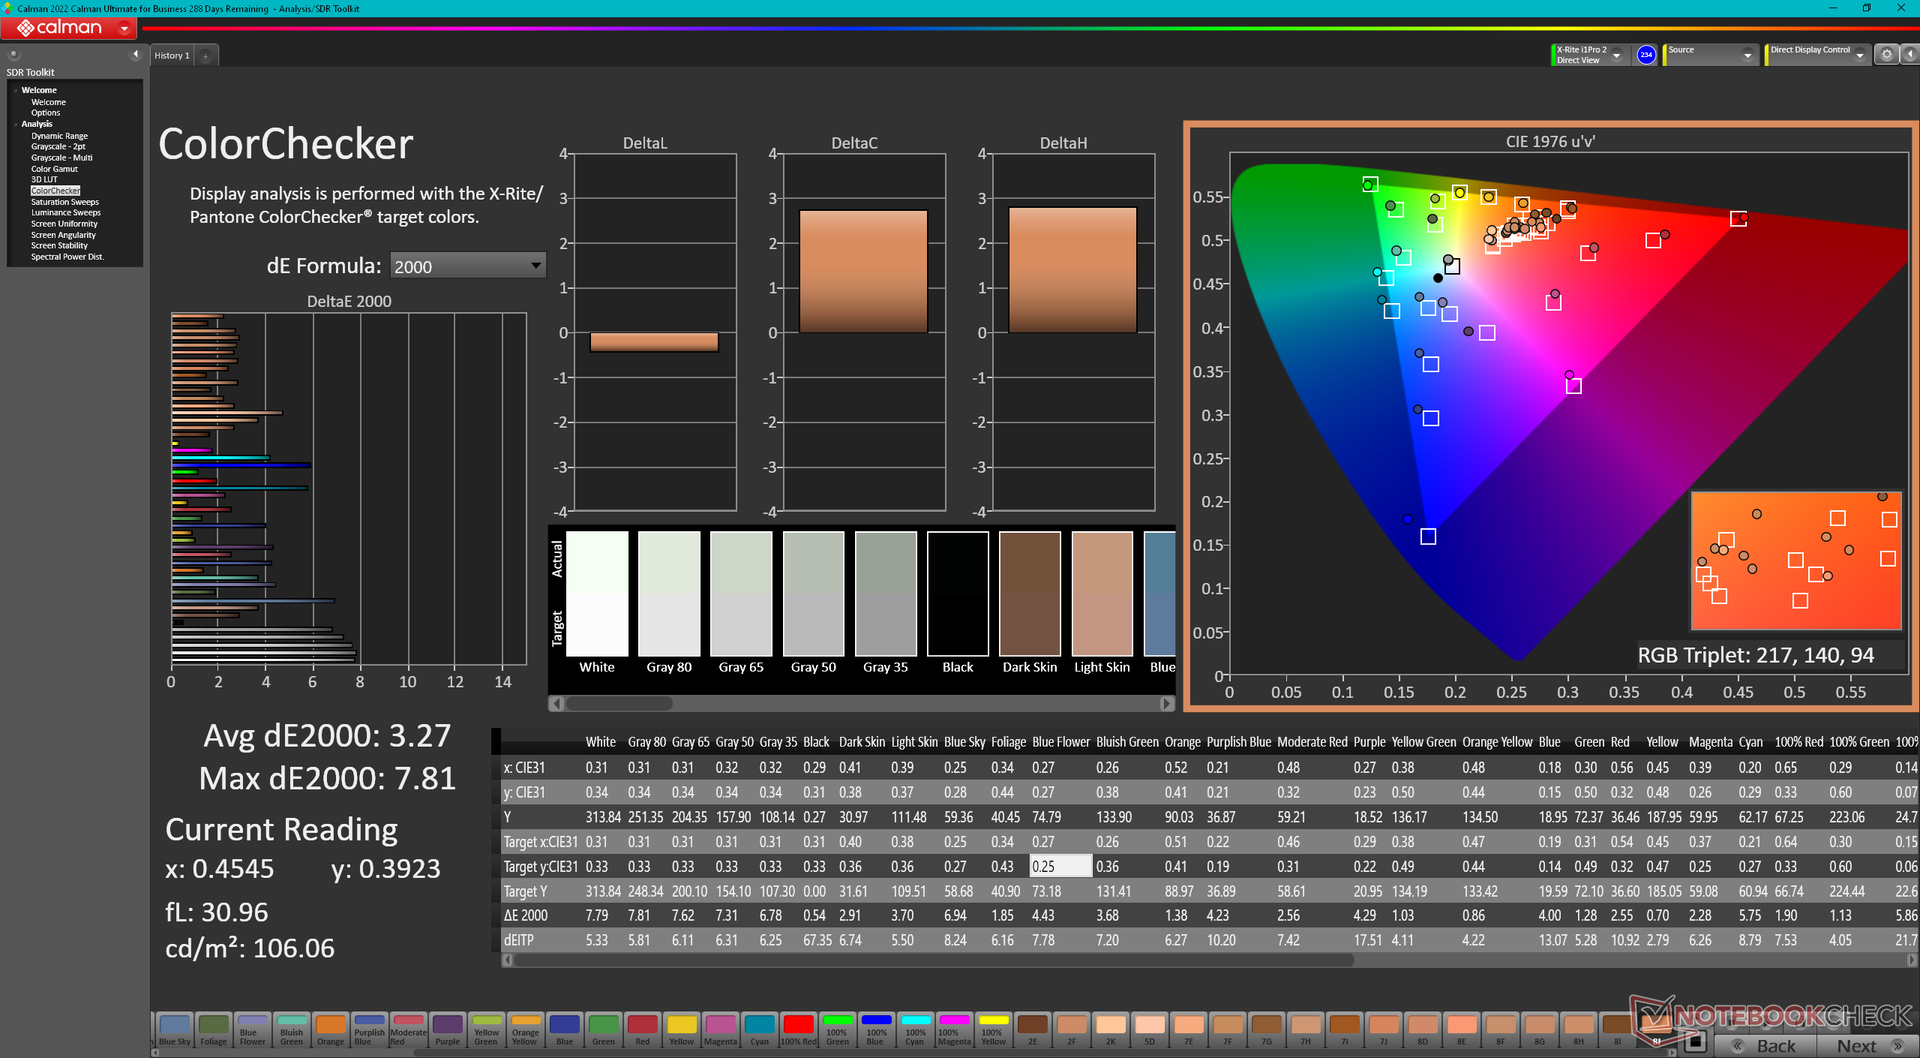
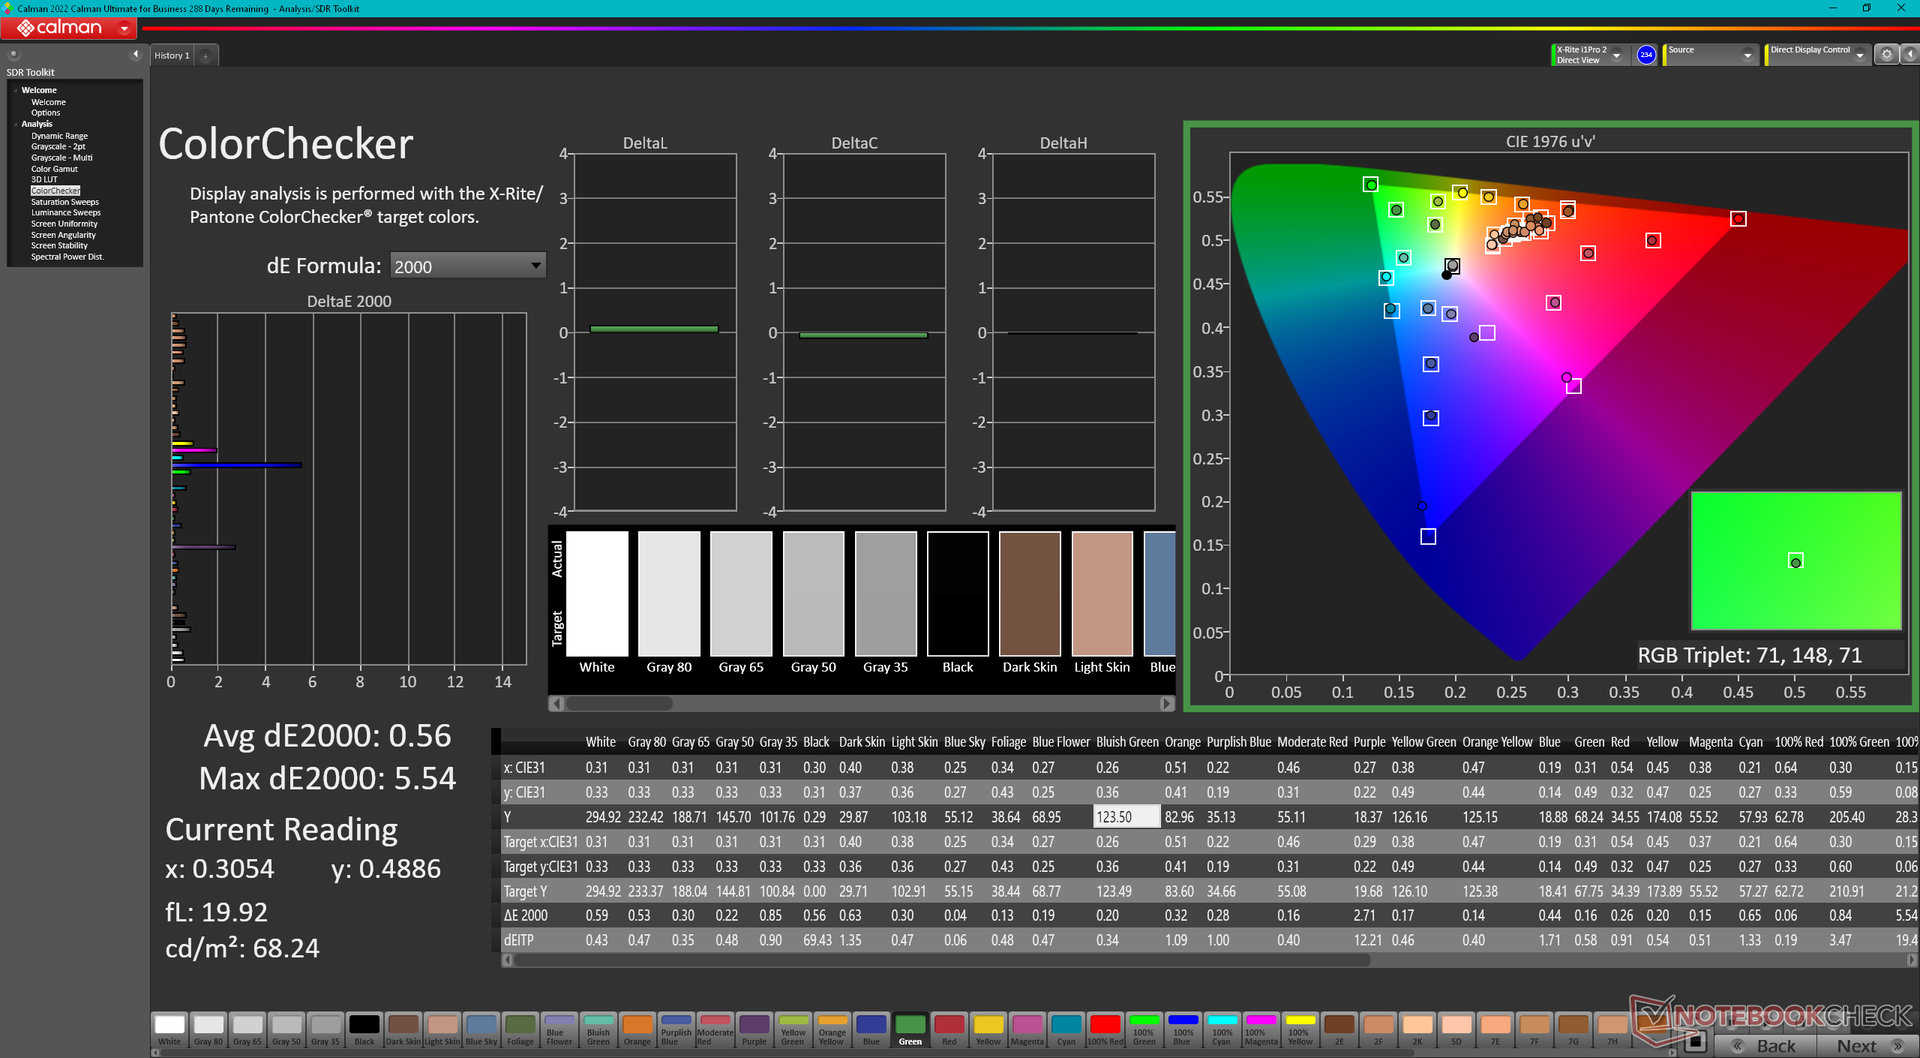
ΔE ColorChecker Calman: 3.27 | ∀{0.5-29.43 Ø4.73}
calibrated: 0.56
ΔE Greyscale Calman: 5.9 | ∀{0.09-98 Ø4.97}
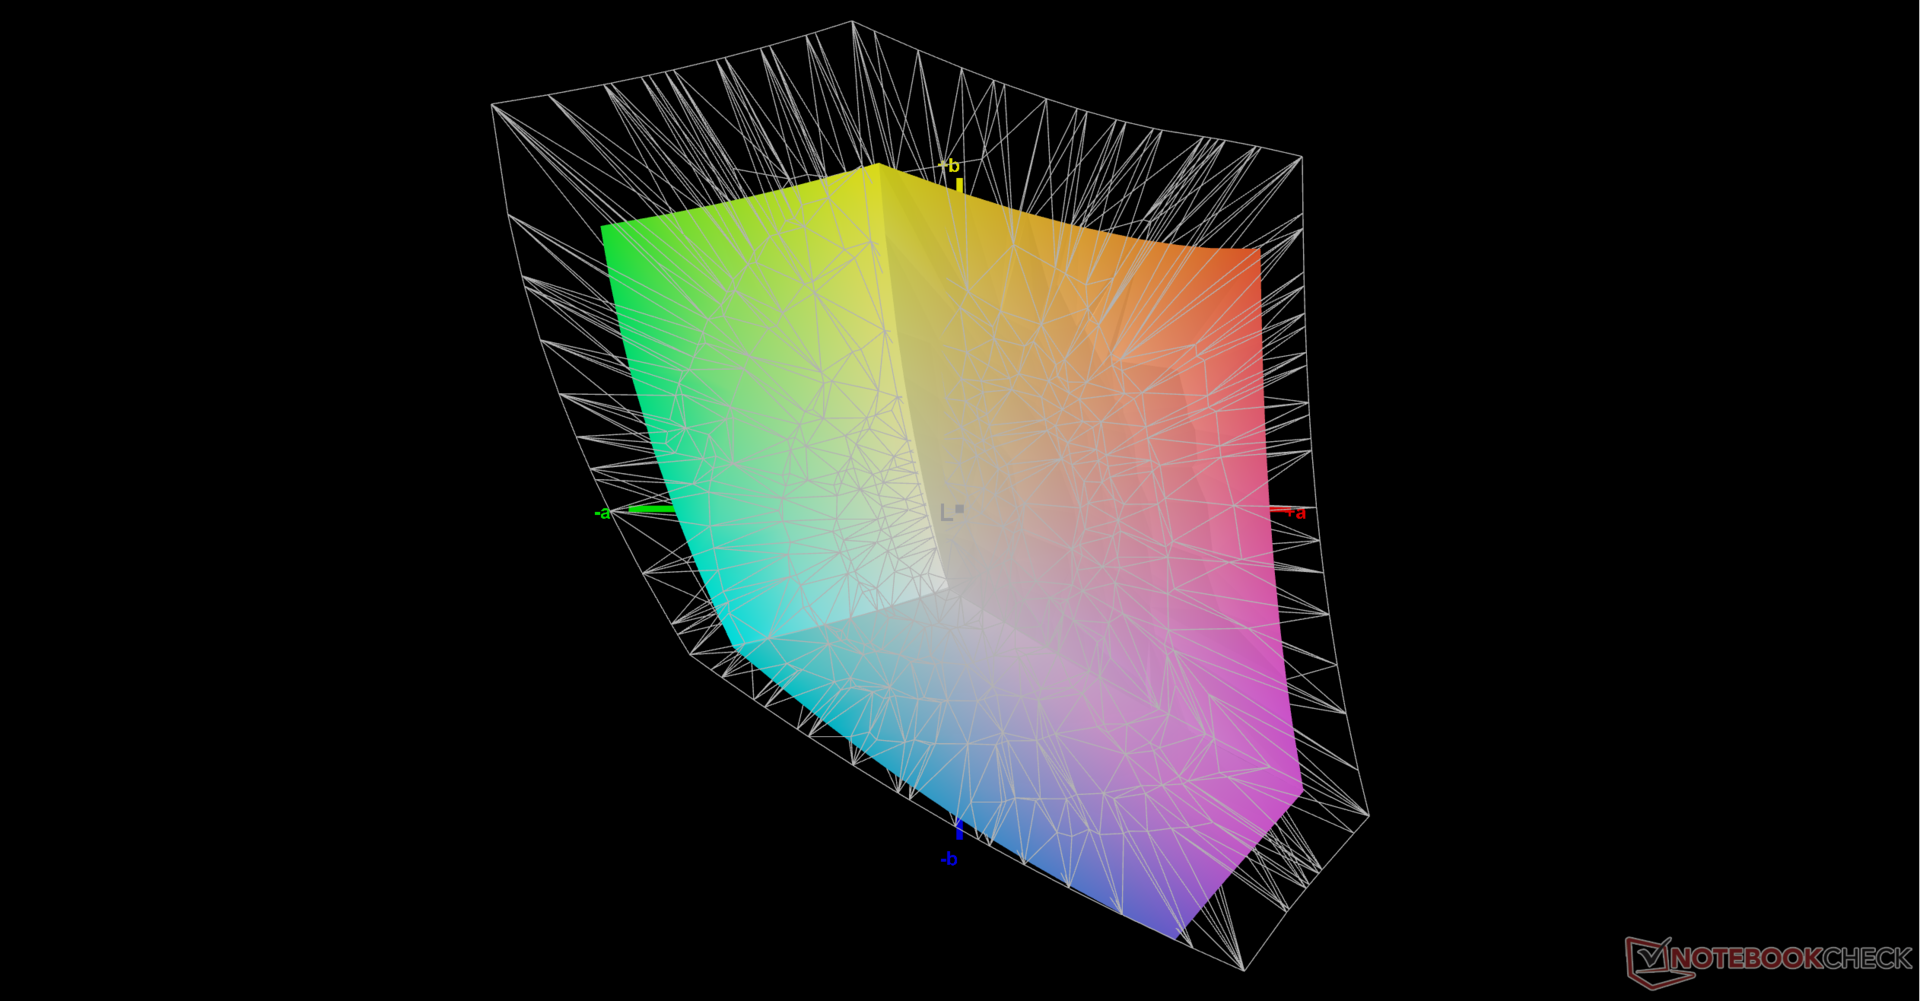
70.5% AdobeRGB 1998 (Argyll 3D)
95.6% sRGB (Argyll 3D)
68.2% Display P3 (Argyll 3D)
Gamma: 2.18
CCT: 6323 K
| HP ZBook Power 15 G10 BOE0B6A, IPS, 2560x1440, 15.6" | HP ZBook Power 15 G9 6B8C4EA LGD073F, IPS, 3840x2160, 15.6" | Lenovo ThinkPad P15v G3 21EM001AGE NE156QUM-N6C, IPS LED, 3840x2160, 15.6" | Dell Precision 5000 5560 Sharp LQ156R1, IPS, 3840x2400, 15.6" | Lenovo ThinkPad P1 G6-21FV000DGE NE160QDM-NY1, IPS, 2560x1600, 16" | Asus ExpertBook B6 Flip B6602FC2 AU Optronics Model: AUOE495, IPS, 2560x1600, 16" | |
|---|---|---|---|---|---|---|
| Display | 1% | 26% | 29% | 1% | 23% | |
| Display P3 Coverage (%) | 68.2 | 69.1 1% | 89.9 32% | 94.9 39% | 68.1 0% | 97.9 44% |
| sRGB Coverage (%) | 95.6 | 97.7 2% | 100 5% | 100 5% | 97.5 2% | 99.89 4% |
| AdobeRGB 1998 Coverage (%) | 70.5 | 69.6 -1% | 99.9 42% | 100 42% | 70.2 0% | 85.52 21% |
| Response Times | -214% | -211% | -228% | 2% | -120% | |
| Response Time Grey 50% / Grey 80% * (ms) | 13 ? | 45.8 ? -252% | 46.7 ? -259% | 47.2 ? -263% | 13.7 ? -5% | 36 ? -177% |
| Response Time Black / White * (ms) | 10.4 ? | 28.6 ? -175% | 27.3 ? -163% | 30.4 ? -192% | 9.6 ? 8% | 17 ? -63% |
| PWM Frequency (Hz) | ||||||
| Screen | 18% | 5% | 7% | 30% | -20% | |
| Brightness middle (cd/m²) | 313.8 | 392 25% | 588 87% | 501.5 60% | 521 66% | 440 40% |
| Brightness (cd/m²) | 302 | 388 28% | 536 77% | 467 55% | 484 60% | 418 38% |
| Brightness Distribution (%) | 83 | 88 6% | 83 0% | 83 0% | 89 7% | 82 -1% |
| Black Level * (cd/m²) | 0.29 | 0.15 48% | 0.38 -31% | 0.44 -52% | 0.36 -24% | 0.3 -3% |
| Contrast (:1) | 1082 | 2613 141% | 1547 43% | 1140 5% | 1447 34% | 1467 36% |
| Colorchecker dE 2000 * | 3.27 | 3.2 2% | 3.9 -19% | 4.73 -45% | 1.2 63% | 2.81 14% |
| Colorchecker dE 2000 max. * | 7.81 | 7 10% | 8.8 -13% | 8.45 -8% | 2.5 68% | 4.62 41% |
| Colorchecker dE 2000 calibrated * | 0.56 | 1.2 -114% | 1 -79% | 0.51 9% | 1 -79% | 2.99 -434% |
| Greyscale dE 2000 * | 5.9 | 4.9 17% | 7.1 -20% | 3.6 39% | 1.4 76% | 0.91 85% |
| Gamma | 2.18 101% | 2.13 103% | 2.12 104% | 2.08 106% | 2.25 98% | 2.2 100% |
| CCT | 6323 103% | 5982 109% | 7268 89% | 6447 101% | 6682 97% | 6600 98% |
| Total Average (Program / Settings) | -65% /
-19% | -60% /
-21% | -64% /
-22% | 11% /
20% | -39% /
-25% |
* ... smaller is better
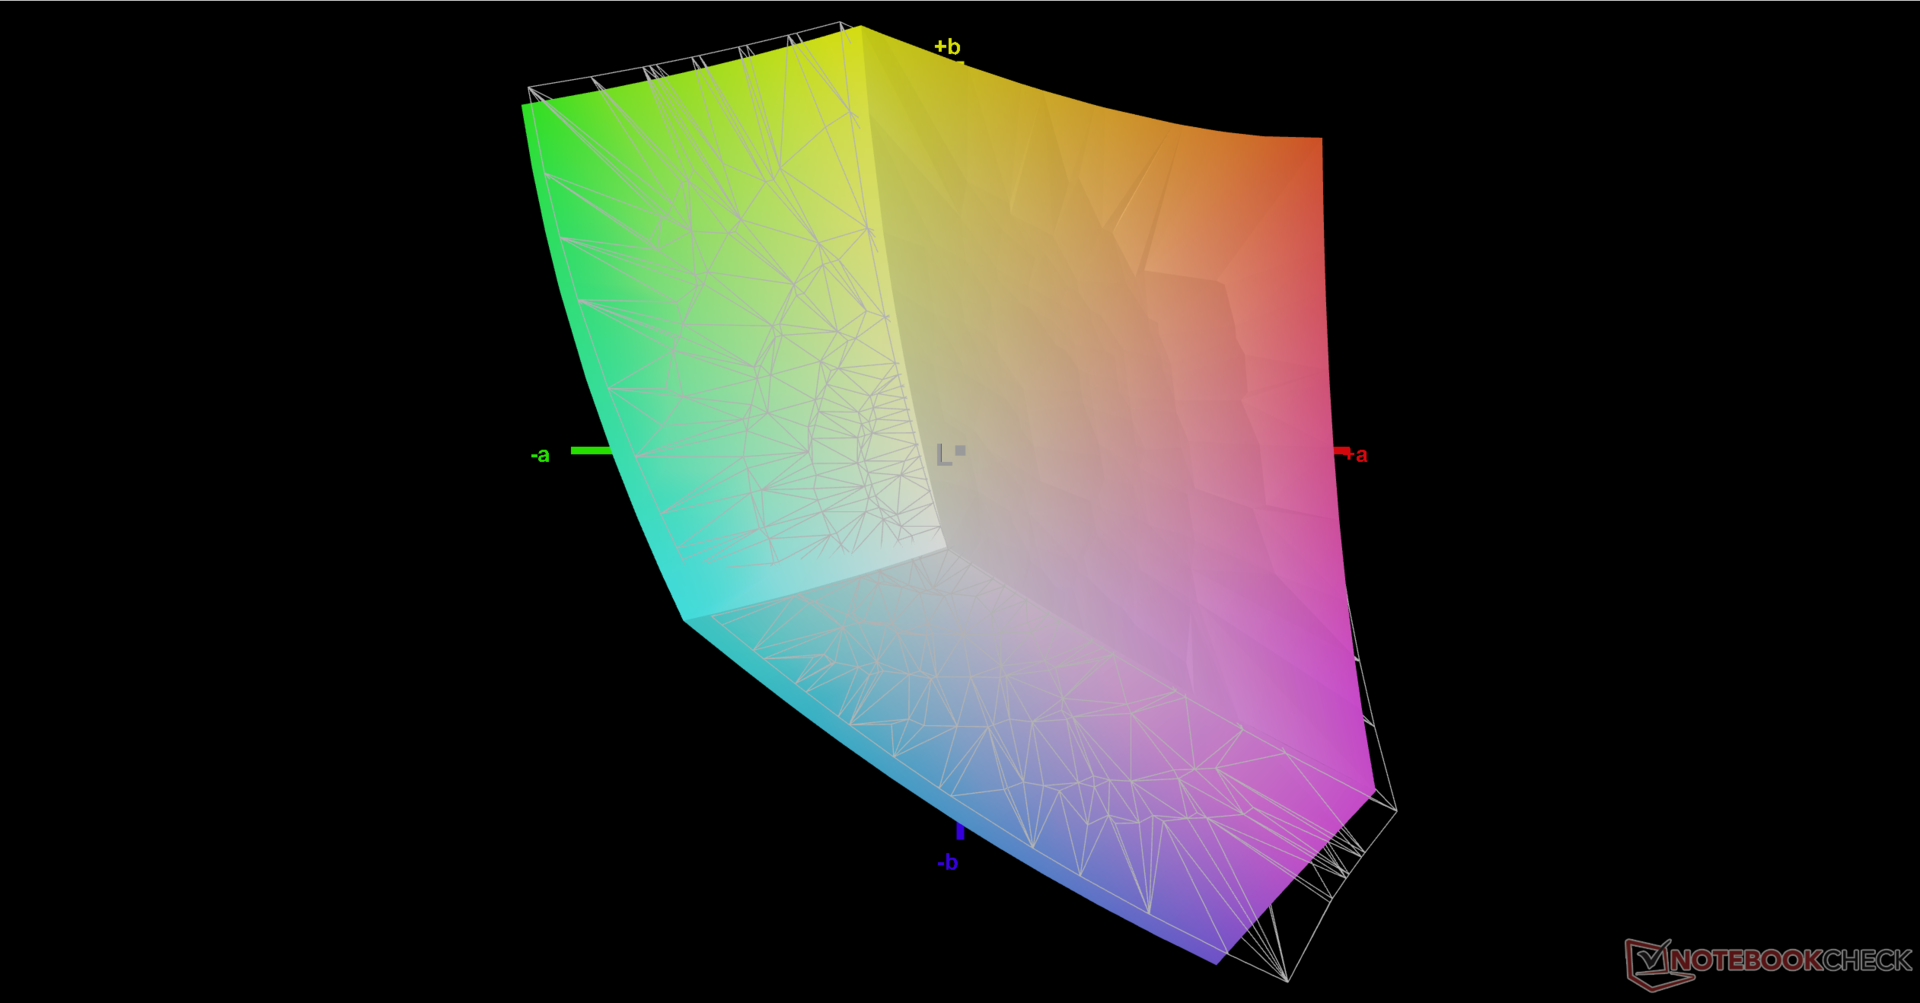
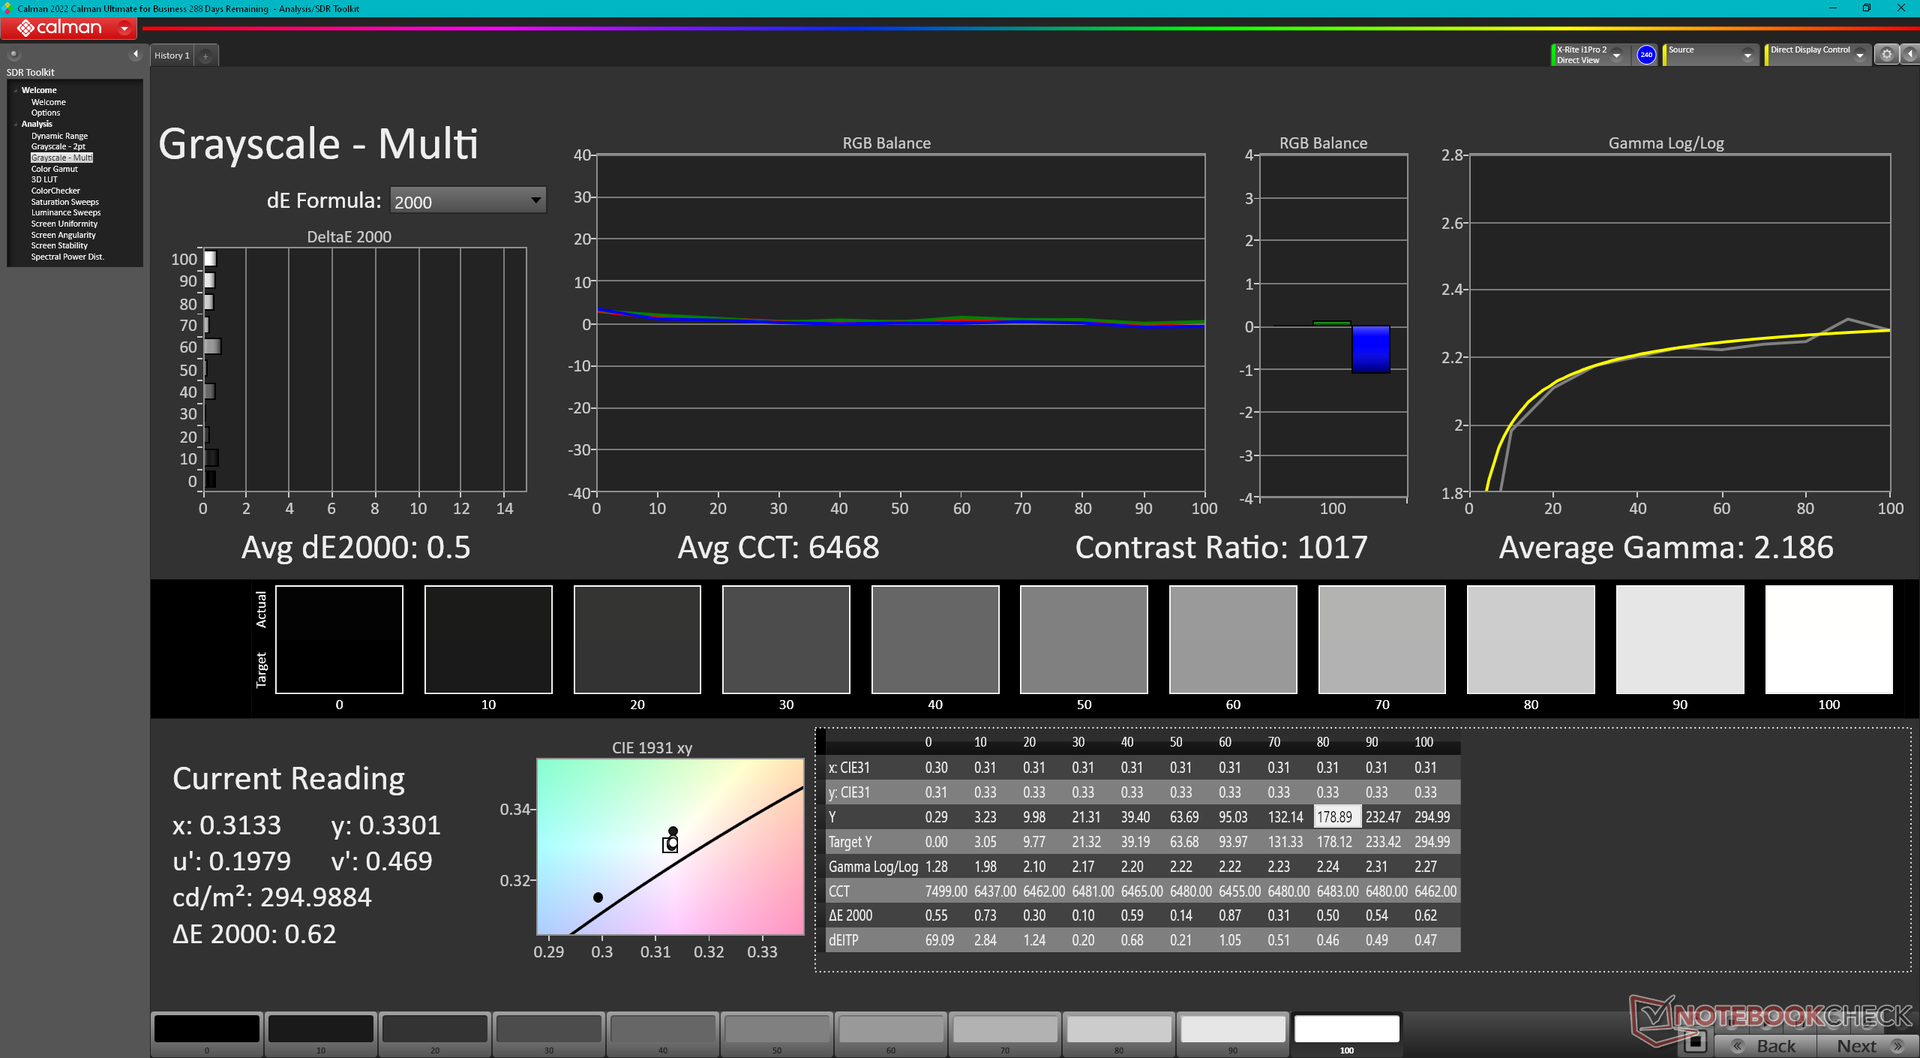
惠普没有在出厂时对该机型进行预校准,这对于 ZBook 级笔记本电脑来说是个遗憾。开箱后的灰度和色彩平均 DeltaE 值分别为 5.9 和 3.27,色温略微偏高。如果自行校准显示屏,平均 DeltaE 值将分别降至 0.5 和 0.56。我们的校准 ICM 文件可在上面免费下载。
Display Response Times
| ↔ Response Time Black to White | ||
|---|---|---|
| 10.4 ms ... rise ↗ and fall ↘ combined | ↗ 5.5 ms rise | 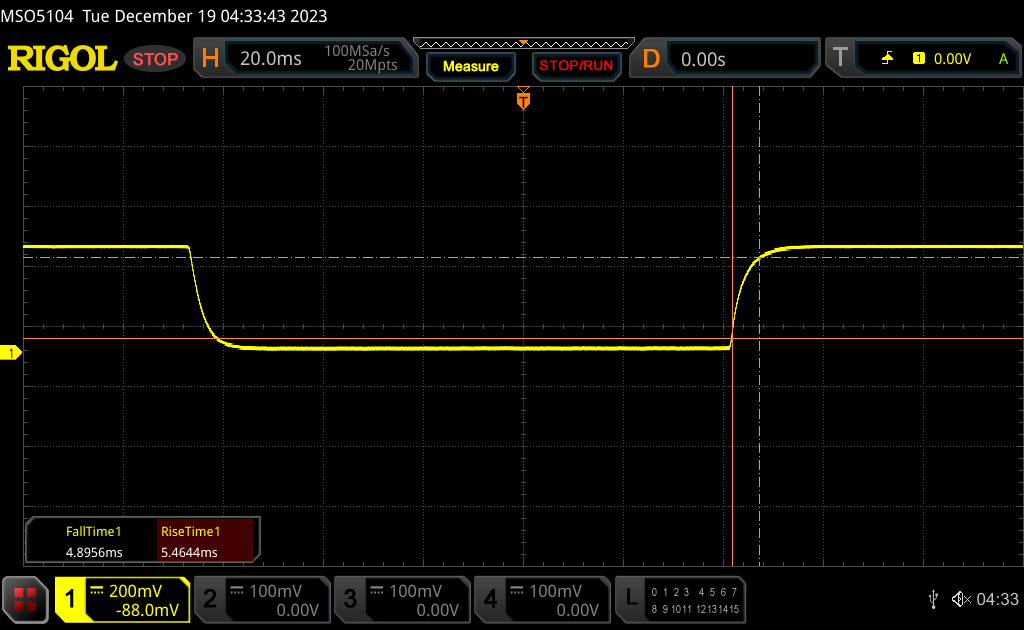 |
| ↘ 4.9 ms fall | ||
| The screen shows good response rates in our tests, but may be too slow for competitive gamers. In comparison, all tested devices range from 0.1 (minimum) to 240 (maximum) ms. » 28 % of all devices are better. This means that the measured response time is better than the average of all tested devices (19.9 ms). | ||
| ↔ Response Time 50% Grey to 80% Grey | ||
| 13 ms ... rise ↗ and fall ↘ combined | ↗ 6.4 ms rise | 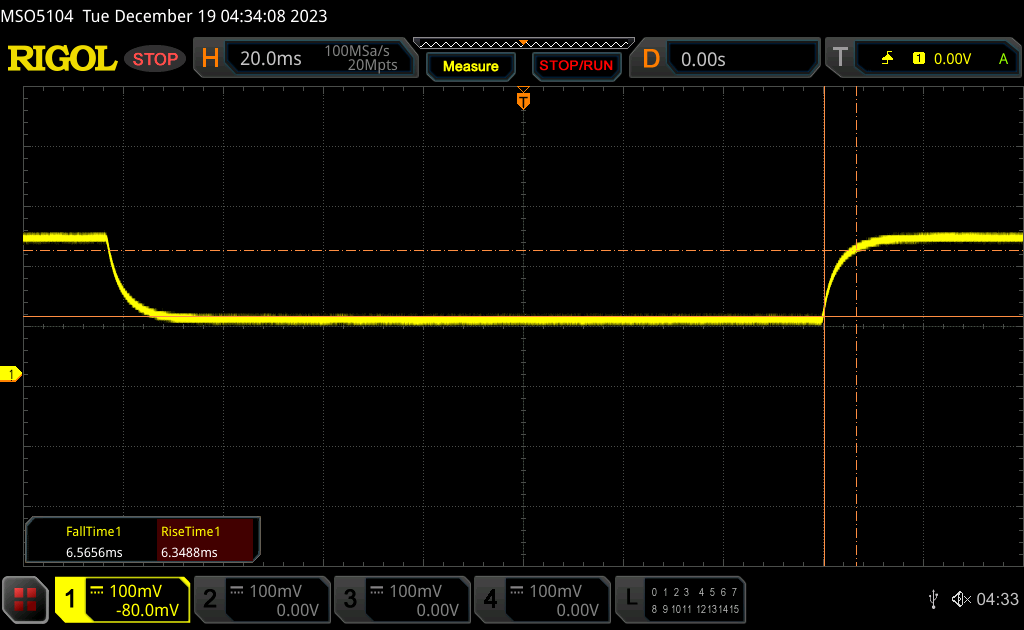 |
| ↘ 6.6 ms fall | ||
| The screen shows good response rates in our tests, but may be too slow for competitive gamers. In comparison, all tested devices range from 0.165 (minimum) to 636 (maximum) ms. » 26 % of all devices are better. This means that the measured response time is better than the average of all tested devices (31.1 ms). | ||
Screen Flickering / PWM (Pulse-Width Modulation)
| Screen flickering / PWM not detected | 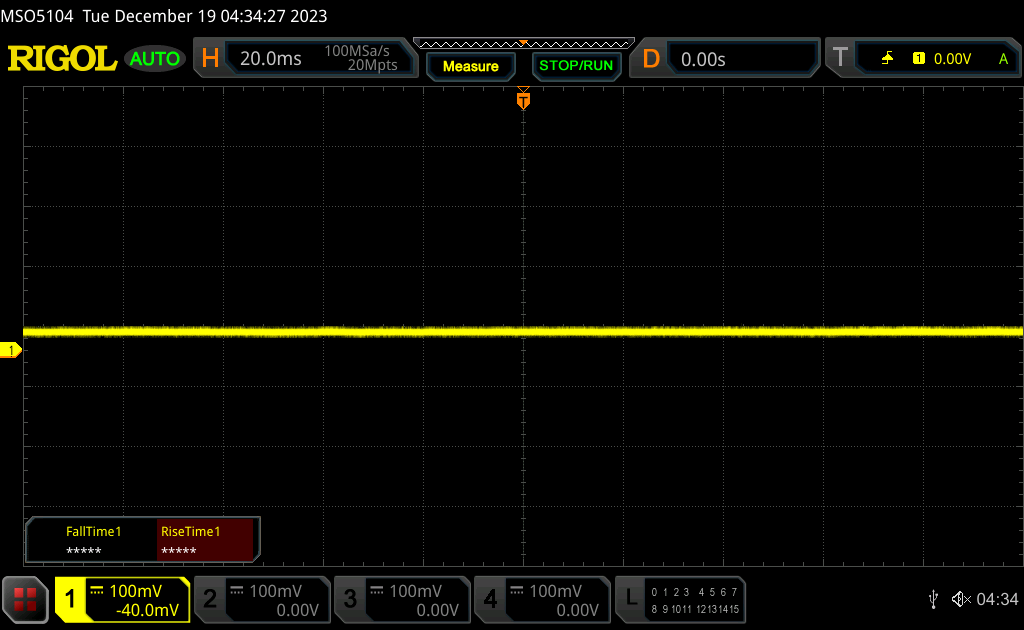 | ||
In comparison: 52 % of all tested devices do not use PWM to dim the display. If PWM was detected, an average of 7804 (minimum: 5 - maximum: 343500) Hz was measured. | |||
性能
测试条件
在运行以下基准测试之前,我们将 Windows 和 Nvidia 控制面板都设置为性能模式。该系统似乎没有惠普提供的任何额外电源配置文件。
如预期的那样支持 Optimus,但没有 ECC VRAM 模式,这与较厚的 ZBook Fury 16 G10更快的 RTX 5000 Ada 不同。
处理器
产品 Ryzen 7 Pro 7840HS多线程性能比 酷睿 i7-12700H多线程性能提高了 20%。但要获得更快的性能,用户应配置英特尔 酷睿 i9-13900H它的运行速度比 Ryzen 7 快 30%。
降级到 Ryzen 5 Pro 7640HS 从 Ryzen 7 Pro 7840HS 降级到 Ryzen 5 Pro 7640HS,预计性能会受到多达 25% 至 30% 的影响。另一方面,升级到 Ryzen 9 Pro 7940HS预计性能提升幅度仅为 5% 至 10%。 联想 ThinkPad Z16 Gen 2.因此,如果配置 Ryzen 9 而不是 Ryzen 7,每美元性能将大幅下降。
Cinebench R15 Multi Loop
Cinebench R23: Multi Core | Single Core
Cinebench R20: CPU (Multi Core) | CPU (Single Core)
Cinebench R15: CPU Multi 64Bit | CPU Single 64Bit
Blender: v2.79 BMW27 CPU
7-Zip 18.03: 7z b 4 | 7z b 4 -mmt1
Geekbench 5.5: Multi-Core | Single-Core
HWBOT x265 Benchmark v2.2: 4k Preset
LibreOffice : 20 Documents To PDF
R Benchmark 2.5: Overall mean
* ... smaller is better
AIDA64: FP32 Ray-Trace | FPU Julia | CPU SHA3 | CPU Queen | FPU SinJulia | FPU Mandel | CPU AES | CPU ZLib | FP64 Ray-Trace | CPU PhotoWorxx
| Performance rating | |
| HP ZBook Power 15 G10 | |
| Average AMD Ryzen 7 PRO 7840HS | |
| Lenovo ThinkPad P1 G6-21FV000DGE | |
| Lenovo ThinkPad P15v G3 21EM001AGE | |
| Asus ExpertBook B6 Flip B6602FC2 | |
| HP ZBook Power 15 G9 6B8C4EA | |
| Dell Precision 5000 5560 -9! | |
| AIDA64 / FP32 Ray-Trace | |
| HP ZBook Power 15 G10 | |
| Average AMD Ryzen 7 PRO 7840HS (25606 - 25776, n=2) | |
| Lenovo ThinkPad P1 G6-21FV000DGE | |
| Asus ExpertBook B6 Flip B6602FC2 | |
| Lenovo ThinkPad P15v G3 21EM001AGE | |
| HP ZBook Power 15 G9 6B8C4EA | |
| AIDA64 / FPU Julia | |
| HP ZBook Power 15 G10 | |
| Average AMD Ryzen 7 PRO 7840HS (107907 - 109059, n=2) | |
| Lenovo ThinkPad P15v G3 21EM001AGE | |
| Lenovo ThinkPad P1 G6-21FV000DGE | |
| Asus ExpertBook B6 Flip B6602FC2 | |
| HP ZBook Power 15 G9 6B8C4EA | |
| AIDA64 / CPU SHA3 | |
| HP ZBook Power 15 G10 | |
| Average AMD Ryzen 7 PRO 7840HS (4631 - 4656, n=2) | |
| Lenovo ThinkPad P1 G6-21FV000DGE | |
| Asus ExpertBook B6 Flip B6602FC2 | |
| HP ZBook Power 15 G9 6B8C4EA | |
| Lenovo ThinkPad P15v G3 21EM001AGE | |
| AIDA64 / CPU Queen | |
| Lenovo ThinkPad P1 G6-21FV000DGE | |
| HP ZBook Power 15 G10 | |
| Average AMD Ryzen 7 PRO 7840HS (97729 - 115640, n=2) | |
| Asus ExpertBook B6 Flip B6602FC2 | |
| Lenovo ThinkPad P15v G3 21EM001AGE | |
| HP ZBook Power 15 G9 6B8C4EA | |
| AIDA64 / FPU SinJulia | |
| HP ZBook Power 15 G10 | |
| Average AMD Ryzen 7 PRO 7840HS (14693 - 14742, n=2) | |
| Lenovo ThinkPad P15v G3 21EM001AGE | |
| Asus ExpertBook B6 Flip B6602FC2 | |
| Lenovo ThinkPad P1 G6-21FV000DGE | |
| HP ZBook Power 15 G9 6B8C4EA | |
| AIDA64 / FPU Mandel | |
| HP ZBook Power 15 G10 | |
| Average AMD Ryzen 7 PRO 7840HS (57502 - 58181, n=2) | |
| Lenovo ThinkPad P15v G3 21EM001AGE | |
| Lenovo ThinkPad P1 G6-21FV000DGE | |
| Asus ExpertBook B6 Flip B6602FC2 | |
| HP ZBook Power 15 G9 6B8C4EA | |
| AIDA64 / CPU AES | |
| Lenovo ThinkPad P15v G3 21EM001AGE | |
| HP ZBook Power 15 G10 | |
| Average AMD Ryzen 7 PRO 7840HS (84454 - 85341, n=2) | |
| Lenovo ThinkPad P1 G6-21FV000DGE | |
| Asus ExpertBook B6 Flip B6602FC2 | |
| HP ZBook Power 15 G9 6B8C4EA | |
| AIDA64 / CPU ZLib | |
| Lenovo ThinkPad P1 G6-21FV000DGE | |
| HP ZBook Power 15 G10 | |
| Average AMD Ryzen 7 PRO 7840HS (1032 - 1043, n=2) | |
| Asus ExpertBook B6 Flip B6602FC2 | |
| HP ZBook Power 15 G9 6B8C4EA | |
| Lenovo ThinkPad P15v G3 21EM001AGE | |
| Dell Precision 5000 5560 | |
| AIDA64 / FP64 Ray-Trace | |
| HP ZBook Power 15 G10 | |
| Average AMD Ryzen 7 PRO 7840HS (13545 - 13800, n=2) | |
| Lenovo ThinkPad P1 G6-21FV000DGE | |
| Asus ExpertBook B6 Flip B6602FC2 | |
| Lenovo ThinkPad P15v G3 21EM001AGE | |
| HP ZBook Power 15 G9 6B8C4EA | |
| AIDA64 / CPU PhotoWorxx | |
| HP ZBook Power 15 G10 | |
| HP ZBook Power 15 G9 6B8C4EA | |
| Asus ExpertBook B6 Flip B6602FC2 | |
| Average AMD Ryzen 7 PRO 7840HS (24325 - 42810, n=2) | |
| Lenovo ThinkPad P1 G6-21FV000DGE | |
| Lenovo ThinkPad P15v G3 21EM001AGE | |
系统性能
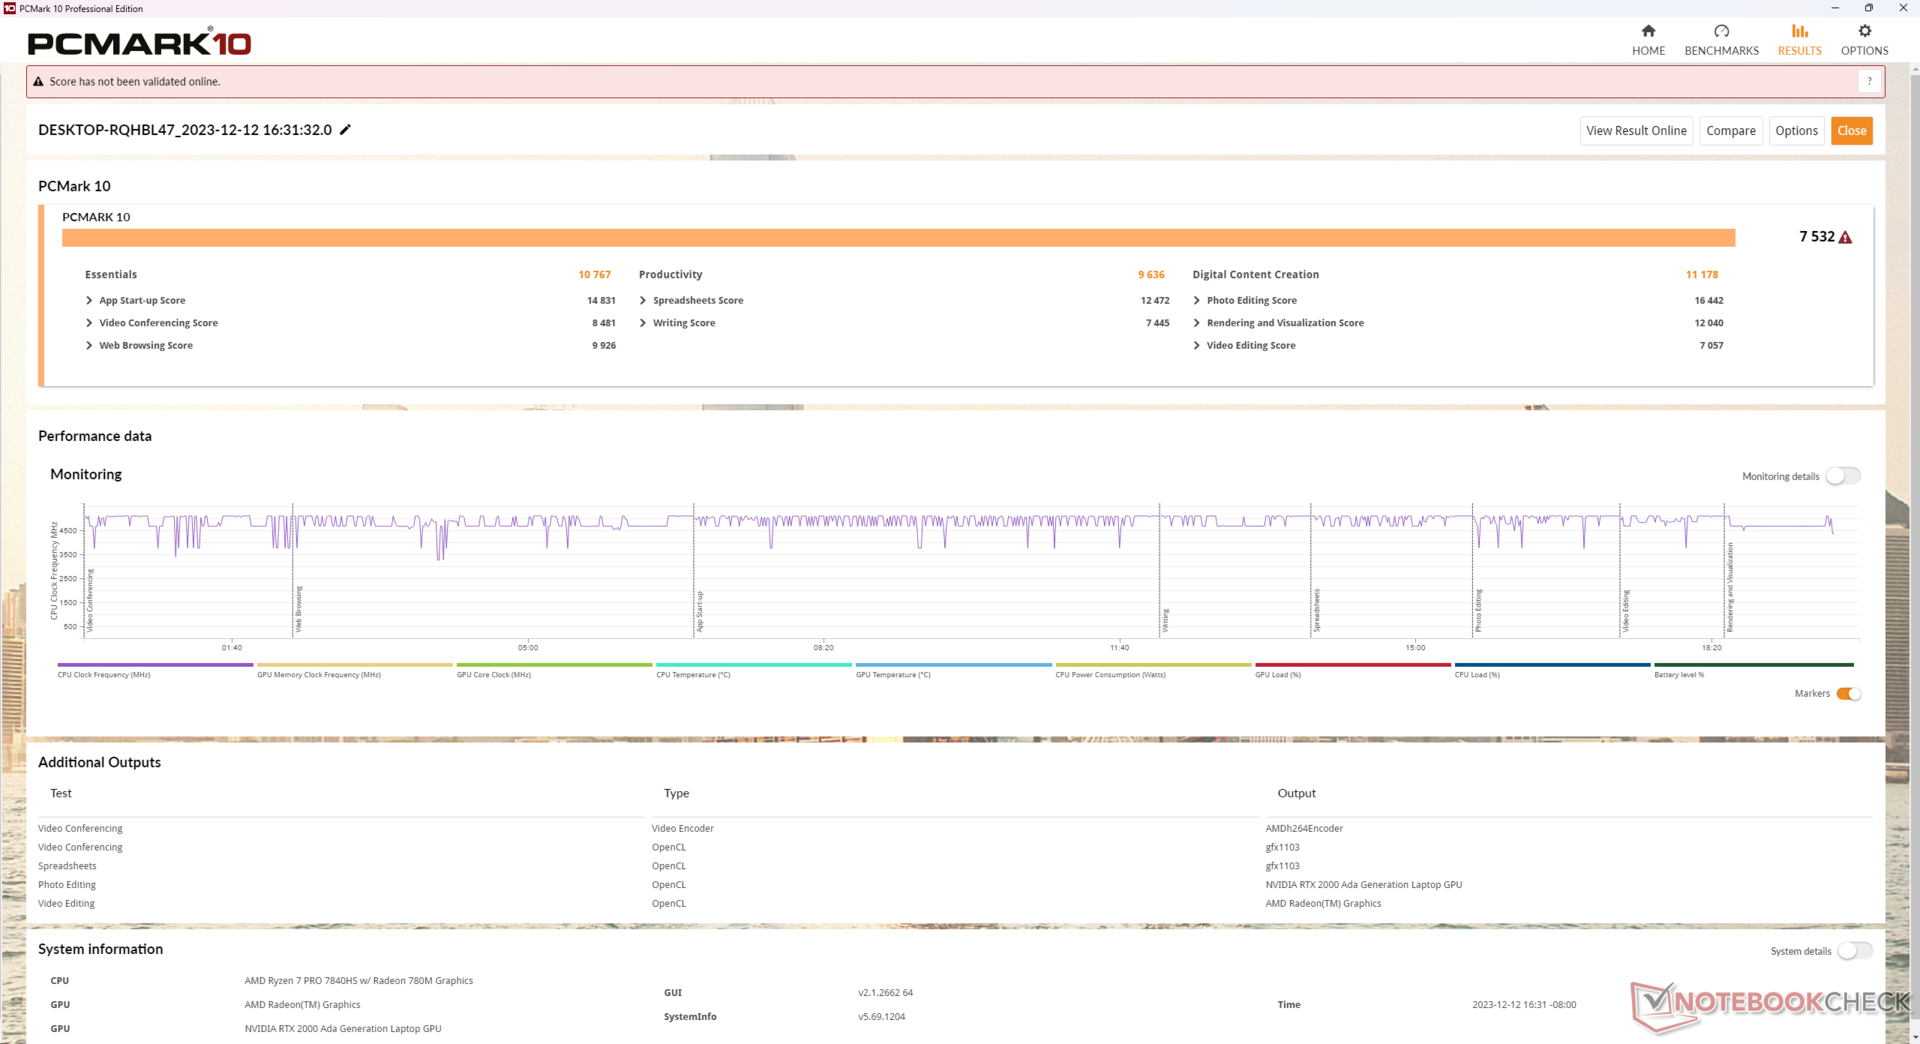
PCMark 测试结果非常出色,分数始终高于其他采用老式 Nvidia RTX A2000 的工作站,包括 ZBook Power 15 G9。快速的 5600 MHz 内存也是一大亮点,AIDA64 内存的高分就是明证。
CrossMark: Overall | Productivity | Creativity | Responsiveness
WebXPRT 3: Overall
WebXPRT 4: Overall
Mozilla Kraken 1.1: Total
| PCMark 10 / Score | |
| HP ZBook Power 15 G10 | |
| Average AMD Ryzen 7 PRO 7840HS, NVIDIA RTX 2000 Ada Generation Laptop (n=1) | |
| Lenovo ThinkPad P1 G6-21FV000DGE | |
| Asus ExpertBook B6 Flip B6602FC2 | |
| Dell Precision 5000 5560 | |
| Lenovo ThinkPad P15v G3 21EM001AGE | |
| HP ZBook Power 15 G9 6B8C4EA | |
| PCMark 10 / Essentials | |
| Lenovo ThinkPad P1 G6-21FV000DGE | |
| Asus ExpertBook B6 Flip B6602FC2 | |
| HP ZBook Power 15 G10 | |
| Average AMD Ryzen 7 PRO 7840HS, NVIDIA RTX 2000 Ada Generation Laptop (n=1) | |
| Dell Precision 5000 5560 | |
| Lenovo ThinkPad P15v G3 21EM001AGE | |
| HP ZBook Power 15 G9 6B8C4EA | |
| PCMark 10 / Productivity | |
| Asus ExpertBook B6 Flip B6602FC2 | |
| Lenovo ThinkPad P1 G6-21FV000DGE | |
| HP ZBook Power 15 G10 | |
| Average AMD Ryzen 7 PRO 7840HS, NVIDIA RTX 2000 Ada Generation Laptop (n=1) | |
| Dell Precision 5000 5560 | |
| Lenovo ThinkPad P15v G3 21EM001AGE | |
| HP ZBook Power 15 G9 6B8C4EA | |
| PCMark 10 / Digital Content Creation | |
| HP ZBook Power 15 G10 | |
| Average AMD Ryzen 7 PRO 7840HS, NVIDIA RTX 2000 Ada Generation Laptop (n=1) | |
| Lenovo ThinkPad P1 G6-21FV000DGE | |
| Asus ExpertBook B6 Flip B6602FC2 | |
| Lenovo ThinkPad P15v G3 21EM001AGE | |
| HP ZBook Power 15 G9 6B8C4EA | |
| Dell Precision 5000 5560 | |
| CrossMark / Overall | |
| Asus ExpertBook B6 Flip B6602FC2 | |
| Lenovo ThinkPad P1 G6-21FV000DGE | |
| HP ZBook Power 15 G9 6B8C4EA | |
| HP ZBook Power 15 G10 | |
| Average AMD Ryzen 7 PRO 7840HS, NVIDIA RTX 2000 Ada Generation Laptop (n=1) | |
| Lenovo ThinkPad P15v G3 21EM001AGE | |
| CrossMark / Productivity | |
| Asus ExpertBook B6 Flip B6602FC2 | |
| Lenovo ThinkPad P1 G6-21FV000DGE | |
| HP ZBook Power 15 G10 | |
| Average AMD Ryzen 7 PRO 7840HS, NVIDIA RTX 2000 Ada Generation Laptop (n=1) | |
| HP ZBook Power 15 G9 6B8C4EA | |
| Lenovo ThinkPad P15v G3 21EM001AGE | |
| CrossMark / Creativity | |
| Asus ExpertBook B6 Flip B6602FC2 | |
| Lenovo ThinkPad P1 G6-21FV000DGE | |
| HP ZBook Power 15 G9 6B8C4EA | |
| HP ZBook Power 15 G10 | |
| Average AMD Ryzen 7 PRO 7840HS, NVIDIA RTX 2000 Ada Generation Laptop (n=1) | |
| Lenovo ThinkPad P15v G3 21EM001AGE | |
| CrossMark / Responsiveness | |
| Asus ExpertBook B6 Flip B6602FC2 | |
| Lenovo ThinkPad P1 G6-21FV000DGE | |
| HP ZBook Power 15 G9 6B8C4EA | |
| HP ZBook Power 15 G10 | |
| Average AMD Ryzen 7 PRO 7840HS, NVIDIA RTX 2000 Ada Generation Laptop (n=1) | |
| Lenovo ThinkPad P15v G3 21EM001AGE | |
| WebXPRT 3 / Overall | |
| Lenovo ThinkPad P1 G6-21FV000DGE | |
| HP ZBook Power 15 G10 | |
| Average AMD Ryzen 7 PRO 7840HS, NVIDIA RTX 2000 Ada Generation Laptop (n=1) | |
| Asus ExpertBook B6 Flip B6602FC2 | |
| HP ZBook Power 15 G9 6B8C4EA | |
| Dell Precision 5000 5560 | |
| Lenovo ThinkPad P15v G3 21EM001AGE | |
| WebXPRT 4 / Overall | |
| Lenovo ThinkPad P1 G6-21FV000DGE | |
| Asus ExpertBook B6 Flip B6602FC2 | |
| HP ZBook Power 15 G9 6B8C4EA | |
| HP ZBook Power 15 G10 | |
| Average AMD Ryzen 7 PRO 7840HS, NVIDIA RTX 2000 Ada Generation Laptop (n=1) | |
| Lenovo ThinkPad P15v G3 21EM001AGE | |
| Mozilla Kraken 1.1 / Total | |
| Lenovo ThinkPad P15v G3 21EM001AGE | |
| Dell Precision 5000 5560 | |
| HP ZBook Power 15 G10 | |
| Average AMD Ryzen 7 PRO 7840HS, NVIDIA RTX 2000 Ada Generation Laptop (n=1) | |
| HP ZBook Power 15 G9 6B8C4EA | |
| Asus ExpertBook B6 Flip B6602FC2 | |
| Lenovo ThinkPad P1 G6-21FV000DGE | |
* ... smaller is better
| PCMark 10 Score | 7532 points | |
Help | ||
| AIDA64 / Memory Copy | |
| HP ZBook Power 15 G10 | |
| HP ZBook Power 15 G9 6B8C4EA | |
| Asus ExpertBook B6 Flip B6602FC2 | |
| Average AMD Ryzen 7 PRO 7840HS (34323 - 67943, n=2) | |
| Lenovo ThinkPad P1 G6-21FV000DGE | |
| Lenovo ThinkPad P15v G3 21EM001AGE | |
| AIDA64 / Memory Read | |
| HP ZBook Power 15 G9 6B8C4EA | |
| HP ZBook Power 15 G10 | |
| Asus ExpertBook B6 Flip B6602FC2 | |
| Average AMD Ryzen 7 PRO 7840HS (30787 - 61660, n=2) | |
| Lenovo ThinkPad P1 G6-21FV000DGE | |
| Lenovo ThinkPad P15v G3 21EM001AGE | |
| AIDA64 / Memory Write | |
| HP ZBook Power 15 G10 | |
| HP ZBook Power 15 G9 6B8C4EA | |
| Average AMD Ryzen 7 PRO 7840HS (39362 - 83167, n=2) | |
| Asus ExpertBook B6 Flip B6602FC2 | |
| Lenovo ThinkPad P1 G6-21FV000DGE | |
| Lenovo ThinkPad P15v G3 21EM001AGE | |
| AIDA64 / Memory Latency | |
| Average AMD Ryzen 7 PRO 7840HS (99.6 - 101.2, n=2) | |
| HP ZBook Power 15 G10 | |
| Lenovo ThinkPad P15v G3 21EM001AGE | |
| Asus ExpertBook B6 Flip B6602FC2 | |
| HP ZBook Power 15 G9 6B8C4EA | |
| Lenovo ThinkPad P1 G6-21FV000DGE | |
* ... smaller is better
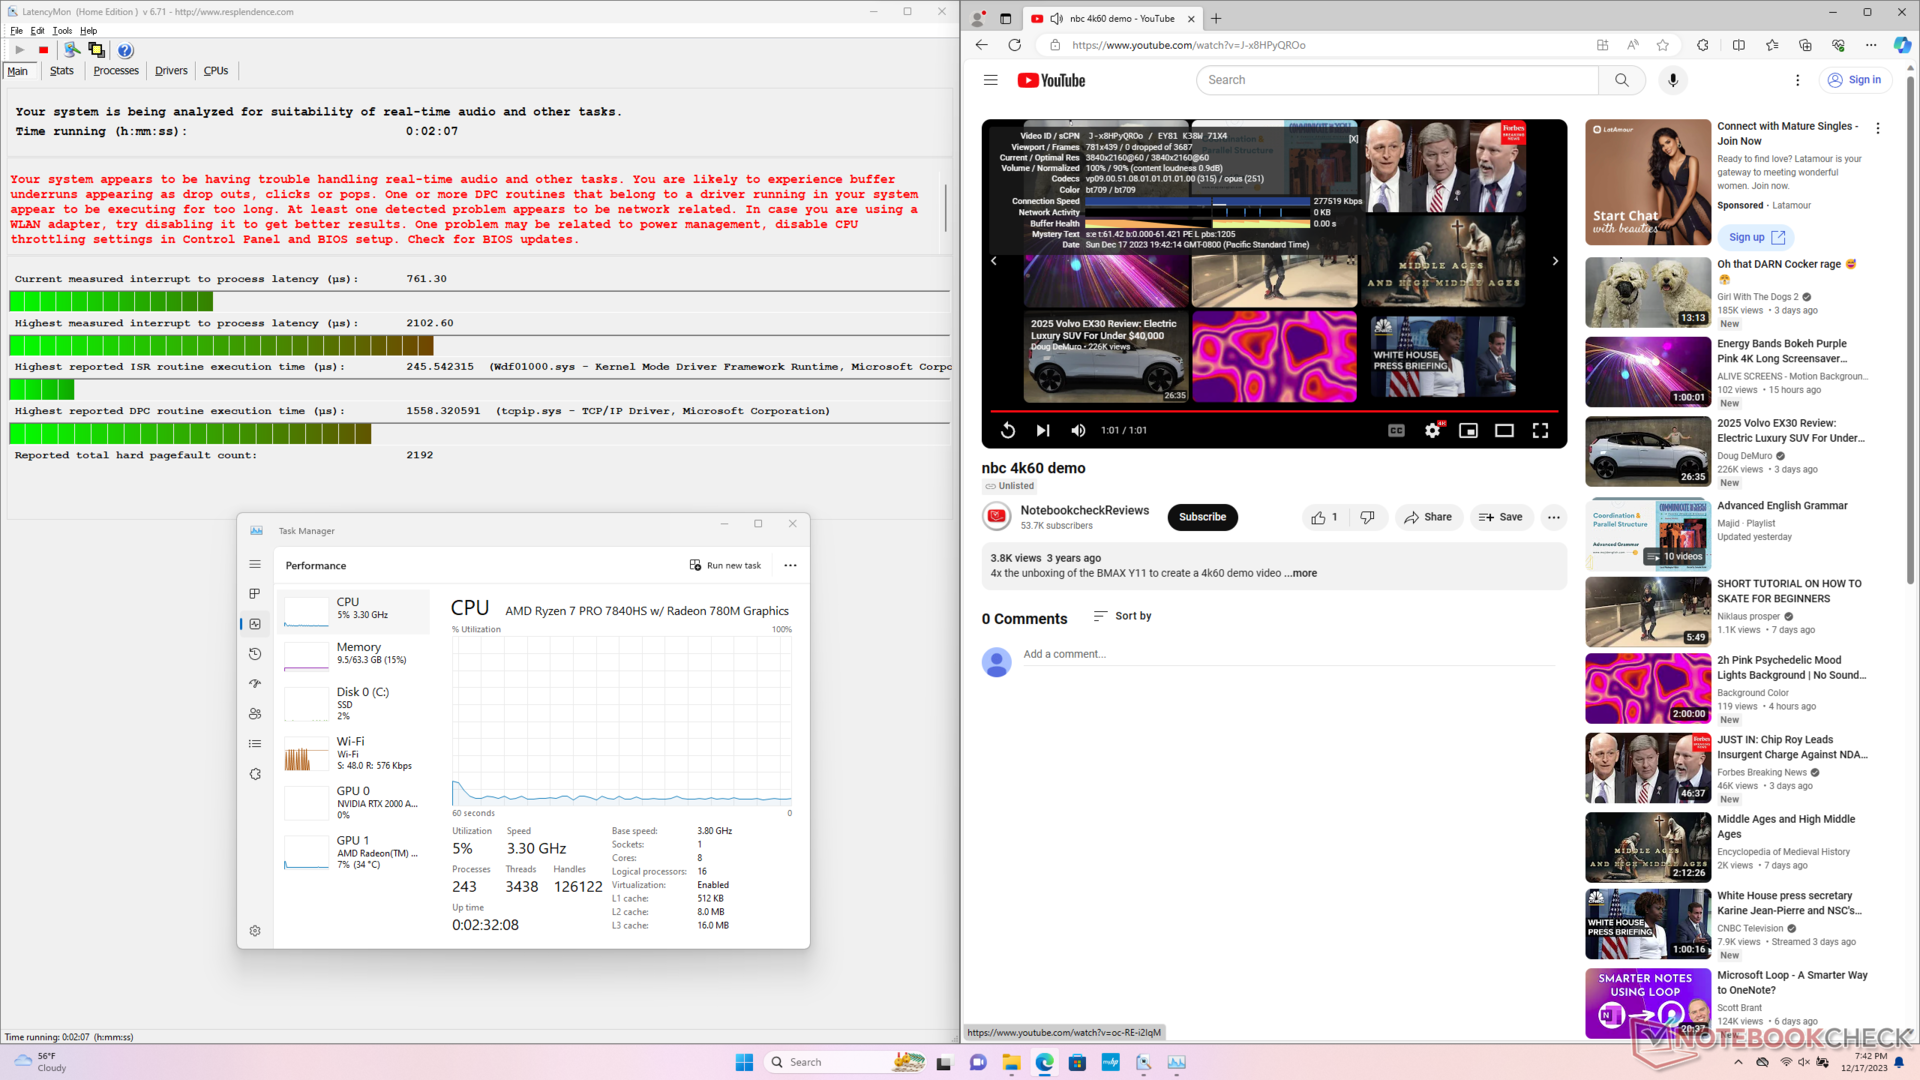
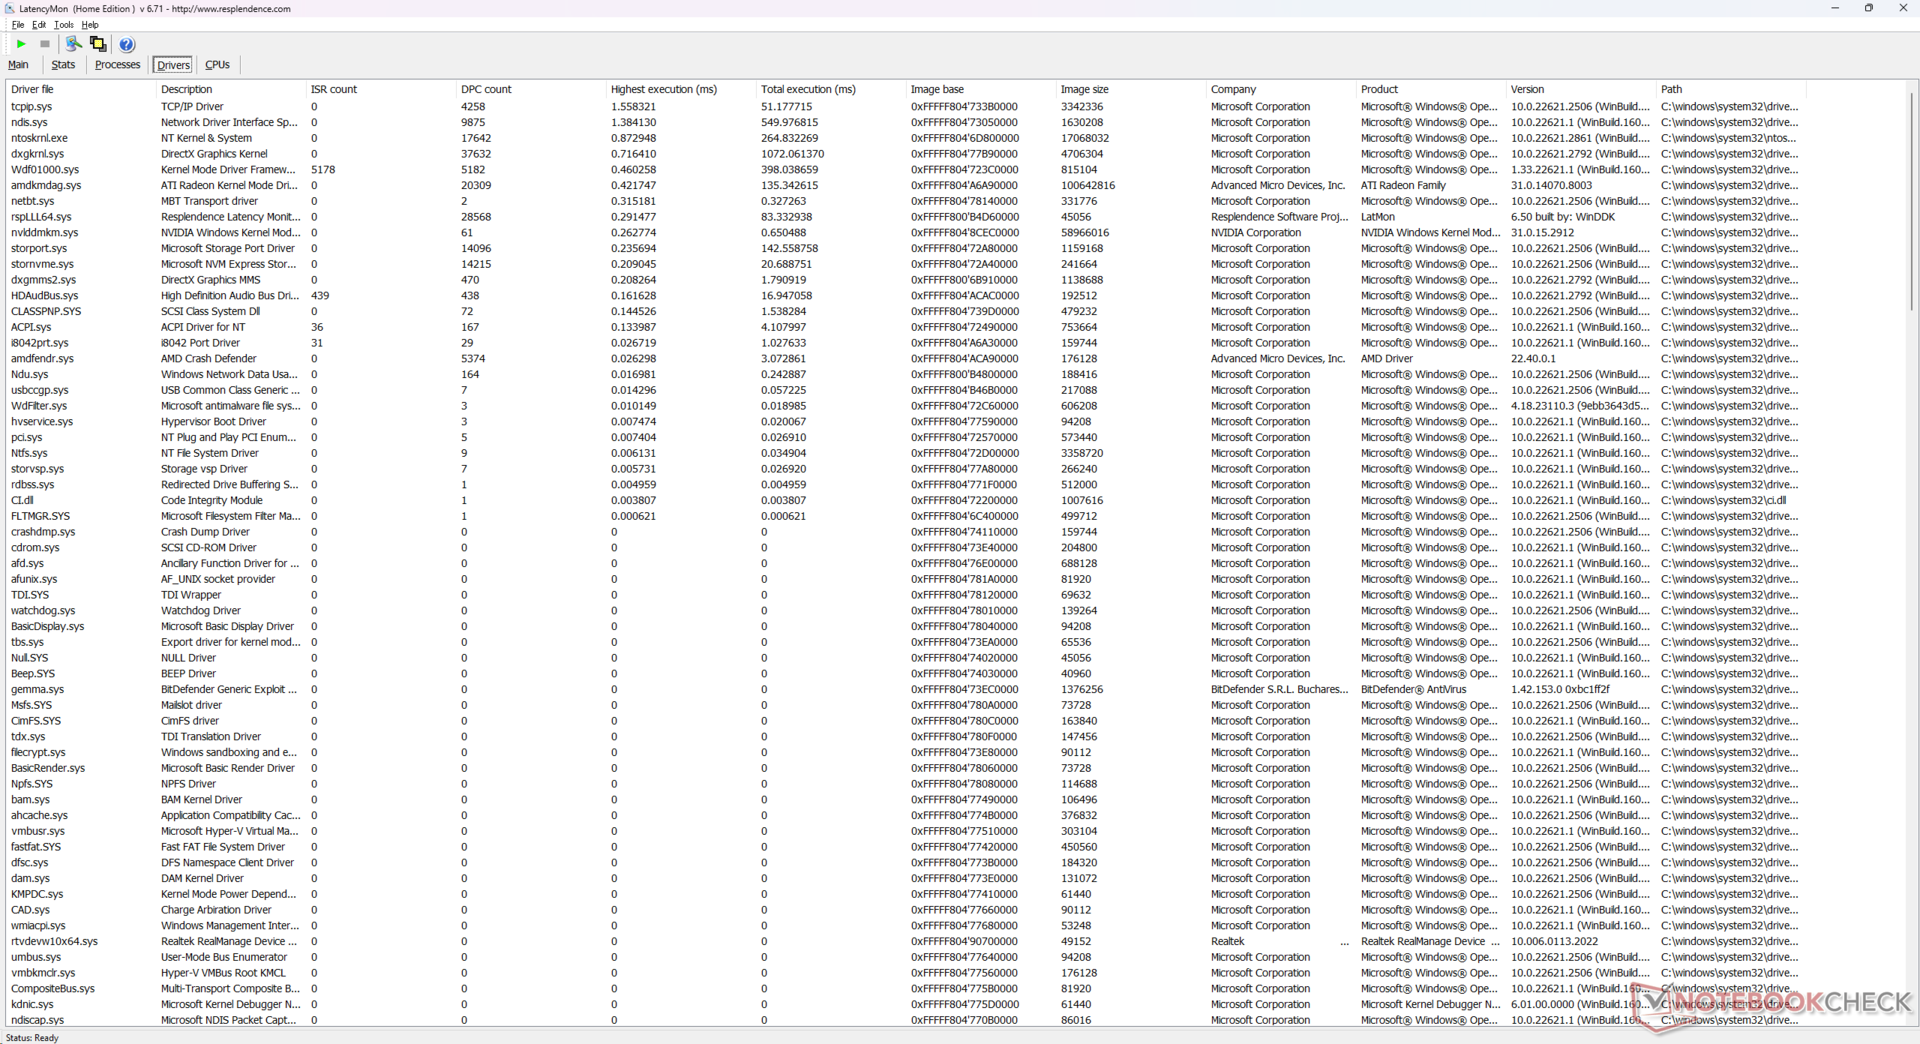
DPC 延迟
在打开我们主页的多个浏览器标签页时,LatencyMon 显示了 DPC 问题。在其他方面,以 60 FPS 播放 4K 视频也非常完美,没有掉帧记录。
| DPC Latencies / LatencyMon - interrupt to process latency (max), Web, Youtube, Prime95 | |
| Lenovo ThinkPad P1 G6-21FV000DGE | |
| Asus ExpertBook B6 Flip B6602FC2 | |
| HP ZBook Power 15 G10 | |
| HP ZBook Power 15 G9 6B8C4EA | |
| Dell Precision 5000 5560 | |
| Lenovo ThinkPad P15v G3 21EM001AGE | |
* ... smaller is better
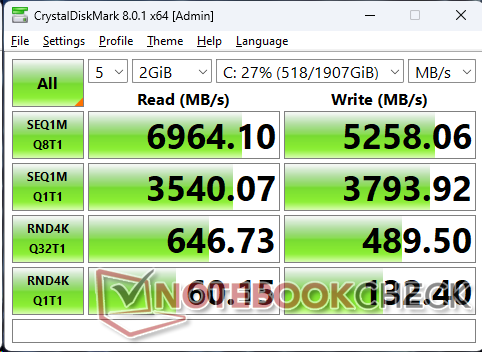
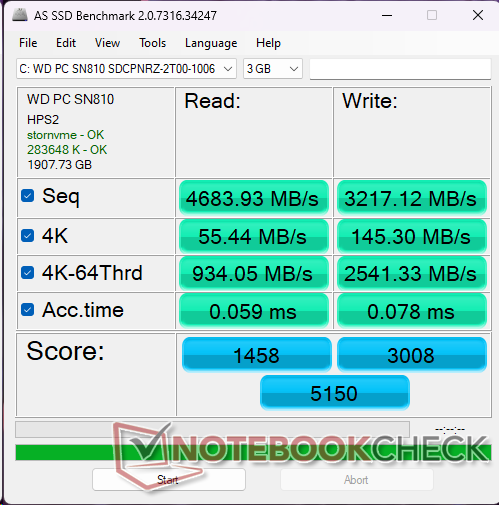
存储设备
我们的设备配置有 WDC PC SN810而不是去年型号上的三星 PM9A1。一般来说,在高队列深度读写小型 4K 块时,WDC 硬盘比三星慢。惠普允许买家配置 SED 或非 SED 硬盘,但惠普没有明确列出相关的 SSD 品牌。

* ... smaller is better
Disk Throttling: DiskSpd Read Loop, Queue Depth 8
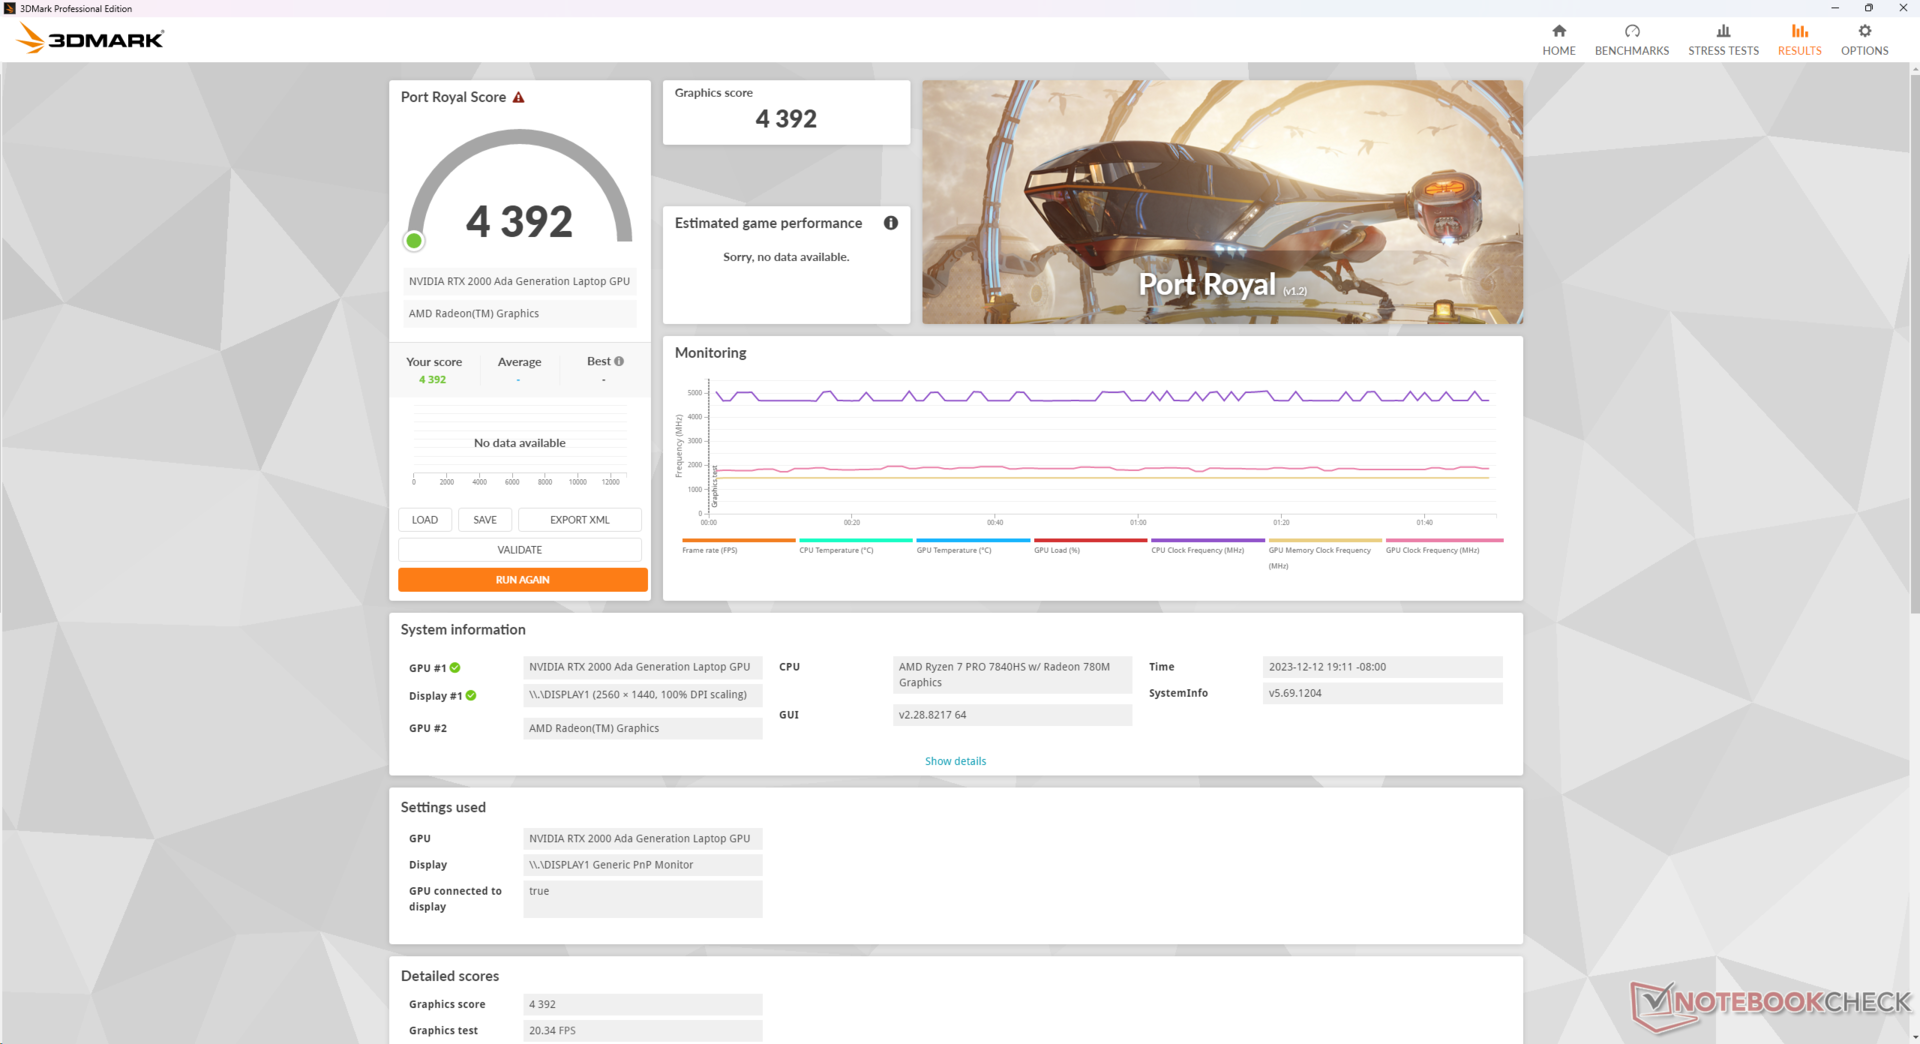
图形处理器性能
撠 Nvidia RTX 2000 Ada比 RTX A2000和去年的 ZBook Power 15 G9 相比,Nvidia RTX 2000 Ada 的升级非常明显,这也是我们选择较新的 G10 机型而非前一版本的主要原因。原始图形处理能力大约提高了 55% 至 65%,SpecViewPerf 的结果也一直较高。
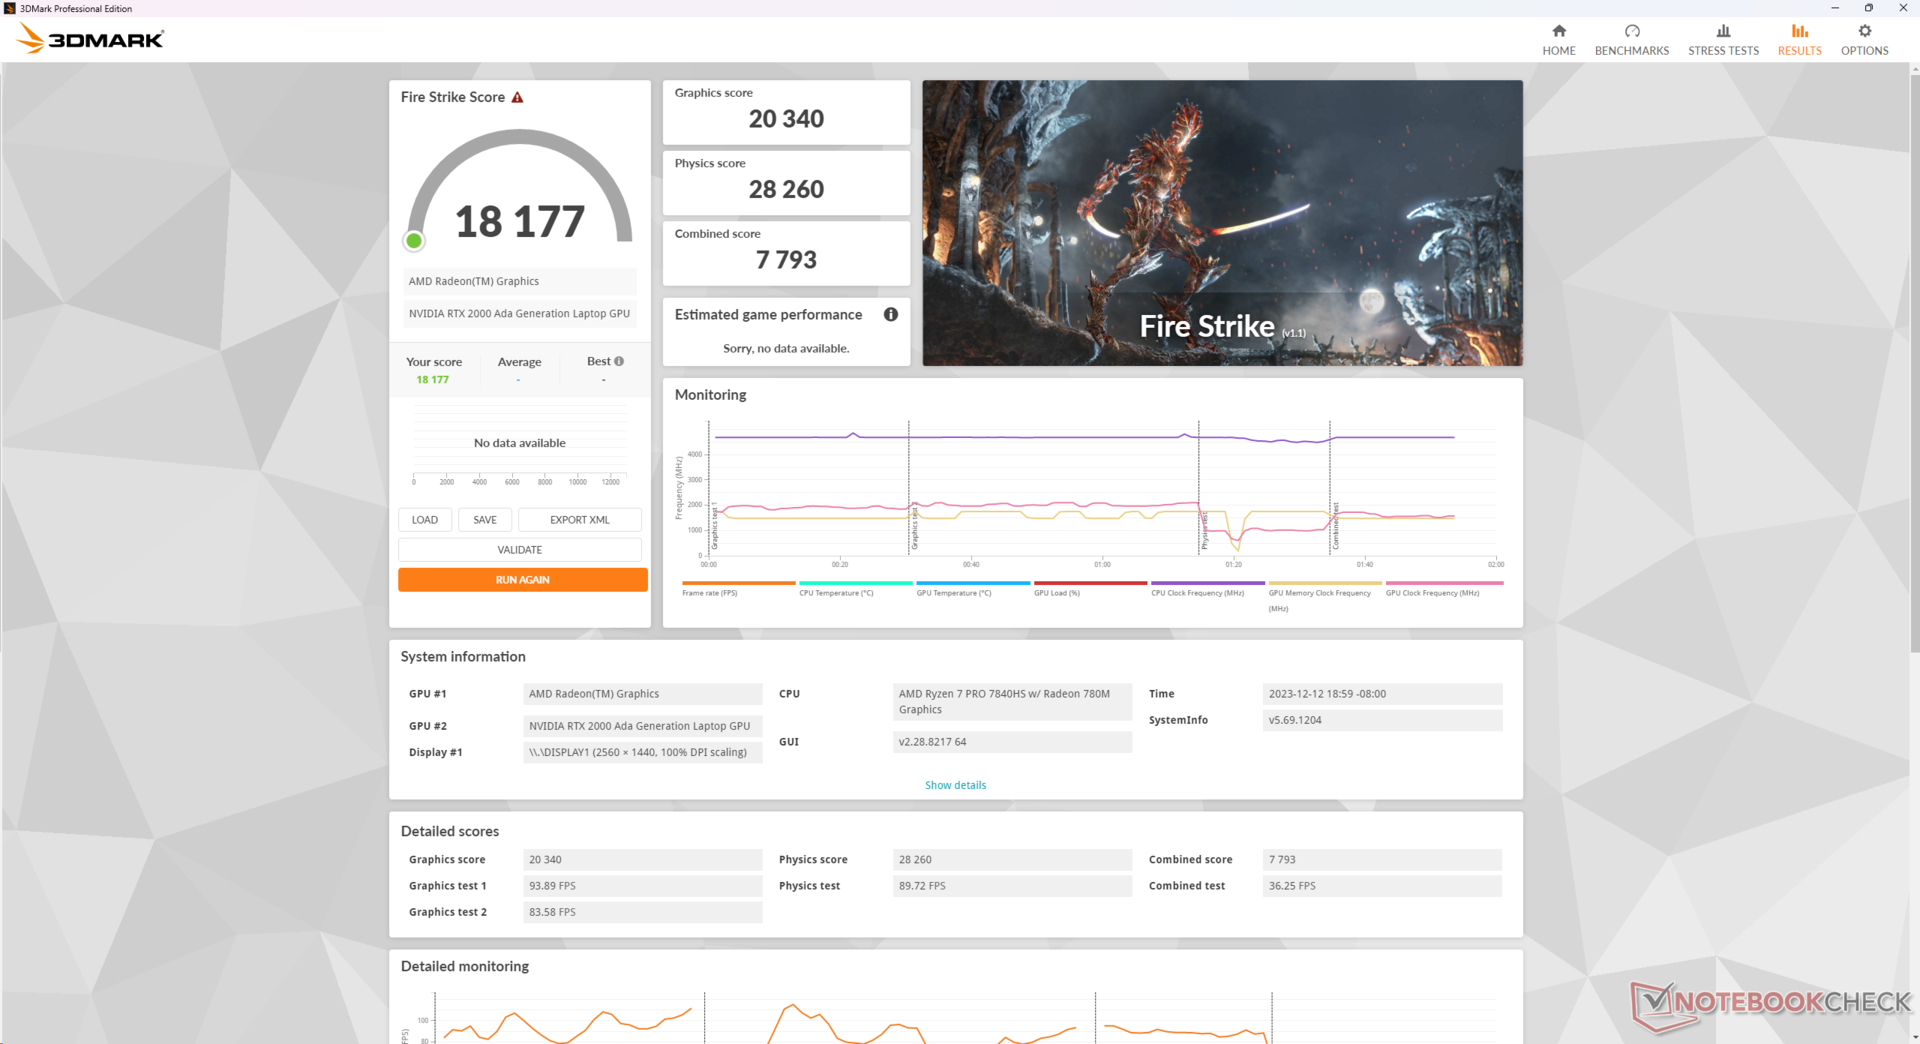
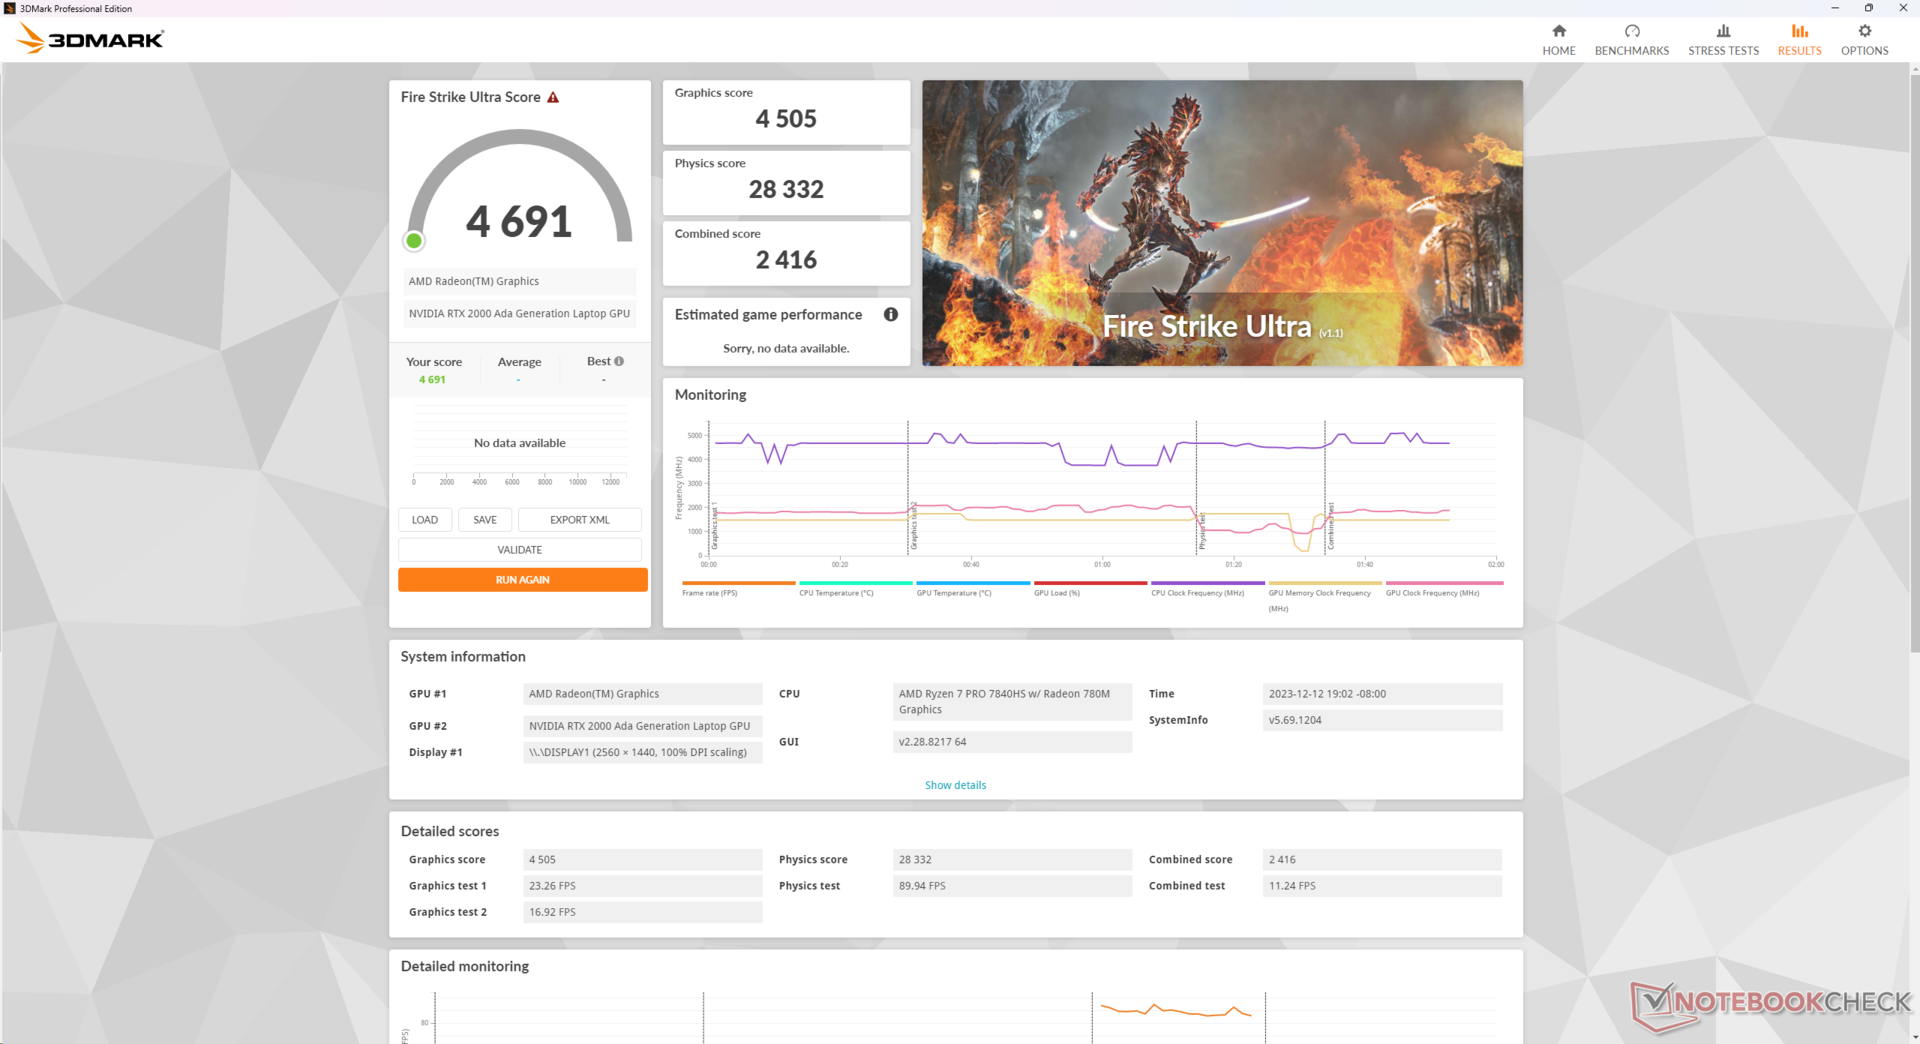
在平衡模式而非性能模式下运行,似乎不会影响 CPU 或 GPU 性能,如下文Fire Strike 结果所示。不过,即使设置为 "性能 "模式,使用电池供电也会大大降低性能。
| 电源配置文件 | 物理得分 | 图形得分 | 综合得分 |
| 性能模式(主模式) | 28260 | 20340 | 7793 |
| 平衡模式(主电源) | 27579 (-0%) | 20812 (-0%) | 7877 (-0%) |
| 性能模式(电池供电) | 6105 (-78%) | 12744 (-37%) | 2392 (-69%) |
令人讨厌的是,惠普提供的 RTX 3000 AdaGPU 仅适用于英特尔配置的 ZBook Power 15 G10,而 AMD 配置仅限于 RTX 2000 Ada。3000 Ada GPU 的性能比 2000 Ada 快大约 5%到 15%,这是我们在使用较小的 ZBook Power 15 G10 时的结果。 戴尔Precision 5480.
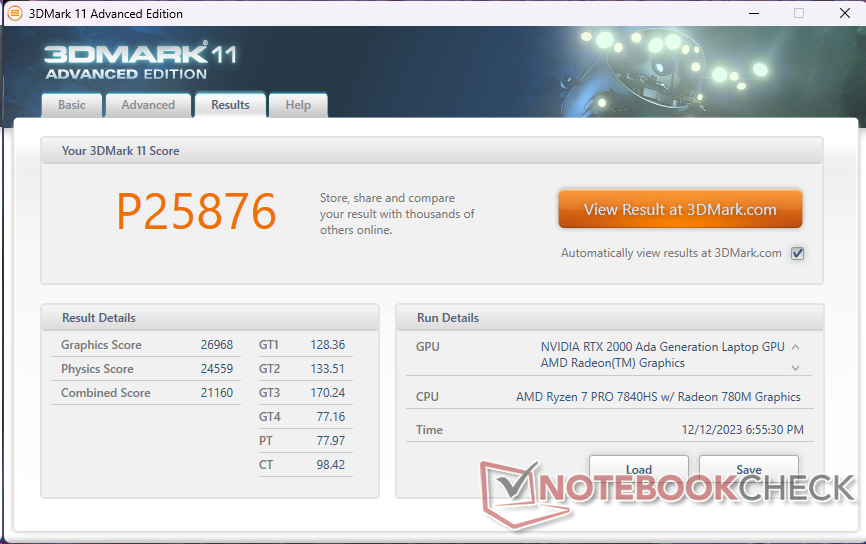
| 3DMark 11 Performance | 25876 points | |
| 3DMark Fire Strike Score | 18177 points | |
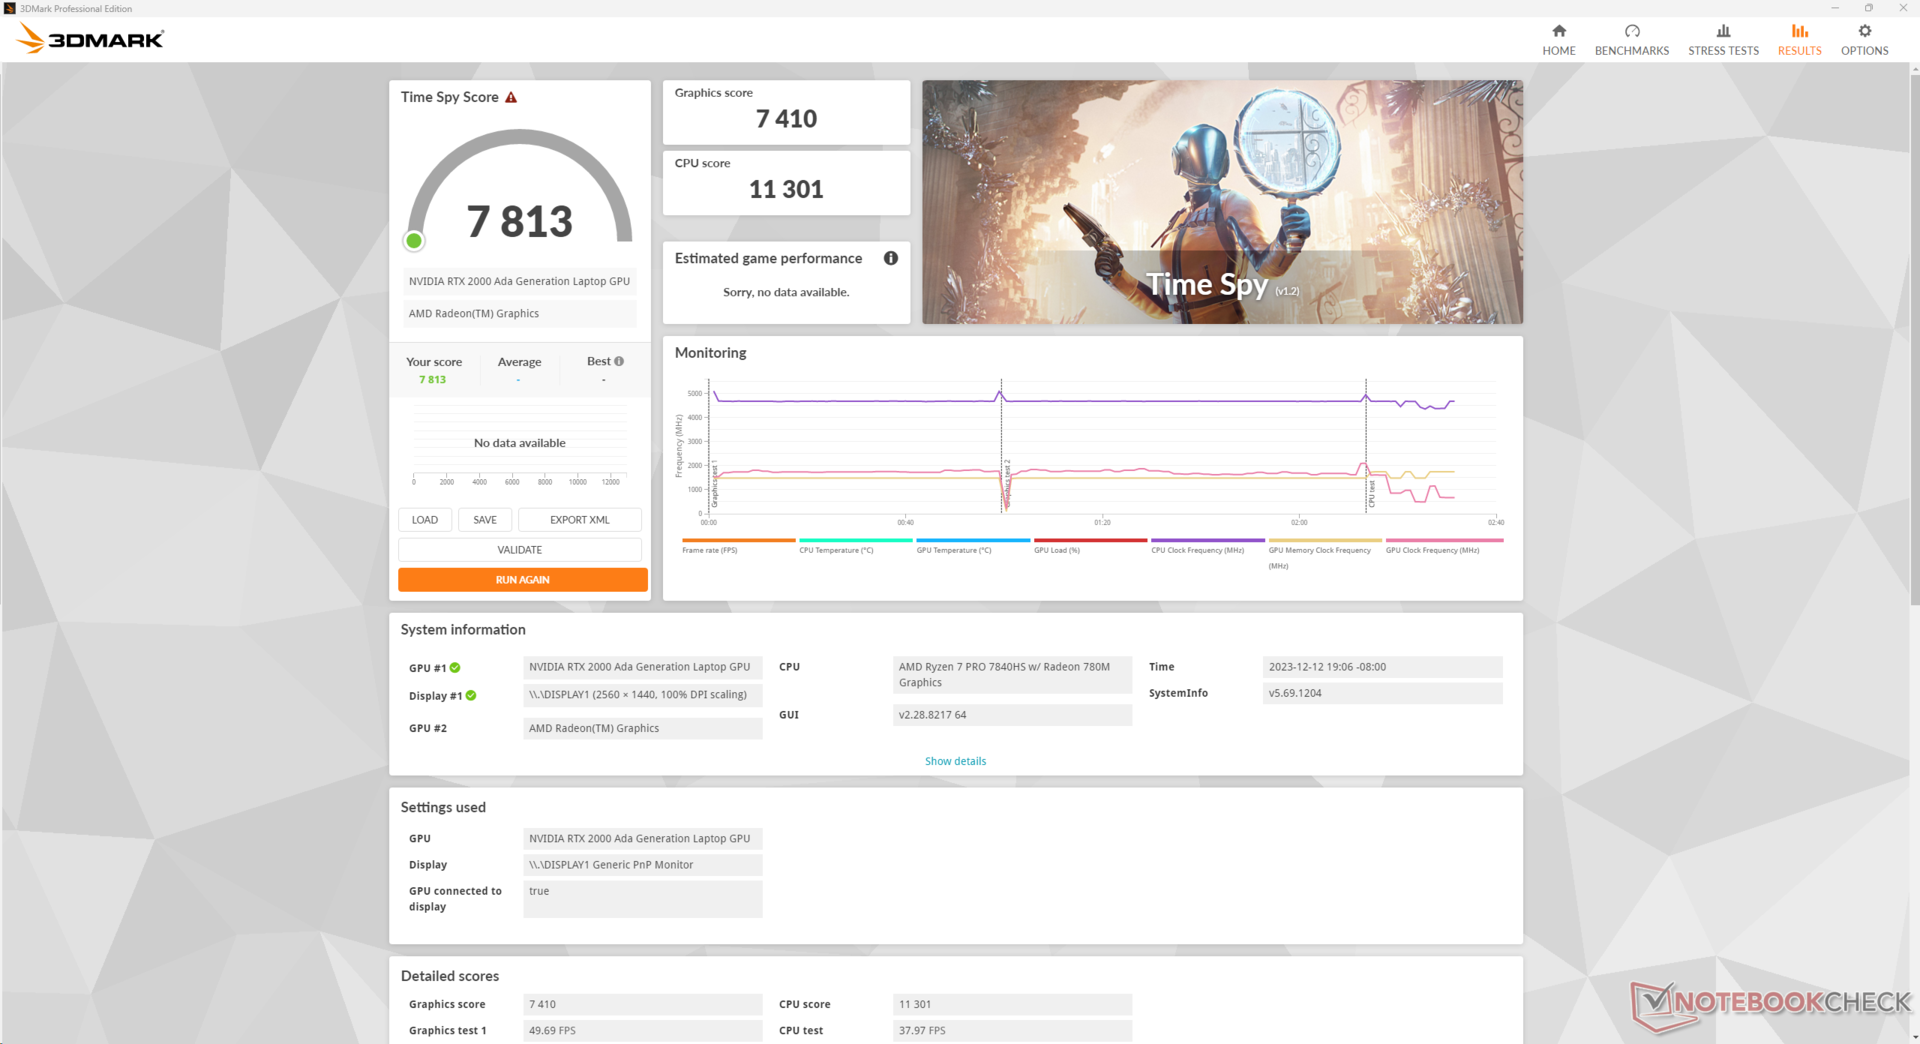
| 3DMark Time Spy Score | 7813 points | |
Help | ||
* ... smaller is better
游戏性能
整体游戏性能与 GeForce RTX 4050尽管 2000 Ada 集成了更多的统一管线、TMU、VRAM 和更宽的内存带宽。赛博朋克 2077》等高要求游戏可以在 1080p 和极限设置下运行,但如果以原始 1440p 分辨率运行,则需要更低的设置。
| Cyberpunk 2077 | |
| 1920x1080 Low Preset (FSR off) | |
| HP ZBook Power 15 G10 | |
| Average NVIDIA RTX 2000 Ada Generation Laptop (81.1 - 85.4, n=2) | |
| Lenovo ThinkPad Z16 Gen 2 | |
| 1920x1080 Medium Preset (FSR off) | |
| HP ZBook Power 15 G10 | |
| Average NVIDIA RTX 2000 Ada Generation Laptop (61.4 - 64.5, n=2) | |
| Lenovo ThinkPad Z16 Gen 2 | |
| 1920x1080 High Preset (FSR off) | |
| HP ZBook Power 15 G10 | |
| Average NVIDIA RTX 2000 Ada Generation Laptop (51.7 - 55.2, n=2) | |
| Lenovo ThinkPad Z16 Gen 2 | |
| 1920x1080 Ultra Preset (FSR off) | |
| HP ZBook Power 15 G10 | |
| Average NVIDIA RTX 2000 Ada Generation Laptop (44.8 - 48.3, n=2) | |
| Lenovo ThinkPad Z16 Gen 2 | |
| 2560x1440 Ultra Preset (FSR off) | |
| HP ZBook Power 15 G10 | |
| Average NVIDIA RTX 2000 Ada Generation Laptop (29.7 - 29.9, n=2) | |
| Lenovo ThinkPad Z16 Gen 2 | |
| 1920x1080 Ray Tracing Ultra Preset (DLSS off) | |
| HP ZBook Power 15 G10 | |
| Average NVIDIA RTX 2000 Ada Generation Laptop (19.2 - 21.6, n=2) | |
| Lenovo ThinkPad Z16 Gen 2 | |
Witcher 3 FPS Chart
| low | med. | high | ultra | QHD | |
|---|---|---|---|---|---|
| GTA V (2015) | 178.1 | 170.6 | 157.7 | 86.2 | 60.6 |
| The Witcher 3 (2015) | 336.4 | 219 | 127.9 | 65.5 | |
| Dota 2 Reborn (2015) | 155 | 140.8 | 136.9 | 132 | |
| Final Fantasy XV Benchmark (2018) | 173.3 | 93.5 | 67.7 | 50.3 | |
| X-Plane 11.11 (2018) | 80.6 | 73 | 52.5 | ||
| Far Cry 5 (2018) | 151 | 110 | 102 | 95 | 63 |
| Strange Brigade (2018) | 332 | 183 | 148.4 | 132.5 | 94.1 |
| Tiny Tina's Wonderlands (2022) | 119.8 | 110.5 | 77.3 | 62.3 | 43.5 |
| F1 22 (2022) | 166.7 | 151.8 | 119.9 | 44.2 | 28.9 |
| Cyberpunk 2077 (2023) | 85.4 | 64.5 | 55.2 | 48.3 | 29.9 |
排放量
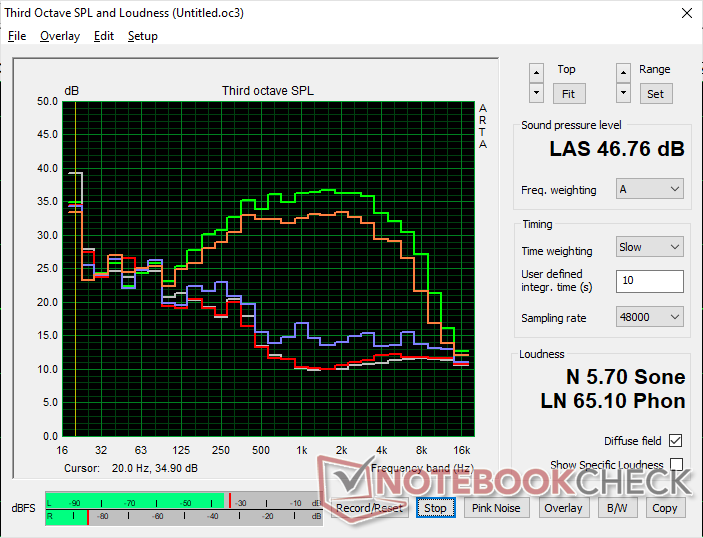
系统噪音
尽管性能不同,但风扇噪音与去年的型号基本相同,最小值和最大值相似。值得注意的是,在运行 3DMark 06 时,G10 设备的内部风扇比 G9 设备的风扇能保持更长时间的安静,但这当然取决于初始温度条件。
运行时的风扇噪音 Witcher 3 平衡模式和性能模式下的风扇噪音保持不变,这与我们的测试结果一致,表明两种电源配置文件之间的差异很小。
Noise level
| Idle |
| 24.4 / 24.4 / 24.4 dB(A) |
| Load |
| 27.4 / 46.8 dB(A) |
 | ||
30 dB silent 40 dB(A) audible 50 dB(A) loud |
||
min: | ||
| HP ZBook Power 15 G10 RTX 2000 Ada Generation Laptop, R7 PRO 7840HS, WDC PC SN810 2TB | HP ZBook Power 15 G9 6B8C4EA RTX A2000 Laptop GPU, i7-12700H, Samsung PM9A1 MZVL21T0HCLR | Lenovo ThinkPad P15v G3 21EM001AGE RTX A2000 Laptop GPU, R7 PRO 6850H, SK Hynix PC711 1TB HFS001TDE9X081N | Dell Precision 5000 5560 RTX A2000 Laptop GPU, i7-11850H, Samsung PM9A1 MZVL22T0HBLB | Lenovo ThinkPad P1 G6-21FV000DGE RTX 2000 Ada Generation Laptop, i9-13900H, SK Hynix PC711 1TB HFS001TDE9X084N | Asus ExpertBook B6 Flip B6602FC2 RTX A2000 Laptop GPU, i9-12950HX, Samsung PM9A1 MZVL21T0HCLR | |
|---|---|---|---|---|---|---|
| Noise | -8% | 3% | 5% | -10% | -34% | |
| off / environment * (dB) | 24.2 | 23.8 2% | 23.2 4% | 23.4 3% | 24.5 -1% | 26 -7% |
| Idle Minimum * (dB) | 24.4 | 23.8 2% | 23.2 5% | 23.6 3% | 24.5 -0% | 32.4 -33% |
| Idle Average * (dB) | 24.4 | 23.8 2% | 23.2 5% | 23.6 3% | 24.5 -0% | 32.4 -33% |
| Idle Maximum * (dB) | 24.4 | 23.8 2% | 23.2 5% | 23.6 3% | 24.5 -0% | 32.4 -33% |
| Load Average * (dB) | 27.4 | 42.9 -57% | 35 -28% | 25.8 6% | 48 -75% | 51.9 -89% |
| Witcher 3 ultra * (dB) | 43.3 | 44.5 -3% | 37.9 12% | 40.1 7% | 40.7 6% | |
| Load Maximum * (dB) | 46.8 | 47.9 -2% | 37.5 20% | 41.4 12% | 48 -3% | 52.1 -11% |
* ... smaller is better
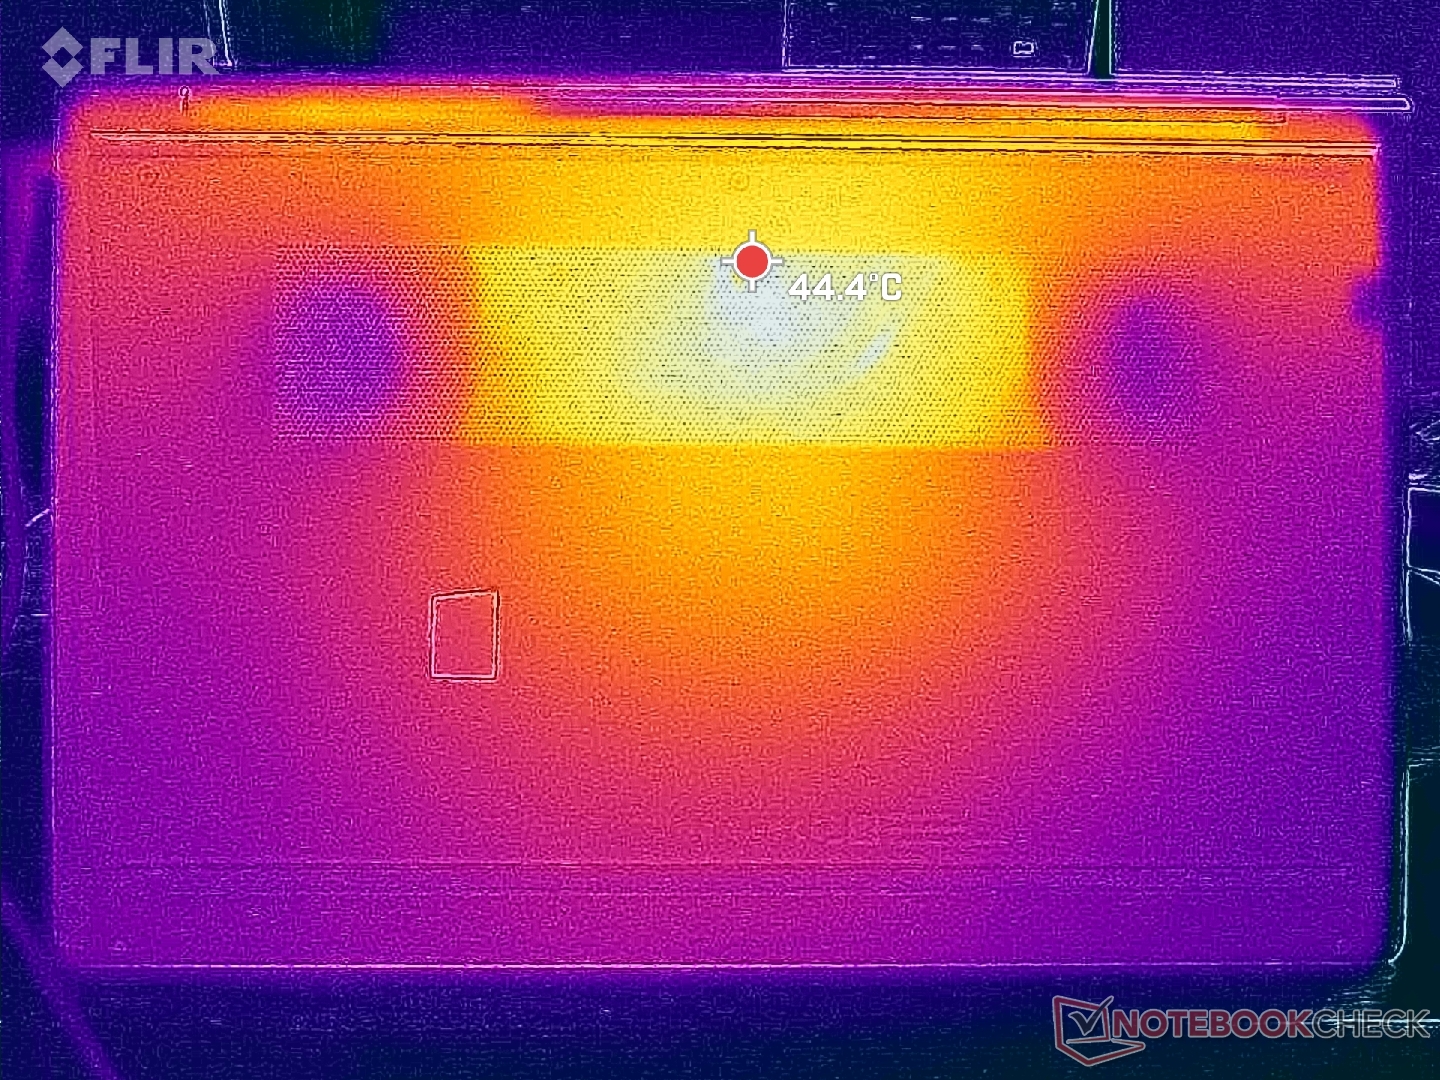
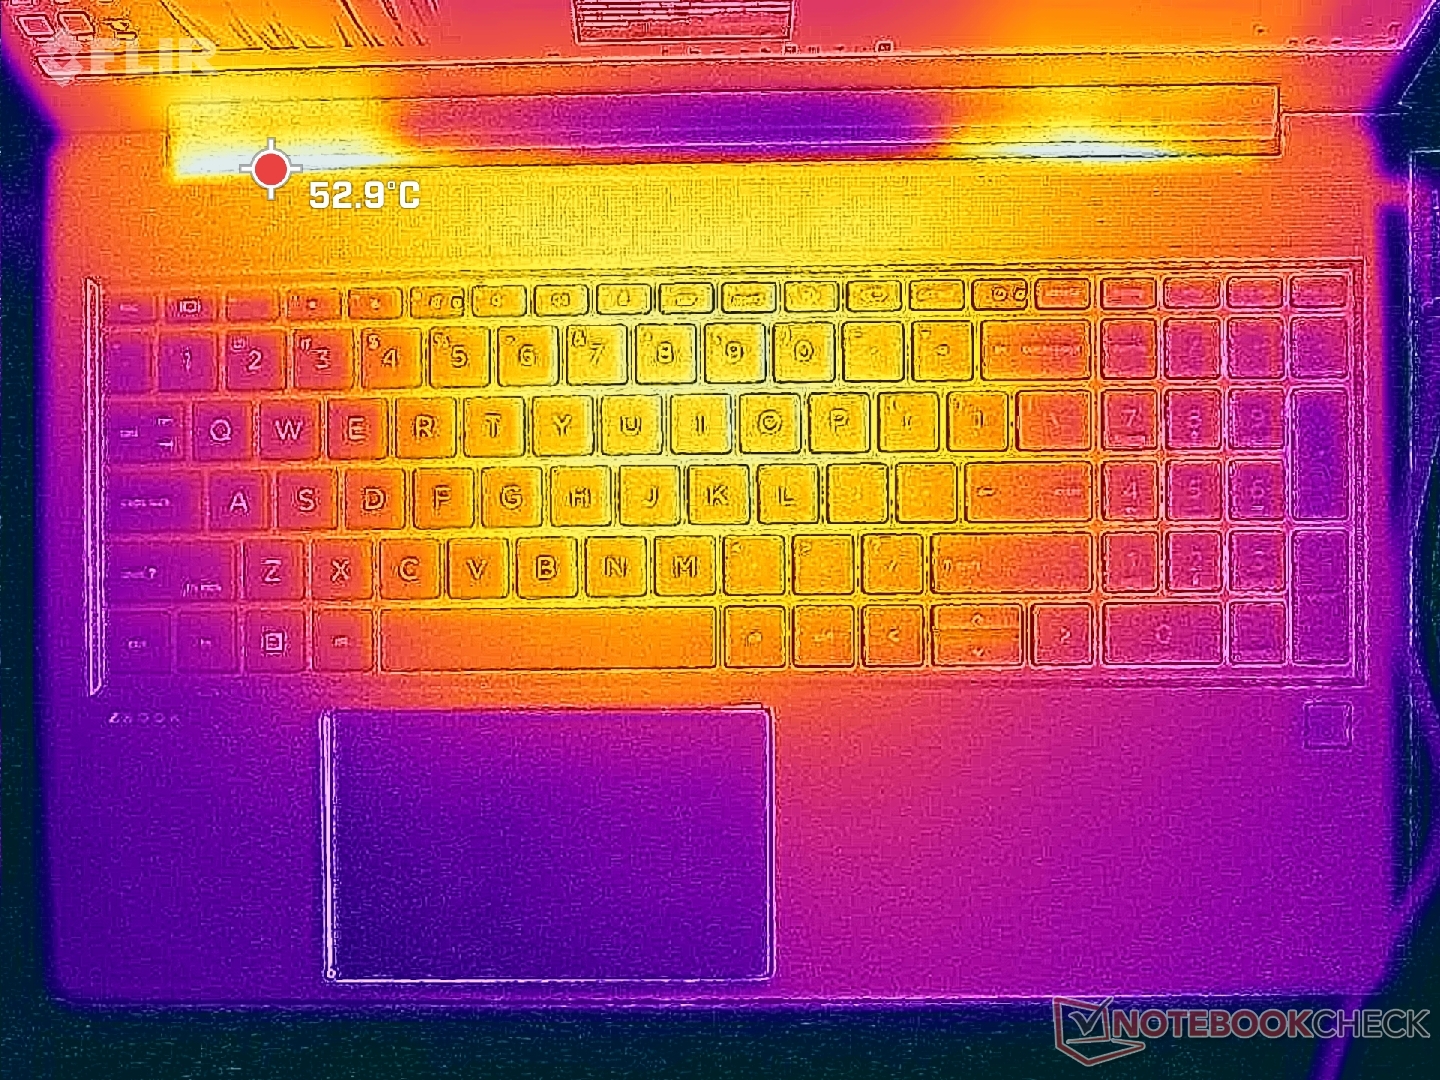
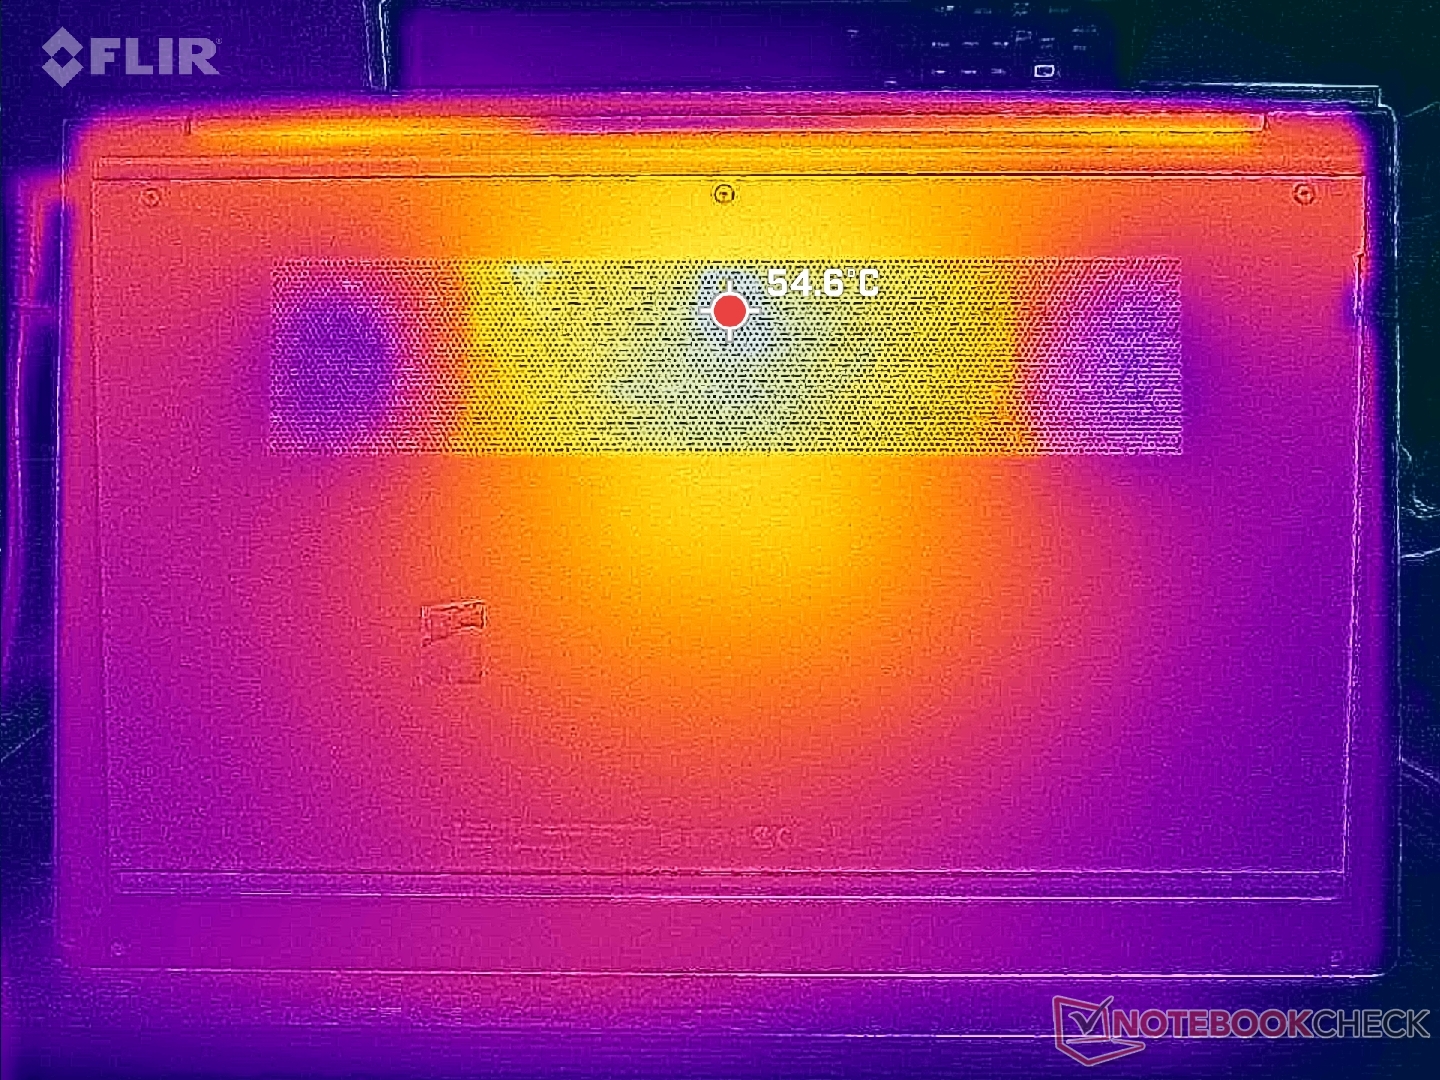
温度
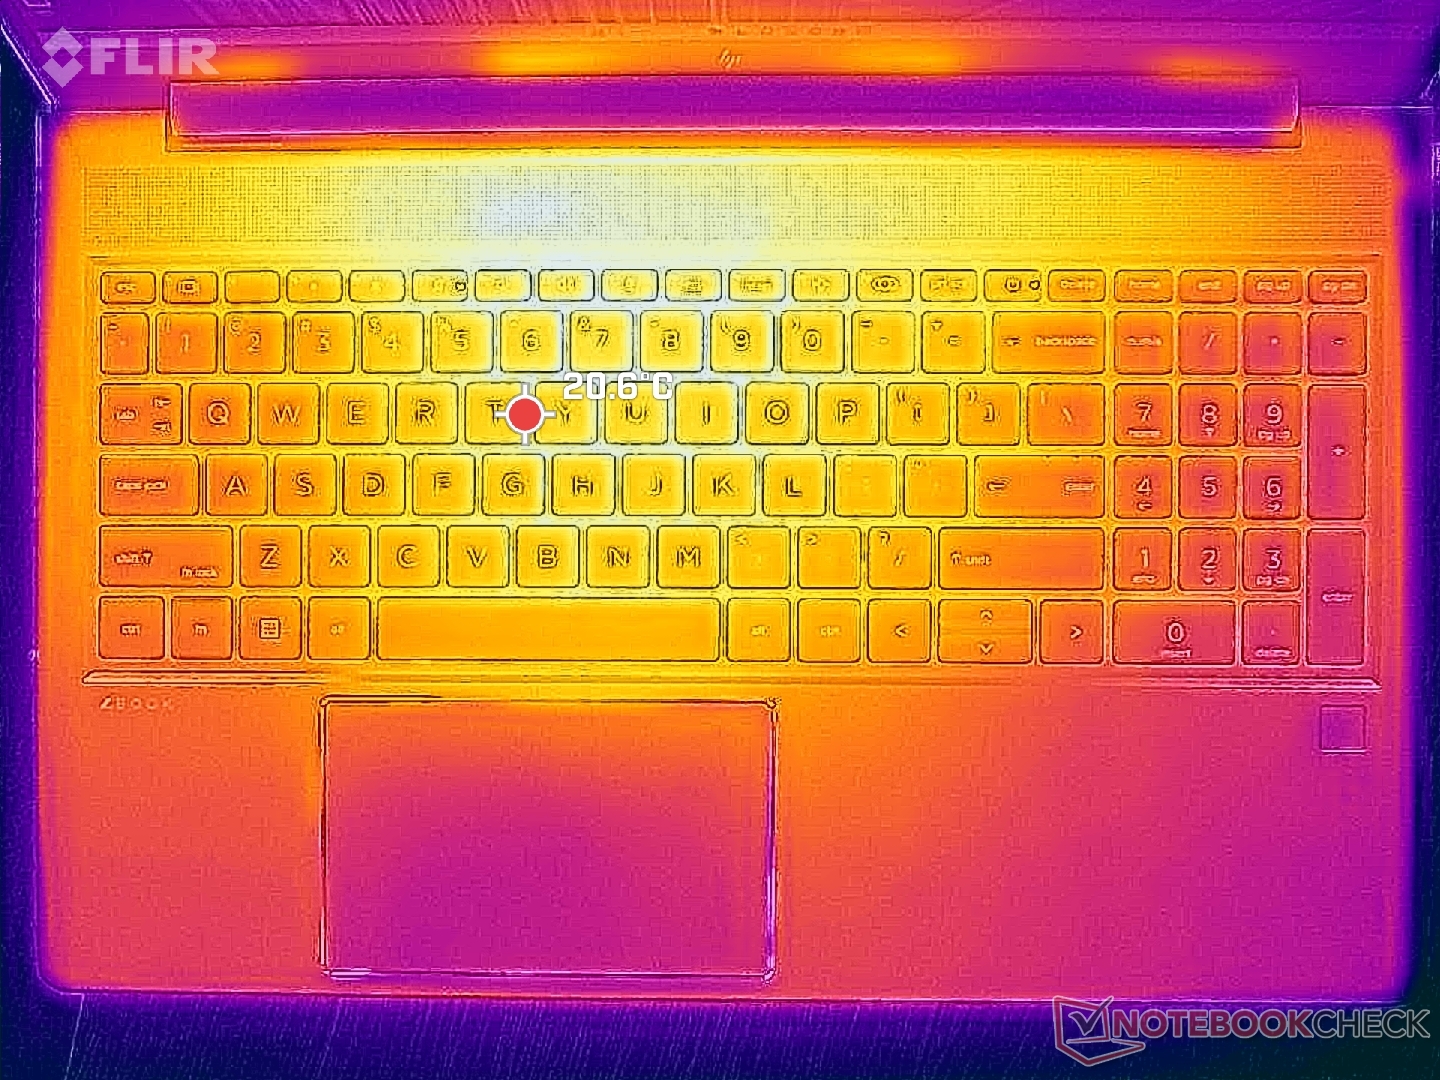
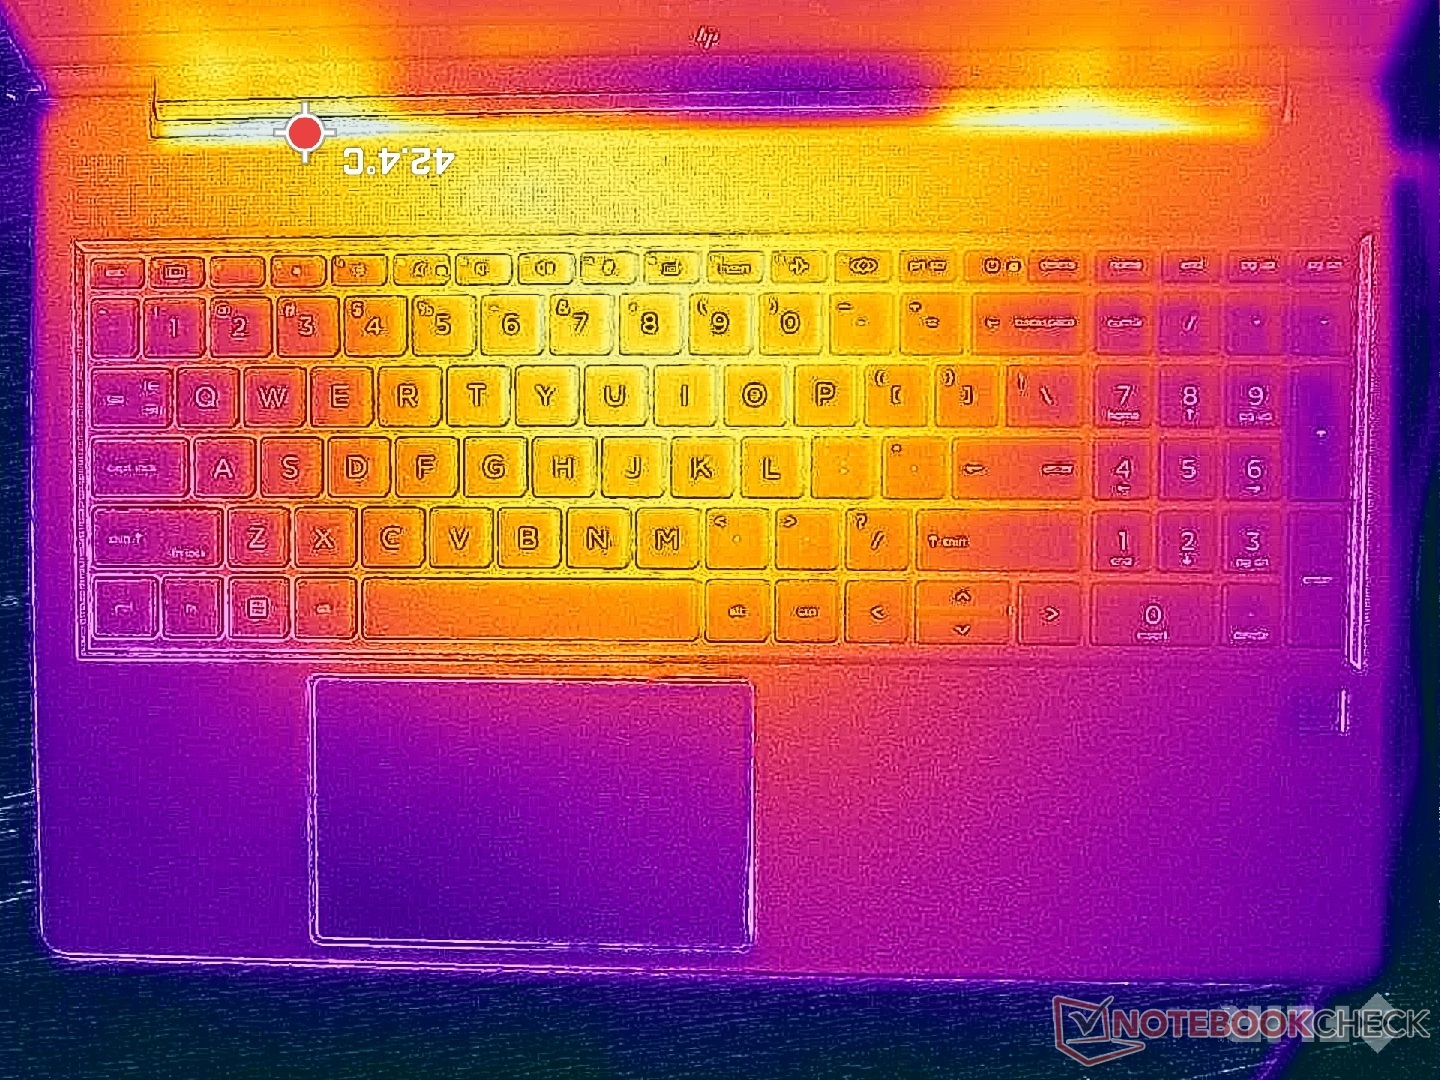
键盘中心的表面温度最高,键盘两侧或机箱边缘的温度较低。键盘中心和底部的热点温度可达 42 摄氏度以上,比同类产品低几度。 ThinkPad P1 G6的温度低几度。
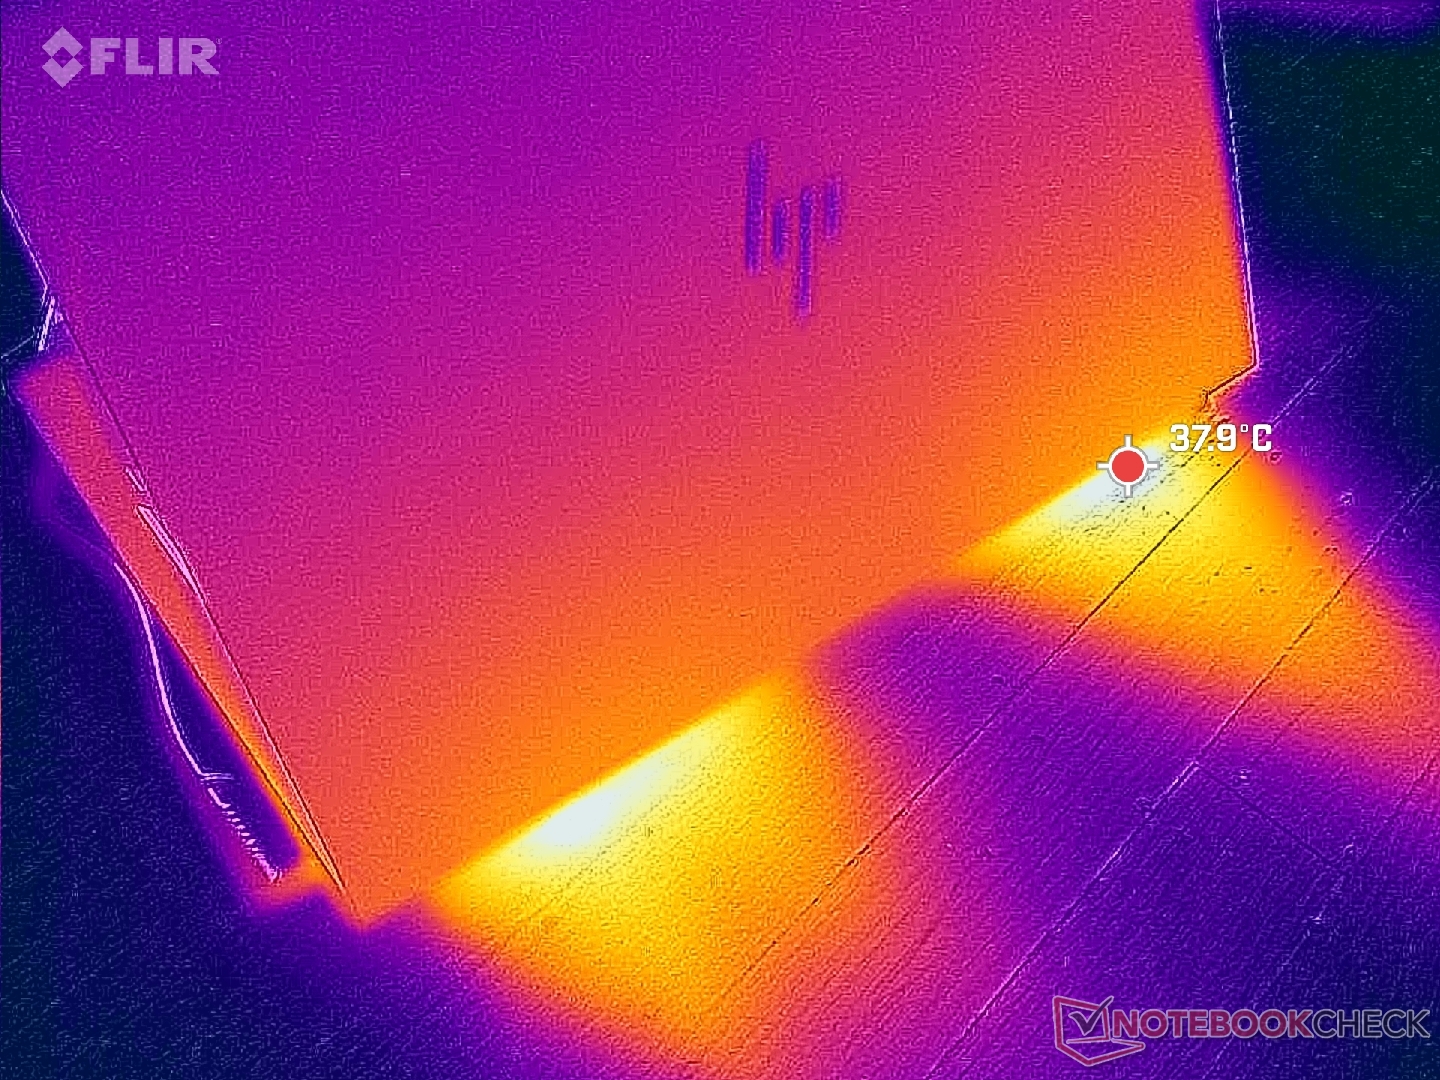
(±) The maximum temperature on the upper side is 42.4 °C / 108 F, compared to the average of 38.2 °C / 101 F, ranging from 22.2 to 69.8 °C for the class Workstation.
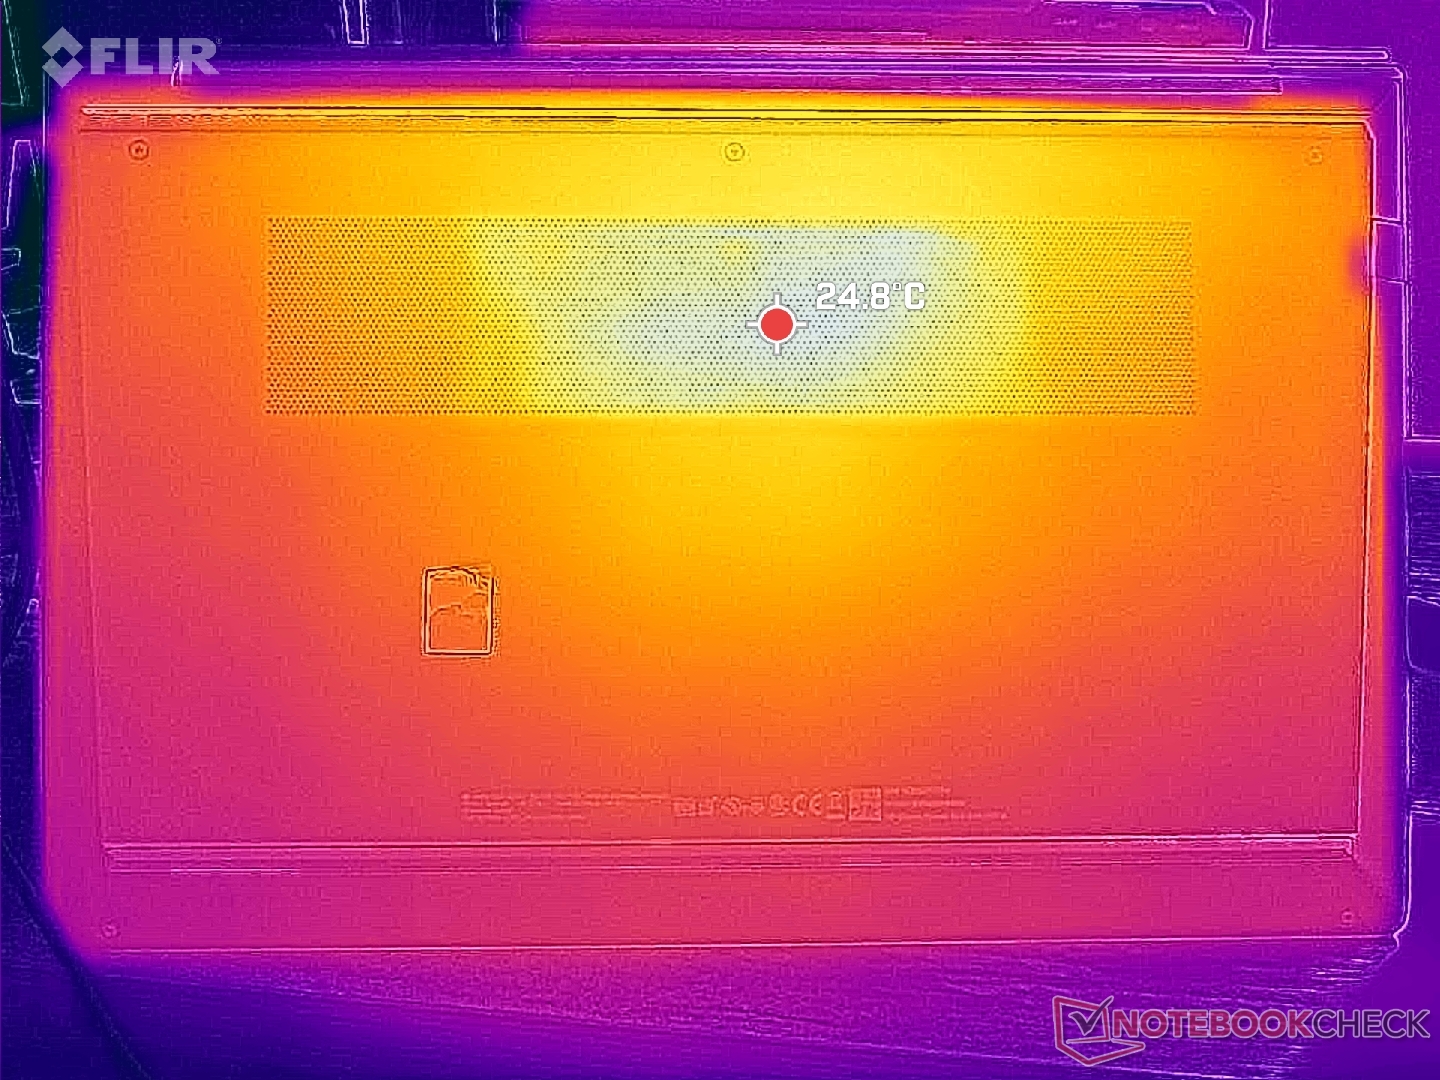
(-) The bottom heats up to a maximum of 47.8 °C / 118 F, compared to the average of 41.1 °C / 106 F
(+) In idle usage, the average temperature for the upper side is 24.4 °C / 76 F, compared to the device average of 32 °C / 90 F.
(+) Playing The Witcher 3, the average temperature for the upper side is 31.2 °C / 88 F, compared to the device average of 32 °C / 90 F.
(+) The palmrests and touchpad are cooler than skin temperature with a maximum of 27.6 °C / 81.7 F and are therefore cool to the touch.
(±) The average temperature of the palmrest area of similar devices was 27.8 °C / 82 F (+0.2 °C / 0.3 F).
| HP ZBook Power 15 G10 AMD Ryzen 7 PRO 7840HS, NVIDIA RTX 2000 Ada Generation Laptop | HP ZBook Power 15 G9 6B8C4EA Intel Core i7-12700H, NVIDIA RTX A2000 Laptop GPU | Lenovo ThinkPad P15v G3 21EM001AGE AMD Ryzen 7 PRO 6850H, NVIDIA RTX A2000 Laptop GPU | Dell Precision 5000 5560 Intel Core i7-11850H, NVIDIA RTX A2000 Laptop GPU | Lenovo ThinkPad P1 G6-21FV000DGE Intel Core i9-13900H, NVIDIA RTX 2000 Ada Generation Laptop | Asus ExpertBook B6 Flip B6602FC2 Intel Core i9-12950HX, NVIDIA RTX A2000 Laptop GPU | |
|---|---|---|---|---|---|---|
| Heat | 7% | -2% | -16% | -9% | -10% | |
| Maximum Upper Side * (°C) | 42.4 | 40.3 5% | 48.7 -15% | 48.2 -14% | 47.1 -11% | 48.4 -14% |
| Maximum Bottom * (°C) | 47.8 | 48.3 -1% | 50.5 -6% | 42.6 11% | 56.5 -18% | 52.3 -9% |
| Idle Upper Side * (°C) | 26.8 | 23.7 12% | 25 7% | 34.8 -30% | 28.1 -5% | 27.8 -4% |
| Idle Bottom * (°C) | 27.2 | 23.8 12% | 25.4 7% | 35.2 -29% | 27.6 -1% | 30.3 -11% |
* ... smaller is better
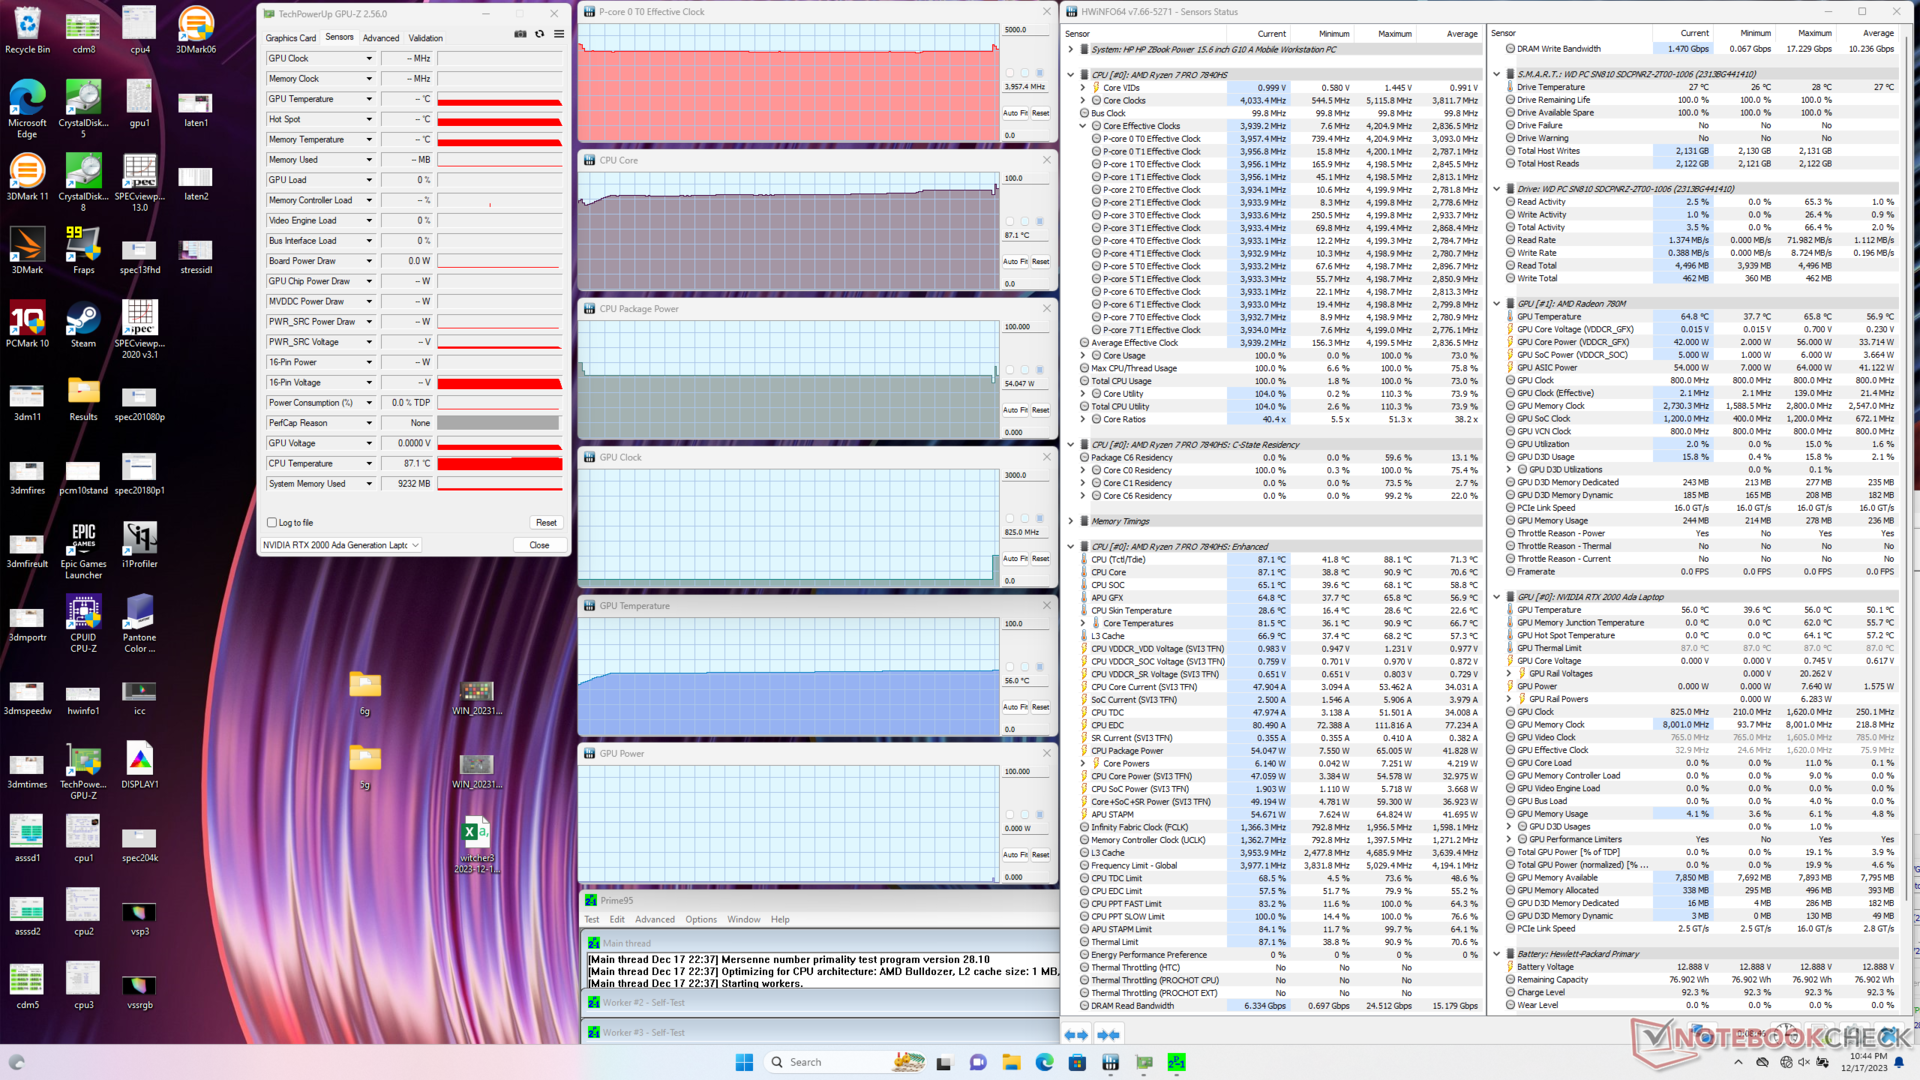
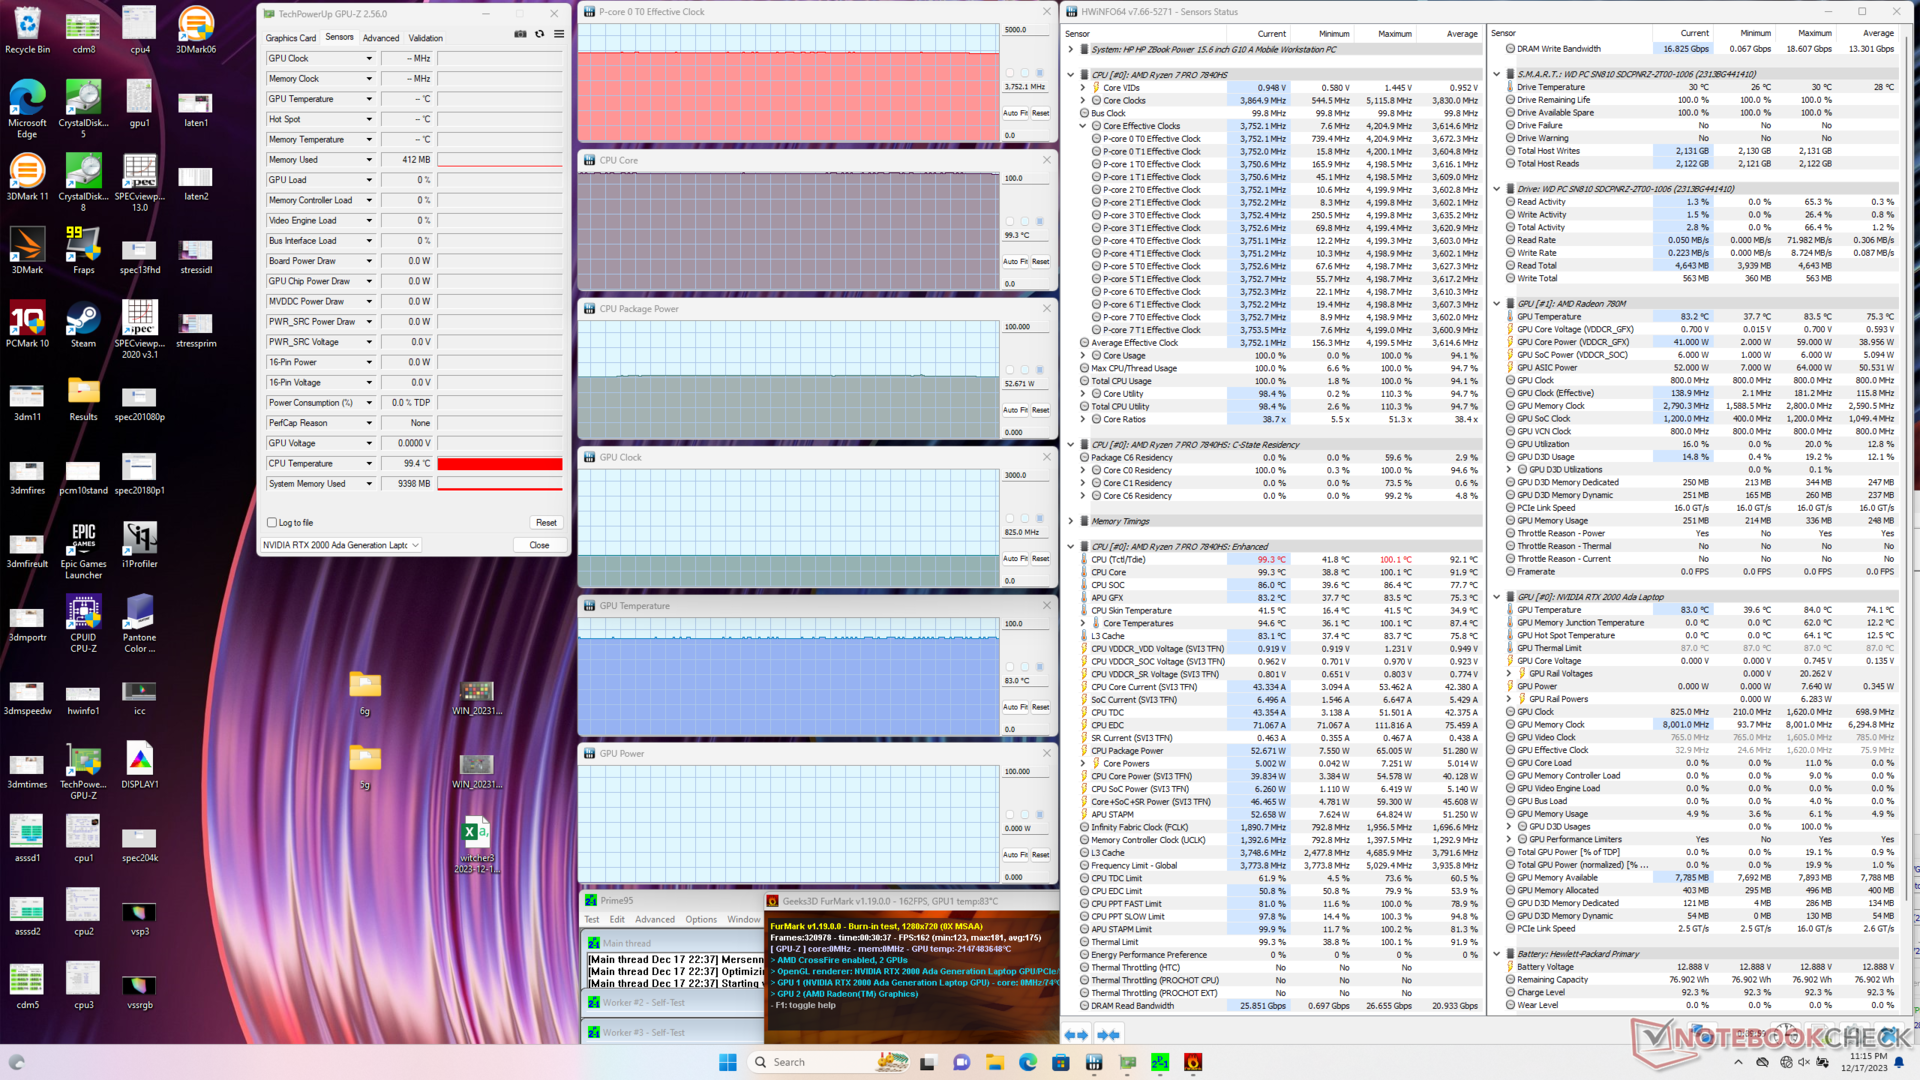
压力测试
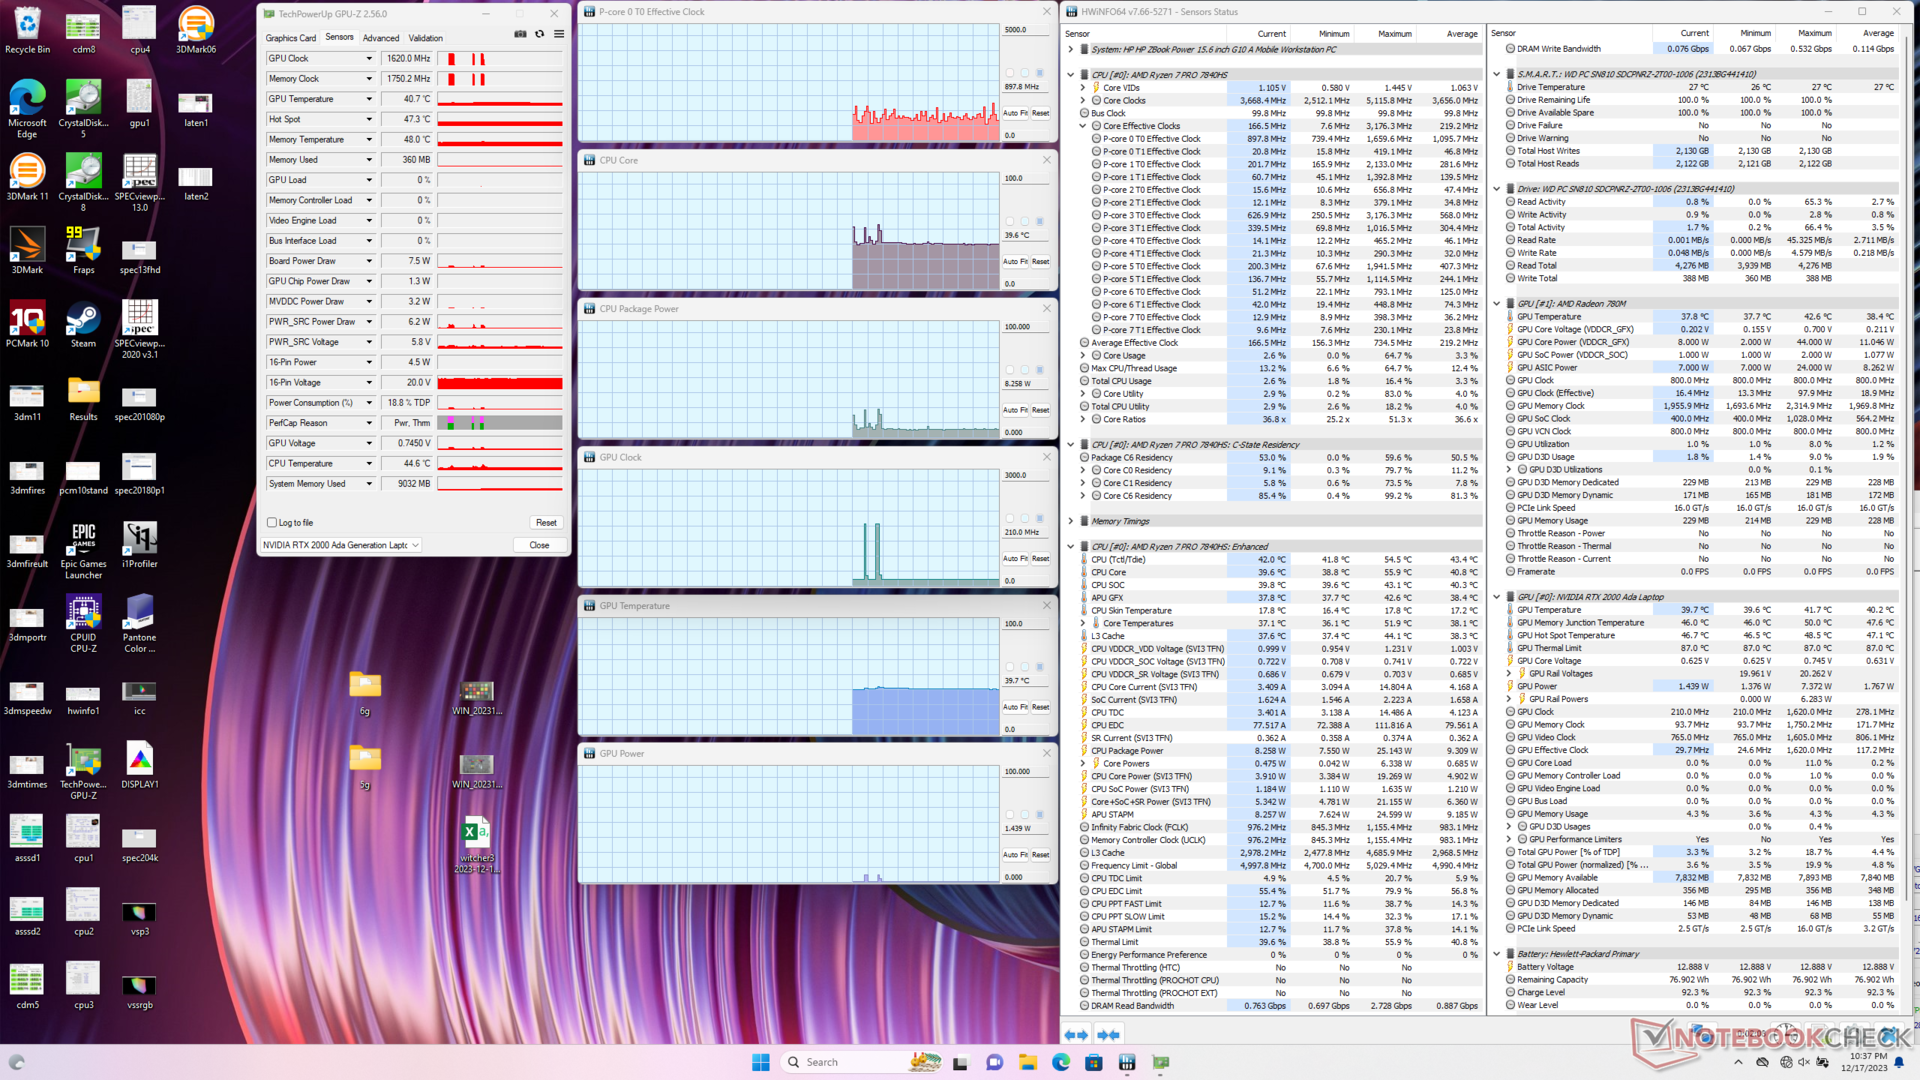
在使用 Prime95 进行压力测试时,CPU 会在最初几秒钟内提升到 4.2 GHz 和 65 W,然后略微下降并稳定在 4.0 GHz 和 54 W。核心温度高达 87 C,但这可能是许多采用 Zen 4 处理器的笔记本电脑的正常情况。在 ThinkPad Z16 G2上重复这项测试,其 Ryzen 9 CPU 的温度会稳定在 100 摄氏度。
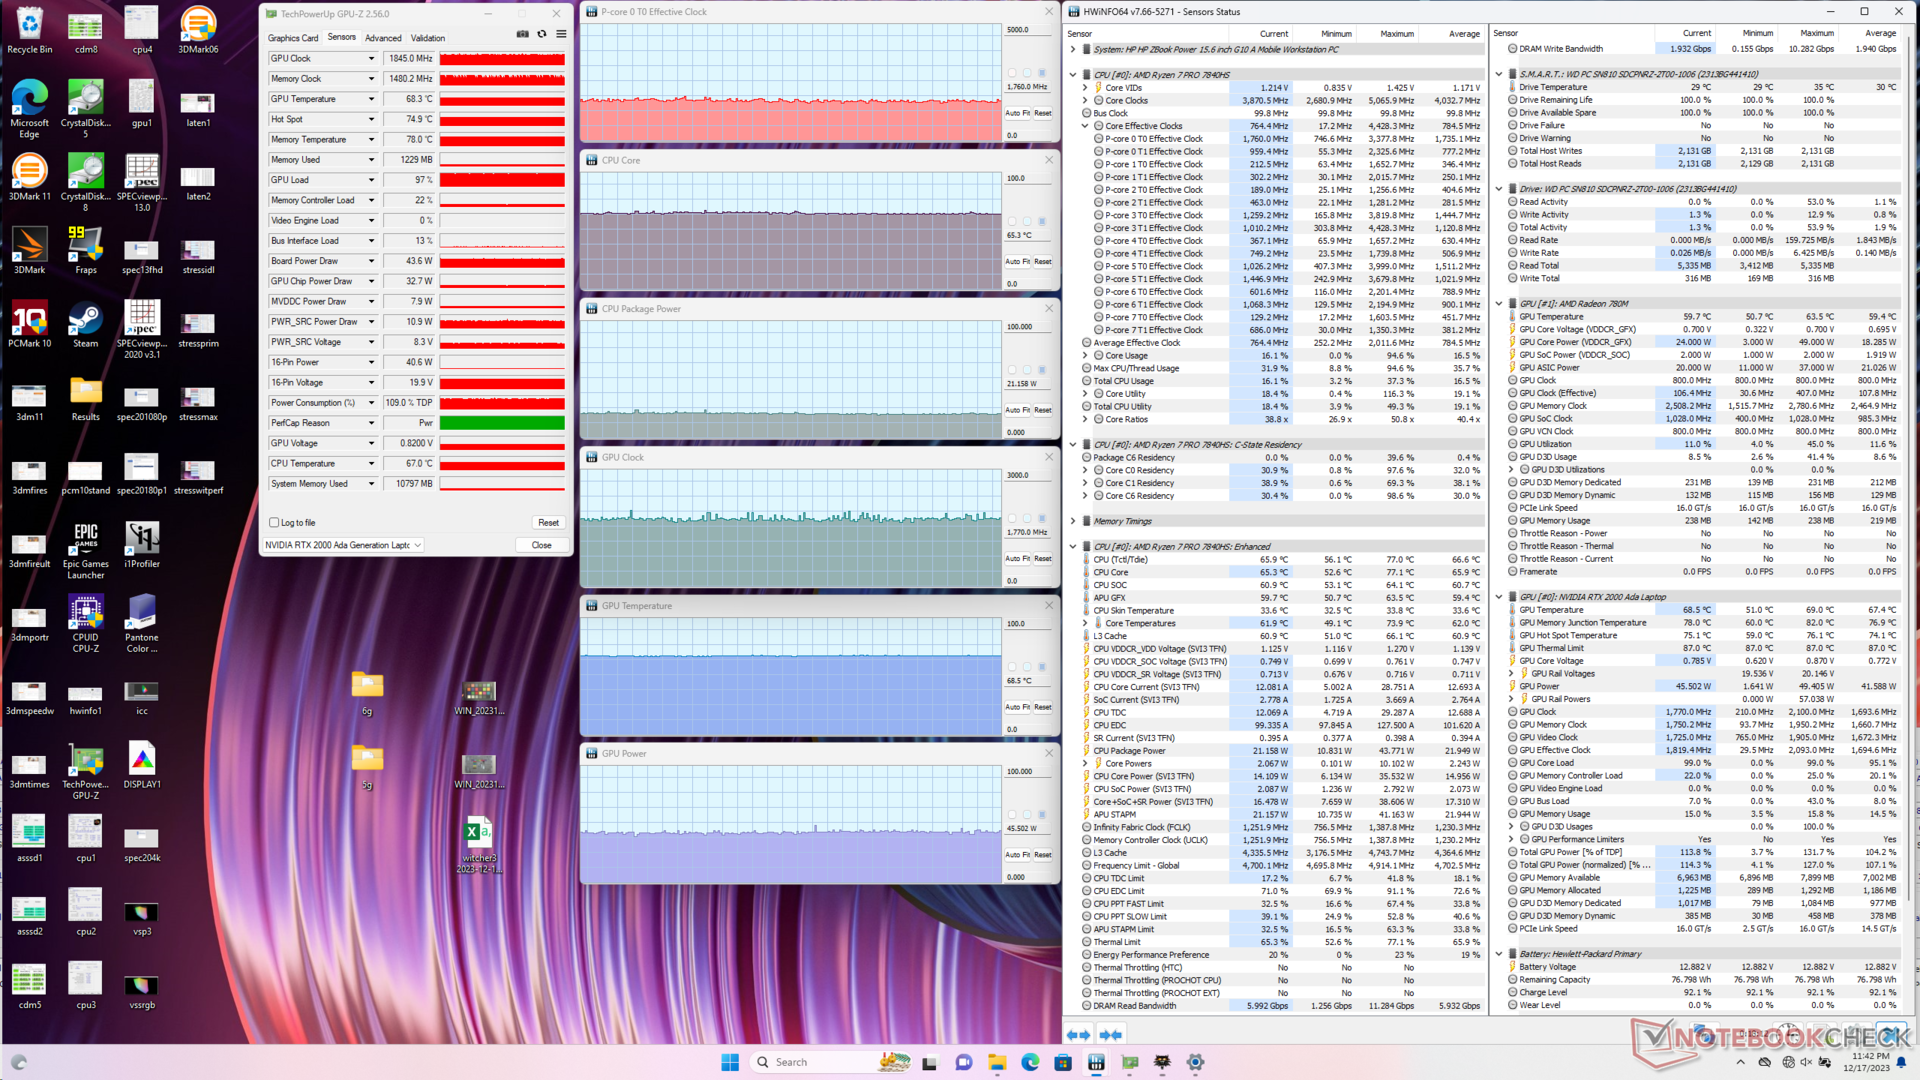
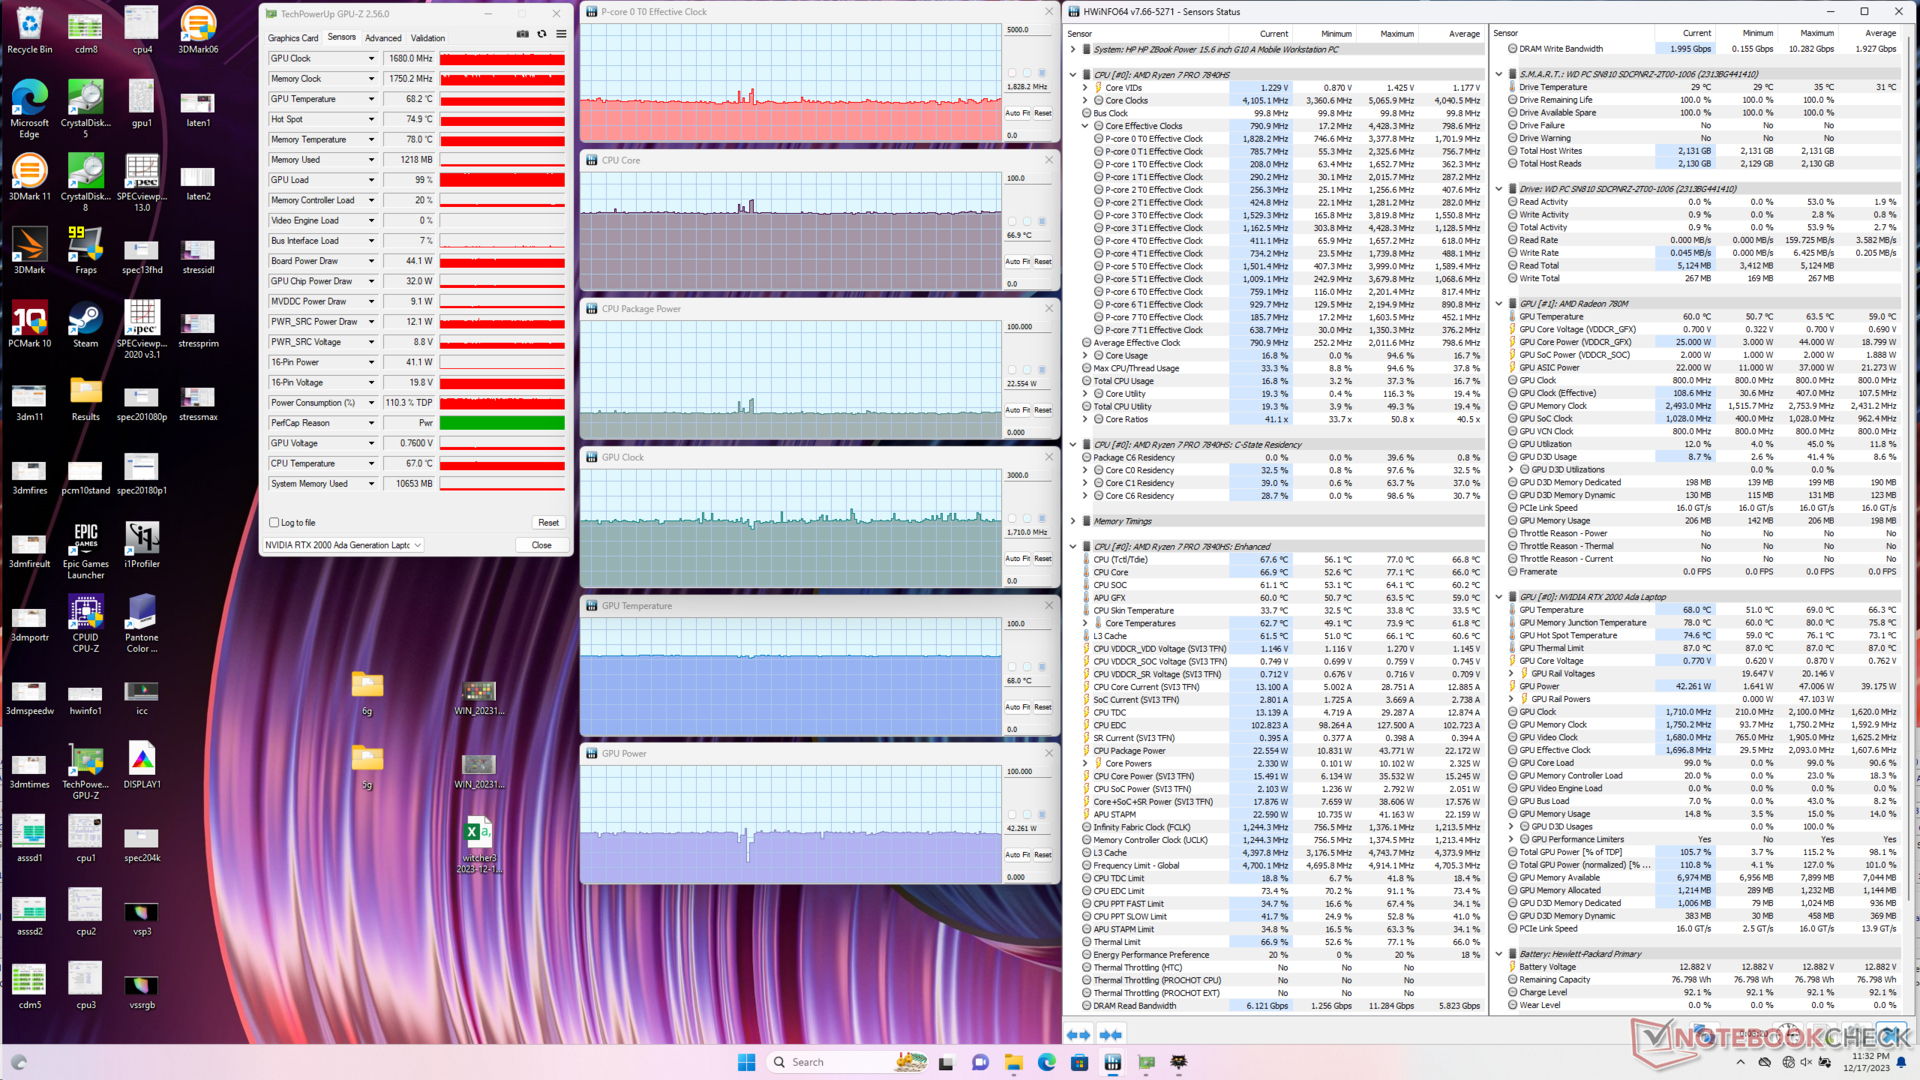
运行 Witcher 3平衡模式与性能模式相比,温度或时钟频率没有明显差异,这与我们在Fire Strike 上的观察结果一致。GPU 板功耗徘徊在 44 W 左右,目标值为 50 W。
| CPU 时钟 (GHz) | GPU 时钟 (MHz) | CPU 平均温度 (°C) | GPU 平均温度(°C) | |
| 系统闲置 | -- | -- | 40 | 40 |
| Prime95 压力 | 4.0 | -- | 87 | 56 |
| Prime95 + FurMark 压力 | 3.8 | 825 | 99 | 83 |
| Witcher 3 压力(平衡模式) | 1.8 | 1770 | 65 | 69 |
| Witcher 3 压力(性能模式) | 1.8 | 1710 | 67 | 68 |
能源管理
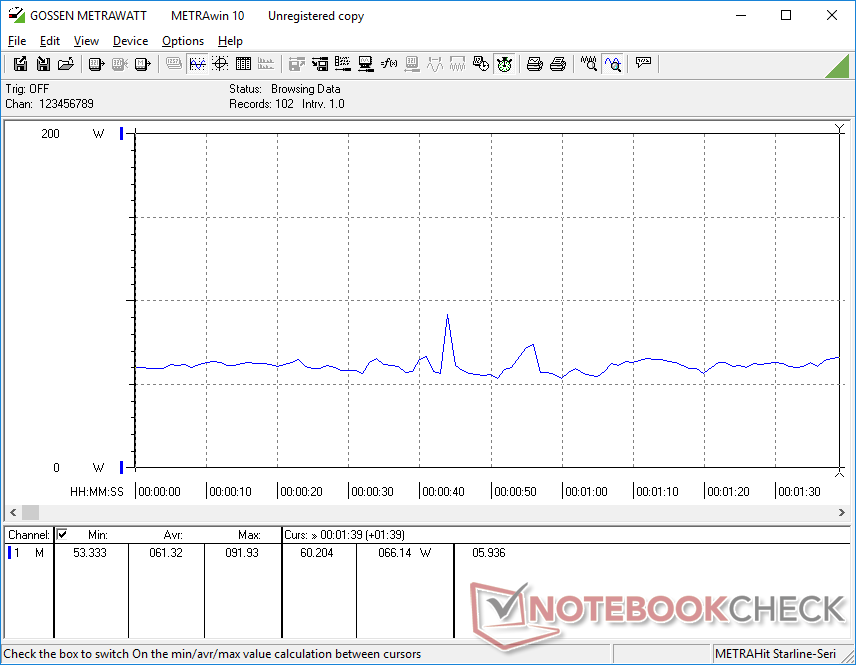
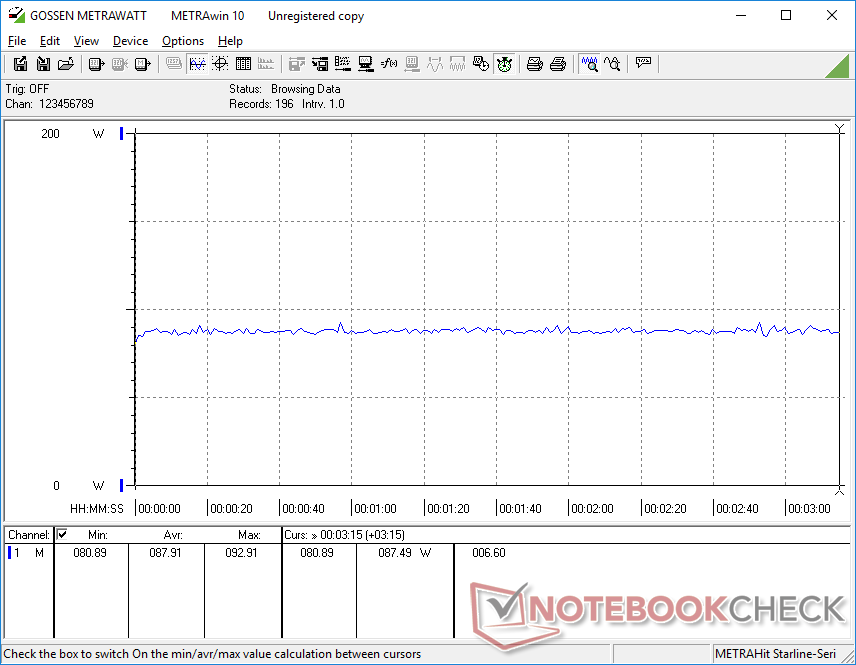
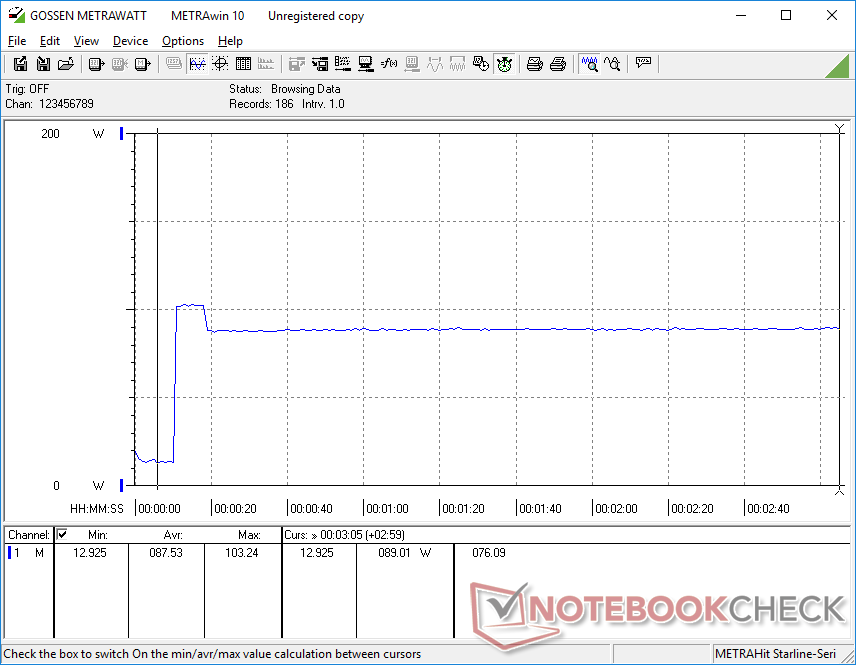
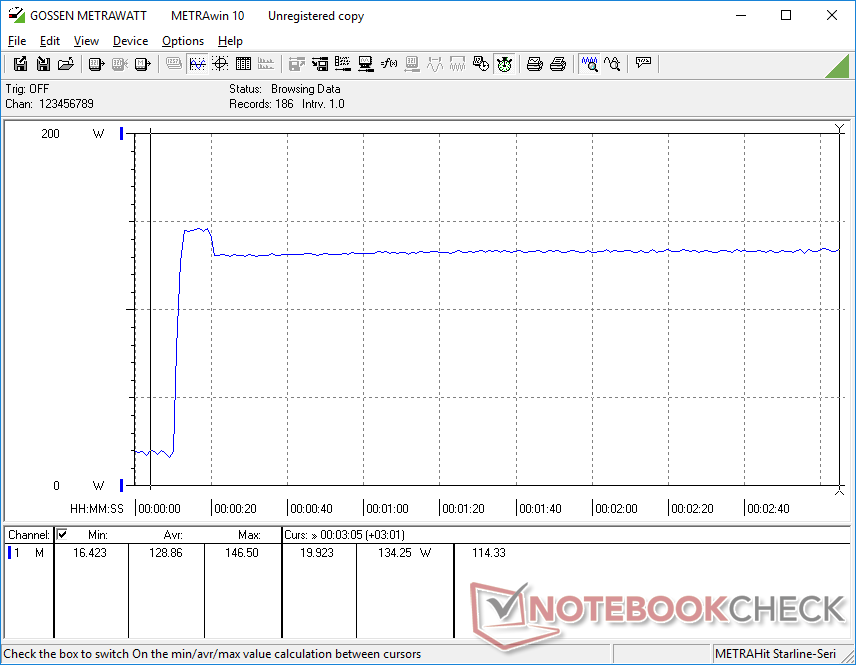
耗电量
总体功耗高于去年的机型,这与我们配置的高性能有关。不过,每瓦性能仍然有利于我们的新机型,尤其是在图形性能方面。例如,与 ZBook Power 15 G9 的酷睿 i7-12700H 相比,运行 Prime95 需要多消耗 16% 的电能,但多线程性能却提高了 20%;而运行 FurMark 只需要多消耗 14% 的电能,但图形性能却提高了 65%。
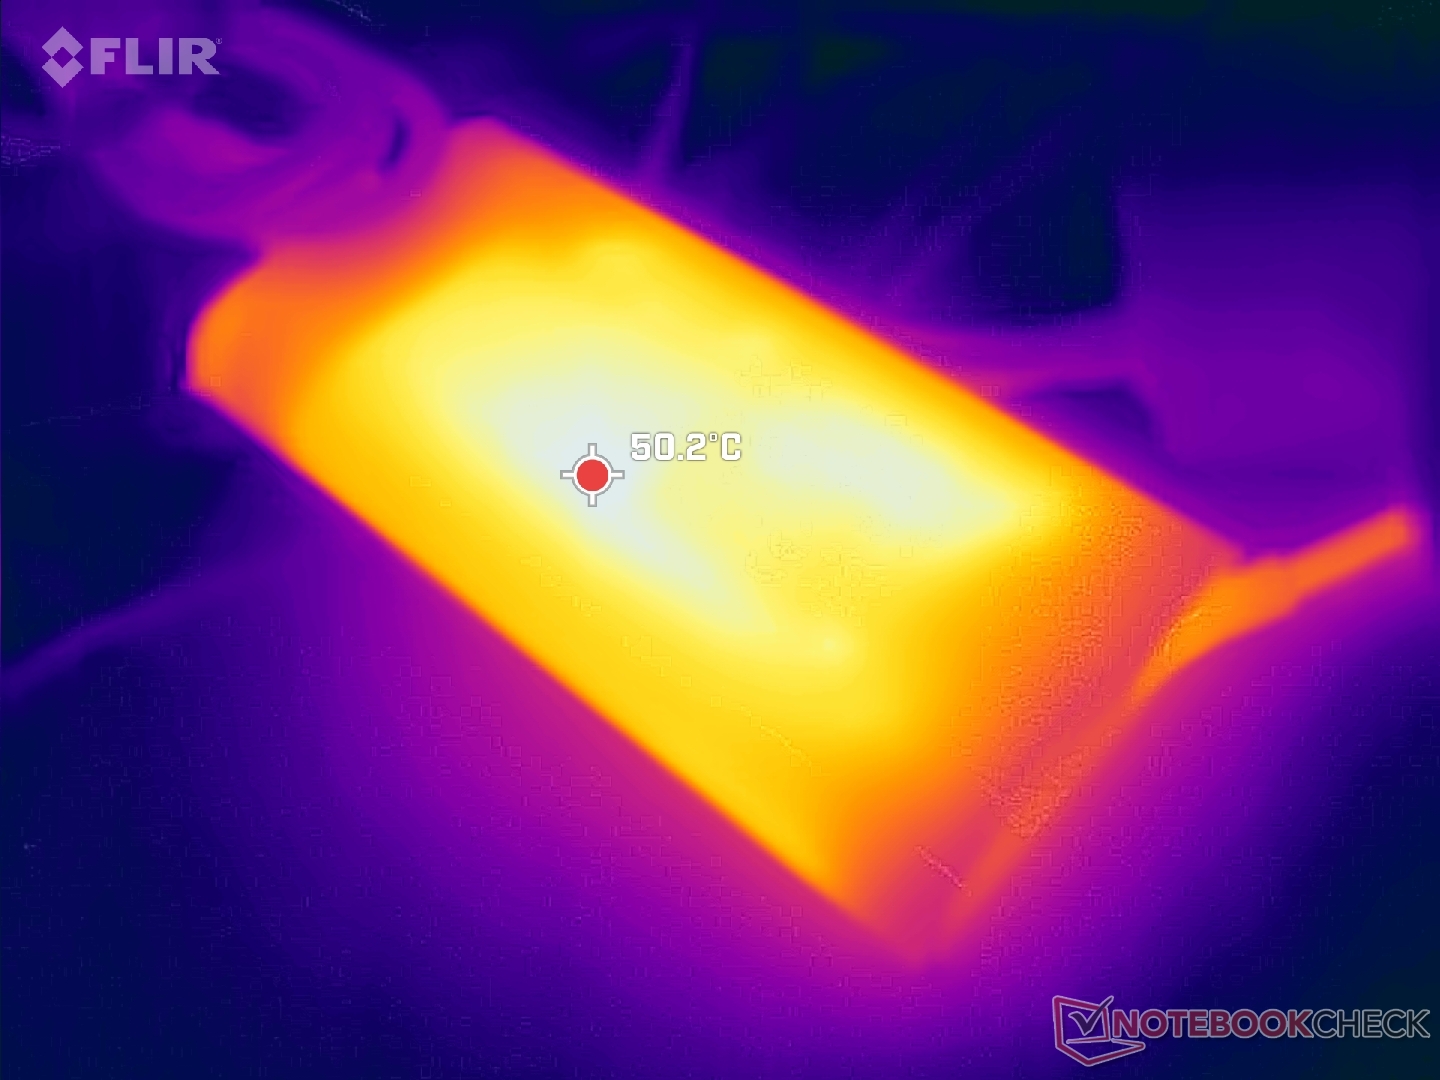
中型(约 13.8 x 6.5 x 2.3 厘米)150 W 交流适配器没有变化,因为 ZBook Power 15 G10 与 ZBook Power 15 G9 的电源包络线相同。但仍支持 USB-C 充电;例如,联想的 135 W USB-C 充电器与惠普的测试设备兼容。
| Off / Standby | |
| Idle | |
| Load |
|
Key:
min: | |
| HP ZBook Power 15 G10 R7 PRO 7840HS, RTX 2000 Ada Generation Laptop, WDC PC SN810 2TB, IPS, 2560x1440, 15.6" | HP ZBook Power 15 G9 6B8C4EA i7-12700H, RTX A2000 Laptop GPU, Samsung PM9A1 MZVL21T0HCLR, IPS, 3840x2160, 15.6" | Lenovo ThinkPad P15v G3 21EM001AGE R7 PRO 6850H, RTX A2000 Laptop GPU, SK Hynix PC711 1TB HFS001TDE9X081N, IPS LED, 3840x2160, 15.6" | Dell Precision 5000 5560 i7-11850H, RTX A2000 Laptop GPU, Samsung PM9A1 MZVL22T0HBLB, IPS, 3840x2400, 15.6" | Lenovo ThinkPad P1 G6-21FV000DGE i9-13900H, RTX 2000 Ada Generation Laptop, SK Hynix PC711 1TB HFS001TDE9X084N, IPS, 2560x1600, 16" | Asus ExpertBook B6 Flip B6602FC2 i9-12950HX, RTX A2000 Laptop GPU, Samsung PM9A1 MZVL21T0HCLR, IPS, 2560x1600, 16" | |
|---|---|---|---|---|---|---|
| Power Consumption | 11% | -11% | -24% | -30% | -81% | |
| Idle Minimum * (Watt) | 5.3 | 3.9 26% | 6.3 -19% | 6.2 -17% | 8.3 -57% | 10.5 -98% |
| Idle Average * (Watt) | 9.9 | 7.2 27% | 13.9 -40% | 13.9 -40% | 14.5 -46% | 11.9 -20% |
| Idle Maximum * (Watt) | 16.7 | 8.5 49% | 14.5 13% | 23.8 -43% | 15.3 8% | 18 -8% |
| Load Average * (Watt) | 61.3 | 87.2 -42% | 82.8 -35% | 95.7 -56% | 91.8 -50% | 182 -197% |
| Witcher 3 ultra * (Watt) | 87.9 | 86.8 1% | 88.8 -1% | 87 1% | 104.7 -19% | 177.5 -102% |
| Load Maximum * (Watt) | 145.3 | 139 4% | 124.8 14% | 132.6 9% | 164.5 -13% | 229 -58% |
* ... smaller is better
Power Consumption Witcher 3 / Stresstest
Power Consumption external Monitor
电池寿命
尽管 CPU、GPU 和显示屏有所不同,但运行时间与我们在去年的机型上记录的几乎完全相同。10 小时的实际浏览时间与许多消费级超极本相差无几。
| HP ZBook Power 15 G10 R7 PRO 7840HS, RTX 2000 Ada Generation Laptop, 83 Wh | HP ZBook Power 15 G9 6B8C4EA i7-12700H, RTX A2000 Laptop GPU, 83 Wh | Lenovo ThinkPad P15v G3 21EM001AGE R7 PRO 6850H, RTX A2000 Laptop GPU, 68 Wh | Dell Precision 5000 5560 i7-11850H, RTX A2000 Laptop GPU, 86 Wh | Lenovo ThinkPad P1 G6-21FV000DGE i9-13900H, RTX 2000 Ada Generation Laptop, 90 Wh | Asus ExpertBook B6 Flip B6602FC2 i9-12950HX, RTX A2000 Laptop GPU, 90 Wh | |
|---|---|---|---|---|---|---|
| Battery runtime | 0% | -31% | -37% | -5% | -13% | |
| WiFi v1.3 (h) | 10 | 10 0% | 6.9 -31% | 6.3 -37% | 9.5 -5% | 8.7 -13% |
| H.264 (h) | 10.7 | 11.2 | 5.8 | |||
| Load (h) | 1.8 | 1.8 | 1.1 | 1.7 | ||
| Reader / Idle (h) | 12 | 12.5 |
Pros
Cons
结论 - 如果没坏就别修
ZBook Power 15 G10 的设计已接近三年。它是目前为数不多的同时搭载 AMD Zen 4 Pro CPU 和 Nvidia RTX Ada GPU 的 16:19 15.6 英寸工作站之一,而这一类别中的大多数其他产品都已转向 16:10 16 英寸外形尺寸,并提供包括 OLED 和 4K 在内的其他显示屏选项。如果较高的外形尺寸和较新的显示屏对你的工作负载很重要,那么你可能要等到惠普更新 ZBook Power 设计,或者寻找其他替代产品,如 联想 ThinkPad P1 G6等替代品。如果不是这样,那么 ZBook Power 15 G10 仍然是一个经典可靠的选择。
对于未来可能推出的 16:10 版本,我们希望惠普能再接再厉,同时支持 ECC RAM 和 ECC VRAM,并且只支持 USB-C 充电。既然下一代 Thunderbolt 可以支持高达 240 W 的 USB-C 充电,那么专有的交流桶式充电器就变得越来越难以证明其合理性。
ZBook Power 15 G10 很可能是惠普最后一款 15.6 英寸工作站,之后该系列将采用更现代的 16:10 设计。
ZBook Power 15 G9 和 G10 之间的主要区别在于,后者配备了 Ada Lovelace GPU,每瓦性能远远高于老式的 Ampere GPU。如果较新的 CPU 和 GPU 有价值,那么建议选择 G10,而不是 G9。除此之外,两款机型的用户体验基本相同,甚至包括电池续航时间。
价格和供应情况
惠普现已开始销售ZBook Power 15 G10,Ryzen 5 配置的起价为 1600 美元,Ryzen 7 和 Nvidia 2000 Ada 或更高配置的起价为 2100 美元。
HP ZBook Power 15 G10
- 12/20/2023 v7 (old)
Allen Ngo
Transparency
The selection of devices to be reviewed is made by our editorial team. The test sample was provided to the author as a loan by the manufacturer or retailer for the purpose of this review. The lender had no influence on this review, nor did the manufacturer receive a copy of this review before publication. There was no obligation to publish this review. As an independent media company, Notebookcheck is not subjected to the authority of manufacturers, retailers or publishers.
This is how Notebookcheck is testing
Every year, Notebookcheck independently reviews hundreds of laptops and smartphones using standardized procedures to ensure that all results are comparable. We have continuously developed our test methods for around 20 years and set industry standards in the process. In our test labs, high-quality measuring equipment is utilized by experienced technicians and editors. These tests involve a multi-stage validation process. Our complex rating system is based on hundreds of well-founded measurements and benchmarks, which maintains objectivity. Further information on our test methods can be found here.
Price comparison

