华硕ROG Zephyrus G GA502DU (Ryzen 7 3750H, GTX 1660 Ti Max-Q) 笔记本电脑评测
| |||||||||||||||||||||||||
Brightness Distribution: 85 %
Center on Battery: 240.1 cd/m²
Contrast: 706:1 (Black: 0.34 cd/m²)
ΔE ColorChecker Calman: 4.2 | ∀{0.5-29.43 Ø4.73}
calibrated: 4.09
ΔE Greyscale Calman: 2.8 | ∀{0.09-98 Ø4.97}
60.4% sRGB (Argyll 1.6.3 3D)
38.4% AdobeRGB 1998 (Argyll 1.6.3 3D)
41.69% AdobeRGB 1998 (Argyll 3D)
60.6% sRGB (Argyll 3D)
40.33% Display P3 (Argyll 3D)
Gamma: 2.2
CCT: 6925 K
| Asus ROG Zephyrus G15 GA502DU Panda LM156LF-CL03, IPS, 15.6", 1920x1080 | Razer Blade 15 RTX 2070 Max-Q LG Philips LGD05C0, IPS, 15.6", 1920x1080 | Asus Zephyrus S GX531GX AU Optronics B156HAN08.2, IPS, 15.6", 1920x1080 | Asus ROG GU501GM-BI7N8 AU Optronics AUO45ED, IPS, 15.6", 1920x1080 | Lenovo Legion Y740-15ICHg LP156WFG-SPB2, IPS, 15.6", 1920x1080 | Gigabyte Aero 15 Classic-XA Sharp LQ156M1JW03 (SHP14C5), IGZO, 15.6", 1920x1080 | Asus Zephyrus S GX502GW AU Optronics B156HAN08.2 (AUO82ED), IPS, 15.6", 1920x1080 | |
|---|---|---|---|---|---|---|---|
| Display | 59% | 58% | 51% | 55% | 60% | 56% | |
| Display P3 Coverage (%) | 40.33 | 65.3 62% | 65.6 63% | 63.4 57% | 63.5 57% | 65.3 62% | 64.9 61% |
| sRGB Coverage (%) | 60.6 | 94.9 57% | 92.2 52% | 87.7 45% | 92.4 52% | 95.5 58% | 91 50% |
| AdobeRGB 1998 Coverage (%) | 41.69 | 66.3 59% | 66.9 60% | 64.7 55% | 66.5 60% | 65.9 58% | |
| Response Times | 55% | 73% | 5% | 49% | 58% | 74% | |
| Response Time Grey 50% / Grey 80% * (ms) | 34 ? | 16.8 ? 51% | 7 ? 79% | 30.8 ? 9% | 18.8 ? 45% | 15.2 ? 55% | 7.2 ? 79% |
| Response Time Black / White * (ms) | 28 ? | 11.6 ? 59% | 9.6 ? 66% | 27.6 ? 1% | 13.2 ? 53% | 11.2 ? 60% | 8.8 ? 69% |
| PWM Frequency (Hz) | 21280 ? | 23580 ? | |||||
| Screen | 31% | 34% | 20% | 23% | 30% | 31% | |
| Brightness middle (cd/m²) | 240.1 | 314.7 31% | 323.6 35% | 286.7 19% | 320.4 33% | 266 11% | 286 19% |
| Brightness (cd/m²) | 231 | 312 35% | 315 36% | 281 22% | 298 29% | 248 7% | 275 19% |
| Brightness Distribution (%) | 85 | 90 6% | 91 7% | 92 8% | 85 0% | 89 5% | 90 6% |
| Black Level * (cd/m²) | 0.34 | 0.38 -12% | 0.29 15% | 0.39 -15% | 0.42 -24% | 0.31 9% | 0.37 -9% |
| Contrast (:1) | 706 | 828 17% | 1116 58% | 735 4% | 763 8% | 858 22% | 773 9% |
| Colorchecker dE 2000 * | 4.2 | 2.56 39% | 3.31 21% | 4.17 1% | 3.21 24% | 2.78 34% | 2.19 48% |
| Colorchecker dE 2000 max. * | 17.8 | 4.89 73% | 5.74 68% | 7.22 59% | 5.54 69% | 5.96 67% | 4.4 75% |
| Colorchecker dE 2000 calibrated * | 4.09 | 1.71 58% | 2.73 33% | 2.36 42% | 0.91 78% | 2.27 44% | |
| Greyscale dE 2000 * | 2.8 | 3.4 -21% | 2.9 -4% | 2.5 11% | 3.6 -29% | 3.58 -28% | 2.2 21% |
| Gamma | 2.2 100% | 2.3 96% | 2.29 96% | 2.274 97% | 2.27 97% | 2.46 89% | 2.41 91% |
| CCT | 6925 94% | 6435 101% | 6765 96% | 6885 94% | 6503 100% | 7186 90% | 6405 101% |
| Color Space (Percent of AdobeRGB 1998) (%) | 38.4 | 60.7 58% | 59.7 55% | 57 48% | 59 54% | 62 61% | 59 54% |
| Color Space (Percent of sRGB) (%) | 60.4 | 94.6 57% | 91.8 52% | 87 44% | 92 52% | 96 59% | 91 51% |
| Total Average (Program / Settings) | 48% /
39% | 55% /
44% | 25% /
22% | 42% /
33% | 49% /
39% | 54% /
41% |
* ... smaller is better
Display Response Times
| ↔ Response Time Black to White | ||
|---|---|---|
| 28 ms ... rise ↗ and fall ↘ combined | ↗ 17.2 ms rise | 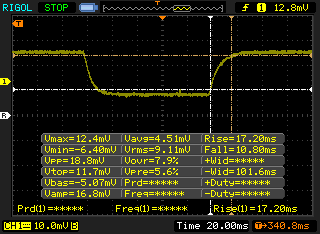 |
| ↘ 10.8 ms fall | ||
| The screen shows relatively slow response rates in our tests and may be too slow for gamers. In comparison, all tested devices range from 0.1 (minimum) to 240 (maximum) ms. » 71 % of all devices are better. This means that the measured response time is worse than the average of all tested devices (19.9 ms). | ||
| ↔ Response Time 50% Grey to 80% Grey | ||
| 34 ms ... rise ↗ and fall ↘ combined | ↗ 17.2 ms rise | 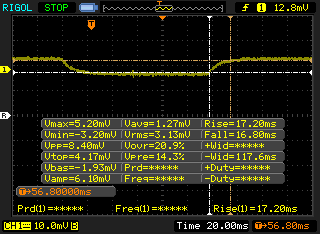 |
| ↘ 16.8 ms fall | ||
| The screen shows slow response rates in our tests and will be unsatisfactory for gamers. In comparison, all tested devices range from 0.165 (minimum) to 636 (maximum) ms. » 47 % of all devices are better. This means that the measured response time is similar to the average of all tested devices (31.1 ms). | ||
Screen Flickering / PWM (Pulse-Width Modulation)
| Screen flickering / PWM detected | 21280 Hz | ≤ 34 % brightness setting | 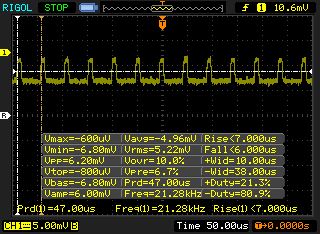 |
The display backlight flickers at 21280 Hz (worst case, e.g., utilizing PWM) Flickering detected at a brightness setting of 34 % and below. There should be no flickering or PWM above this brightness setting. The frequency of 21280 Hz is quite high, so most users sensitive to PWM should not notice any flickering. In comparison: 52 % of all tested devices do not use PWM to dim the display. If PWM was detected, an average of 7801 (minimum: 5 - maximum: 343500) Hz was measured. | |||
| PCMark 8 | |
| Home Score Accelerated v2 | |
| Asus TUF FX505DY | |
| Asus ROG GU501GM-BI7N8 | |
| Asus Zephyrus S GX531GX | |
| MSI GL63 8RC-069US | |
| Asus ROG Zephyrus G15 GA502DU | |
| Work Score Accelerated v2 | |
| Asus Zephyrus S GX531GX | |
| MSI GL63 8RC-069US | |
| Asus TUF FX505DY | |
| Asus ROG GU501GM-BI7N8 | |
| Asus ROG Zephyrus G15 GA502DU | |
| PCMark 8 Home Score Accelerated v2 | 3642 points | |
| PCMark 8 Work Score Accelerated v2 | 4956 points | |
| PCMark 10 Score | 4322 points | |
Help | ||
| Asus ROG Zephyrus G15 GA502DU Intel SSD 660p SSDPEKNW512G8 | Razer Blade 15 RTX 2070 Max-Q Samsung SSD PM981 MZVLB512HAJQ | Asus Zephyrus S GX531GX Intel SSD 660p SSDPEKNW512G8 | Asus ROG GU501GM-BI7N8 Kingston RBUSNS8154P3128GJ | Lenovo Legion Y740-15ICHg Samsung SSD PM981 MZVLB256HAHQ | Gigabyte Aero 15 Classic-XA Intel SSD 760p SSDPEKKW512G8 | |
|---|---|---|---|---|---|---|
| AS SSD | 92% | 7% | -59% | 59% | 60% | |
| Seq Read (MB/s) | 907 | 1840 103% | 1239 37% | 841 -7% | 1953 115% | 2517 178% |
| Seq Write (MB/s) | 926 | 1822 97% | 920 -1% | 404.7 -56% | 1629 76% | 924 0% |
| 4K Read (MB/s) | 47.26 | 52.3 11% | 45.74 -3% | 22.62 -52% | 33.2 -30% | 59.1 25% |
| 4K Write (MB/s) | 98.7 | 110.7 12% | 95.7 -3% | 67.1 -32% | 88.1 -11% | 126.5 28% |
| 4K-64 Read (MB/s) | 321.5 | 1126 250% | 322 0% | 270.3 -16% | 757 135% | 876 172% |
| 4K-64 Write (MB/s) | 736 | 1717 133% | 722 -2% | 237 -68% | 1501 104% | 922 25% |
| Access Time Read * (ms) | 0.064 | 0.047 27% | 0.073 -14% | 0.278 -334% | 0.077 -20% | 0.042 34% |
| Access Time Write * (ms) | 0.045 | 0.033 27% | 0.047 -4% | 0.058 -29% | 0.043 4% | 0.065 -44% |
| Score Read (Points) | 459 | 1362 197% | 492 7% | 377 -18% | 985 115% | 1186 158% |
| Score Write (Points) | 927 | 2010 117% | 910 -2% | 345 -63% | 1752 89% | 1141 23% |
| Score Total (Points) | 1641 | 4079 149% | 1654 1% | 900 -45% | 3230 97% | 2870 75% |
| Copy ISO MB/s (MB/s) | 905 | 1975 118% | 1236 37% | 773 -15% | 1872 107% | 2086 130% |
| Copy Program MB/s (MB/s) | 496.9 | 526 6% | 703 41% | 269.2 -46% | 478.2 -4% | 454.2 -9% |
| Copy Game MB/s (MB/s) | 819 | 1200 47% | 812 -1% | 419.3 -49% | 1165 42% | 1141 39% |
* ... smaller is better

| 3DMark | |
| 1920x1080 Fire Strike Graphics | |
| MSI GE75 9SG | |
| Asus Zephyrus S GX502GW | |
| Razer Blade 15 RTX 2070 Max-Q | |
| Alienware 17 R5 | |
| Schenker Compact 15 | |
| Asus ROG Zephyrus G15 GA502DU | |
| Asus Zephyrus S GX531GM | |
| Acer Nitro 5 | |
| Asus TUF FX705GE-EW096T | |
| Asus TUF FX705DY-AU072 | |
| Acer Swift 3 SF314-55G-768V | |
| 2560x1440 Time Spy Graphics | |
| MSI GE75 9SG | |
| Asus Zephyrus S GX502GW | |
| Razer Blade 15 RTX 2070 Max-Q | |
| Alienware 17 R5 | |
| Schenker Compact 15 | |
| Asus ROG Zephyrus G15 GA502DU | |
| Asus Zephyrus S GX531GM | |
| Acer Nitro 5 | |
| Asus TUF FX705GE-EW096T | |
| Asus TUF FX705DY-AU072 | |
| 3840x2160 Fire Strike Ultra Graphics | |
| MSI GE75 9SG | |
| Razer Blade 15 RTX 2070 Max-Q | |
| Asus ROG Zephyrus G15 GA502DU | |
| Asus Zephyrus S GX531GM | |
| Asus TUF FX705GE-EW096T | |
| Asus TUF FX705DY-AU072 | |
| 1920x1080 Fire Strike Score | |
| MSI GE75 9SG | |
| Asus Zephyrus S GX502GW | |
| Alienware 17 R5 | |
| Razer Blade 15 RTX 2070 Max-Q | |
| Schenker Compact 15 | |
| Asus ROG Zephyrus G15 GA502DU | |
| Asus Zephyrus S GX531GM | |
| Acer Nitro 5 | |
| Asus TUF FX705GE-EW096T | |
| Asus TUF FX705DY-AU072 | |
| Acer Swift 3 SF314-55G-768V | |
| 3DMark 11 | |
| 1280x720 Performance GPU | |
| MSI GE75 9SG | |
| Asus Zephyrus S GX502GW | |
| Alienware 17 R5 | |
| Razer Blade 15 RTX 2070 Max-Q | |
| Schenker Compact 15 | |
| Asus ROG Zephyrus G15 GA502DU | |
| Acer Nitro 5 | |
| Asus Zephyrus S GX531GM | |
| Asus TUF FX705GE-EW096T | |
| Asus TUF FX705DY-AU072 | |
| Acer Swift 3 SF314-55G-768V | |
| 1280x720 Performance Combined | |
| MSI GE75 9SG | |
| Schenker Compact 15 | |
| Alienware 17 R5 | |
| Asus Zephyrus S GX502GW | |
| Razer Blade 15 RTX 2070 Max-Q | |
| Acer Nitro 5 | |
| Asus TUF FX705GE-EW096T | |
| Asus Zephyrus S GX531GM | |
| Asus ROG Zephyrus G15 GA502DU | |
| Asus TUF FX705DY-AU072 | |
| Acer Swift 3 SF314-55G-768V | |
| 3DMark 06 Standard Score | 24029 points | |
| 3DMark Vantage P Result | 31845 points | |
| 3DMark 11 Performance | 12279 points | |
| 3DMark Ice Storm Standard Score | 56479 points | |
| 3DMark Cloud Gate Standard Score | 17712 points | |
| 3DMark Fire Strike Score | 10792 points | |
| 3DMark Time Spy Score | 4547 points | |
Help | ||
| Shadow of the Tomb Raider - 1920x1080 Highest Preset AA:T | |
| Nvidia GeForce GTX 1080 Founders Edition | |
| Alienware m15 P79F | |
| Zotac GeForce GTX 1660 Ti 6 GB | |
| MSI GL73 8SE-010US | |
| Schenker Compact 15 | |
| HP Omen 15-dc0015ng | |
| Asus ROG Zephyrus G15 GA502DU | |
| Acer Nitro 5 | |
| Asus Zephyrus S GX531GM | |
| Asus TUF FX705GE-EW096T | |
| Lenovo ThinkPad X1 Extreme-20MF000XGE | |
| Acer Aspire 5 A515-52G-723L | |
| low | med. | high | ultra | |
|---|---|---|---|---|
| BioShock Infinite (2013) | 183.4 | 102.3 | ||
| The Witcher 3 (2015) | 138.4 | 83.9 | 48.8 | |
| Batman: Arkham Knight (2015) | 89 | 69 | 51 | |
| Metal Gear Solid V (2015) | 60 | 60 | 60 | |
| Rise of the Tomb Raider (2016) | 93.7 | 72.7 | 64.5 | |
| Ashes of the Singularity (2016) | 42.4 | 40.7 | ||
| Overwatch (2016) | 193.7 | 140.7 | 116 | |
| Rocket League (2017) | 206.7 | 160.8 | 141.7 | |
| Middle-earth: Shadow of War (2017) | 91 | 82 | 72 | 61 |
| Fortnite (2018) | 138 | 92.2 | 89.5 | 78.6 |
| Final Fantasy XV Benchmark (2018) | 78.4 | 60.3 | 44.9 | |
| Monster Hunter World (2018) | 66.9 | 59.3 | 59.5 | 50.8 |
| Shadow of the Tomb Raider (2018) | 62 | 57 | 53 | 49 |
| Assassin´s Creed Odyssey (2018) | 48 | 43 | 39 | 33 |
| Apex Legends (2019) | 144 | 105.3 | 90.1 | 89 |
| Metro Exodus (2019) | 96.6 | 53.9 | 46.6 | 35.1 |
| Asus ROG Zephyrus G15 GA502DU GeForce GTX 1660 Ti Max-Q, R7 3750H, Intel SSD 660p SSDPEKNW512G8 | Razer Blade 15 RTX 2070 Max-Q GeForce RTX 2070 Max-Q, i7-8750H, Samsung SSD PM981 MZVLB512HAJQ | Asus Zephyrus S GX531GX GeForce RTX 2080 Max-Q, i7-8750H, Intel SSD 660p SSDPEKNW512G8 | Asus ROG GU501GM-BI7N8 GeForce GTX 1060 Mobile, i7-8750H, Kingston RBUSNS8154P3128GJ | Asus Zephyrus S GX502GW GeForce RTX 2070 Mobile, i7-9750H, 2x Intel SSD 660p SSDPEKNW512G8 (RAID 0) | Acer Aspire Nitro 5 AN515-54-53Z2 GeForce GTX 1650 Mobile, i5-9300H, WDC PC SN520 SDAPNUW-512G | |
|---|---|---|---|---|---|---|
| Noise | 10% | -3% | -0% | -7% | 1% | |
| off / environment * (dB) | 28 | 28.8 -3% | 28.7 -2% | 28.6 -2% | 30 -7% | 30 -7% |
| Idle Minimum * (dB) | 29.4 | 28.8 2% | 29.8 -1% | 31.4 -7% | 31 -5% | 30 -2% |
| Idle Average * (dB) | 31.9 | 28.8 10% | 32.4 -2% | 31.4 2% | 33 -3% | 31 3% |
| Idle Maximum * (dB) | 33 | 29.4 11% | 38 -15% | 34.2 -4% | 38 -15% | 33 -0% |
| Load Average * (dB) | 41.2 | 35.7 13% | 38.2 7% | 42.8 -4% | 50 -21% | 46 -12% |
| Witcher 3 ultra * (dB) | 53.8 | 42.5 21% | 56.6 -5% | 50.9 5% | 53 1% | 46 14% |
| Load Maximum * (dB) | 55.7 | 45 19% | 56.6 -2% | 50.9 9% | 56 -1% | 49 12% |
* ... smaller is better
Noise level
| Idle |
| 29.4 / 31.9 / 33 dB(A) |
| Load |
| 41.2 / 55.7 dB(A) |
 | ||
30 dB silent 40 dB(A) audible 50 dB(A) loud |
||
min: | ||
(-) The maximum temperature on the upper side is 55.8 °C / 132 F, compared to the average of 40.4 °C / 105 F, ranging from 21.2 to 68.8 °C for the class Gaming.
(-) The bottom heats up to a maximum of 58.2 °C / 137 F, compared to the average of 43.2 °C / 110 F
(+) In idle usage, the average temperature for the upper side is 27 °C / 81 F, compared to the device average of 33.9 °C / 93 F.
(±) Playing The Witcher 3, the average temperature for the upper side is 35.7 °C / 96 F, compared to the device average of 33.9 °C / 93 F.
(+) The palmrests and touchpad are cooler than skin temperature with a maximum of 27.6 °C / 81.7 F and are therefore cool to the touch.
(±) The average temperature of the palmrest area of similar devices was 28.8 °C / 83.8 F (+1.2 °C / 2.1 F).
Asus ROG Zephyrus G15 GA502DU audio analysis
(+) | speakers can play relatively loud (88.8 dB)
Bass 100 - 315 Hz
(±) | reduced bass - on average 12.5% lower than median
(±) | linearity of bass is average (12.5% delta to prev. frequency)
Mids 400 - 2000 Hz
(±) | higher mids - on average 6.2% higher than median
(±) | linearity of mids is average (7.7% delta to prev. frequency)
Highs 2 - 16 kHz
(+) | balanced highs - only 3.5% away from median
(±) | linearity of highs is average (9.2% delta to prev. frequency)
Overall 100 - 16.000 Hz
(±) | linearity of overall sound is average (17.2% difference to median)
Compared to same class
» 46% of all tested devices in this class were better, 11% similar, 42% worse
» The best had a delta of 6%, average was 18%, worst was 132%
Compared to all devices tested
» 32% of all tested devices were better, 8% similar, 60% worse
» The best had a delta of 4%, average was 24%, worst was 134%
Apple MacBook 12 (Early 2016) 1.1 GHz audio analysis
(+) | speakers can play relatively loud (83.6 dB)
Bass 100 - 315 Hz
(±) | reduced bass - on average 11.3% lower than median
(±) | linearity of bass is average (14.2% delta to prev. frequency)
Mids 400 - 2000 Hz
(+) | balanced mids - only 2.4% away from median
(+) | mids are linear (5.5% delta to prev. frequency)
Highs 2 - 16 kHz
(+) | balanced highs - only 2% away from median
(+) | highs are linear (4.5% delta to prev. frequency)
Overall 100 - 16.000 Hz
(+) | overall sound is linear (10.2% difference to median)
Compared to same class
» 7% of all tested devices in this class were better, 2% similar, 91% worse
» The best had a delta of 5%, average was 18%, worst was 53%
Compared to all devices tested
» 5% of all tested devices were better, 1% similar, 94% worse
» The best had a delta of 4%, average was 24%, worst was 134%
| Off / Standby | |
| Idle | |
| Load |
|
Key:
min: | |
| Asus ROG Zephyrus G15 GA502DU R7 3750H, GeForce GTX 1660 Ti Max-Q, Intel SSD 660p SSDPEKNW512G8, IPS, 1920x1080, 15.6" | Razer Blade 15 RTX 2070 Max-Q i7-8750H, GeForce RTX 2070 Max-Q, Samsung SSD PM981 MZVLB512HAJQ, IPS, 1920x1080, 15.6" | Asus Zephyrus S GX531GX i7-8750H, GeForce RTX 2080 Max-Q, Intel SSD 660p SSDPEKNW512G8, IPS, 1920x1080, 15.6" | Asus ROG GU501GM-BI7N8 i7-8750H, GeForce GTX 1060 Mobile, Kingston RBUSNS8154P3128GJ, IPS, 1920x1080, 15.6" | Acer Aspire Nitro 5 AN515-54-53Z2 i5-9300H, GeForce GTX 1650 Mobile, WDC PC SN520 SDAPNUW-512G, IPS, 1920x1080, 15.6" | Lenovo Legion Y730-15ICH i5-8300H i5-8300H, GeForce GTX 1050 Ti Mobile, Intel Optane 16 GB MEMPEK1J016GAL + HGST ST1000LM049 1 TB HDD, IPS, 1920x1080, 15.6" | |
|---|---|---|---|---|---|---|
| Power Consumption | -27% | -64% | -39% | 19% | -2% | |
| Idle Minimum * (Watt) | 7.4 | 10.4 -41% | 16.1 -118% | 12.35 -67% | 5 32% | 8 -8% |
| Idle Average * (Watt) | 8.6 | 14.6 -70% | 20.9 -143% | 19.98 -132% | 7 19% | 11.8 -37% |
| Idle Maximum * (Watt) | 39.1 | 16.3 58% | 27 31% | 25.44 35% | 11 72% | 13.1 66% |
| Load Average * (Watt) | 65.9 | 88.5 -34% | 93.4 -42% | 94.28 -43% | 89 -35% | 90.2 -37% |
| Witcher 3 ultra * (Watt) | 106.9 | 155.4 -45% | 168.2 -57% | 132.9 -24% | 90 16% | 107.8 -1% |
| Load Maximum * (Watt) | 141.3 | 182.4 -29% | 215.3 -52% | 140.63 -0% | 132 7% | 136.2 4% |
* ... smaller is better
| Asus ROG Zephyrus G15 GA502DU R7 3750H, GeForce GTX 1660 Ti Max-Q, 76 Wh | Razer Blade 15 RTX 2070 Max-Q i7-8750H, GeForce RTX 2070 Max-Q, 80 Wh | Asus Zephyrus S GX531GX i7-8750H, GeForce RTX 2080 Max-Q, 50 Wh | Asus ROG GU501GM-BI7N8 i7-8750H, GeForce GTX 1060 Mobile, 55 Wh | Lenovo Legion Y740-15ICHg i7-8750H, GeForce RTX 2070 Max-Q, 57 Wh | Acer Aspire Nitro 5 AN515-54-53Z2 i5-9300H, GeForce GTX 1650 Mobile, 57 Wh | |
|---|---|---|---|---|---|---|
| Battery runtime | -24% | -62% | -61% | -67% | -5% | |
| Reader / Idle (h) | 15.3 | 11.4 -25% | 4.5 -71% | 3.9 -75% | 17.4 14% | |
| WiFi v1.3 (h) | 8 | 6.5 -19% | 3 -62% | 4 -50% | 2.8 -65% | 8.1 1% |
| Load (h) | 2.1 | 1.5 -29% | 0.8 -62% | 0.8 -62% | 1.5 -29% |
Pros
Cons
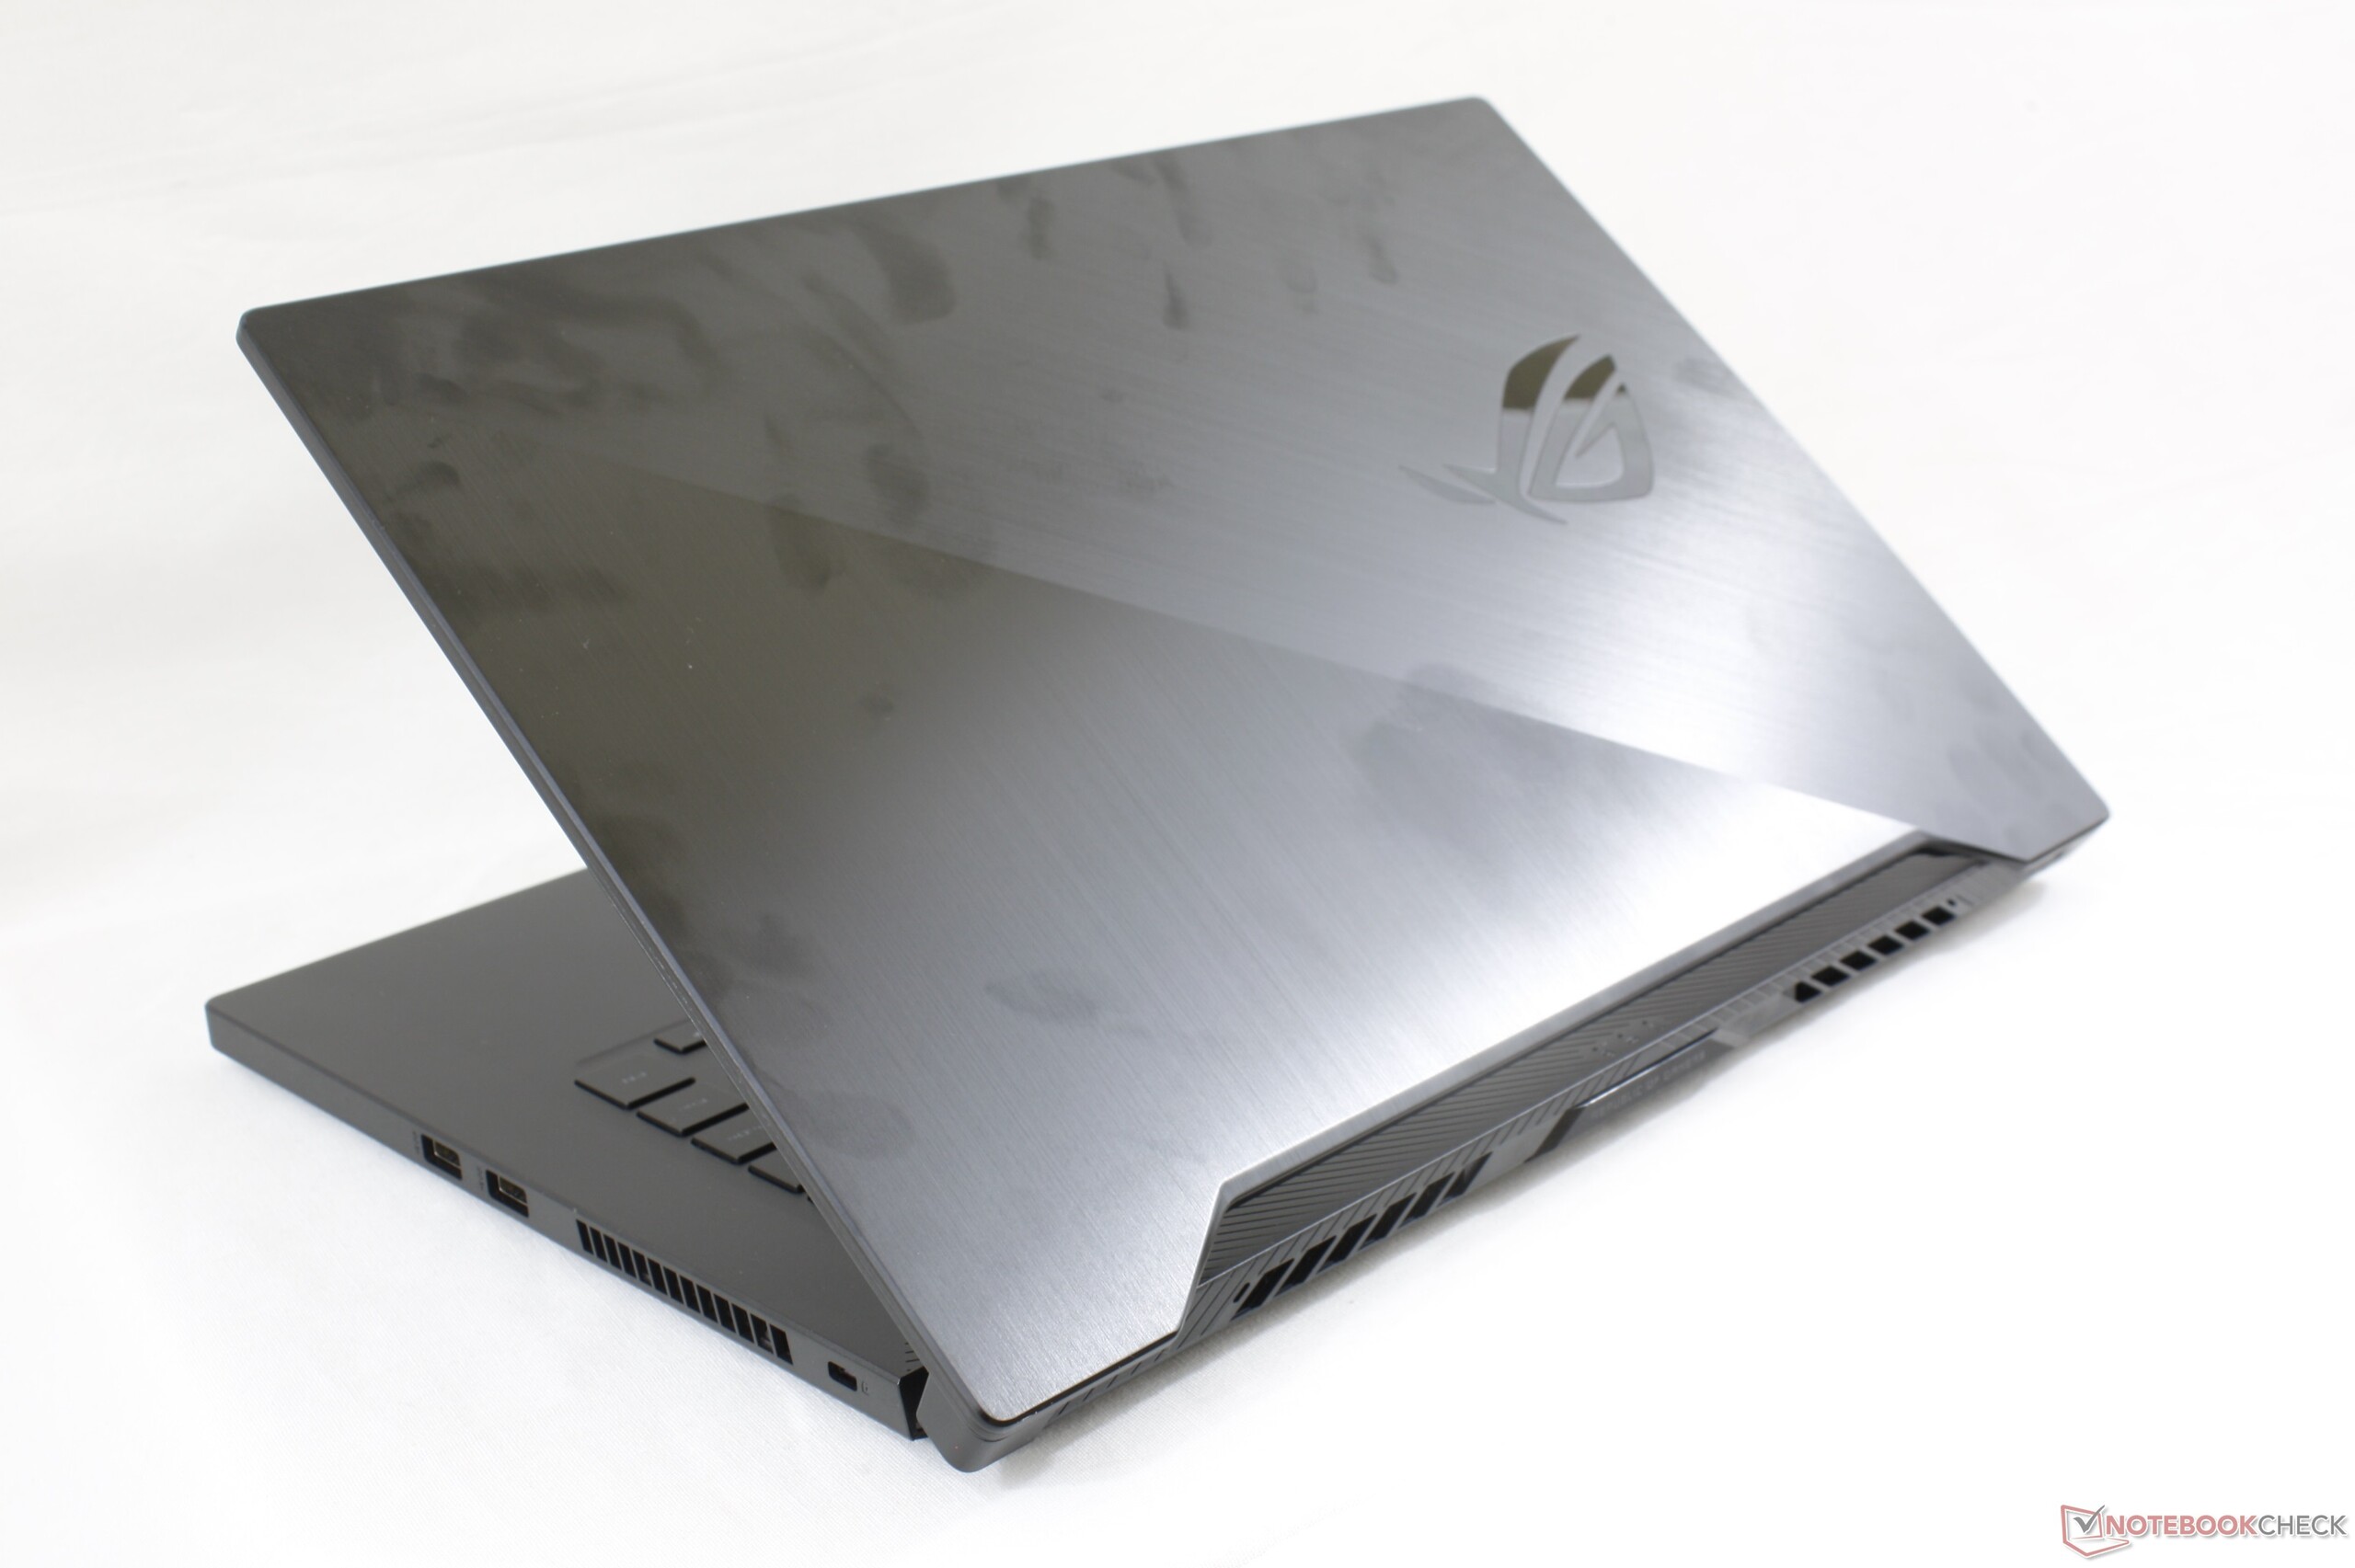
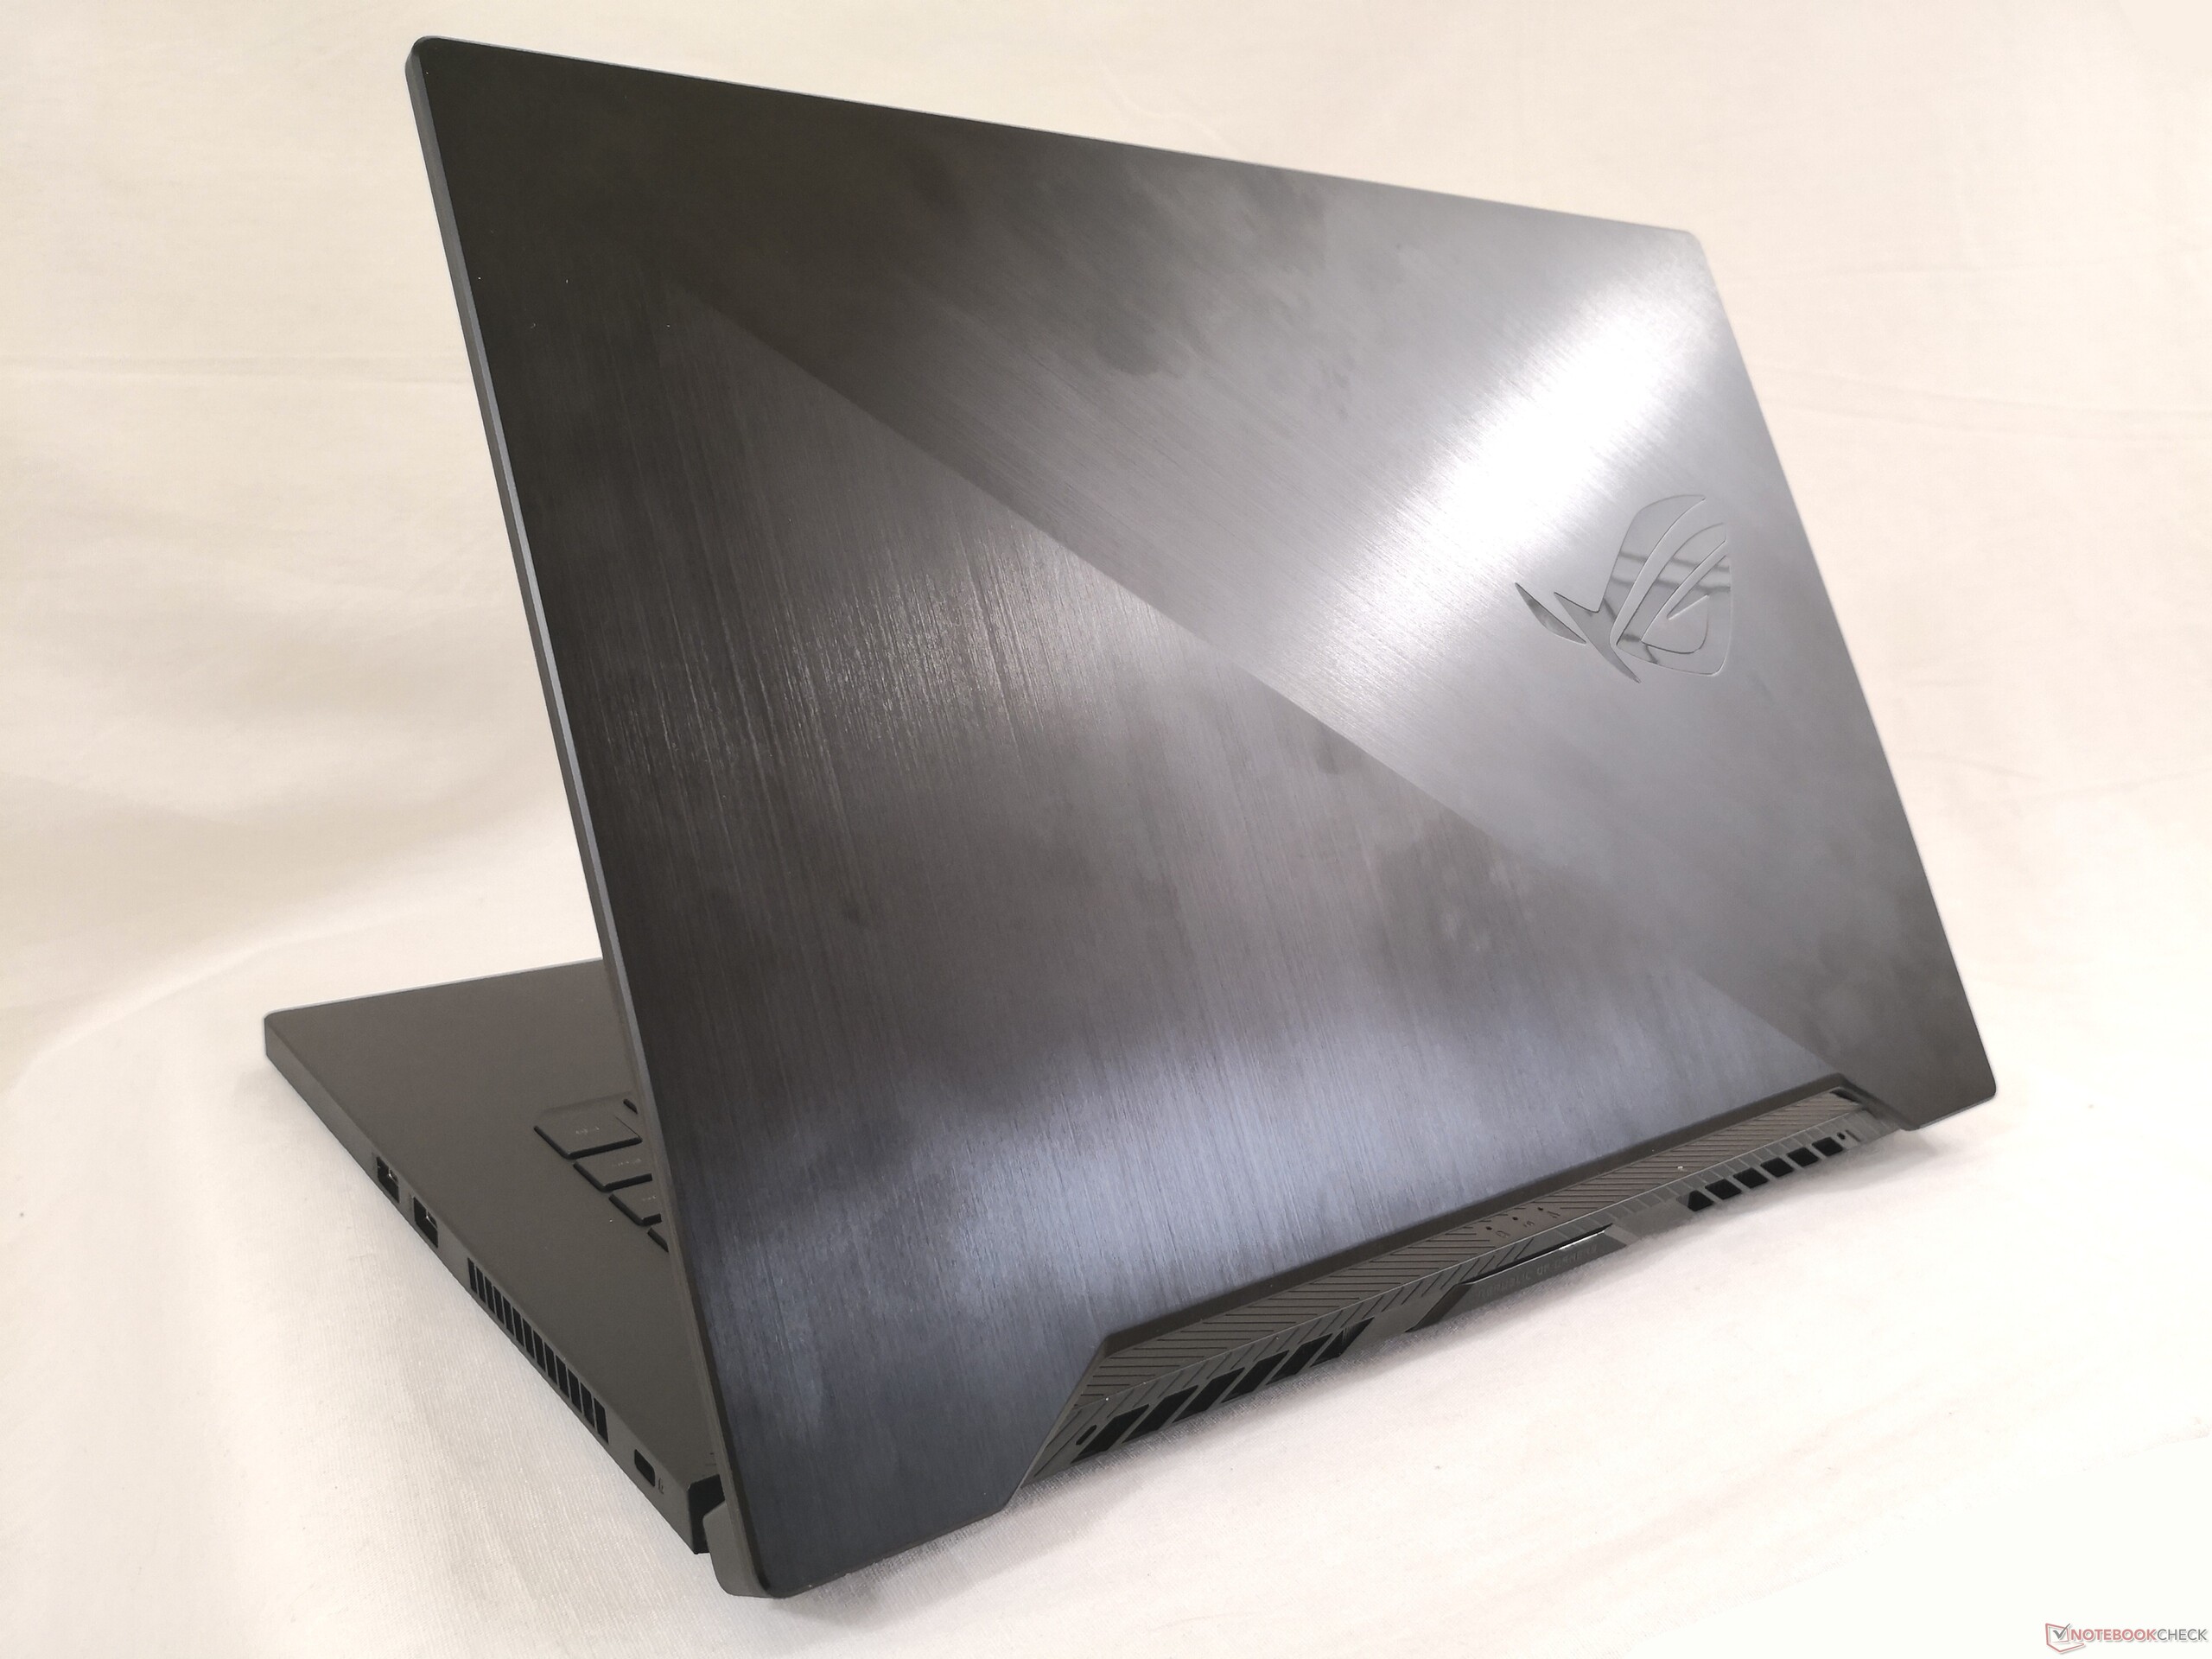
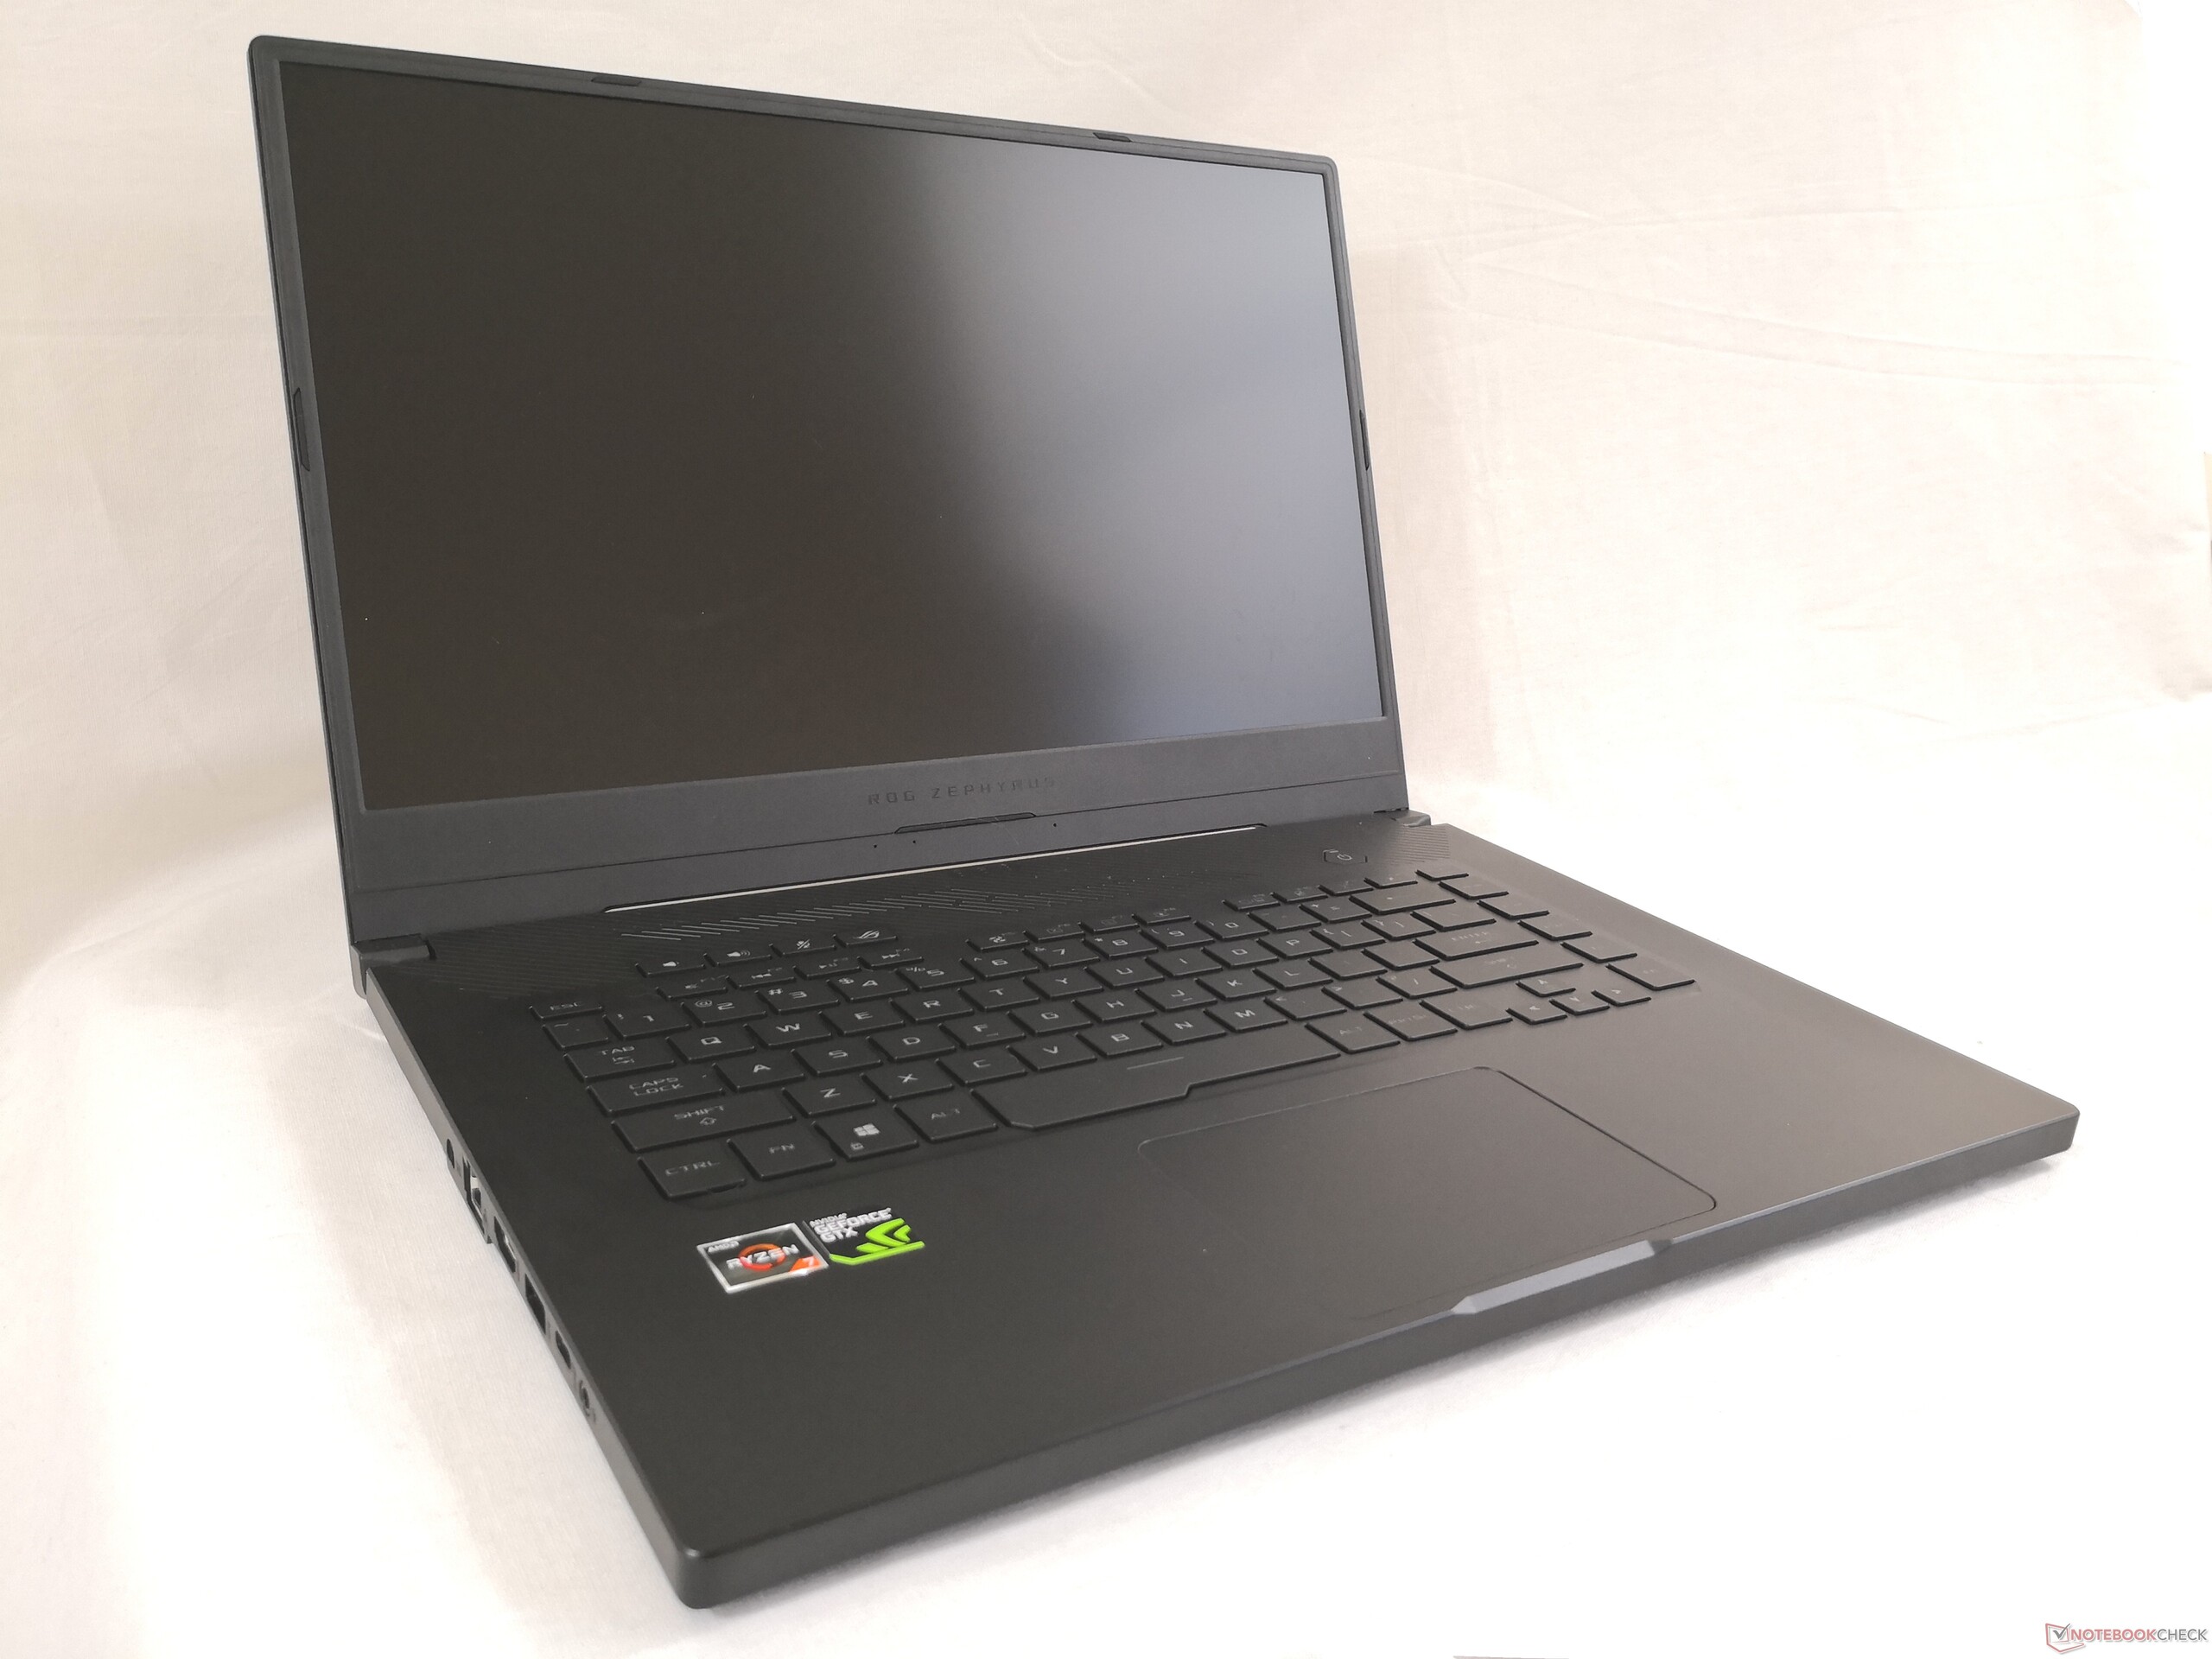
廉价游戏笔记本电脑因其无聊的外观,廉价的塑料和较厚的外形而臭名昭着。与超极本相比,拥有性能更强的CPU和GPU通常需要付出代价。对于一些低预算游戏玩家来说,无聊的设计对他们来说可能并不重要,只要有足够性能来运行最新的游戏就行了。但是,如果我们告诉您这个世界上存在这么一台便宜的笔记本电脑,它既有昂贵的超薄设计又有比GTX 1060更好的性能呢?
华硕Zephyrus G GA502GU经过精心调校,可以在此价格范围内平衡游戏性能和外观,可能比任何其他游戏笔记本更好。1000美元标志了入门级游戏系统,如Acer Nitro 5,MSI GF / GP系列,戴尔G5,沃尔玛Overpowered 15系列,以及配备GTX 1050 Ti,GTX 1060或GTX 1650显卡的HP Pavilion Gaming。GA502GU凭借其更强大的GTX 1660 Ti Max-Q GPU可以胜过这些竞品,同时以相同的价格实现更薄,更省电,更豪华的设计。
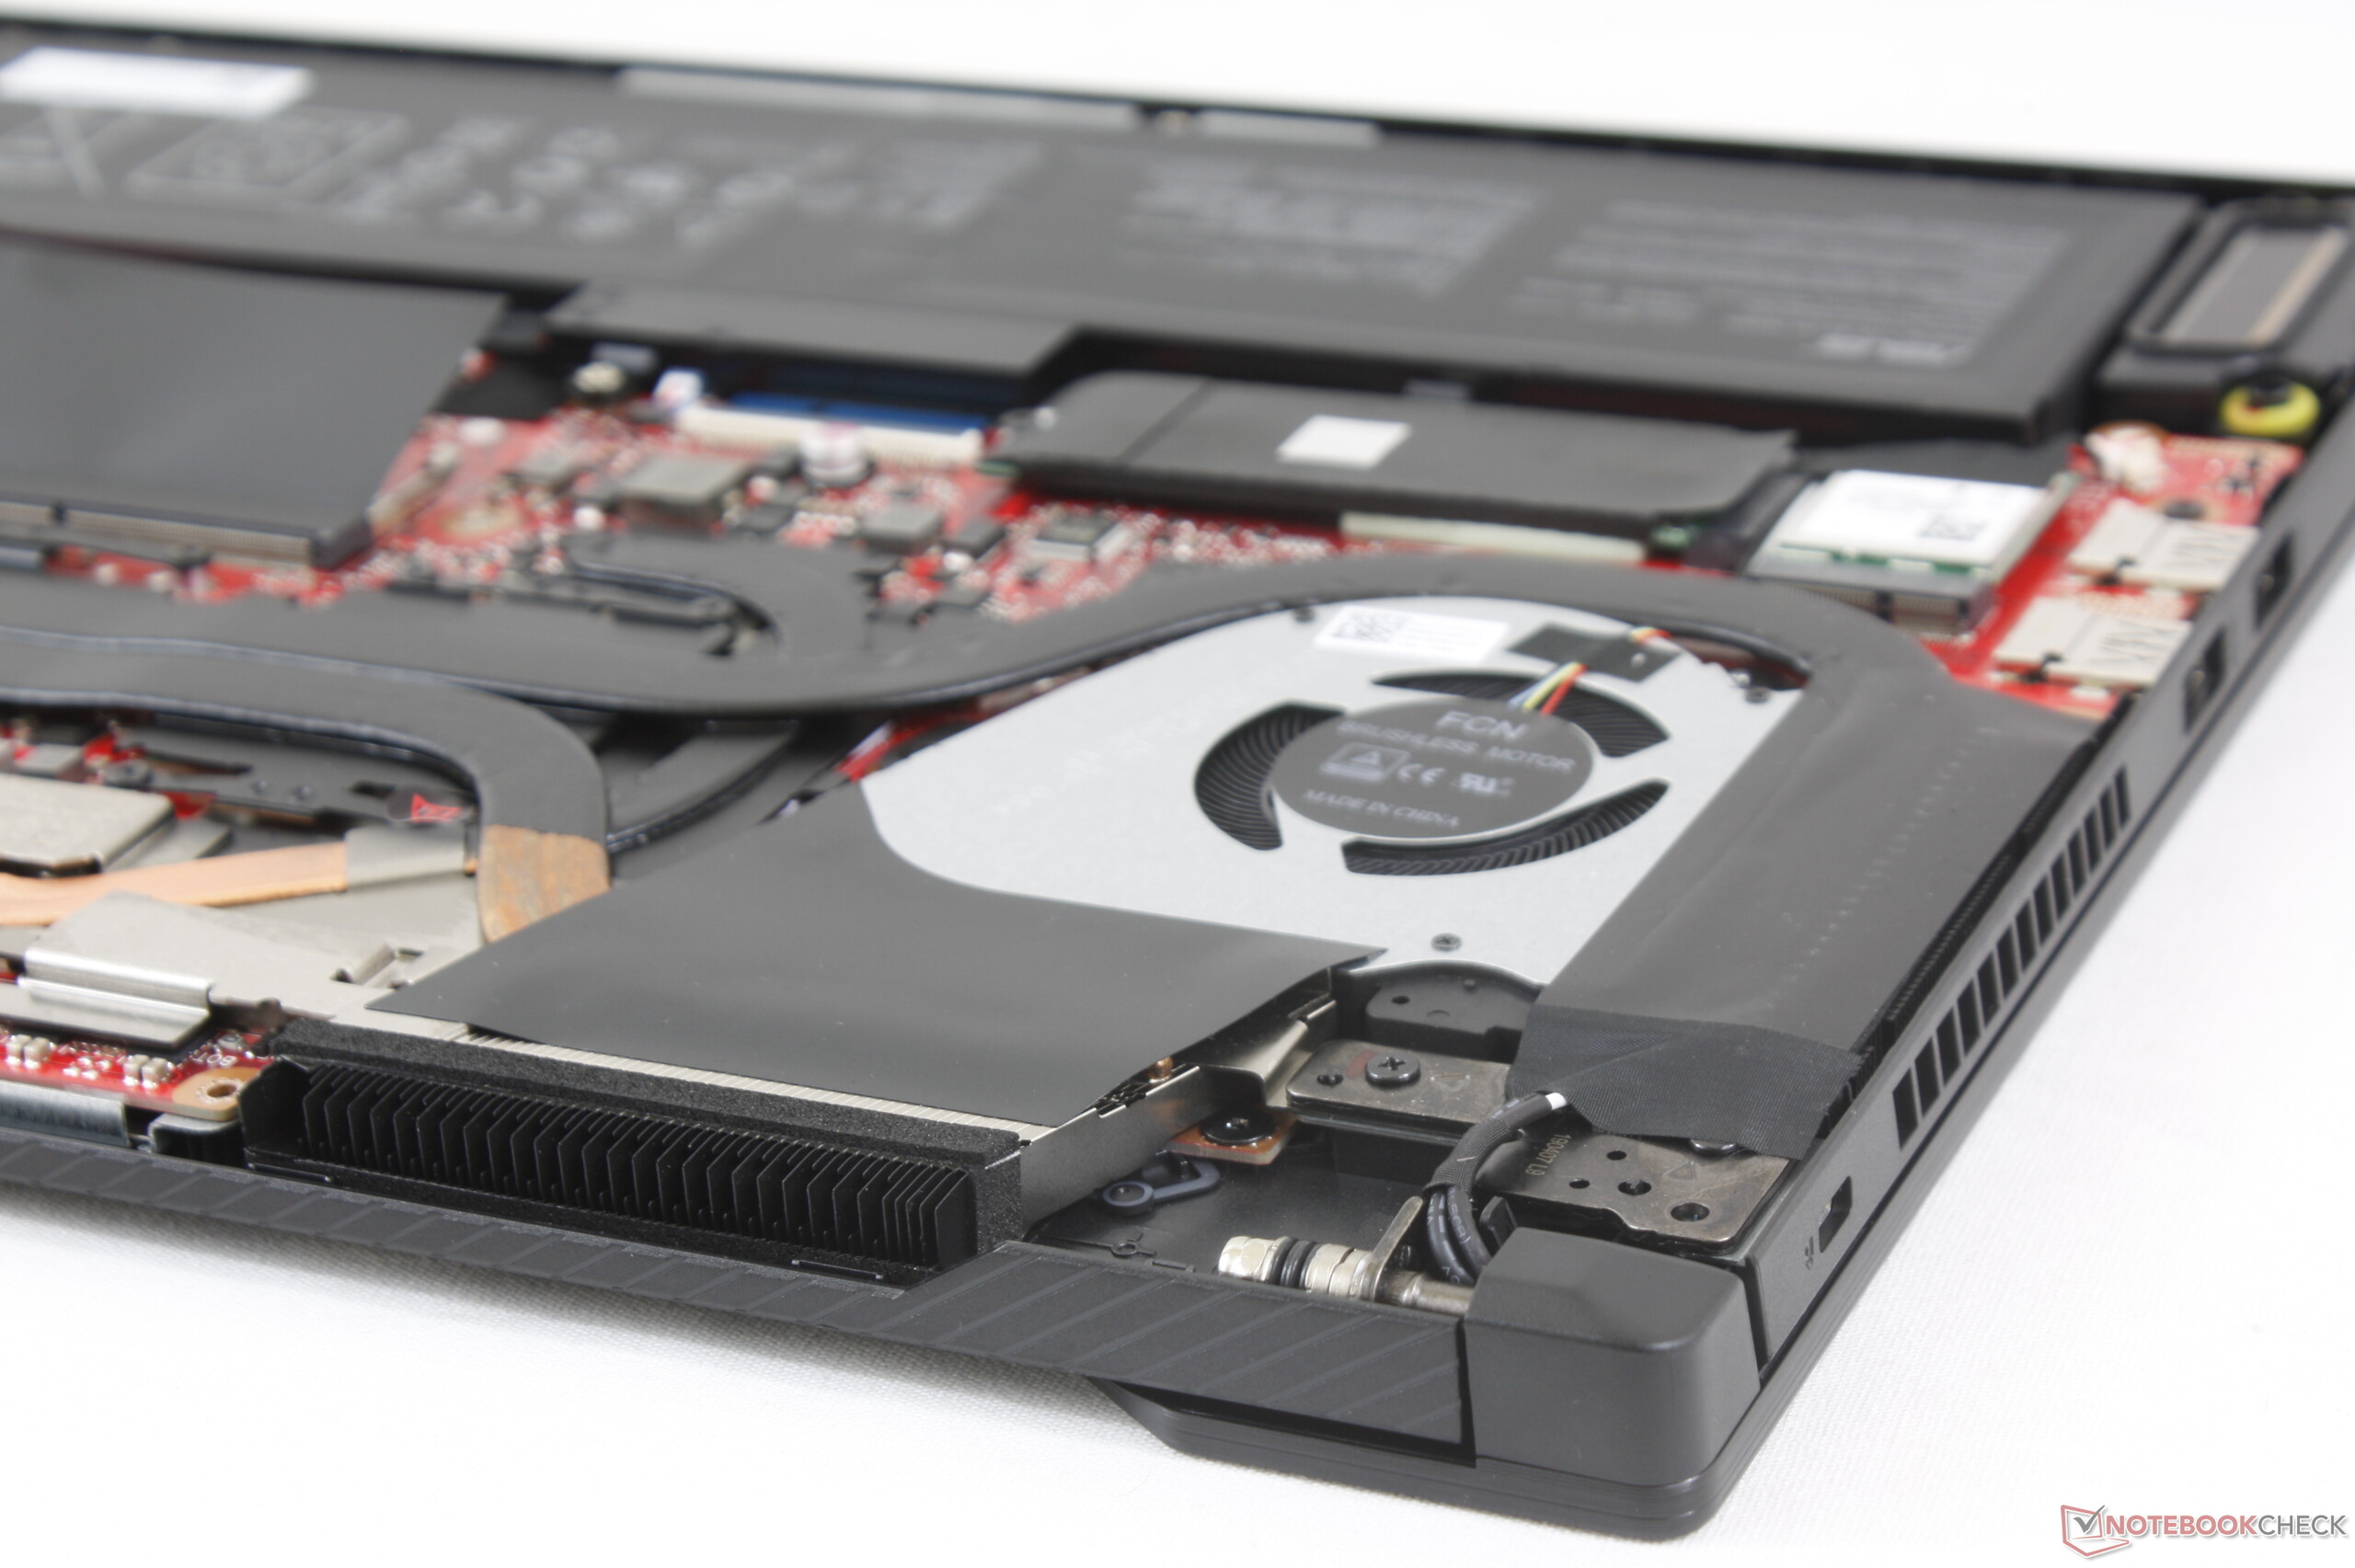
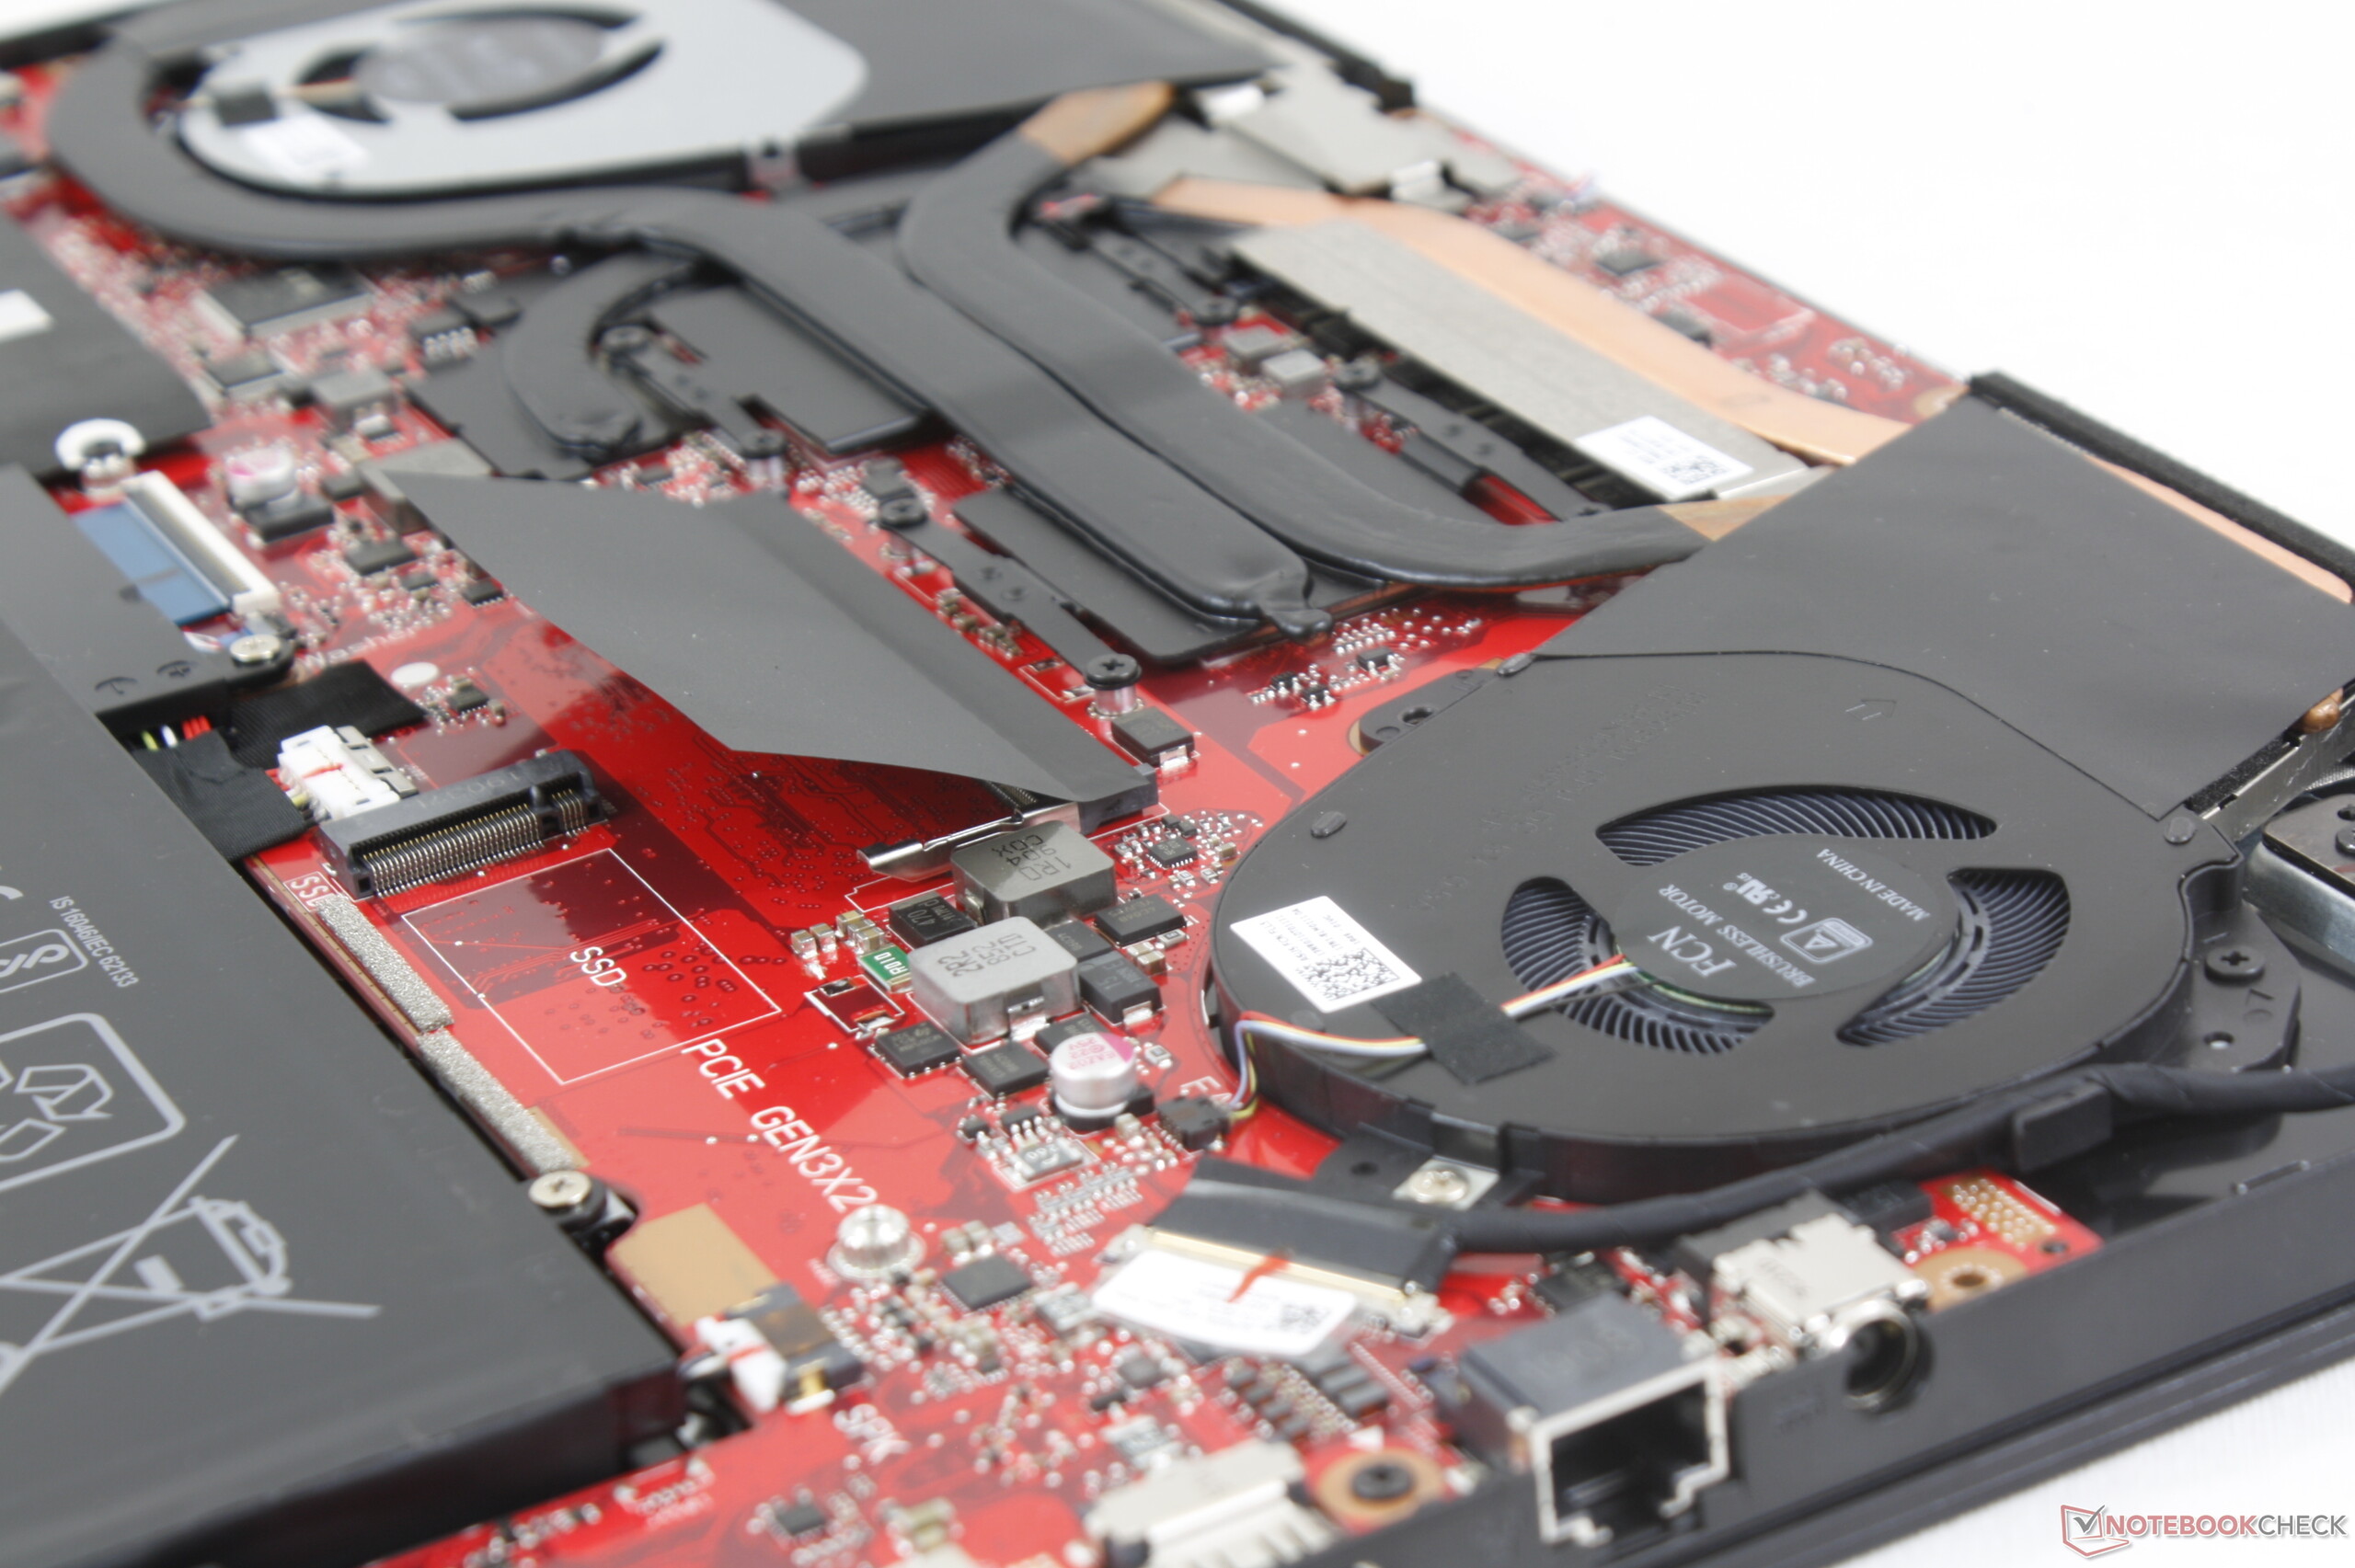
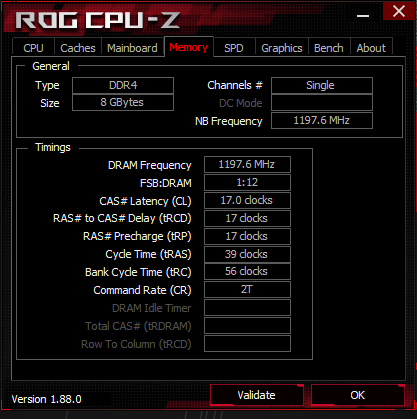
为了在经济实惠的水平上提供顶级外观和性能,必须有些用料不佳的地方:屏幕比大多数更暗,色域窄,重影更明显,M.2 2280 NVMe插槽都是半速,没有集成的网络摄像头或G-Sync,基本SKU仅包含8 GB的单通道RAM。在最坏的情况下,这些限制都会减少1080p下的游戏体验,幸运的是,如果需要,RAM很容易扩展。希望未来的更新能够解决游戏时风扇噪音的问题。
旗舰产品以低价格出现在中档游戏本中。在Ryzen的帮助下,与市场上其他的廉价英特尔酷睿i5游戏笔记本电脑相比,华硕已经提高了廉价游戏笔记本电脑的外观,触感和性能。
Asus ROG Zephyrus G15 GA502DU
- 05/30/2019 v6 (old)
Allen Ngo
Price comparison

