惠普光影精灵笔记本电脑评测:一台安静的游戏本
| SD Card Reader | |
| average JPG Copy Test (av. of 3 runs) | |
| Dell XPS 15 9570 Core i9 UHD (Toshiba Exceria Pro SDXC 64 GB UHS-II) | |
| HP Omen 17t-3AW55AV_1 (Toshiba Exceria Pro SDXC 64 GB UHS-II) | |
| HP Pavilion Gaming 17-cd0085cl (Toshiba Exceria Pro SDXC 64 GB UHS-II) | |
| MSI GP75 Leopard 9SD (Toshiba Exceria Pro SDXC 64 GB UHS-II) | |
| maximum AS SSD Seq Read Test (1GB) | |
| Dell XPS 15 9570 Core i9 UHD (Toshiba Exceria Pro SDXC 64 GB UHS-II) | |
| HP Omen 17t-3AW55AV_1 (Toshiba Exceria Pro SDXC 64 GB UHS-II) | |
| HP Pavilion Gaming 17-cd0085cl (Toshiba Exceria Pro SDXC 64 GB UHS-II) | |
| MSI GP75 Leopard 9SD (Toshiba Exceria Pro SDXC 64 GB UHS-II) | |
| Networking | |
| iperf3 transmit AX12 | |
| Razer Blade Pro 17 RTX 2080 Max-Q | |
| MSI GP75 Leopard 9SD | |
| HP Pavilion Gaming 17-cd0085cl | |
| Lenovo Legion Y740-17ICH | |
| Asus TUF FX705DT-AU068T | |
| iperf3 receive AX12 | |
| MSI GP75 Leopard 9SD | |
| Razer Blade Pro 17 RTX 2080 Max-Q | |
| HP Pavilion Gaming 17-cd0085cl | |
| Lenovo Legion Y740-17ICH | |
| Asus TUF FX705DT-AU068T | |
| |||||||||||||||||||||||||
Brightness Distribution: 86 %
Center on Battery: 299.6 cd/m²
Contrast: 908:1 (Black: 0.33 cd/m²)
ΔE ColorChecker Calman: 3.68 | ∀{0.5-29.43 Ø4.73}
calibrated: 3.15
ΔE Greyscale Calman: 3.8 | ∀{0.09-98 Ø4.97}
89.8% sRGB (Argyll 1.6.3 3D)
58.1% AdobeRGB 1998 (Argyll 1.6.3 3D)
64.3% AdobeRGB 1998 (Argyll 3D)
90.2% sRGB (Argyll 3D)
63.3% Display P3 (Argyll 3D)
Gamma: 2.12
CCT: 7240 K
| HP Pavilion Gaming 17-cd0085cl BOE0825, IPS, 17.3", 1920x1080 | Lenovo Legion Y740-17ICH AU Optronics B173HAN03.2, IPS, 17.3", 1920x1080 | HP Omen 17t-3AW55AV_1 AU Optronics AUO309D, IPS, 17.3", 1920x1080 | Asus TUF FX705DT-AU068T AU Optronics B173HAN04.2, IPS, 17.3", 1920x1080 | MSI GP75 Leopard 9SD Chi Mei N173HCE-G33 (CMN175C), IPS, 17.3", 1920x1080 | Razer Blade Pro 17 RTX 2080 Max-Q AU Optronics B173HAN04.0, IPS, 17.3", 1920x1080 | |
|---|---|---|---|---|---|---|
| Display | 1% | 2% | -1% | 2% | -3% | |
| Display P3 Coverage (%) | 63.3 | 64 1% | 65.4 3% | 62.3 -2% | 63.4 0% | 60.6 -4% |
| sRGB Coverage (%) | 90.2 | 90.4 0% | 90 0% | 89.1 -1% | 94.9 5% | 89 -1% |
| AdobeRGB 1998 Coverage (%) | 64.3 | 64.8 1% | 65.8 2% | 63.7 -1% | 65.1 1% | 62.1 -3% |
| Response Times | 43% | 47% | -42% | 65% | 65% | |
| Response Time Grey 50% / Grey 80% * (ms) | 31.6 ? | 15.6 ? 51% | 17.6 ? 44% | 41 ? -30% | 8 ? 75% | 6.8 ? 78% |
| Response Time Black / White * (ms) | 19.6 ? | 12.8 ? 35% | 10 ? 49% | 30 ? -53% | 8.8 ? 55% | 9.6 ? 51% |
| PWM Frequency (Hz) | 25510 ? | |||||
| Screen | -11% | 5% | 8% | 22% | 11% | |
| Brightness middle (cd/m²) | 299.6 | 299.1 0% | 343.6 15% | 316 5% | 420 40% | 299.3 0% |
| Brightness (cd/m²) | 285 | 273 -4% | 320 12% | 294 3% | 393 38% | 294 3% |
| Brightness Distribution (%) | 86 | 81 -6% | 87 1% | 84 -2% | 91 6% | 94 9% |
| Black Level * (cd/m²) | 0.33 | 0.27 18% | 0.34 -3% | 0.32 3% | 0.32 3% | 0.29 12% |
| Contrast (:1) | 908 | 1108 22% | 1011 11% | 988 9% | 1313 45% | 1032 14% |
| Colorchecker dE 2000 * | 3.68 | 5.07 -38% | 3.74 -2% | 3.39 8% | 3.04 17% | 2.55 31% |
| Colorchecker dE 2000 max. * | 8.05 | 10.55 -31% | 5.33 34% | 5.56 31% | 7.22 10% | 4.73 41% |
| Colorchecker dE 2000 calibrated * | 3.15 | 3.31 -5% | 3.49 -11% | 2.14 32% | 0.89 72% | 2.9 8% |
| Greyscale dE 2000 * | 3.8 | 6.8 -79% | 3.7 3% | 3.17 17% | 3.91 -3% | 3.5 8% |
| Gamma | 2.12 104% | 2.46 89% | 2.36 93% | 2.39 92% | 2.26 97% | 2.28 96% |
| CCT | 7240 90% | 7805 83% | 6388 102% | 7098 92% | 7138 91% | 7101 92% |
| Color Space (Percent of AdobeRGB 1998) (%) | 58.1 | 58.5 1% | 58 0% | 51 -12% | 60 3% | 57 -2% |
| Color Space (Percent of sRGB) (%) | 89.8 | 89.9 0% | 90 0% | 89 -1% | 95 6% | 88.7 -1% |
| Total Average (Program / Settings) | 11% /
-2% | 18% /
10% | -12% /
0% | 30% /
23% | 24% /
15% |
* ... smaller is better
Display Response Times
| ↔ Response Time Black to White | ||
|---|---|---|
| 19.6 ms ... rise ↗ and fall ↘ combined | ↗ 10.8 ms rise | 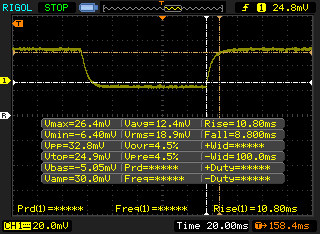 |
| ↘ 8.8 ms fall | ||
| The screen shows good response rates in our tests, but may be too slow for competitive gamers. In comparison, all tested devices range from 0.1 (minimum) to 240 (maximum) ms. » 43 % of all devices are better. This means that the measured response time is similar to the average of all tested devices (19.9 ms). | ||
| ↔ Response Time 50% Grey to 80% Grey | ||
| 31.6 ms ... rise ↗ and fall ↘ combined | ↗ 14 ms rise | 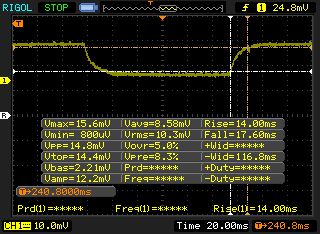 |
| ↘ 17.6 ms fall | ||
| The screen shows slow response rates in our tests and will be unsatisfactory for gamers. In comparison, all tested devices range from 0.165 (minimum) to 636 (maximum) ms. » 43 % of all devices are better. This means that the measured response time is similar to the average of all tested devices (31.1 ms). | ||
Screen Flickering / PWM (Pulse-Width Modulation)
| Screen flickering / PWM not detected | 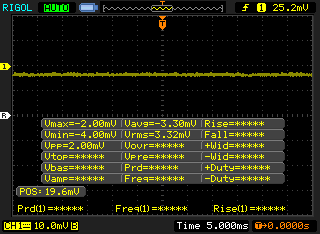 | ||
In comparison: 52 % of all tested devices do not use PWM to dim the display. If PWM was detected, an average of 7794 (minimum: 5 - maximum: 343500) Hz was measured. | |||

| Cinebench R15 | |
| CPU Single 64Bit | |
| Schenker XMG Ultra 15 Turing | |
| HP Pavilion Gaming 17-cd0085cl | |
| Alienware m17 P37E | |
| MSI GE75 9SG | |
| Average Intel Core i7-9750H (170 - 194, n=82) | |
| Dell G5 15 5587 | |
| HP Omen 15-dc1020ng | |
| HP Omen 17t-3AW55AV_1 | |
| MSI GT72S-6QEG16SR421BW | |
| Asus FX503VM-EH73 | |
| Lenovo Legion Y520-15IKBA-80WY001VGE | |
| Asus ROG Zephyrus G15 GA502DU | |
| CPU Multi 64Bit | |
| MSI GE75 9SG | |
| Schenker XMG Ultra 15 Turing | |
| Alienware m17 P37E | |
| Average Intel Core i7-9750H (952 - 1306, n=85) | |
| HP Pavilion Gaming 17-cd0085cl | |
| HP Omen 17t-3AW55AV_1 | |
| MSI GT72S-6QEG16SR421BW | |
| Asus ROG Zephyrus G15 GA502DU | |
| HP Omen 15-dc1020ng | |
| Dell G5 15 5587 | |
| Asus FX503VM-EH73 | |
| Lenovo Legion Y520-15IKBA-80WY001VGE | |
| Cinebench R11.5 | |
| CPU Single 64Bit | |
| MSI GE75 9SG | |
| Average Intel Core i7-9750H (1.96 - 2.19, n=10) | |
| HP Omen 17t-3AW55AV_1 | |
| Dell G5 15 5587 | |
| Asus FX503VM-EH73 | |
| MSI GT72S-6QEG16SR421BW | |
| Asus ROG Zephyrus G15 GA502DU | |
| CPU Multi 64Bit | |
| MSI GE75 9SG | |
| Average Intel Core i7-9750H (11.3 - 14.1, n=10) | |
| HP Omen 17t-3AW55AV_1 | |
| Asus ROG Zephyrus G15 GA502DU | |
| MSI GT72S-6QEG16SR421BW | |
| Asus FX503VM-EH73 | |
| Dell G5 15 5587 | |
| Cinebench R10 | |
| Rendering Multiple CPUs 32Bit | |
| Schenker XMG Ultra 15 Turing | |
| MSI GE75 9SG | |
| HP Omen 17t-3AW55AV_1 | |
| Average Intel Core i7-9750H (28251 - 36304, n=13) | |
| HP Omen 15-dc1020ng | |
| Dell G5 15 5587 | |
| Asus FX503VM-EH73 | |
| Asus ROG Zephyrus G15 GA502DU | |
| Rendering Single 32Bit | |
| Schenker XMG Ultra 15 Turing | |
| MSI GE75 9SG | |
| Average Intel Core i7-9750H (6659 - 7214, n=13) | |
| HP Omen 17t-3AW55AV_1 | |
| HP Omen 15-dc1020ng | |
| Dell G5 15 5587 | |
| Asus FX503VM-EH73 | |
| Asus ROG Zephyrus G15 GA502DU | |
| wPrime 2.10 - 1024m | |
| Asus FX503VM-EH73 | |
| Asus ROG Zephyrus G15 GA502DU | |
| Average Intel Core i7-9750H (n=1) | |
| HP Omen 17t-3AW55AV_1 | |
| MSI GE75 9SG | |
* ... smaller is better
| PCMark 10 | |
| Score | |
| Lenovo Legion Y740-17ICH | |
| HP Omen 17t-3AW55AV_1 | |
| Razer Blade Pro 17 RTX 2080 Max-Q | |
| MSI GP75 Leopard 9SD | |
| HP Pavilion Gaming 17-cd0085cl | |
| Asus TUF FX705DT-AU068T | |
| Essentials | |
| HP Omen 17t-3AW55AV_1 | |
| Lenovo Legion Y740-17ICH | |
| Razer Blade Pro 17 RTX 2080 Max-Q | |
| HP Pavilion Gaming 17-cd0085cl | |
| MSI GP75 Leopard 9SD | |
| Asus TUF FX705DT-AU068T | |
| Productivity | |
| HP Omen 17t-3AW55AV_1 | |
| Razer Blade Pro 17 RTX 2080 Max-Q | |
| Lenovo Legion Y740-17ICH | |
| MSI GP75 Leopard 9SD | |
| HP Pavilion Gaming 17-cd0085cl | |
| Asus TUF FX705DT-AU068T | |
| Digital Content Creation | |
| Lenovo Legion Y740-17ICH | |
| HP Omen 17t-3AW55AV_1 | |
| Razer Blade Pro 17 RTX 2080 Max-Q | |
| MSI GP75 Leopard 9SD | |
| HP Pavilion Gaming 17-cd0085cl | |
| Asus TUF FX705DT-AU068T | |
| PCMark 8 | |
| Home Score Accelerated v2 | |
| HP Omen 17t-3AW55AV_1 | |
| Lenovo Legion Y740-17ICH | |
| Asus TUF FX705DT-AU068T | |
| Razer Blade Pro 17 RTX 2080 Max-Q | |
| HP Pavilion Gaming 17-cd0085cl | |
| MSI GP75 Leopard 9SD | |
| Work Score Accelerated v2 | |
| HP Omen 17t-3AW55AV_1 | |
| Lenovo Legion Y740-17ICH | |
| Razer Blade Pro 17 RTX 2080 Max-Q | |
| MSI GP75 Leopard 9SD | |
| HP Pavilion Gaming 17-cd0085cl | |
| Asus TUF FX705DT-AU068T | |
| PCMark 8 Home Score Accelerated v2 | 4148 points | |
| PCMark 8 Work Score Accelerated v2 | 5222 points | |
| PCMark 10 Score | 5429 points | |
Help | ||
| HP Pavilion Gaming 17-cd0085cl Samsung SSD PM981 MZVLB256HAHQ | HP Omen 17t-3AW55AV_1 Samsung SSD PM981 MZVLB512HAJQ | Asus TUF FX705DT-AU068T WDC PC SN520 SDAPNUW-256G | Asus ROG Zephyrus G15 GA502DU Intel SSD 660p SSDPEKNW512G8 | Schenker XMG Ultra 15 Turing Samsung SSD 970 EVO Plus 1TB | |
|---|---|---|---|---|---|
| AS SSD | 8% | -35% | -30% | 51% | |
| Seq Read (MB/s) | 1709 | 1473 -14% | 1546 -10% | 907 -47% | 2739 60% |
| Seq Write (MB/s) | 1345 | 1962 46% | 1182 -12% | 926 -31% | 2650 97% |
| 4K Read (MB/s) | 49.73 | 31.66 -36% | 36.54 -27% | 47.26 -5% | 27.86 -44% |
| 4K Write (MB/s) | 108.2 | 84.4 -22% | 109.2 1% | 98.7 -9% | 134.7 24% |
| 4K-64 Read (MB/s) | 731 | 1125 54% | 612 -16% | 321.5 -56% | 1651 126% |
| 4K-64 Write (MB/s) | 1233 | 1866 51% | 436.6 -65% | 736 -40% | 2190 78% |
| Access Time Read * (ms) | 0.073 | 0.071 3% | 0.113 -55% | 0.064 12% | 0.031 58% |
| Access Time Write * (ms) | 0.034 | 0.047 -38% | 0.034 -0% | 0.045 -32% | 0.028 18% |
| Score Read (Points) | 951 | 1304 37% | 803 -16% | 459 -52% | 1953 105% |
| Score Write (Points) | 1476 | 2147 45% | 664 -55% | 927 -37% | 2590 75% |
| Score Total (Points) | 2909 | 4142 42% | 1869 -36% | 1641 -44% | 5529 90% |
| Copy ISO MB/s (MB/s) | 1284 | 1080 -16% | 698 -46% | 905 -30% | 2031 58% |
| Copy Program MB/s (MB/s) | 589 | 481.1 -18% | 114.1 -81% | 496.9 -16% | 452.1 -23% |
| Copy Game MB/s (MB/s) | 1107 | 875 -21% | 379.6 -66% | 819 -26% | 1043 -6% |
* ... smaller is better

| 3DMark 11 | |
| 1280x720 Performance GPU | |
| Razer Blade Pro 17 RTX 2080 Max-Q | |
| Eurocom Nightsky RX17 | |
| Alienware 17 R5 | |
| Zotac GeForce GTX 1660 Ti 6 GB | |
| Aorus 15 W9 | |
| MSI GP75 Leopard 9SD | |
| HP Omen 15-dc0015ng | |
| HP Pavilion Gaming 17-cd0085cl | |
| Asus ROG Zephyrus G15 GA502DU | |
| Dell G5 15 5587 | |
| Asus TUF FX705DT-AU068T | |
| MSI GT72S-6QEG16SR421BW | |
| 1280x720 Performance Combined | |
| Zotac GeForce GTX 1660 Ti 6 GB | |
| Eurocom Nightsky RX17 | |
| MSI GP75 Leopard 9SD | |
| HP Pavilion Gaming 17-cd0085cl | |
| Razer Blade Pro 17 RTX 2080 Max-Q | |
| HP Omen 15-dc0015ng | |
| Alienware 17 R5 | |
| Aorus 15 W9 | |
| MSI GT72S-6QEG16SR421BW | |
| Dell G5 15 5587 | |
| Asus ROG Zephyrus G15 GA502DU | |
| Asus TUF FX705DT-AU068T | |
| 3DMark 11 Performance | 16005 points | |
| 3DMark Cloud Gate Standard Score | 35562 points | |
| 3DMark Fire Strike Score | 11904 points | |
| 3DMark Time Spy Score | 5245 points | |
Help | ||
| Shadow of the Tomb Raider | |
| 1920x1080 Highest Preset AA:T | |
| MSI GE75 9SG | |
| Zotac GeForce GTX 1660 Ti 6 GB | |
| Asus ROG Strix G GL731GU-RB74 | |
| HP Pavilion Gaming 17-cd0085cl | |
| HP Omen 15-dc0015ng | |
| Asus ROG Zephyrus G15 GA502DU | |
| MSI GF75 Thin 9SC | |
| Acer Aspire Nitro 5 AN515-54-53Z2 | |
| 1280x720 Lowest Preset | |
| MSI GE75 9SG | |
| Asus ROG Strix G GL731GU-RB74 | |
| HP Omen 15-dc0015ng | |
| MSI GF75 Thin 9SC | |
| Zotac GeForce GTX 1660 Ti 6 GB | |
| HP Pavilion Gaming 17-cd0085cl | |
| Asus ROG Zephyrus G15 GA502DU | |
| low | med. | high | ultra | |
|---|---|---|---|---|
| BioShock Infinite (2013) | 331.3 | 282 | 259.9 | 130 |
| The Witcher 3 (2015) | 256.8 | 173.3 | 92.1 | 48.5 |
| Shadow of the Tomb Raider (2018) | 126 | 83 | 74 | 64 |
| HP Pavilion Gaming 17-cd0085cl GeForce GTX 1660 Ti Max-Q, i7-9750H, Samsung SSD PM981 MZVLB256HAHQ | Lenovo Legion Y740-17ICH GeForce RTX 2080 Max-Q, i7-8750H, Samsung SSD PM981 MZVLB256HAHQ | HP Omen 17t-3AW55AV_1 GeForce GTX 1070 Mobile, i7-8750H, Samsung SSD PM981 MZVLB512HAJQ | Asus TUF FX705DT-AU068T GeForce GTX 1650 Mobile, R5 3550H, WDC PC SN520 SDAPNUW-256G | MSI GP75 Leopard 9SD GeForce GTX 1660 Ti Mobile, i7-9750H, Kingston RBUSNS8154P3256GJ1 | Eurocom Nightsky RX17 GeForce RTX 2070 Mobile, i7-9750H, 2x Samsung SSD 970 Pro 512GB (RAID 0) | |
|---|---|---|---|---|---|---|
| Noise | -6% | -11% | -6% | -24% | -15% | |
| off / environment * (dB) | 28.2 | 28.3 -0% | 27.8 1% | 30.8 -9% | 29 -3% | 28 1% |
| Idle Minimum * (dB) | 30.1 | 31.5 -5% | 31.1 -3% | 30.8 -2% | 29 4% | 28 7% |
| Idle Average * (dB) | 30.1 | 31.6 -5% | 31.1 -3% | 30.8 -2% | 34 -13% | 28.4 6% |
| Idle Maximum * (dB) | 30.1 | 31.6 -5% | 35 -16% | 32.2 -7% | 37 -23% | 32.9 -9% |
| Load Average * (dB) | 34.2 | 32.3 6% | 42 -23% | 38.6 -13% | 53 -55% | 45 -32% |
| Witcher 3 ultra * (dB) | 34.2 | 43 -26% | 44.5 -30% | 51 -49% | 53.2 -56% | |
| Load Maximum * (dB) | 43.8 | 45.5 -4% | 46.5 -6% | 44.8 -2% | 55 -26% | 53.2 -21% |
* ... smaller is better
Noise level
| Idle |
| 30.1 / 30.1 / 30.1 dB(A) |
| Load |
| 34.2 / 43.8 dB(A) |
 | ||
30 dB silent 40 dB(A) audible 50 dB(A) loud |
||
min: | ||
(±) The maximum temperature on the upper side is 42.6 °C / 109 F, compared to the average of 40.4 °C / 105 F, ranging from 21.2 to 68.8 °C for the class Gaming.
(-) The bottom heats up to a maximum of 49 °C / 120 F, compared to the average of 43.2 °C / 110 F
(+) In idle usage, the average temperature for the upper side is 29.8 °C / 86 F, compared to the device average of 33.9 °C / 93 F.
(±) Playing The Witcher 3, the average temperature for the upper side is 33.7 °C / 93 F, compared to the device average of 33.9 °C / 93 F.
(+) The palmrests and touchpad are cooler than skin temperature with a maximum of 29.2 °C / 84.6 F and are therefore cool to the touch.
(±) The average temperature of the palmrest area of similar devices was 28.8 °C / 83.8 F (-0.4 °C / -0.8 F).
HP Pavilion Gaming 17-cd0085cl audio analysis
(±) | speaker loudness is average but good (74.3 dB)
Analysis not possible as minimum curve is missing or too high
Apple MacBook 12 (Early 2016) 1.1 GHz audio analysis
(+) | speakers can play relatively loud (83.6 dB)
Bass 100 - 315 Hz
(±) | reduced bass - on average 11.3% lower than median
(±) | linearity of bass is average (14.2% delta to prev. frequency)
Mids 400 - 2000 Hz
(+) | balanced mids - only 2.4% away from median
(+) | mids are linear (5.5% delta to prev. frequency)
Highs 2 - 16 kHz
(+) | balanced highs - only 2% away from median
(+) | highs are linear (4.5% delta to prev. frequency)
Overall 100 - 16.000 Hz
(+) | overall sound is linear (10.2% difference to median)
Compared to same class
» 7% of all tested devices in this class were better, 2% similar, 91% worse
» The best had a delta of 5%, average was 18%, worst was 53%
Compared to all devices tested
» 5% of all tested devices were better, 1% similar, 94% worse
» The best had a delta of 4%, average was 24%, worst was 134%
| Off / Standby | |
| Idle | |
| Load |
|
Key:
min: | |
| HP Pavilion Gaming 17-cd0085cl i7-9750H, GeForce GTX 1660 Ti Max-Q, Samsung SSD PM981 MZVLB256HAHQ, IPS, 1920x1080, 17.3" | Lenovo Legion Y740-17ICH i7-8750H, GeForce RTX 2080 Max-Q, Samsung SSD PM981 MZVLB256HAHQ, IPS, 1920x1080, 17.3" | HP Omen 17t-3AW55AV_1 i7-8750H, GeForce GTX 1070 Mobile, Samsung SSD PM981 MZVLB512HAJQ, IPS, 1920x1080, 17.3" | MSI GP75 Leopard 9SD i7-9750H, GeForce GTX 1660 Ti Mobile, Kingston RBUSNS8154P3256GJ1, IPS, 1920x1080, 17.3" | Eurocom Nightsky RX17 i7-9750H, GeForce RTX 2070 Mobile, 2x Samsung SSD 970 Pro 512GB (RAID 0), IPS, 1920x1080, 17.3" | Asus ROG Zephyrus G15 GA502DU R7 3750H, GeForce GTX 1660 Ti Max-Q, Intel SSD 660p SSDPEKNW512G8, IPS, 1920x1080, 15.6" | |
|---|---|---|---|---|---|---|
| Power Consumption | -105% | -101% | -48% | -96% | -31% | |
| Idle Minimum * (Watt) | 5.4 | 20.2 -274% | 17.8 -230% | 10 -85% | 18.6 -244% | 7.4 -37% |
| Idle Average * (Watt) | 9.2 | 27.2 -196% | 24.7 -168% | 15 -63% | 22.6 -146% | 8.6 7% |
| Idle Maximum * (Watt) | 13 | 28.7 -121% | 29.6 -128% | 22 -69% | 23 -77% | 39.1 -201% |
| Load Average * (Watt) | 85.9 | 90.8 -6% | 110 -28% | 92 -7% | 93.4 -9% | 65.9 23% |
| Witcher 3 ultra * (Watt) | 107.9 | 152.1 -41% | 167.8 -56% | 153 -42% | 186.4 -73% | 106.9 1% |
| Load Maximum * (Watt) | 182.2 | 165.4 9% | 178.6 2% | 216 -19% | 233.6 -28% | 141.3 22% |
* ... smaller is better
| HP Pavilion Gaming 17-cd0085cl i7-9750H, GeForce GTX 1660 Ti Max-Q, 52.5 Wh | Lenovo Legion Y740-17ICH i7-8750H, GeForce RTX 2080 Max-Q, 76 Wh | HP Omen 17t-3AW55AV_1 i7-8750H, GeForce GTX 1070 Mobile, 86 Wh | Asus TUF FX705DT-AU068T R5 3550H, GeForce GTX 1650 Mobile, 64 Wh | MSI GP75 Leopard 9SD i7-9750H, GeForce GTX 1660 Ti Mobile, 51 Wh | Razer Blade Pro 17 RTX 2080 Max-Q i7-9750H, GeForce RTX 2080 Max-Q, 70 Wh | Eurocom Nightsky RX17 i7-9750H, GeForce RTX 2070 Mobile, 62 Wh | |
|---|---|---|---|---|---|---|---|
| Battery runtime | -44% | -9% | 55% | -48% | -12% | -36% | |
| Reader / Idle (h) | 11.6 | 4.5 -61% | 13.6 17% | 4.8 -59% | 4.9 -58% | 4.2 -64% | |
| WiFi v1.3 (h) | 5.7 | 3.2 -44% | 4.2 -26% | 7.8 37% | 3.2 -44% | 4.7 -18% | 2 -65% |
| Load (h) | 1 | 1.6 60% | 2.1 110% | 0.6 -40% | 1.4 40% | 1.2 20% |
Pros
Cons
一句话描述了我们对光影精灵17的整体体验:惊讶。光影精灵系列是惠普在预算范围内为用户设计的低端产品,因此我们总是相应地调整我们的期望。这款特别的机型让我们措手不及,它是我们测试过的最安静的游戏笔记本电脑之一,也是更时尚,设计感更强的光影精灵 PC之一。惠普显然已经开始对其入门级游戏笔记本电脑给予更多关注。
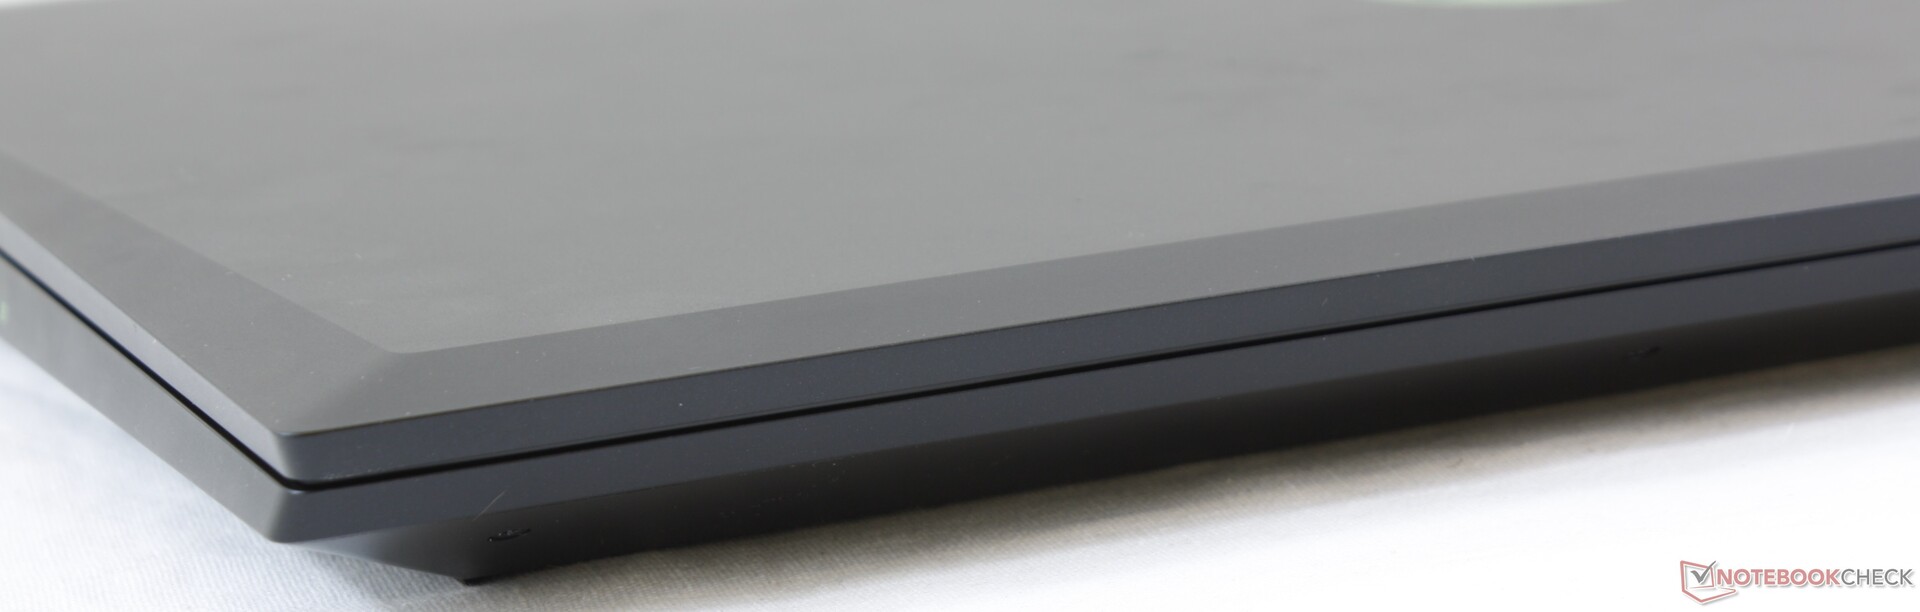
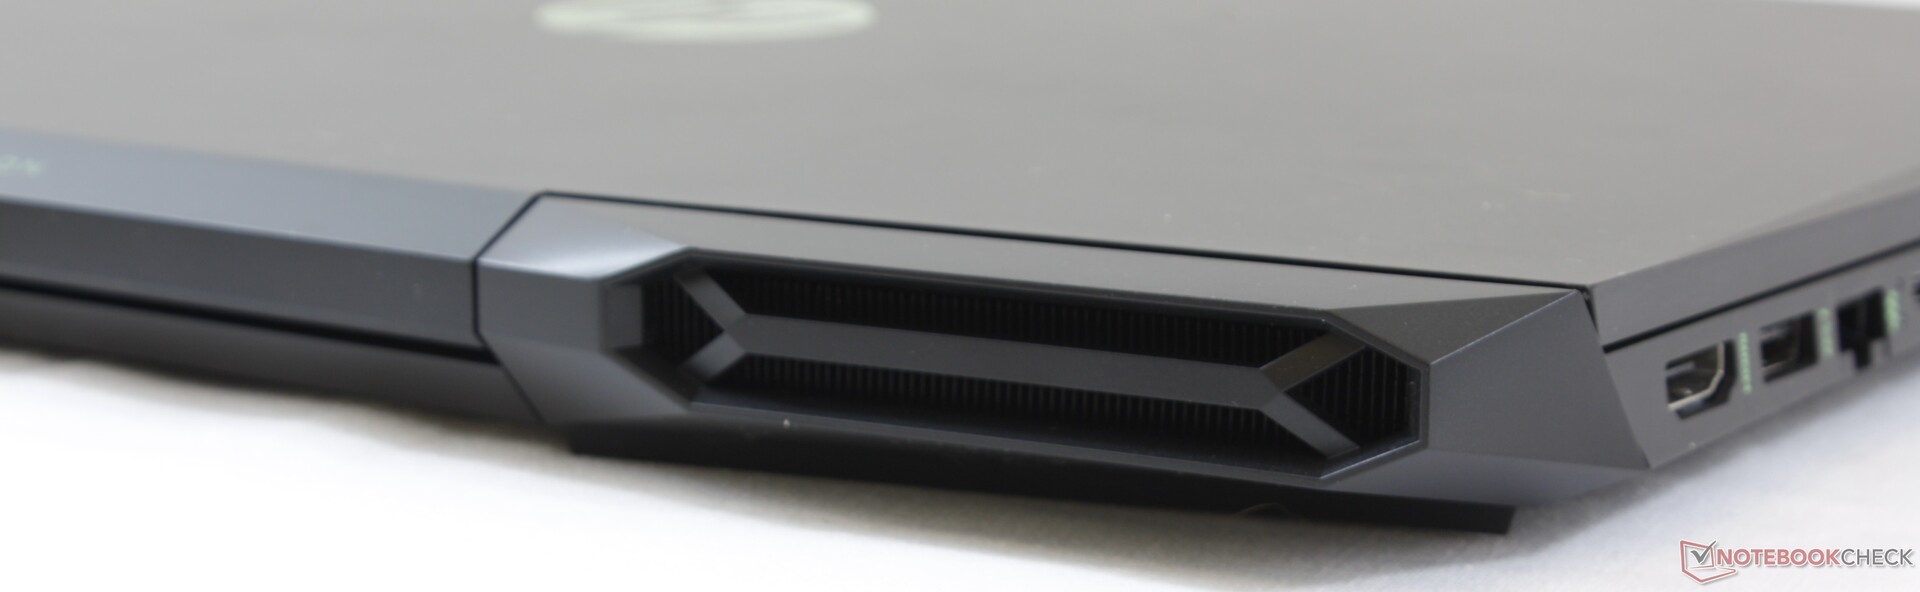
仍有一些挥之不去的“廉价”特征可能会需要更多的改进。狭窄的触控板,柔性屏幕盖,中等水平的扬声器和脆弱的后格栅感觉它们应该属于便宜得多的笔记本电脑。
这里的重点是带有i9-9750H和GTX 1660 Ti Max-Q图形的Pavilion Gaming 17并不比具有同等规格的竞争系统便宜得多。售价1300美元,比MSI GL73,MSI GP75,华硕TUF FX705或华硕ROG GL731GU只便宜约100至200美元,具体取决于RAM,存储和显示配置。即便如此,我们发现Pavilion更好,因为游戏时系统的安静程度更高。
超出廉价类别的水平。它不仅对于游戏笔记本来说相对安静,而且其强大的设计为未来光影精灵笔记本电脑的功能奠定了基础。
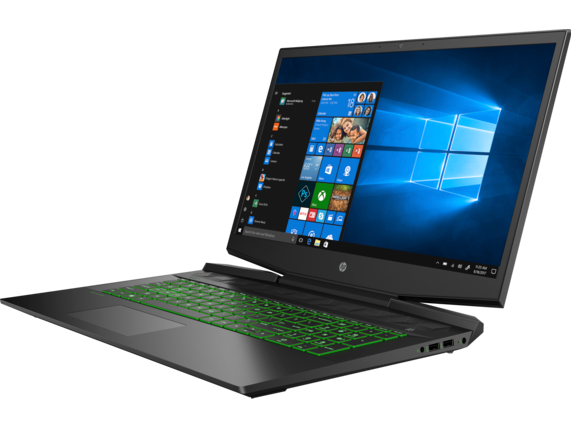
HP Pavilion Gaming 17-cd0085cl
- 09/20/2019 v7 (old)
Allen Ngo
Price comparison

