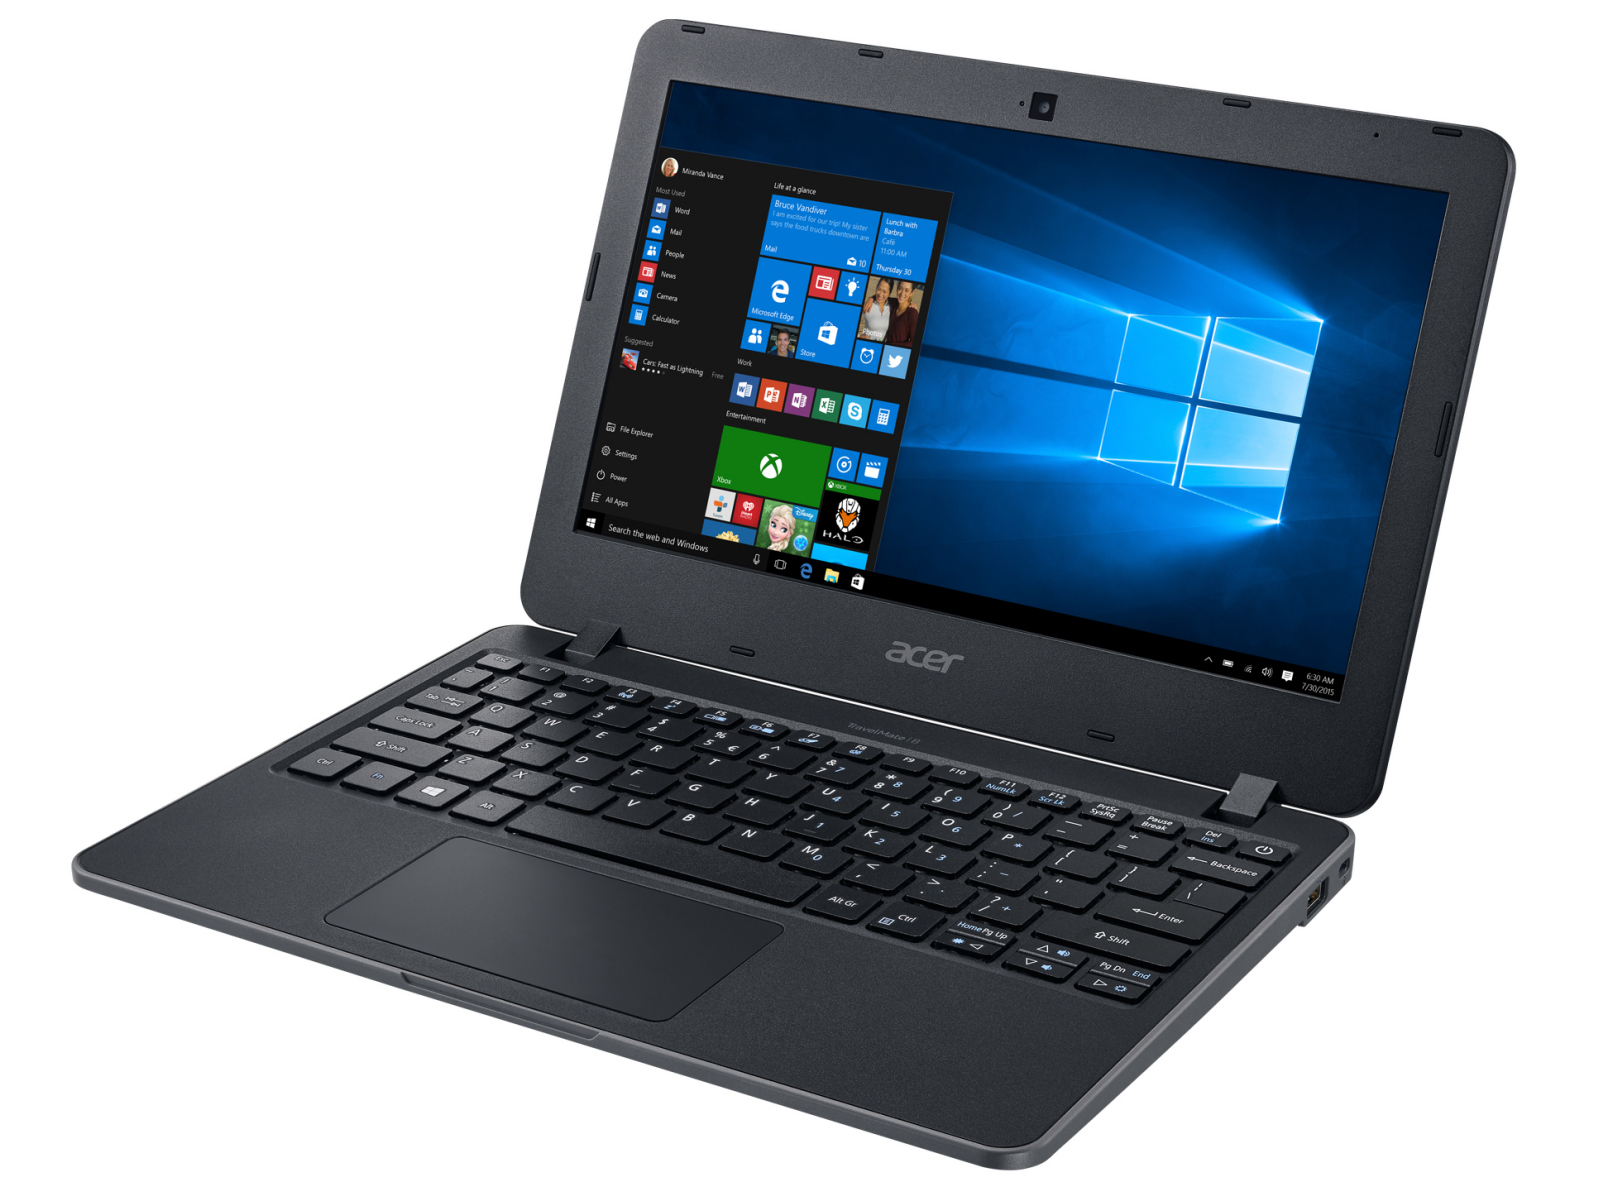
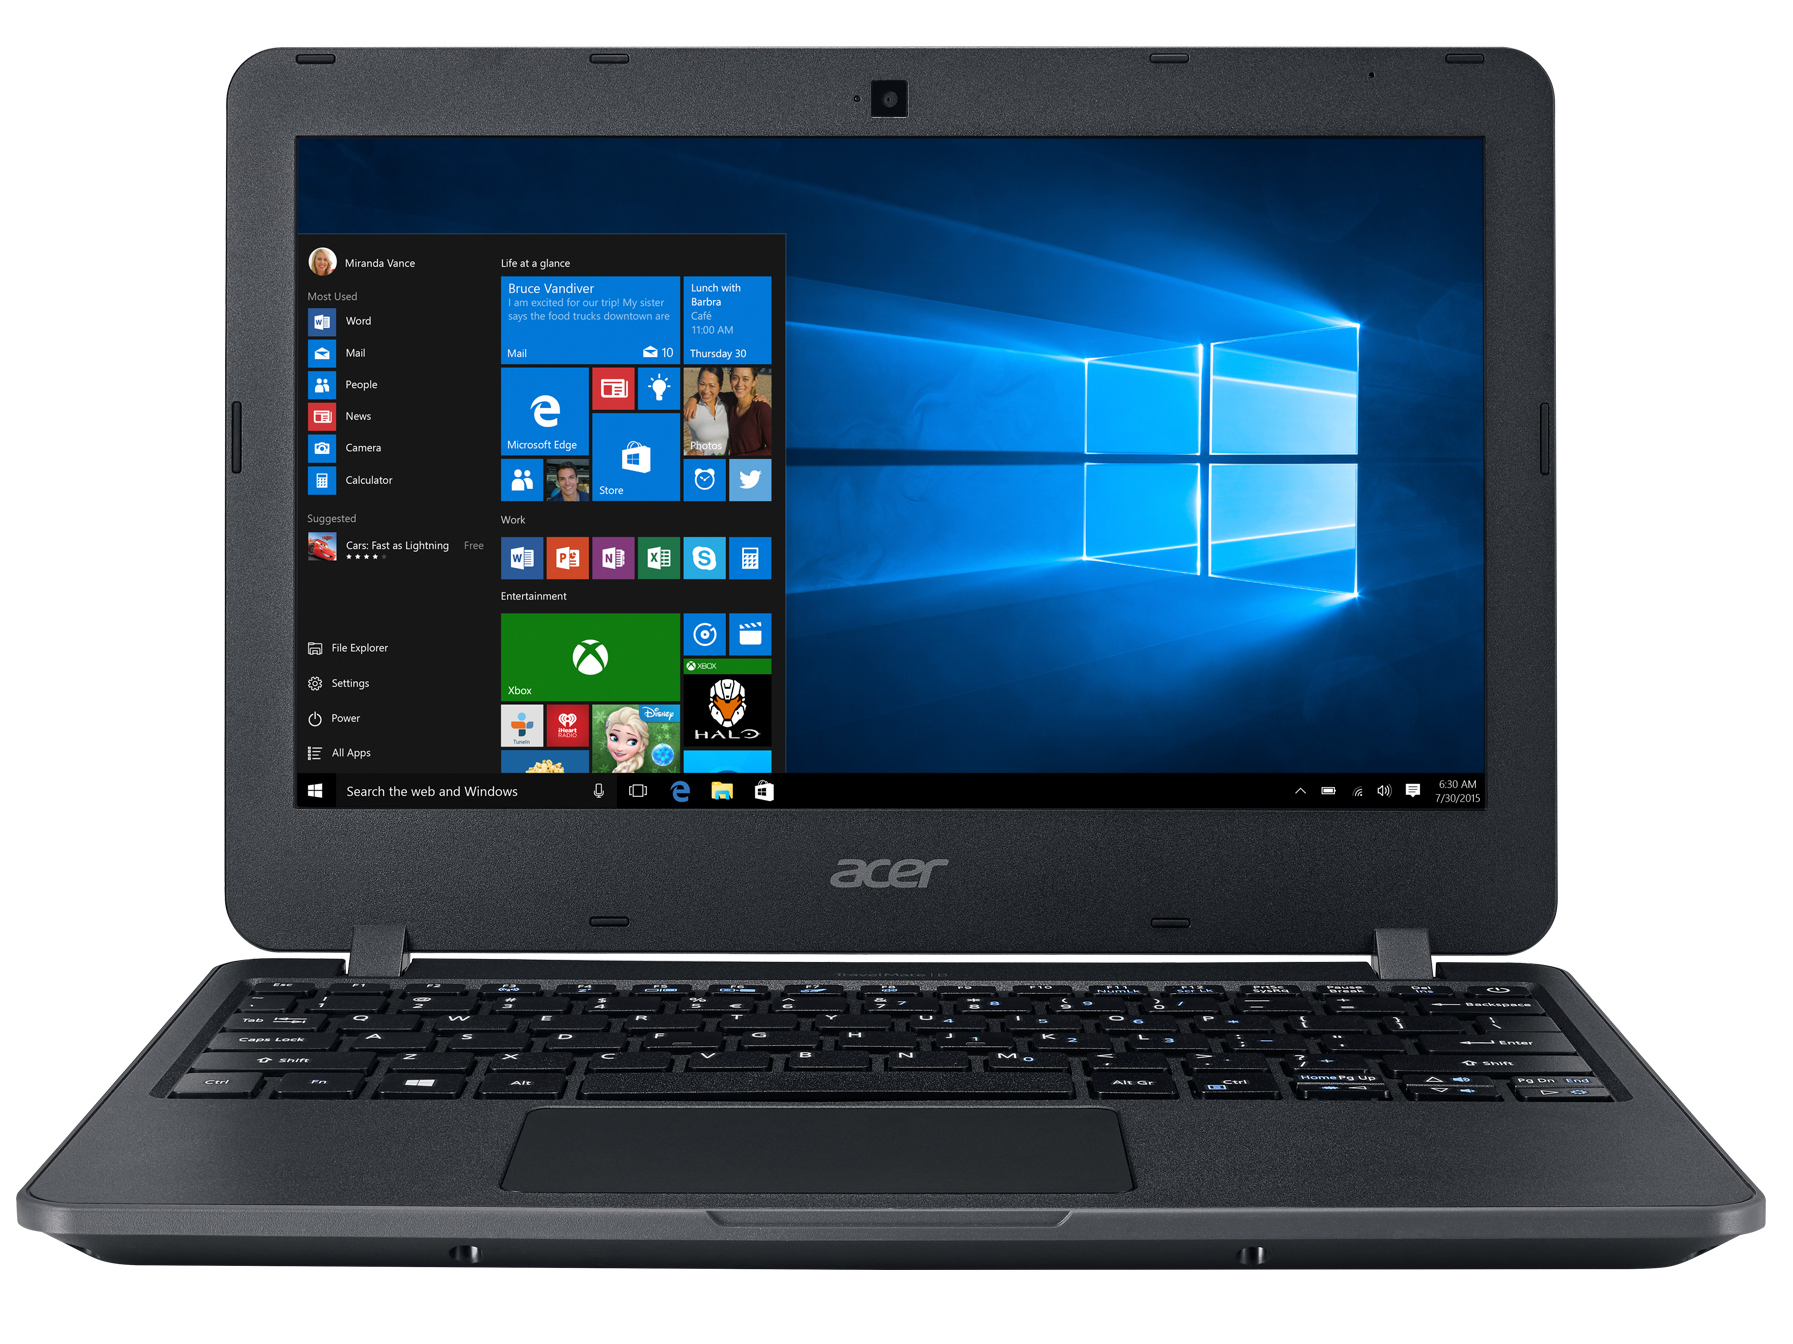
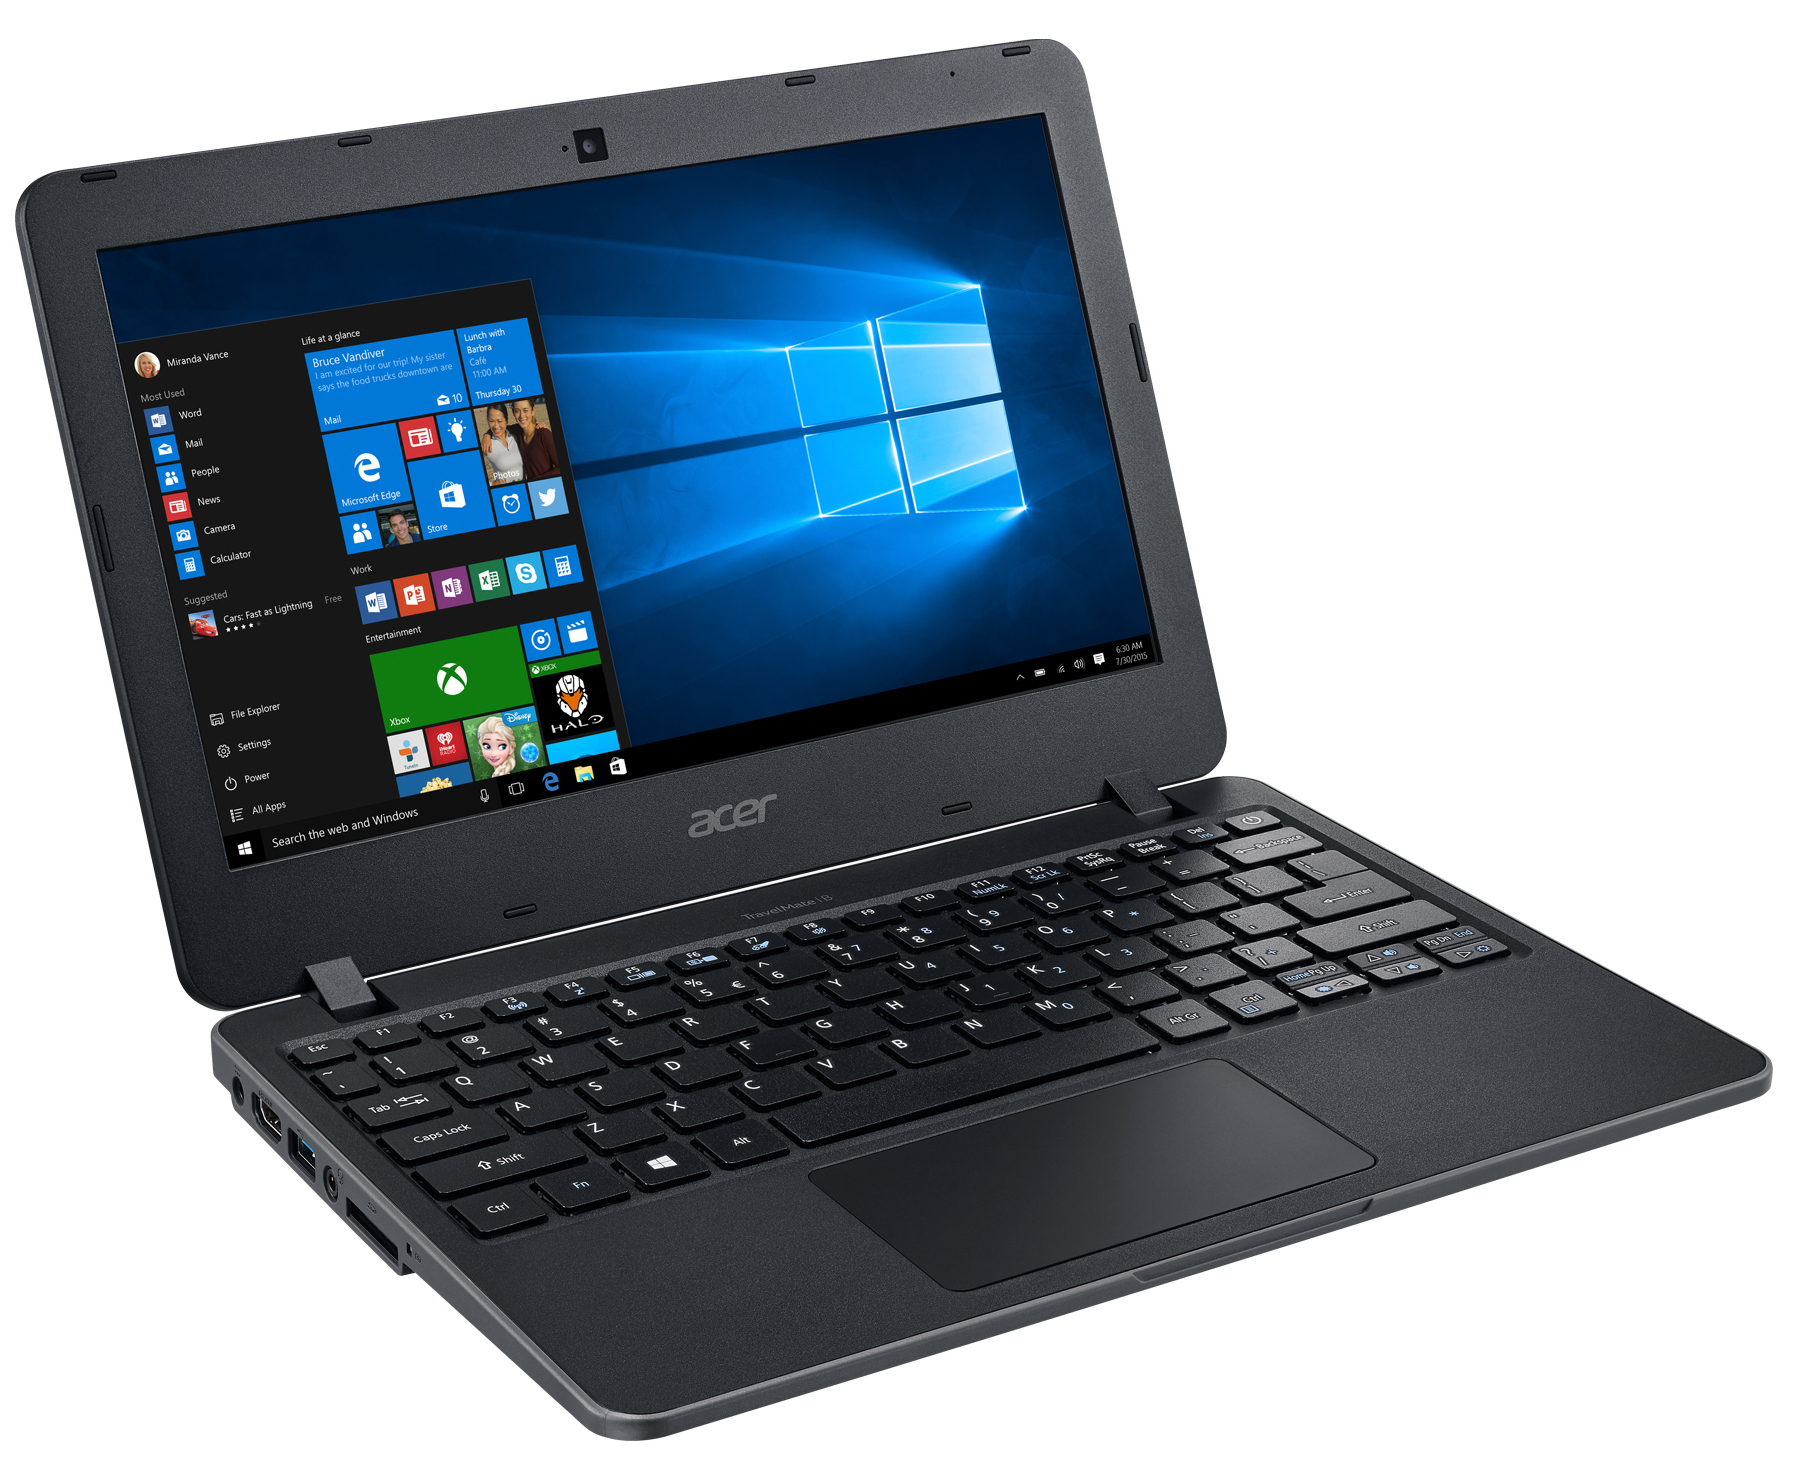
宏碁 TravelMate B117-M-P16Q 笔记本电脑简短评测
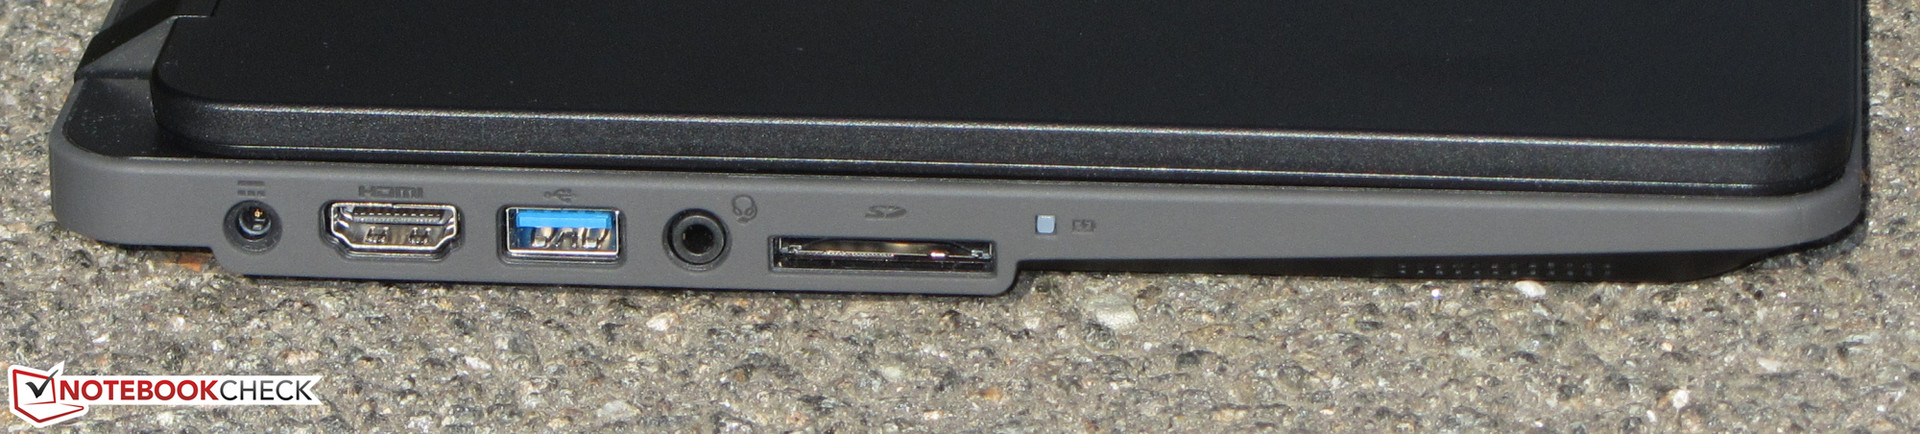
Connectivity
| SD Card Reader | |
| average JPG Copy Test (av. of 3 runs) | |
| Acer TravelMate B117-M-P16Q | |
| Acer Chromebook C740-C3DY | |
| Acer Aspire One Cloudbook 11 AO1-131-C58K | |
| maximum AS SSD Seq Read Test (1GB) | |
| Acer Aspire One Cloudbook 11 AO1-131-C58K | |
| Networking | |
| iperf Server (receive) TCP 1 m | |
| Acer TravelMate B117-M-P16Q (seb) | |
| iperf Client (transmit) TCP 1 m | |
| Acer TravelMate B117-M-P16Q (seb) | |
| |||||||||||||||||||||||||
Brightness Distribution: 85 %
Center on Battery: 180 cd/m²
Contrast: 574:1 (Black: 0.38 cd/m²)
ΔE ColorChecker Calman: 10.29 | ∀{0.5-29.43 Ø4.73}
ΔE Greyscale Calman: 11.71 | ∀{0.09-98 Ø4.97}
63% sRGB (Argyll 1.6.3 3D)
40% AdobeRGB 1998 (Argyll 1.6.3 3D)
43.46% AdobeRGB 1998 (Argyll 3D)
62.9% sRGB (Argyll 3D)
42.04% Display P3 (Argyll 3D)
Gamma: 2.45
CCT: 14164 K
| Acer TravelMate B117-M-P16Q TN LED, 1366x768 | Acer Aspire One Cloudbook 11 AO1-131-C58K TN LED, 1366x768 | Medion Akoya S2015 Chromebook TN LED, 1366x768 | HP Stream 11-r000ng TN, 1366x768 | Lenovo S21e-20 80M4004MGE TN, 1366x768 | Dell Inspiron 11 3162 TN LED, 1366x768 | |
|---|---|---|---|---|---|---|
| Display | -5% | 1% | -3% | -8% | ||
| Display P3 Coverage (%) | 42.04 | 39.91 -5% | 42.52 1% | 40.64 -3% | 38.7 -8% | |
| sRGB Coverage (%) | 62.9 | 59.9 -5% | 63.5 1% | 61.2 -3% | 58.1 -8% | |
| AdobeRGB 1998 Coverage (%) | 43.46 | 41.25 -5% | 43.97 1% | 41.99 -3% | 39.98 -8% | |
| Response Times | -3% | 14% | 4% | 7% | 8% | |
| Response Time Grey 50% / Grey 80% * (ms) | 38 ? | 46 ? -21% | 40 ? -5% | 44 ? -16% | 40 ? -5% | 41 ? -8% |
| Response Time Black / White * (ms) | 31 ? | 26 ? 16% | 21 ? 32% | 24 ? 23% | 25 ? 19% | 24 ? 23% |
| PWM Frequency (Hz) | 1000 ? | 198 ? | ||||
| Screen | -3% | -14% | 1% | -10% | -5% | |
| Brightness middle (cd/m²) | 218 | 271 24% | 227 4% | 264 21% | 240 10% | 255 17% |
| Brightness (cd/m²) | 215 | 258 20% | 216 0% | 248 15% | 225 5% | 236 10% |
| Brightness Distribution (%) | 85 | 92 8% | 90 6% | 84 -1% | 90 6% | 75 -12% |
| Black Level * (cd/m²) | 0.38 | 0.58 -53% | 0.62 -63% | 0.5 -32% | 0.61 -61% | 0.64 -68% |
| Contrast (:1) | 574 | 467 -19% | 366 -36% | 528 -8% | 393 -32% | 398 -31% |
| Colorchecker dE 2000 * | 10.29 | 10.29 -0% | 9.78 5% | 11.23 -9% | 8.91 13% | |
| Colorchecker dE 2000 max. * | 17.68 | 16.39 7% | 19.44 -10% | 13.52 24% | ||
| Greyscale dE 2000 * | 11.71 | 11.78 -1% | 11.27 4% | 11.16 5% | 12.33 -5% | 9.87 16% |
| Gamma | 2.45 90% | 2.52 87% | 2.41 91% | 2.44 90% | 2.5 88% | 2.26 97% |
| CCT | 14164 46% | 13438 48% | 12875 50% | 12954 50% | 14130 46% | 10232 64% |
| Color Space (Percent of AdobeRGB 1998) (%) | 40 | 38.1 -5% | 41 2% | 39 -2% | 37 -7% | |
| Color Space (Percent of sRGB) (%) | 63 | 60 -5% | 63 0% | 61 -3% | 58 -8% | |
| Total Average (Program / Settings) | -4% /
-4% | 0% /
-7% | 2% /
2% | -2% /
-6% | -2% /
-4% |
* ... smaller is better
Screen Flickering / PWM (Pulse-Width Modulation)
| Screen flickering / PWM not detected | ||
In comparison: 52 % of all tested devices do not use PWM to dim the display. If PWM was detected, an average of 7784 (minimum: 5 - maximum: 343500) Hz was measured. | ||
Display Response Times
| ↔ Response Time Black to White | ||
|---|---|---|
| 31 ms ... rise ↗ and fall ↘ combined | ↗ 14 ms rise | 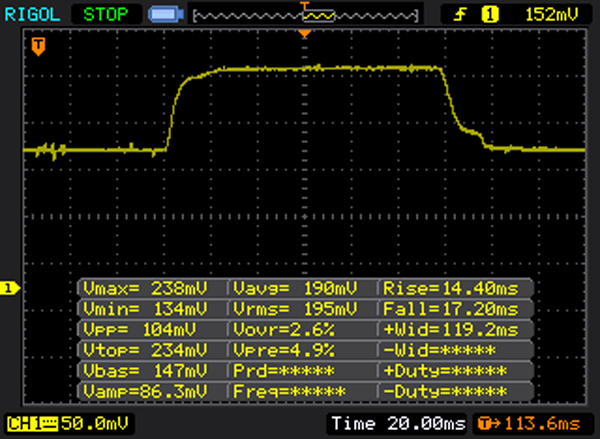 |
| ↘ 17 ms fall | ||
| The screen shows slow response rates in our tests and will be unsatisfactory for gamers. In comparison, all tested devices range from 0.1 (minimum) to 240 (maximum) ms. » 84 % of all devices are better. This means that the measured response time is worse than the average of all tested devices (19.9 ms). | ||
| ↔ Response Time 50% Grey to 80% Grey | ||
| 38 ms ... rise ↗ and fall ↘ combined | ↗ 18 ms rise | 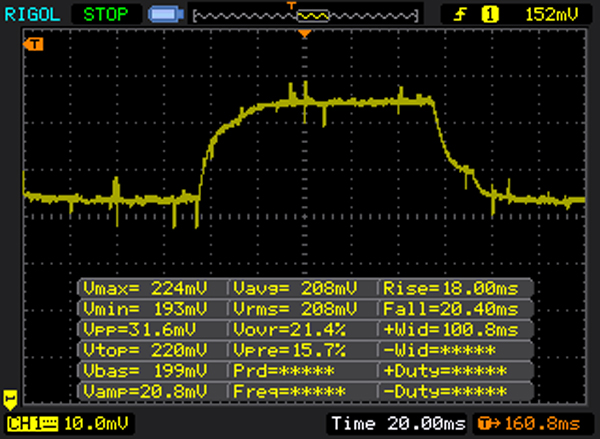 |
| ↘ 20 ms fall | ||
| The screen shows slow response rates in our tests and will be unsatisfactory for gamers. In comparison, all tested devices range from 0.165 (minimum) to 636 (maximum) ms. » 55 % of all devices are better. This means that the measured response time is worse than the average of all tested devices (31.1 ms). | ||
| Cinebench R15 | |
| CPU Single 64Bit | |
| Lenovo S21e-20 80M4004MGE | |
| Acer TravelMate B117-M-P16Q | |
| Acer Aspire One Cloudbook 11 AO1-131-C58K | |
| Dell Inspiron 11 3162 | |
| HP Stream 11-r000ng | |
| CPU Multi 64Bit | |
| Lenovo S21e-20 80M4004MGE | |
| Acer TravelMate B117-M-P16Q | |
| Acer Aspire One Cloudbook 11 AO1-131-C58K | |
| Dell Inspiron 11 3162 | |
| HP Stream 11-r000ng | |
| Geekbench 3 | |
| 32 Bit Single-Core Score | |
| Acer TravelMate B117-M-P16Q | |
| Dell Inspiron 11 3162 | |
| Acer Aspire One Cloudbook 11 AO1-131-C58K | |
| 32 Bit Multi-Core Score | |
| Acer TravelMate B117-M-P16Q | |
| Dell Inspiron 11 3162 | |
| Acer Aspire One Cloudbook 11 AO1-131-C58K | |
| JetStream 1.1 - 1.1 Total | |
| Acer Chromebook C740-C3DY | |
| Acer Aspire One Cloudbook 11 AO1-131-C58K | |
| Acer Aspire One Cloudbook 11 AO1-131-C58K | |
| Dell Inspiron 11 3162 | |
| Medion Akoya S2015 Chromebook | |
| Acer TravelMate B117-M-P16Q | |
| PCMark 8 Home Score Accelerated v2 | 1999 points | |
| PCMark 8 Creative Score Accelerated v2 | 1936 points | |
| PCMark 8 Work Score Accelerated v2 | 1594 points | |
Help | ||
| PCMark 8 - Home Score Accelerated v2 | |
| Acer TravelMate B117-M-P16Q | |
| Dell Inspiron 11 3162 | |
| Acer Aspire One Cloudbook 11 AO1-131-C58K | |
| HP Stream 11-r000ng | |
| Lenovo S21e-20 80M4004MGE | |
| Medion Akoya S2218 | |

| Acer TravelMate B117-M-P16Q Liteonit CV3-8D256 | Acer Aspire One Cloudbook 11 AO1-131-C58K 32 GB eMMC Flash | HP Stream 11-r000ng 32 GB eMMC Flash | Medion Akoya S2218 64 GB eMMC Flash | Lenovo S21e-20 80M4004MGE 32 GB eMMC Flash | Dell Inspiron 11 3162 32 GB eMMC Flash | |
|---|---|---|---|---|---|---|
| CrystalDiskMark 3.0 | -69% | -65% | -73% | -65% | -75% | |
| Read Seq (MB/s) | 506 | 172.4 -66% | 154.2 -70% | 140.2 -72% | 175.5 -65% | 158.4 -69% |
| Write Seq (MB/s) | 393.4 | 78.4 -80% | 76.6 -81% | 52.7 -87% | 69.1 -82% | 20.58 -95% |
| Read 512 (MB/s) | 329.1 | 156.3 -53% | 165.8 -50% | 98.4 -70% | 166.6 -49% | 158.8 -52% |
| Write 512 (MB/s) | 282.5 | 65.2 -77% | 59.9 -79% | 58.7 -79% | 50.1 -82% | 30.91 -89% |
| Read 4k (MB/s) | 23.35 | 17.69 -24% | 18.25 -22% | 15.25 -35% | 19.35 -17% | 11.74 -50% |
| Write 4k (MB/s) | 45.56 | 7.842 -83% | 13.16 -71% | 9.817 -78% | 11.12 -76% | 10.66 -77% |
| Read 4k QD32 (MB/s) | 123.5 | 28.3 -77% | 46.51 -62% | 37.24 -70% | 52 -58% | 31.3 -75% |
| Write 4k QD32 (MB/s) | 111.2 | 7.399 -93% | 13.21 -88% | 8.734 -92% | 10.96 -90% | 10.2 -91% |
| 3DMark 06 Standard Score | 3566 points | |
| 3DMark Vantage P Result | 2081 points | |
| 3DMark 11 Performance | 537 points | |
| 3DMark Ice Storm Standard Score | 26768 points | |
| 3DMark Cloud Gate Standard Score | 2392 points | |
| 3DMark Fire Strike Score | 259 points | |
Help | ||
| 3DMark 11 - 1280x720 Performance GPU | |
| Acer TravelMate B117-M-P16Q | |
| Acer Aspire One Cloudbook 11 AO1-131-C58K | |
| Dell Inspiron 11 3162 | |
| HP Stream 11-r000ng | |
| Lenovo S21e-20 80M4004MGE | |
| low | med. | high | ultra | |
|---|---|---|---|---|
| Deus Ex Human Revolution (2011) | 35.4 | 14.7 | ||
| Diablo III (2012) | 32 | 19.1 | 14.4 | |
| Counter-Strike: GO (2012) | 42.6 | 32 | 20.4 | |
| Tomb Raider (2013) | 27.8 | 12.8 | 9.5 | |
| BioShock Infinite (2013) | 22.2 | 11.4 | 9.2 | |
| GRID: Autosport (2014) | 50.5 | 15 | ||
| Sims 4 (2014) | 77.5 | 19.6 | ||
| F1 2014 (2014) | 28 | 17 | ||
| Dirt Rally (2015) | 41.5 | 12.5 | ||
| Metal Gear Solid V (2015) | 18.8 | 13 | ||
| World of Warships (2015) | 21.8 | 16.2 |
(±) The maximum temperature on the upper side is 40.1 °C / 104 F, compared to the average of 33.1 °C / 92 F, ranging from 21.6 to 53.2 °C for the class Netbook.
(±) The bottom heats up to a maximum of 42.4 °C / 108 F, compared to the average of 36.6 °C / 98 F
(+) In idle usage, the average temperature for the upper side is 28.6 °C / 83 F, compared to the device average of 29.8 °C / 86 F.
(+) The palmrests and touchpad are cooler than skin temperature with a maximum of 29.8 °C / 85.6 F and are therefore cool to the touch.
(±) The average temperature of the palmrest area of similar devices was 29.3 °C / 84.7 F (-0.5 °C / -0.9 F).
Acer TravelMate B117-M-P16Q audio analysis
(-) | not very loud speakers (71 dB)
Bass 100 - 315 Hz
(-) | nearly no bass - on average 30.8% lower than median
(±) | linearity of bass is average (9.9% delta to prev. frequency)
Mids 400 - 2000 Hz
(±) | higher mids - on average 6.7% higher than median
(±) | linearity of mids is average (8.6% delta to prev. frequency)
Highs 2 - 16 kHz
(+) | balanced highs - only 1.5% away from median
(+) | highs are linear (6.7% delta to prev. frequency)
Overall 100 - 16.000 Hz
(±) | linearity of overall sound is average (26.9% difference to median)
Compared to same class
» 43% of all tested devices in this class were better, 14% similar, 43% worse
» The best had a delta of 14%, average was 25%, worst was 35%
Compared to all devices tested
» 82% of all tested devices were better, 4% similar, 14% worse
» The best had a delta of 4%, average was 24%, worst was 134%
Apple MacBook 12 (Early 2016) 1.1 GHz audio analysis
(+) | speakers can play relatively loud (83.6 dB)
Bass 100 - 315 Hz
(±) | reduced bass - on average 11.3% lower than median
(±) | linearity of bass is average (14.2% delta to prev. frequency)
Mids 400 - 2000 Hz
(+) | balanced mids - only 2.4% away from median
(+) | mids are linear (5.5% delta to prev. frequency)
Highs 2 - 16 kHz
(+) | balanced highs - only 2% away from median
(+) | highs are linear (4.5% delta to prev. frequency)
Overall 100 - 16.000 Hz
(+) | overall sound is linear (10.2% difference to median)
Compared to same class
» 7% of all tested devices in this class were better, 2% similar, 91% worse
» The best had a delta of 5%, average was 18%, worst was 53%
Compared to all devices tested
» 5% of all tested devices were better, 1% similar, 94% worse
» The best had a delta of 4%, average was 24%, worst was 134%
| Off / Standby | |
| Idle | |
| Load |
|
Key:
min: | |
| Battery Runtime - WiFi Websurfing | |
| Acer Chromebook C740-C3DY | |
| Acer TravelMate B117-M-P16Q | |
| Dell Inspiron 11 3162 | |
| HP Stream 11-r000ng | |
| Medion Akoya S2015 Chromebook | |
| Medion Akoya S2218 | |
| Acer Aspire One Cloudbook 11 AO1-131-C58K | |
| Lenovo S21e-20 80M4004MGE | |
Pros
Cons
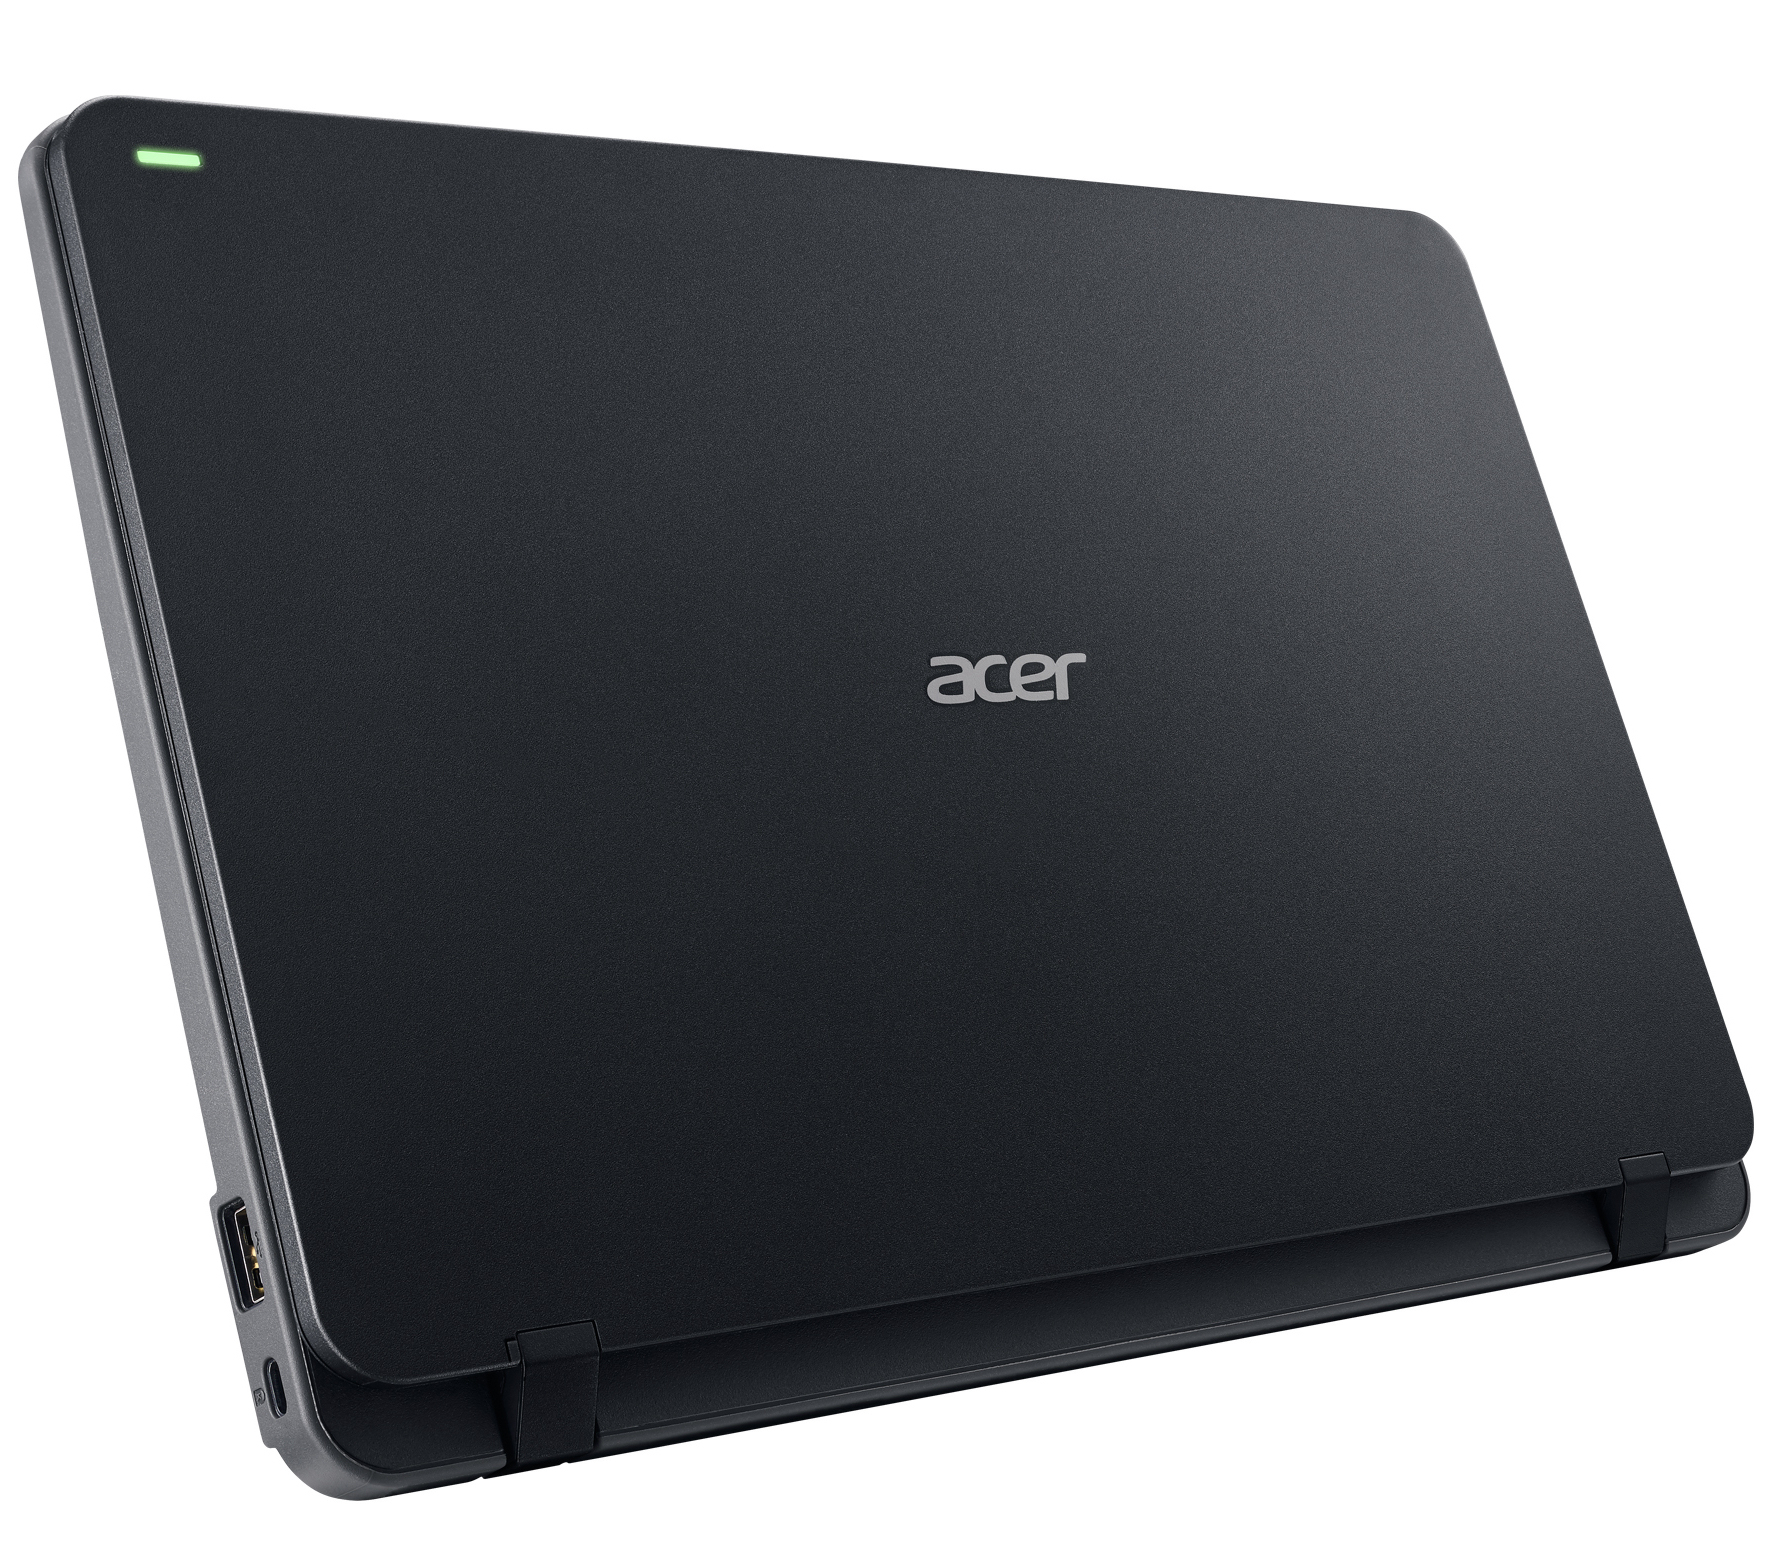
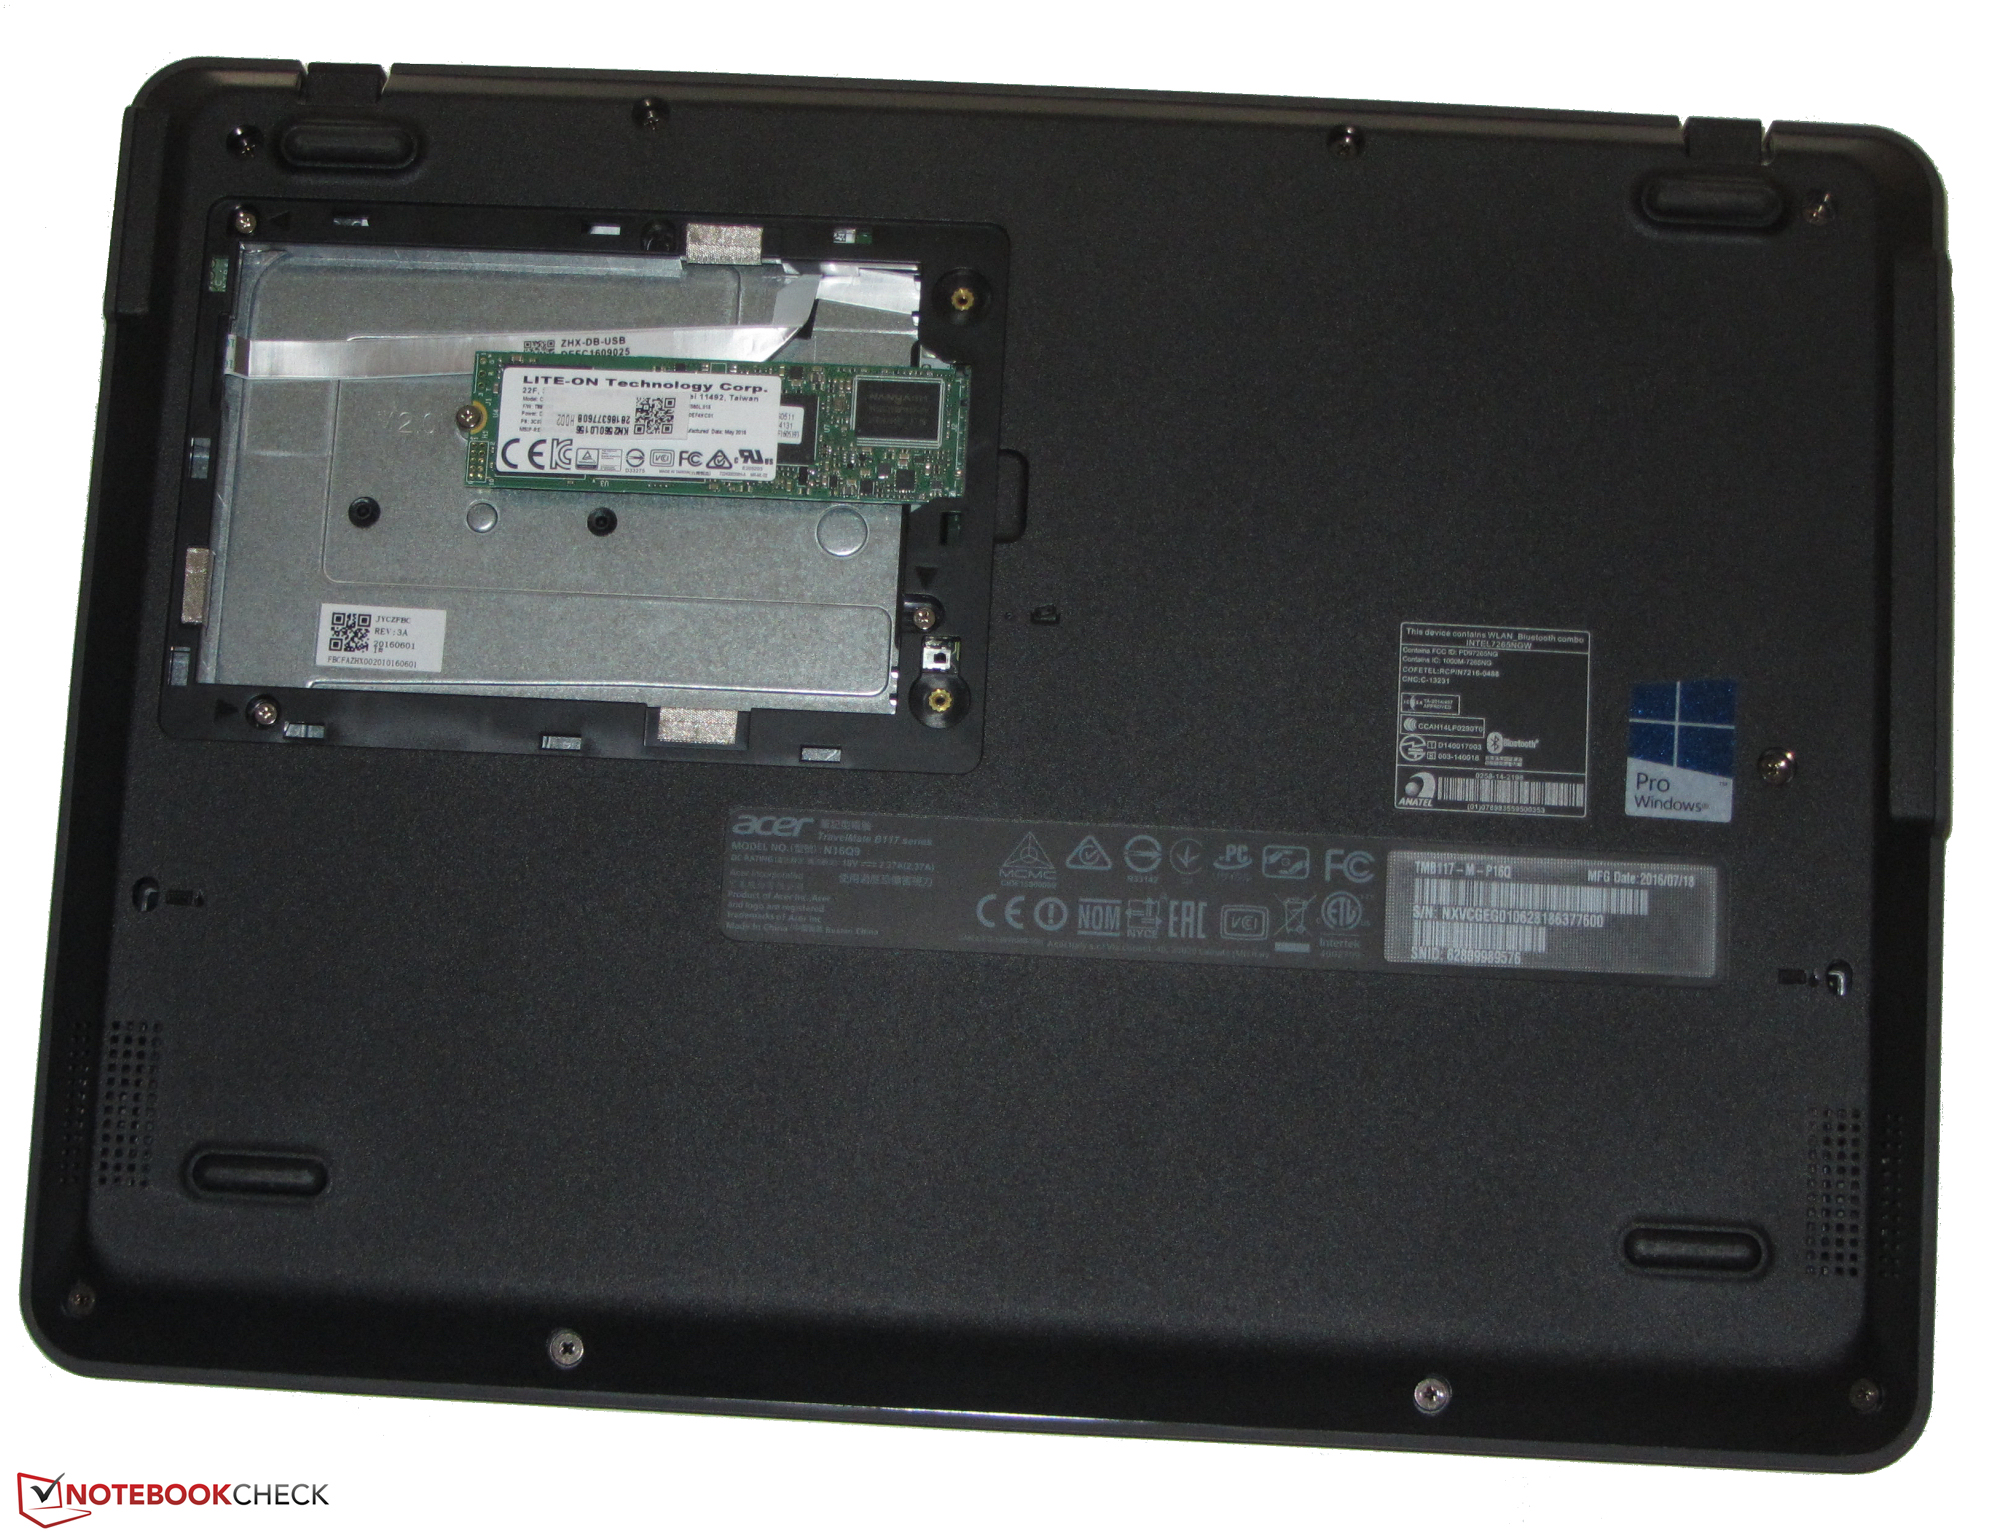
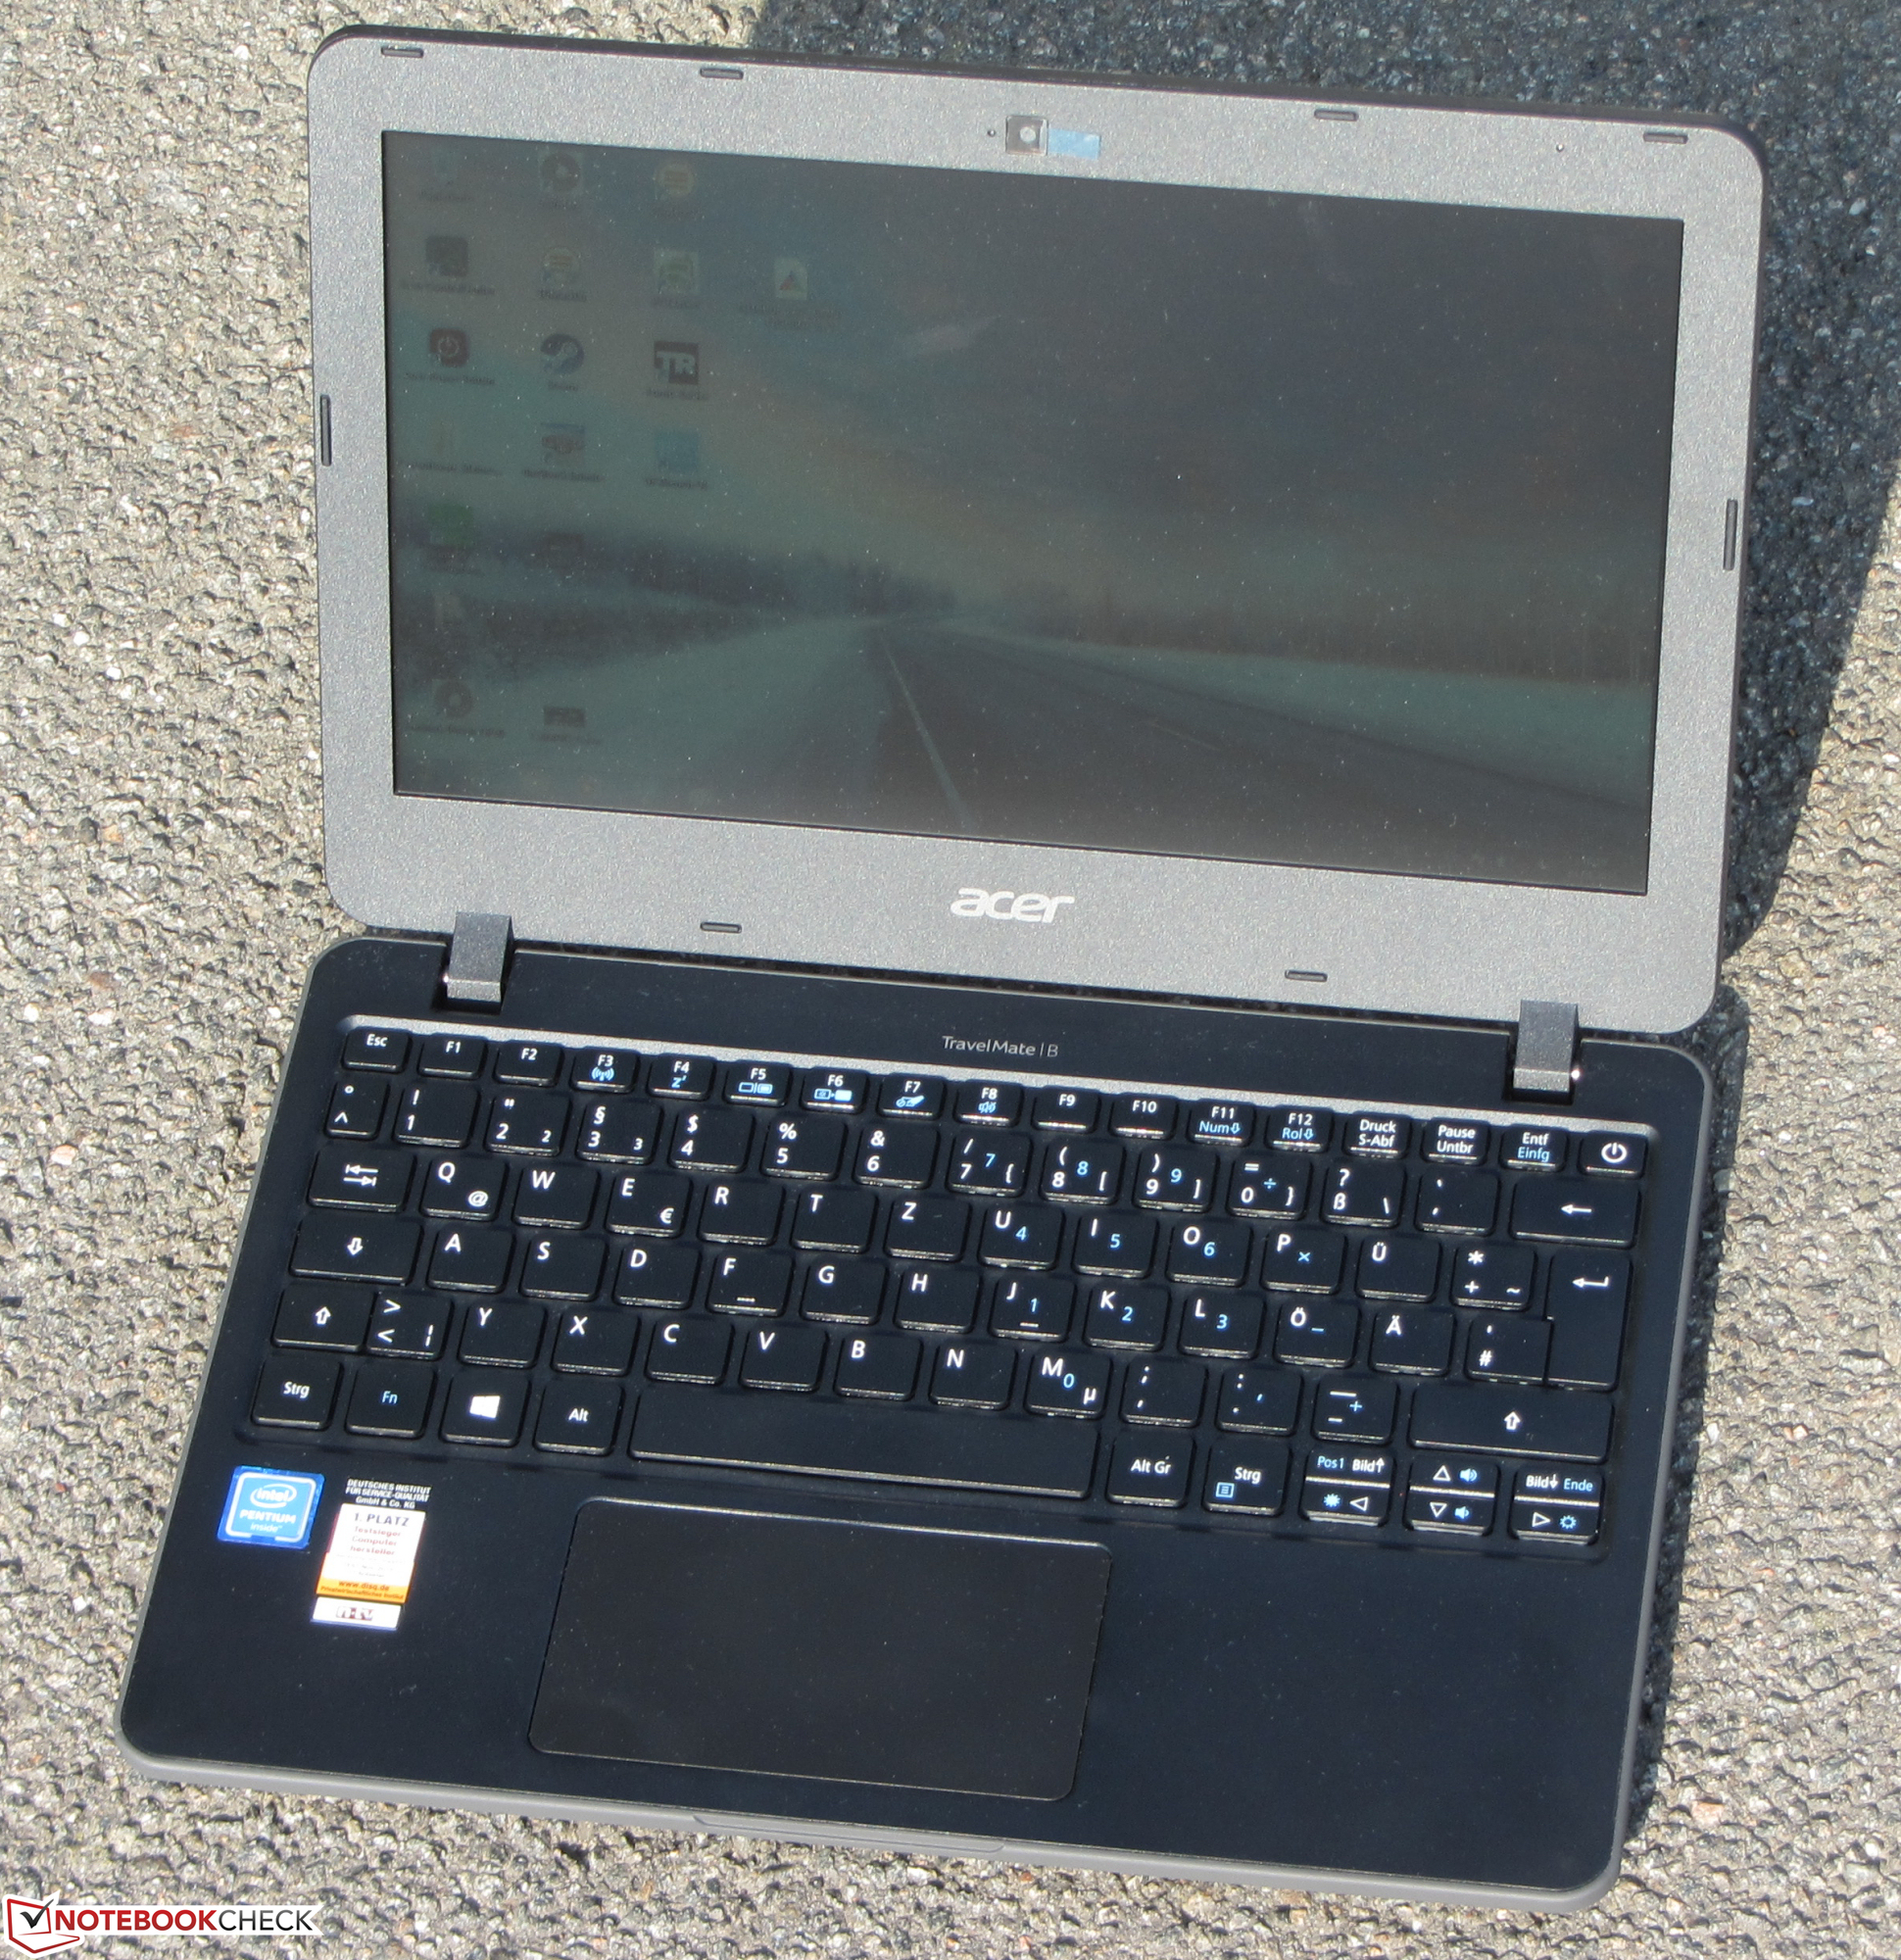
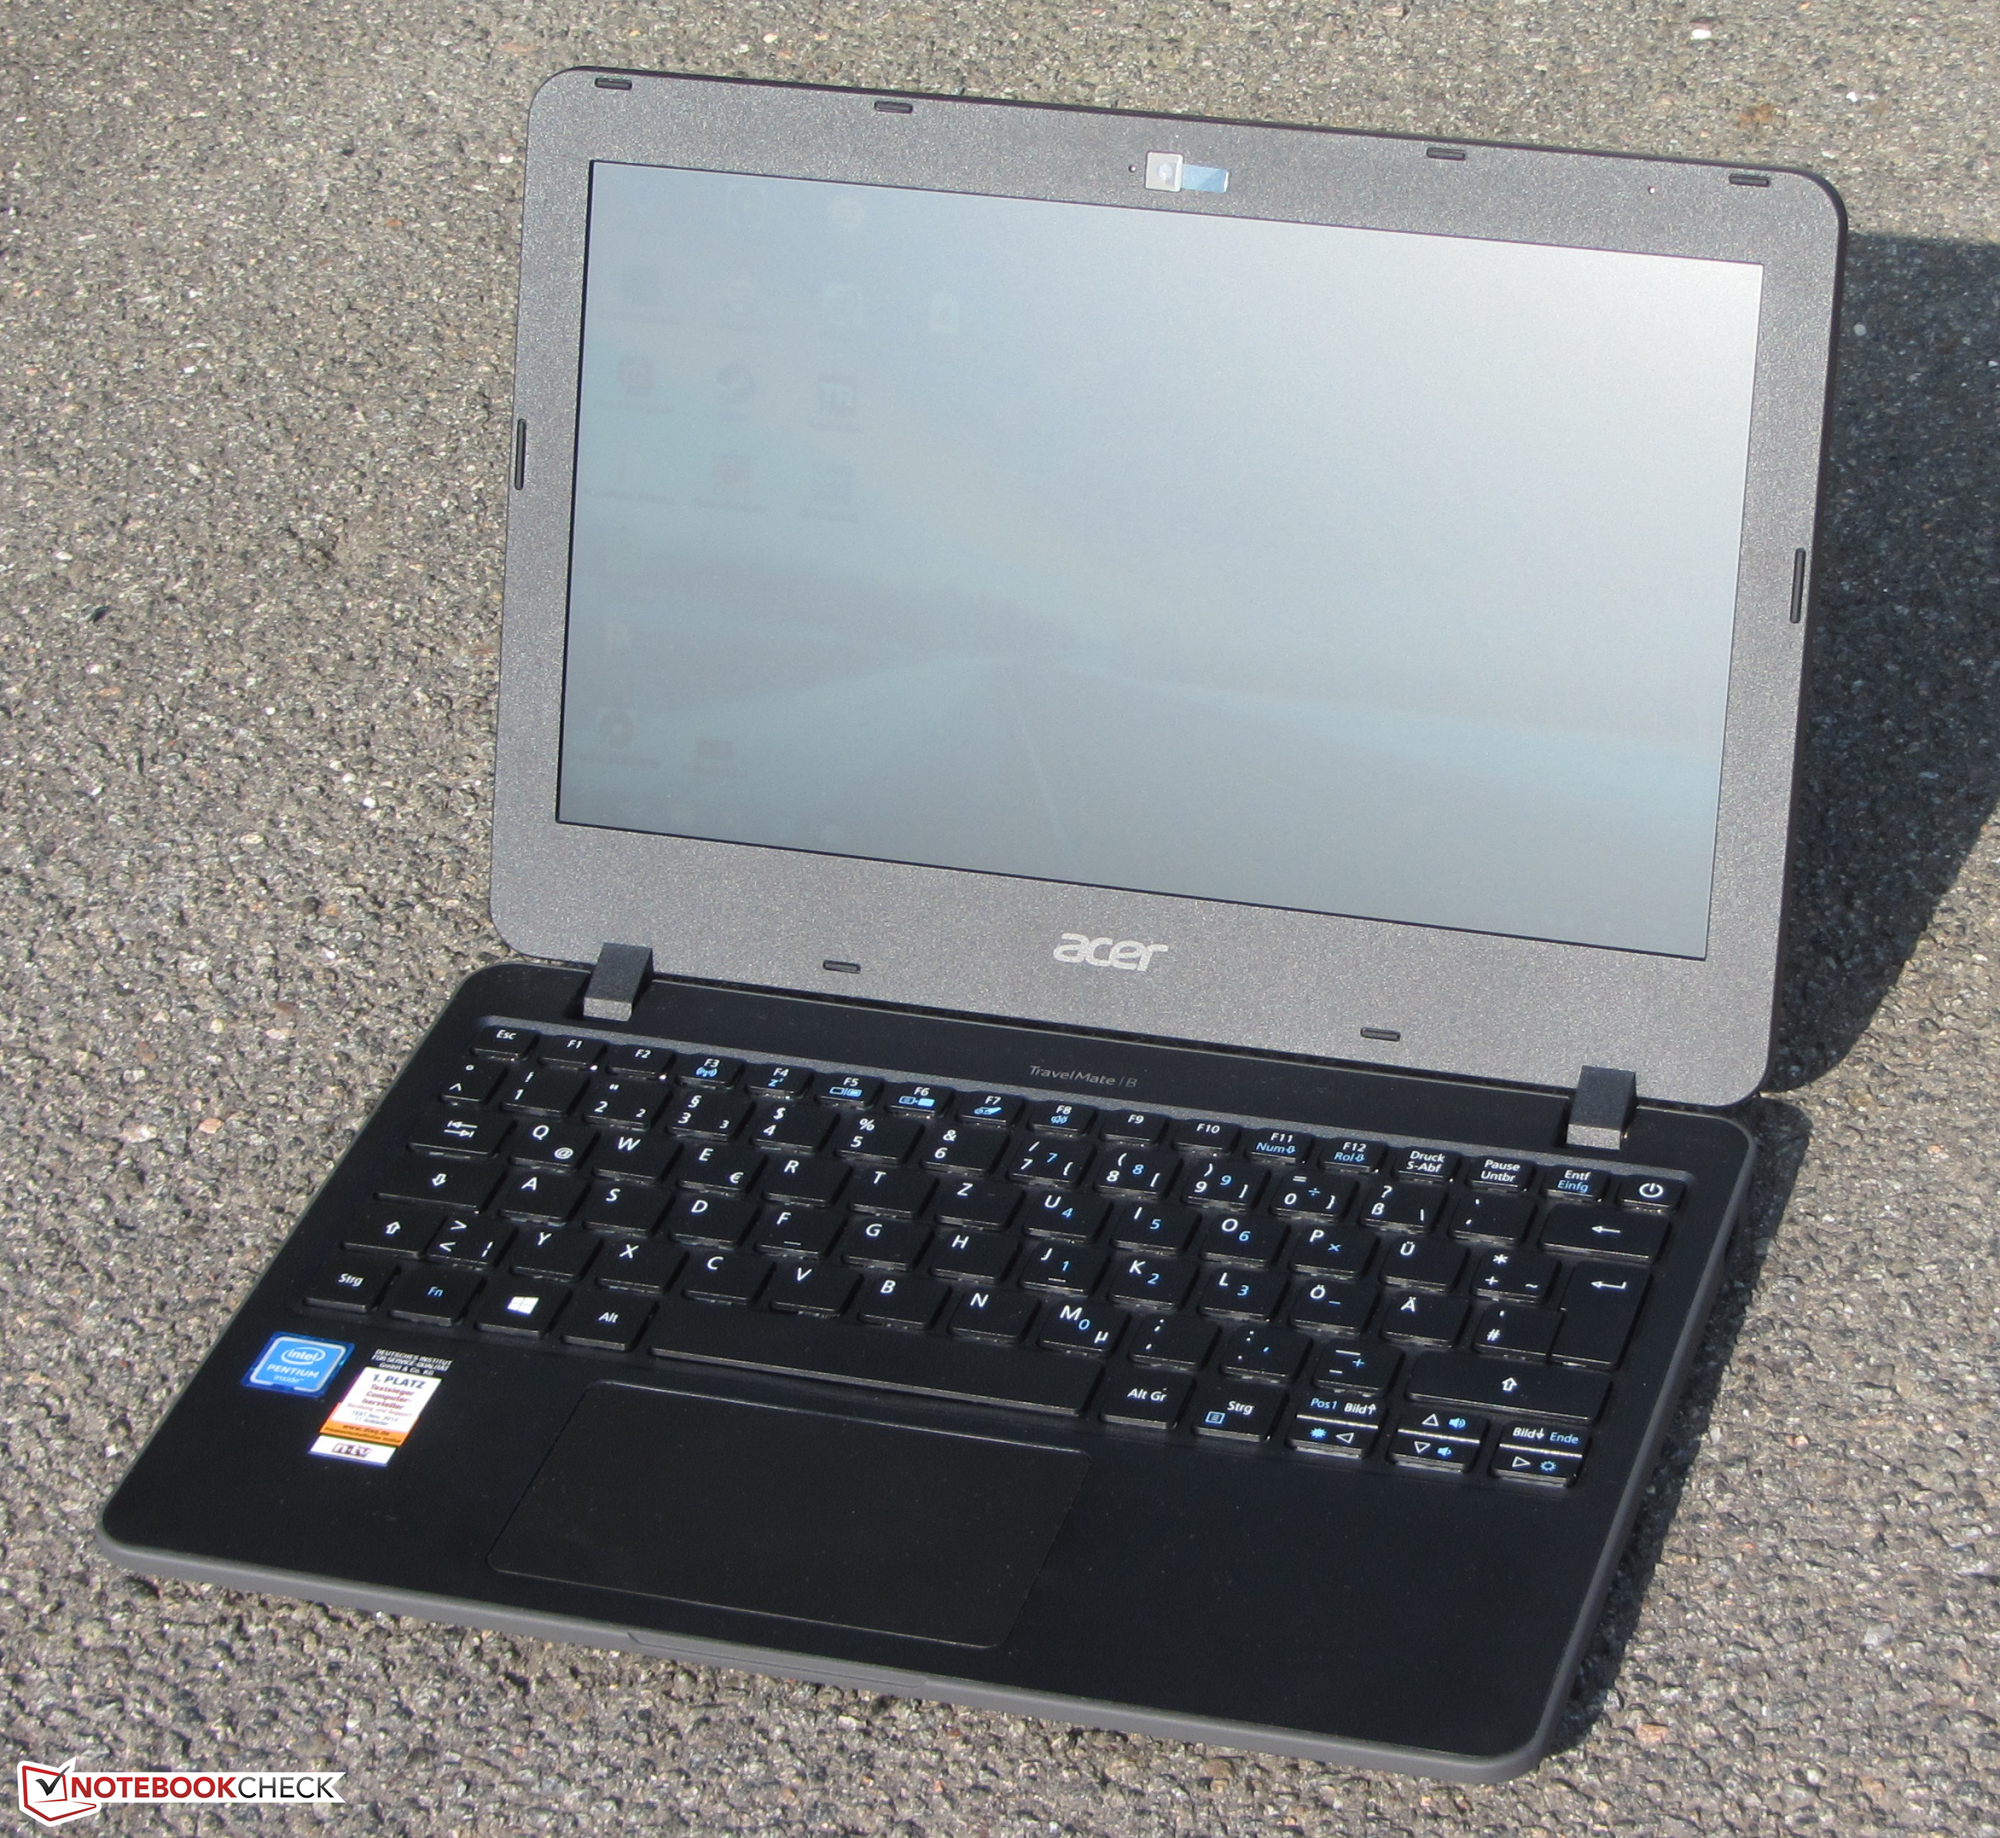
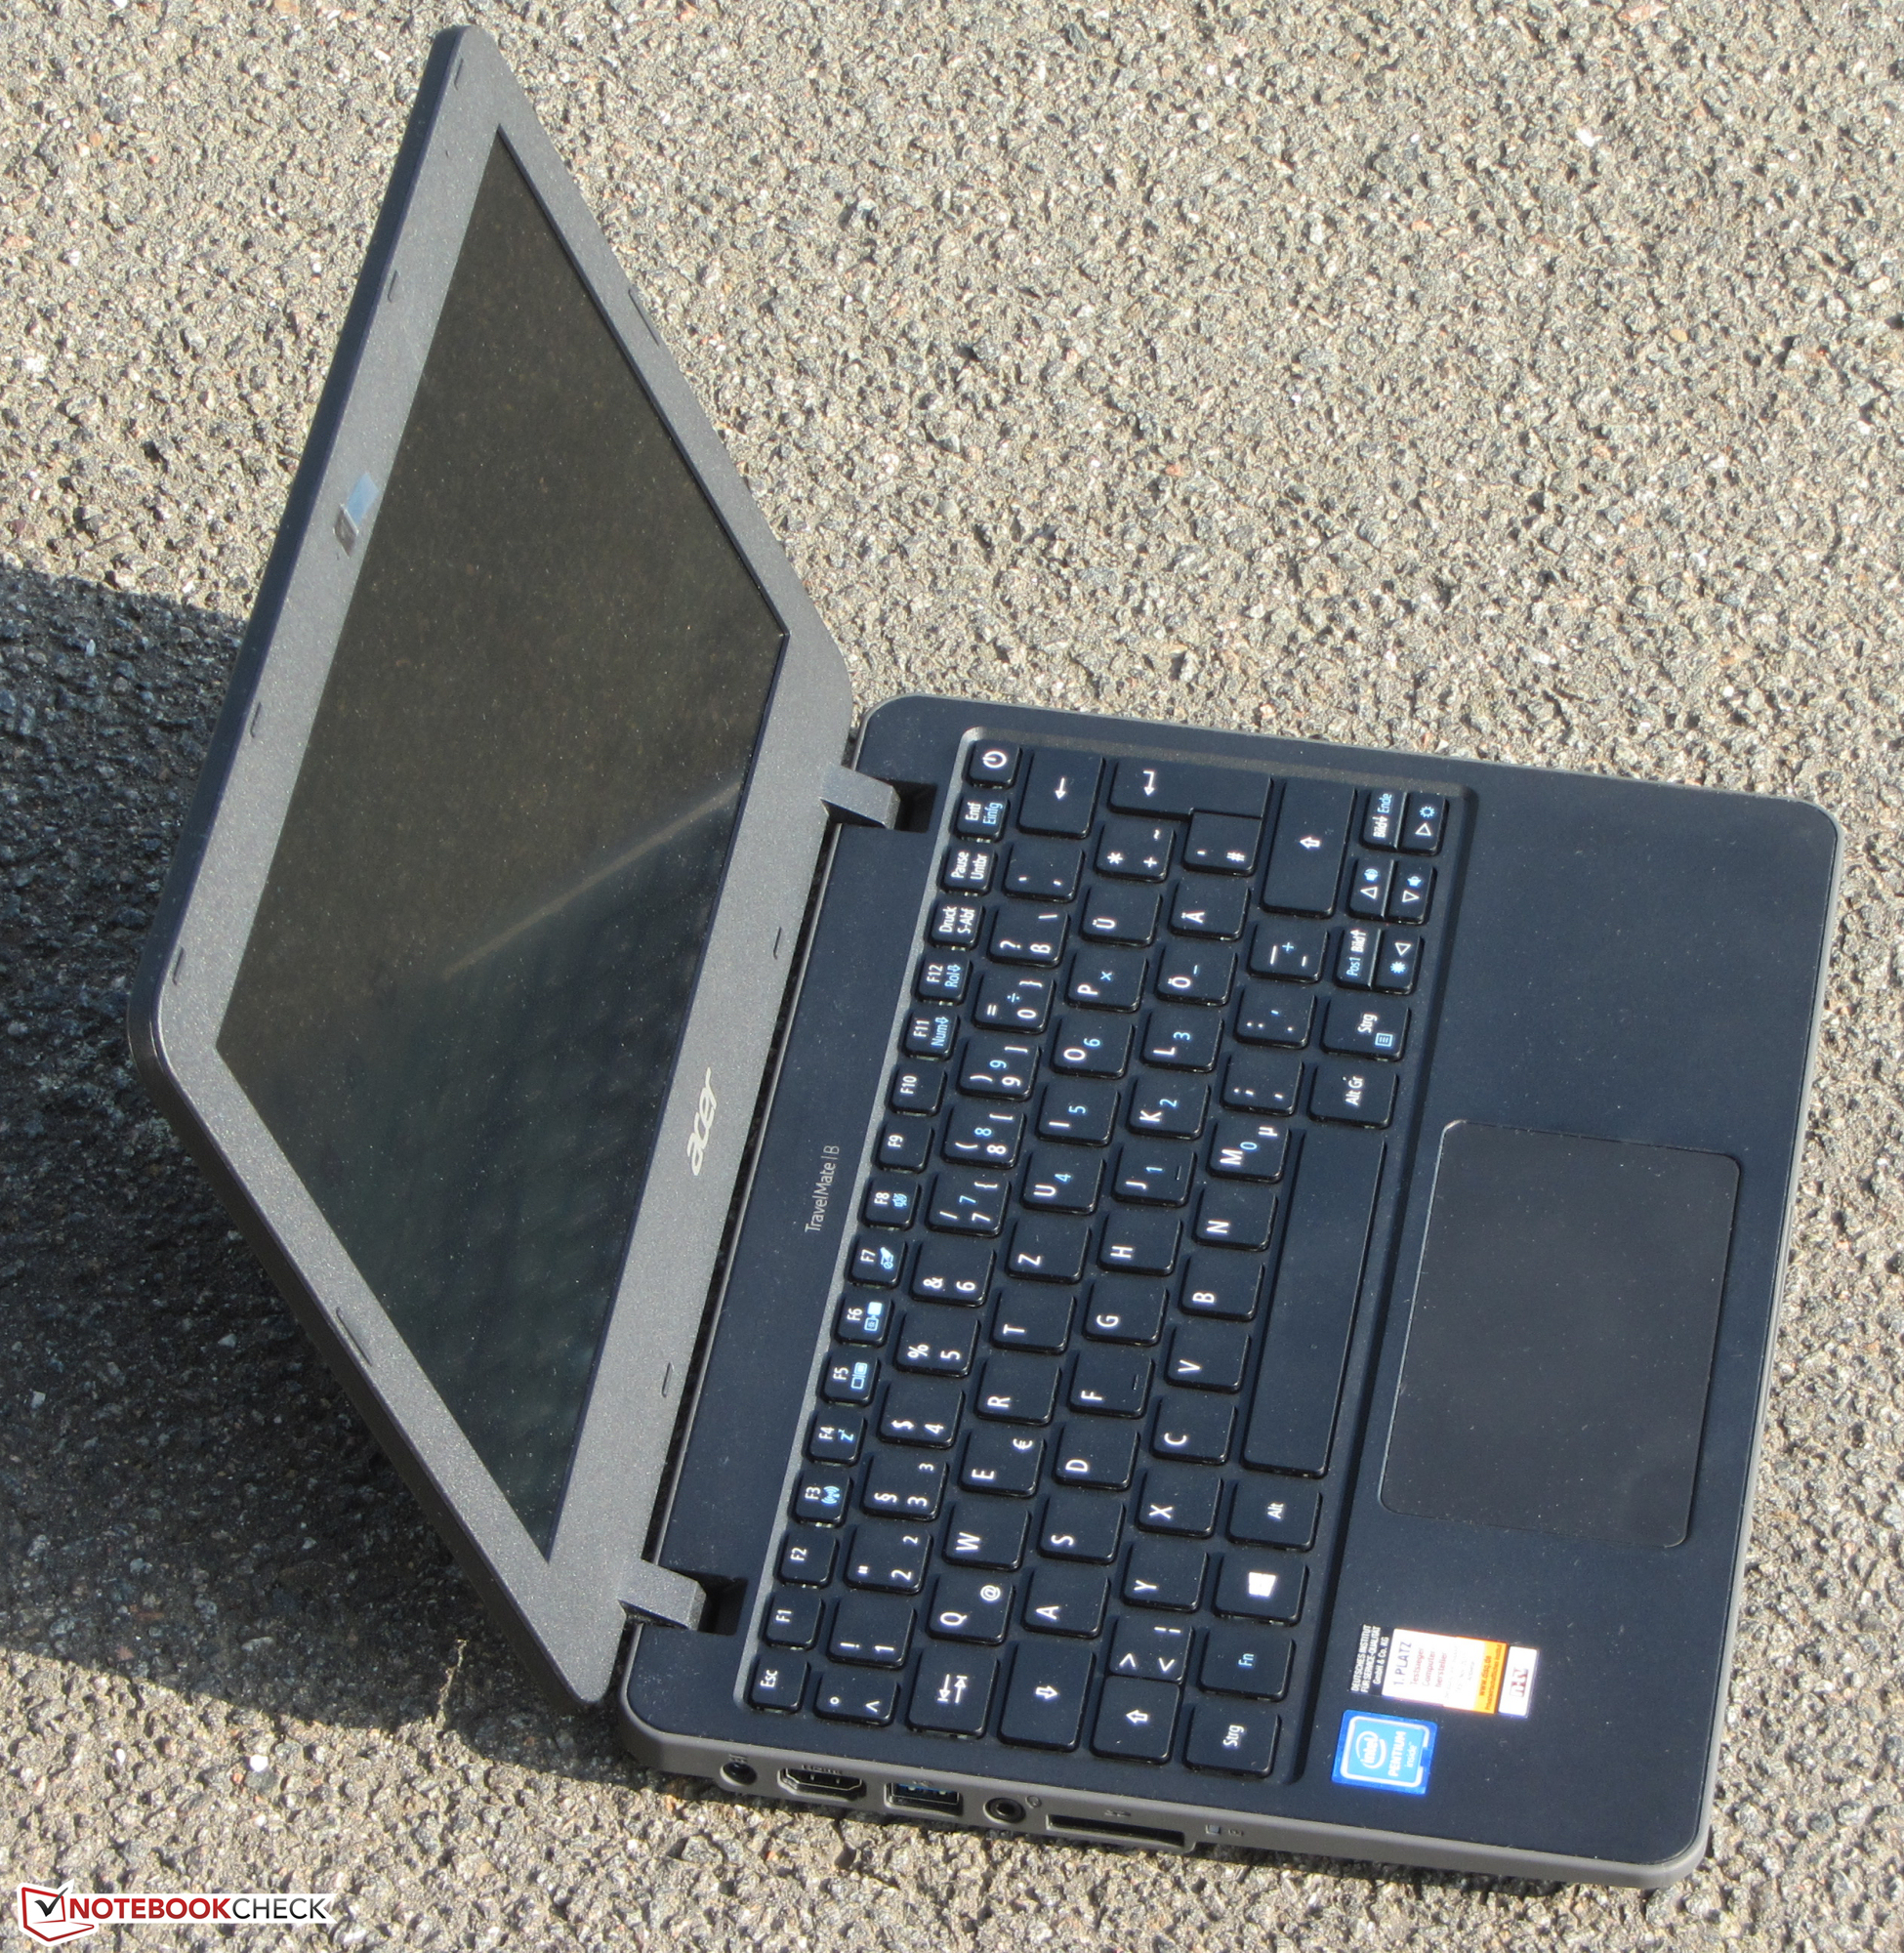
宏基的这款小尺寸上网本是为了教育行业而设计的,它坚固的外壳能够证明这一点。它所配备的处理器能够为基本的办公以及互联网功能提供足够的性能。这台笔记本运行时总是十分安静而且不会过热。其高速的固态硬盘保证了系统能够快速的运行,并且因为 TravelMate 设置有维修窗,所以为它更换固态硬盘是十分简单的。它的续航表现也是十分出众的。它同时拥有一块非常出色的键盘。而且它的三年原厂保修也是值得一提的。但它的缺点再一次落在了它的屏幕上,它的屏幕亮度严重不足且可视角度有限。
宏碁制造了一台紧凑且十分耐用的机器,它十分适用于打字以及上网。TravelMate 的产品线应该能够吸引到很多的学生。
但是,我们的测试样品550欧元(约合616美金)的售价并不便宜,固态硬盘的配备以及两套Windows操作系统都提高了售价。为了节约资金,可以考虑型号为 B117-M-P12K 的产品。 它采用的是传统500GB机械硬盘而且不带有Windows操作系统,它加上二手 Windows 7 许可的总价大约是330欧元(约合369美金)。
注:本文是基于完整评测的缩减版本,阅读完整的英文评测,请点击这里。
Acer TravelMate B117-M-P16Q
- 09/27/2016 v5.1 (old)
Sascha Mölck