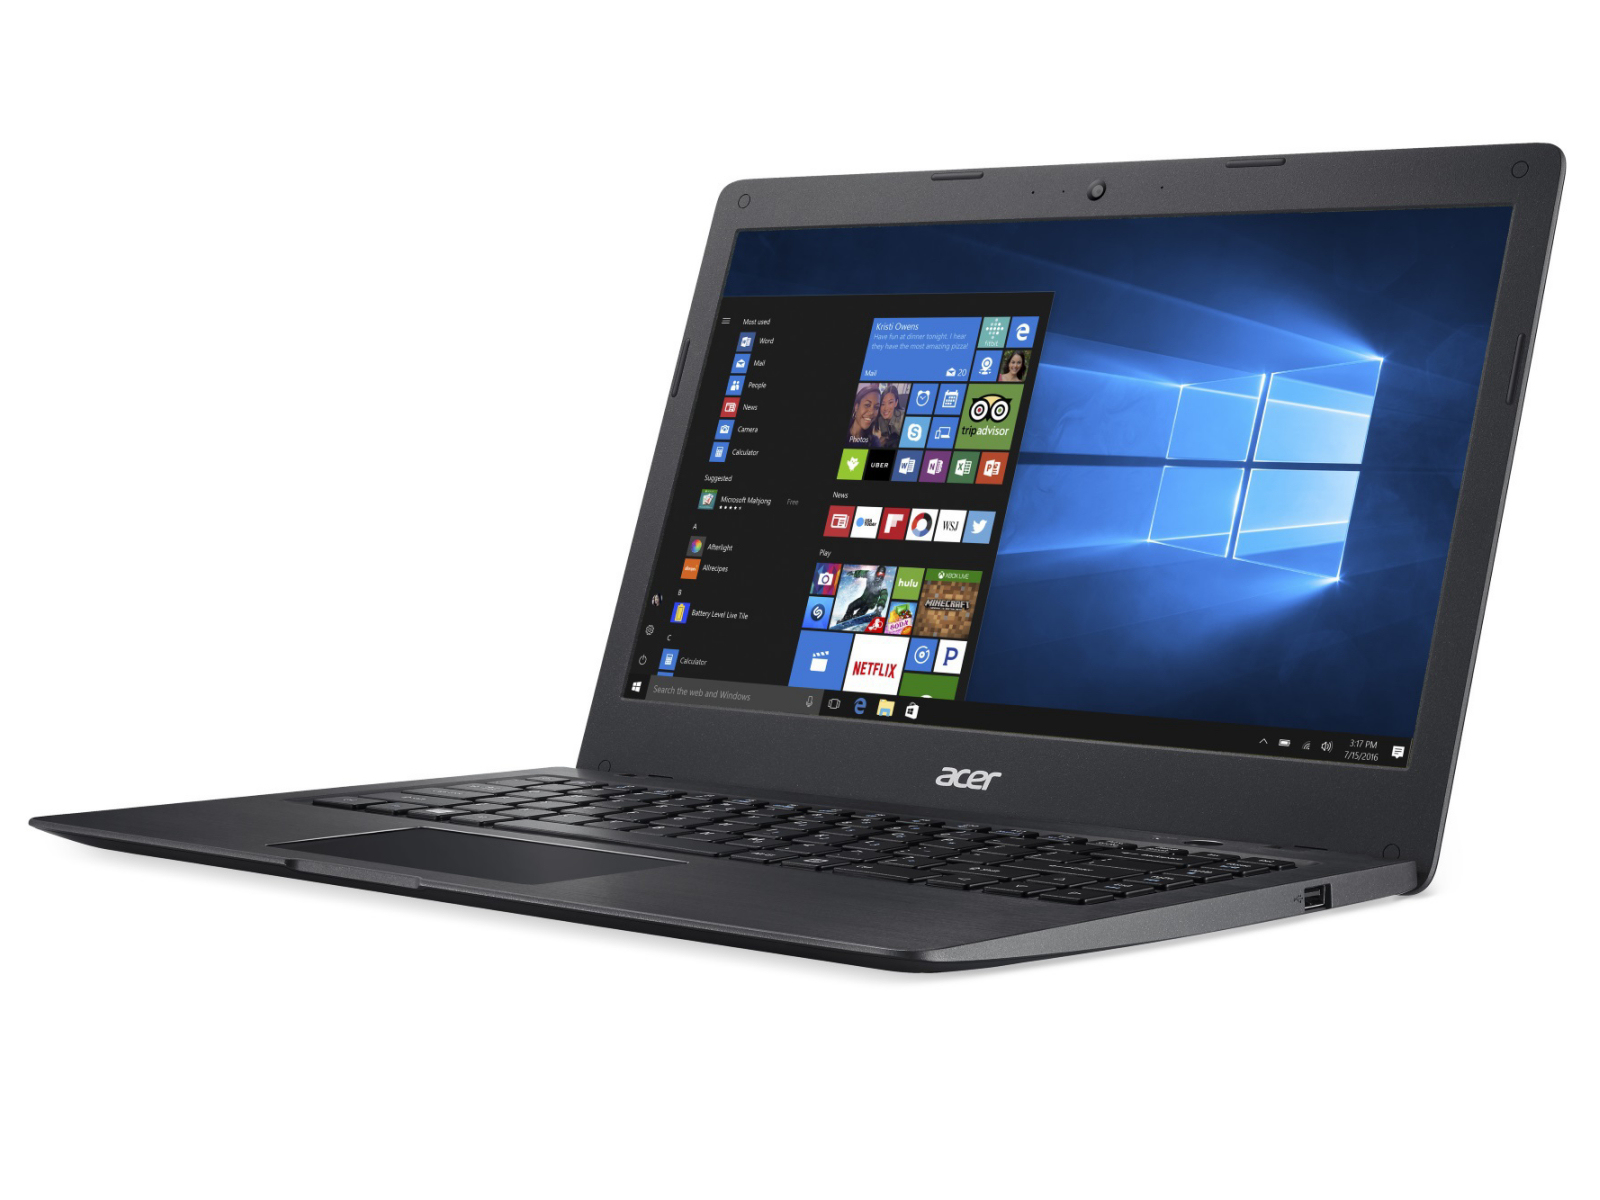
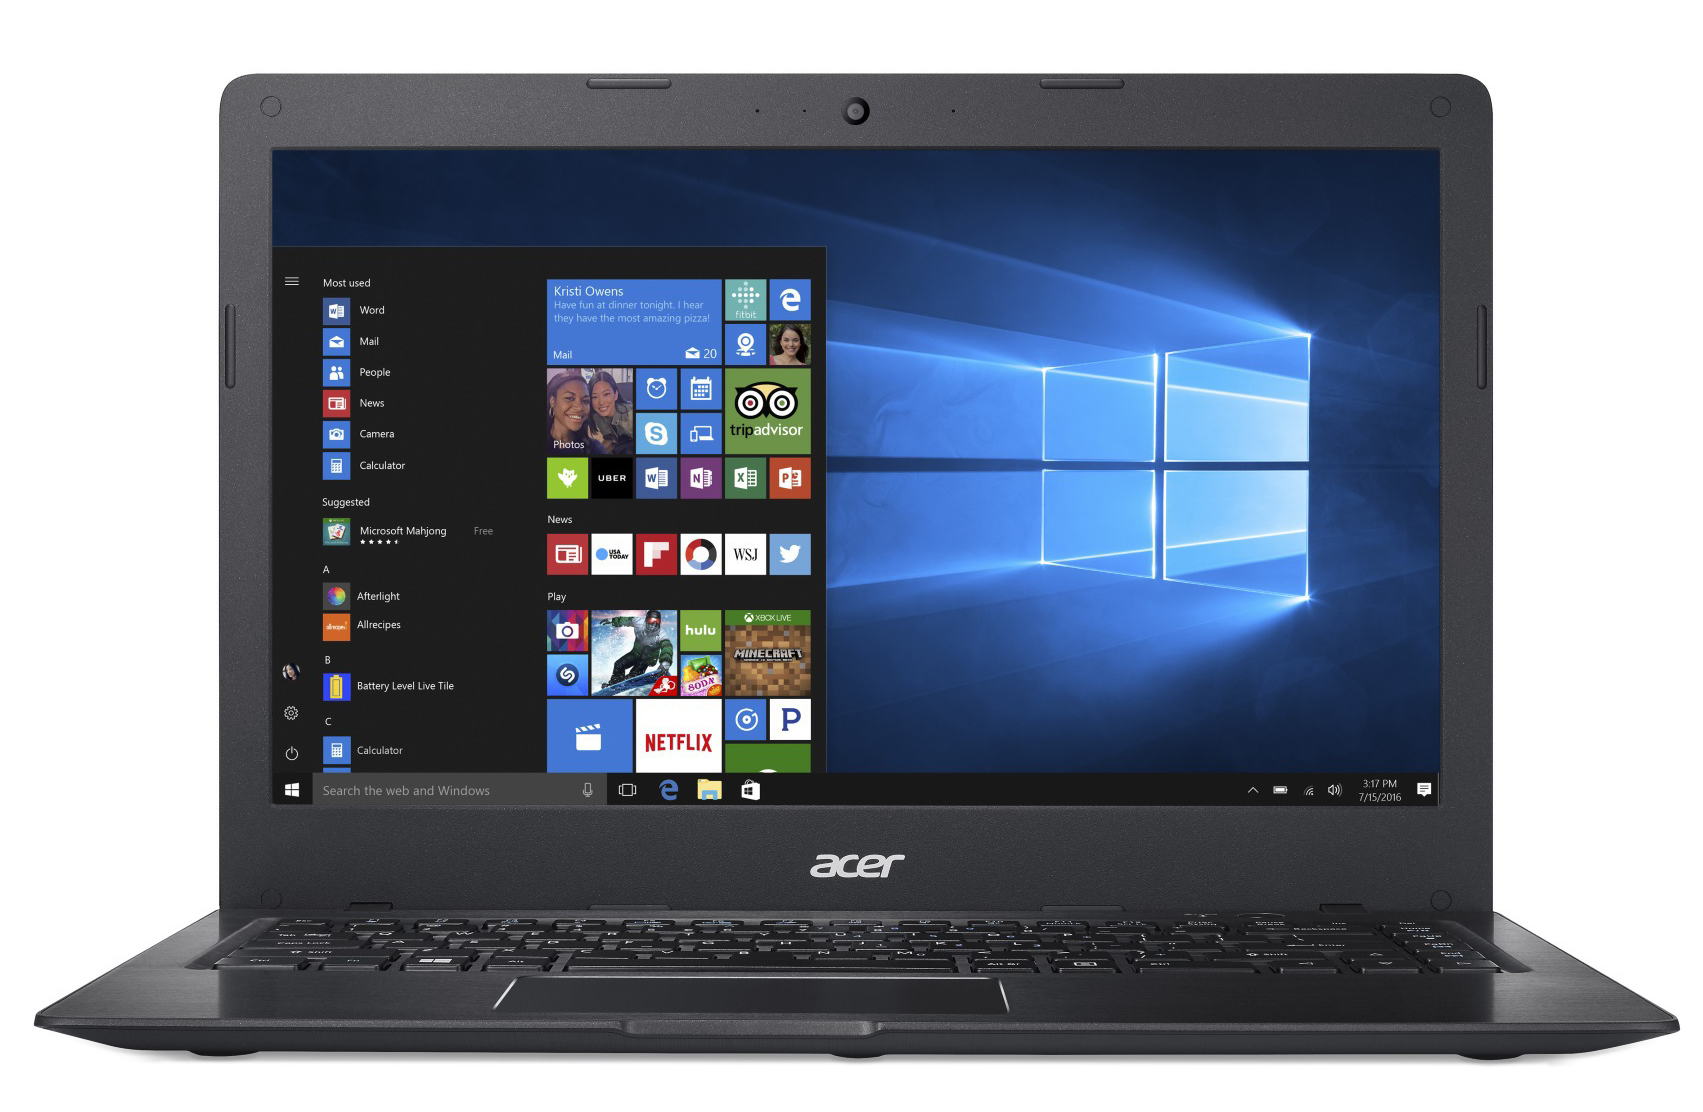
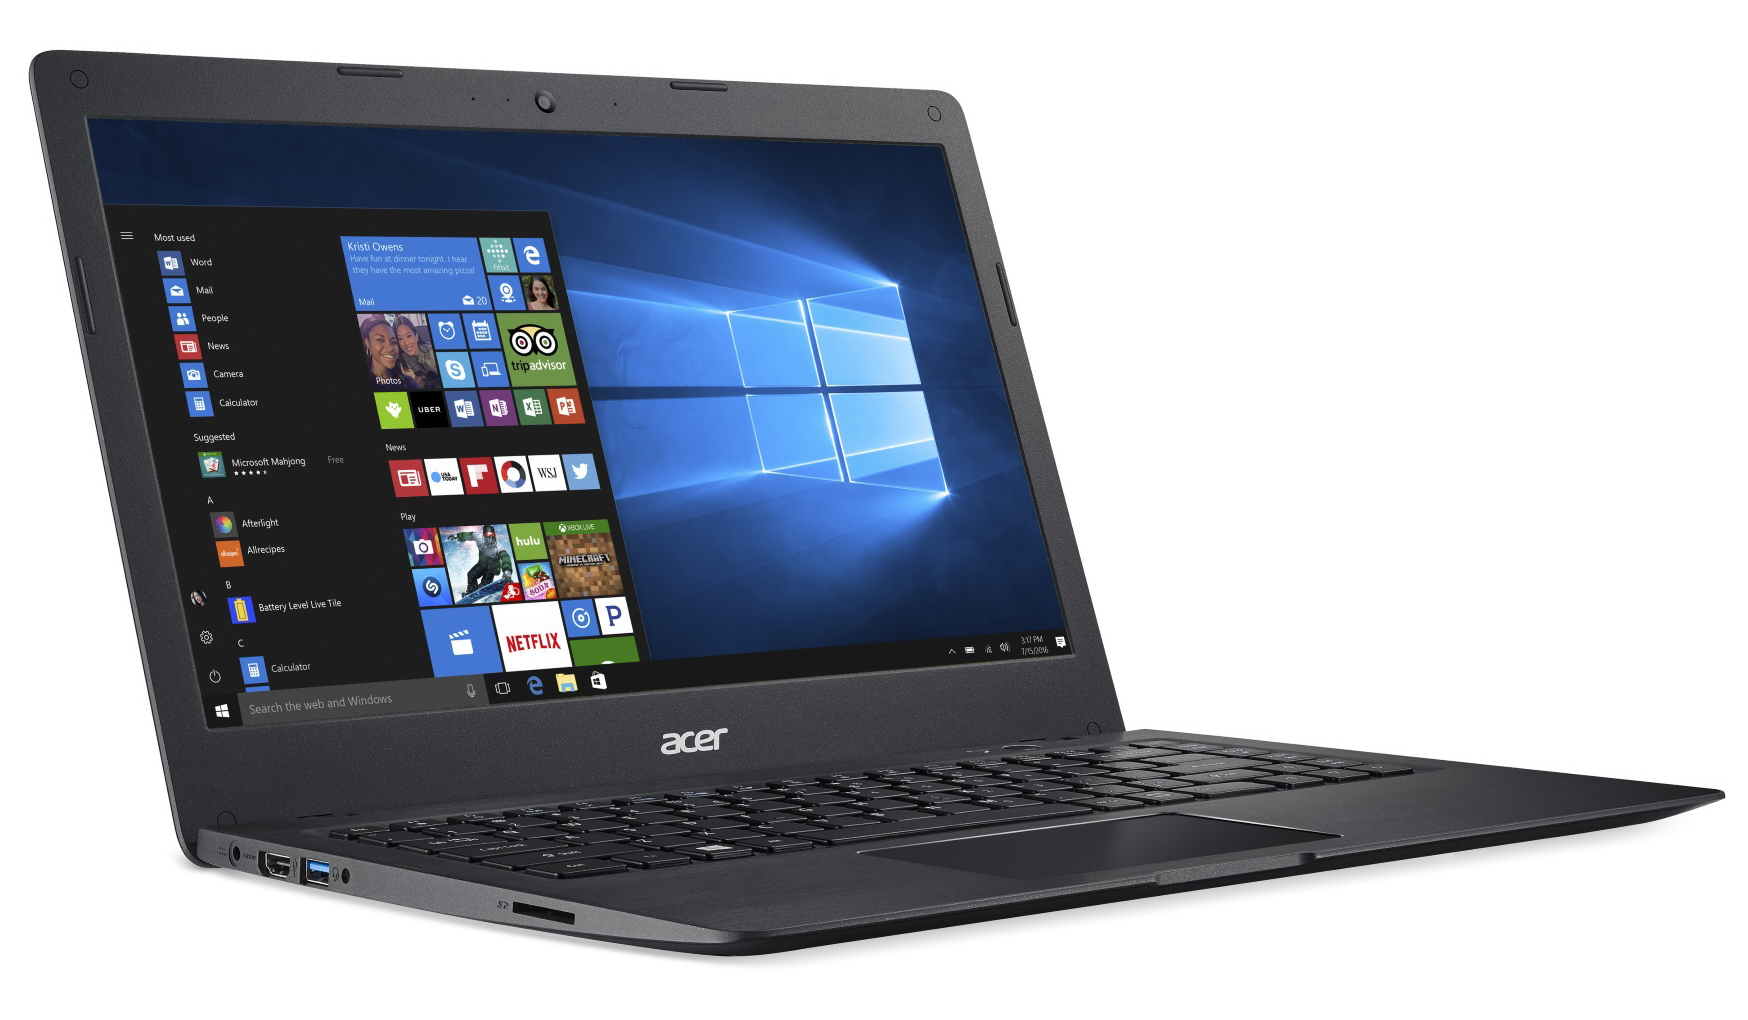
宏碁 Swift 1 SF114-31-P6F6 笔记本电脑简短评测
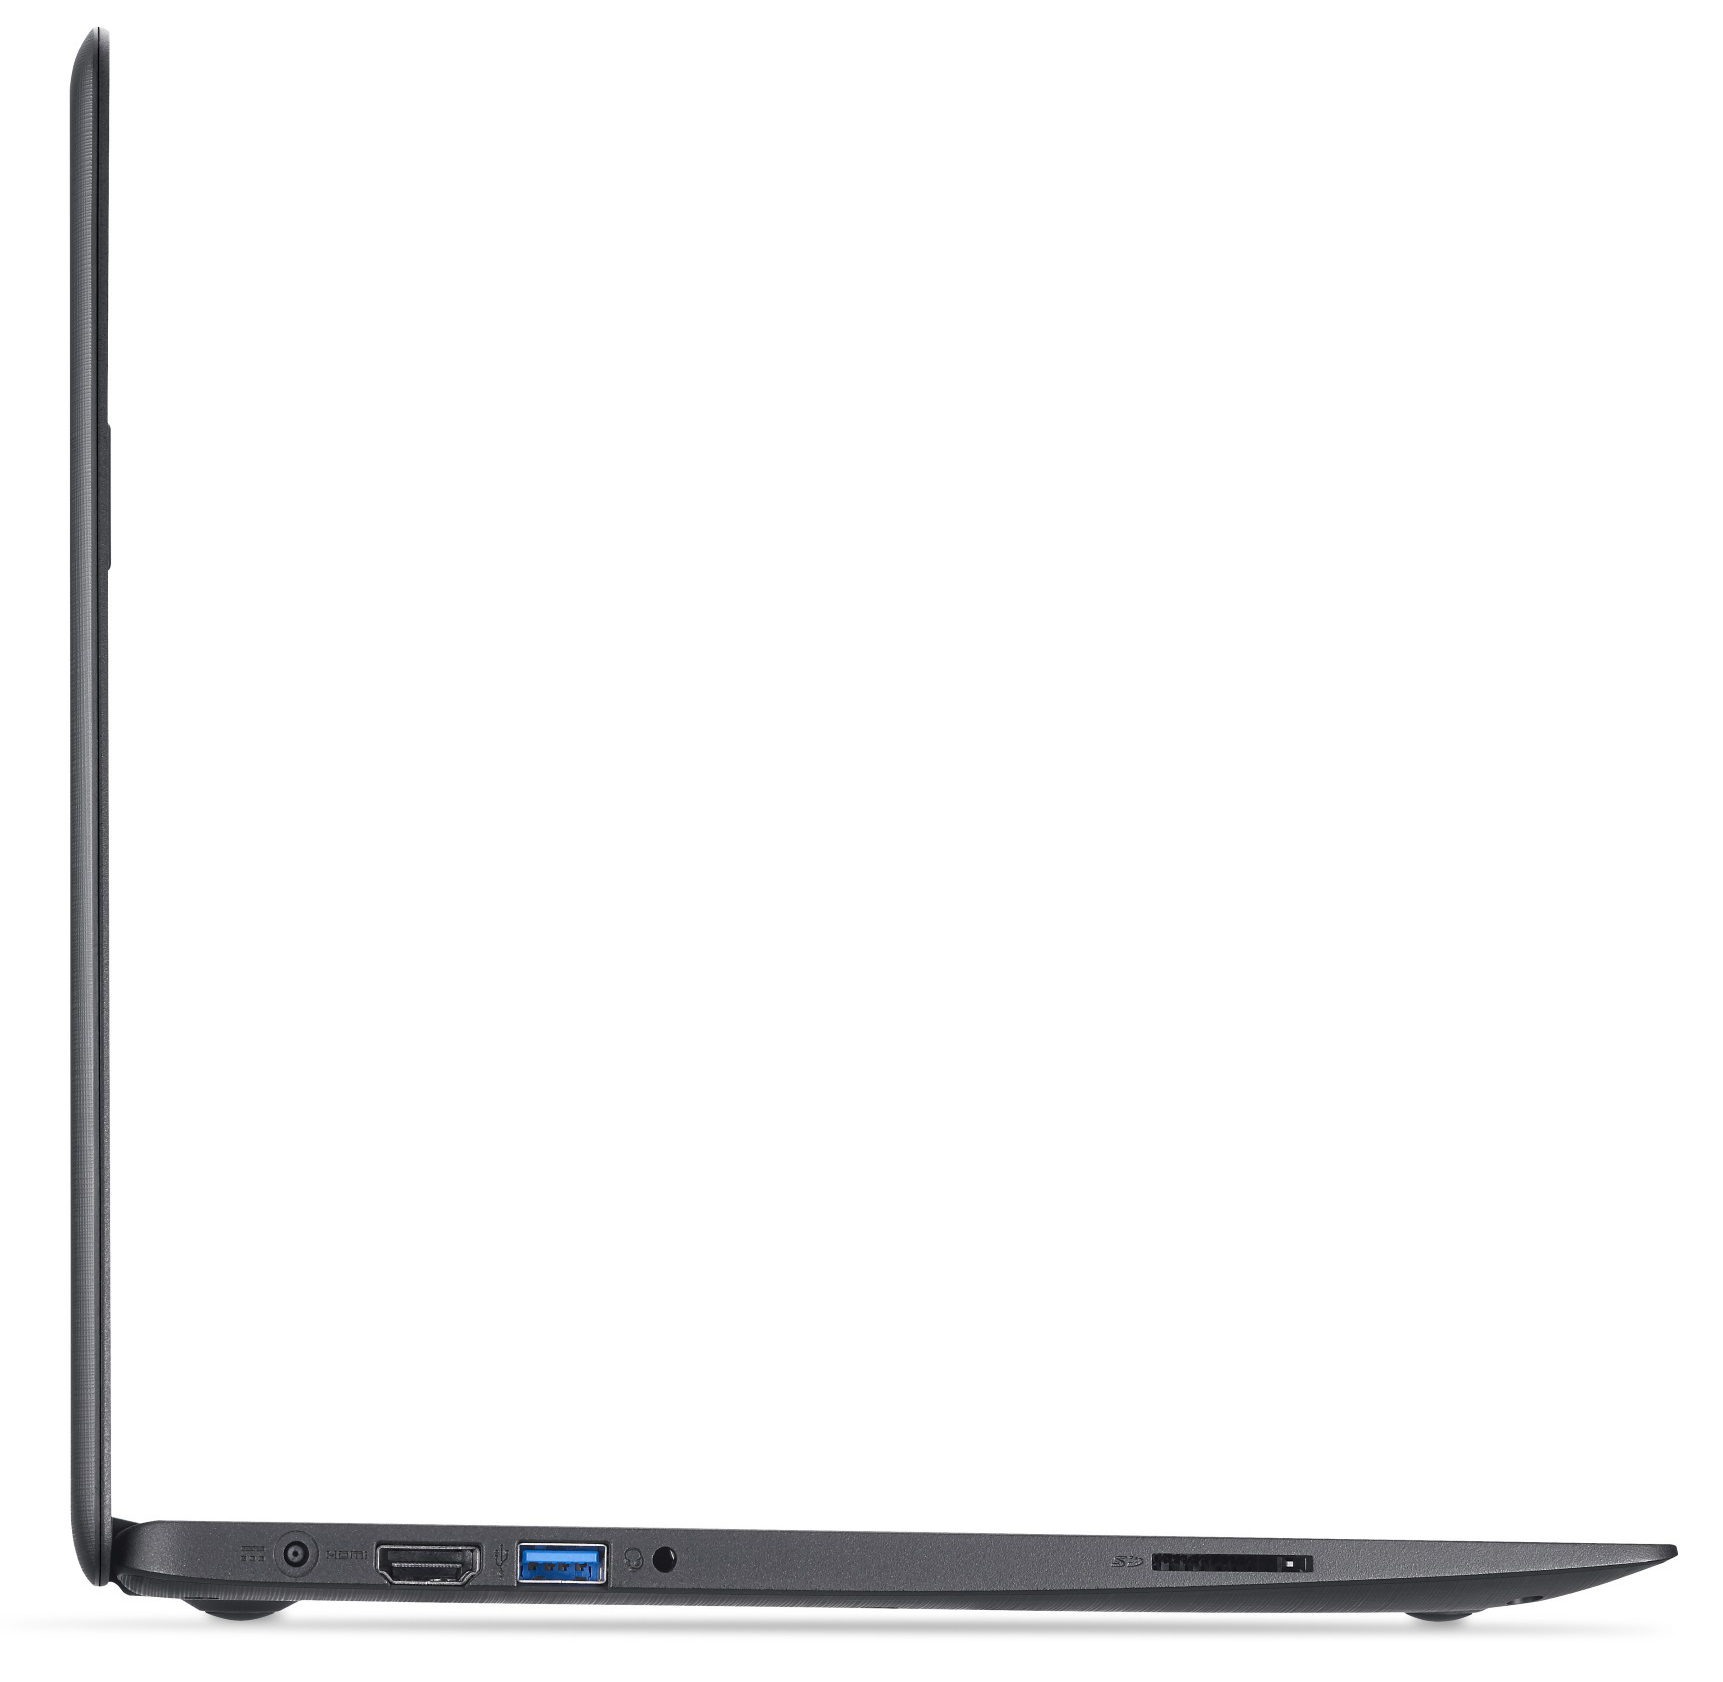
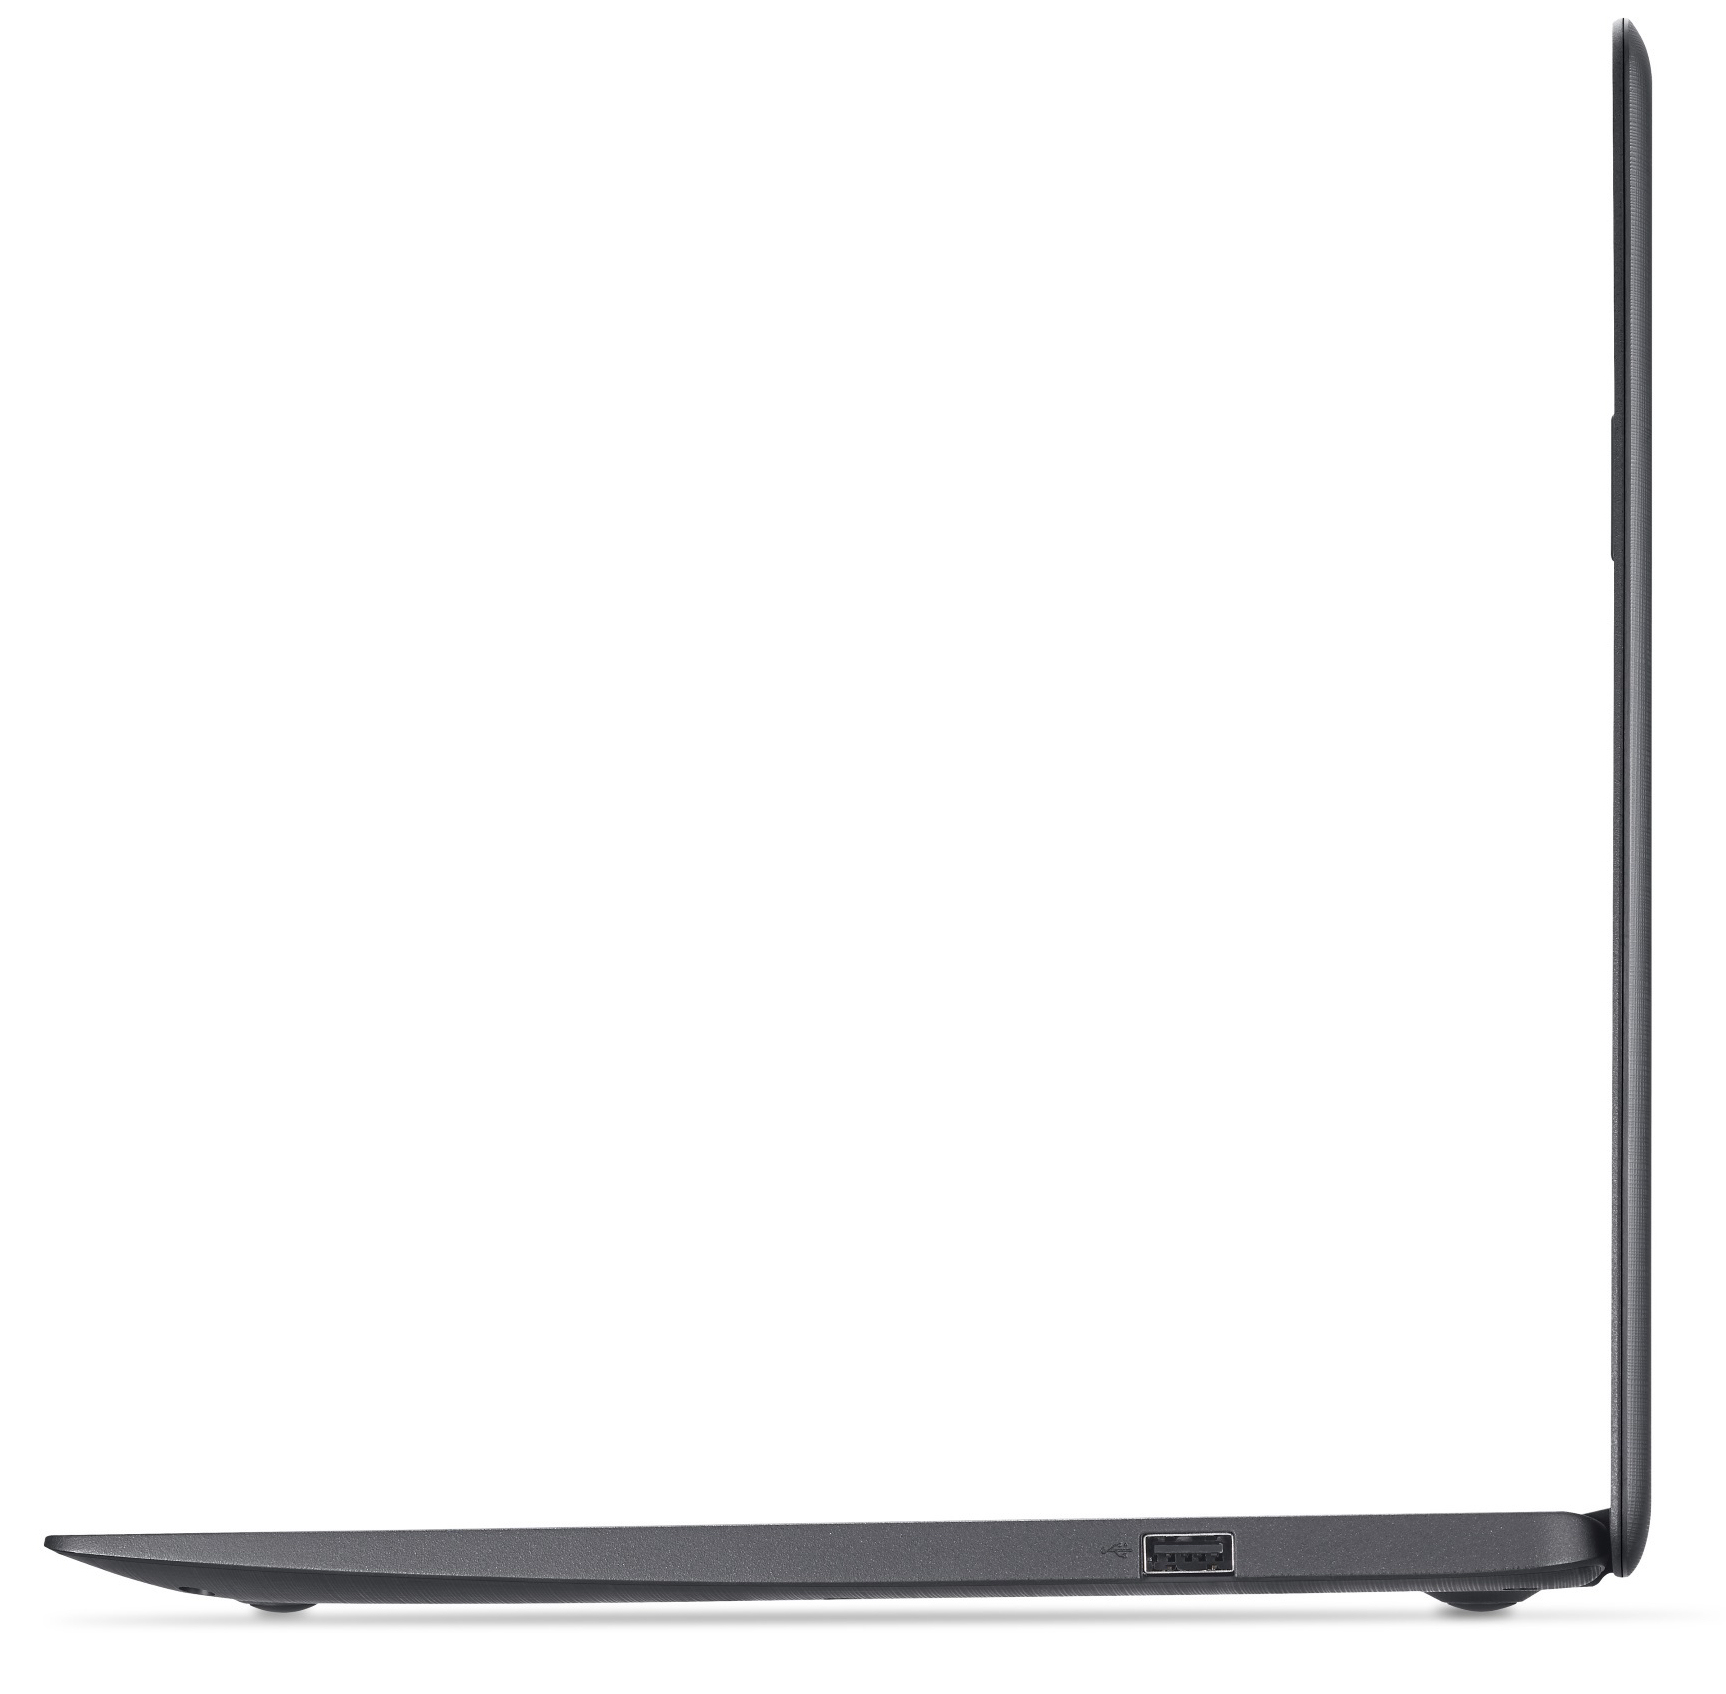
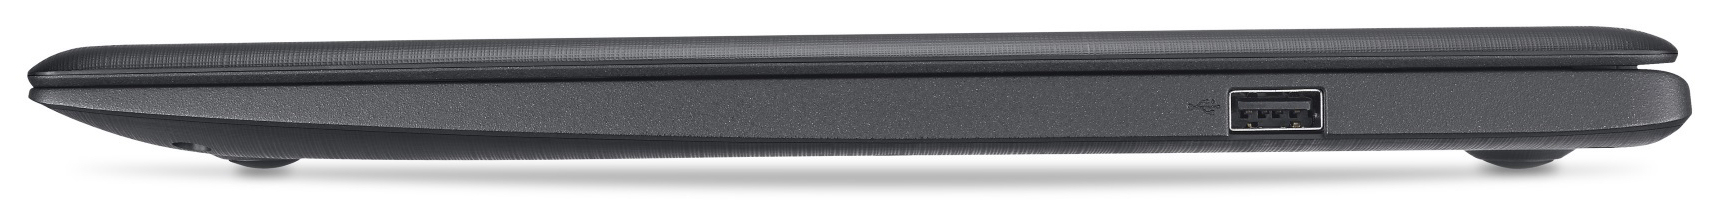
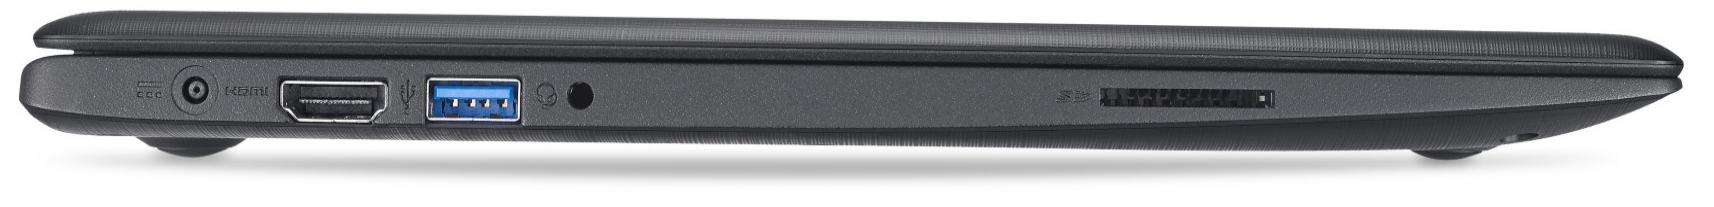
Connectivity
| SD Card Reader | |
| average JPG Copy Test (av. of 3 runs) | |
| Medion Akoya S4219 | |
| HP Stream 13-c102ng | |
| Acer Swift 1 SF114-31-P6F6 | |
| Acer Aspire One Cloudbook 14 AO1-431-C6QM | |
| Lenovo E31-70 80KX015RGE | |
| maximum AS SSD Seq Read Test (1GB) | |
| Medion Akoya S4219 | |
| Acer Swift 1 SF114-31-P6F6 | |
| Lenovo E31-70 80KX015RGE | |
| HP Stream 13-c102ng | |
| Networking | |
| iperf3 transmit AX12 | |
| Lenovo IdeaPad 710S Plus-13IKB | |
| Acer Swift 1 SF114-31-P6F6 (jseb) | |
| iperf3 receive AX12 | |
| Lenovo IdeaPad 710S Plus-13IKB | |
| Acer Swift 1 SF114-31-P6F6 (jseb) | |
| |||||||||||||||||||||||||
Brightness Distribution: 80 %
Center on Battery: 270 cd/m²
Contrast: 474:1 (Black: 0.57 cd/m²)
ΔE ColorChecker Calman: 3.01 | ∀{0.5-29.43 Ø4.71}
ΔE Greyscale Calman: 12.73 | ∀{0.09-98 Ø4.96}
62% sRGB (Argyll 1.6.3 3D)
39% AdobeRGB 1998 (Argyll 1.6.3 3D)
42.35% AdobeRGB 1998 (Argyll 3D)
61.5% sRGB (Argyll 3D)
40.97% Display P3 (Argyll 3D)
Gamma: 2.36
CCT: 14629 K
| Acer Swift 1 SF114-31-P6F6 TN LED, 1366x768, 14" | Acer Aspire One Cloudbook 14 AO1-431-C6QM TN LED, 1366x768, 14" | Medion Akoya S4219 IPS, 1920x1080, 14" | Lenovo E31-70 80KX015RGE TN, 1366x768, 13.3" | HP Stream 13-c102ng TN, 1366x768, 13.3" | HP Chromebook 14 G1 TN, 1366x768, 14" | |
|---|---|---|---|---|---|---|
| Display | -1% | 45% | 20% | -1% | ||
| Display P3 Coverage (%) | 40.97 | 40.68 -1% | 61.7 51% | 49.25 20% | 40.68 -1% | |
| sRGB Coverage (%) | 61.5 | 60.6 -1% | 84.8 38% | 73.5 20% | 59.8 -3% | |
| AdobeRGB 1998 Coverage (%) | 42.35 | 42.08 -1% | 62 46% | 50.9 20% | 42.32 0% | |
| Response Times | -14% | 20% | -4% | -12% | ||
| Response Time Grey 50% / Grey 80% * (ms) | 32 ? | 49.6 ? -55% | 33 ? -3% | 44.4 ? -39% | 45 ? -41% | |
| Response Time Black / White * (ms) | 30 ? | 21.6 ? 28% | 17 ? 43% | 20.4 ? 32% | 25 ? 17% | |
| PWM Frequency (Hz) | 200 ? | 200 ? | 50 ? | 200 ? | 201 ? | |
| Screen | -31% | 28% | -36% | -22% | 7% | |
| Brightness middle (cd/m²) | 270 | 231 -14% | 216 -20% | 206 -24% | 190 -30% | 226 -16% |
| Brightness (cd/m²) | 247 | 213 -14% | 211 -15% | 200 -19% | 179 -28% | 227 -8% |
| Brightness Distribution (%) | 80 | 87 9% | 65 -19% | 84 5% | 85 6% | 86 8% |
| Black Level * (cd/m²) | 0.57 | 0.47 18% | 0.2 65% | 0.6 -5% | 0.33 42% | 0.4 30% |
| Contrast (:1) | 474 | 491 4% | 1080 128% | 343 -28% | 576 22% | 565 19% |
| Colorchecker dE 2000 * | 3.01 | 9.1 -202% | 3.7 -23% | 9.2 -206% | 9.84 -227% | |
| Colorchecker dE 2000 max. * | 6.33 | 14.88 -135% | 5.88 7% | 14.8 -134% | ||
| Greyscale dE 2000 * | 12.73 | 9.55 25% | 2.67 79% | 10.94 14% | 10.32 19% | |
| Gamma | 2.36 93% | 2.47 89% | 2.65 83% | 2.76 80% | 2.48 89% | |
| CCT | 14629 44% | 11384 57% | 6418 101% | 13282 49% | 11884 55% | |
| Color Space (Percent of AdobeRGB 1998) (%) | 39 | 38.84 0% | 55 41% | 46.92 20% | 38 -3% | |
| Color Space (Percent of sRGB) (%) | 62 | 60.59 -2% | 85 37% | 73.36 18% | 60 -3% | |
| Total Average (Program / Settings) | -15% /
-23% | 31% /
30% | -7% /
-20% | -12% /
-16% | 7% /
7% |
* ... smaller is better
Screen Flickering / PWM (Pulse-Width Modulation)
| Screen flickering / PWM detected | 200 Hz | ≤ 90 % brightness setting | 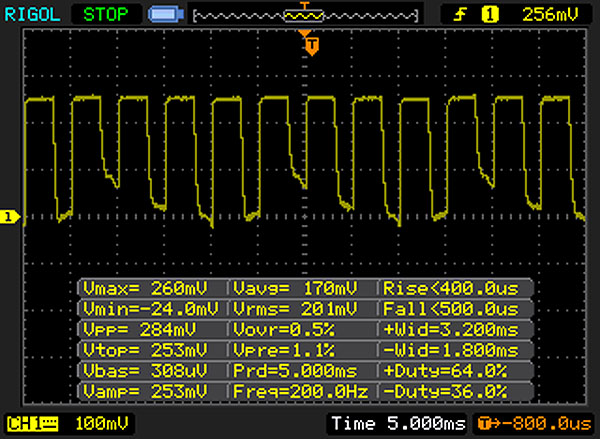 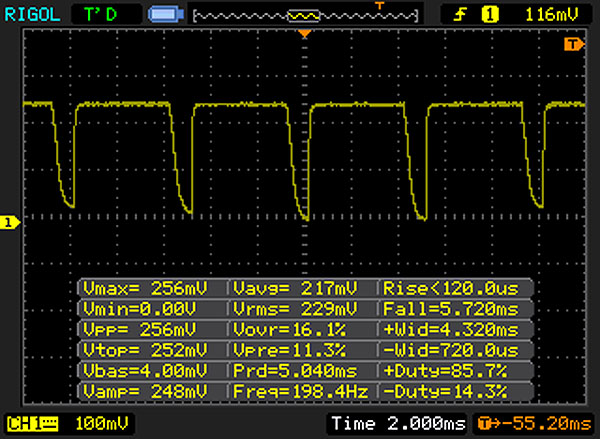 |
The display backlight flickers at 200 Hz (worst case, e.g., utilizing PWM) Flickering detected at a brightness setting of 90 % and below. There should be no flickering or PWM above this brightness setting. The frequency of 200 Hz is relatively low, so sensitive users will likely notice flickering and experience eyestrain at the stated brightness setting and below. In comparison: 52 % of all tested devices do not use PWM to dim the display. If PWM was detected, an average of 7754 (minimum: 5 - maximum: 343500) Hz was measured. | |||
Display Response Times
| ↔ Response Time Black to White | ||
|---|---|---|
| 30 ms ... rise ↗ and fall ↘ combined | ↗ 16 ms rise | 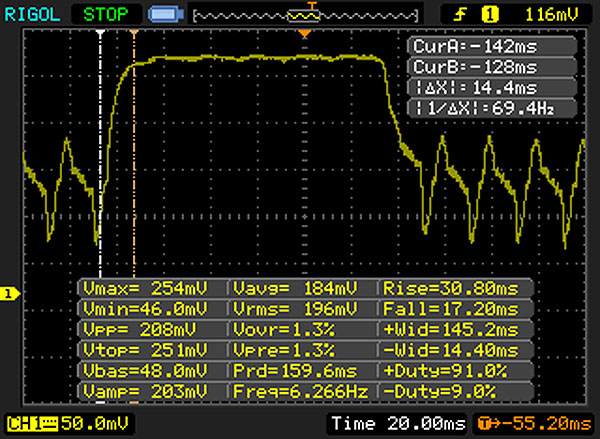 |
| ↘ 14 ms fall | ||
| The screen shows slow response rates in our tests and will be unsatisfactory for gamers. In comparison, all tested devices range from 0.1 (minimum) to 240 (maximum) ms. » 80 % of all devices are better. This means that the measured response time is worse than the average of all tested devices (19.8 ms). | ||
| ↔ Response Time 50% Grey to 80% Grey | ||
| 32 ms ... rise ↗ and fall ↘ combined | ↗ 10 ms rise | 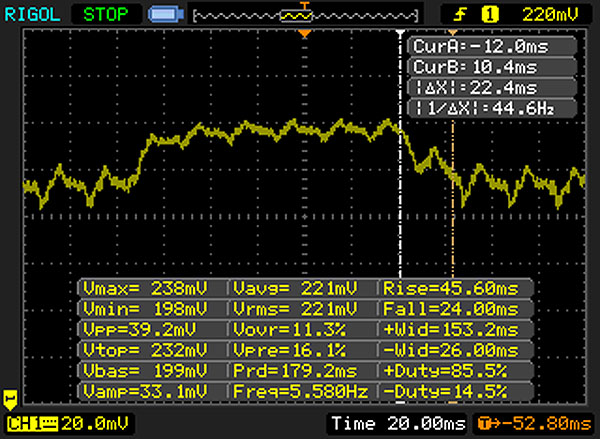 |
| ↘ 22 ms fall | ||
| The screen shows slow response rates in our tests and will be unsatisfactory for gamers. In comparison, all tested devices range from 0.165 (minimum) to 636 (maximum) ms. » 43 % of all devices are better. This means that the measured response time is similar to the average of all tested devices (31 ms). | ||
| Cinebench R15 | |
| CPU Single 64Bit | |
| Lenovo E31-70 80KX015RGE | |
| Acer Aspire ES1-332-P91H | |
| Acer Swift 1 SF114-31-P6F6 | |
| Medion Akoya S4219 | |
| Acer Aspire One Cloudbook 14 AO1-431-C6QM | |
| HP Stream 13-c102ng | |
| CPU Multi 64Bit | |
| Lenovo E31-70 80KX015RGE | |
| Acer Aspire ES1-332-P91H | |
| Acer Swift 1 SF114-31-P6F6 | |
| Medion Akoya S4219 | |
| Acer Aspire One Cloudbook 14 AO1-431-C6QM | |
| HP Stream 13-c102ng | |
| Cinebench R10 | |
| Rendering Multiple CPUs 32Bit | |
| Lenovo E31-70 80KX015RGE | |
| Acer Aspire ES1-332-P91H | |
| Acer Swift 1 SF114-31-P6F6 | |
| Medion Akoya S4219 | |
| Acer Aspire One Cloudbook 14 AO1-431-C6QM | |
| HP Stream 13-c102ng | |
| Rendering Single 32Bit | |
| Lenovo E31-70 80KX015RGE | |
| Acer Aspire ES1-332-P91H | |
| Acer Swift 1 SF114-31-P6F6 | |
| Medion Akoya S4219 | |
| Acer Aspire One Cloudbook 14 AO1-431-C6QM | |
| HP Stream 13-c102ng | |
| Geekbench 3 | |
| 32 Bit Single-Core Score | |
| Acer Aspire ES1-332-P91H | |
| Acer Swift 1 SF114-31-P6F6 | |
| Acer Aspire One Cloudbook 14 AO1-431-C6QM | |
| 32 Bit Multi-Core Score | |
| Acer Aspire ES1-332-P91H | |
| Acer Swift 1 SF114-31-P6F6 | |
| Acer Aspire One Cloudbook 14 AO1-431-C6QM | |
| Geekbench 4.0 | |
| 64 Bit Single-Core Score | |
| Acer Aspire ES1-332-P91H | |
| Acer Swift 1 SF114-31-P6F6 | |
| 64 Bit Multi-Core Score | |
| Acer Aspire ES1-332-P91H | |
| Acer Swift 1 SF114-31-P6F6 | |
| JetStream 1.1 - 1.1 Total | |
| Lenovo E31-70 80KX015RGE | |
| Acer Aspire ES1-332-P91H | |
| Acer Swift 1 SF114-31-P6F6 | |
| Medion Akoya S4219 | |
| Acer Aspire One Cloudbook 14 AO1-431-C6QM | |
| PCMark 8 Home Score Accelerated v2 | 2114 points | |
| PCMark 8 Creative Score Accelerated v2 | 2302 points | |
| PCMark 8 Work Score Accelerated v2 | 1595 points | |
Help | ||
| PCMark 8 - Home Score Accelerated v2 | |
| Lenovo E31-70 80KX015RGE | |
| Acer Swift 1 SF114-31-P6F6 | |
| Acer Aspire ES1-332-P91H | |
| Medion Akoya S4219 | |
| Acer Aspire One Cloudbook 14 AO1-431-C6QM | |
| HP Stream 13-c102ng | |

| Acer Swift 1 SF114-31-P6F6 128 GB eMMC Flash | Acer Aspire One Cloudbook 14 AO1-431-C6QM 32 GB eMMC Flash | Medion Akoya S4219 128 GB eMMC Flash | Lenovo E31-70 80KX015RGE Seagate ST500LM000 Solid State Hybrid Drive | HP Stream 13-c102ng 32 GB eMMC Flash | |
|---|---|---|---|---|---|
| CrystalDiskMark 3.0 | -11% | -3% | -53% | 1% | |
| Read Seq (MB/s) | 166.5 | 173.5 4% | 151.2 -9% | 116.4 -30% | 152.8 -8% |
| Write Seq (MB/s) | 85 | 77.9 -8% | 55.7 -34% | 120.7 42% | 76.9 -10% |
| Read 512 (MB/s) | 153.8 | 154.8 1% | 156.6 2% | 37.01 -76% | 167 9% |
| Write 512 (MB/s) | 75.6 | 64.1 -15% | 46.9 -38% | 73.1 -3% | 22.79 -70% |
| Read 4k (MB/s) | 13.2 | 15.88 20% | 16.29 23% | 0.507 -96% | 18.28 38% |
| Write 4k (MB/s) | 13.04 | 8.583 -34% | 16.5 27% | 4.156 -68% | 16.78 29% |
| Read 4k QD32 (MB/s) | 35.12 | 25.73 -27% | 20.62 -41% | 0.967 -97% | 31.59 -10% |
| Write 4k QD32 (MB/s) | 12.66 | 8.656 -32% | 18.86 49% | 0.652 -95% | 16.08 27% |
| 3DMark 11 Performance | 565 points | |
Help | ||
| 3DMark 11 - 1280x720 Performance GPU | |
| Lenovo E31-70 80KX015RGE | |
| Acer Aspire ES1-332-P91H | |
| Acer Swift 1 SF114-31-P6F6 | |
| Medion Akoya S4219 | |
| Acer Aspire One Cloudbook 14 AO1-431-C6QM | |
| HP Stream 13-c102ng | |
| low | med. | high | ultra | |
|---|---|---|---|---|
| The Elder Scrolls V: Skyrim (2011) | 21.8 | 10.4 | 6.5 | |
| Dead Space 3 (2013) | 43.2 | 19.6 | 14.3 | |
| BioShock Infinite (2013) | 23.2 | 11.8 | 10 | |
| Battlefield 4 (2013) | 16.5 | 12.5 | 8.3 | |
| Risen 3: Titan Lords (2014) | 14 | 9.1 | ||
| Alien: Isolation (2014) | 18.9 | 13.6 | ||
| Dragon Age: Inquisition (2014) | 12.1 | 7.6 | ||
| Dota 2 Reborn (2015) | 35.2 | 22.8 | ||
| Anno 2205 (2015) | 10.8 | 6.9 | ||
| Rainbow Six Siege (2015) | 15.3 | 8.9 | ||
| Rise of the Tomb Raider (2016) | 7.1 | 4.2 | ||
| Mirror's Edge Catalyst (2016) | 10.5 | 6.1 | ||
| Civilization 6 (2016) | 12.2 | 5.2 | ||
| Farming Simulator 17 (2016) | 31.3 | 21.3 | ||
| Titanfall 2 (2016) | 14.4 | 10.5 | ||
| Resident Evil 7 (2017) | 13.5 | 11 |
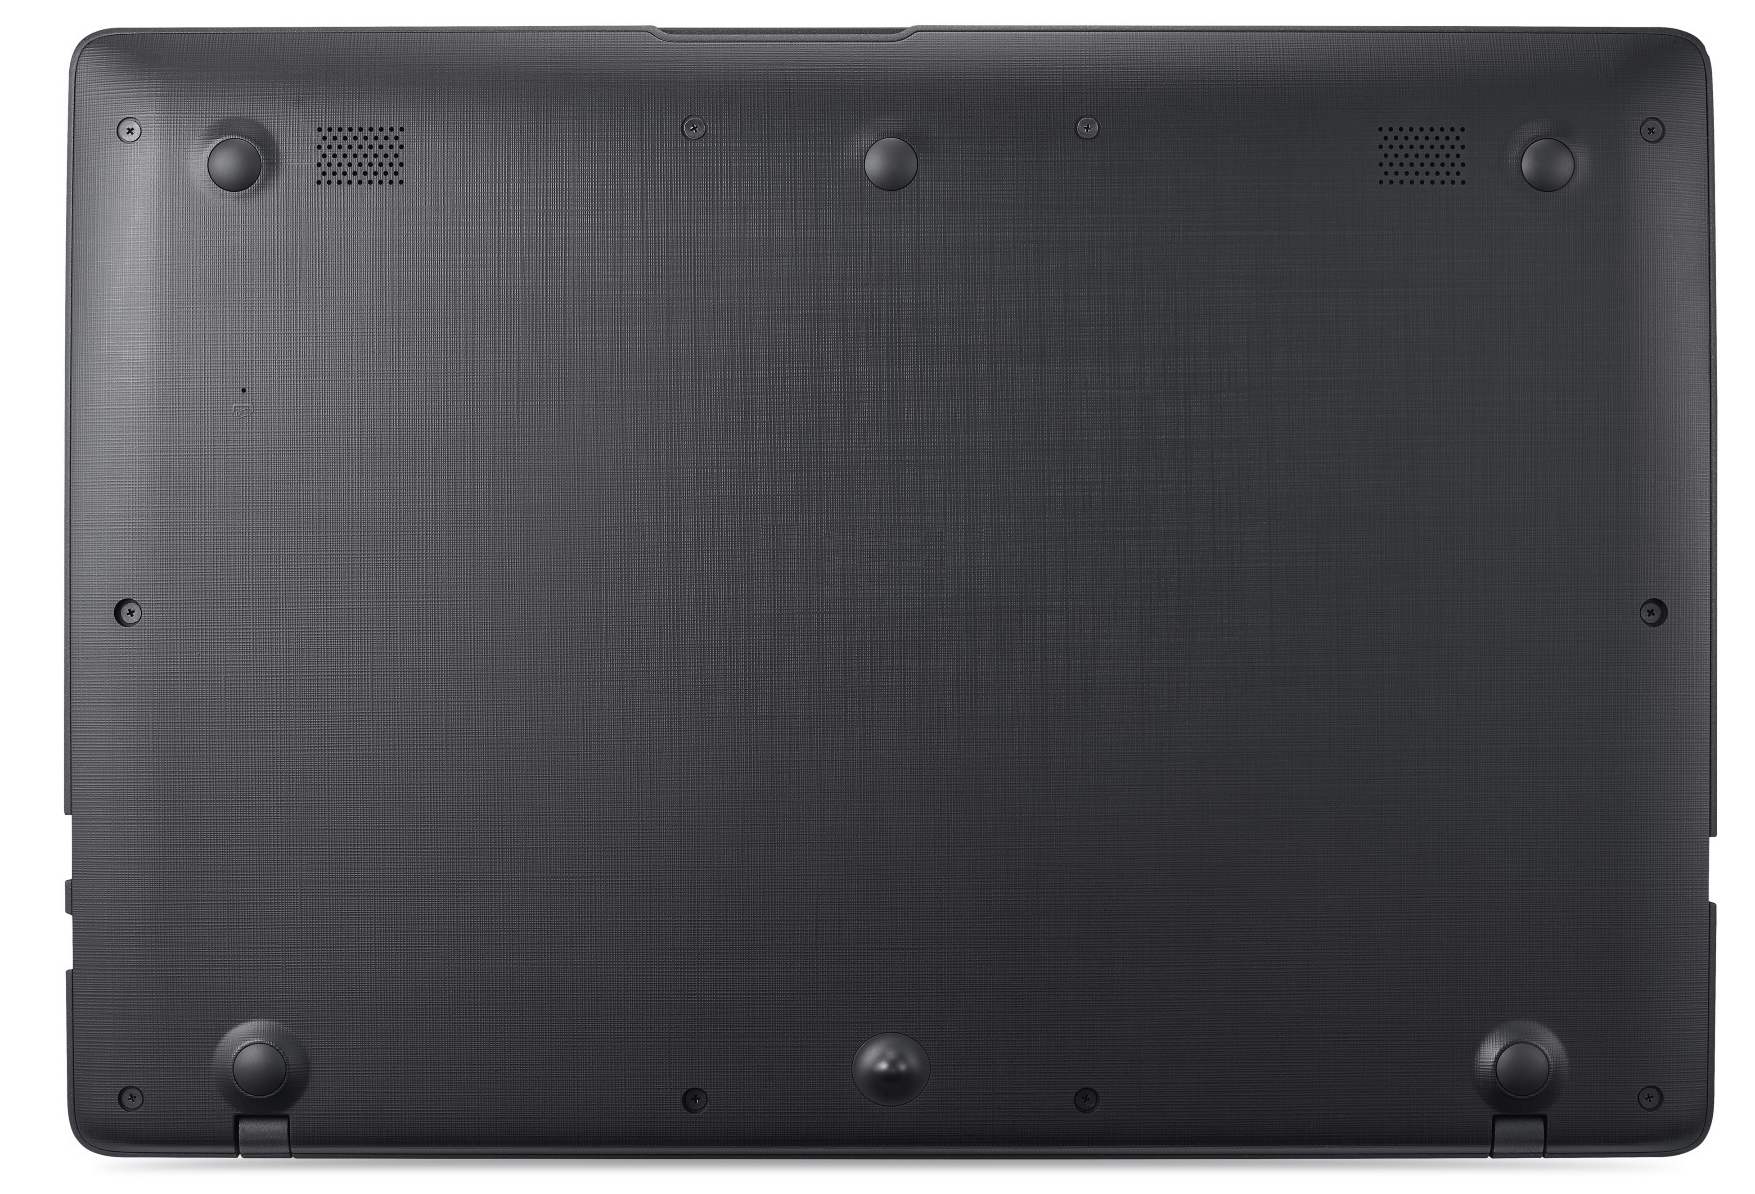
(+) The maximum temperature on the upper side is 36.6 °C / 98 F, compared to the average of 35.9 °C / 97 F, ranging from 21.4 to 59 °C for the class Subnotebook.
(±) The bottom heats up to a maximum of 44.2 °C / 112 F, compared to the average of 39.2 °C / 103 F
(+) In idle usage, the average temperature for the upper side is 25 °C / 77 F, compared to the device average of 30.8 °C / 87 F.
(+) The palmrests and touchpad are cooler than skin temperature with a maximum of 31.9 °C / 89.4 F and are therefore cool to the touch.
(-) The average temperature of the palmrest area of similar devices was 28.2 °C / 82.8 F (-3.7 °C / -6.6 F).
Acer Swift 1 SF114-31-P6F6 audio analysis
(±) | speaker loudness is average but good (75 dB)
Bass 100 - 315 Hz
(-) | nearly no bass - on average 22.8% lower than median
(+) | bass is linear (2.4% delta to prev. frequency)
Mids 400 - 2000 Hz
(±) | reduced mids - on average 9.4% lower than median
(±) | linearity of mids is average (7.4% delta to prev. frequency)
Highs 2 - 16 kHz
(+) | balanced highs - only 2.6% away from median
(+) | highs are linear (2.7% delta to prev. frequency)
Overall 100 - 16.000 Hz
(±) | linearity of overall sound is average (22.2% difference to median)
Compared to same class
» 76% of all tested devices in this class were better, 5% similar, 19% worse
» The best had a delta of 5%, average was 18%, worst was 53%
Compared to all devices tested
» 65% of all tested devices were better, 6% similar, 29% worse
» The best had a delta of 4%, average was 23%, worst was 134%
Apple MacBook 12 (Early 2016) 1.1 GHz audio analysis
(+) | speakers can play relatively loud (83.6 dB)
Bass 100 - 315 Hz
(±) | reduced bass - on average 11.3% lower than median
(±) | linearity of bass is average (14.2% delta to prev. frequency)
Mids 400 - 2000 Hz
(+) | balanced mids - only 2.4% away from median
(+) | mids are linear (5.5% delta to prev. frequency)
Highs 2 - 16 kHz
(+) | balanced highs - only 2% away from median
(+) | highs are linear (4.5% delta to prev. frequency)
Overall 100 - 16.000 Hz
(+) | overall sound is linear (10.2% difference to median)
Compared to same class
» 7% of all tested devices in this class were better, 2% similar, 90% worse
» The best had a delta of 5%, average was 18%, worst was 53%
Compared to all devices tested
» 5% of all tested devices were better, 1% similar, 94% worse
» The best had a delta of 4%, average was 23%, worst was 134%
| Off / Standby | |
| Idle | |
| Load |
|
Key:
min: | |
| Battery Runtime - WiFi Websurfing | |
| Acer Swift 1 SF114-31-P6F6 | |
| Acer Aspire One Cloudbook 14 AO1-431-C6QM | |
| HP Chromebook 14 G1 | |
| HP Stream 13-c102ng | |
| Medion Akoya S4219 | |
| Lenovo E31-70 80KX015RGE | |
Pros
Cons
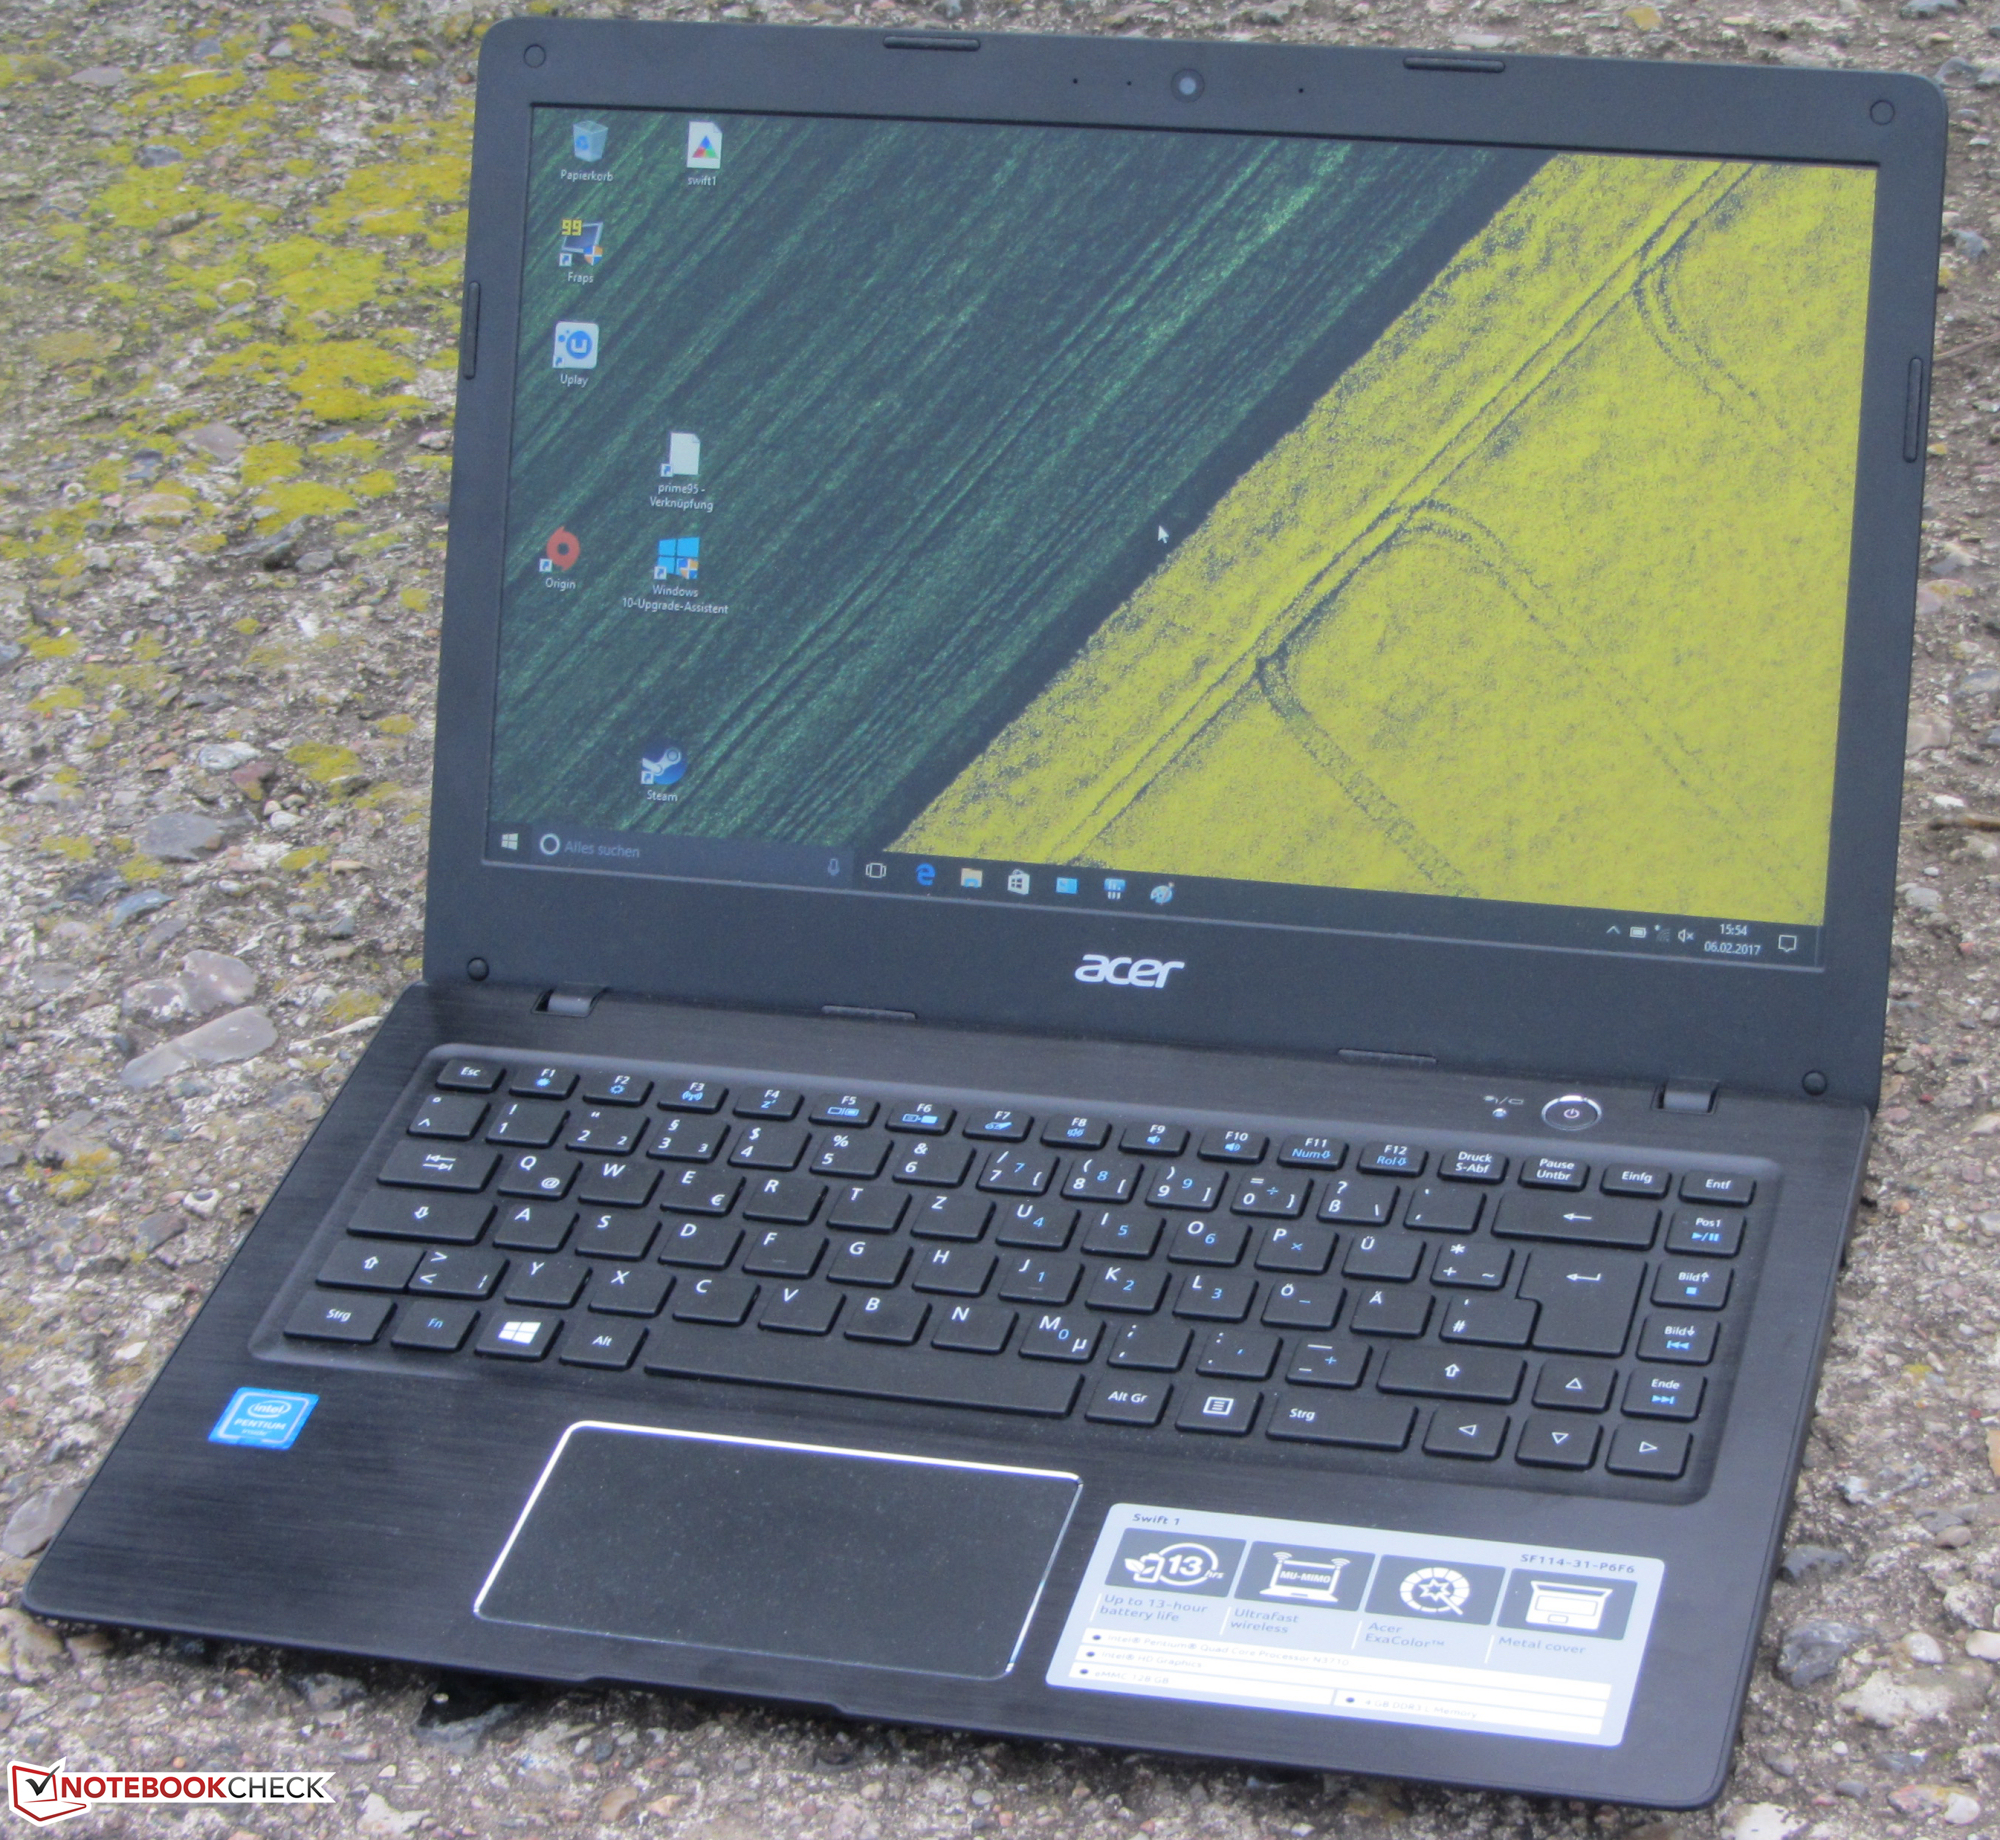
Swift 1是宏碁Swift系列中性能最低价格最实惠的机型。不过,它也同样值得我们关注。尽管它的机身完全采用塑料材质,Swift 1仍然算是十分时尚。这也要归功于它的纤薄体型。Swift 1无法与搭配酷睿i或酷睿m处理器的同系列机型相抗衡。它的奔腾N3710处理器更适合基础办公和上网浏览等应用。
宏碁带来了一台时尚,纤薄且续航持久的打字和上网浏览设备。这台售价不足400欧元(约2903人民币)的设备让它十分适合学生和青少年用户。
这台笔记本电脑运行完全安静,也不会过热。它的存储设备容量为128GB。用户可用的剩余空间超过了96GB,这对大部分用户可能都足够了。这台笔记本电脑并没有搭配背光键盘。不过它的键盘提供了不错的使用感受,可以时候长时间打字的需要。它的超长续航时间也为此带来了不小的帮助。这台笔记本电脑的低售价在屏幕品质上得到了很明显的体现。它搭配了一块昏暗,低对比度,可视角度较窄的屏幕面板。不过,考虑到价位较低,还属于可以接受的水平。
最后,我们希望宏碁可以对它的后续机型做出一些改进,出了Apollo Lake架构处理器,背光键盘和至少一个USB-C接口外,一块IPS屏幕应该会让它更加全面。不过这个愿望可能会犹豫Swift 1的价位而有些难以企及。
注:本文是基于完整评测的缩减版本,阅读完整的英文评测,请点击这里。
Acer Swift 1 SF114-31-P6F6
- 02/09/2017 v6 (old)
Sascha Mölck