Teclast Tbook 16 Power 2-in-1 (x7-Z8750, 8 GB) 简短评测

| SD Card Reader - average JPG Copy Test (av. of 3 runs) | |
| Apple MacBook Pro Retina 13 inch 2013-10 | |
| Acer Aspire S 13 S5-371-71QZ | |
| Teclast Tbook 16 Power | |
| Microsoft Surface Pro 4, Core i5, 256GB | |
| Lenovo ThinkPad Yoga 370-20JJS00100 | |
| Dell Latitude 12 5285 2-in-1 | |
| Asus Zenbook UX3410UA | |
| Chuwi Vi8 Plus (CWI519) | |
| Networking | |
| iperf3 transmit AX12 | |
| Microsoft Surface Pro 4, Core i5, 128GB (Klaus I211) | |
| Microsoft Surface Book with Performance Base | |
| Cube i7 Book CDK09 (Klaus I211) | |
| Teclast Tbook 16 Power | |
| Chuwi Hi10 Pro | |
| iperf3 receive AX12 | |
| Microsoft Surface Book with Performance Base | |
| Microsoft Surface Pro 4, Core i5, 128GB (Klaus I211) | |
| Cube i7 Book CDK09 (Klaus I211) | |
| Teclast Tbook 16 Power | |
| Chuwi Hi10 Pro | |
| |||||||||||||||||||||||||
Brightness Distribution: 79 %
Center on Battery: 244 cd/m²
Contrast: 642:1 (Black: 0.38 cd/m²)
ΔE ColorChecker Calman: 6.7 | ∀{0.5-29.43 Ø4.71}
ΔE Greyscale Calman: 7.4 | ∀{0.09-98 Ø4.96}
93% sRGB (Argyll 1.6.3 3D)
60.6% AdobeRGB 1998 (Argyll 1.6.3 3D)
67.4% AdobeRGB 1998 (Argyll 3D)
93.2% sRGB (Argyll 3D)
66.1% Display P3 (Argyll 3D)
Gamma: 2.15
CCT: 8867 K
| Teclast Tbook 16 Power 1920x1080, 11.6" | Microsoft Surface Pro 4 Core i7 Samsung 123YL01-001 ID: SDC3853, , 2736x1824, 12.3" | Cube i9 KDC0000, , 1920x1200, 12.2" | Chuwi Hi12 SEC3542, , 2160x1440, 12" | |
|---|---|---|---|---|
| Display | 3% | -3% | 1% | |
| Display P3 Coverage (%) | 66.1 | 66.9 1% | 65.7 -1% | 66 0% |
| sRGB Coverage (%) | 93.2 | 97.5 5% | 88.7 -5% | 95.3 2% |
| AdobeRGB 1998 Coverage (%) | 67.4 | 68.6 2% | 65.1 -3% | 68.1 1% |
| Response Times | -20% | 14% | 39% | |
| Response Time Grey 50% / Grey 80% * (ms) | 40 ? | 48.4 ? -21% | 37.2 ? 7% | 28 ? 30% |
| Response Time Black / White * (ms) | 30.2 ? | 35.6 ? -18% | 24 ? 21% | 16 ? 47% |
| PWM Frequency (Hz) | 12000 ? | 10420 | 200 ? | |
| Screen | 53% | 16% | 17% | |
| Brightness middle (cd/m²) | 244 | 436.7 79% | 263 8% | 293 20% |
| Brightness (cd/m²) | 215 | 433 101% | 263 22% | 277 29% |
| Brightness Distribution (%) | 79 | 87 10% | 77 -3% | 89 13% |
| Black Level * (cd/m²) | 0.38 | 0.326 14% | 0.28 26% | 0.256 33% |
| Contrast (:1) | 642 | 1340 109% | 939 46% | 1145 78% |
| Colorchecker dE 2000 * | 6.7 | 1.82 73% | 4.1 39% | 5.2 22% |
| Colorchecker dE 2000 max. * | 11.7 | 12.1 -3% | 11.4 3% | |
| Greyscale dE 2000 * | 7.4 | 1.44 81% | 3.8 49% | 8.5 -15% |
| Gamma | 2.15 102% | 2.1 105% | 2.25 98% | 2.21 100% |
| CCT | 8867 73% | 6560 99% | 6433 101% | 7048 92% |
| Color Space (Percent of AdobeRGB 1998) (%) | 60.6 | 62.3 3% | 57.7 -5% | 62 2% |
| Color Space (Percent of sRGB) (%) | 93 | 97.5 5% | 76.2 -18% | 82.5 -11% |
| Total Average (Program / Settings) | 12% /
32% | 9% /
12% | 19% /
17% |
* ... smaller is better
Display Response Times
| ↔ Response Time Black to White | ||
|---|---|---|
| 30.2 ms ... rise ↗ and fall ↘ combined | ↗ 16.8 ms rise | |
| ↘ 13.4 ms fall | ||
| The screen shows slow response rates in our tests and will be unsatisfactory for gamers. In comparison, all tested devices range from 0.1 (minimum) to 240 (maximum) ms. » 82 % of all devices are better. This means that the measured response time is worse than the average of all tested devices (19.8 ms). | ||
| ↔ Response Time 50% Grey to 80% Grey | ||
| 40 ms ... rise ↗ and fall ↘ combined | ↗ 20 ms rise | |
| ↘ 20 ms fall | ||
| The screen shows slow response rates in our tests and will be unsatisfactory for gamers. In comparison, all tested devices range from 0.165 (minimum) to 636 (maximum) ms. » 61 % of all devices are better. This means that the measured response time is worse than the average of all tested devices (31 ms). | ||
Screen Flickering / PWM (Pulse-Width Modulation)
| Screen flickering / PWM detected | 12000 Hz | ≤ 26 % brightness setting |
| ≤ 60 cd/m² brightness | ||
The display backlight flickers at 12000 Hz (worst case, e.g., utilizing PWM) Flickering detected at a brightness setting of 26 % (60 cd/m²) and below. There should be no flickering or PWM above this brightness setting. The frequency of 12000 Hz is quite high, so most users sensitive to PWM should not notice any flickering. As the flickering occurs only on very low brightness settings, it should not be an issue in typical office settings. Nonetheless, use in low light conditions may be straining to the eyes. In comparison: 52 % of all tested devices do not use PWM to dim the display. If PWM was detected, an average of 7754 (minimum: 5 - maximum: 343500) Hz was measured. | ||
| Cinebench R15 | |
| CPU Single 64Bit | |
| Cube i7 Book CDK09 | |
| Microsoft Surface Pro 4, Core m3 | |
| Cube i9 | |
| Acer TravelMate B117-M-P16Q | |
| Chiligreen Mobilitas SF2600 | |
| Acer Swift 1 SF114-31-P6F6 | |
| HP Pavilion x360 11t T5M27AV | |
| Teclast Tbook 16 Power | |
| Microsoft Surface 3 | |
| Chuwi Hi12 | |
| VOYO VBook V3 | |
| Medion Akoya P2211T MD98602 | |
| CPU Multi 64Bit | |
| Cube i7 Book CDK09 | |
| Microsoft Surface Pro 4, Core m3 | |
| Cube i9 | |
| Acer Swift 1 SF114-31-P6F6 | |
| Acer TravelMate B117-M-P16Q | |
| Chiligreen Mobilitas SF2600 | |
| Microsoft Surface 3 | |
| Teclast Tbook 16 Power | |
| HP Pavilion x360 11t T5M27AV | |
| Teclast Tbook 10s | |
| Chuwi Hi12 | |
| Medion Akoya P2211T MD98602 | |
| VOYO VBook V3 | |
| Chuwi Hi10 Pro | |
| PCMark 8 - Home Score Accelerated v2 | |
| Cube i7 Book CDK09 | |
| Cube i9 | |
| Microsoft Surface Pro 4, Core m3 | |
| Acer Swift 1 SF114-31-P6F6 | |
| Acer TravelMate B117-M-P16Q | |
| Chiligreen Mobilitas SF2600 | |
| Microsoft Surface 3 | |
| HP Pavilion x360 11t T5M27AV | |
| Teclast Tbook 16 Power | |
| VOYO VBook V3 | |
| Acer Switch One 10 SW1-011-14UQ | |
| Medion Akoya E2215T | |
| Teclast Tbook 10s | |
| PCMark 8 Home Score Accelerated v2 | 1499 points | |
| PCMark 8 Creative Score Accelerated v2 | 1732 points | |
| PCMark 10 Score | 1006 points | |
Help | ||
| Performance rating - Percent | |
| Microsoft Surface Pro 4, Core m3 | |
| Cube i9 | |
| Cube i7 Book CDK09 | |
| Microsoft Surface 3 | |
| Teclast Tbook 16 Power | |
| Medion Akoya P2211T MD98602 | |

| 3DMark 11 - 1280x720 Performance GPU | |
| Acer Aspire ES1-731G-P5UR | |
| Cube i9 | |
| Acer Swift 1 SF114-31-P6F6 | |
| Chiligreen Mobilitas SF2600 | |
| Acer TravelMate B117-M-P16Q | |
| HP Pavilion x360 11t T5M27AV | |
| Lenovo Yoga Book 2016 Windows 64GB LTE | |
| Teclast Tbook 16 Power | |
| HP 250 G5 Y1V08UT | |
| Acer Switch One 10 SW1-011-14UQ | |
| 3DMark | |
| 1280x720 Cloud Gate Standard Graphics | |
| Acer Aspire ES1-731G-P5UR | |
| Cube i9 | |
| Acer TravelMate B117-M-P16Q | |
| Lenovo Yoga Book 2016 Windows 64GB LTE | |
| Chiligreen Mobilitas SF2600 | |
| HP 250 G5 Y1V08UT | |
| HP Pavilion x360 11t T5M27AV | |
| Teclast Tbook 16 Power | |
| 1920x1080 Fire Strike Graphics | |
| Acer Aspire ES1-731G-P5UR | |
| Acer TravelMate B117-M-P16Q | |
| HP Pavilion x360 11t T5M27AV | |
| 3DMark 06 Standard Score | 2274 points | |
| 3DMark 11 Performance | 451 points | |
| 3DMark Cloud Gate Standard Score | 1743 points | |
Help | ||
| Dota 2 Reborn - 1280x720 min (0/3) fastest | |
| Cube i9 | |
| Acer Swift 1 SF114-31-P6F6 | |
| Teclast Tbook 16 Power | |
| Chuwi Hi12 | |
| World of Warships - 1366x768 Low Preset AF:Trilinear | |
| Cube i9 | |
| Acer TravelMate B117-M-P16Q | |
| Teclast Tbook 16 Power | |
| Chuwi Hi12 | |
| Farming Simulator 17 - 1280x720 Low Preset | |
| Cube i9 | |
| Acer Swift 1 SF114-31-P6F6 | |
| Chuwi Hi12 | |
| Teclast Tbook 16 Power | |
| low | med. | high | ultra | |
|---|---|---|---|---|
| Dota 2 Reborn (2015) | 22.1 | 13.7 | ||
| World of Warships (2015) | 15 | |||
| Farming Simulator 17 (2016) | 17.6 | |||
| Rocket League (2017) | 18.7 | |||
| Team Fortress 2 (2017) | 19.6 | |||
| Battle Bay (2018) | 37 | |||
| World of Tanks Blitz (2018) | 37 | 24 | ||
| Arena of Valor (2018) | 25 | |||
| Shadow Fight 3 (2018) | 30 | |||
| PUBG Mobile (2018) | 0 game wont start (Hangs after a few minutes) | |||
| League of Legends (2019) | 23.6 | 18 | 13.9 | |
| Hearthstone (2020) | 17.8 | 18 | 9.91 |
(±) The maximum temperature on the upper side is 43 °C / 109 F, compared to the average of 35.4 °C / 96 F, ranging from 19.6 to 60 °C for the class Convertible.
(±) The bottom heats up to a maximum of 40 °C / 104 F, compared to the average of 36.9 °C / 98 F
(+) In idle usage, the average temperature for the upper side is 27.9 °C / 82 F, compared to the device average of 30.3 °C / 87 F.
(-) The palmrests and touchpad can get very hot to the touch with a maximum of 41 °C / 105.8 F.
(-) The average temperature of the palmrest area of similar devices was 28 °C / 82.4 F (-13 °C / -23.4 F).
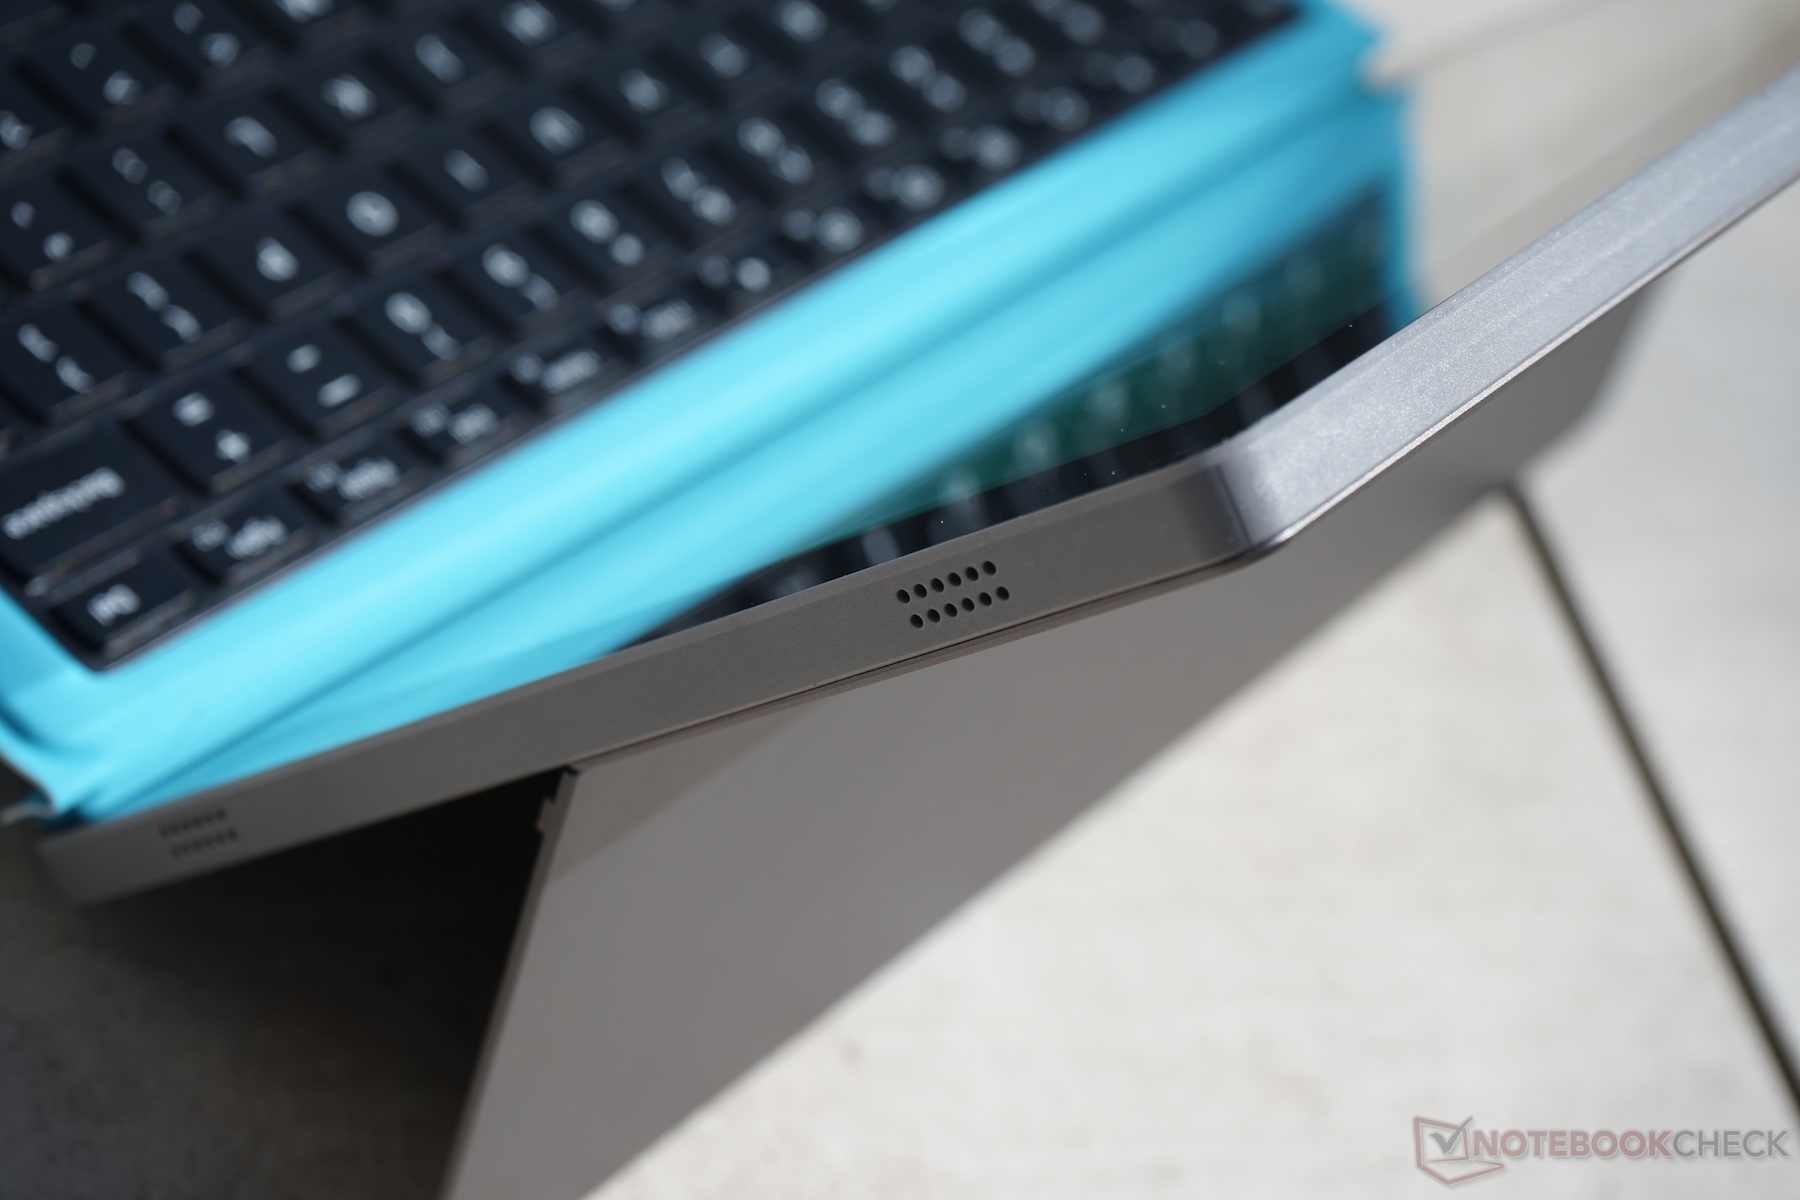
Teclast Tbook 16 Power audio analysis
(-) | not very loud speakers (70.6 dB)
Bass 100 - 315 Hz
(±) | reduced bass - on average 14.3% lower than median
(±) | linearity of bass is average (8.4% delta to prev. frequency)
Mids 400 - 2000 Hz
(±) | higher mids - on average 13.2% higher than median
(-) | mids are not linear (26.2% delta to prev. frequency)
Highs 2 - 16 kHz
(±) | higher highs - on average 12.2% higher than median
(-) | highs are not linear (22.3% delta to prev. frequency)
Overall 100 - 16.000 Hz
(-) | overall sound is not linear (56.8% difference to median)
Compared to same class
» 100% of all tested devices in this class were better, 0% similar, 0% worse
» The best had a delta of 6%, average was 20%, worst was 57%
Compared to all devices tested
» 96% of all tested devices were better, 0% similar, 4% worse
» The best had a delta of 4%, average was 23%, worst was 134%
Apple MacBook 12 (Early 2016) 1.1 GHz audio analysis
(+) | speakers can play relatively loud (83.6 dB)
Bass 100 - 315 Hz
(±) | reduced bass - on average 11.3% lower than median
(±) | linearity of bass is average (14.2% delta to prev. frequency)
Mids 400 - 2000 Hz
(+) | balanced mids - only 2.4% away from median
(+) | mids are linear (5.5% delta to prev. frequency)
Highs 2 - 16 kHz
(+) | balanced highs - only 2% away from median
(+) | highs are linear (4.5% delta to prev. frequency)
Overall 100 - 16.000 Hz
(+) | overall sound is linear (10.2% difference to median)
Compared to same class
» 7% of all tested devices in this class were better, 2% similar, 90% worse
» The best had a delta of 5%, average was 18%, worst was 53%
Compared to all devices tested
» 5% of all tested devices were better, 1% similar, 94% worse
» The best had a delta of 4%, average was 23%, worst was 134%
| Off / Standby | |
| Idle | |
| Load |
|
Key:
min: | |
| Teclast Tbook 16 Power Z8750, HD Graphics 405 (Braswell), 64 GB eMMC Flash, IPS, 1920x1080, 11.6" | Chuwi Hi12 Z8300, HD Graphics (Cherry Trail), Hynix HCG8E 64 GB, IPS, 2160x1440, 12" | Cube i7 Book CDK09 6Y30, HD Graphics 515, FORESEE 64GB O1229B, IPS, 1920x1080, 10.6" | Cube i9 6Y30, HD Graphics 515, FORESEE 128GB O1229B, IPS, 1920x1200, 12.2" | Microsoft Surface 3 Z8700, HD Graphics (Cherry Trail), 128 GB eMMC Flash, IPS, 1920x1280, 10.8" | Acer Swift 1 SF114-31-P6F6 N3710, HD Graphics 405 (Braswell), 128 GB eMMC Flash, TN LED, 1366x768, 14" | |
|---|---|---|---|---|---|---|
| Power Consumption | 21% | -180% | -132% | -70% | -100% | |
| Idle Minimum * (Watt) | 2.6 | 1.7 35% | 6.6 -154% | 4.6 -77% | 2.5 4% | 4.1 -58% |
| Idle Average * (Watt) | 2.7 | 1.7 37% | 10 -270% | 9.6 -256% | 7 -159% | 8.3 -207% |
| Idle Maximum * (Watt) | 2.7 | 3.3 -22% | 12 -344% | 9.6 -256% | 8.4 -211% | 8.6 -219% |
| Load Average * (Watt) | 12.7 | 7.9 38% | 21.1 -66% | 18.6 -46% | 11.2 12% | 13.5 -6% |
| Load Maximum * (Watt) | 13.1 | 10.8 18% | 22 -68% | 16.3 -24% | 12.4 5% | 14.5 -11% |
* ... smaller is better
| Battery Runtime - WiFi Websurfing | |
| Acer Swift 1 SF114-31-P6F6 | |
| Acer Switch One 10 SW1-011-14UQ | |
| Microsoft Surface Pro 4, Core m3 | |
| Chuwi Vi10 Ultimate 64GB | |
| Chuwi Hi12 | |
| Teclast Tbook 16 Power | |
| Chuwi Hi10 Pro | |
| Cube i7 Book CDK09 | |
| Cube i9 | |
| Teclast Tbook 10s | |
Pros
Cons
Teclast Tbook 16 Power最大的卖点在于它高速的Atom x7处理器。尽管它的性能比Atom x5强,它依旧比竞品所搭载的Core m8和奔腾 N3701 处理器慢太多。特别是在游戏性能上,英特尔 HD Graphics 405令我们十分失望。
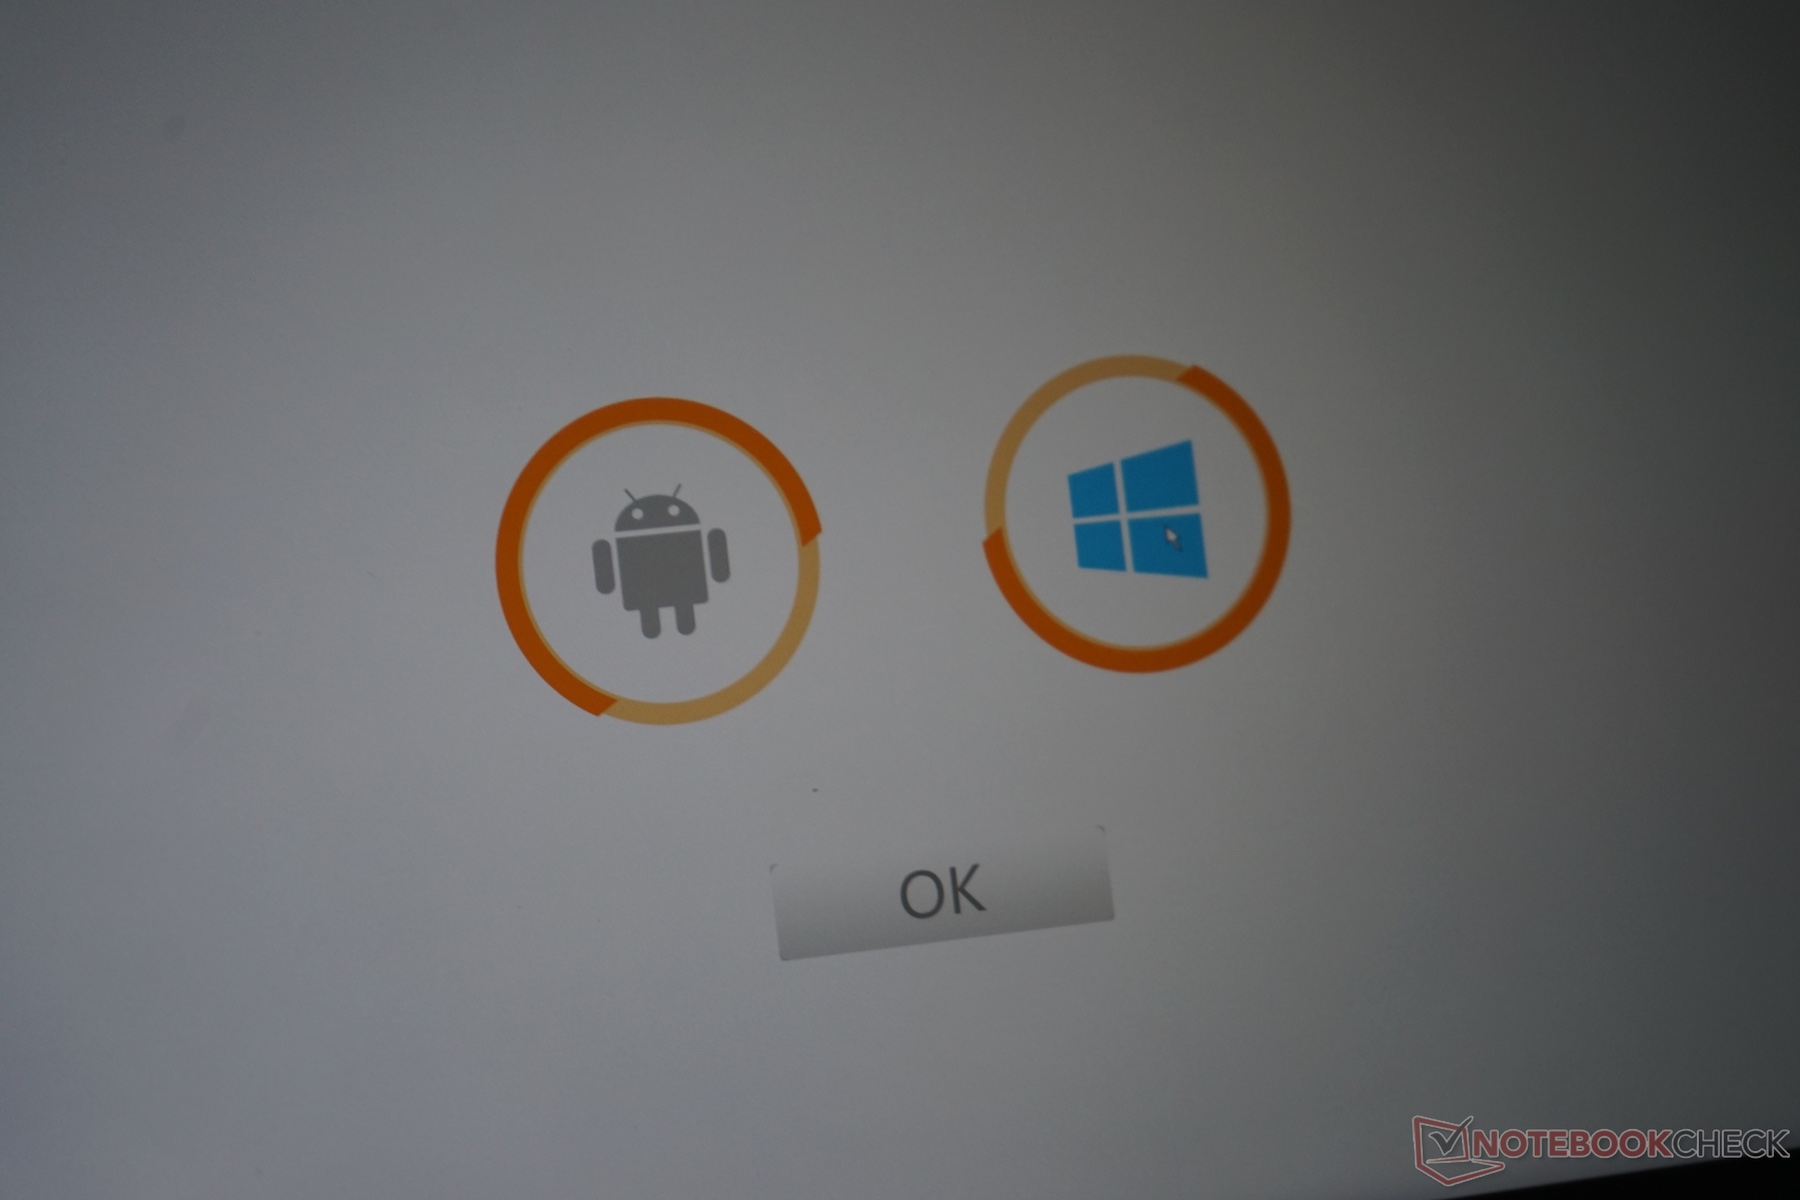
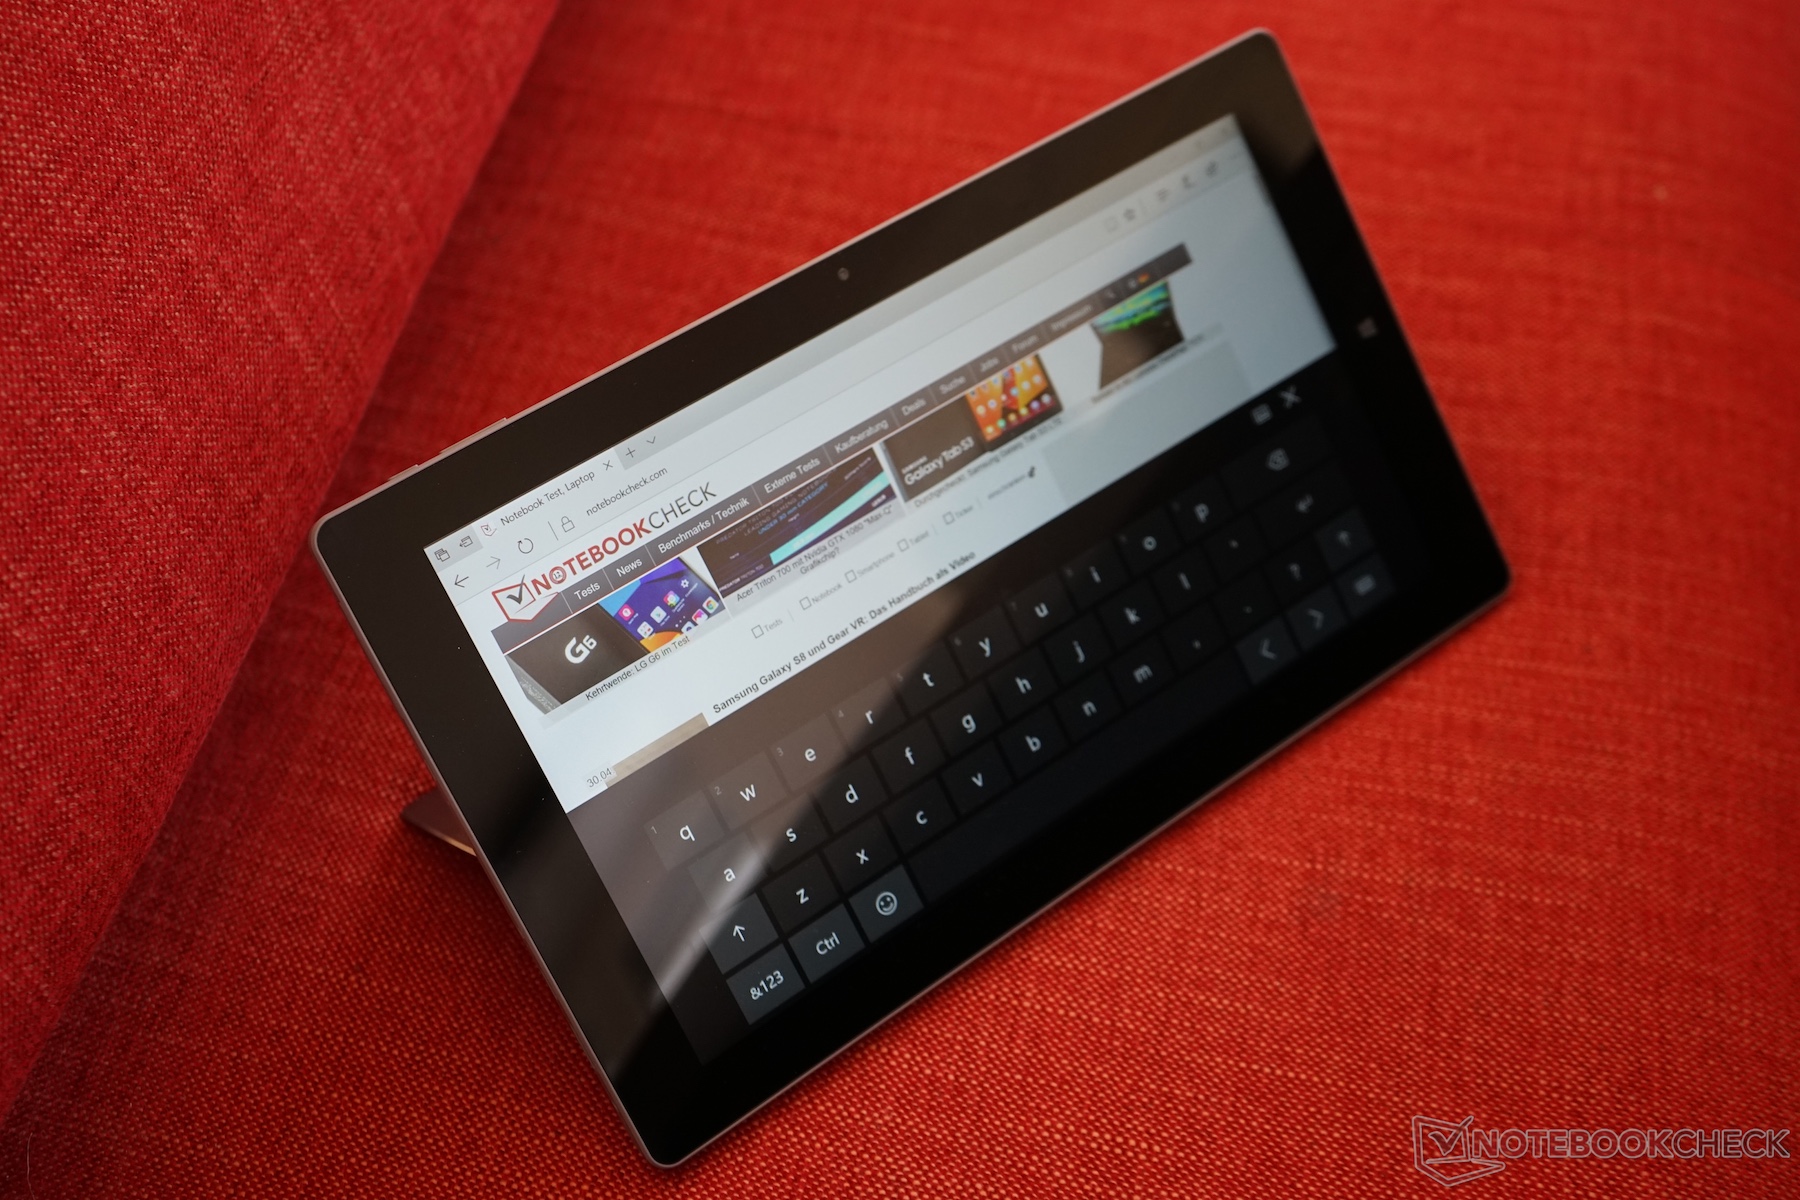
其另外一个主要卖点在于预装有Android 6操作系统。在一个很短的时间里我们的确是能够使用它的,它表现很出色而且看起来也很顺滑。但不幸的是,再一次 Windows更新之后,双启动项的选项消失了,我们因此无法对它进行进一步测试。
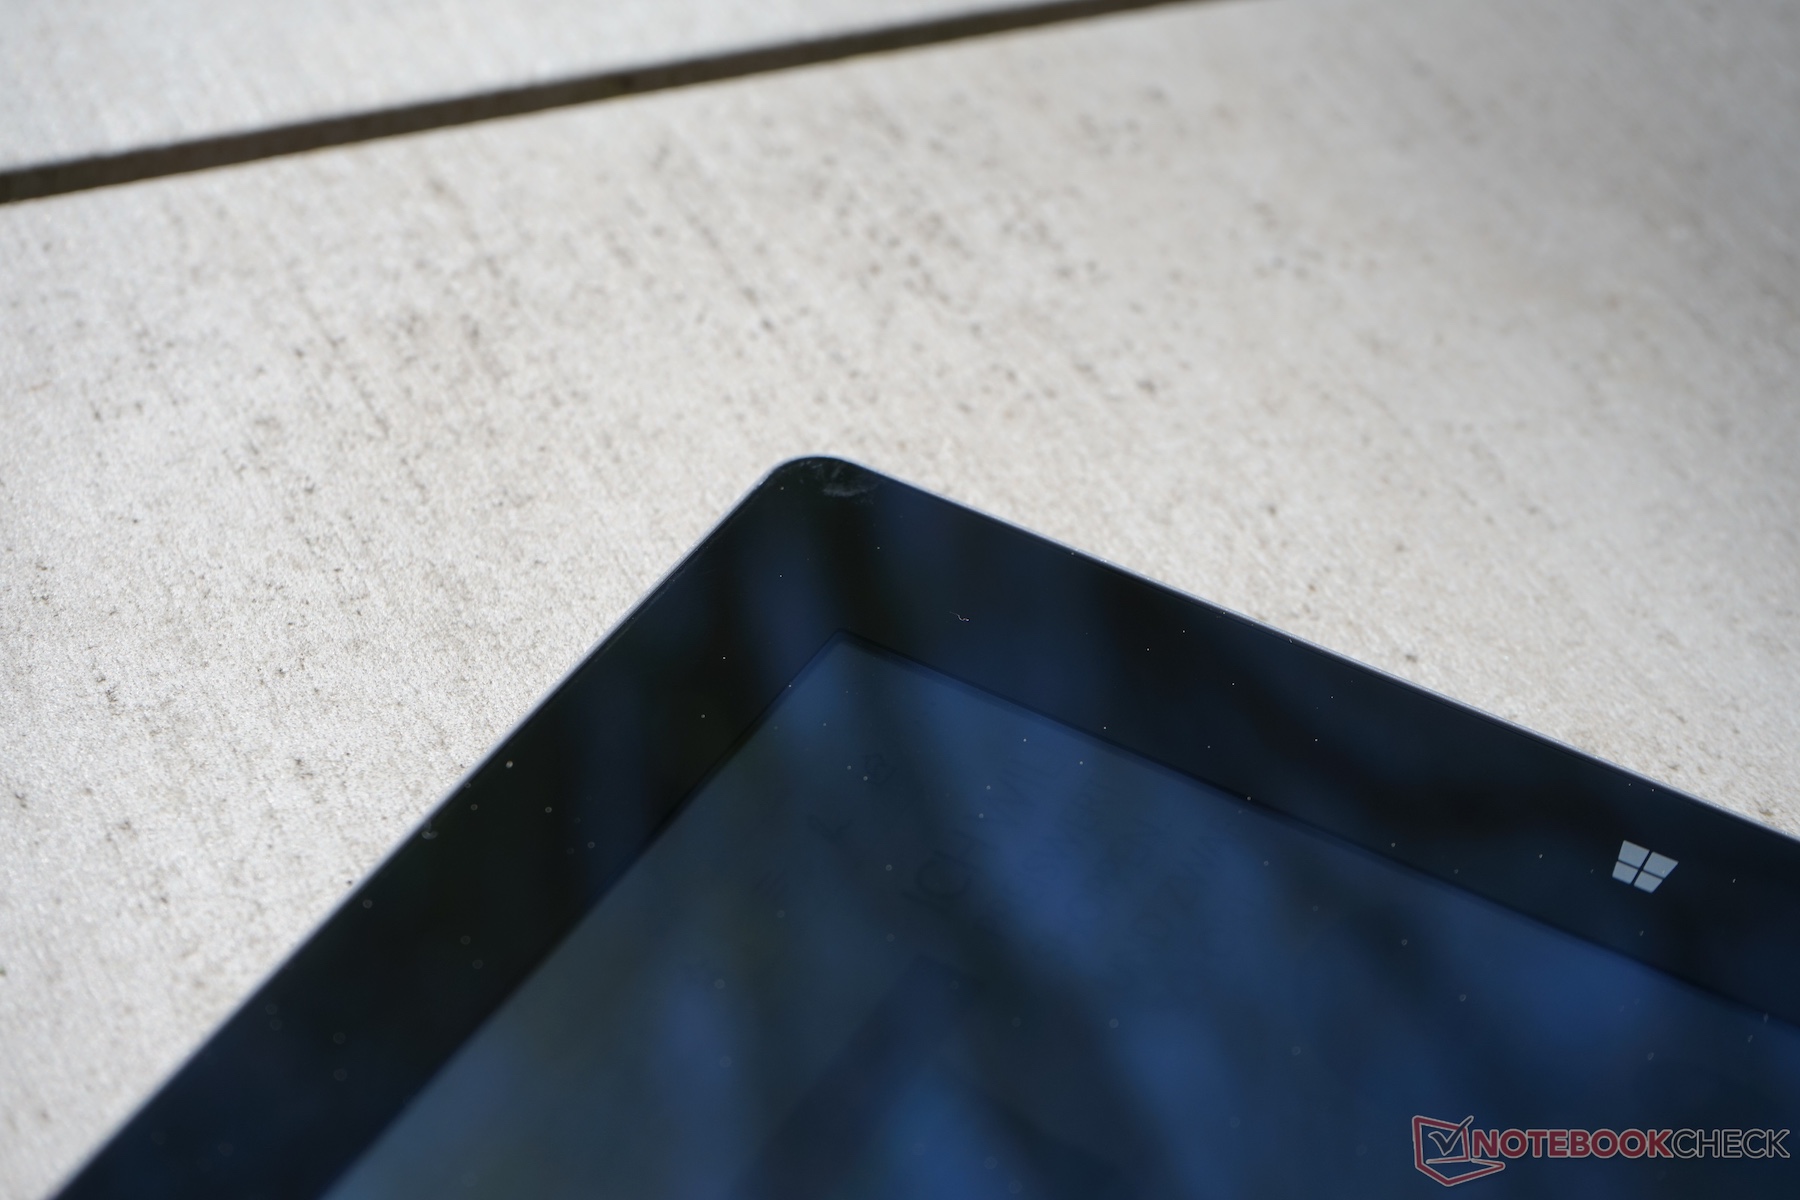
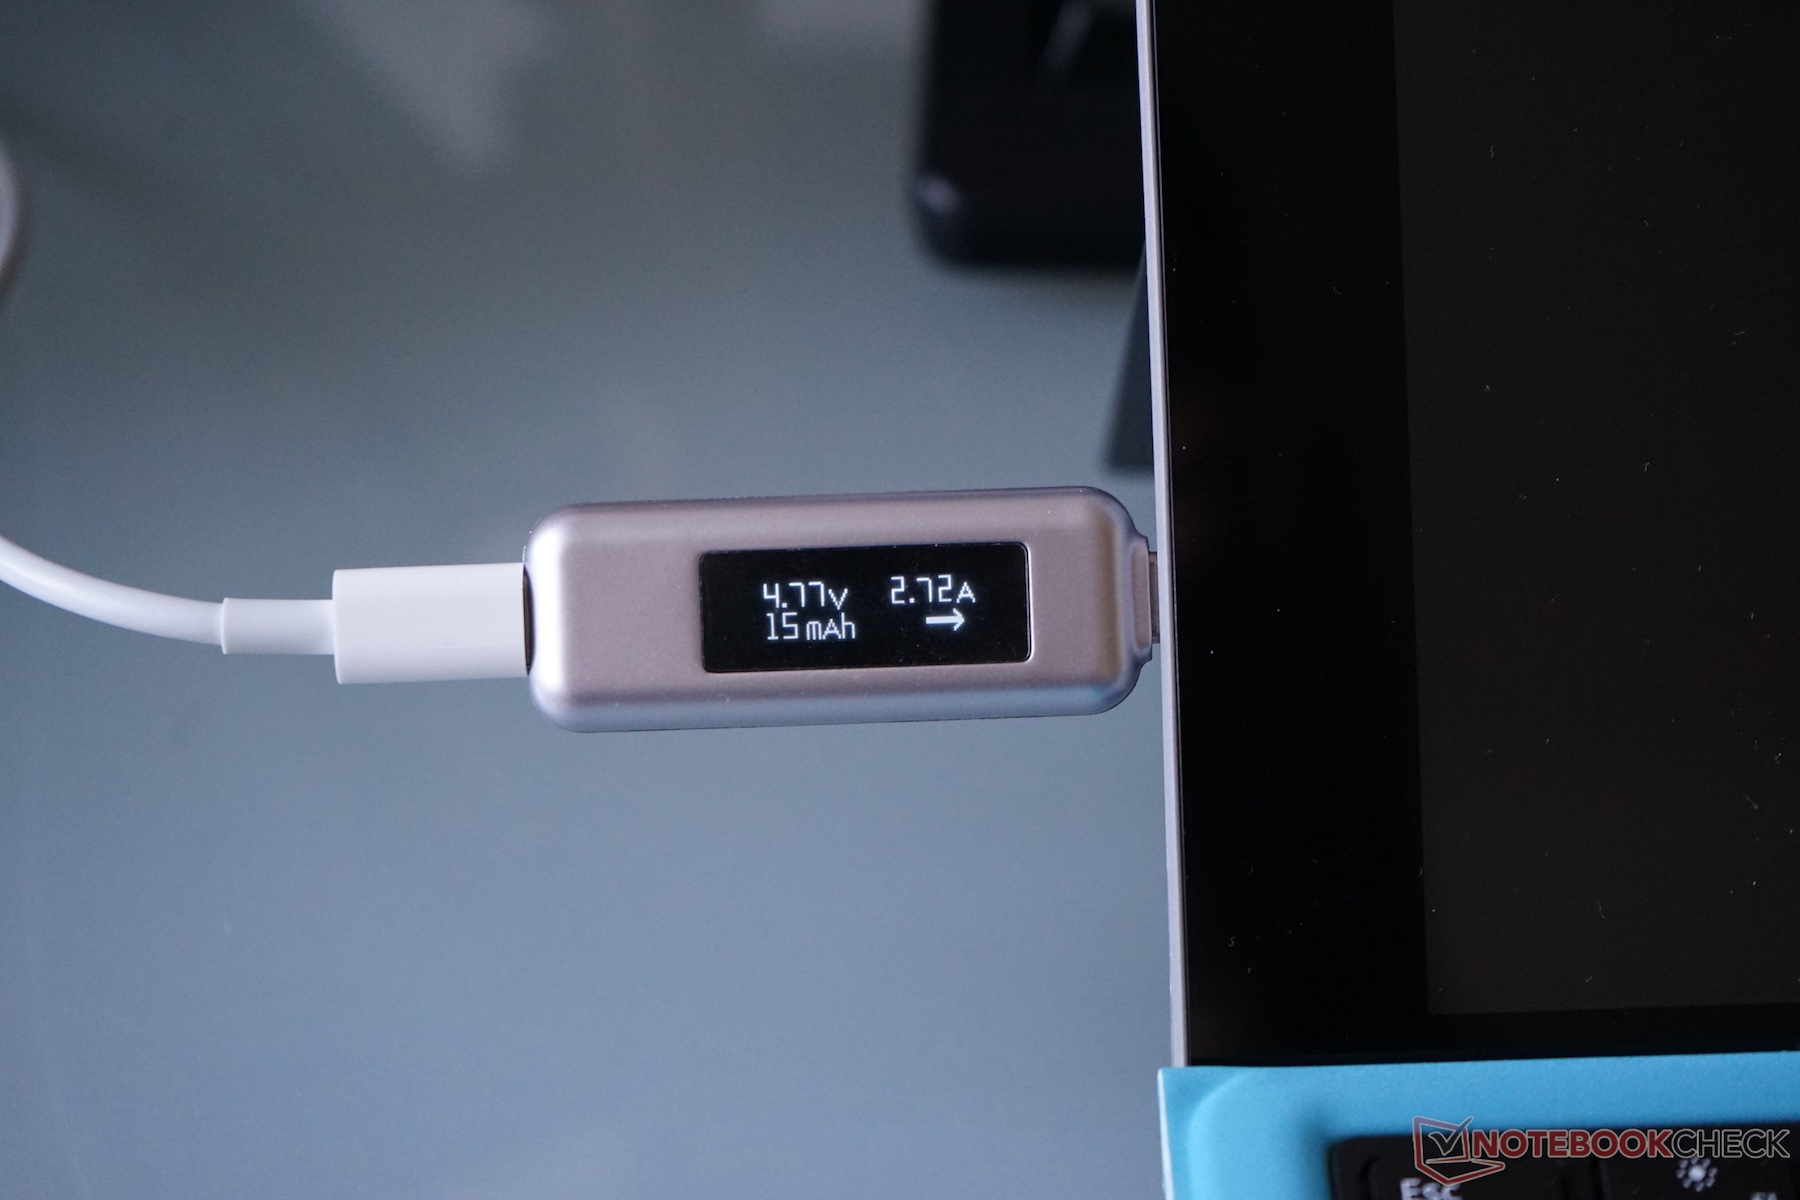
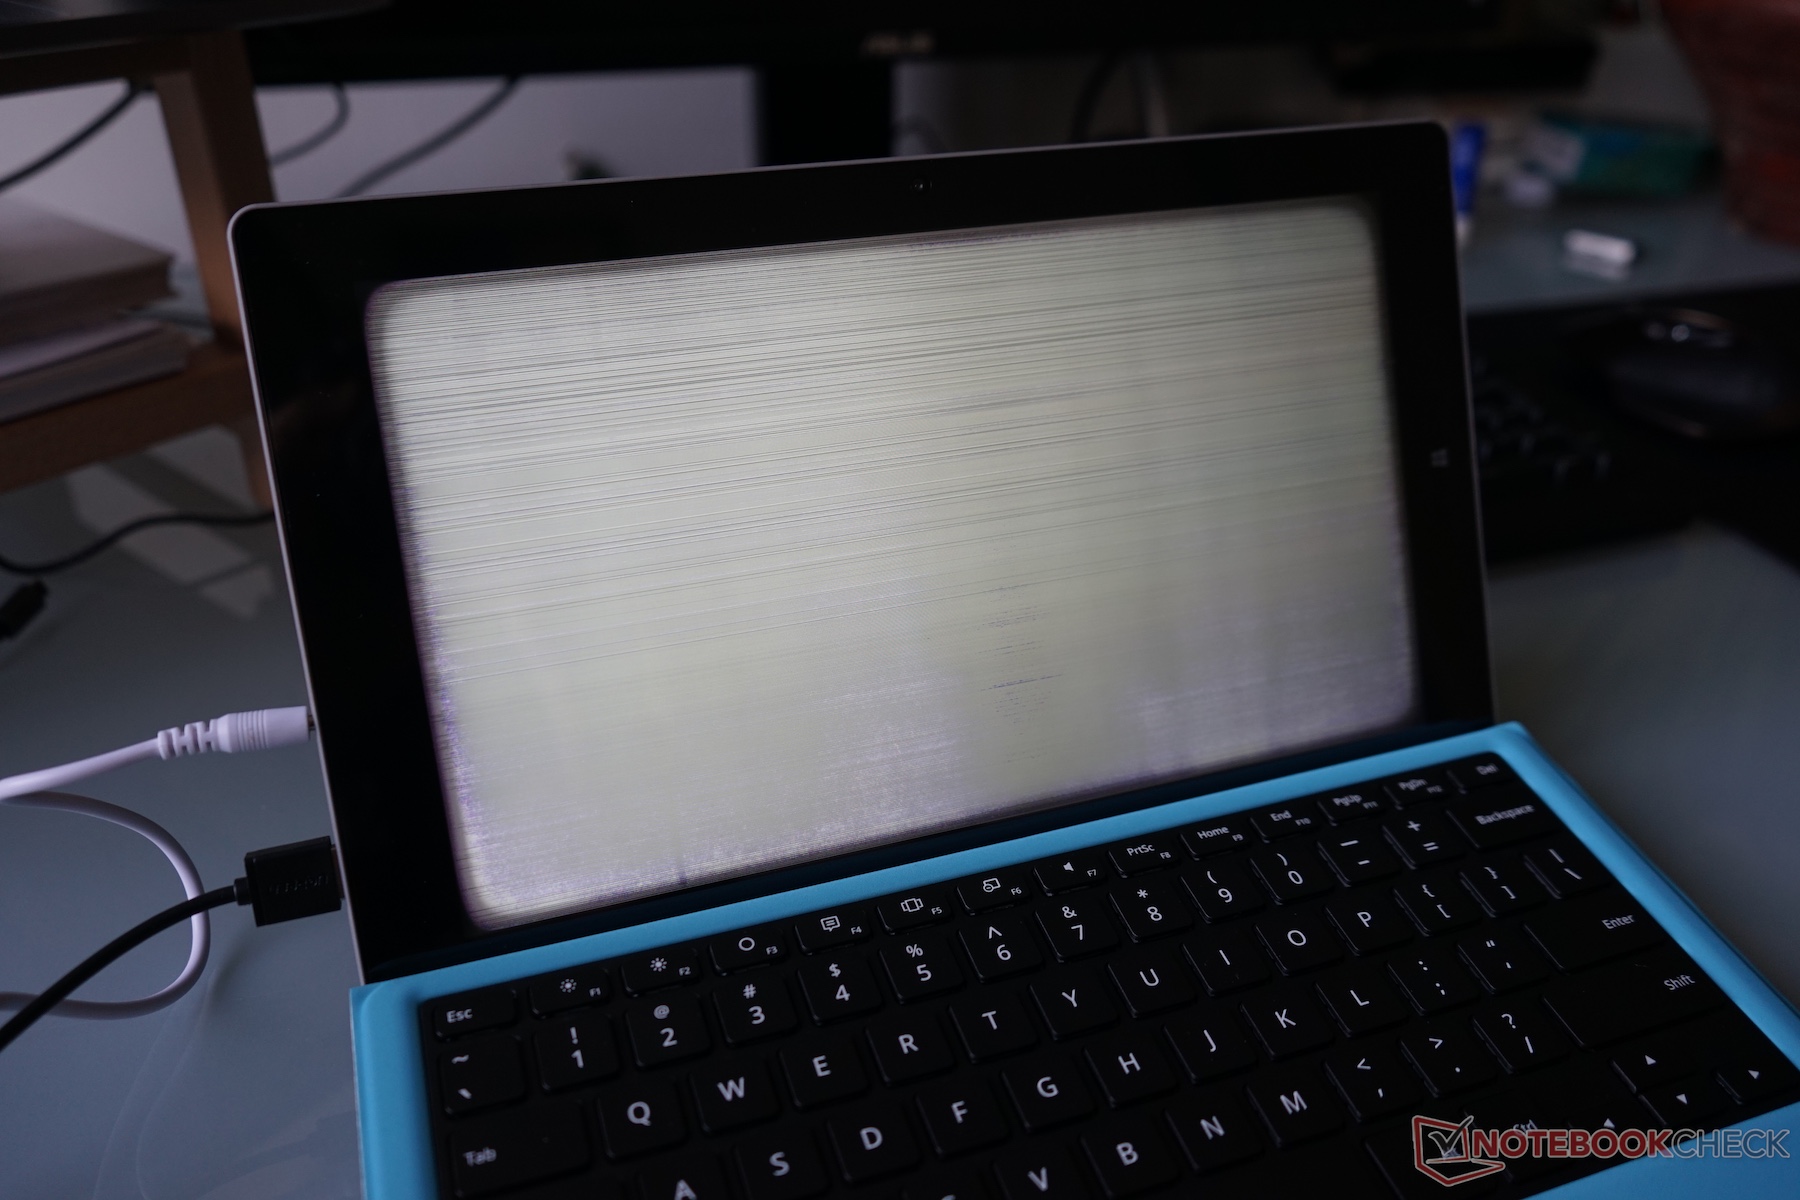
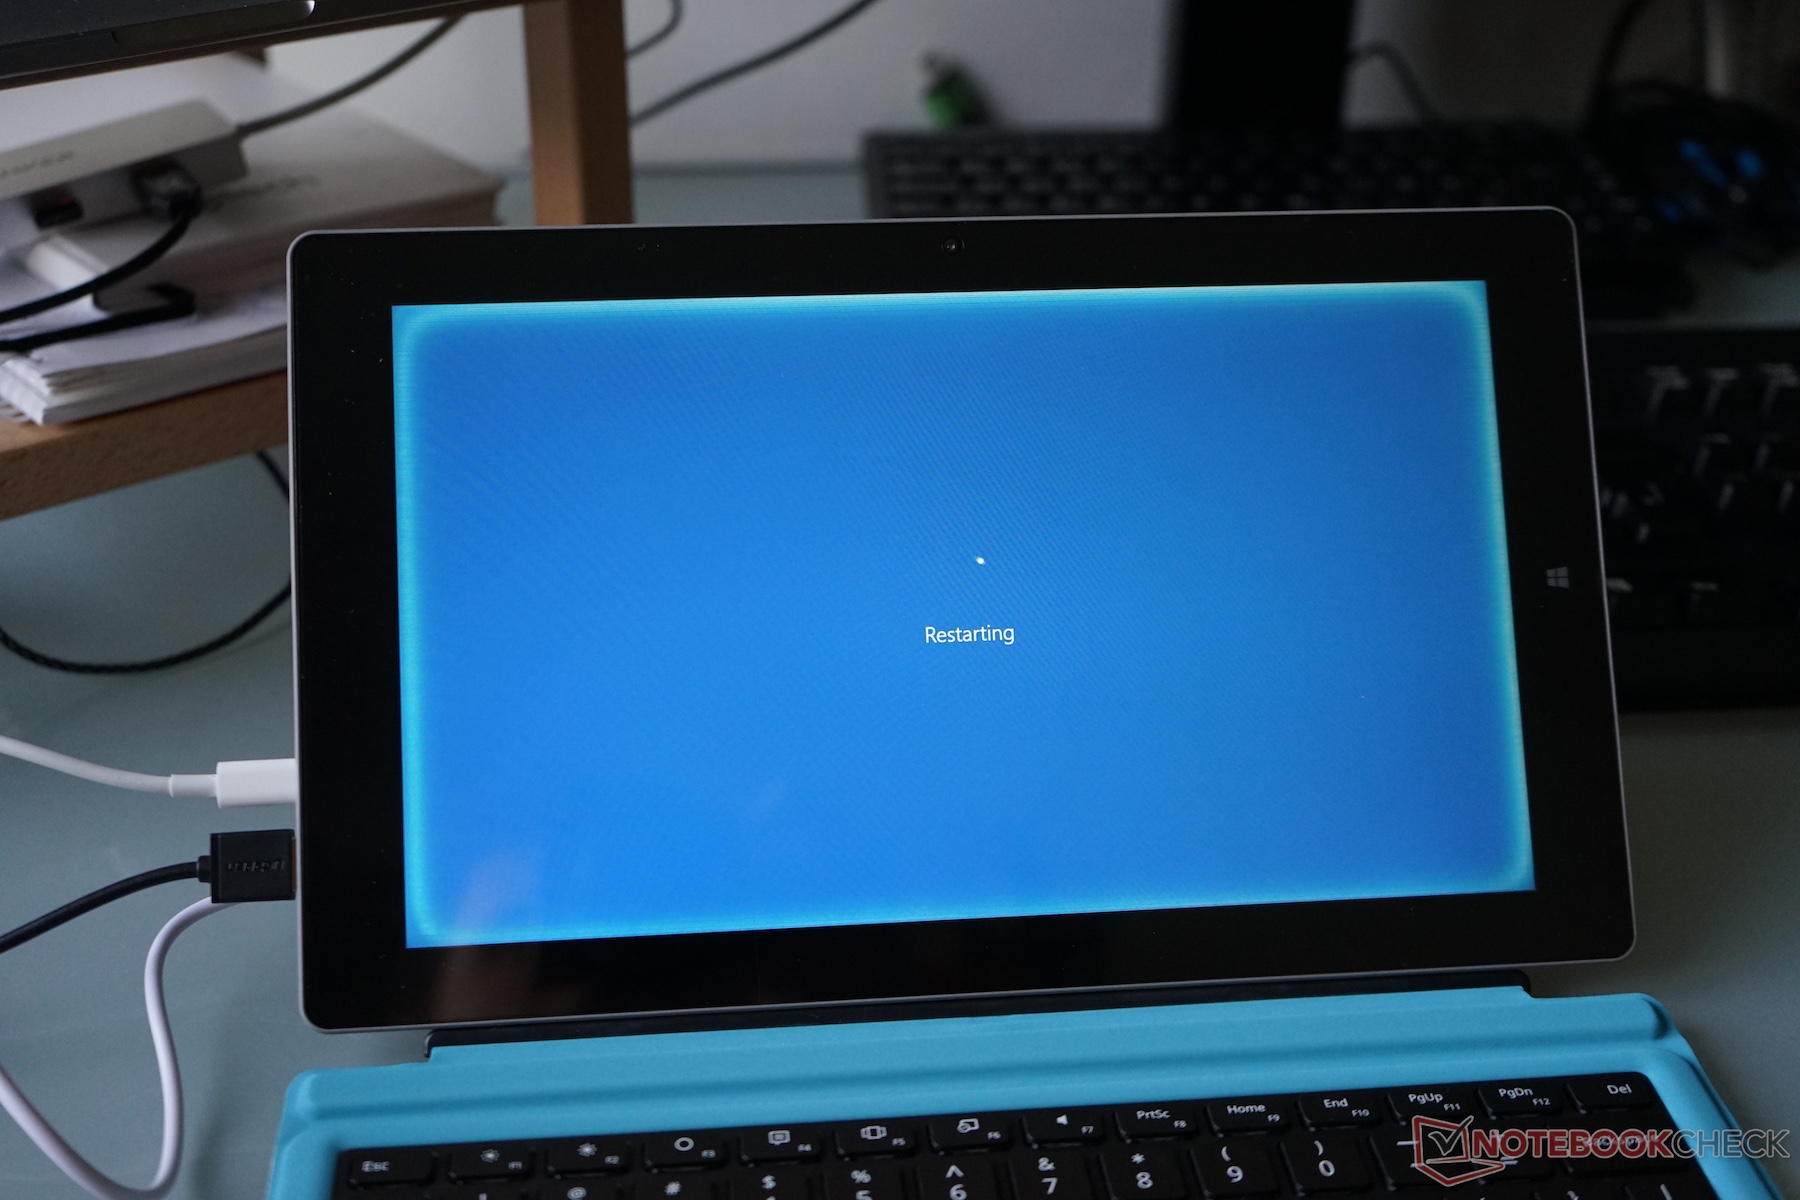
总体上来说,我们在对于测试样机的测试过程中,遭遇到了很多的或大或小的问题。一天早晨,屏幕无法显示除了白噪之外的任何东西,我们被迫重启了设备。因为一些原因,之后的几个小时内,屏幕的边缘部分亮度比其余部分更亮。充电器的确实带来了更多的大问题。无论是苹果的,Inateck或是Anker的USB-C充电器都无法对它很好的充电。有的时候,它完全无法充电,有时,它的充电断断续续,而且当它充完电之后,有时它会失去和充电器的链接。
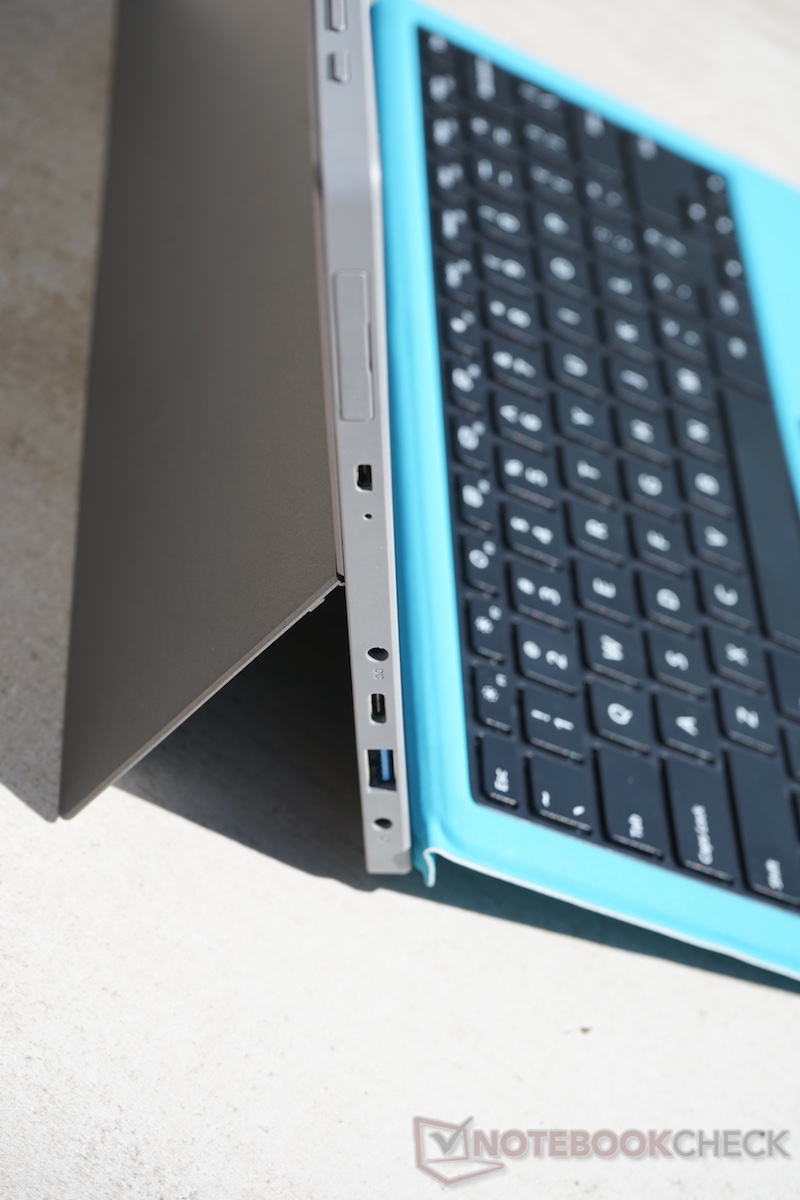
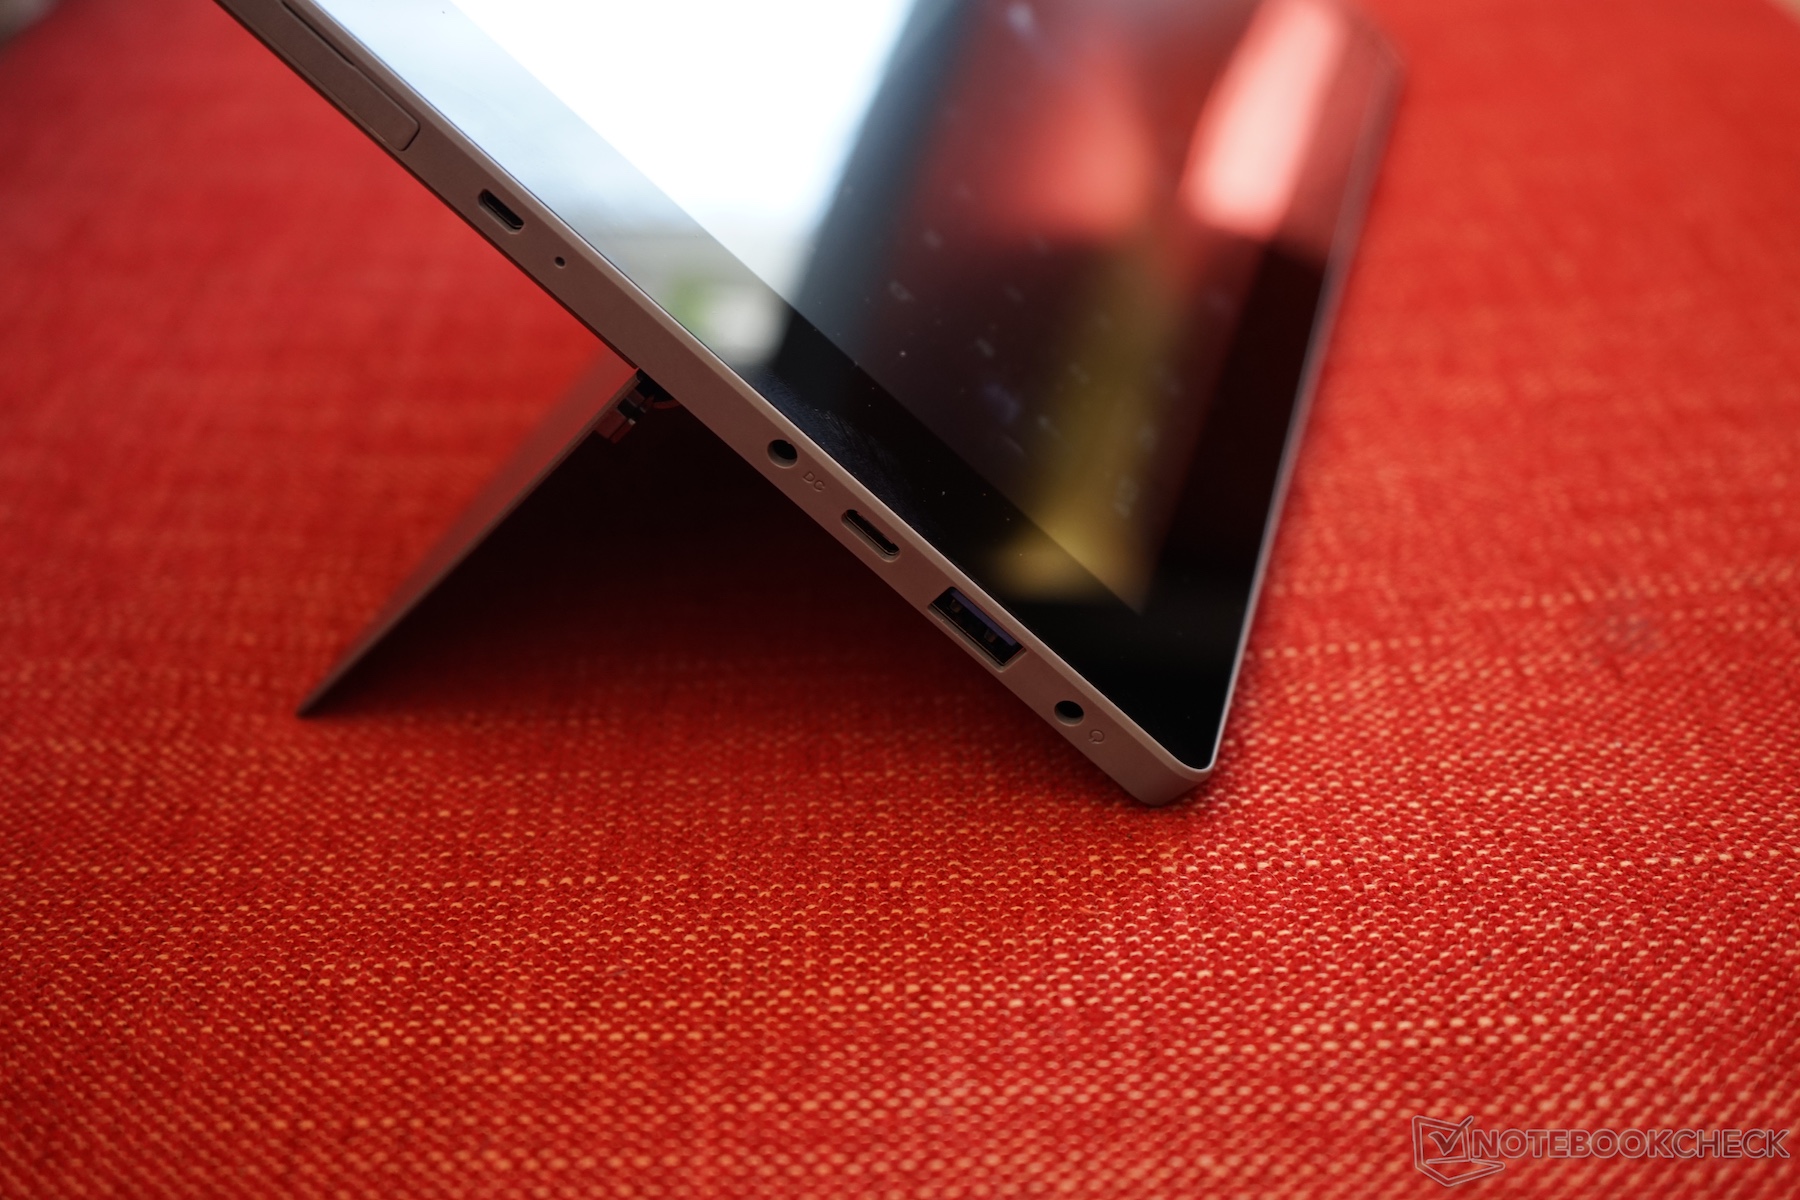
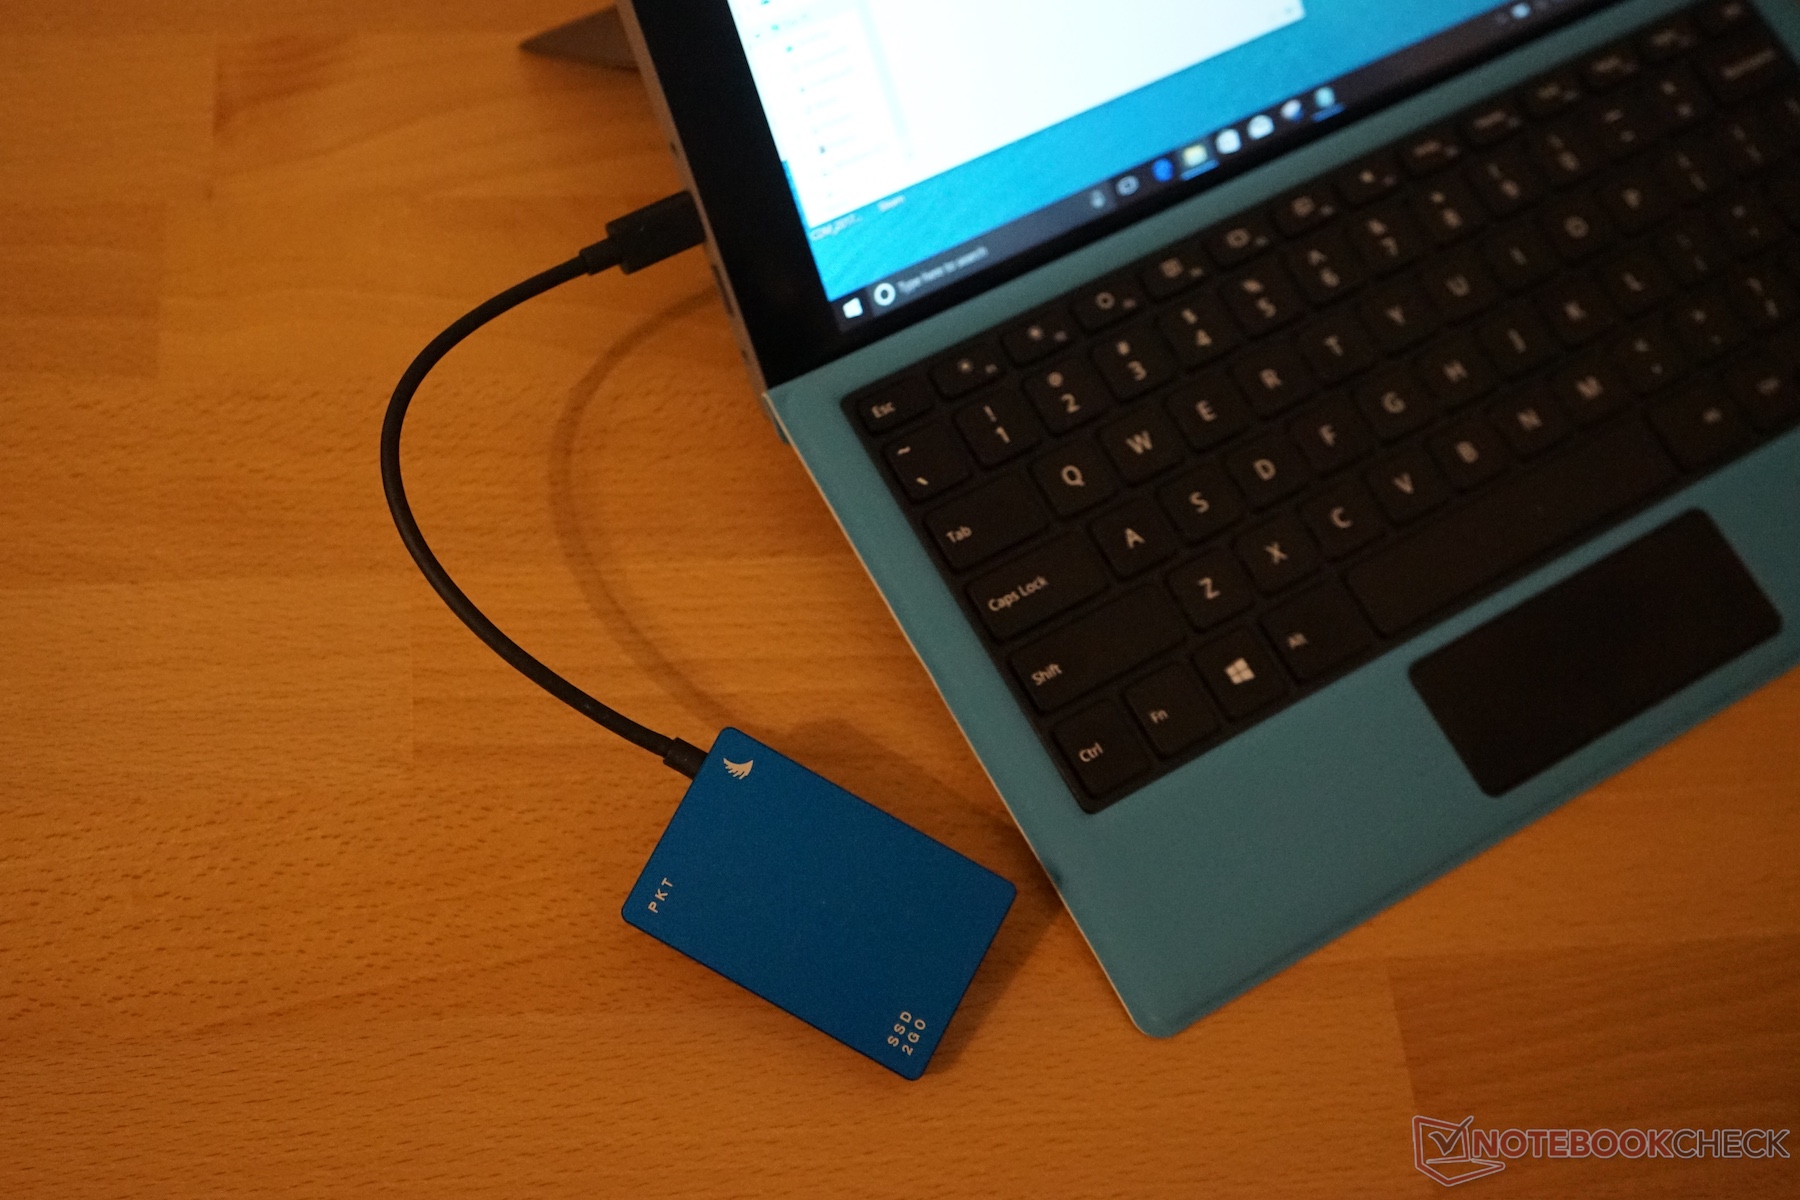
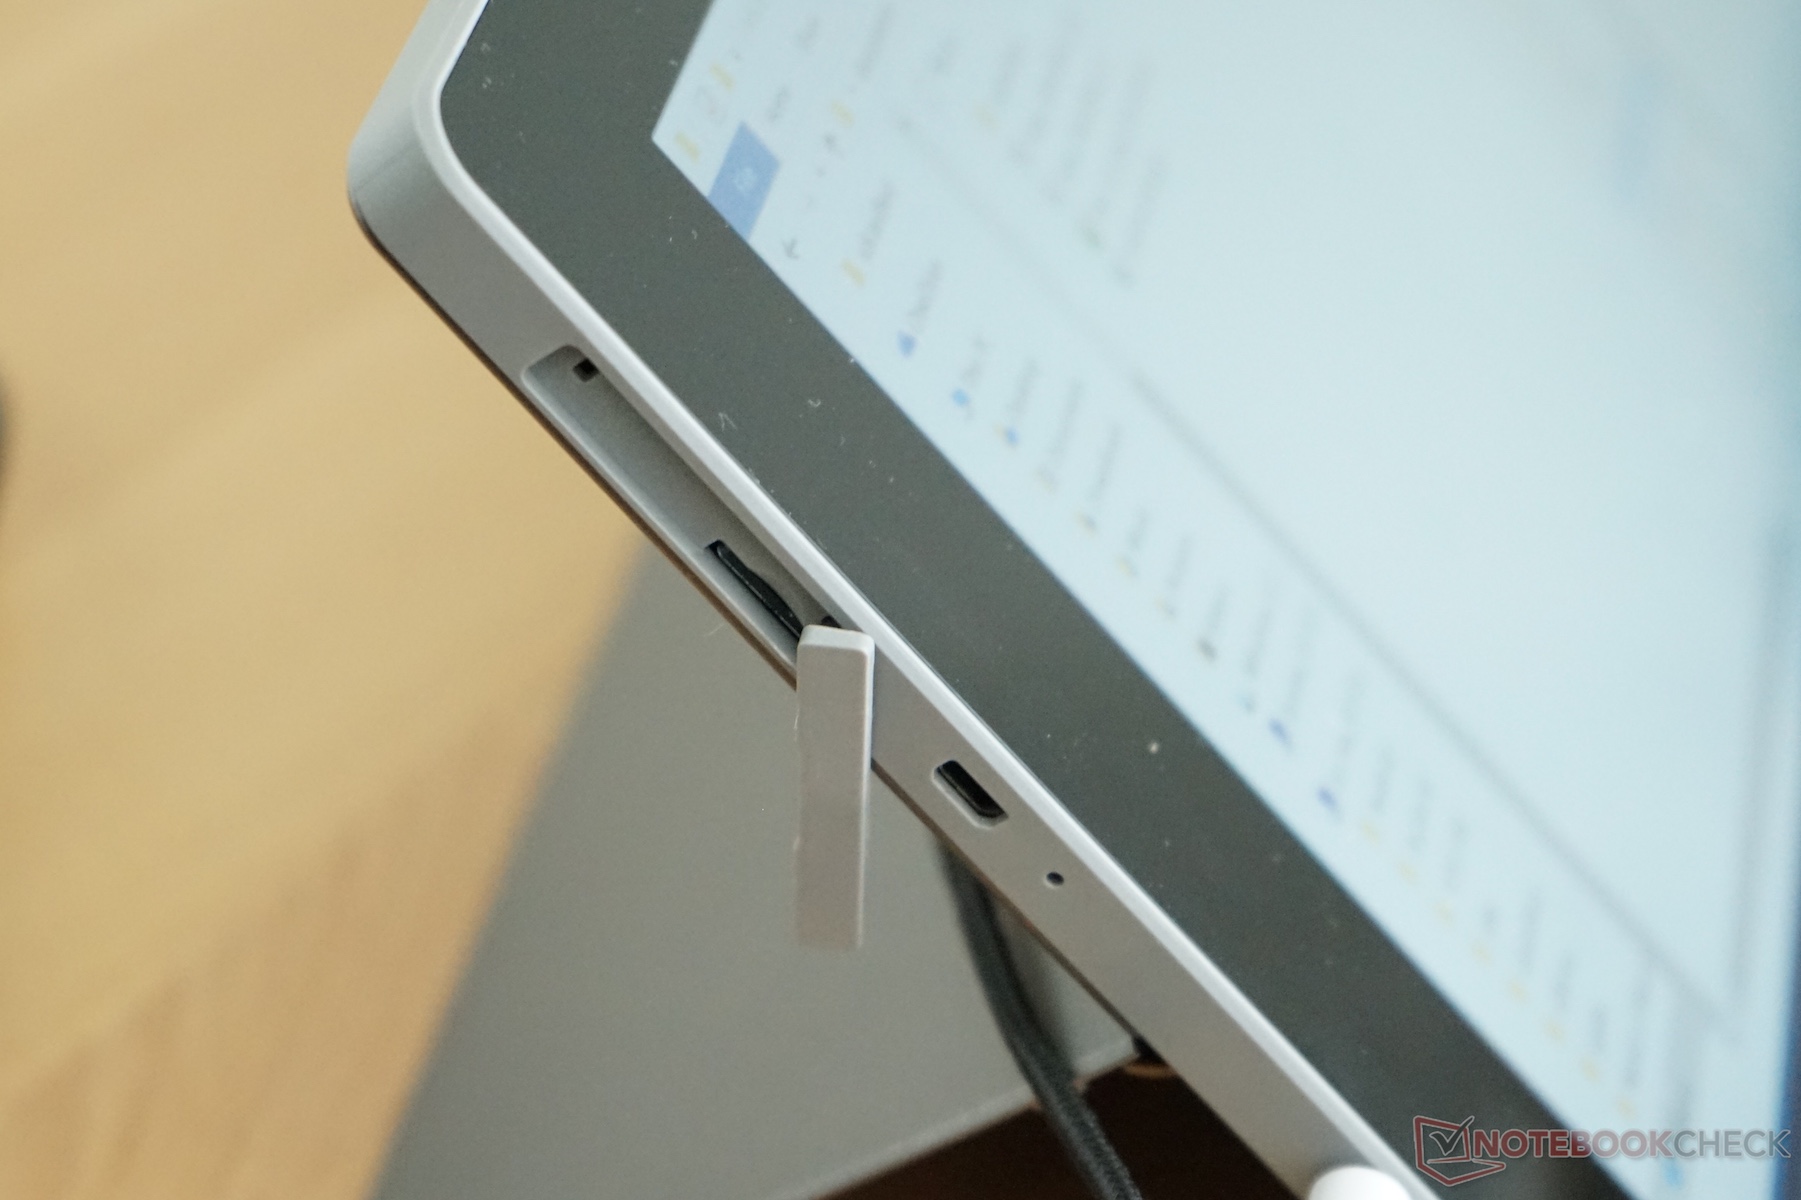
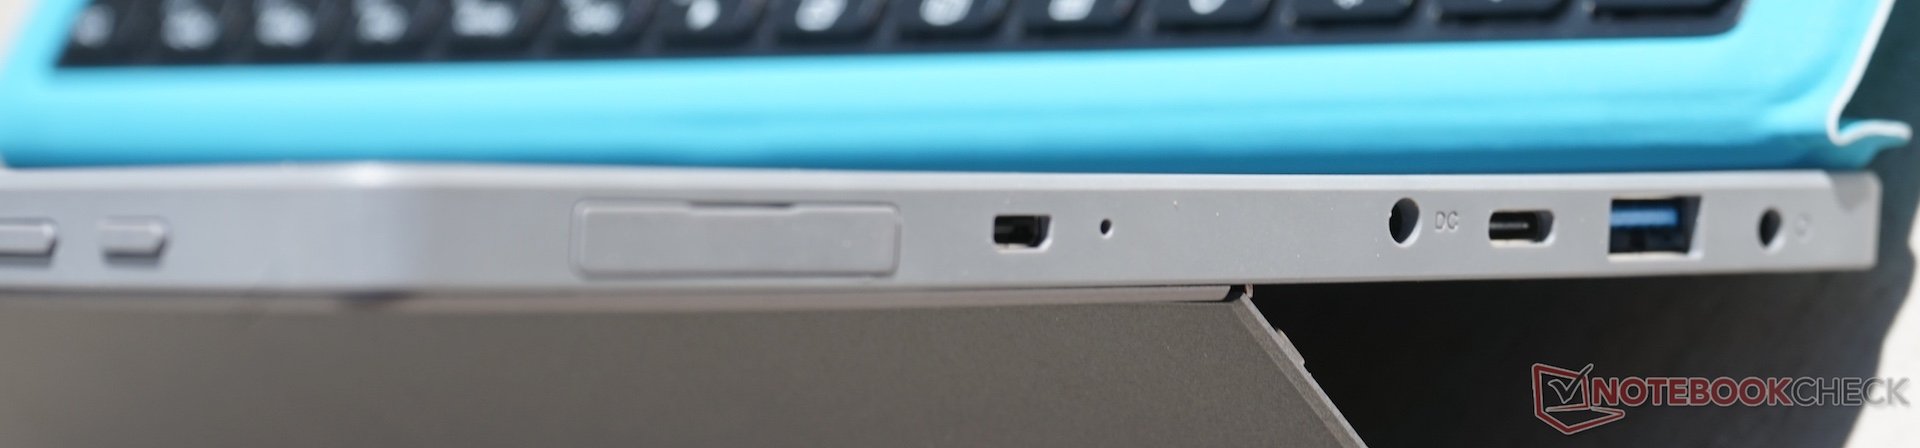
自带的USB接口的工作情况不如预期,我们无法使用外置固态硬盘,例如G-Drive,Angelbird,或是OCZ的产品。其他的设备,例如外置机械硬盘或闪迪Extreme 900,运行的很正常。我们猜测是USB的接口供电不足。待机也是这台设备的一大问题。初来较高的待机功耗之外,它有时在屏幕关闭的状态下依旧维持运行状态,而一些后台进程导致CPU负载较高使得电池很快被消耗殆尽。我们无法找到这个问题的确切原因。我们最好的猜测是其驱动程序出错或不佳。
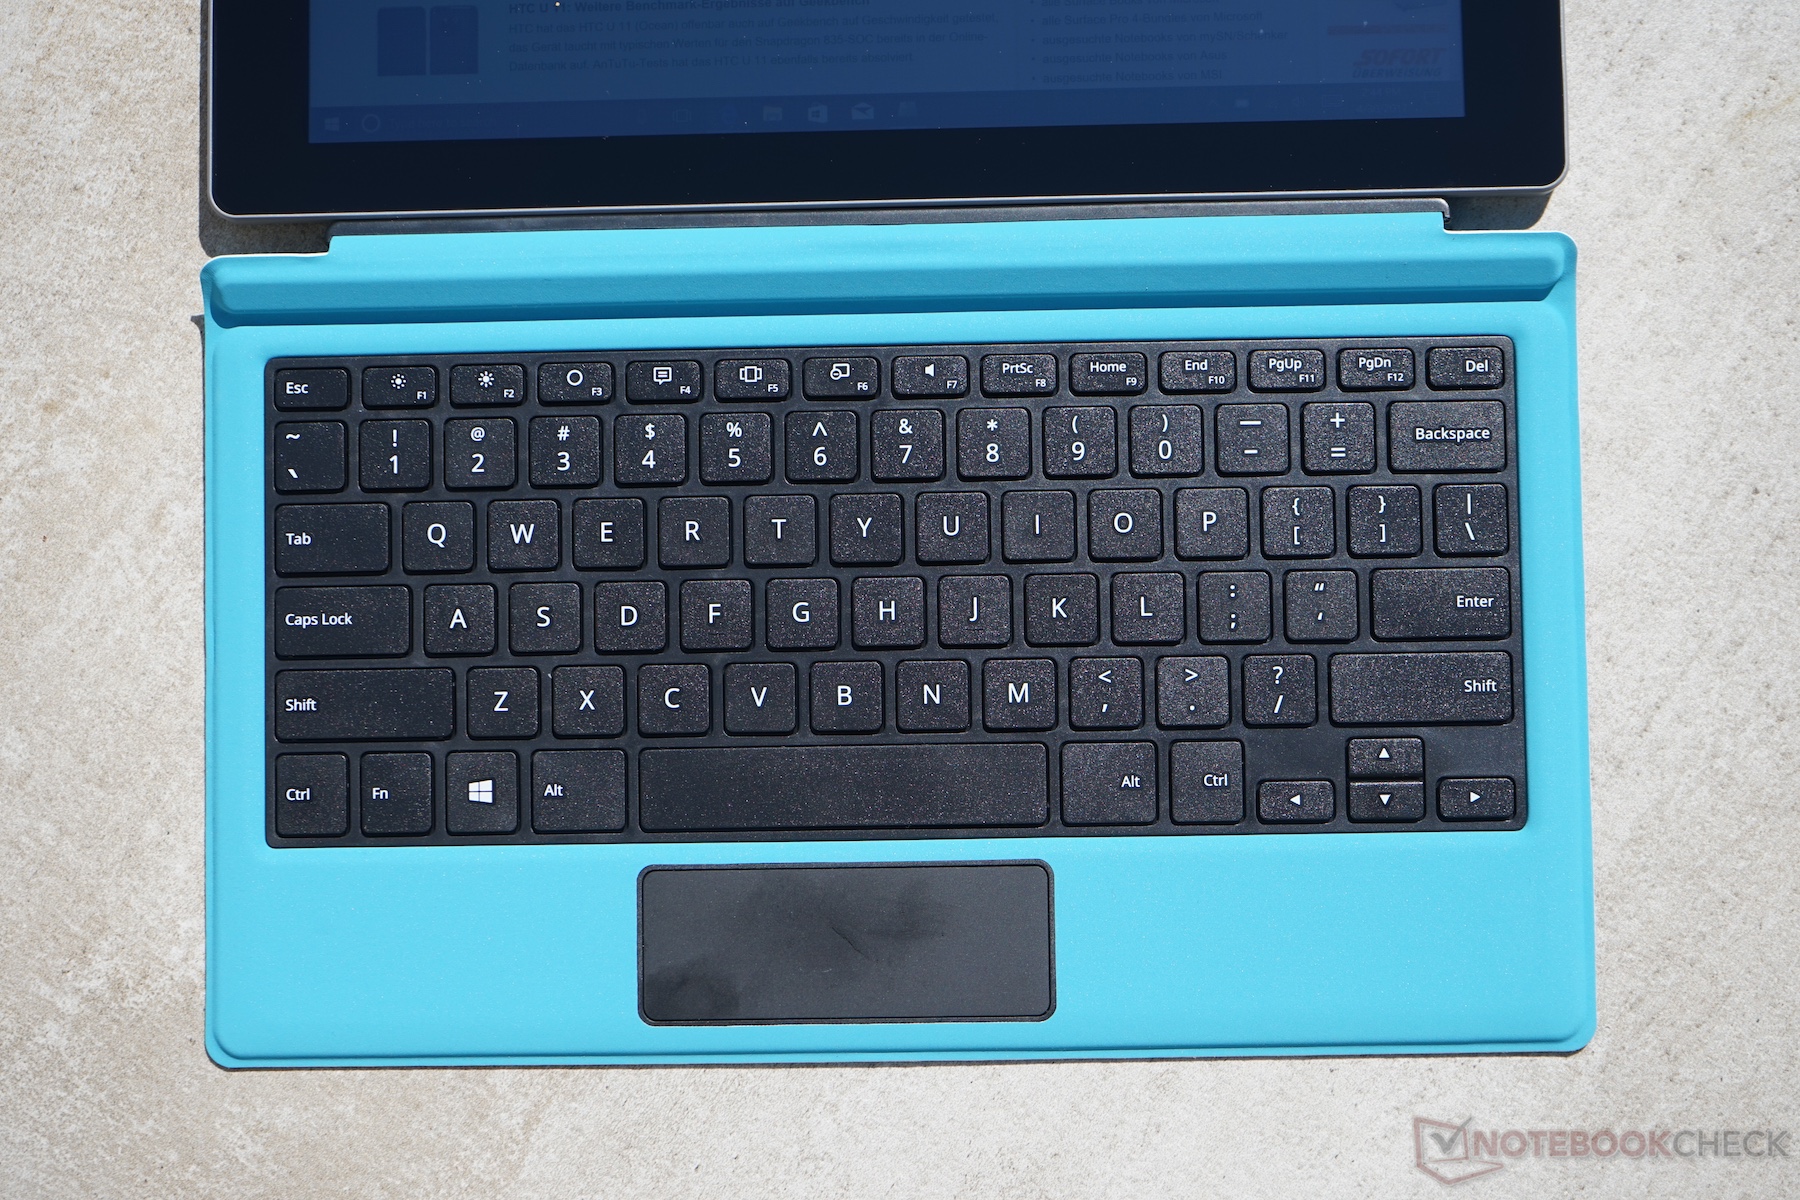
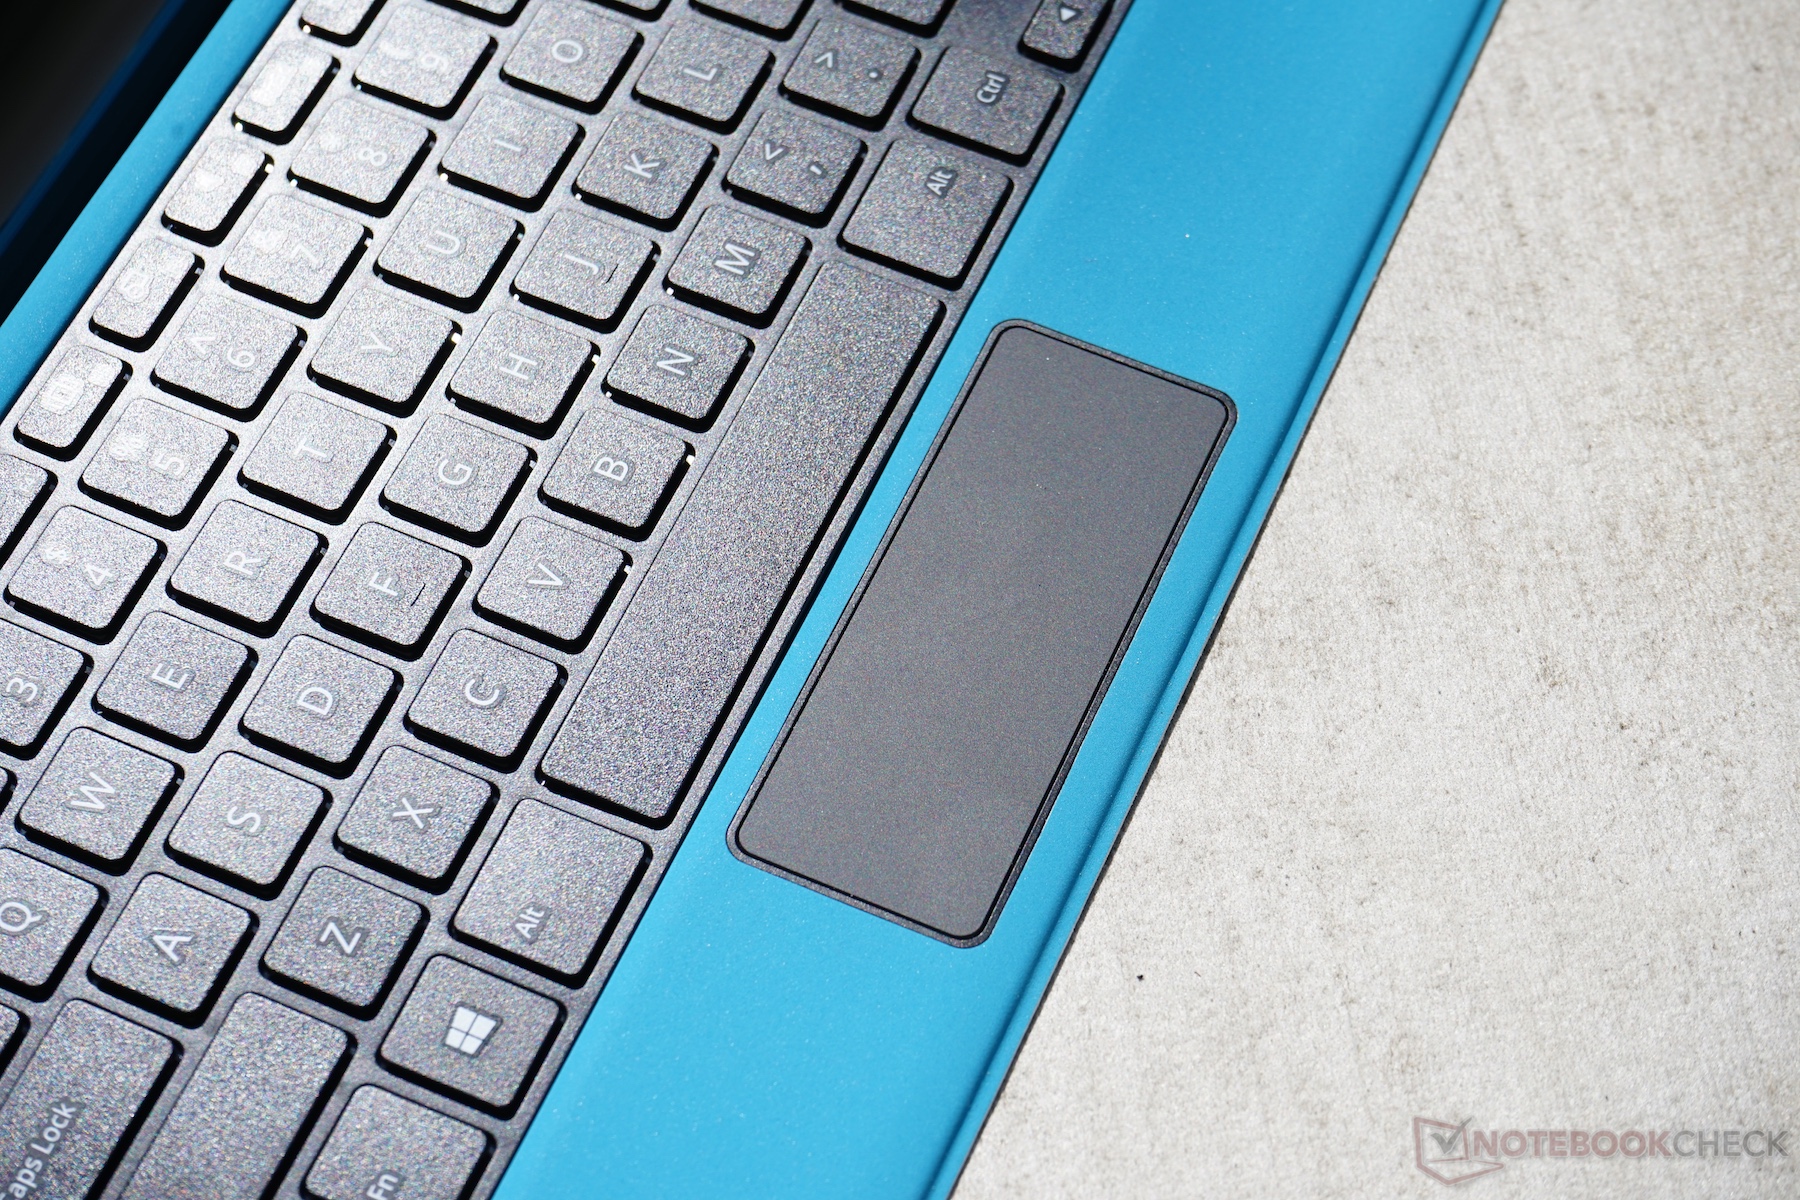
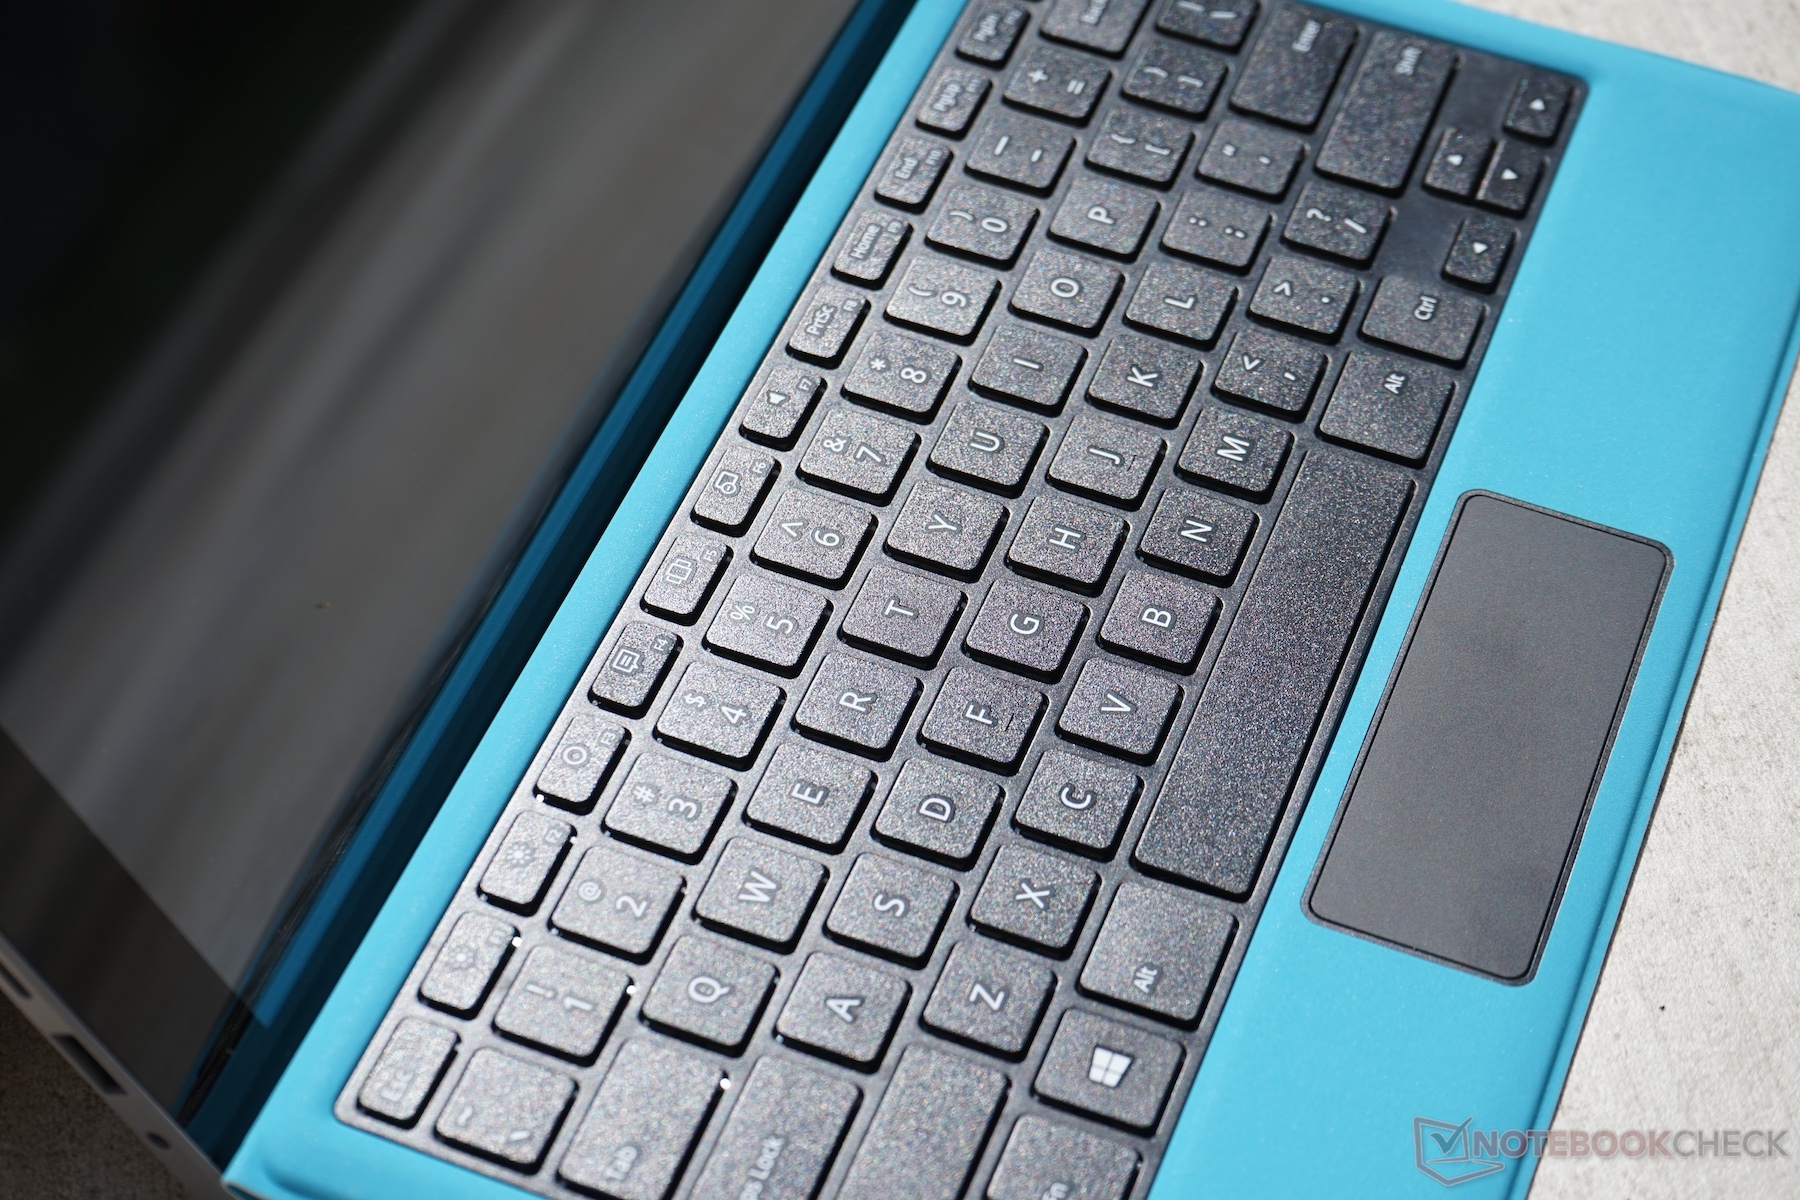
除了上述的问题之外,这台平板依旧还有其他的几个显而易见的问题:摄像头,扬声器,以及触摸板。再者。因为缺乏CE认证,这台设备现在无法在欧洲被买到,在撰写文章的时间点上,唯一买到它的方法是从中国进口。保修和支持服务因此完全取决于卖家,且伴有高昂的税费和运费。
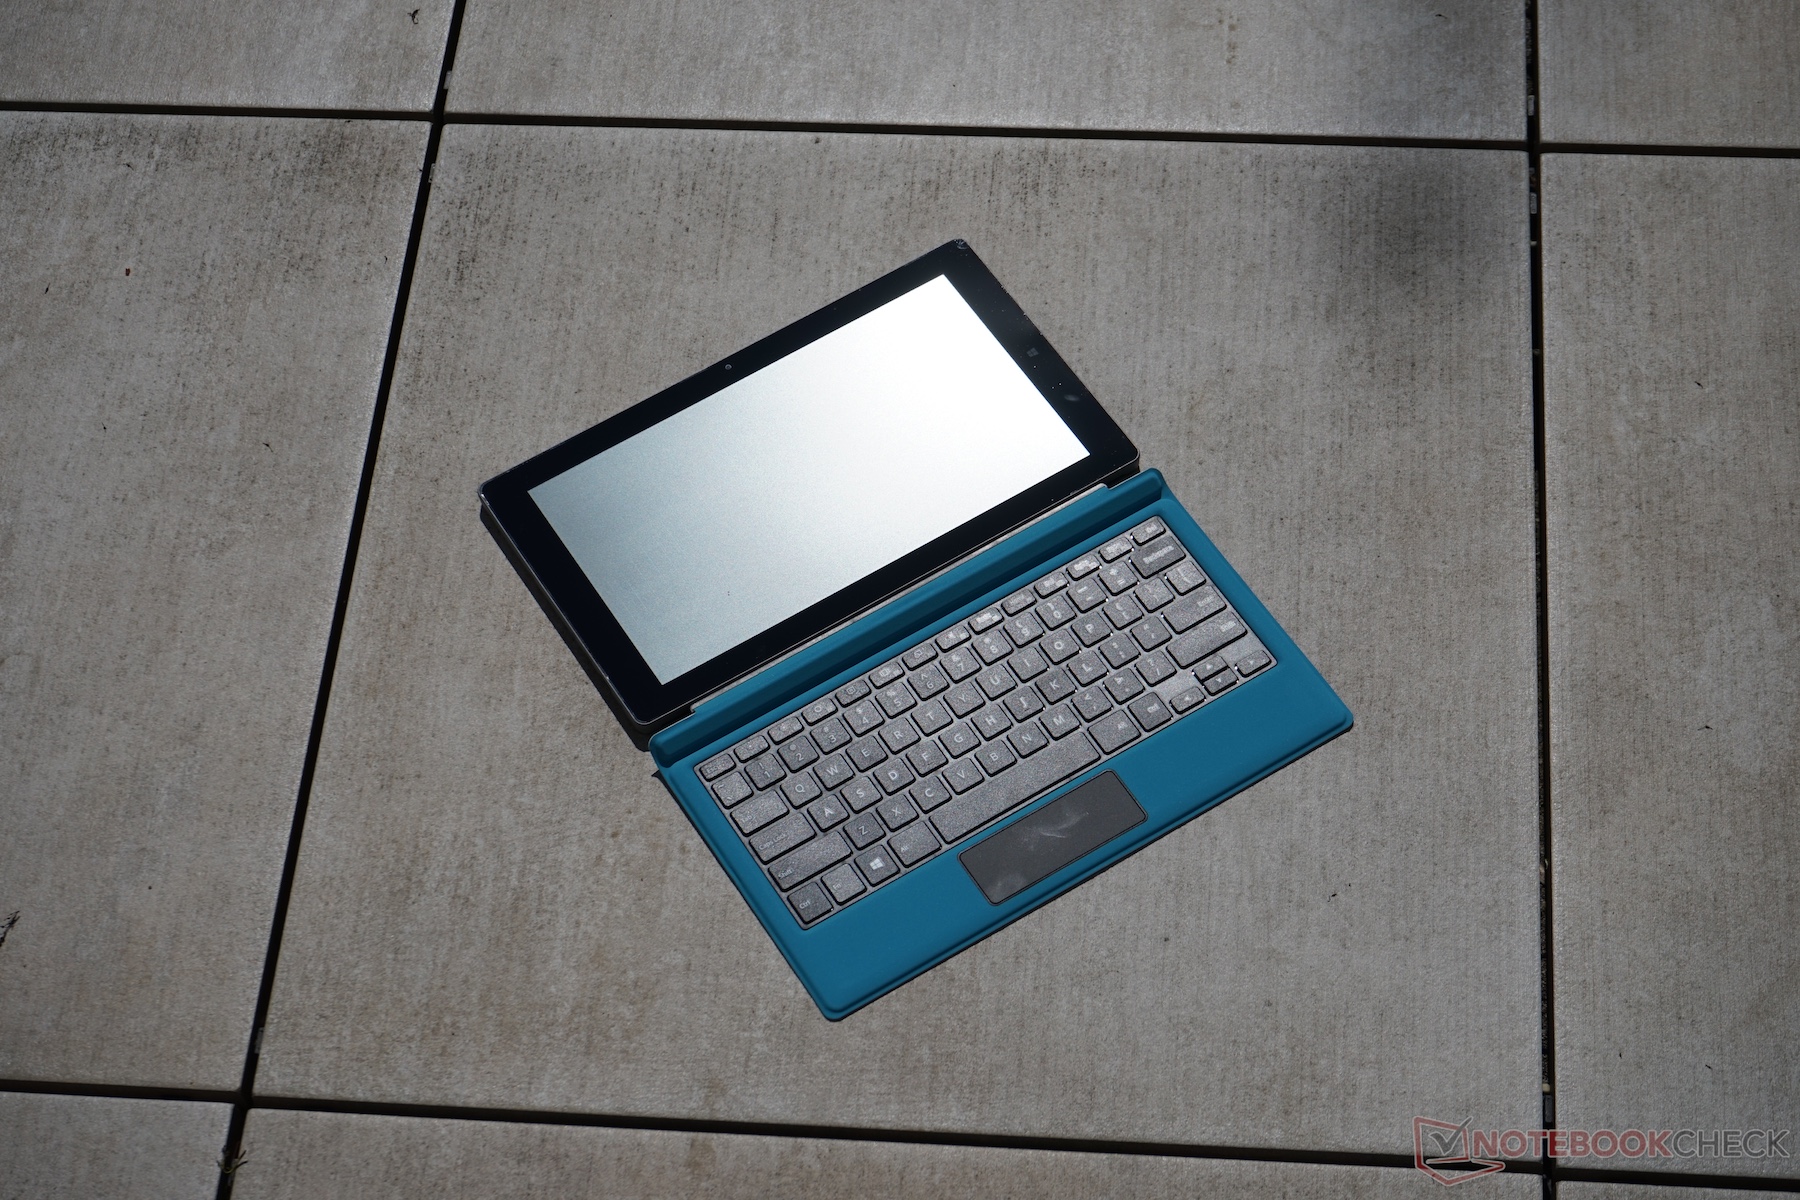
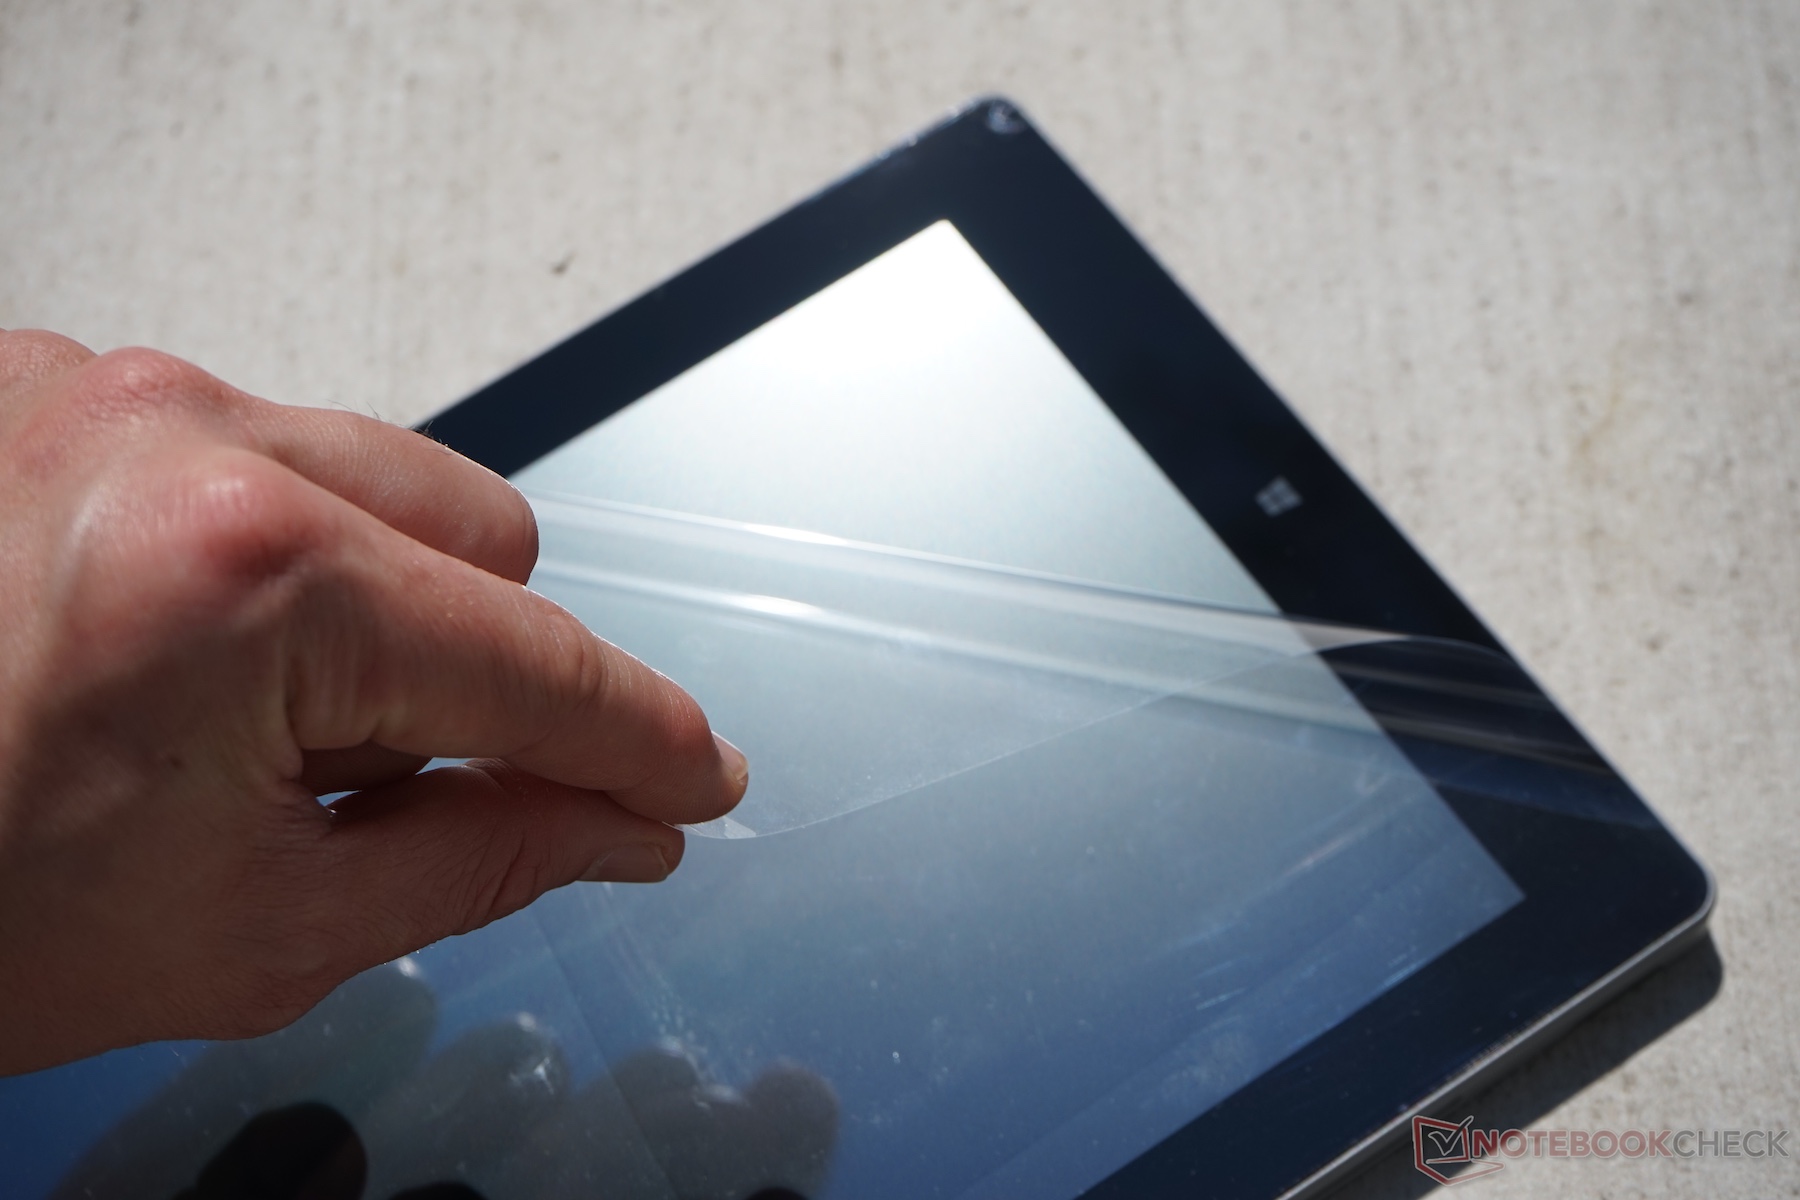
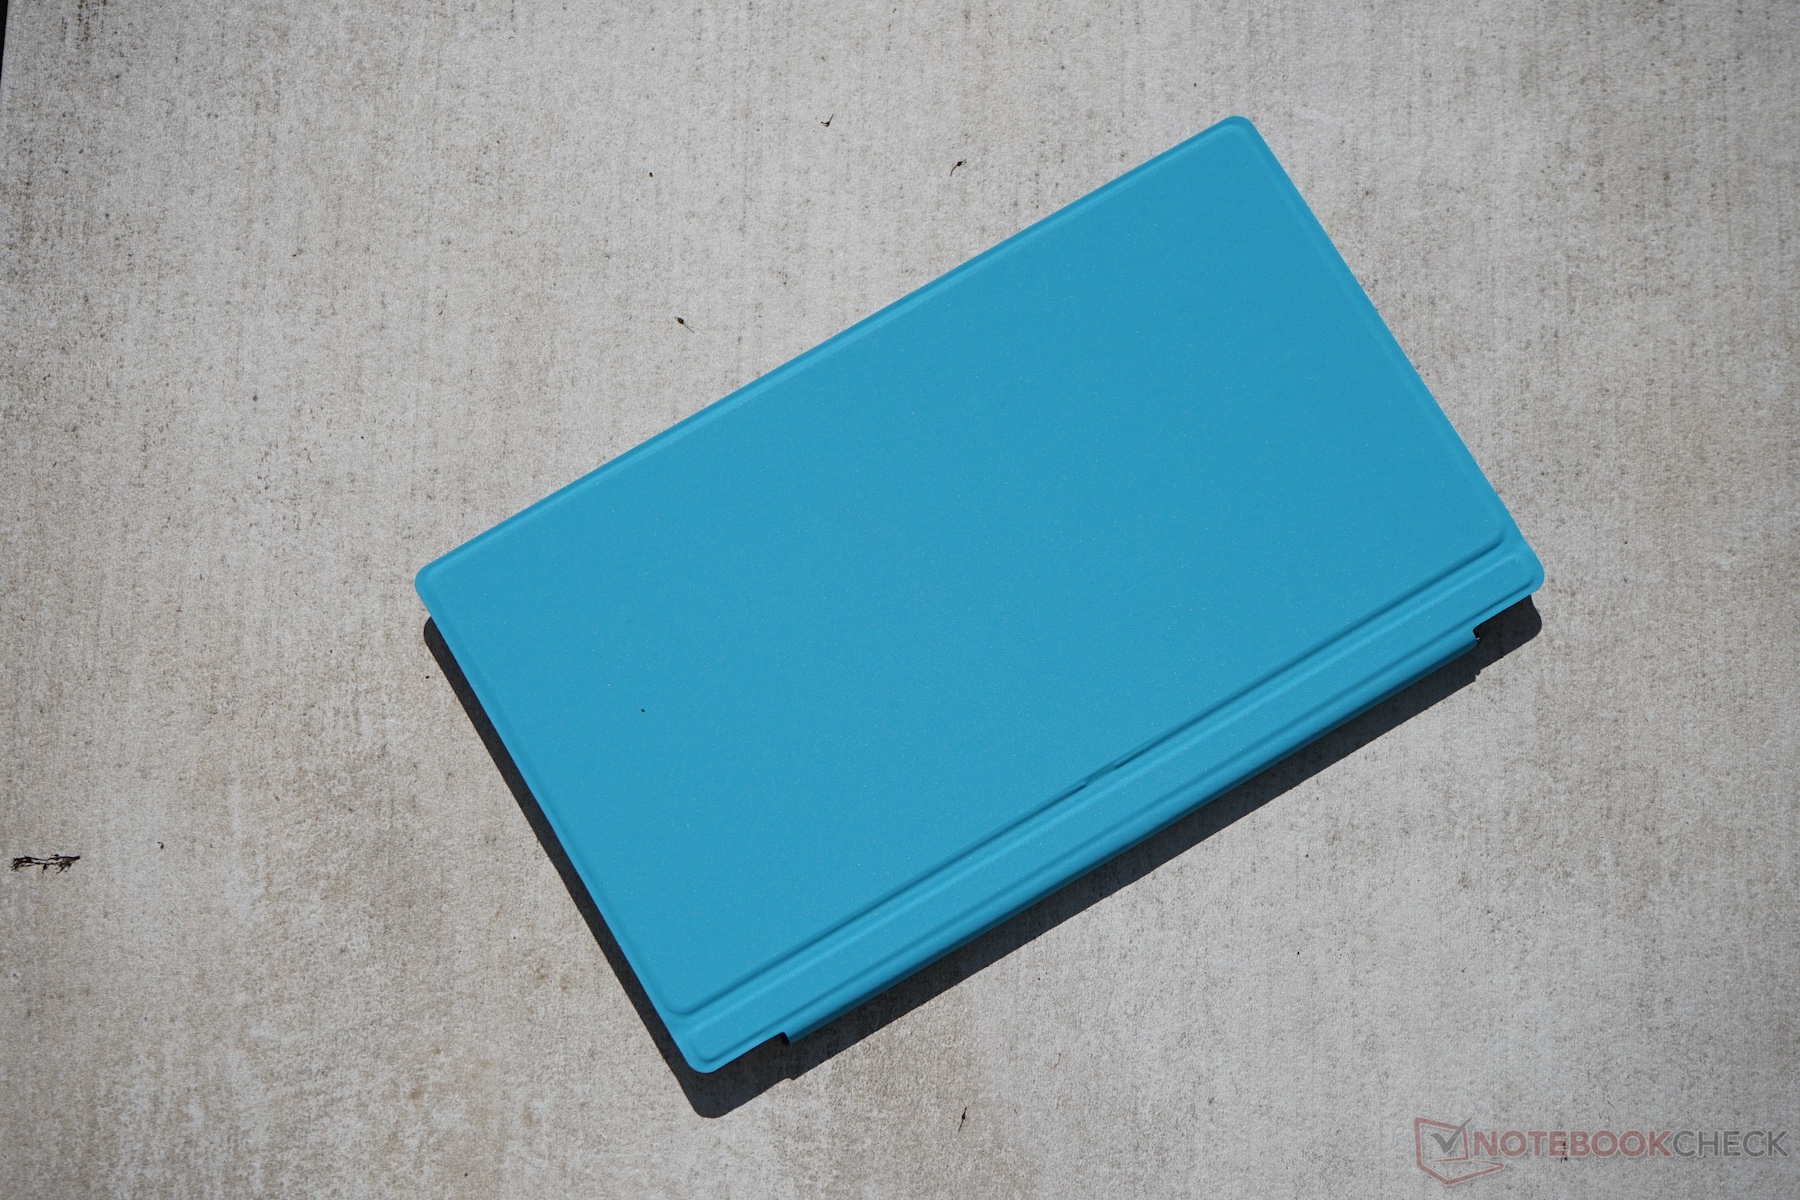
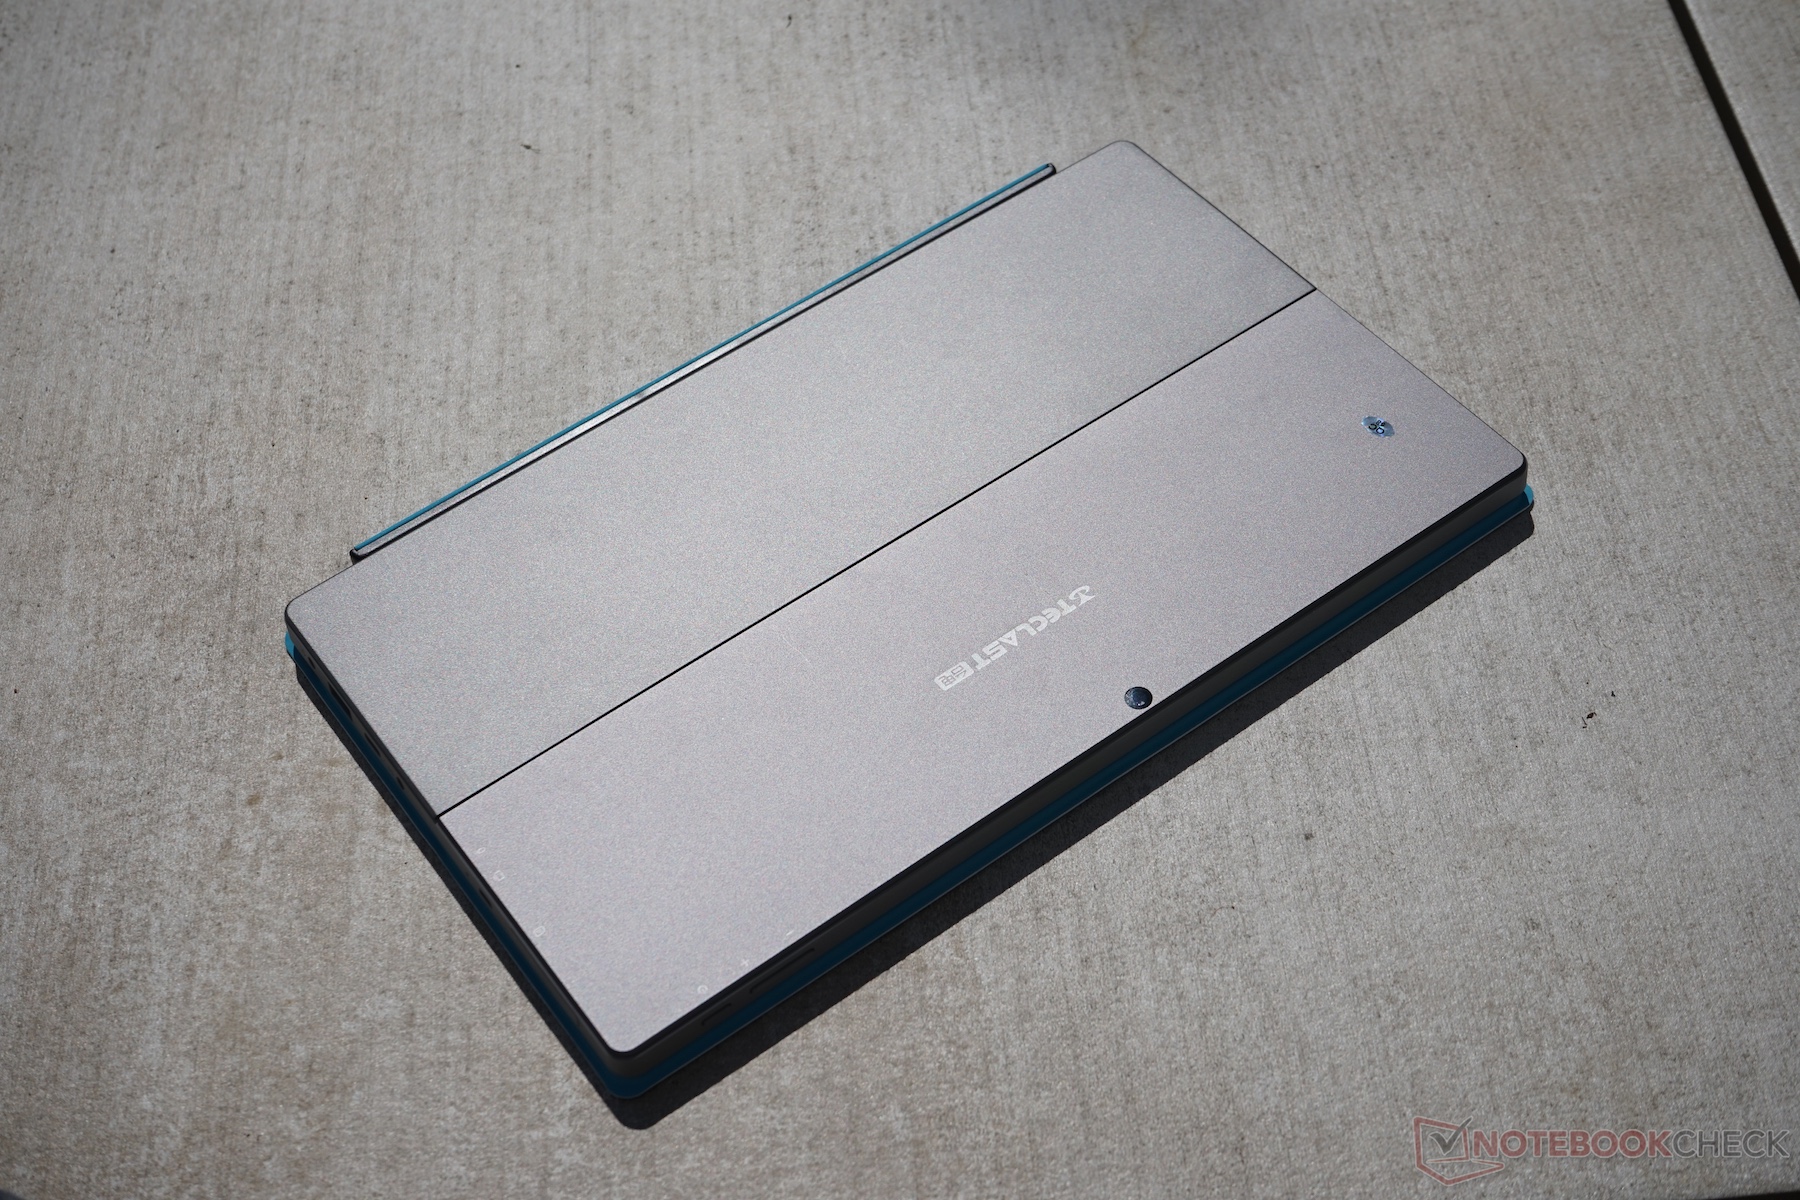
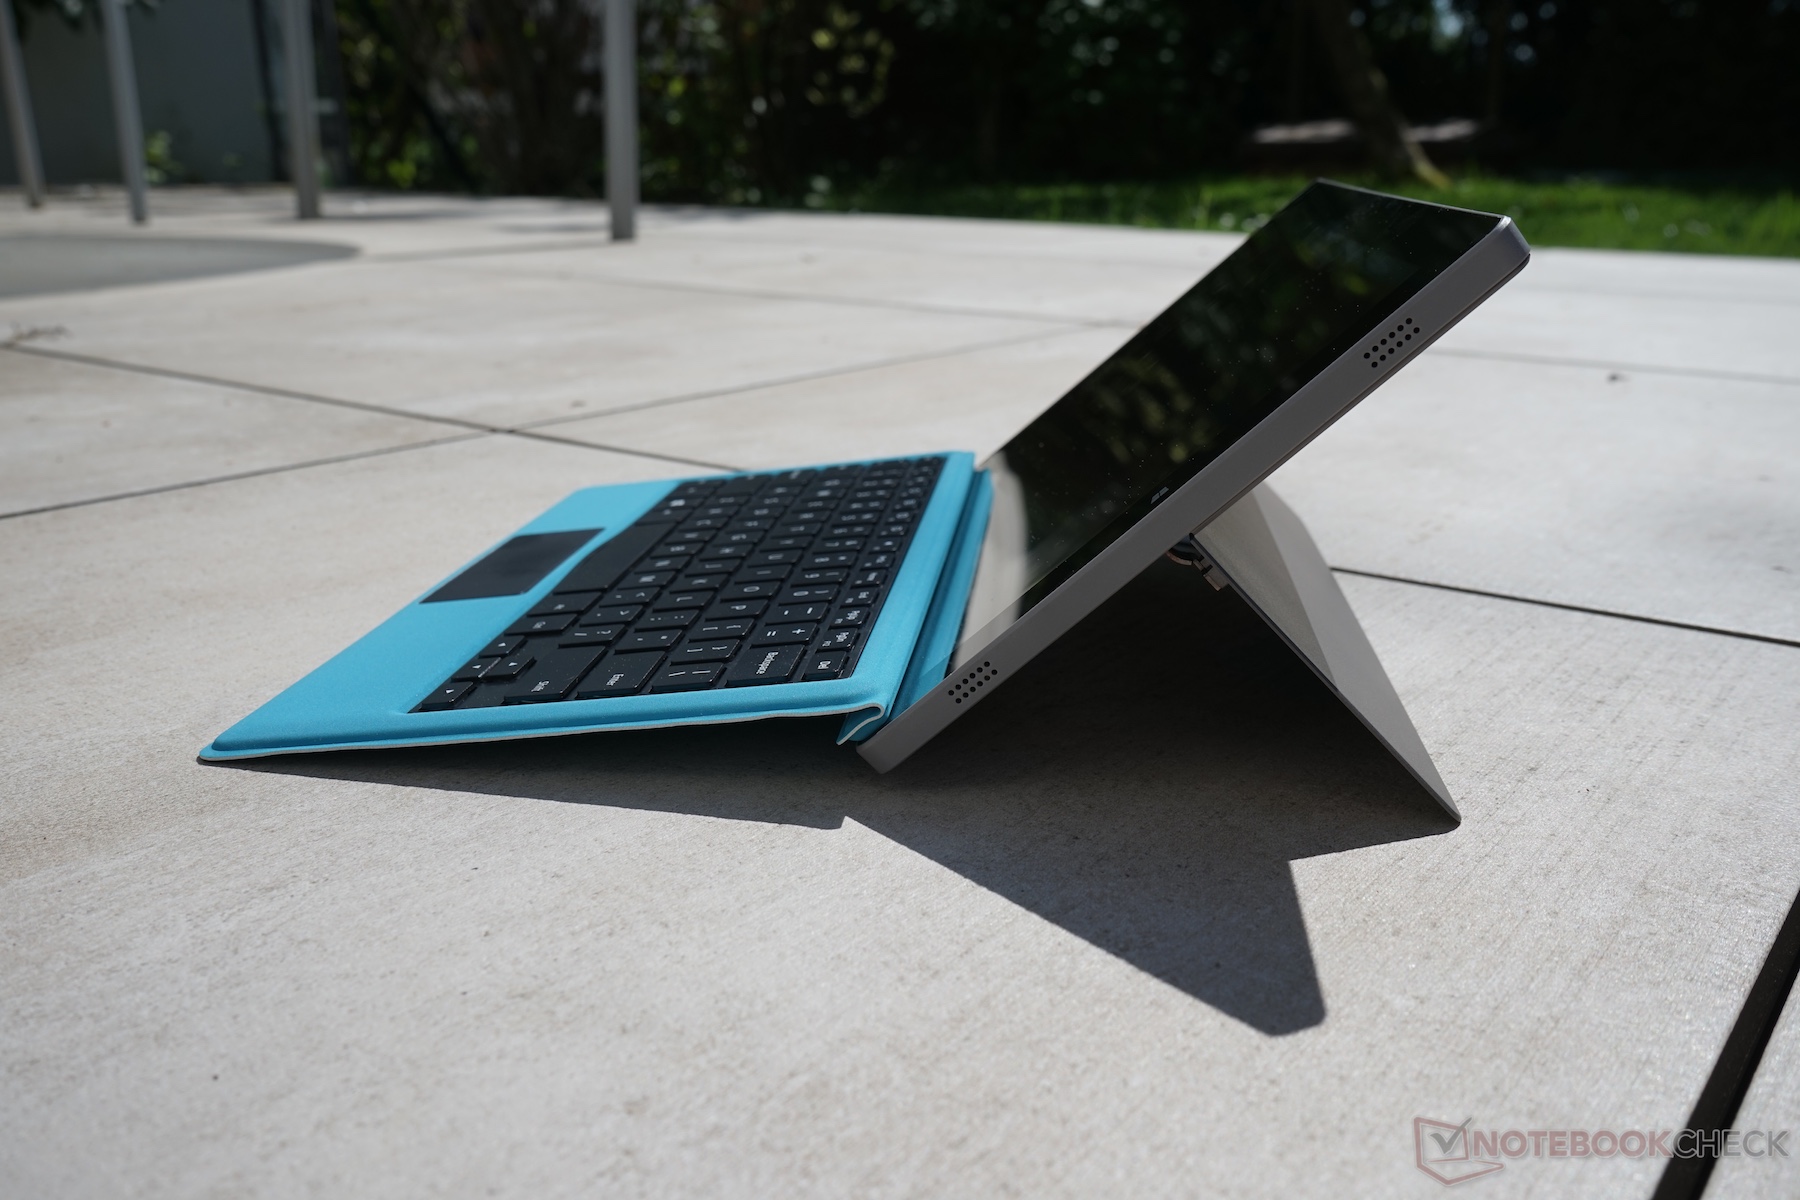
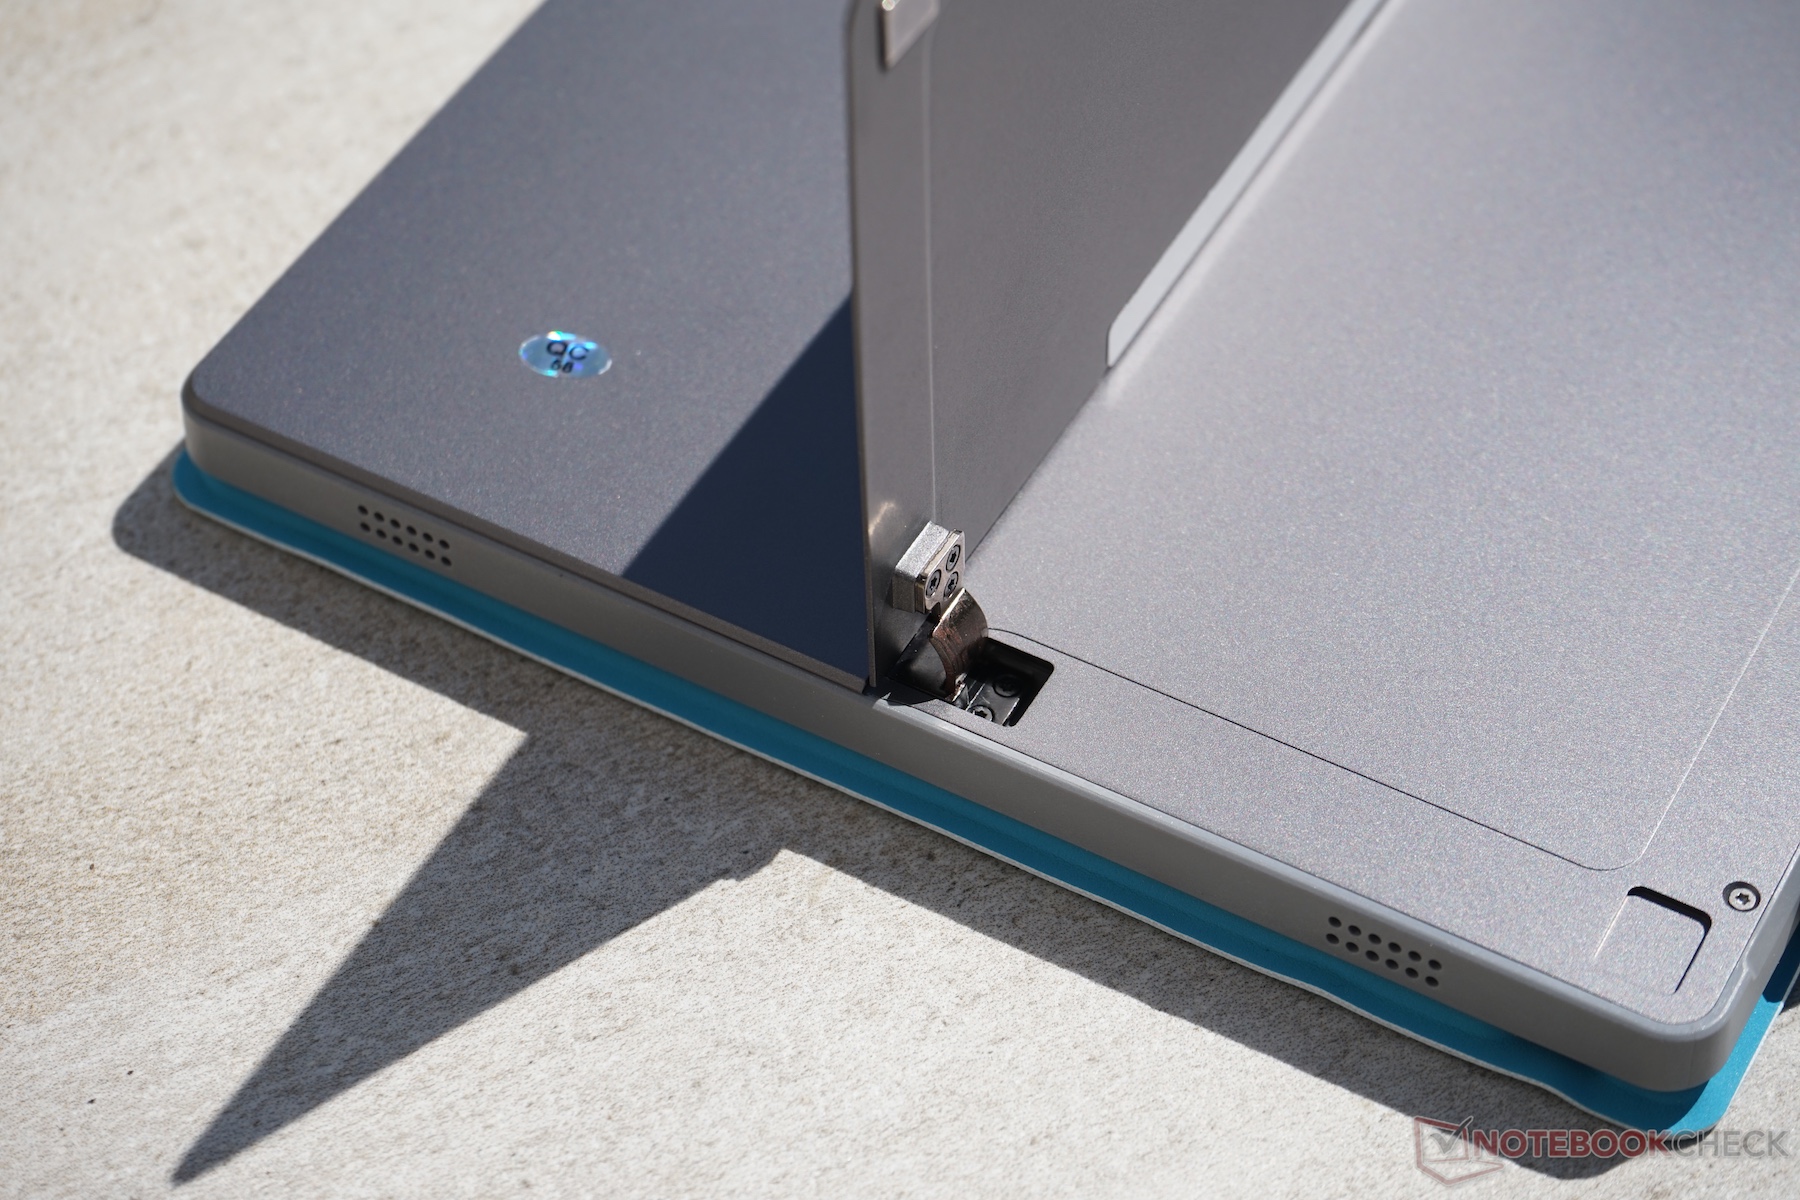
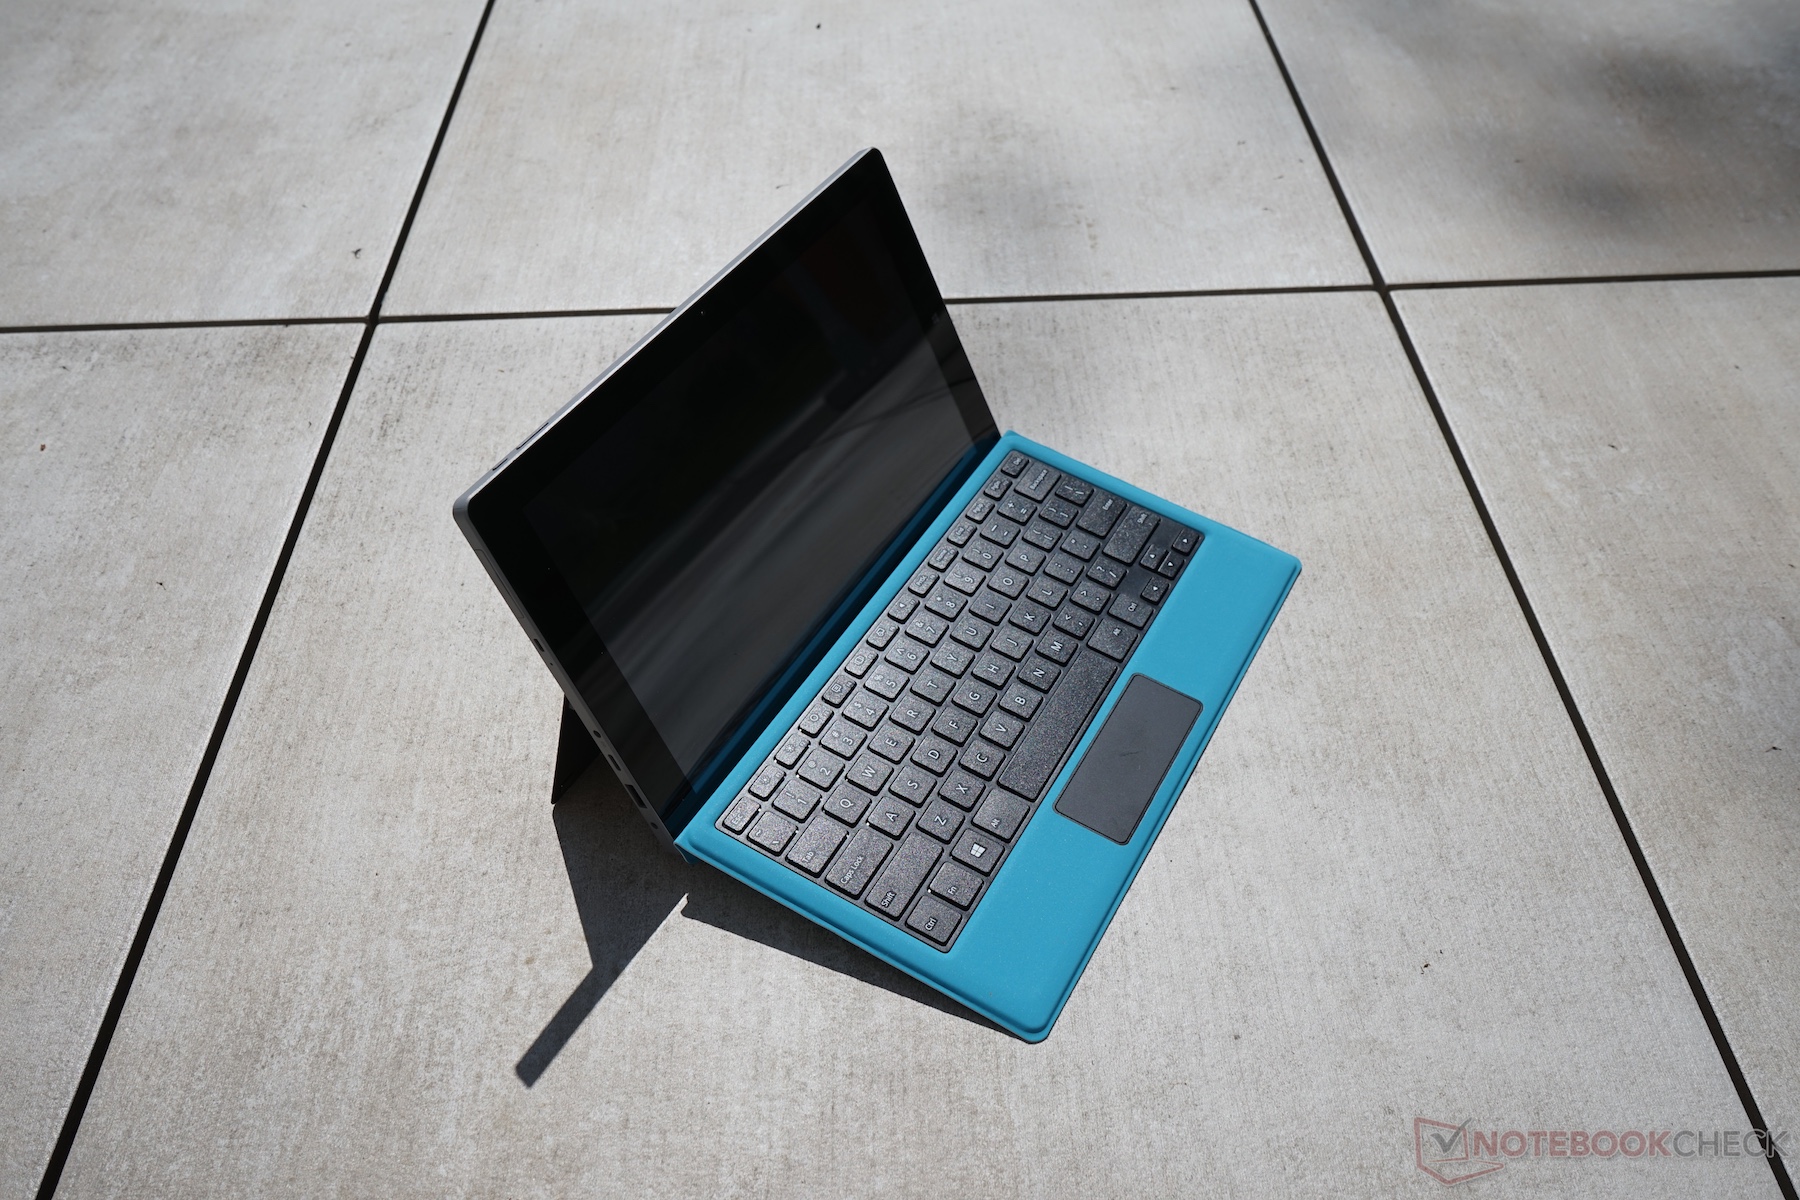
但是,它也有一些优点。尽管不合适在户外使用,它的屏幕也不算是太烂。外壳的坚固程度是极为出色的,并且有着很好的触感。我们喜欢完全静音的系统(无风扇,无高频啸叫),且其MicroSD读卡器速度相对来说比较快。
我们通过Gearbest从中国直接获得了我们的评测样机,它的售价约为310美元。若需要键盘扩展坞则需要再加35美元,若不考虑它的缺点,是很值得推荐的。
注:本文是基于完整评测的缩减版本,阅读完整的英文评测,请点击这里。
Teclast Tbook 16 Power
- 05/15/2017 v6 (old)
Klaus Hinum
Price comparison
