联想IdeaPad 5 15IIL05笔记本电脑评测:性能续航双丰收——感谢70-Wh的电池
Rating | Date | Model | Weight | Height | Size | Resolution | Price |
|---|---|---|---|---|---|---|---|
| 83 % v7 (old) | 09 / 2020 | Lenovo IdeaPad 5 15IIL05 i5-1035G1, GeForce MX350 | 1.7 kg | 17.9 mm | 15.60" | 1920x1080 | |
| 81.5 % v7 (old) | Acer Aspire 5 A515-54G i5-10210U, GeForce MX250 | 1.7 kg | 17.9 mm | 15.60" | 1920x1080 | ||
| 83 % v6 (old) | 05 / 2020 | HP Pavilion 15-cs2019ng i5-8265U, GeForce MX250 | 1.9 kg | 18 mm | 15.60" | 1920x1080 | |
| 83.3 % v7 (old) | Schenker VIA 15 R5 3500U, Vega 8 | 1.4 kg | 17 mm | 15.60" | 1920x1080 | ||
| 75.4 % v7 (old) | HP Pavilion Gaming 15-ec0002ng R5 3550H, GeForce GTX 1050 Mobile | 2.3 kg | 23.5 mm | 15.60" | 1920x1080 |


| SD Card Reader | |
| average JPG Copy Test (av. of 3 runs) | |
| Average of class Multimedia (23 - 531, n=40, last 2 years) | |
| Lenovo Ideapad S540-15IML (Toshiba Exceria Pro SDXC 64 GB UHS-II) | |
| HP Pavilion 15-cs2019ng (Toshiba Exceria Pro SDXC 64 GB UHS-II) | |
| Schenker VIA 15 | |
| HP Pavilion Gaming 15-ec0002ng (Toshiba Exceria Pro SDXC 64 GB UHS-II) | |
| Lenovo IdeaPad 5 15IIL05 (Toshiba Exceria Pro SDXC 64 GB UHS-II) | |
| maximum AS SSD Seq Read Test (1GB) | |
| Average of class Multimedia (37.3 - 1455, n=39, last 2 years) | |
| Lenovo Ideapad S540-15IML (Toshiba Exceria Pro SDXC 64 GB UHS-II) | |
| HP Pavilion Gaming 15-ec0002ng (Toshiba Exceria Pro SDXC 64 GB UHS-II) | |
| Schenker VIA 15 (Toshiba Exceria Pro M501 64 GB UHS-II) | |
| HP Pavilion 15-cs2019ng (Toshiba Exceria Pro SDXC 64 GB UHS-II) | |
| Lenovo IdeaPad 5 15IIL05 (Toshiba Exceria Pro SDXC 64 GB UHS-II) | |
| Networking | |
| iperf3 transmit AX12 | |
| Schenker VIA 15 | |
| Average Intel Wi-Fi 6 AX201 (49.8 - 1775, n=324) | |
| Acer Aspire 5 A515-54G | |
| HP Pavilion Gaming 15-ec0002ng | |
| Lenovo IdeaPad 5 15IIL05 | |
| HP Pavilion 15-cs2019ng | |
| Lenovo Ideapad S540-15IML | |
| iperf3 receive AX12 | |
| Schenker VIA 15 | |
| Average Intel Wi-Fi 6 AX201 (136 - 1743, n=324) | |
| Lenovo IdeaPad 5 15IIL05 | |
| Acer Aspire 5 A515-54G | |
| HP Pavilion 15-cs2019ng | |
| HP Pavilion Gaming 15-ec0002ng | |
| Lenovo Ideapad S540-15IML | |


| |||||||||||||||||||||||||
Brightness Distribution: 88 %
Center on Battery: 344 cd/m²
Contrast: 1259:1 (Black: 0.27 cd/m²)
ΔE ColorChecker Calman: 6.62 | ∀{0.5-29.43 Ø4.71}
calibrated: 4.71
ΔE Greyscale Calman: 4.61 | ∀{0.09-98 Ø4.96}
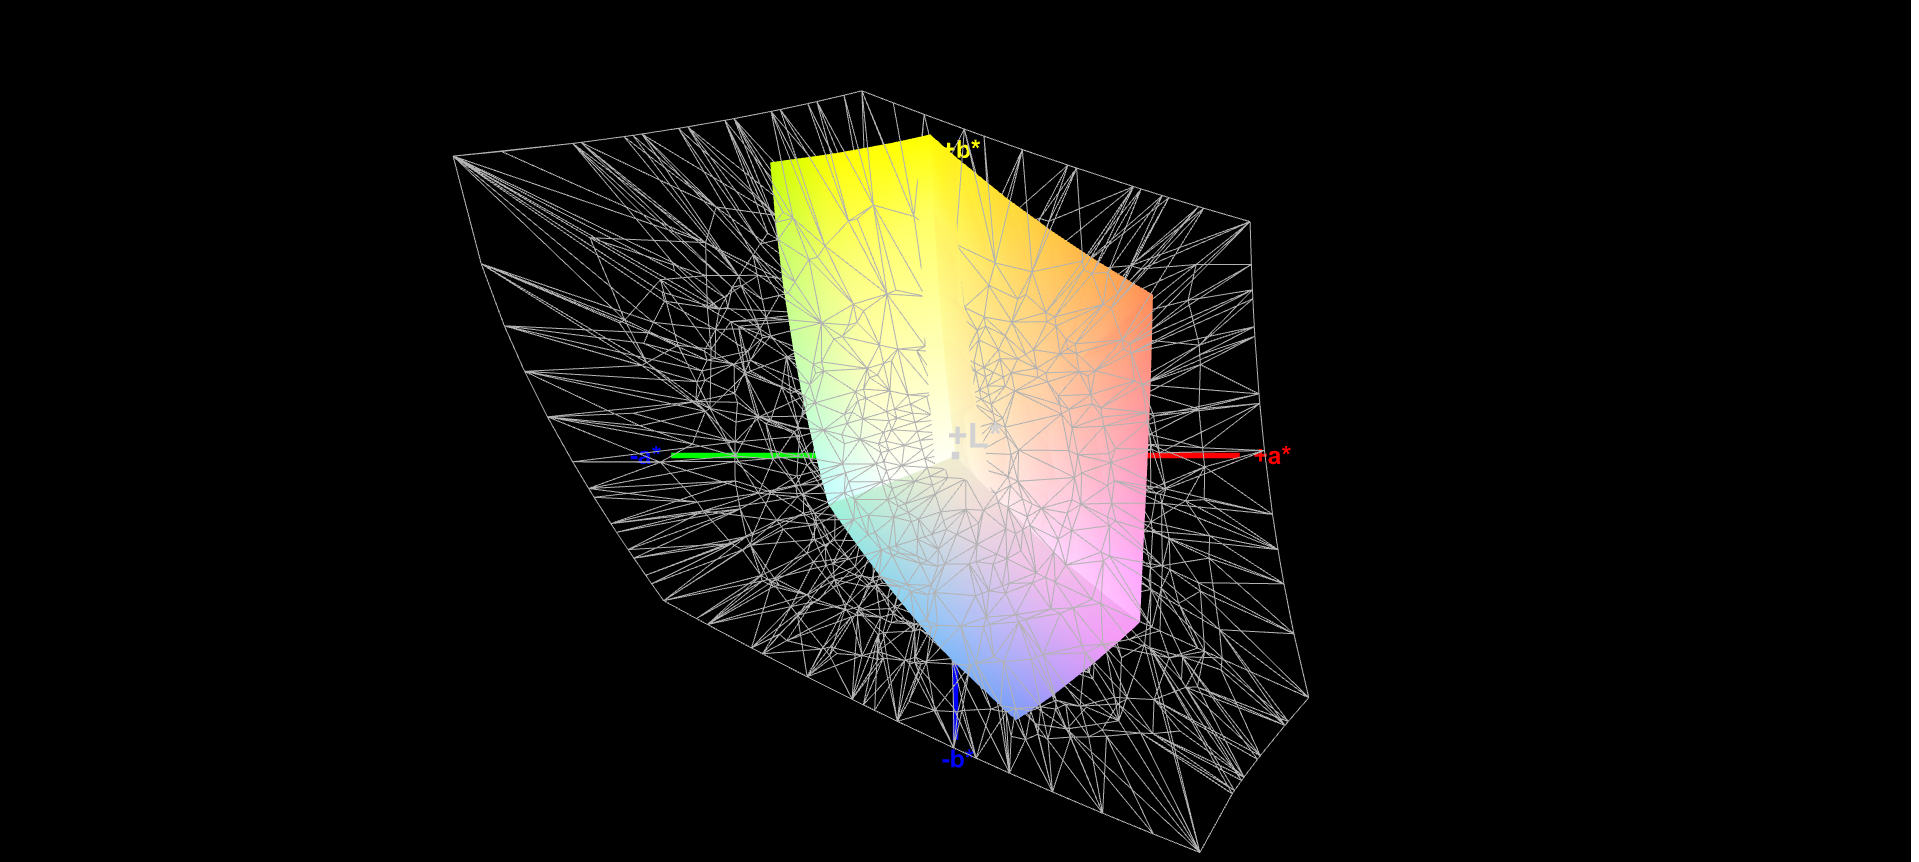
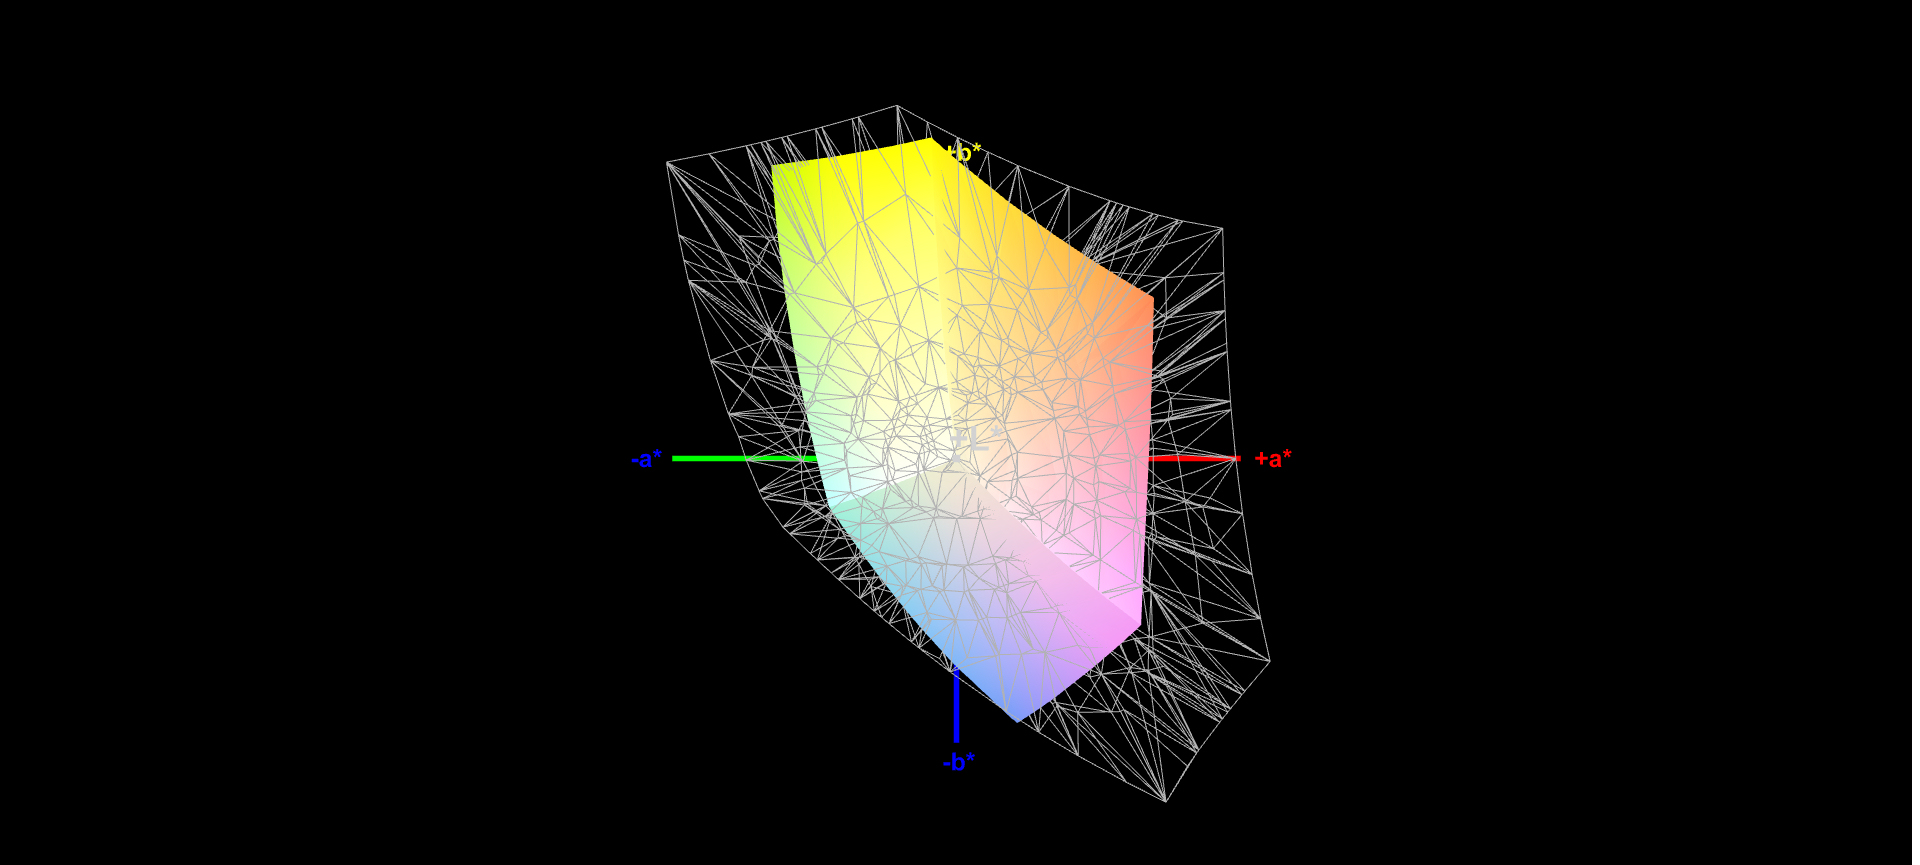
56% sRGB (Argyll 1.6.3 3D)
36% AdobeRGB 1998 (Argyll 1.6.3 3D)
38.88% AdobeRGB 1998 (Argyll 3D)
56.5% sRGB (Argyll 3D)
37.63% Display P3 (Argyll 3D)
Gamma: 2.74
CCT: 6262 K
| Lenovo IdeaPad 5 15IIL05 IPS, 1920x1080, 15.6" | Acer Aspire 5 A515-54G IPS, 1920x1080, 15.6" | HP Pavilion 15-cs2019ng IPS, 1920x1080, 15.6" | Schenker VIA 15 IPS, 1920x1080, 15.6" | HP Pavilion Gaming 15-ec0002ng TN LED, 1920x1080, 15.6" | Lenovo Ideapad S540-15IML IPS, 1920x1080, 15.6" | |
|---|---|---|---|---|---|---|
| Display | -10% | 67% | 81% | 10% | 65% | |
| Display P3 Coverage (%) | 37.63 | 33.78 -10% | 67.2 79% | 68.7 83% | 41.22 10% | 66.8 78% |
| sRGB Coverage (%) | 56.5 | 50.8 -10% | 88.1 56% | 99.8 77% | 61.8 9% | 86.5 53% |
| AdobeRGB 1998 Coverage (%) | 38.88 | 34.9 -10% | 64.4 66% | 70.9 82% | 42.62 10% | 63.2 63% |
| Response Times | 11% | -5% | 5% | 20% | -24% | |
| Response Time Grey 50% / Grey 80% * (ms) | 42 ? | 36 ? 14% | 43 ? -2% | 38.4 ? 9% | 44 ? -5% | 49.6 ? -18% |
| Response Time Black / White * (ms) | 27 ? | 25 ? 7% | 29 ? -7% | 26.8 ? 1% | 15 ? 44% | 34.8 ? -29% |
| PWM Frequency (Hz) | 208 ? | 25910 ? | 250 ? | 202 ? | ||
| Screen | 5% | 19% | 38% | -29% | 21% | |
| Brightness middle (cd/m²) | 340 | 248 -27% | 320 -6% | 296 -13% | 233 -31% | 299 -12% |
| Brightness (cd/m²) | 325 | 238 -27% | 293 -10% | 273 -16% | 211 -35% | 278 -14% |
| Brightness Distribution (%) | 88 | 86 -2% | 86 -2% | 81 -8% | 82 -7% | 87 -1% |
| Black Level * (cd/m²) | 0.27 | 0.23 15% | 0.26 4% | 0.25 7% | 0.405 -50% | 0.25 7% |
| Contrast (:1) | 1259 | 1078 -14% | 1231 -2% | 1184 -6% | 575 -54% | 1196 -5% |
| Colorchecker dE 2000 * | 6.62 | 5.05 24% | 4.5 32% | 1.7 74% | 8.22 -24% | 4.32 35% |
| Colorchecker dE 2000 max. * | 21.05 | 14.34 32% | 8.81 58% | 2.9 86% | 18.6 12% | 9.3 56% |
| Colorchecker dE 2000 calibrated * | 4.71 | 4.76 -1% | 0.8 83% | 2.58 45% | ||
| Greyscale dE 2000 * | 4.61 | 1.37 70% | 4.71 -2% | 2.1 54% | 10.13 -120% | 4.21 9% |
| Gamma | 2.74 80% | 2.4 92% | 2.45 90% | 2.31 95% | 2.27 97% | 2.39 92% |
| CCT | 6262 104% | 6592 99% | 7085 92% | 6759 96% | 11323 57% | 6799 96% |
| Color Space (Percent of AdobeRGB 1998) (%) | 36 | 32 -11% | 58 61% | 64.7 80% | 39 8% | 57 58% |
| Color Space (Percent of sRGB) (%) | 56 | 51 -9% | 88 57% | 99.8 78% | 62 11% | 86 54% |
| Total Average (Program / Settings) | 2% /
3% | 27% /
25% | 41% /
42% | 0% /
-15% | 21% /
24% |
* ... smaller is better
Display Response Times
| ↔ Response Time Black to White | ||
|---|---|---|
| 27 ms ... rise ↗ and fall ↘ combined | ↗ 16 ms rise | 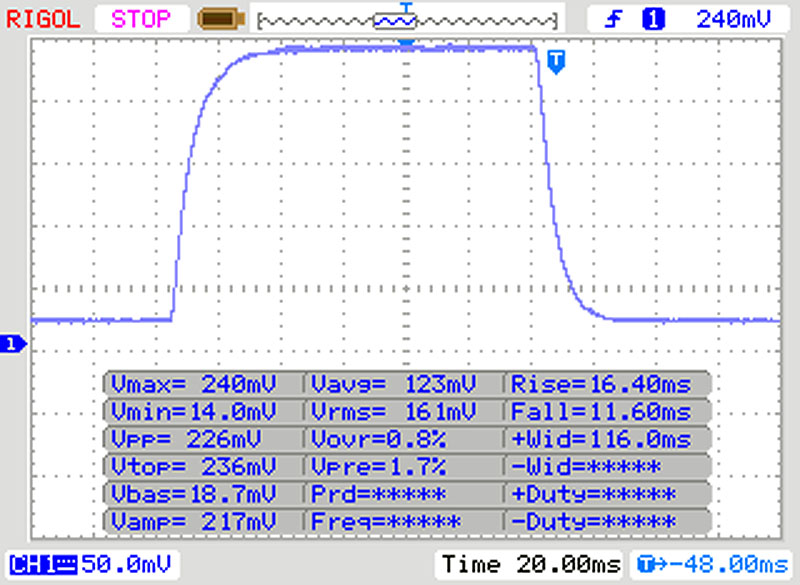 |
| ↘ 11 ms fall | ||
| The screen shows relatively slow response rates in our tests and may be too slow for gamers. In comparison, all tested devices range from 0.1 (minimum) to 240 (maximum) ms. » 67 % of all devices are better. This means that the measured response time is worse than the average of all tested devices (19.8 ms). | ||
| ↔ Response Time 50% Grey to 80% Grey | ||
| 42 ms ... rise ↗ and fall ↘ combined | ↗ 20 ms rise | 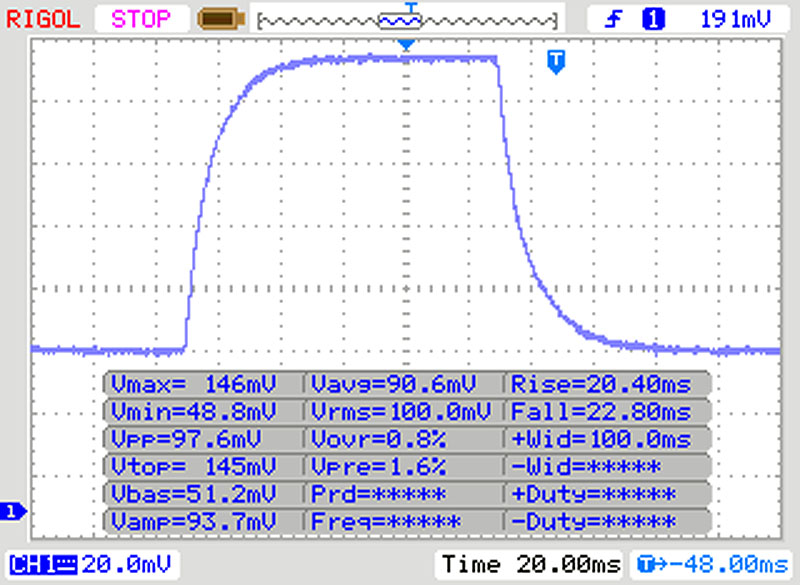 |
| ↘ 22 ms fall | ||
| The screen shows slow response rates in our tests and will be unsatisfactory for gamers. In comparison, all tested devices range from 0.165 (minimum) to 636 (maximum) ms. » 67 % of all devices are better. This means that the measured response time is worse than the average of all tested devices (31 ms). | ||
Screen Flickering / PWM (Pulse-Width Modulation)
| Screen flickering / PWM not detected |  | ||
In comparison: 52 % of all tested devices do not use PWM to dim the display. If PWM was detected, an average of 7747 (minimum: 5 - maximum: 343500) Hz was measured. | |||
| Cinebench R15 | |
| CPU Single 64Bit | |
| Average of class Multimedia (184.8 - 326, n=61, last 2 years) | |
| Lenovo Ideapad S540-15IML | |
| Lenovo IdeaPad 5 15IIL05 | |
| Average Intel Core i5-1035G1 (144 - 171, n=8) | |
| Acer Aspire 5 A515-54G | |
| HP Pavilion 15-cs2019ng | |
| HP Pavilion Gaming 15-ec0002ng | |
| Schenker VIA 15 | |
| CPU Multi 64Bit | |
| Average of class Multimedia (856 - 5224, n=63, last 2 years) | |
| Lenovo IdeaPad 5 15IIL05 | |
| HP Pavilion Gaming 15-ec0002ng | |
| Schenker VIA 15 | |
| Lenovo Ideapad S540-15IML | |
| Average Intel Core i5-1035G1 (518 - 803, n=11) | |
| Acer Aspire 5 A515-54G | |
| HP Pavilion 15-cs2019ng | |
| Blender - v2.79 BMW27 CPU | |
| Average Intel Core i5-1035G1 (607 - 1002, n=9) | |
| Acer Aspire 5 A515-54G | |
| Schenker VIA 15 | |
| Lenovo IdeaPad 5 15IIL05 | |
| Average of class Multimedia (100 - 557, n=60, last 2 years) | |
| 7-Zip 18.03 | |
| 7z b 4 -mmt1 | |
| Average of class Multimedia (3666 - 7545, n=58, last 2 years) | |
| Lenovo IdeaPad 5 15IIL05 | |
| Acer Aspire 5 A515-54G | |
| Average Intel Core i5-1035G1 (3739 - 4318, n=8) | |
| Schenker VIA 15 | |
| 7z b 4 | |
| Average of class Multimedia (26062 - 130368, n=57, last 2 years) | |
| Lenovo IdeaPad 5 15IIL05 | |
| Acer Aspire 5 A515-54G | |
| Schenker VIA 15 | |
| Average Intel Core i5-1035G1 (13236 - 20378, n=8) | |
| Cinebench R20 | |
| CPU (Single Core) | |
| Average of class Multimedia (425 - 853, n=59, last 2 years) | |
| Lenovo IdeaPad 5 15IIL05 | |
| Lenovo Ideapad S540-15IML | |
| Average Intel Core i5-1035G1 (382 - 431, n=7) | |
| Acer Aspire 5 A515-54G | |
| HP Pavilion Gaming 15-ec0002ng | |
| Schenker VIA 15 | |
| CPU (Multi Core) | |
| Average of class Multimedia (1887 - 12912, n=59, last 2 years) | |
| Lenovo IdeaPad 5 15IIL05 | |
| HP Pavilion Gaming 15-ec0002ng | |
| Schenker VIA 15 | |
| Lenovo Ideapad S540-15IML | |
| Average Intel Core i5-1035G1 (1178 - 1873, n=7) | |
| Acer Aspire 5 A515-54G | |
| Geekbench 5.5 | |
| Single-Core | |
| Average of class Multimedia (805 - 2974, n=58, last 2 years) | |
| Lenovo IdeaPad 5 15IIL05 | |
| Average Intel Core i5-1035G1 (1142 - 1240, n=7) | |
| Acer Aspire 5 A515-54G | |
| HP Pavilion Gaming 15-ec0002ng | |
| Schenker VIA 15 | |
| Multi-Core | |
| Average of class Multimedia (4652 - 20422, n=58, last 2 years) | |
| Lenovo IdeaPad 5 15IIL05 | |
| Average Intel Core i5-1035G1 (3337 - 4372, n=7) | |
| Acer Aspire 5 A515-54G | |
| HP Pavilion Gaming 15-ec0002ng | |
| Schenker VIA 15 | |
| HWBOT x265 Benchmark v2.2 - 4k Preset | |
| Average of class Multimedia (5.26 - 36.1, n=58, last 2 years) | |
| Lenovo IdeaPad 5 15IIL05 | |
| Acer Aspire 5 A515-54G | |
| Average Intel Core i5-1035G1 (3.32 - 6.44, n=8) | |
| Schenker VIA 15 | |
| LibreOffice - 20 Documents To PDF | |
| Acer Aspire 5 A515-54G | |
| Average Intel Core i5-1035G1 (55.3 - 70.9, n=6) | |
| Lenovo IdeaPad 5 15IIL05 | |
| Average of class Multimedia (23.9 - 146.7, n=59, last 2 years) | |
| R Benchmark 2.5 - Overall mean | |
| Schenker VIA 15 | |
| Average Intel Core i5-1035G1 (0.705 - 0.769, n=7) | |
| Acer Aspire 5 A515-54G | |
| Lenovo IdeaPad 5 15IIL05 | |
| Average of class Multimedia (0.3604 - 0.947, n=58, last 2 years) | |
* ... smaller is better
| PCMark 8 Home Score Accelerated v2 | 3641 points | |
| PCMark 8 Creative Score Accelerated v2 | 3816 points | |
| PCMark 8 Work Score Accelerated v2 | 5249 points | |
| PCMark 10 Score | 4113 points | |
Help | ||
| PCMark 8 | |
| Home Score Accelerated v2 | |
| Average of class Multimedia (n=1last 2 years) | |
| Lenovo IdeaPad 5 15IIL05 | |
| Average Intel Core i5-1035G1, NVIDIA GeForce MX350 (n=1) | |
| HP Pavilion 15-cs2019ng | |
| HP Pavilion Gaming 15-ec0002ng | |
| Work Score Accelerated v2 | |
| Lenovo IdeaPad 5 15IIL05 | |
| Average Intel Core i5-1035G1, NVIDIA GeForce MX350 (n=1) | |
| HP Pavilion 15-cs2019ng | |
| HP Pavilion Gaming 15-ec0002ng | |
| DPC Latencies / LatencyMon - interrupt to process latency (max), Web, Youtube, Prime95 | |
| Lenovo IdeaPad 5 15IIL05 | |
* ... smaller is better

| Lenovo IdeaPad 5 15IIL05 SK hynix BC511 HFM512GDHTNI-87A0B | Acer Aspire 5 A515-54G Kingston RBUSNS8154P3512GJ1 | HP Pavilion 15-cs2019ng Toshiba KBG30ZMV256G | Schenker VIA 15 Samsung SSD 970 EVO Plus 500GB | HP Pavilion Gaming 15-ec0002ng Intel SSD 660p SSDPEKNW512G8 | Lenovo Ideapad S540-15IML Samsung SSD PM981a MZVLB512HBJQ | Average SK hynix BC511 HFM512GDHTNI-87A0B | |
|---|---|---|---|---|---|---|---|
| CrystalDiskMark 5.2 / 6 | -13% | -18% | 61% | -9% | 31% | -6% | |
| Write 4K (MB/s) | 159.7 | 100.4 -37% | 149.3 -7% | 164.5 3% | 136.9 -14% | 170.7 7% | 135.9 ? -15% |
| Read 4K (MB/s) | 48.31 | 47.16 -2% | 52.7 9% | 46.88 -3% | 57 18% | 49.51 2% | 45.3 ? -6% |
| Write Seq (MB/s) | 1038 | 993 -4% | 667 -36% | 2659 156% | 968 -7% | 1156 11% | 1057 ? 2% |
| Read Seq (MB/s) | 1158 | 1176 2% | 818 -29% | 2623 127% | 1631 41% | 1136 -2% | 1144 ? -1% |
| Write 4K Q32T1 (MB/s) | 493.9 | 354.7 -28% | 332.1 -33% | 310.9 -37% | 237 -52% | 420.5 -15% | 458 ? -7% |
| Read 4K Q32T1 (MB/s) | 522 | 473 -9% | 467.1 -11% | 351.2 -33% | 337.1 -35% | 527 1% | 425 ? -19% |
| Write Seq Q32T1 (MB/s) | 1028 | 1034 1% | 985 -4% | 3236 215% | 963 -6% | 2984 190% | 1040 ? 1% |
| Read Seq Q32T1 (MB/s) | 2280 | 1635 -28% | 1454 -36% | 3547 56% | 1863 -18% | 3550 56% | 2274 ? 0% |
Dauerleistung Lesen: DiskSpd Read Loop, Queue Depth 8
| 3DMark 11 Performance | 6569 points | |
| 3DMark Ice Storm Standard Score | 80377 points | |
| 3DMark Cloud Gate Standard Score | 16929 points | |
| 3DMark Fire Strike Score | 4036 points | |
| 3DMark Time Spy Score | 1522 points | |
Help | ||
| 3DMark 11 - 1280x720 Performance GPU | |
| Average of class Multimedia (3749 - 60002, n=58, last 2 years) | |
| HP Pavilion Gaming 15-ec0002ng | |
| Lenovo IdeaPad 5 15IIL05 | |
| Average NVIDIA GeForce MX350 (5191 - 6540, n=13) | |
| Lenovo Ideapad S540-15IML | |
| HP Pavilion 15-cs2019ng | |
| Schenker VIA 15 | |
| 3DMark | |
| 1280x720 Cloud Gate Standard Graphics | |
| Average of class Multimedia (16765 - 143501, n=33, last 2 years) | |
| HP Pavilion Gaming 15-ec0002ng | |
| Average NVIDIA GeForce MX350 (23194 - 26239, n=9) | |
| Lenovo IdeaPad 5 15IIL05 | |
| Lenovo Ideapad S540-15IML | |
| HP Pavilion 15-cs2019ng | |
| 1920x1080 Fire Strike Graphics | |
| Average of class Multimedia (2328 - 48907, n=61, last 2 years) | |
| HP Pavilion Gaming 15-ec0002ng | |
| Lenovo IdeaPad 5 15IIL05 | |
| Average NVIDIA GeForce MX350 (3999 - 4656, n=14) | |
| Lenovo Ideapad S540-15IML | |
| HP Pavilion 15-cs2019ng | |
| Acer Aspire 5 A515-54G | |
| 2560x1440 Time Spy Graphics | |
| Average of class Multimedia (696 - 19403, n=62, last 2 years) | |
| HP Pavilion Gaming 15-ec0002ng | |
| Lenovo IdeaPad 5 15IIL05 | |
| Average NVIDIA GeForce MX350 (1123 - 1595, n=12) | |
| Lenovo Ideapad S540-15IML | |
| The Witcher 3 - 1366x768 Medium Graphics & Postprocessing | |
| HP Pavilion Gaming 15-ec0002ng | |
| Average of class Multimedia (41 - 93, n=3, last 2 years) | |
| Lenovo IdeaPad 5 15IIL05 | |
| Average NVIDIA GeForce MX350 (35.2 - 51.9, n=13) | |
| HP Pavilion 15-cs2019ng | |
| Lenovo Ideapad S540-15IML | |
| Acer Aspire 5 A515-54G | |
| BioShock Infinite - 1366x768 High Preset | |
| HP Pavilion Gaming 15-ec0002ng | |
| Average NVIDIA GeForce MX350 (110.6 - 111.4, n=2) | |
| Lenovo IdeaPad 5 15IIL05 | |
| HP Pavilion 15-cs2019ng | |
| Shadow of the Tomb Raider - 1280x720 Lowest Preset | |
| Average of class Multimedia (66 - 204, n=7, last 2 years) | |
| Lenovo IdeaPad 5 15IIL05 | |
| HP Pavilion Gaming 15-ec0002ng | |
| Average NVIDIA GeForce MX350 (54.3 - 68, n=4) | |
| Control - 1280x720 Low Quality Preset | |
| HP Pavilion Gaming 15-ec0002ng | |
| Lenovo IdeaPad 5 15IIL05 | |
| Average NVIDIA GeForce MX350 (51.6 - 53.2, n=2) | |
| Lenovo Ideapad S540-15IML | |
| Fortnite - 1920x1080 High Preset | |
| Average NVIDIA GeForce MX350 (42.7 - 43.8, n=2) | |
| Lenovo IdeaPad 5 15IIL05 | |
| Call of Duty Modern Warfare 2019 - 1280x720 Minimum Settings | |
| HP Pavilion Gaming 15-ec0002ng | |
| Average NVIDIA GeForce MX350 (50.3 - 54.7, n=2) | |
| Lenovo IdeaPad 5 15IIL05 | |
| Lenovo Ideapad S540-15IML | |
| Red Dead Redemption 2 - 1280x720 Minimum Settings | |
| HP Pavilion Gaming 15-ec0002ng | |
| Lenovo IdeaPad 5 15IIL05 | |
| Average NVIDIA GeForce MX350 (27 - 42.1, n=2) | |
| Lenovo Ideapad S540-15IML | |
| low | med. | high | ultra | |
|---|---|---|---|---|
| Counter-Strike: GO (2012) | 252 | 228.4 | 204.9 | 120.1 |
| BioShock Infinite (2013) | 222.6 | 132.4 | 110.6 | 43.2 |
| GTA V (2015) | 146 | 136.4 | 47 | 9.1 |
| The Witcher 3 (2015) | 80.5 | 46.2 | 27.8 | 16.4 |
| Dota 2 Reborn (2015) | 102.8 | 93.8 | 83.3 | 76.3 |
| Overwatch (2016) | 192.2 | 143.9 | 64 | 42.5 |
| Rocket League (2017) | 220 | 105.8 | 74.4 | |
| Fortnite (2018) | 138.8 | 87.8 | 42.7 | 27 |
| X-Plane 11.11 (2018) | 55.9 | 50 | 45.4 | |
| World of Tanks enCore (2018) | 346.8 | 103.8 | 39.8 | |
| Far Cry 5 (2018) | 59 | 24 | 22 | 20 |
| Shadow of the Tomb Raider (2018) | 68 | 24 | 18 | 14 |
| Assassin´s Creed Odyssey (2018) | 49 | 22 | 12 | |
| Battlefield V (2018) | 73.7 | 37.6 | 29.9 | 23.2 |
| Farming Simulator 19 (2018) | 158.7 | 88.6 | 52.6 | 38.5 |
| Apex Legends (2019) | 94 | 40.6 | 32.6 | 27.4 |
| Far Cry New Dawn (2019) | 56 | 28 | 26 | 22 |
| Metro Exodus (2019) | 39.1 | 14.9 | 12 | 8.6 |
| Dirt Rally 2.0 (2019) | 116.4 | 40.3 | 33.6 | 15.5 |
| The Division 2 (2019) | 53 | 28 | 22 | 13 |
| Anno 1800 (2019) | 79.4 | 35.5 | 20.7 | 11 |
| Rage 2 (2019) | 44 | 16.2 | 14.7 | 14.1 |
| Total War: Three Kingdoms (2019) | 91.9 | 30.1 | 11.9 | 6.7 |
| F1 2019 (2019) | 110 | 49 | 39 | 33 |
| Control (2019) | 53.2 | 18.1 | 12.7 | |
| Borderlands 3 (2019) | 68.2 | 26.3 | 17 | 14.7 |
| Ghost Recon Breakpoint (2019) | 44 | 19 | 15 | |
| GRID 2019 (2019) | 71.9 | 26.4 | 17.8 | |
| Call of Duty Modern Warfare 2019 (2019) | 50.3 | 31.4 | 21.2 | 17.3 |
| Need for Speed Heat (2019) | 51.5 | 29.2 | 24.9 | 21.7 |
| Star Wars Jedi Fallen Order (2019) | 36.9 | 28.3 | 24 | |
| Red Dead Redemption 2 (2019) | 42.1 | 16.7 | ||
| Escape from Tarkov (2020) | 73.9 | 35.2 | 36.8 | 22.1 |
| Hunt Showdown (2020) | 59.1 | 25.7 | 21.6 | |
| Gears Tactics (2020) | 141.5 | 52.1 | 32.7 | 21.7 |
Noise level
| Idle |
| 30.7 / 30.7 / 30.7 dB(A) |
| Load |
| 43.4 / 43.7 dB(A) |
 | ||
30 dB silent 40 dB(A) audible 50 dB(A) loud |
||
min: | ||
| Lenovo IdeaPad 5 15IIL05 i5-1035G1, GeForce MX350 | Acer Aspire 5 A515-54G i5-10210U, GeForce MX250 | HP Pavilion 15-cs2019ng i5-8265U, GeForce MX250 | Schenker VIA 15 R5 3500U, Vega 8 | HP Pavilion Gaming 15-ec0002ng R5 3550H, GeForce GTX 1050 Mobile | Lenovo Ideapad S540-15IML i5-10210U, GeForce MX250 | Average NVIDIA GeForce MX350 | Average of class Multimedia | |
|---|---|---|---|---|---|---|---|---|
| Noise | 6% | -1% | 9% | 2% | -0% | 10% | 14% | |
| off / environment * (dB) | 30.7 | 29.8 3% | 30.5 1% | 29.4 4% | 30.3 1% | 30 2% | 26.6 ? 13% | 24.2 ? 21% |
| Idle Minimum * (dB) | 30.7 | 29.8 3% | 31.5 -3% | 29.6 4% | 30.3 1% | 30 2% | 26.6 ? 13% | 24.3 ? 21% |
| Idle Average * (dB) | 30.7 | 29.8 3% | 31.5 -3% | 29.6 4% | 30.3 1% | 32 -4% | 26.7 ? 13% | 24.7 ? 20% |
| Idle Maximum * (dB) | 30.7 | 29.8 3% | 31.5 -3% | 29.6 4% | 31 -1% | 37 -21% | 27.5 ? 10% | 26.4 ? 14% |
| Load Average * (dB) | 43.4 | 37.3 14% | 42.5 2% | 33.4 23% | 39.3 9% | 41 6% | 40.3 ? 7% | 37.4 ? 14% |
| Witcher 3 ultra * (dB) | 43.2 | 42.9 1% | 39 10% | |||||
| Load Maximum * (dB) | 43.7 | 40.1 8% | 42.5 3% | 38.1 13% | 43.3 1% | 42 4% | 43 ? 2% | 46.2 ? -6% |
* ... smaller is better
(±) The maximum temperature on the upper side is 43.1 °C / 110 F, compared to the average of 36.8 °C / 98 F, ranging from 21 to 71 °C for the class Multimedia.
(-) The bottom heats up to a maximum of 50.9 °C / 124 F, compared to the average of 39.1 °C / 102 F
(+) In idle usage, the average temperature for the upper side is 26.8 °C / 80 F, compared to the device average of 31.3 °C / 88 F.
(±) Playing The Witcher 3, the average temperature for the upper side is 37 °C / 99 F, compared to the device average of 31.3 °C / 88 F.
(+) The palmrests and touchpad are cooler than skin temperature with a maximum of 28.7 °C / 83.7 F and are therefore cool to the touch.
(±) The average temperature of the palmrest area of similar devices was 28.7 °C / 83.7 F (0 °C / 0 F).
| Lenovo IdeaPad 5 15IIL05 i5-1035G1, GeForce MX350 | Acer Aspire 5 A515-54G i5-10210U, GeForce MX250 | HP Pavilion 15-cs2019ng i5-8265U, GeForce MX250 | Schenker VIA 15 R5 3500U, Vega 8 | HP Pavilion Gaming 15-ec0002ng R5 3550H, GeForce GTX 1050 Mobile | Lenovo Ideapad S540-15IML i5-10210U, GeForce MX250 | Average NVIDIA GeForce MX350 | Average of class Multimedia | |
|---|---|---|---|---|---|---|---|---|
| Heat | 10% | 6% | 8% | 13% | 11% | 4% | 9% | |
| Maximum Upper Side * (°C) | 43.1 | 41.3 4% | 46 -7% | 44.5 -3% | 41 5% | 42 3% | 44.5 ? -3% | 41.1 ? 5% |
| Maximum Bottom * (°C) | 50.9 | 40 21% | 44.6 12% | 45.2 11% | 39.1 23% | 45 12% | 46.6 ? 8% | 43.7 ? 14% |
| Idle Upper Side * (°C) | 29 | 27.4 6% | 26.6 8% | 26.3 9% | 26 10% | 25 14% | 27.6 ? 5% | 27 ? 7% |
| Idle Bottom * (°C) | 31 | 28.6 8% | 27.4 12% | 27 13% | 26.5 15% | 26 16% | 29.4 ? 5% | 28 ? 10% |
* ... smaller is better
Lenovo IdeaPad 5 15IIL05 audio analysis
(-) | not very loud speakers (68.6 dB)
Bass 100 - 315 Hz
(-) | nearly no bass - on average 20.9% lower than median
(±) | linearity of bass is average (11.2% delta to prev. frequency)
Mids 400 - 2000 Hz
(+) | balanced mids - only 3.6% away from median
(±) | linearity of mids is average (10% delta to prev. frequency)
Highs 2 - 16 kHz
(+) | balanced highs - only 3.6% away from median
(+) | highs are linear (4.4% delta to prev. frequency)
Overall 100 - 16.000 Hz
(±) | linearity of overall sound is average (21.5% difference to median)
Compared to same class
» 76% of all tested devices in this class were better, 5% similar, 19% worse
» The best had a delta of 5%, average was 17%, worst was 45%
Compared to all devices tested
» 61% of all tested devices were better, 7% similar, 32% worse
» The best had a delta of 4%, average was 23%, worst was 134%
| Off / Standby | |
| Idle | |
| Load |
|
Key:
min: | |
| Lenovo IdeaPad 5 15IIL05 i5-1035G1, GeForce MX350 | Acer Aspire 5 A515-54G i5-10210U, GeForce MX250 | HP Pavilion 15-cs2019ng i5-8265U, GeForce MX250 | Schenker VIA 15 R5 3500U, Vega 8 | HP Pavilion Gaming 15-ec0002ng R5 3550H, GeForce GTX 1050 Mobile | Lenovo Ideapad S540-15IML i5-10210U, GeForce MX250 | Average NVIDIA GeForce MX350 | Average of class Multimedia | |
|---|---|---|---|---|---|---|---|---|
| Power Consumption | 27% | 15% | 11% | -5% | 10% | 10% | -22% | |
| Idle Minimum * (Watt) | 4.9 | 3.4 31% | 4.9 -0% | 5.7 -16% | 1.9 61% | 5 -2% | 3.97 ? 19% | 5.72 ? -17% |
| Idle Average * (Watt) | 9.1 | 6.4 30% | 7.9 13% | 9.1 -0% | 7.2 21% | 7 23% | 8.26 ? 9% | 10.2 ? -12% |
| Idle Maximum * (Watt) | 11.6 | 9.2 21% | 10.1 13% | 9.6 17% | 9.6 17% | 10 14% | 10.7 ? 8% | 12.4 ? -7% |
| Load Average * (Watt) | 65 | 38 42% | 60 8% | 33.3 49% | 74 -14% | 64 2% | 55.2 ? 15% | 65.5 ? -1% |
| Witcher 3 ultra * (Watt) | 59 | 75 -27% | 44 25% | |||||
| Load Maximum * (Watt) | 65.3 | 59 10% | 38 42% | 63.6 3% | 124 -90% | 67 -3% | 65.8 ? -1% | 114 ? -75% |
* ... smaller is better
| Lenovo IdeaPad 5 15IIL05 i5-1035G1, GeForce MX350, 70 Wh | Acer Aspire 5 A515-54G i5-10210U, GeForce MX250, 48 Wh | HP Pavilion 15-cs2019ng i5-8265U, GeForce MX250, 41 Wh | Schenker VIA 15 R5 3500U, Vega 8, 91 Wh | HP Pavilion Gaming 15-ec0002ng R5 3550H, GeForce GTX 1050 Mobile, 52.5 Wh | Lenovo Ideapad S540-15IML i5-10210U, GeForce MX250, 70 Wh | Average of class Multimedia | |
|---|---|---|---|---|---|---|---|
| Battery runtime | -22% | -55% | 18% | -26% | -1% | -3% | |
| Reader / Idle (h) | 23.2 | 8 -66% | 30.2 30% | 24.9 ? 7% | |||
| H.264 (h) | 16.1 | 16.4 ? 2% | |||||
| WiFi v1.3 (h) | 11.4 | 8.9 -22% | 5 -56% | 13.4 18% | 8.4 -26% | 12.1 6% | 12.2 ? 7% |
| Load (h) | 2.3 | 1.3 -43% | 1.4 -39% | 1.668 ? -27% |
Pros
Cons
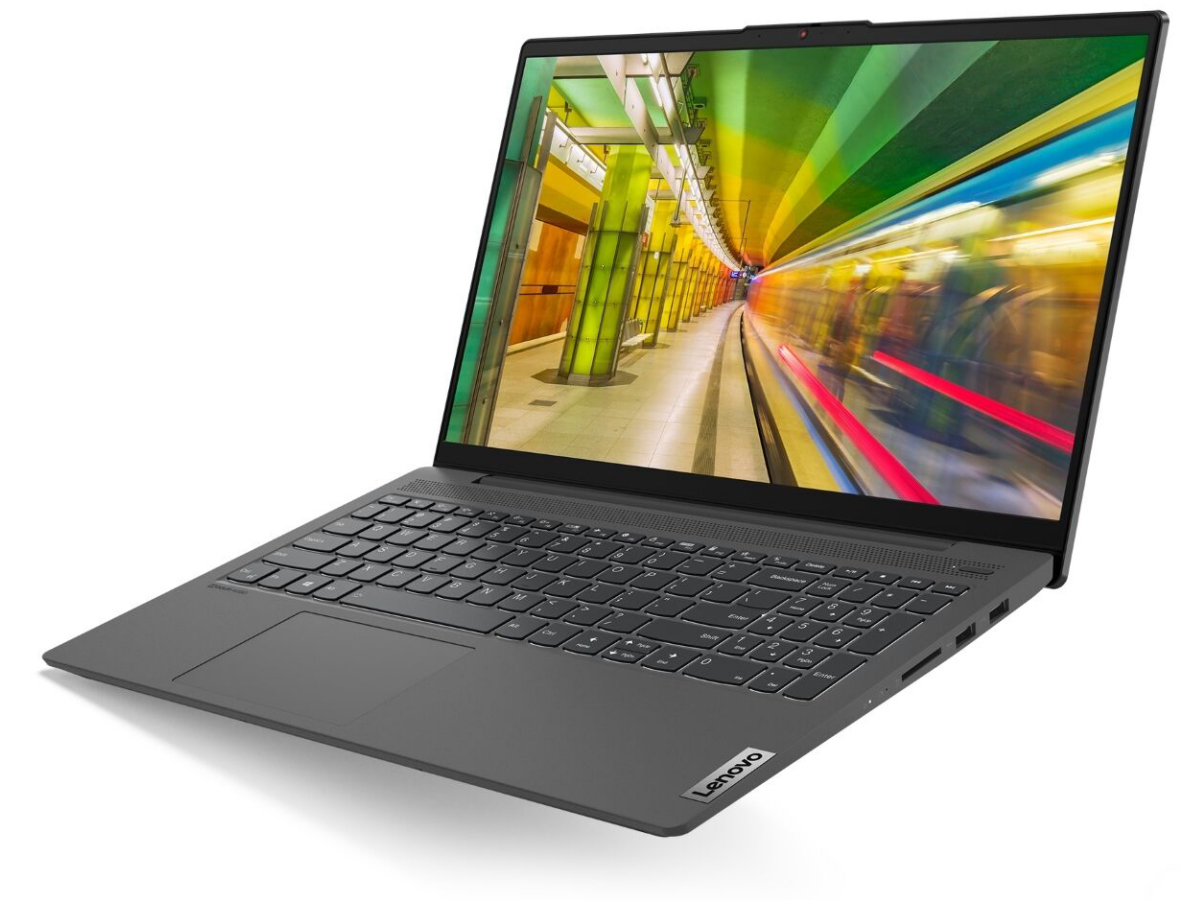
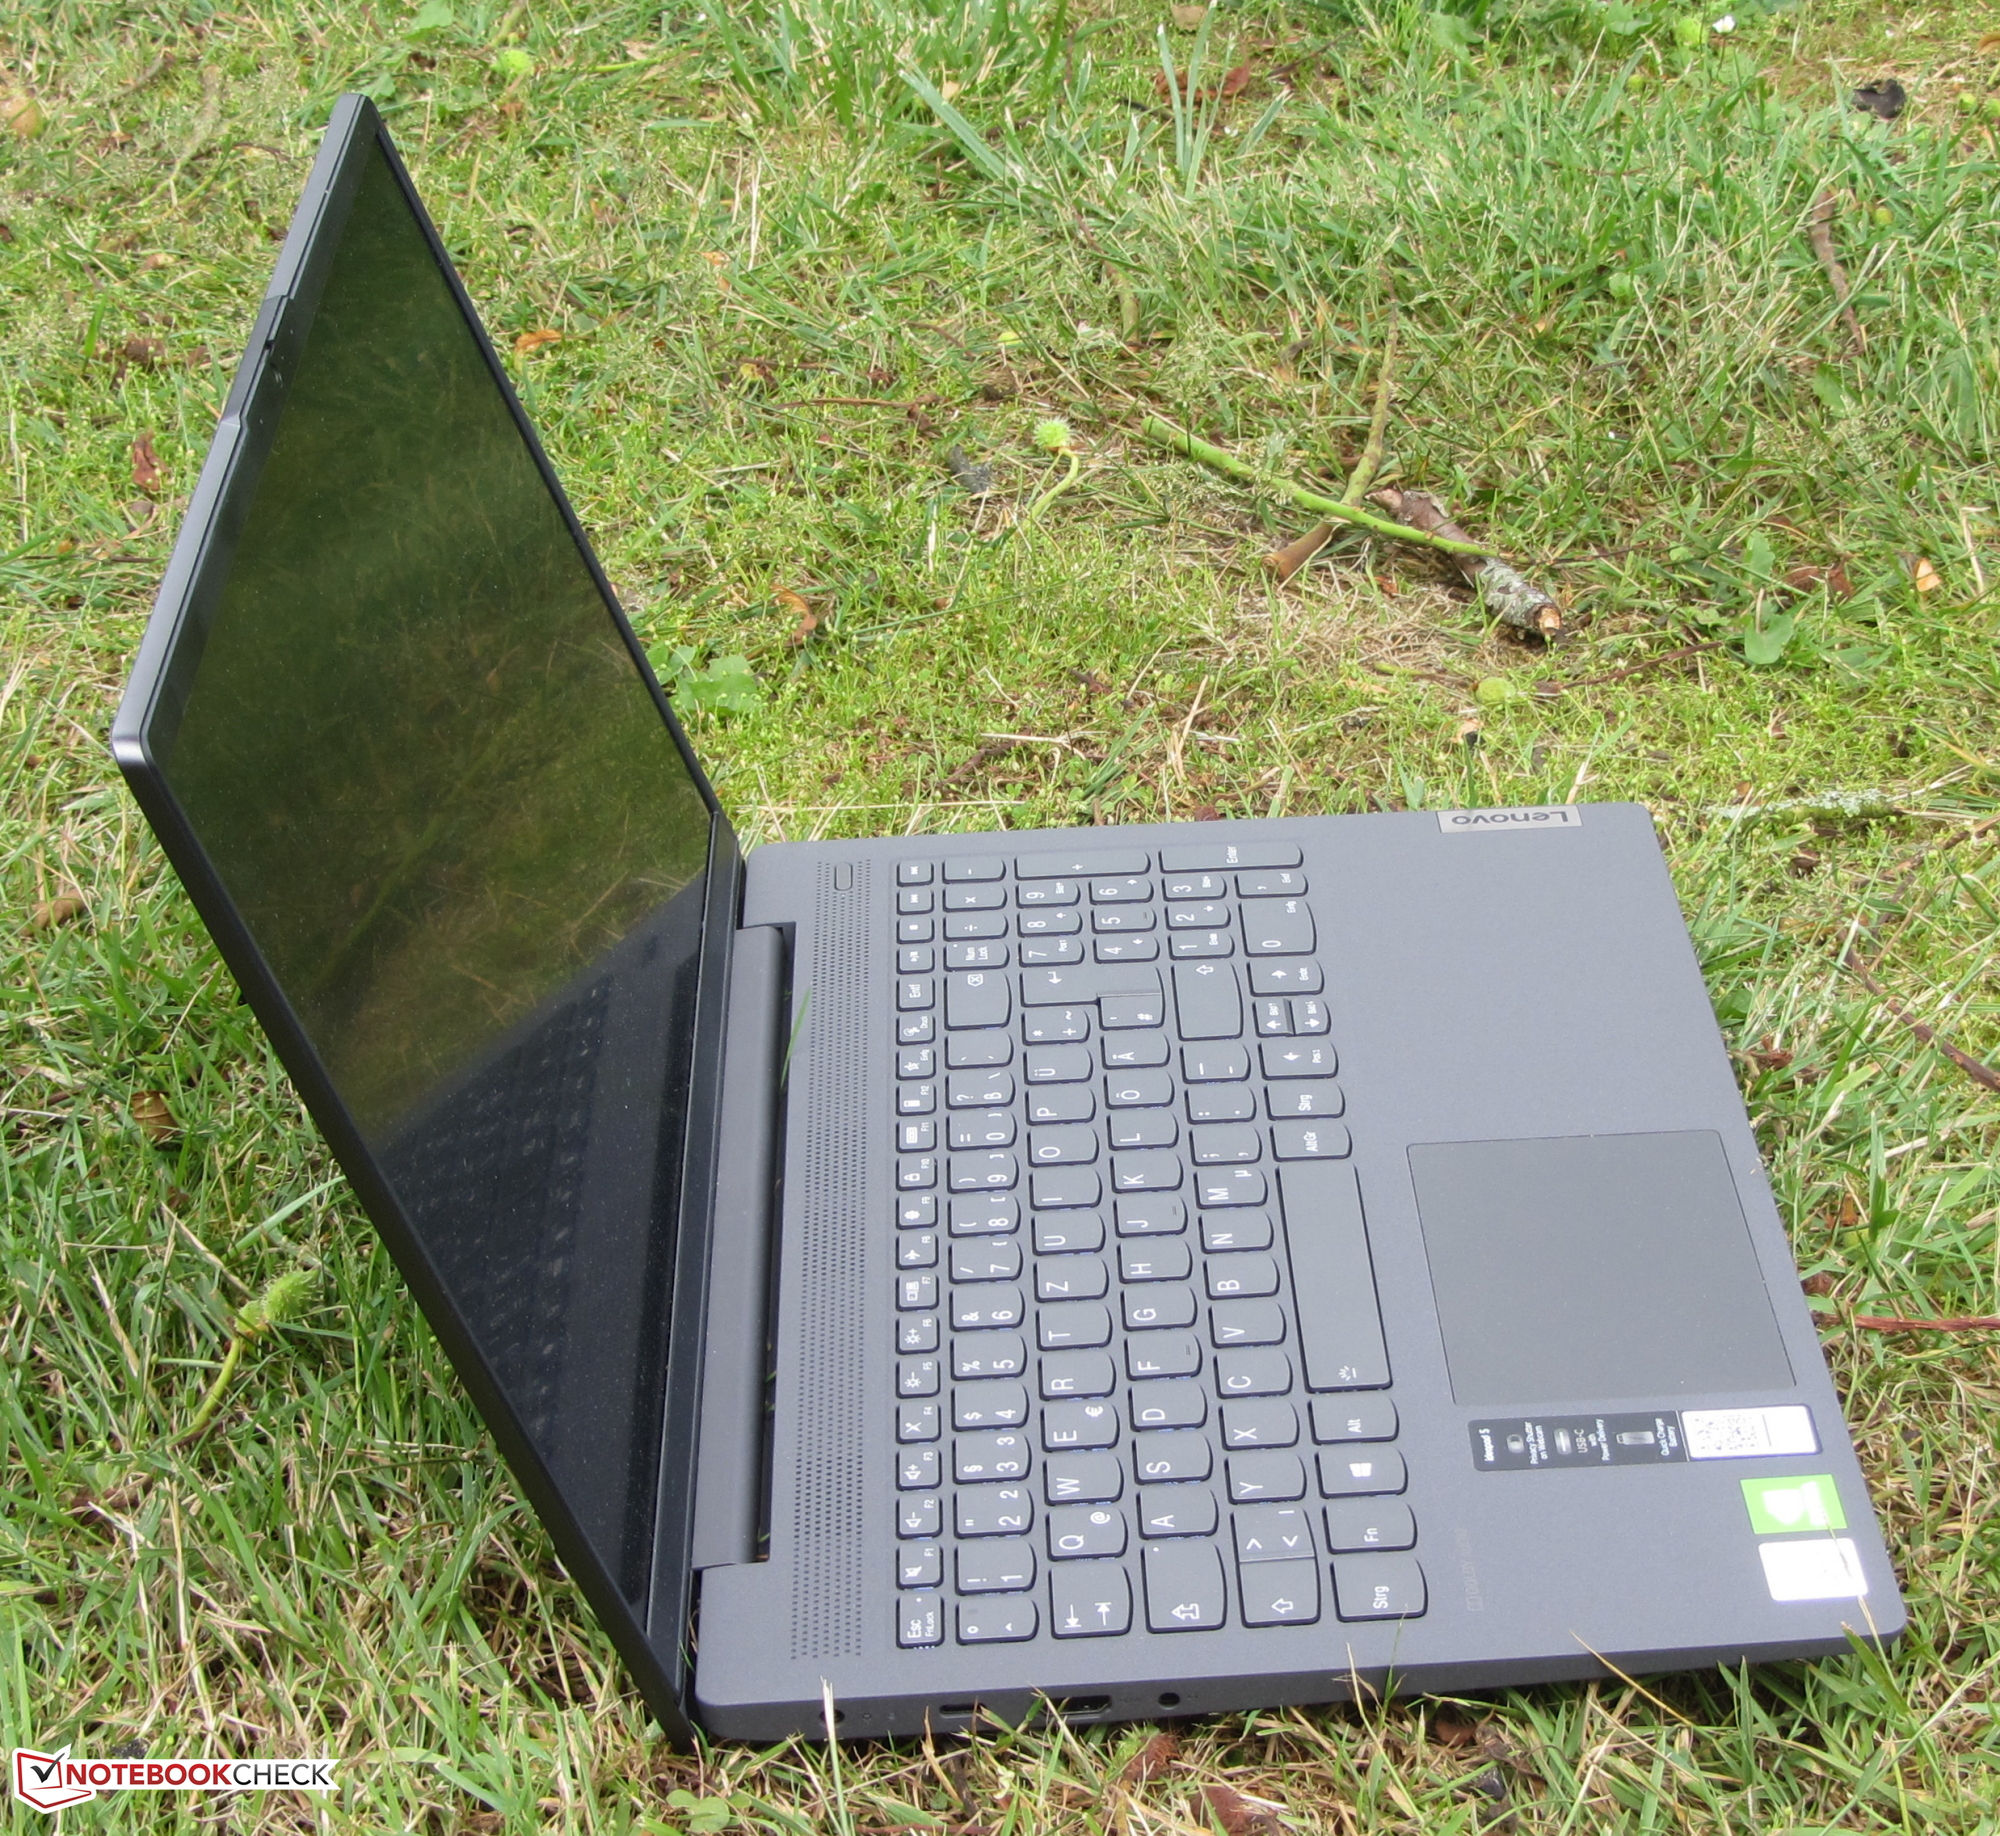
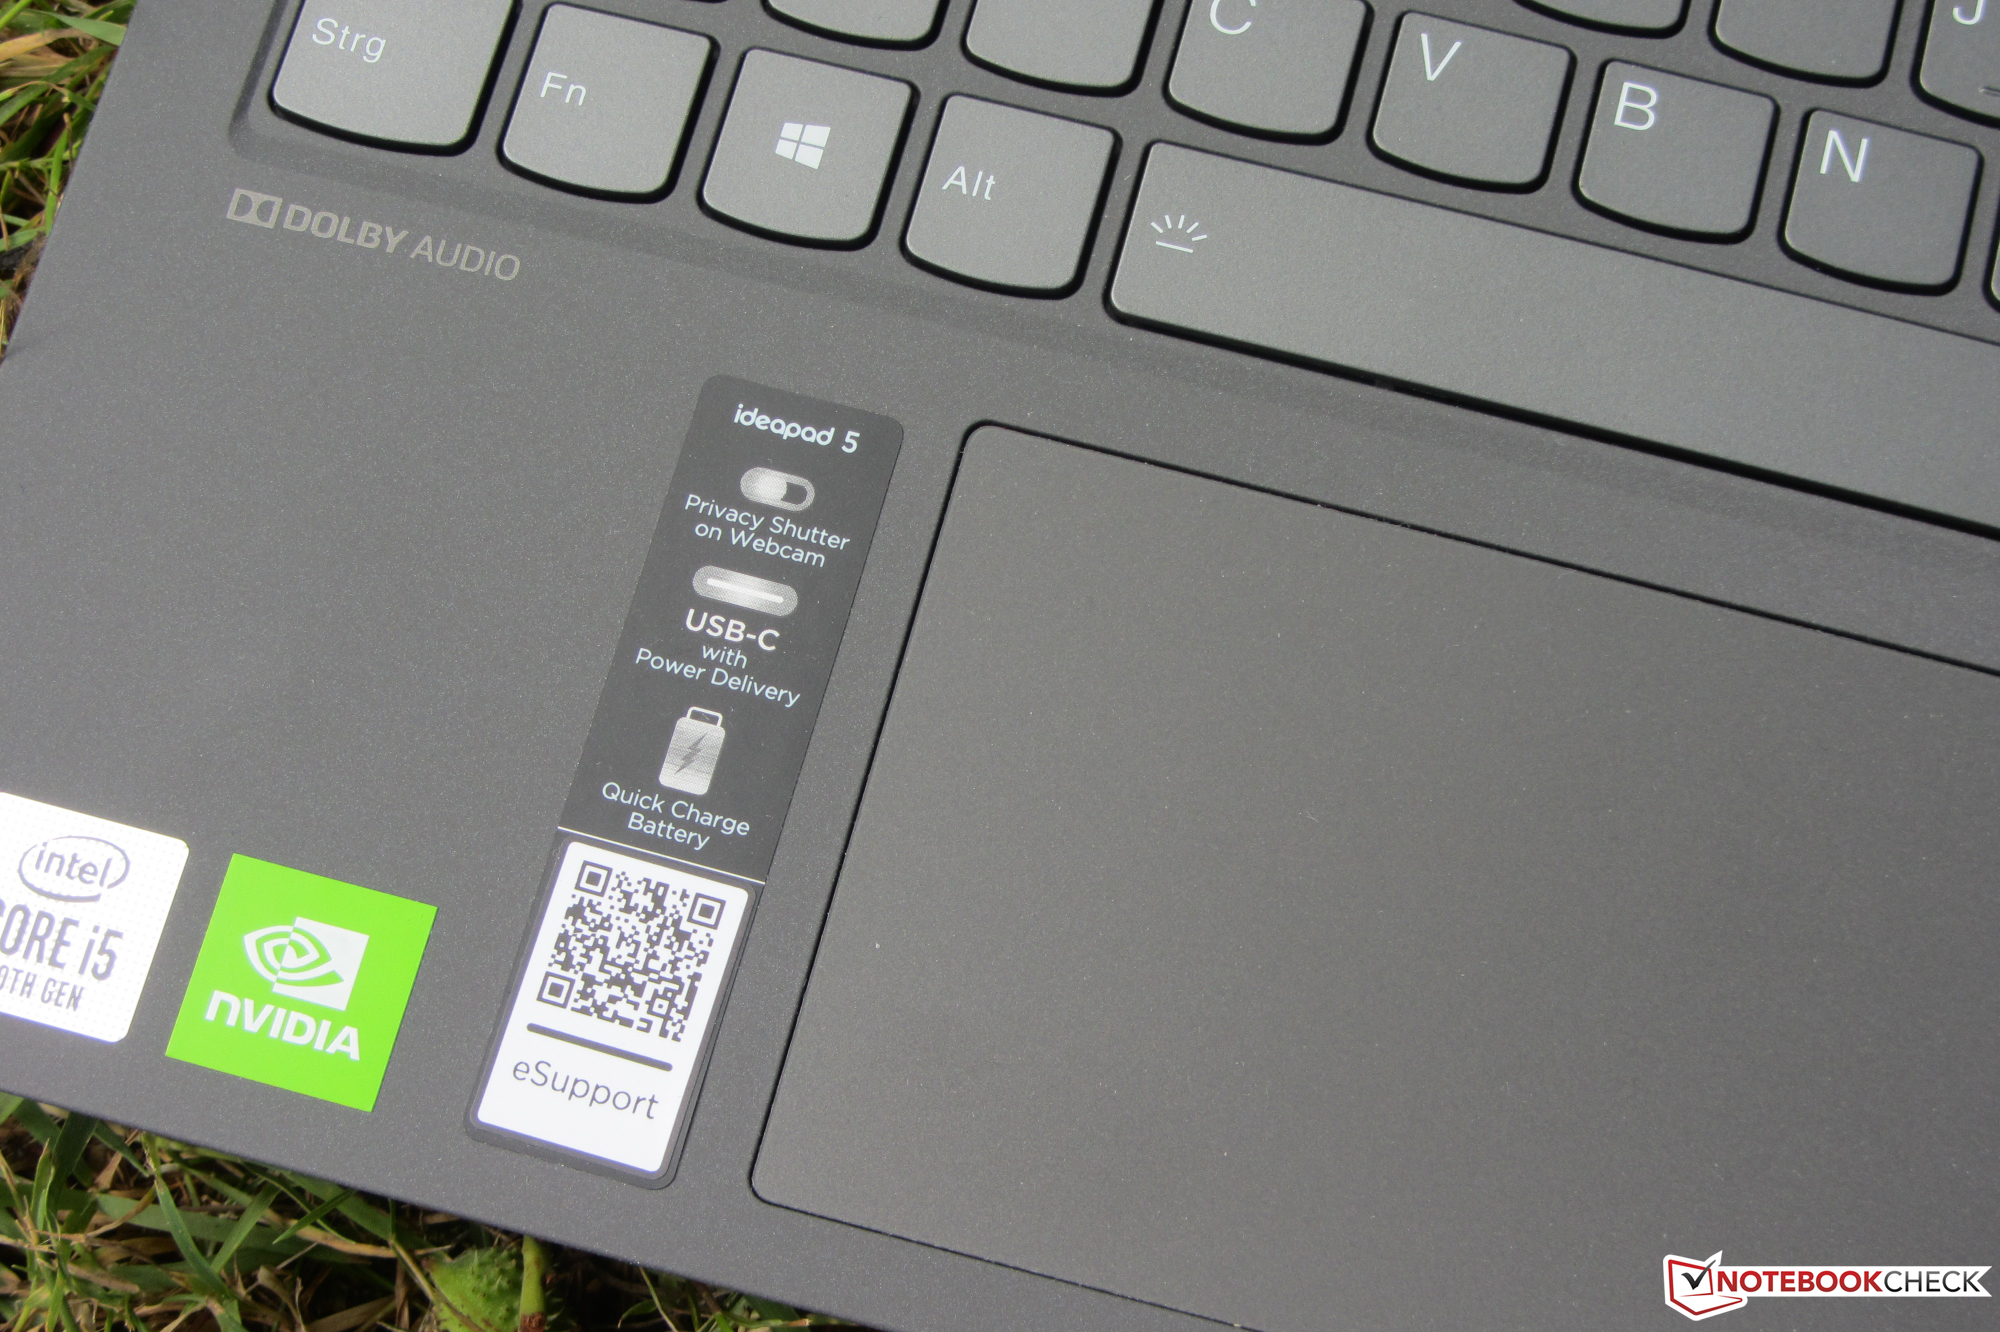
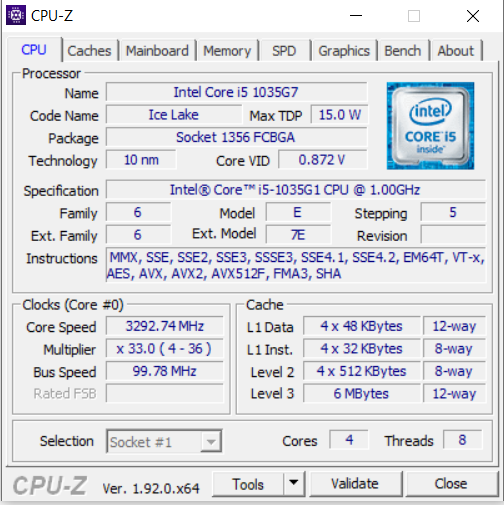
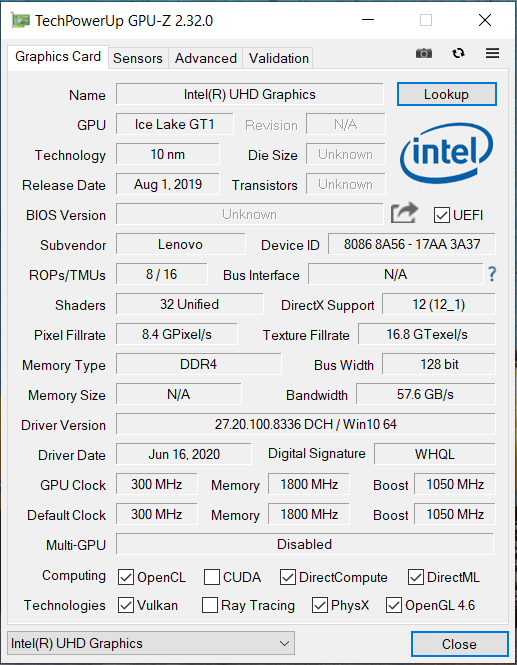
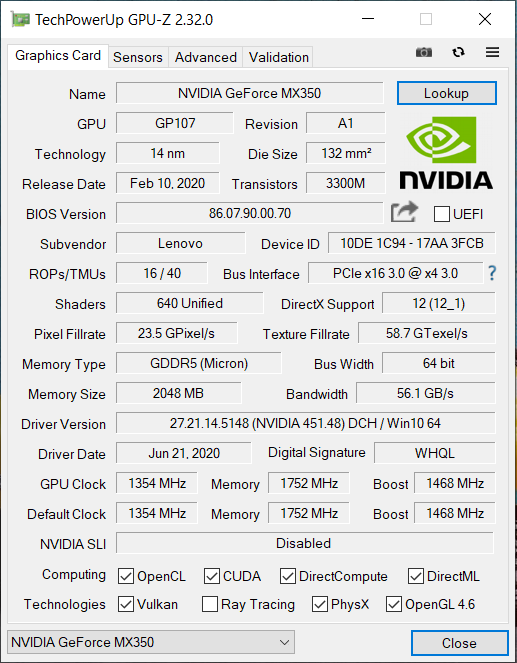
联想的多媒体全能本现在具有强大的硬件。酷睿i5-1035G1处理器与GeForce MX350的结合,不仅可以为办公和互联网应用提供更高的性能,而且还可以流畅地运行大多数当前的游戏。
事实证明,联想IdeaPad 5 15IIL05是功能强大的多媒体多功能产品,社长具有游戏潜力。
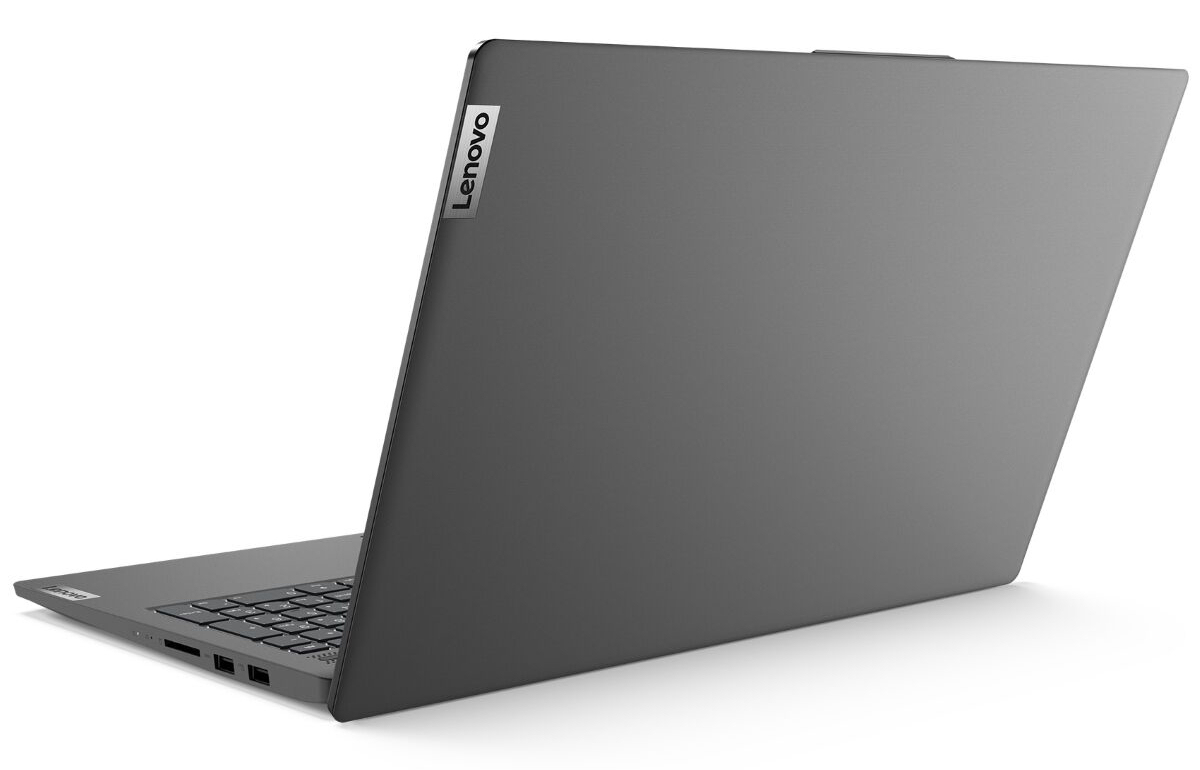
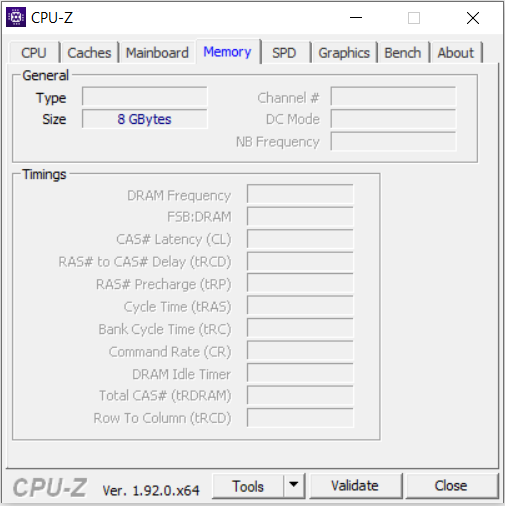
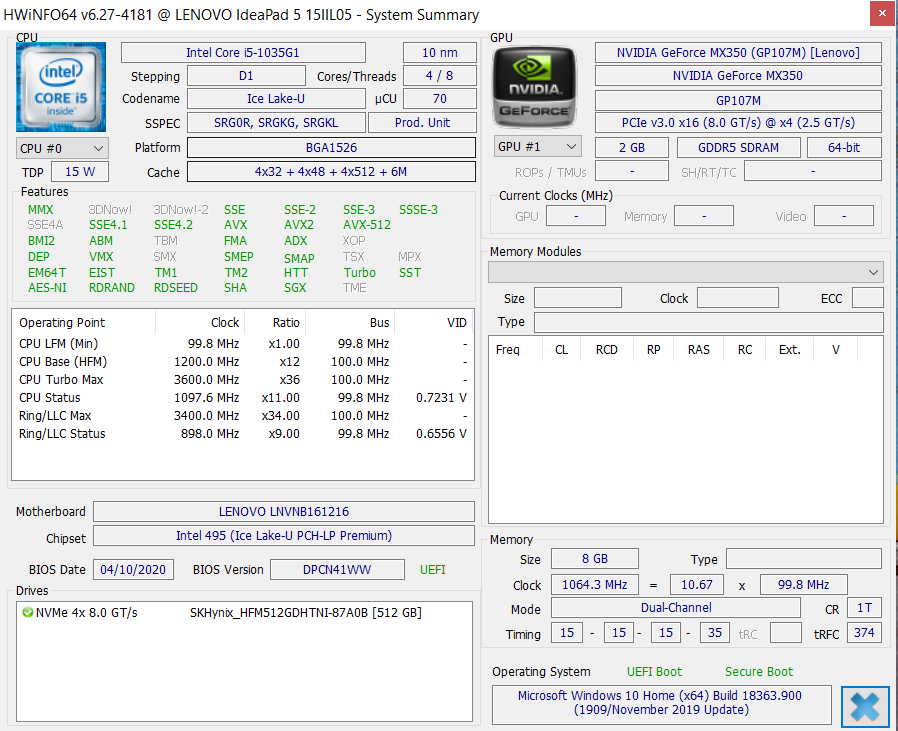
笔记本计算机配备了8 GB的RAM。由于是板载,因此无法扩展。因此,我们建议选择具有16 GB RAM的IdeaPad型号,以确保该设备能适应未来的需求。用户可以将NVMe SSD更换为更大容量的型号。该设备易于打开以进行维护工作。
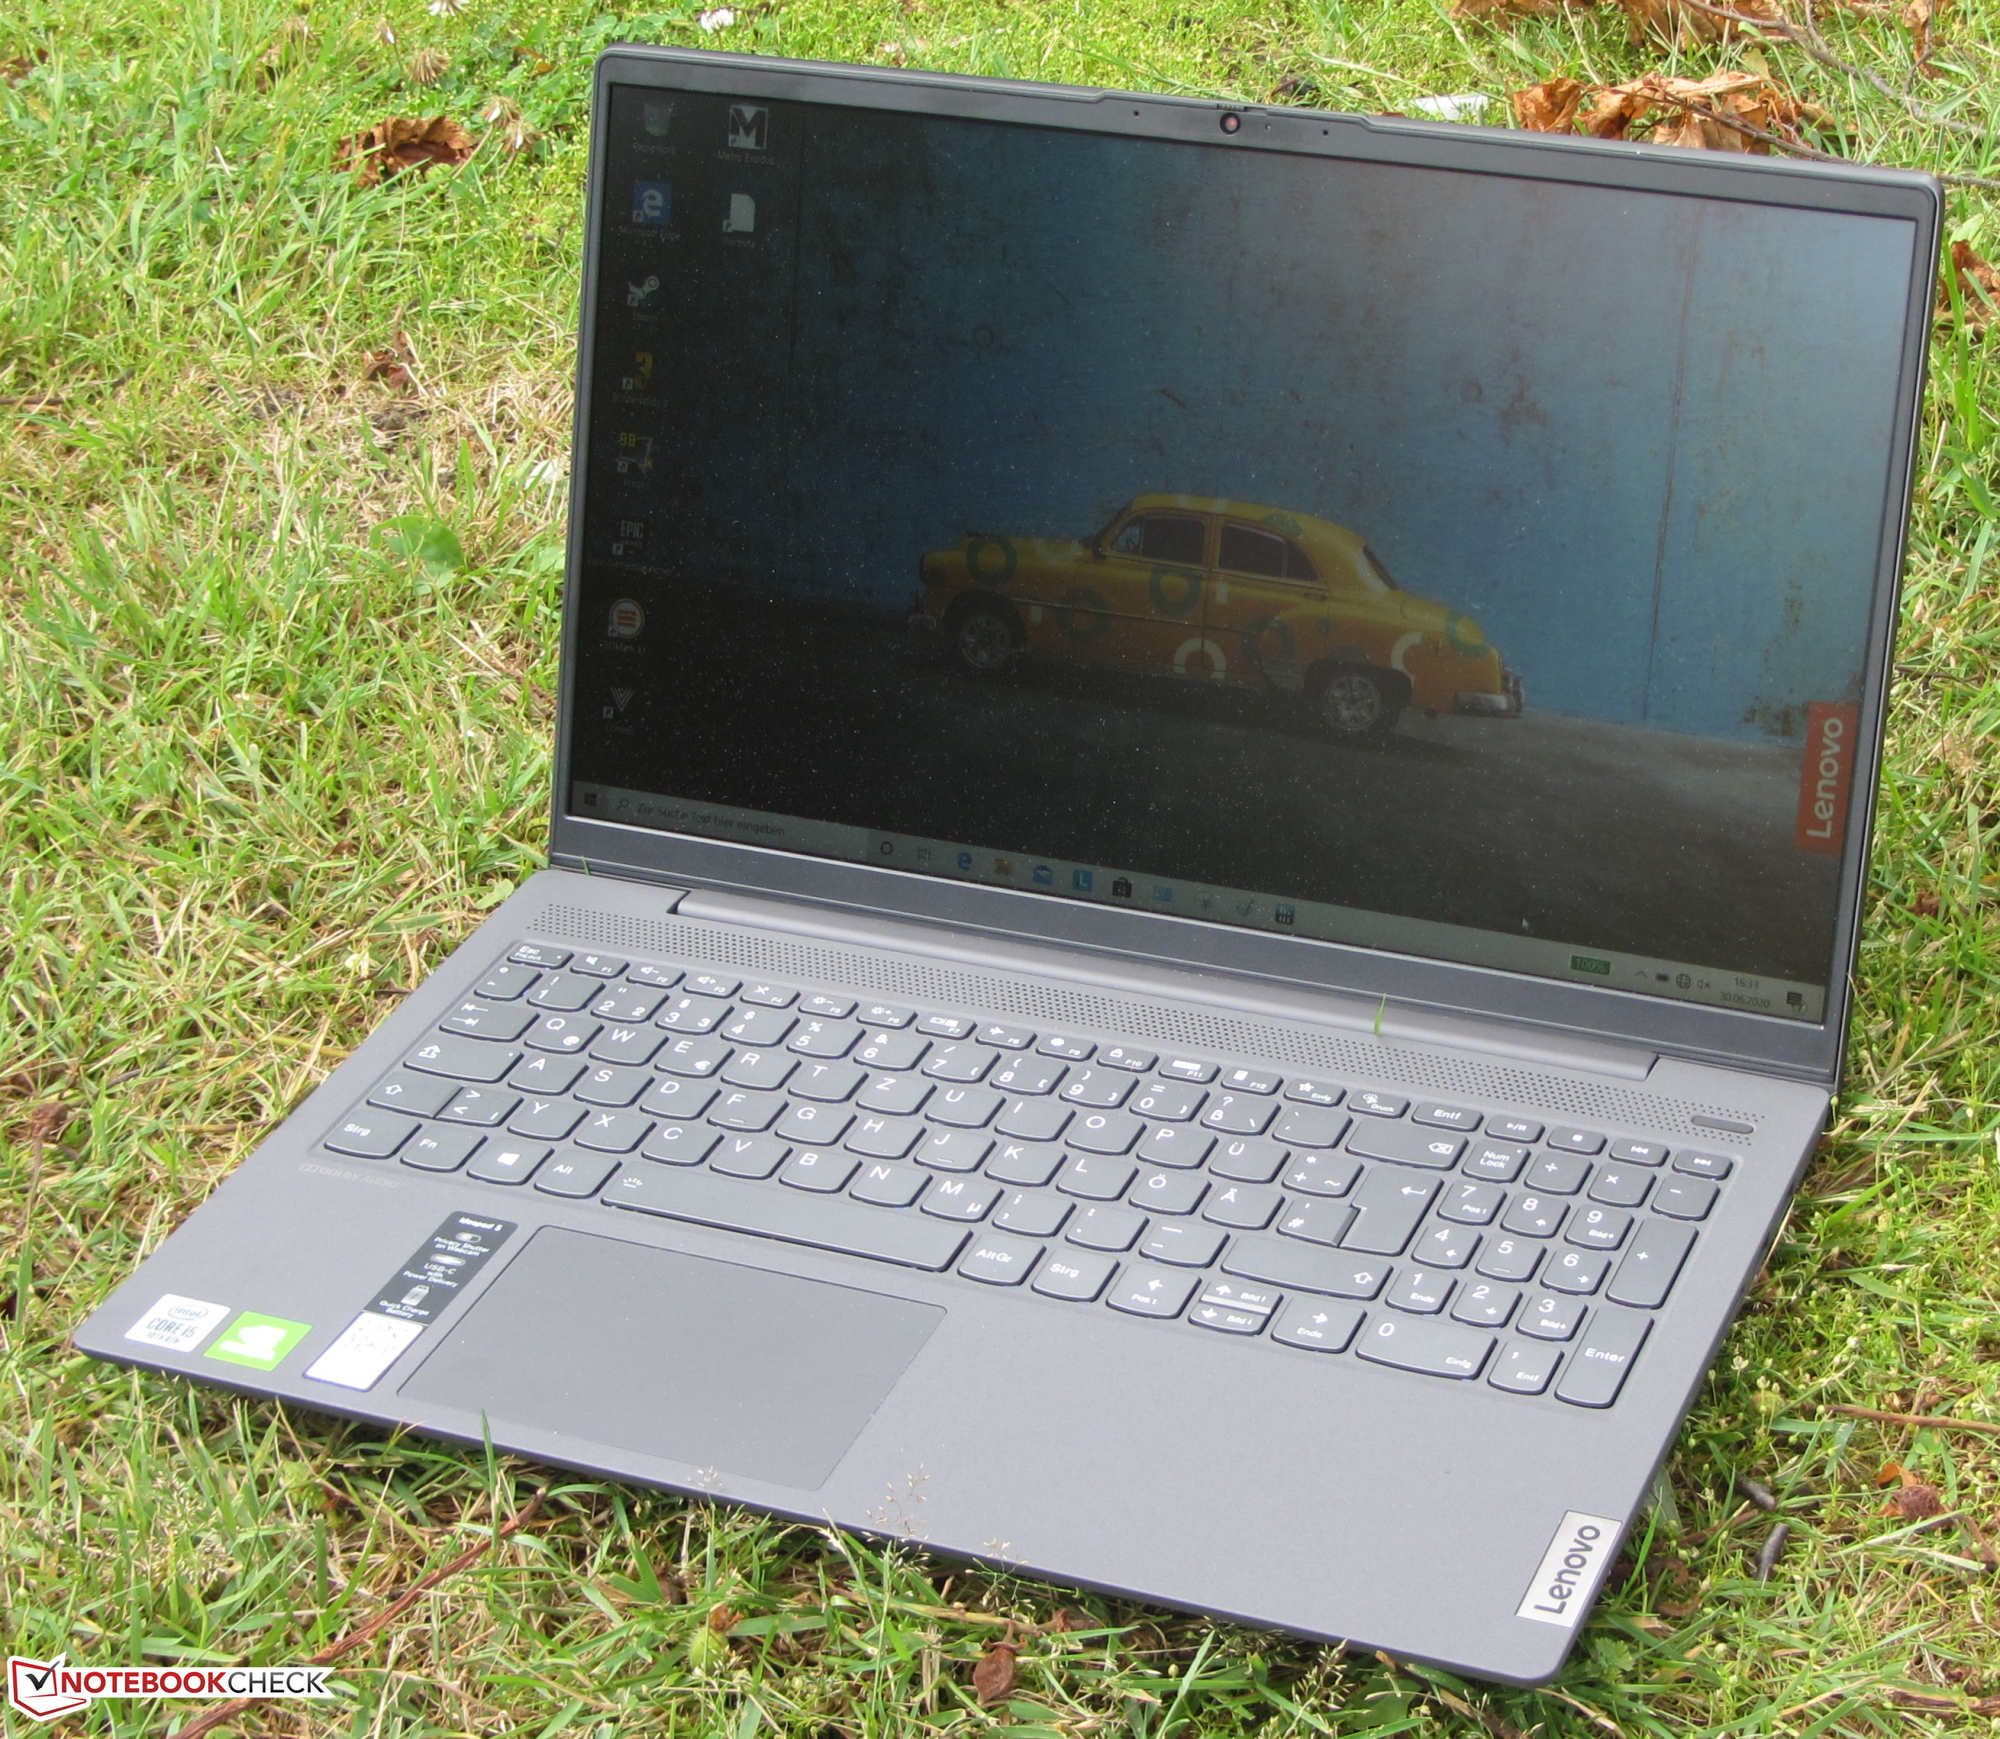
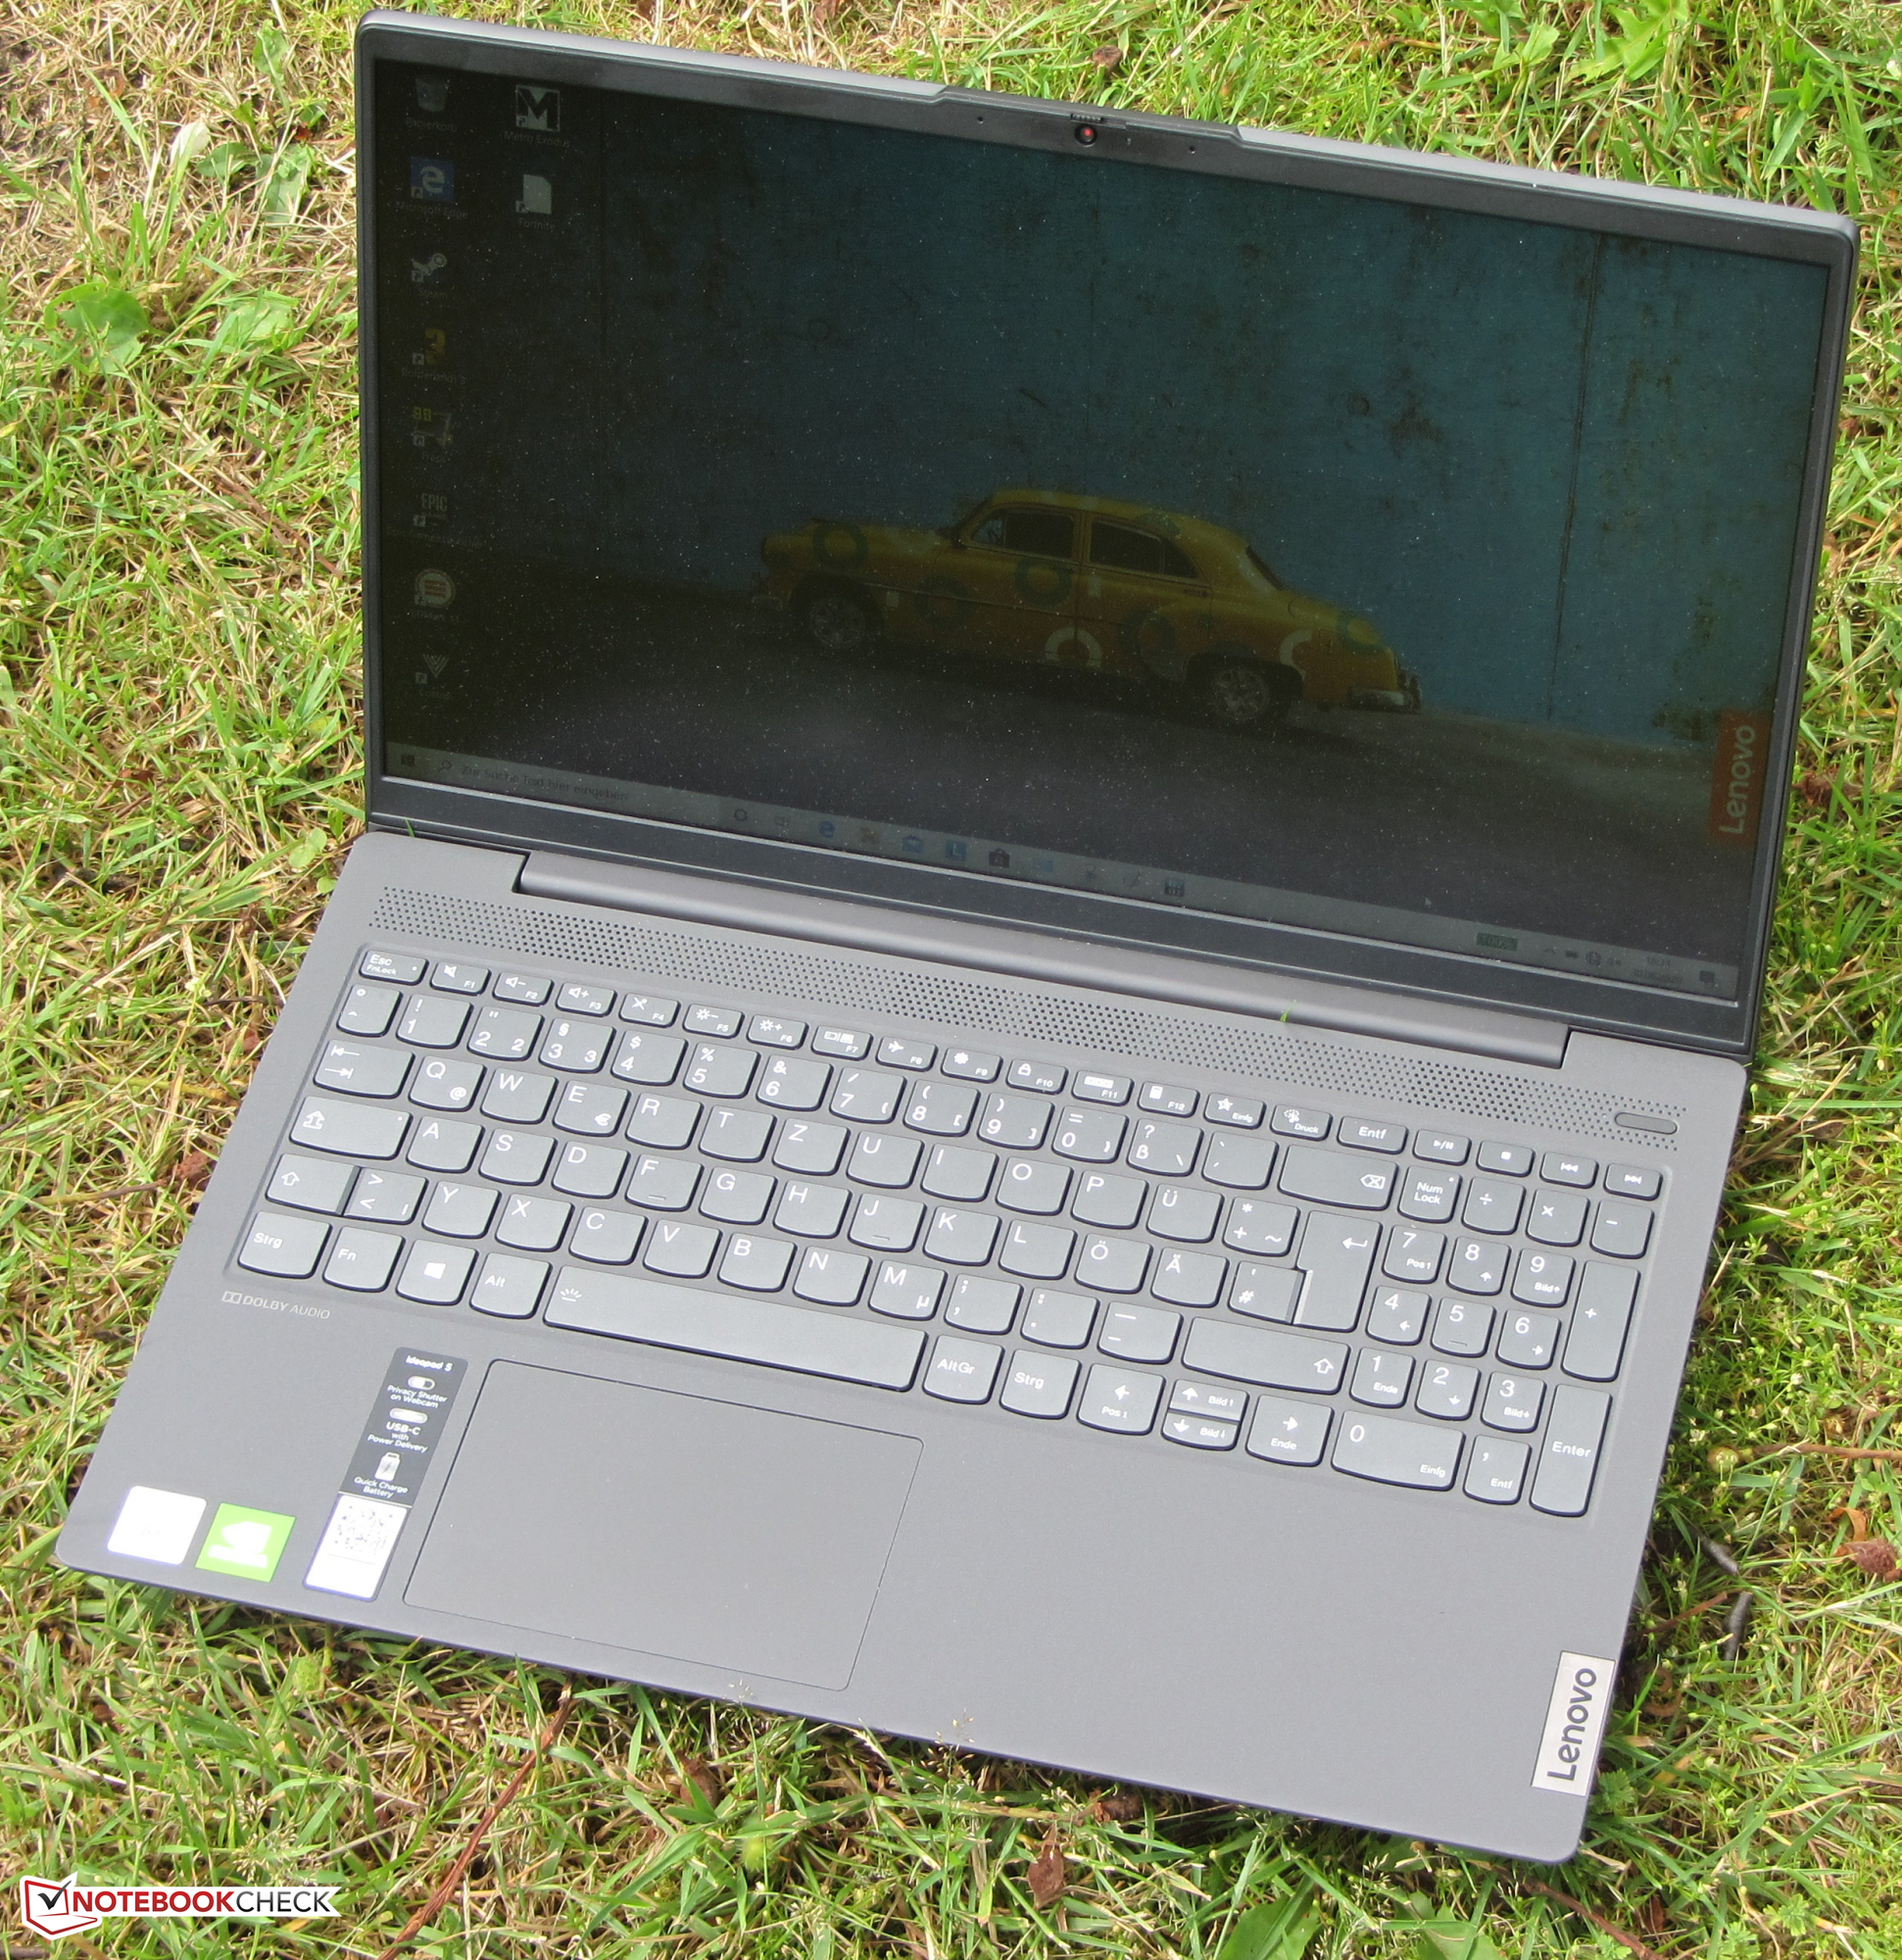
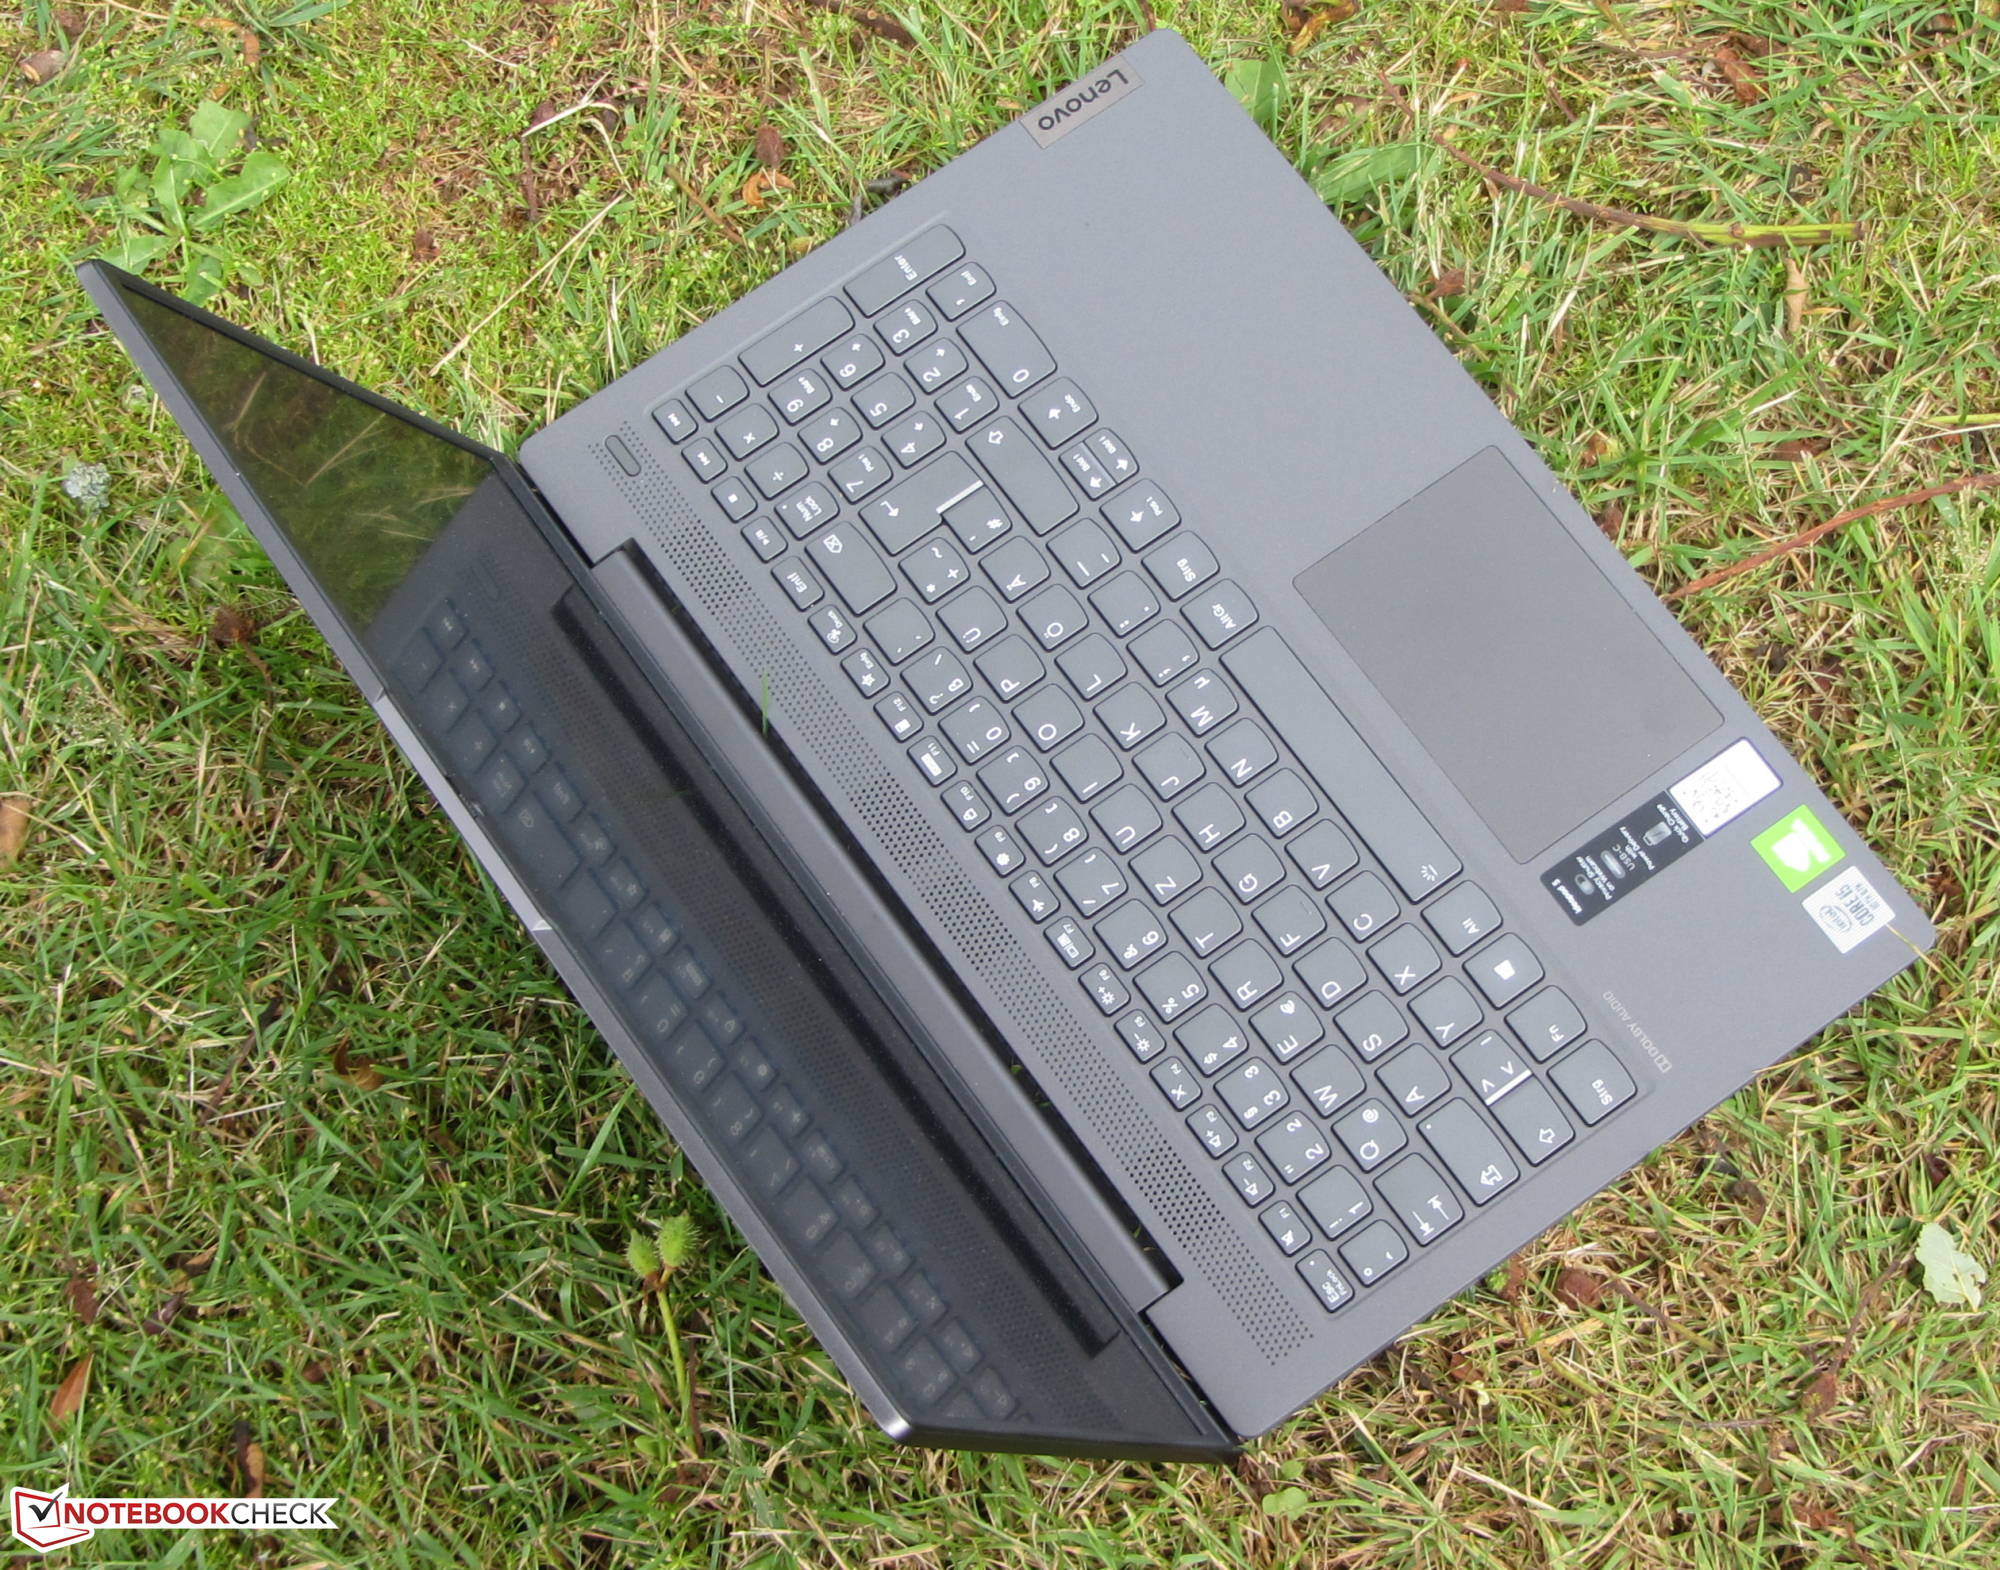
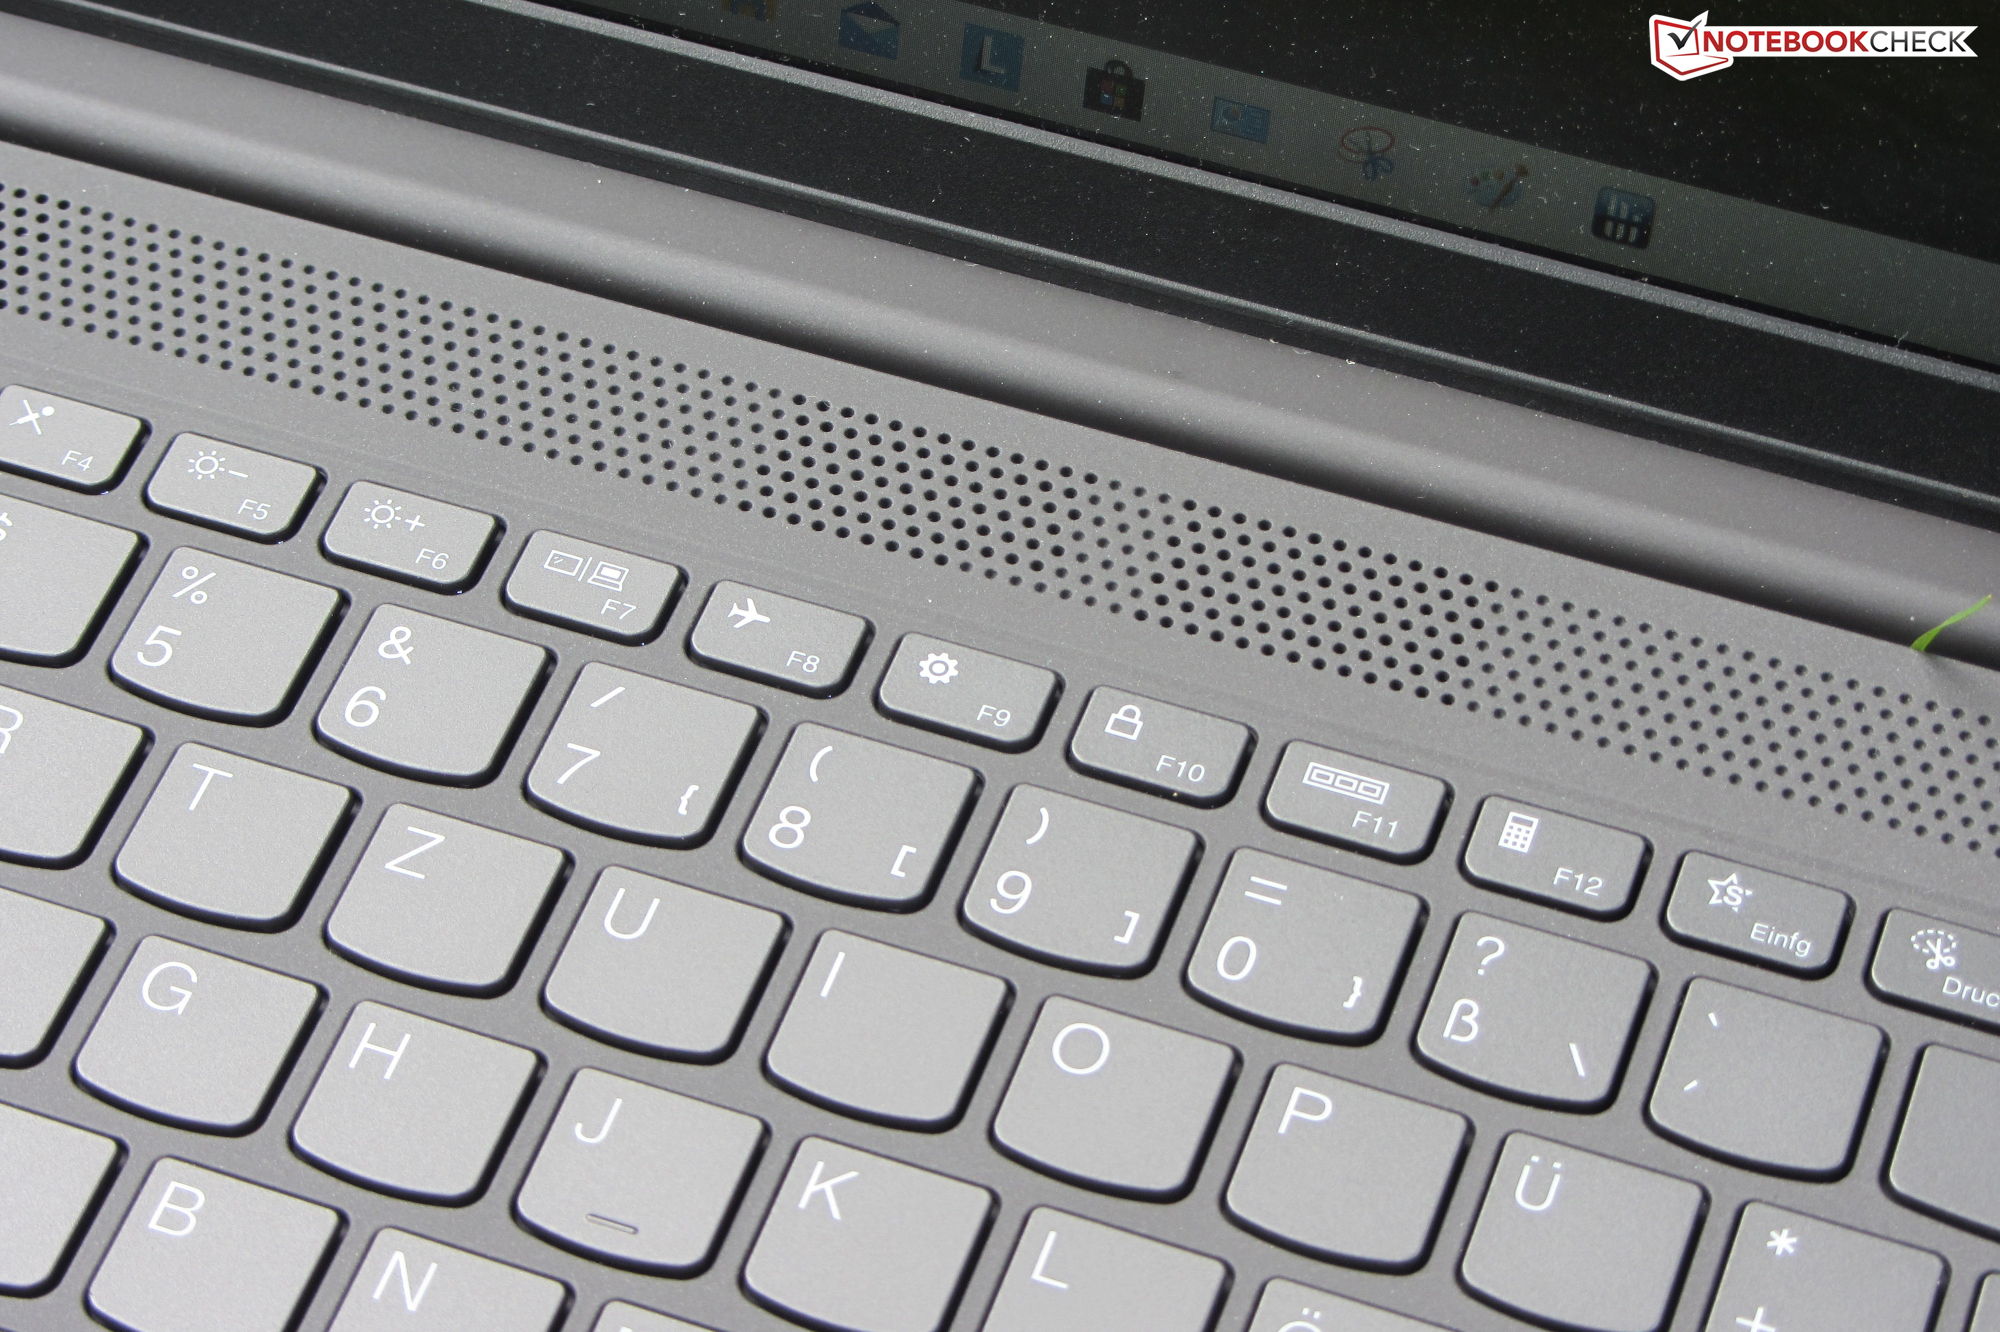
IPS Full-HD显示屏可提供稳定的视角,无光泽的表面和不错的色彩。亮度和对比度都在理想范围内。但是,色域覆盖率太低。背光键盘给人以良好的印象,适合常规打字。
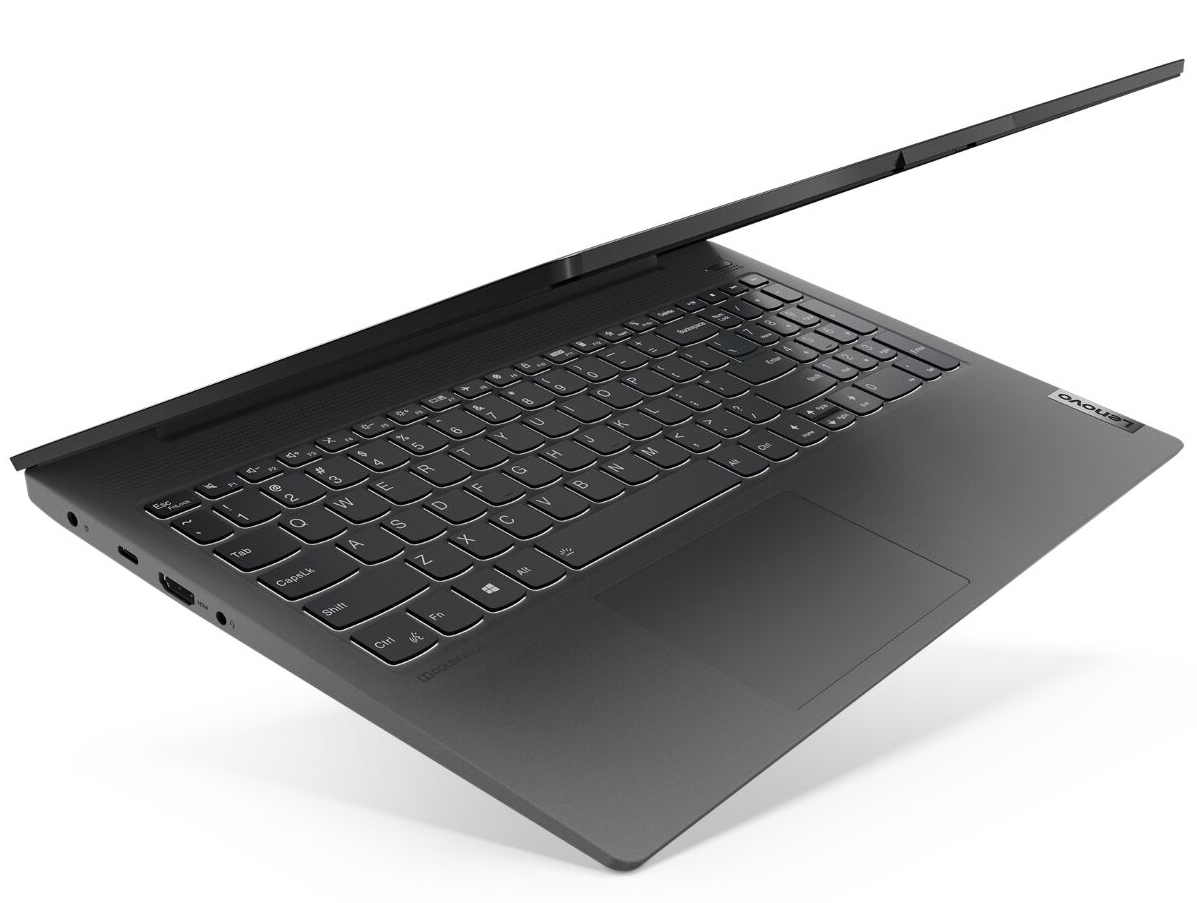
由于电池容量大(70Wh),IdeaPad可以达到理想的续航时间,并且无需电源即可轻松工作一天。 Type-C USB端口(USB 3.2 Gen 2,电源传输,和通过USB-C的DisplayPort)意味着可以使用随附的AC适配器或任何USB充电器为设备充电。
还有一件事:根据Lenovo的说法,IdeaPad 5系列还可以配备另外的电池(45 Wh和57 Wh),因此,如果续航时间对您来说很重要,则可以考虑该型号。
Lenovo IdeaPad 5 15IIL05
- 07/06/2020 v7 (old)
Sascha Mölck
Price comparison

