华硕Vivobook 15 K513EQ OLED笔记本电脑回顾。联想IdeaPad的替代品
从高端的华硕ZenBook系列往下走一步,你会发现自己跪在面向预算的华硕VivoBook系列中。这个家族一直在迅速扩大,成为一个令人困惑的庞大机型阵容,包括英特尔和AMD的CPU,集成或独立显卡,甚至OLED选项。这肯定很难跟上,而最新的VivoBook 15 K513并没有完全让事情变得简单。
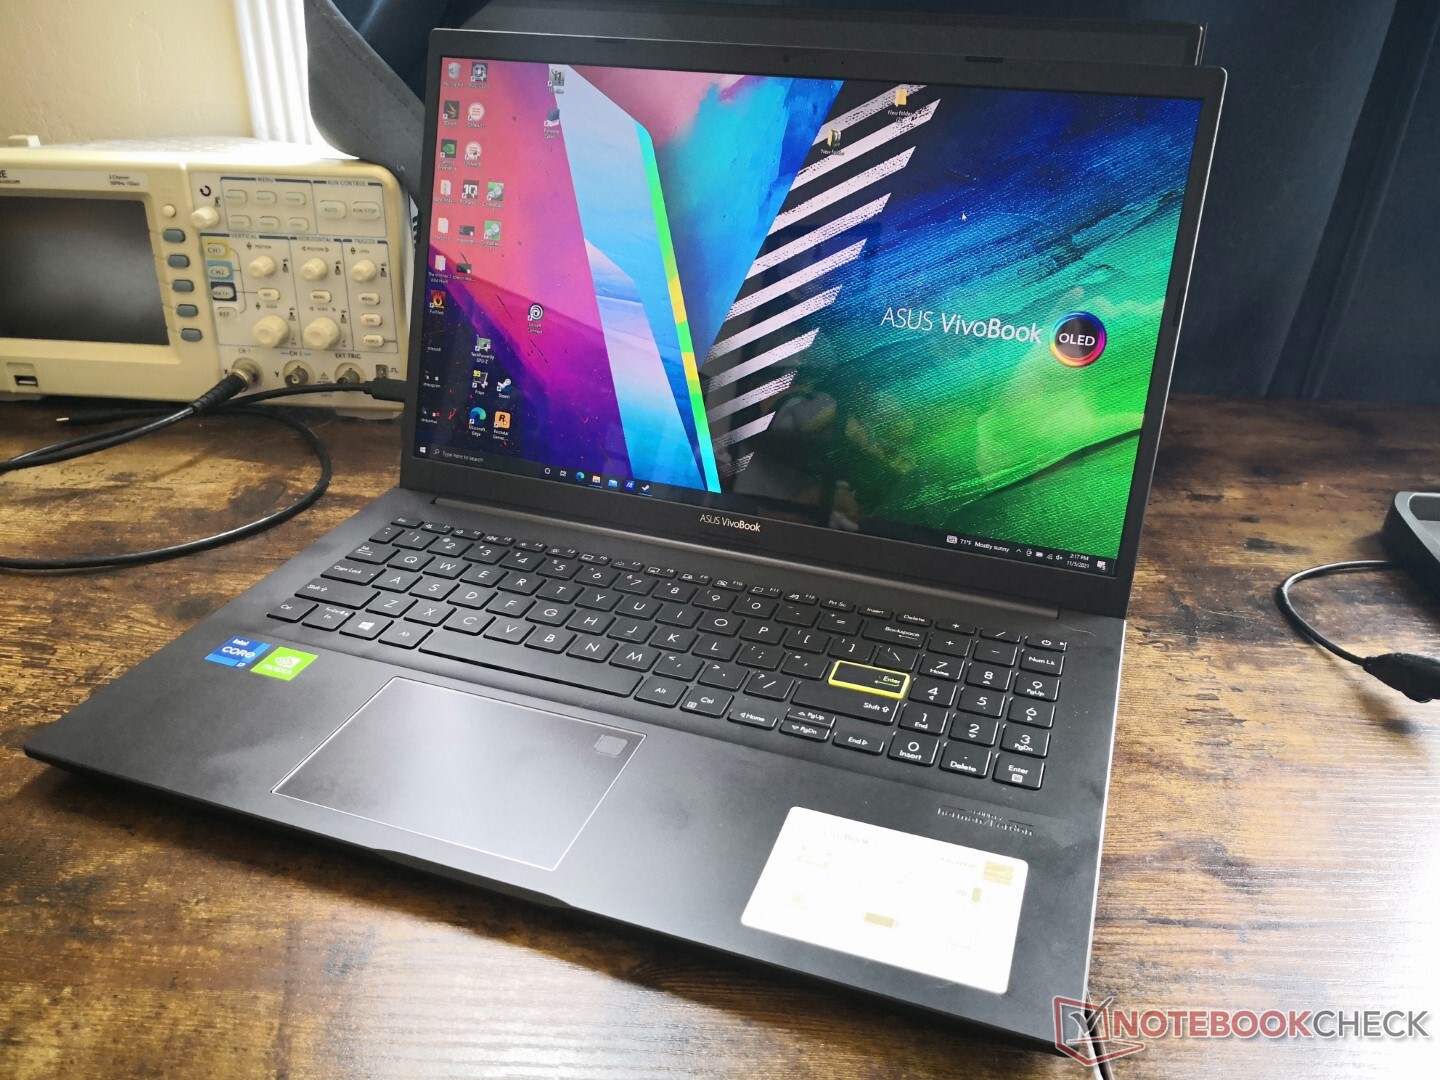
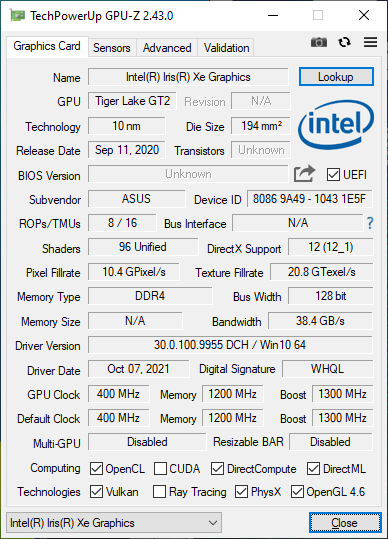
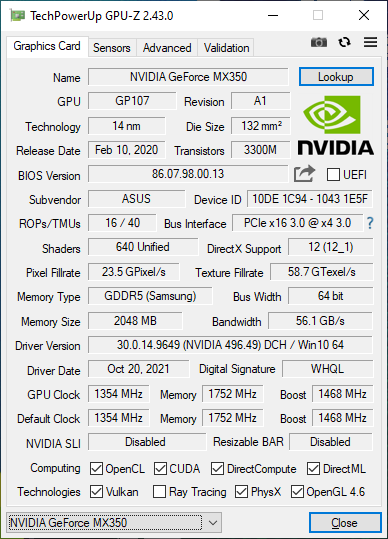
撇开命名惯例不谈,我们的VivoBook 15 K513测试装置肯定不同于大多数其他预算或中档多媒体笔记本电脑,它具有不常见的英特尔第11代酷睿i7-1165G7和GeForce MX350配对。此外,它是首批配备非触摸式1080p OLED显示屏的15.6英寸笔记本电脑之一,而目前所有的4K OLED面板都是如此。我们将仔细研究VivoBook 15 K513的性能、显示屏和物理特性,以了解究竟是什么让它与市场上所有其他VivoBook 15机型如此不同。
这一领域的竞争者包括其他中档多媒体笔记本电脑,如 联想IdeaPad 5 15, 戴尔 Inspiron 15, 惠普Pavilion 15, 或 MSI Summit B15/E15系列。我们的具体测试装置可以在网上找到,价格约为900美元至1000美元。
更多华硕VivoBook评论。
Potential Competitors in Comparison
Rating | Date | Model | Weight | Height | Size | Resolution | Price |
|---|---|---|---|---|---|---|---|
| 80.6 % v7 (old) | 11 / 2021 | Asus Vivobook 15 K513EQ i7-1165G7, GeForce MX350 | 1.6 kg | 17.9 mm | 15.60" | 1920x1080 | |
| 85.9 % v7 (old) | 11 / 2021 | Asus VivoBook 15 Pro M3500QC-L1062 R5 5600H, GeForce RTX 3050 4GB Laptop GPU | 1.7 kg | 19.9 mm | 15.60" | 1920x1080 | |
| 83.4 % v7 (old) | 12 / 2020 | Asus VivoBook S15 S533EQ-BQ002T i7-1165G7, GeForce MX350 | 1.8 kg | 16.1 mm | 15.60" | 1920x1080 | |
| 83.5 % v7 (old) | 08 / 2021 | Lenovo IdeaPad 5 15ALC05 R5 5500U, Vega 7 | 1.7 kg | 19.1 mm | 15.60" | 1920x1080 | |
| 80.5 % v7 (old) | 10 / 2021 | Dell Inspiron 15 3501 i7-1165G7, Iris Xe G7 96EUs | 2 kg | 19.9 mm | 15.60" | 1920x1080 | |
| 81.2 % v7 (old) | 07 / 2021 | HP Pavilion 15-eg i7-1165G7, GeForce MX450 | 1.7 kg | 17.9 mm | 15.60" | 1920x1080 |
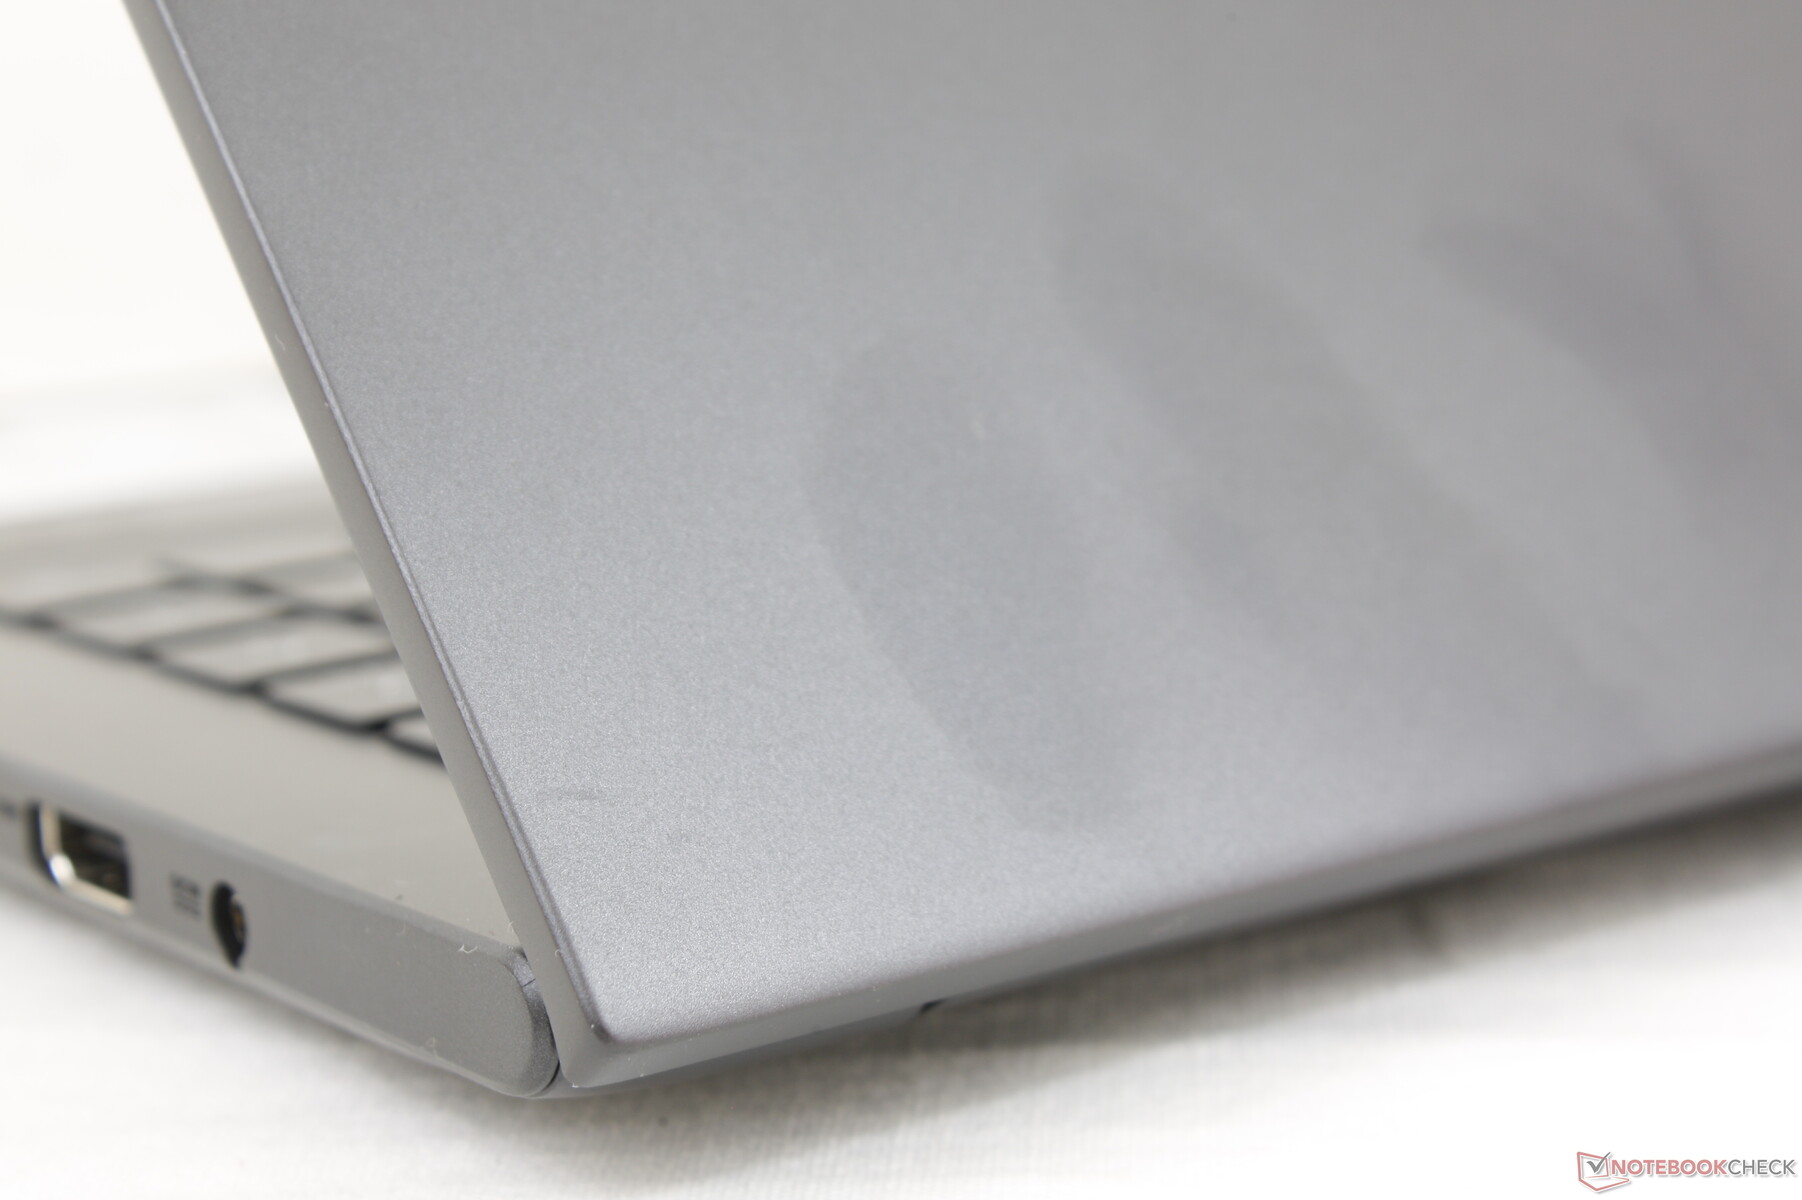
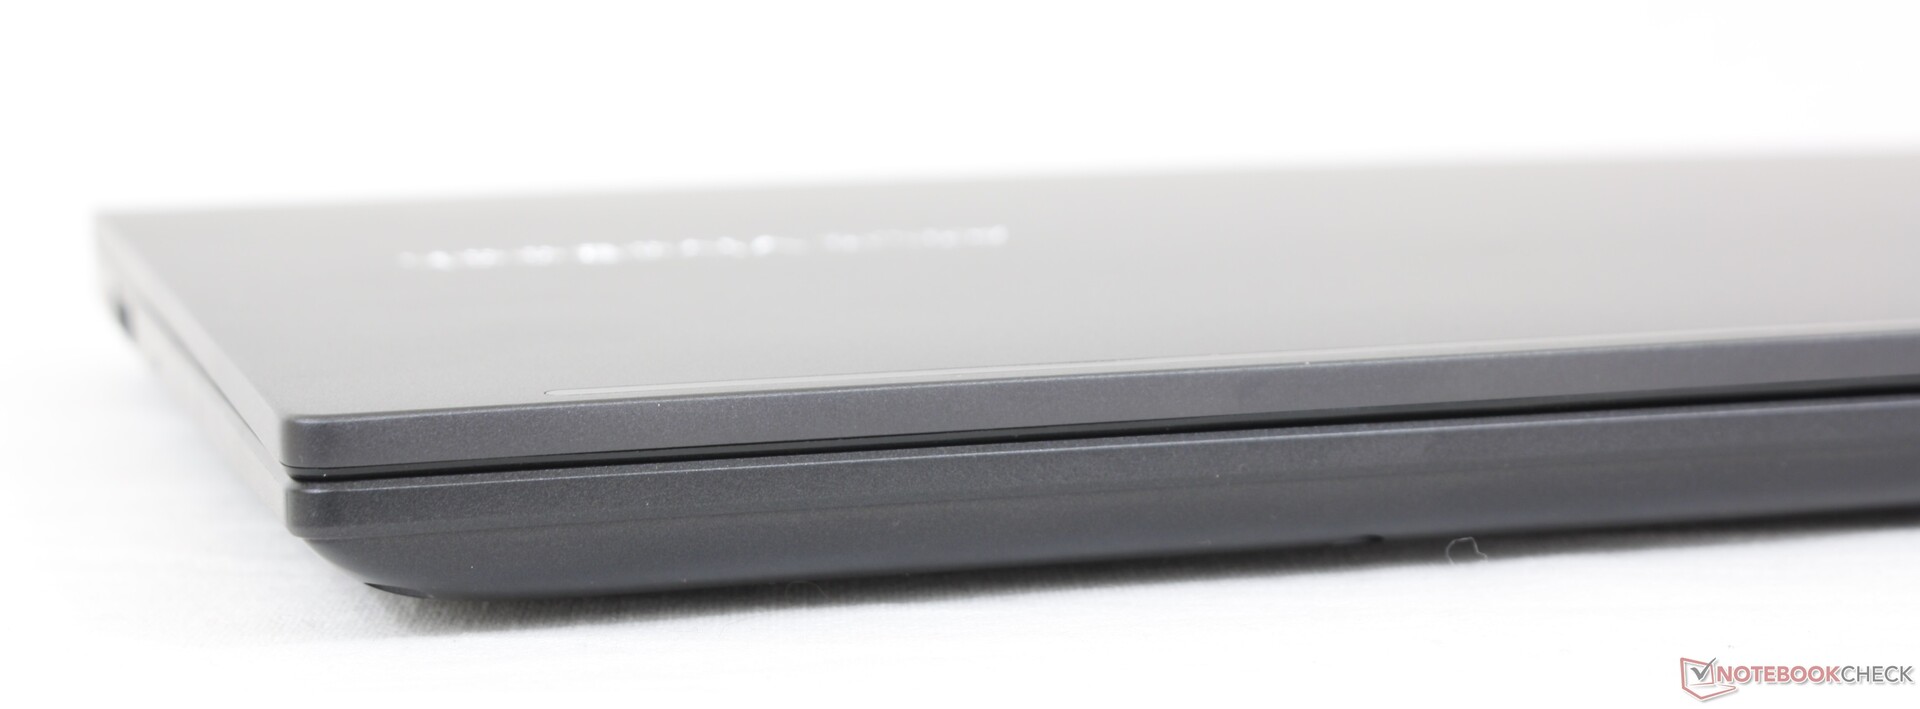
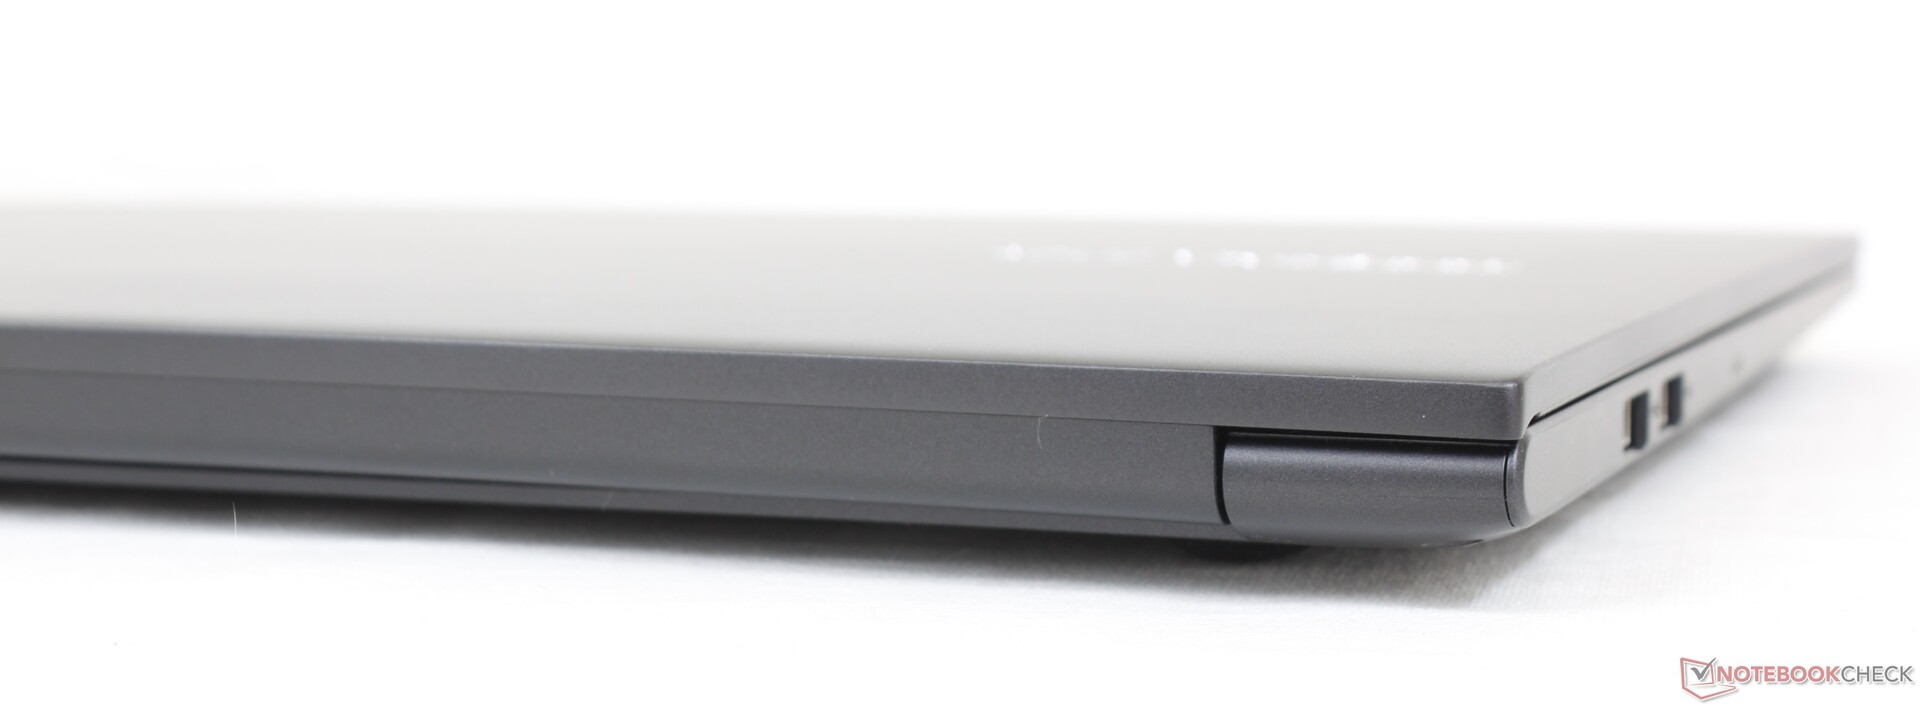
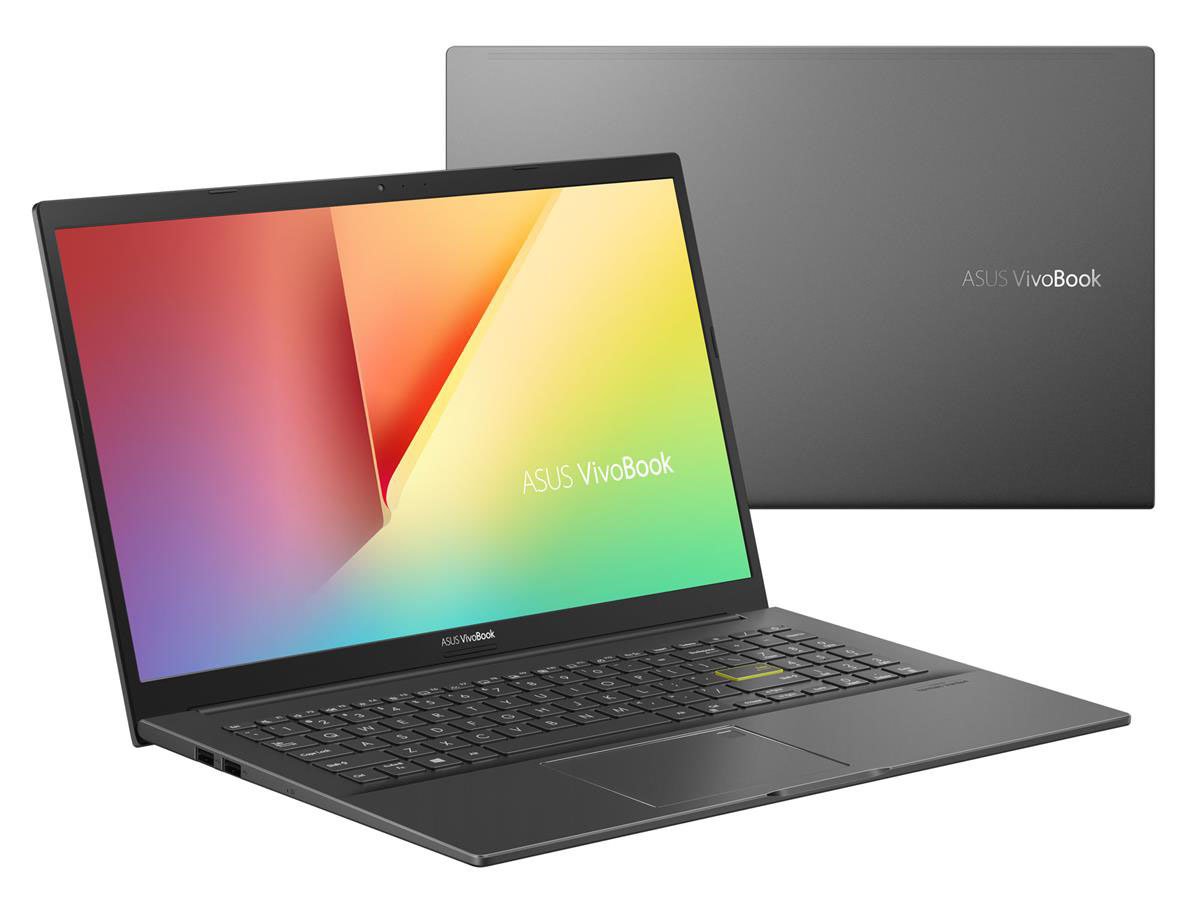
案例 - 希望你喜欢塑料
所有各种15.6英寸的VivoBook 15型号之间的内部和外部都有适度的差异。在我们的案例中,VivoBook 15 K513最类似于 VivoBook 15 F512在端口定位和主板布局方面最为相似。特别是塑料底座,远没有典型的塑料底座牢固或豪华。 禅书15,惠普Spectre,或 戴尔XPS 15这也是可以预期的。底盘硬度反而更符合联想IdeaPad 5 15或戴尔Inspiron 3501,而比最新的惠普Pavilion 15要弱一些。例如,它的键盘中心,比我们希望的更容易弯曲。
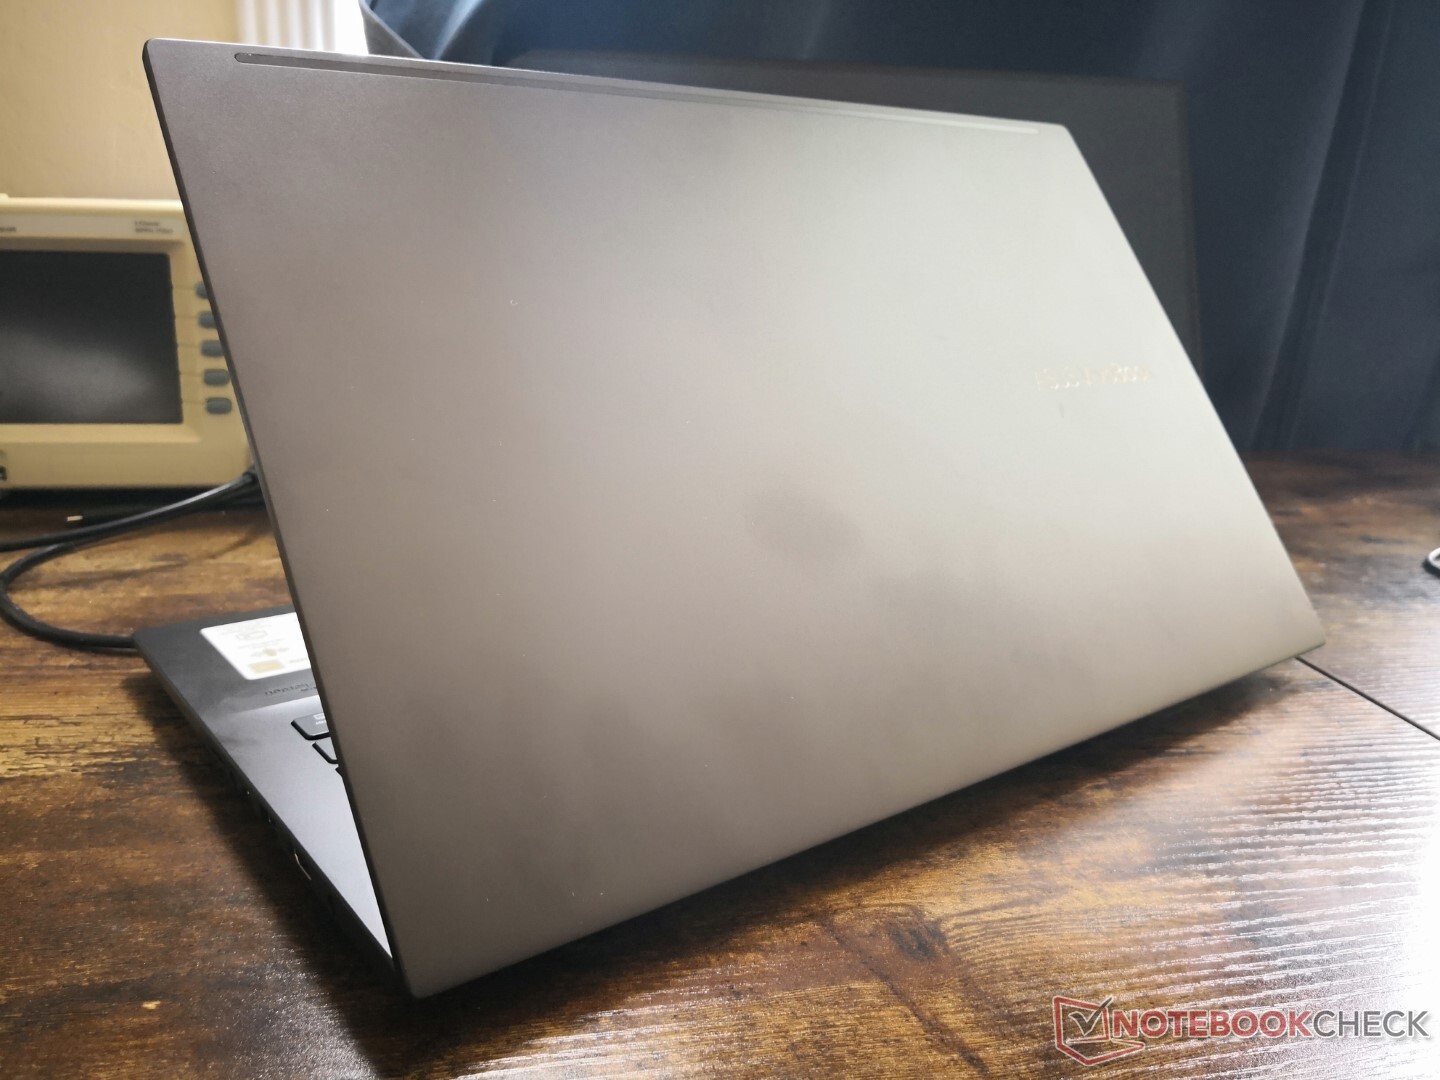
尽管有独立的GPU和OLED面板,但该系统比许多竞争对手要轻大约100克到200克。整体尺寸与最新的惠普Pavilion 15最为相似,而比VivoBook 15 Pro和VivoBook S15分别更薄和更厚。
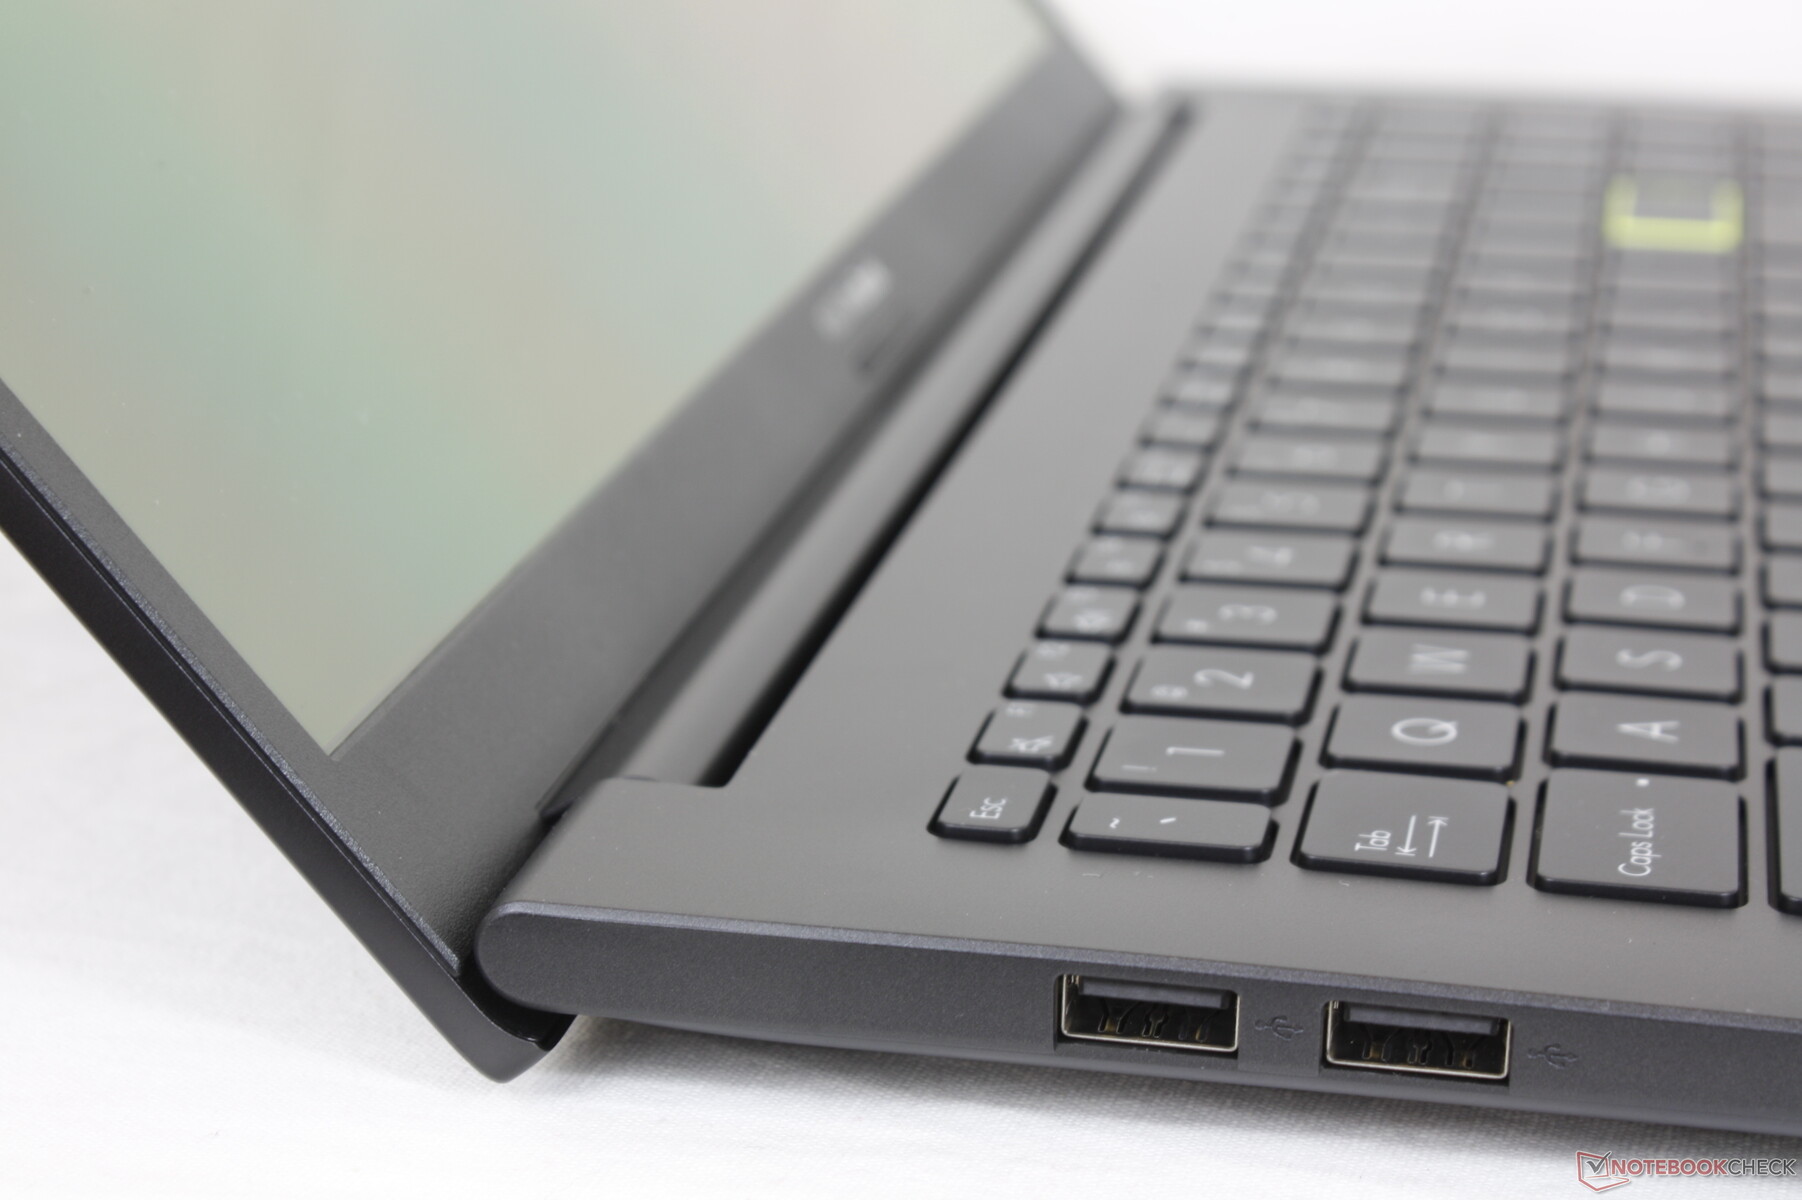
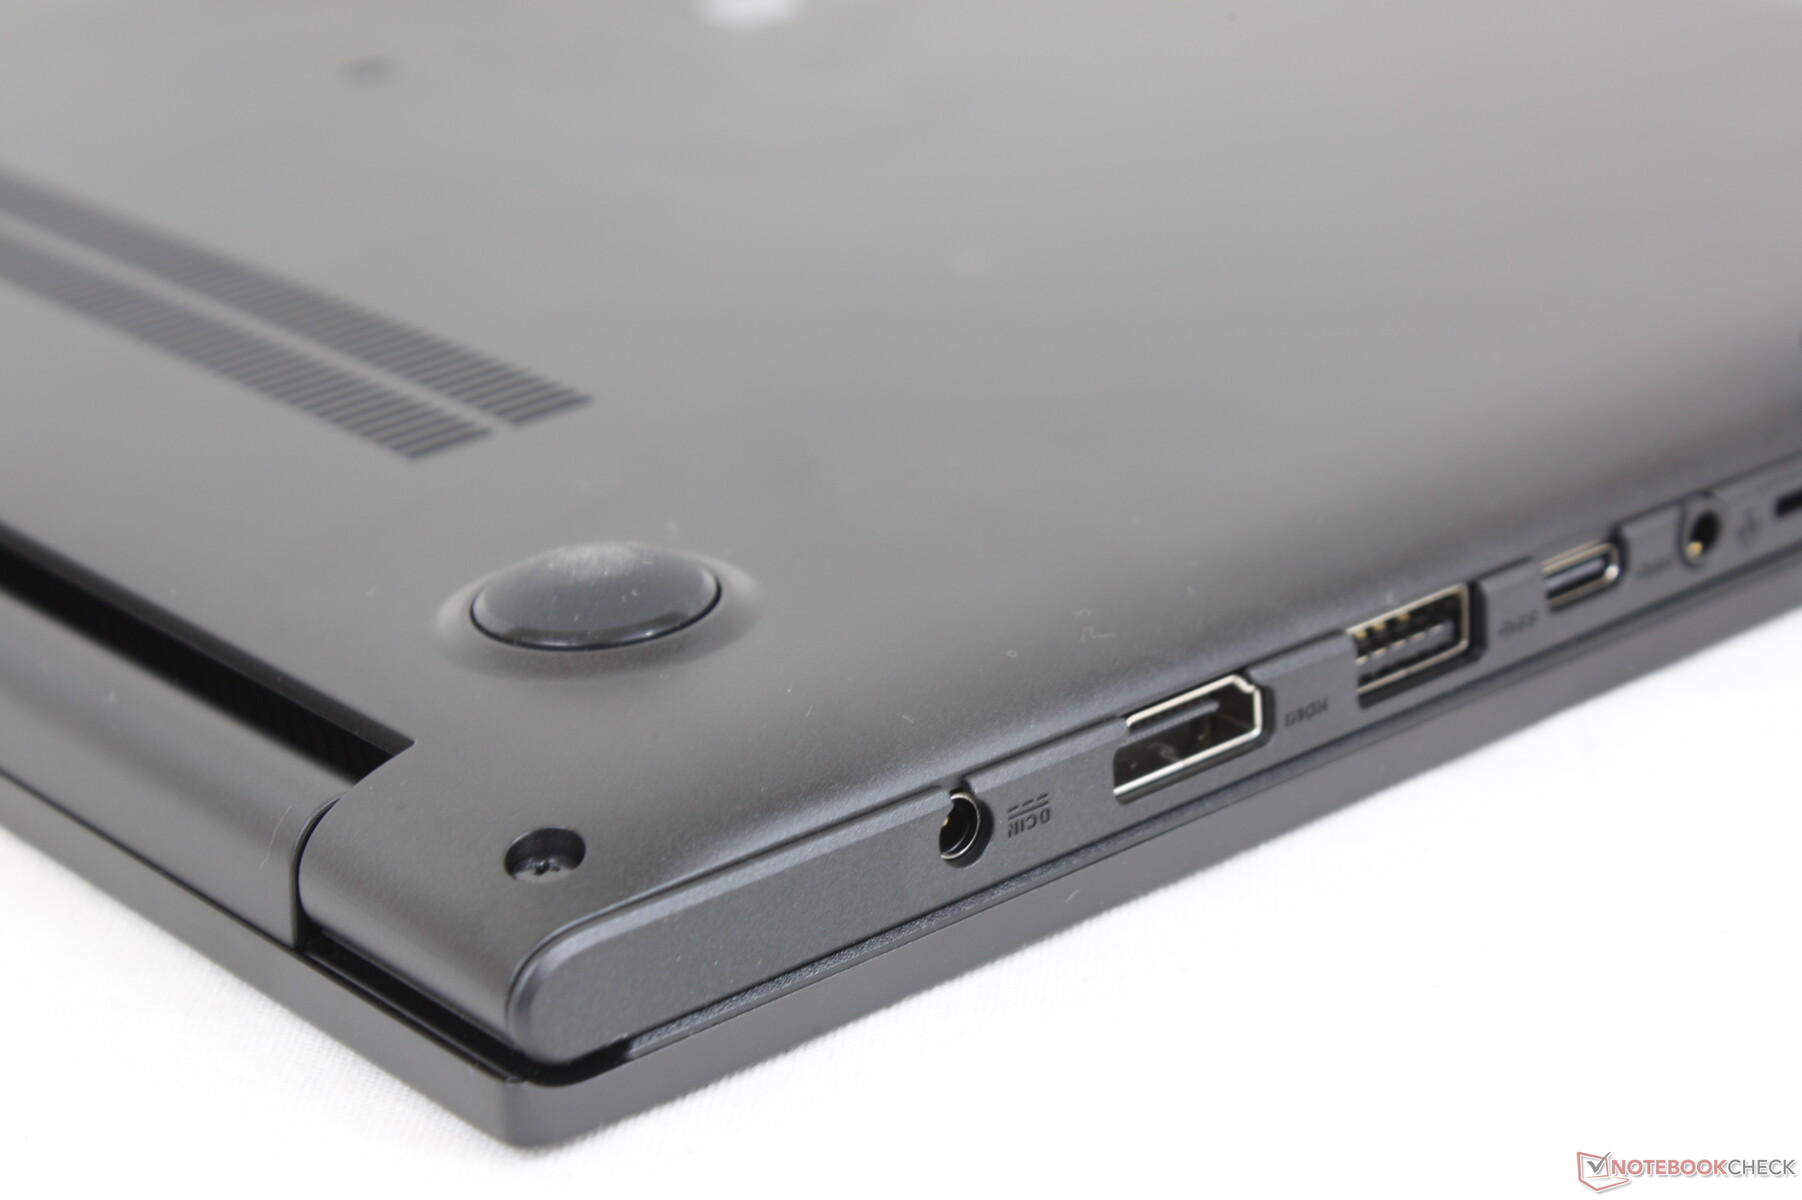
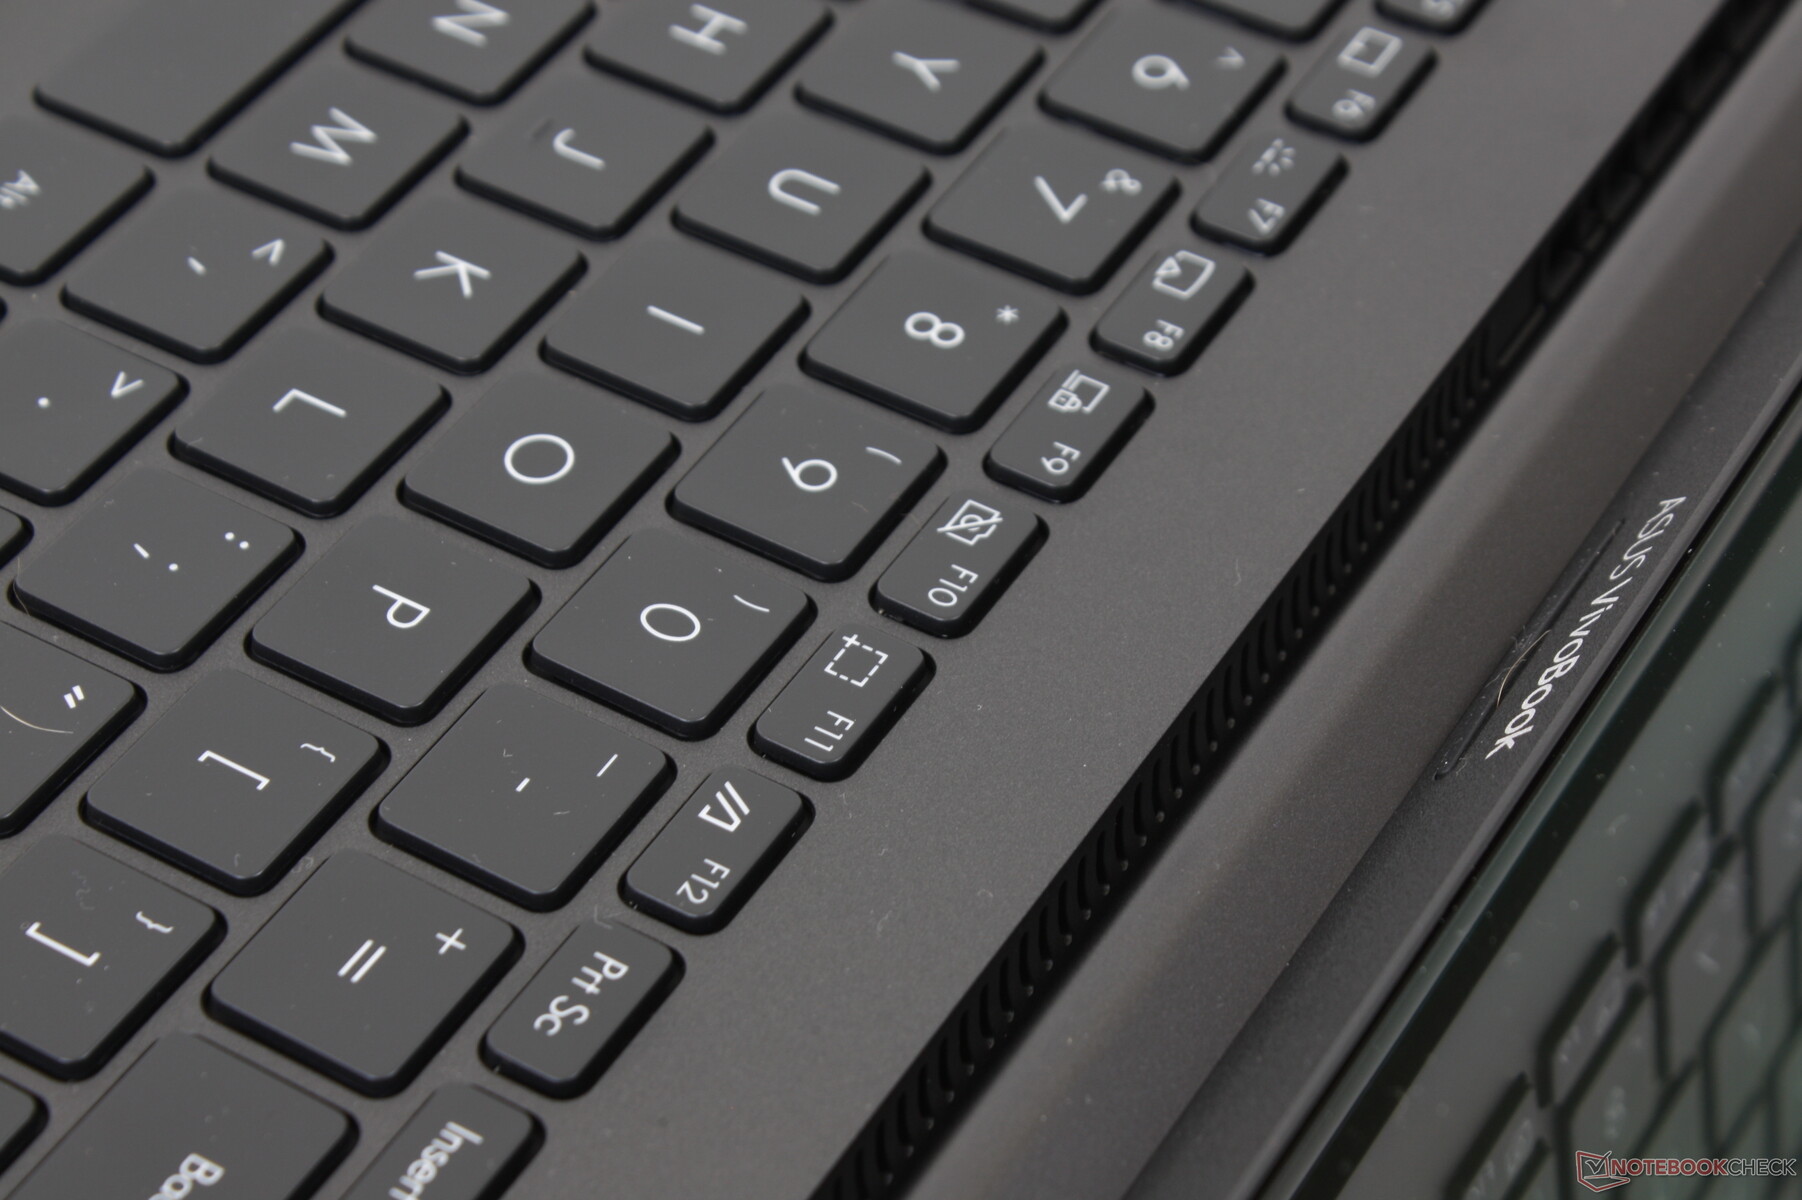
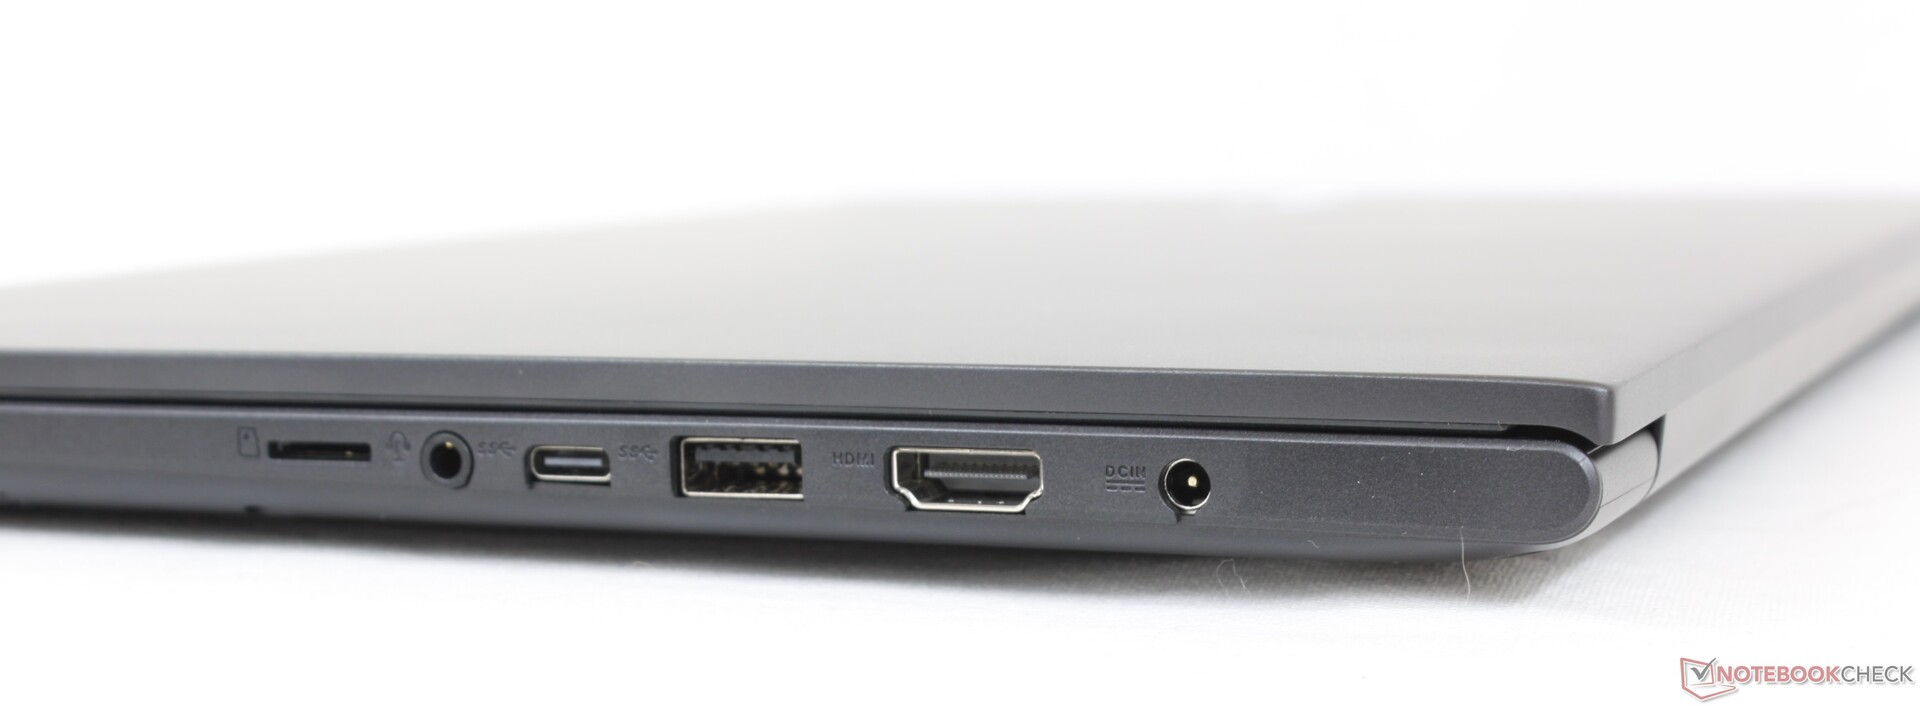
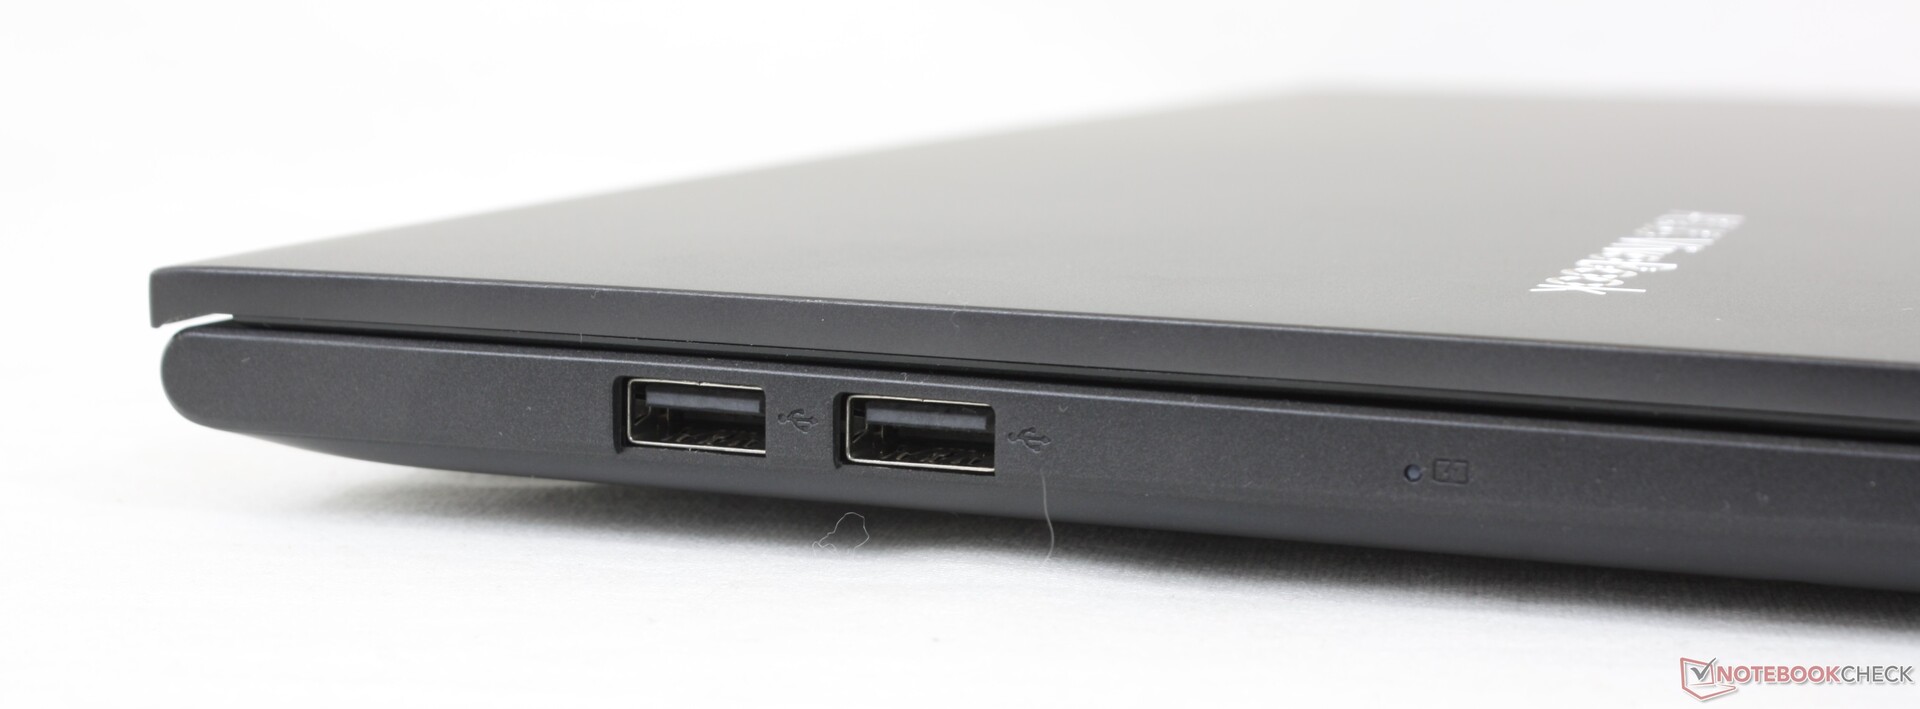
连接性 - 没有Thunderbolt或USB-C充电功能
端口选项是体面的,但有令人失望的注意事项。首先,USB-C端口不支持DisplayPort或Power Delivery,这意味着你无法通过这个端口连接外部显示器或为系统充电,这与大多数其他笔记本电脑不同。其次,HDMI端口只有1.4版本,意味着它不支持60FPS的4K外部显示器。该模型甚至利用了比USB-A 3.0更慢的USB-A 2.0端口。
SD卡阅读器
弹簧式MicroSD读卡器的速度仍然很慢,以反映预算型Vivobook系列。将1GB的图片从我们的UHS-II测试卡移动到桌面需要大约30秒,而在ZenBook 15上只需要14秒。

| SD Card Reader | |
| average JPG Copy Test (av. of 3 runs) | |
| HP Pavilion 15-eg (AV PRO microSD 128 GB V60) | |
| Asus VivoBook 15 Pro M3500QC-L1062 (AV Pro V60) | |
| Asus Vivobook 15 K513EQ (AV Pro V60) | |
| Lenovo IdeaPad 5 15ALC05 (Toshiba Exceria Pro SDXC 64 GB UHS-II) | |
| Asus VivoBook S15 S533EQ-BQ002T (Toshiba Exceria Pro M501 microSDXC 64GB) | |
| Dell Inspiron 15 3501 (AV Pro SD 128 GB V60) | |
| maximum AS SSD Seq Read Test (1GB) | |
| HP Pavilion 15-eg (AV PRO microSD 128 GB V60) | |
| Asus VivoBook 15 Pro M3500QC-L1062 (AV Pro V60) | |
| Asus Vivobook 15 K513EQ (AV Pro V60) | |
| Lenovo IdeaPad 5 15ALC05 (Toshiba Exceria Pro SDXC 64 GB UHS-II) | |
| Dell Inspiron 15 3501 (AV Pro SD microSD 128 GB V60) | |
| Asus VivoBook S15 S533EQ-BQ002T (Toshiba Exceria Pro M501 microSDXC 64GB) | |
沟通
我们的测试设备配备了Wi-Fi 6,而较少的SKU配备了Wi-Fi 5。在Netgear RAX200测试路由器上,我们能够达到超过1.2 Gbps的出色的实际平均接收率,而传输率则更令人失望,只有约600 Mbps。
网络摄像头
相机质量仍然很差,而且多年来基本没有变化。也不支持Windows Hello,因为没有集成红外传感器,甚至没有物理隐私快门。


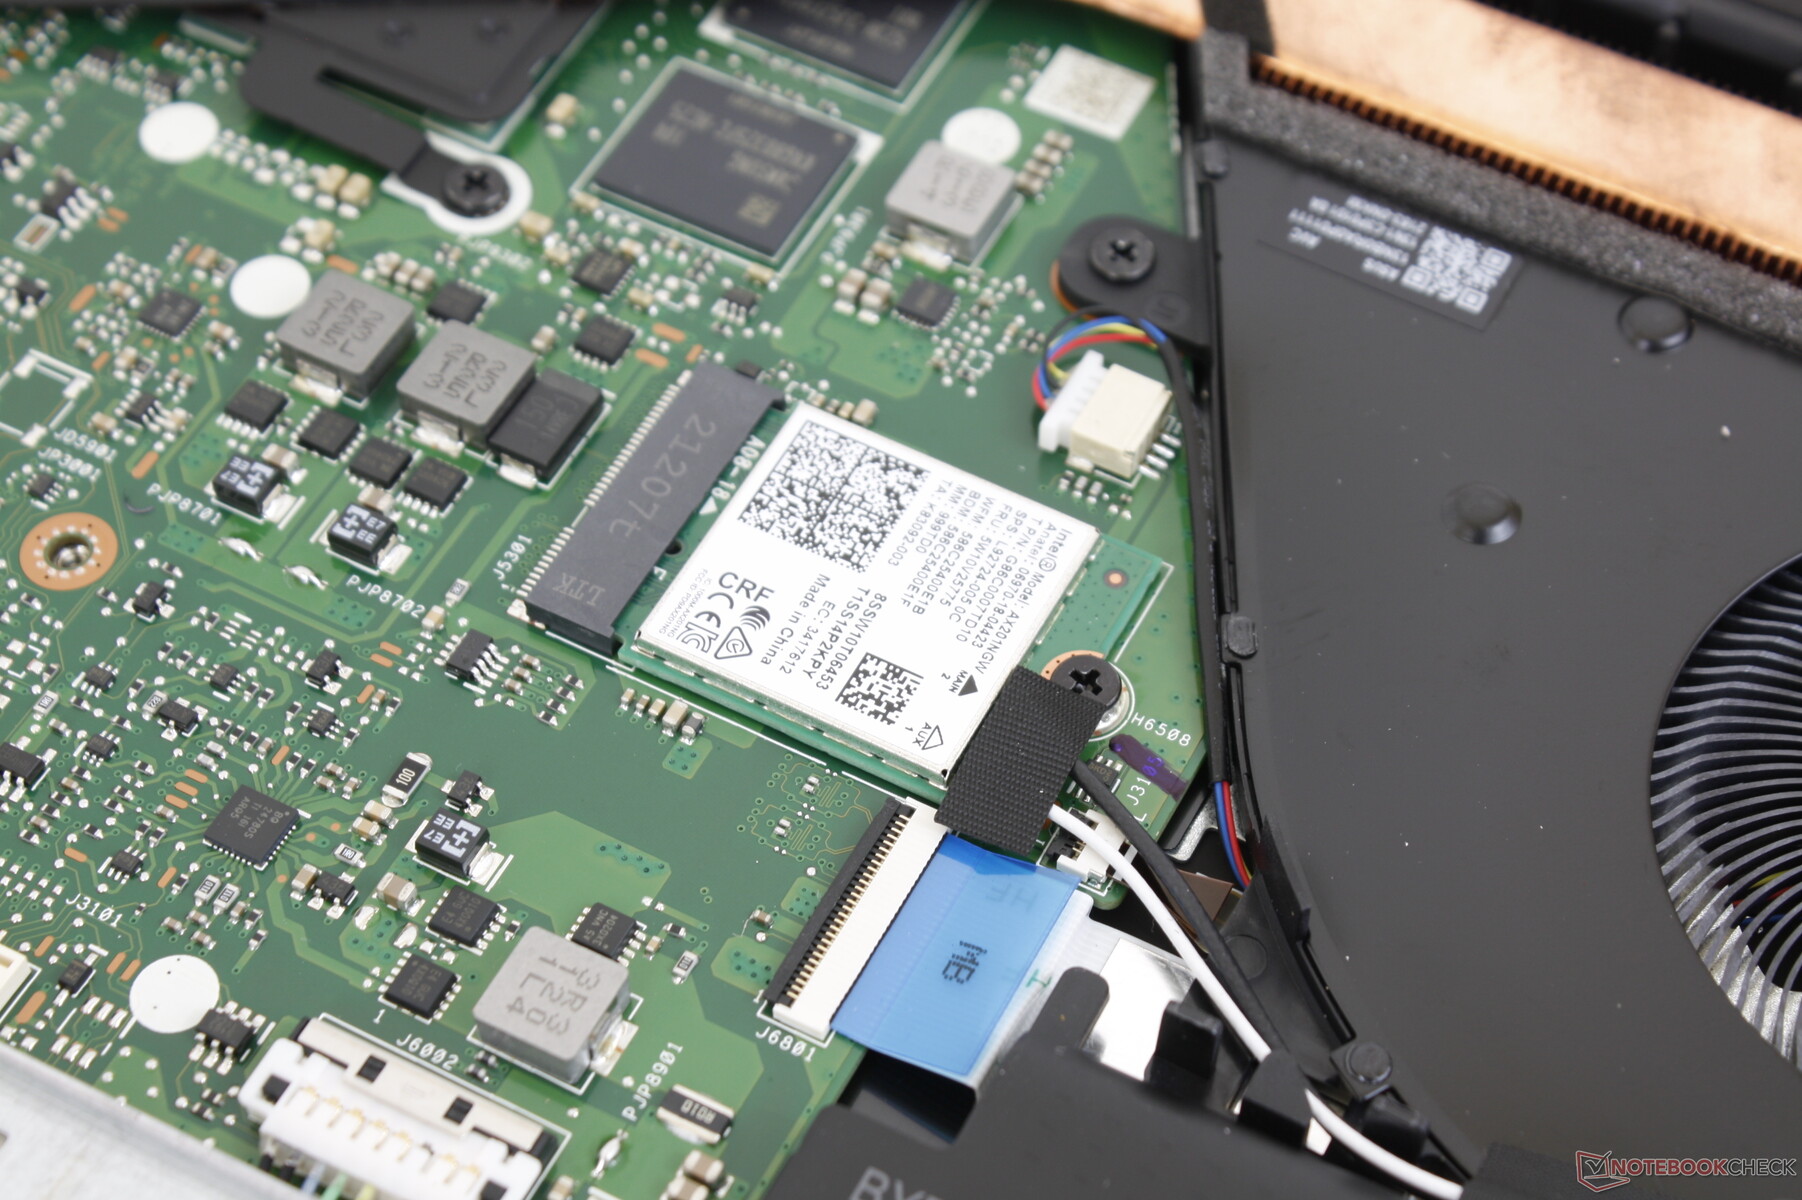
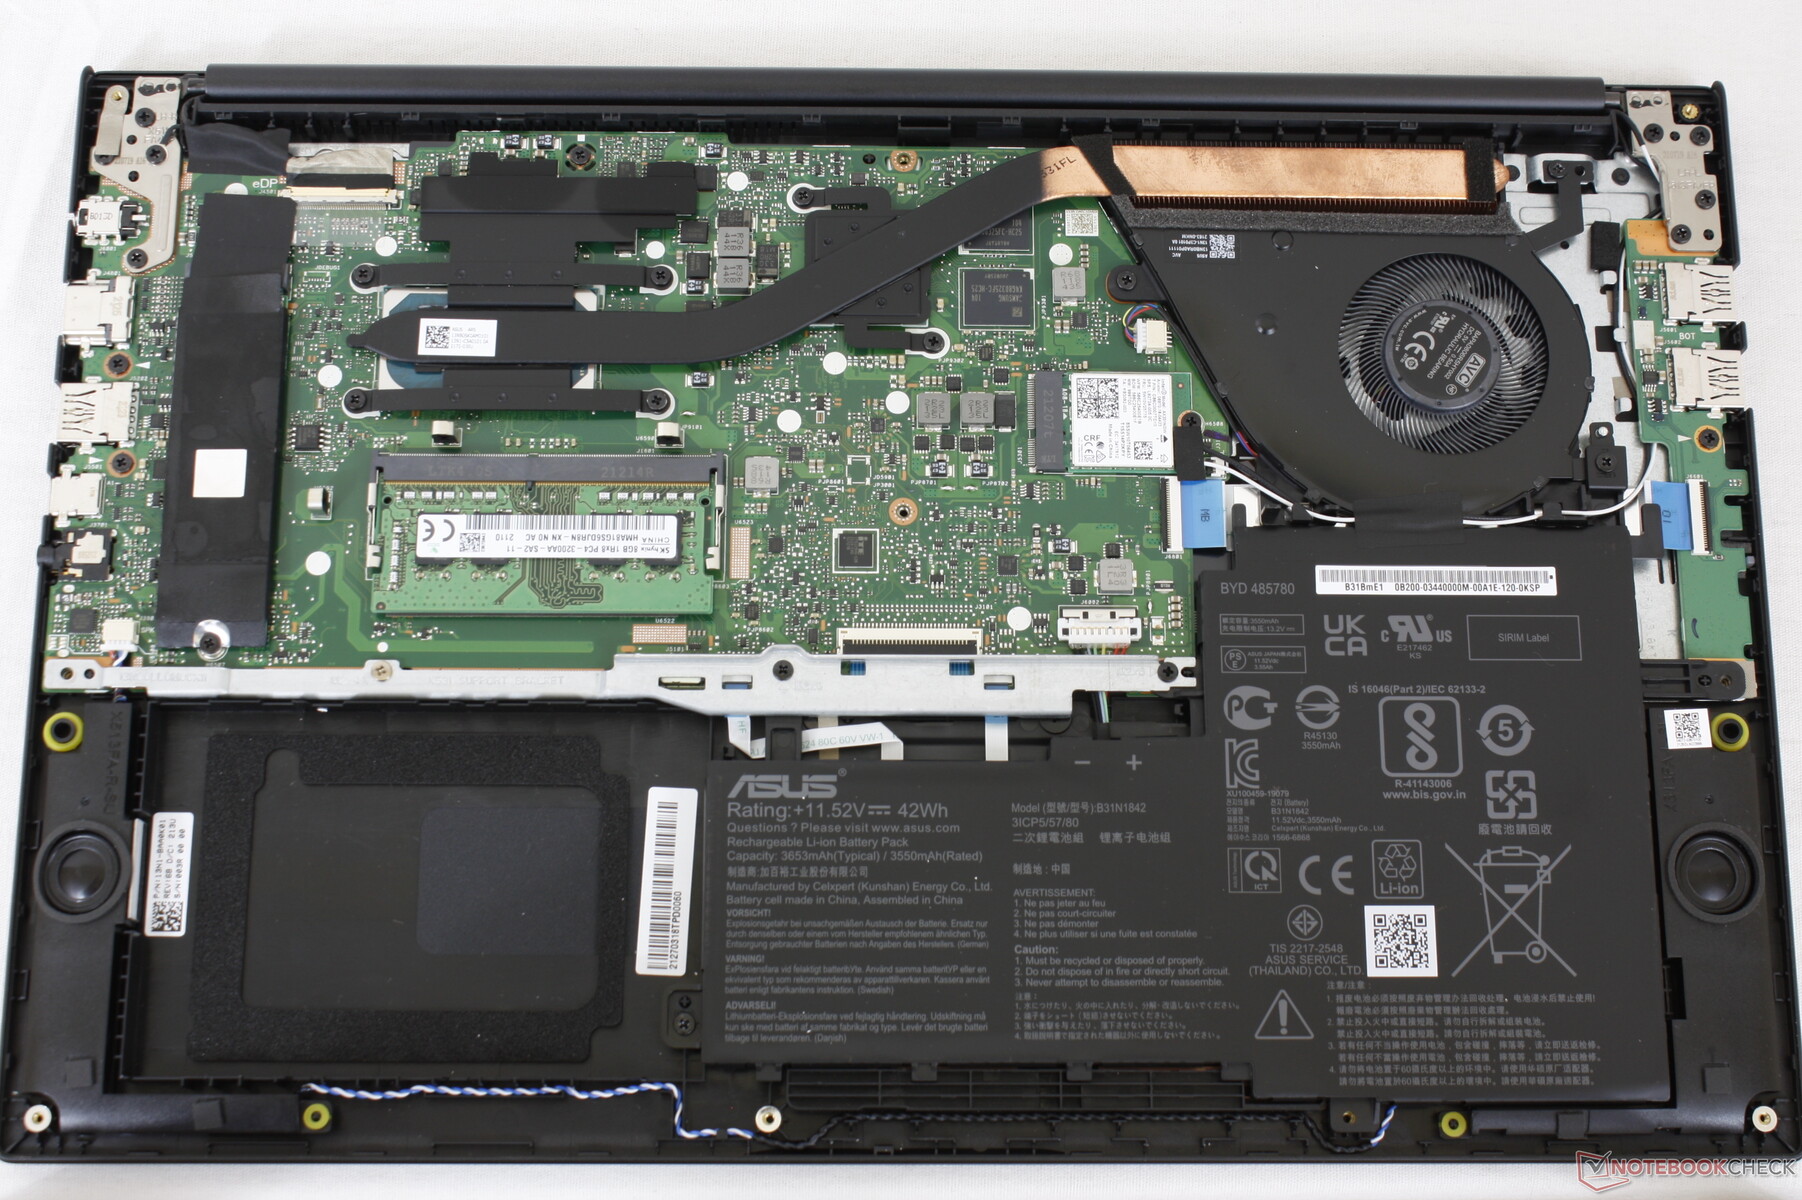
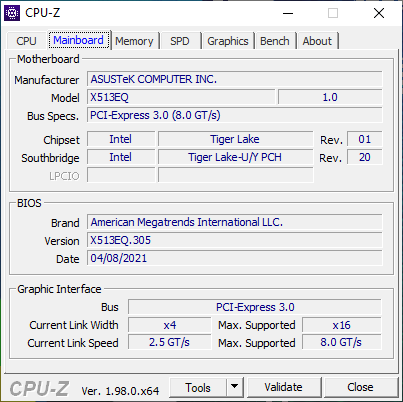
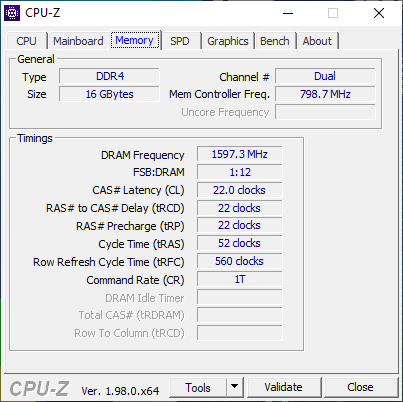
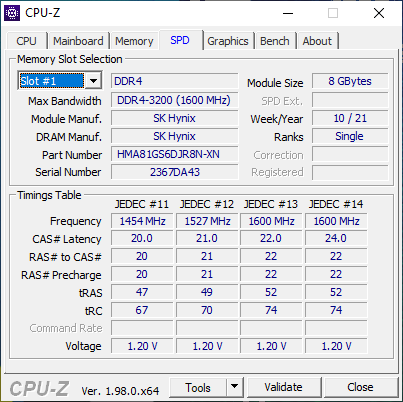
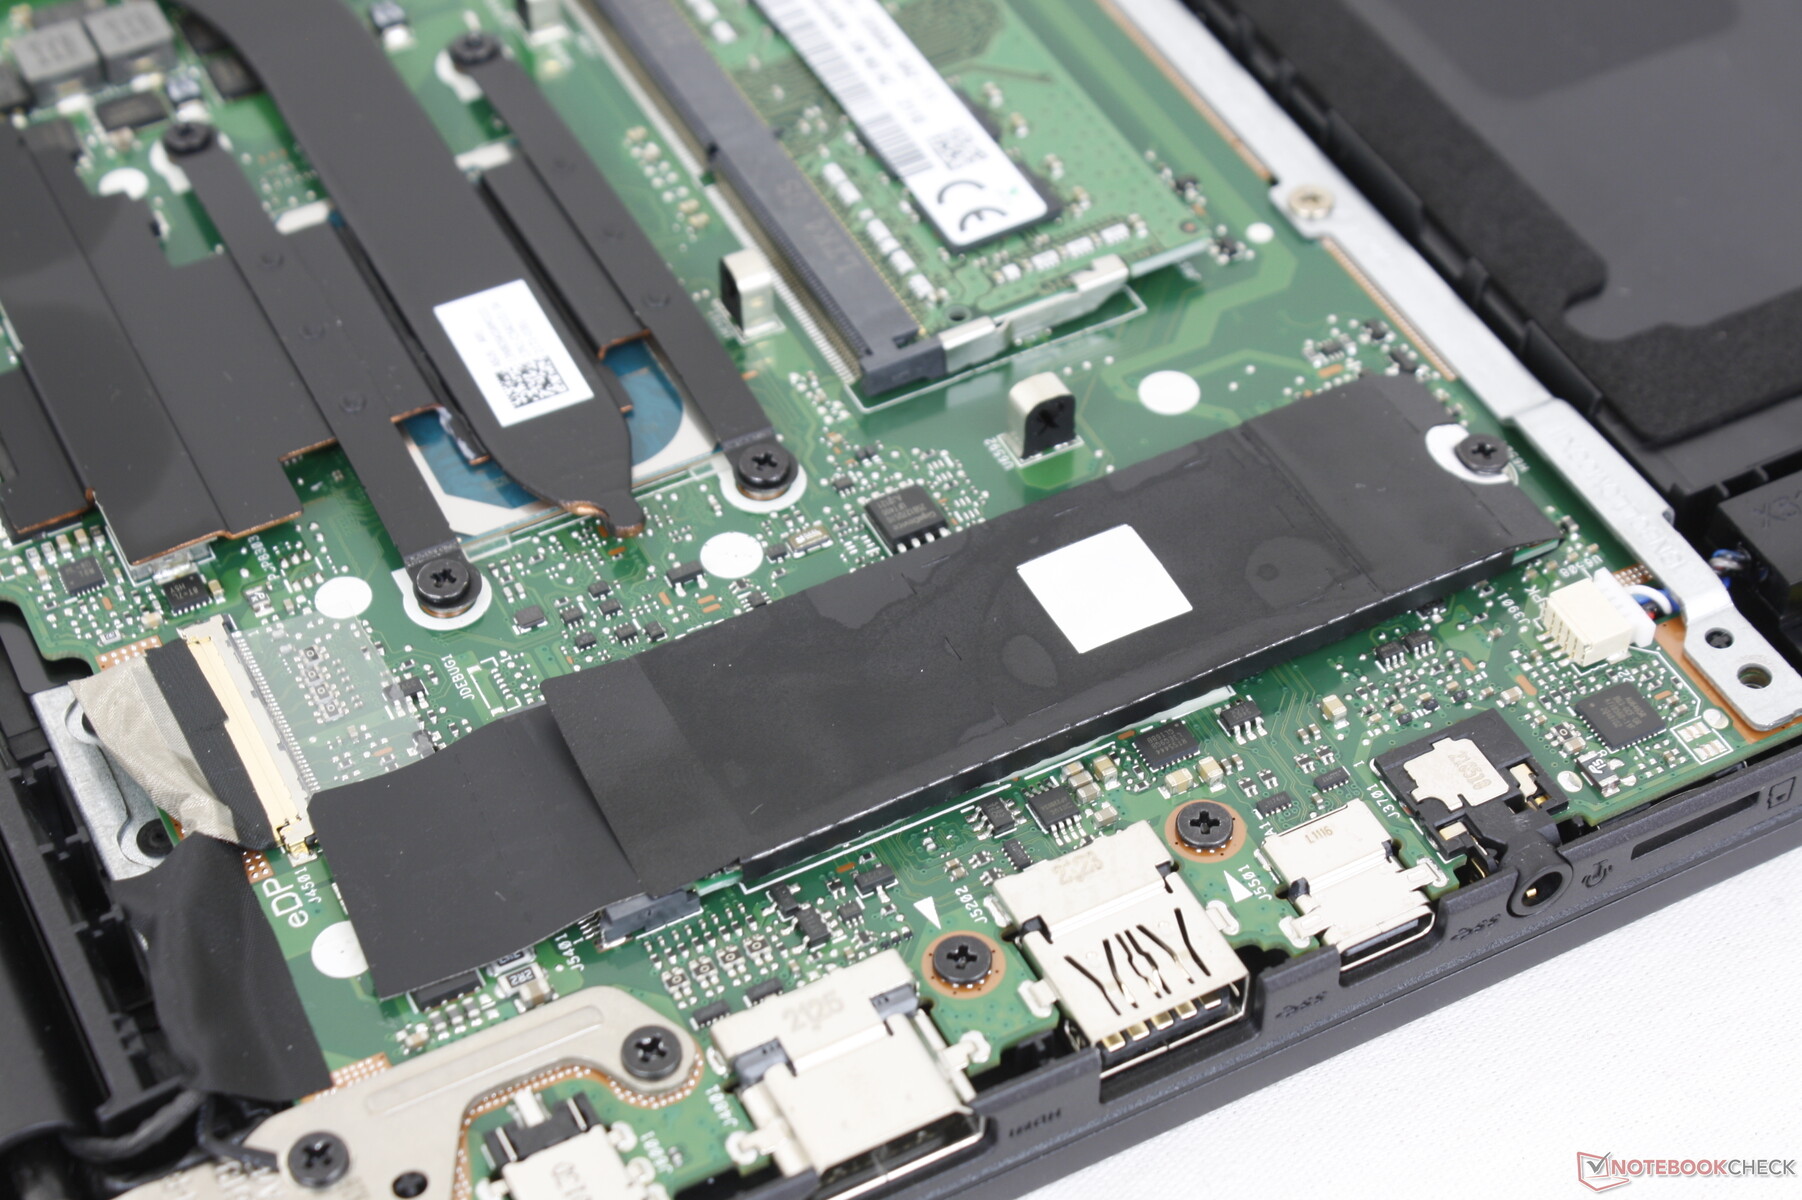
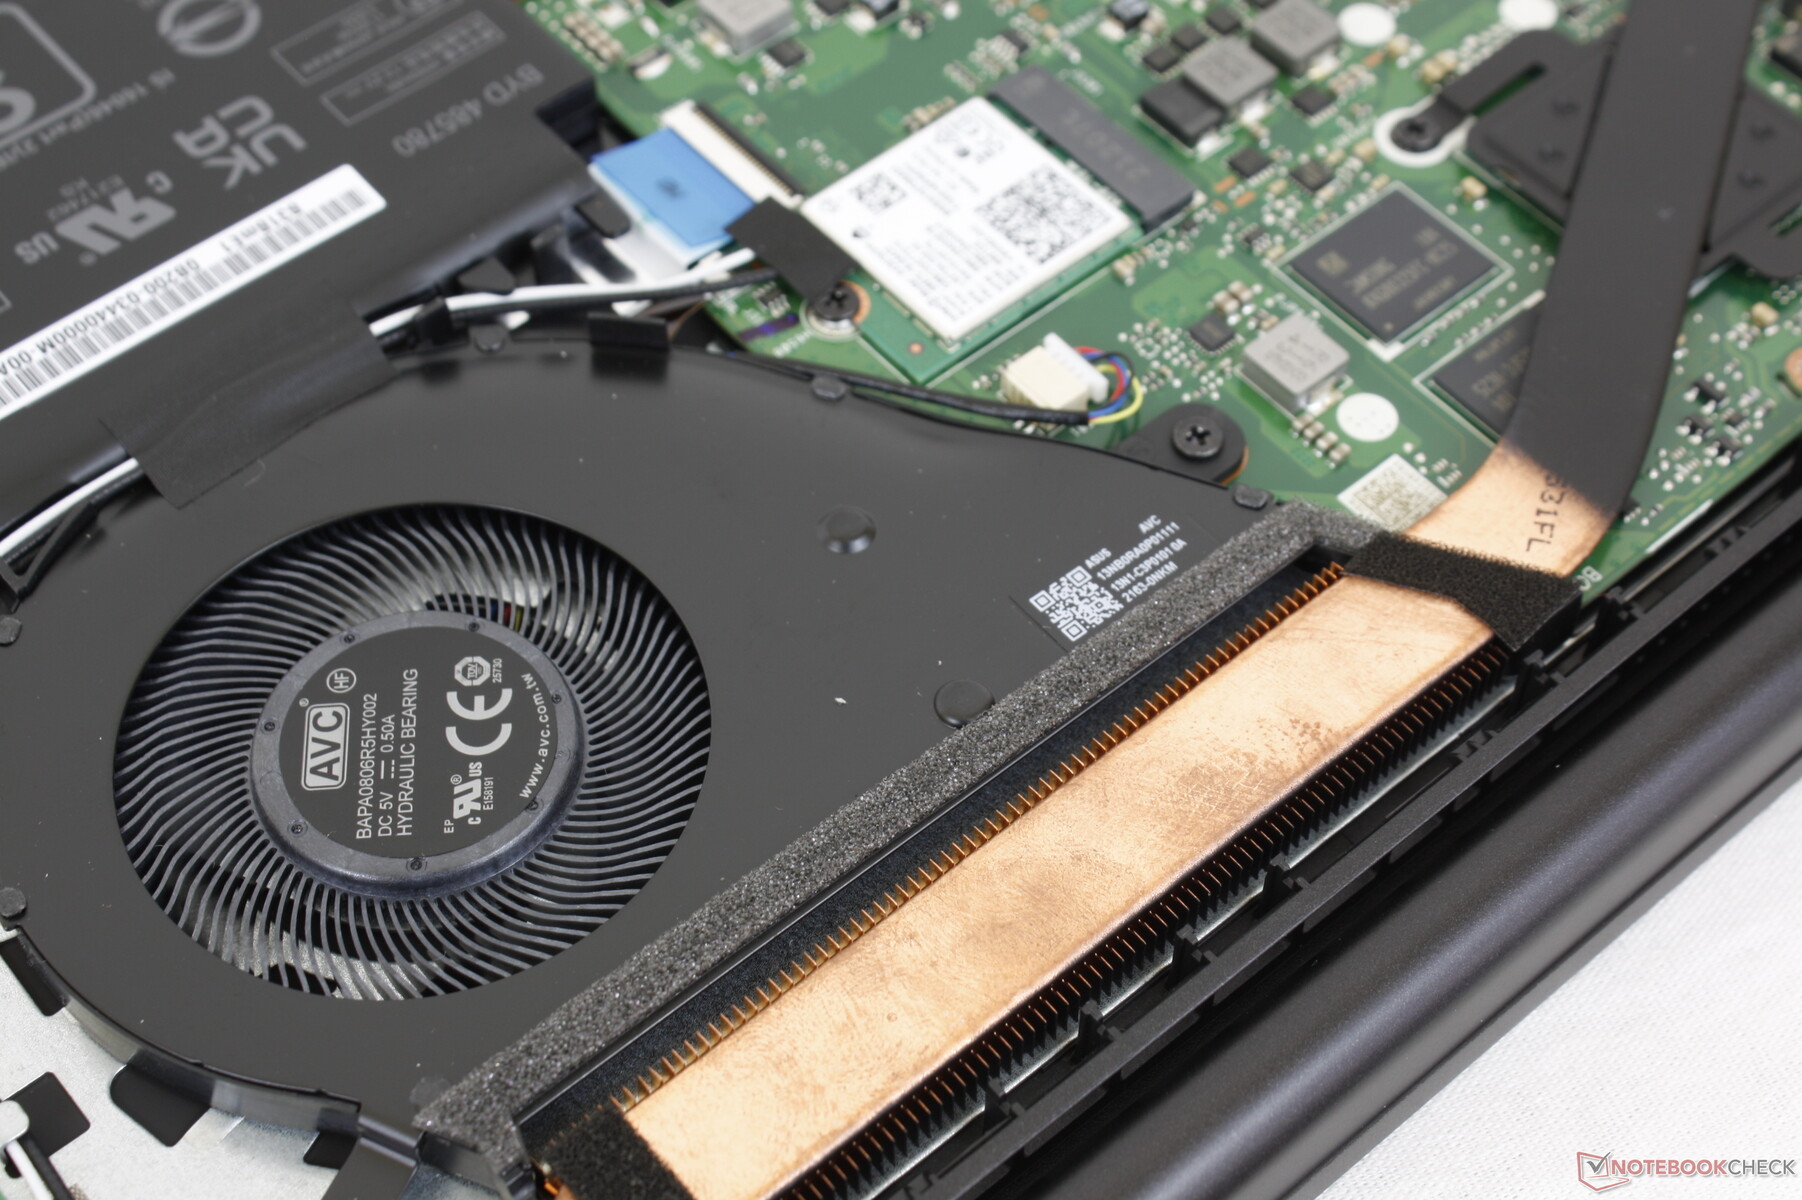
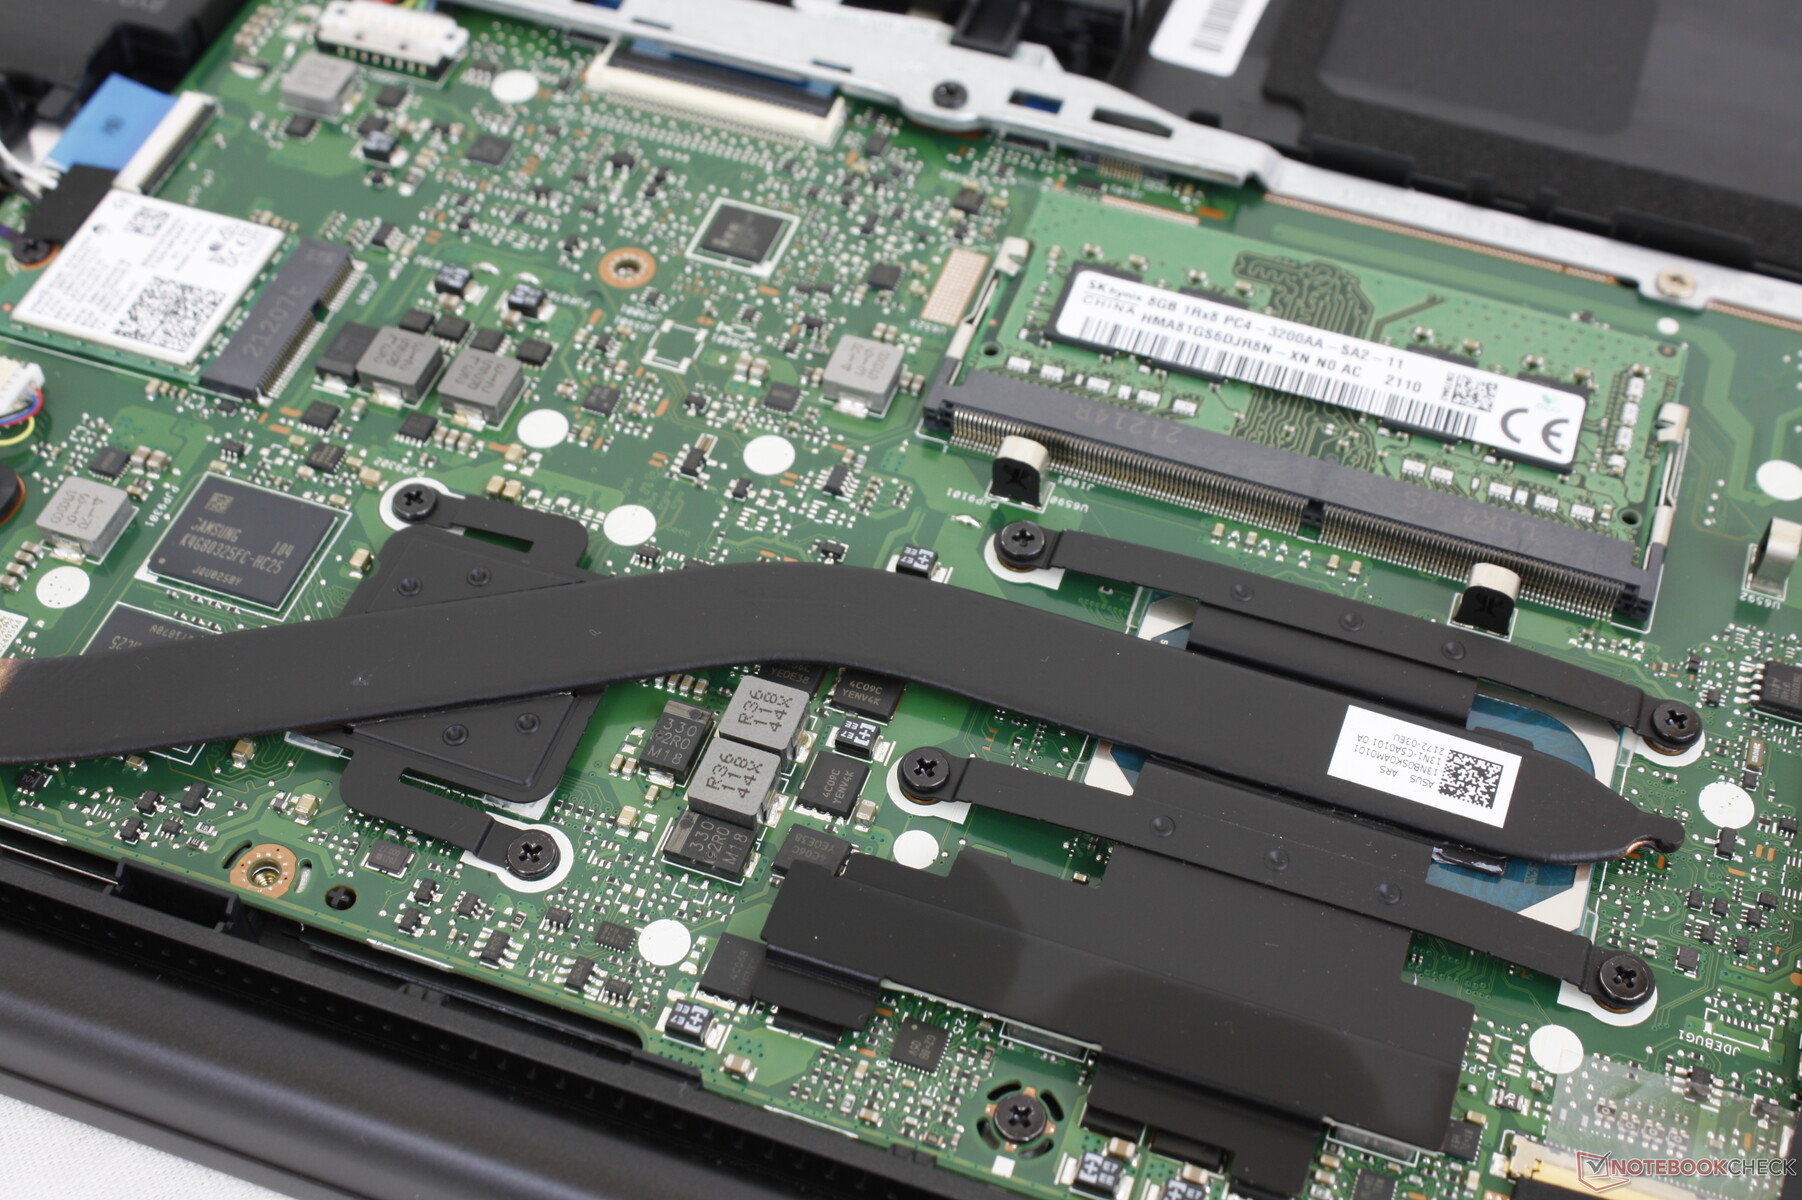
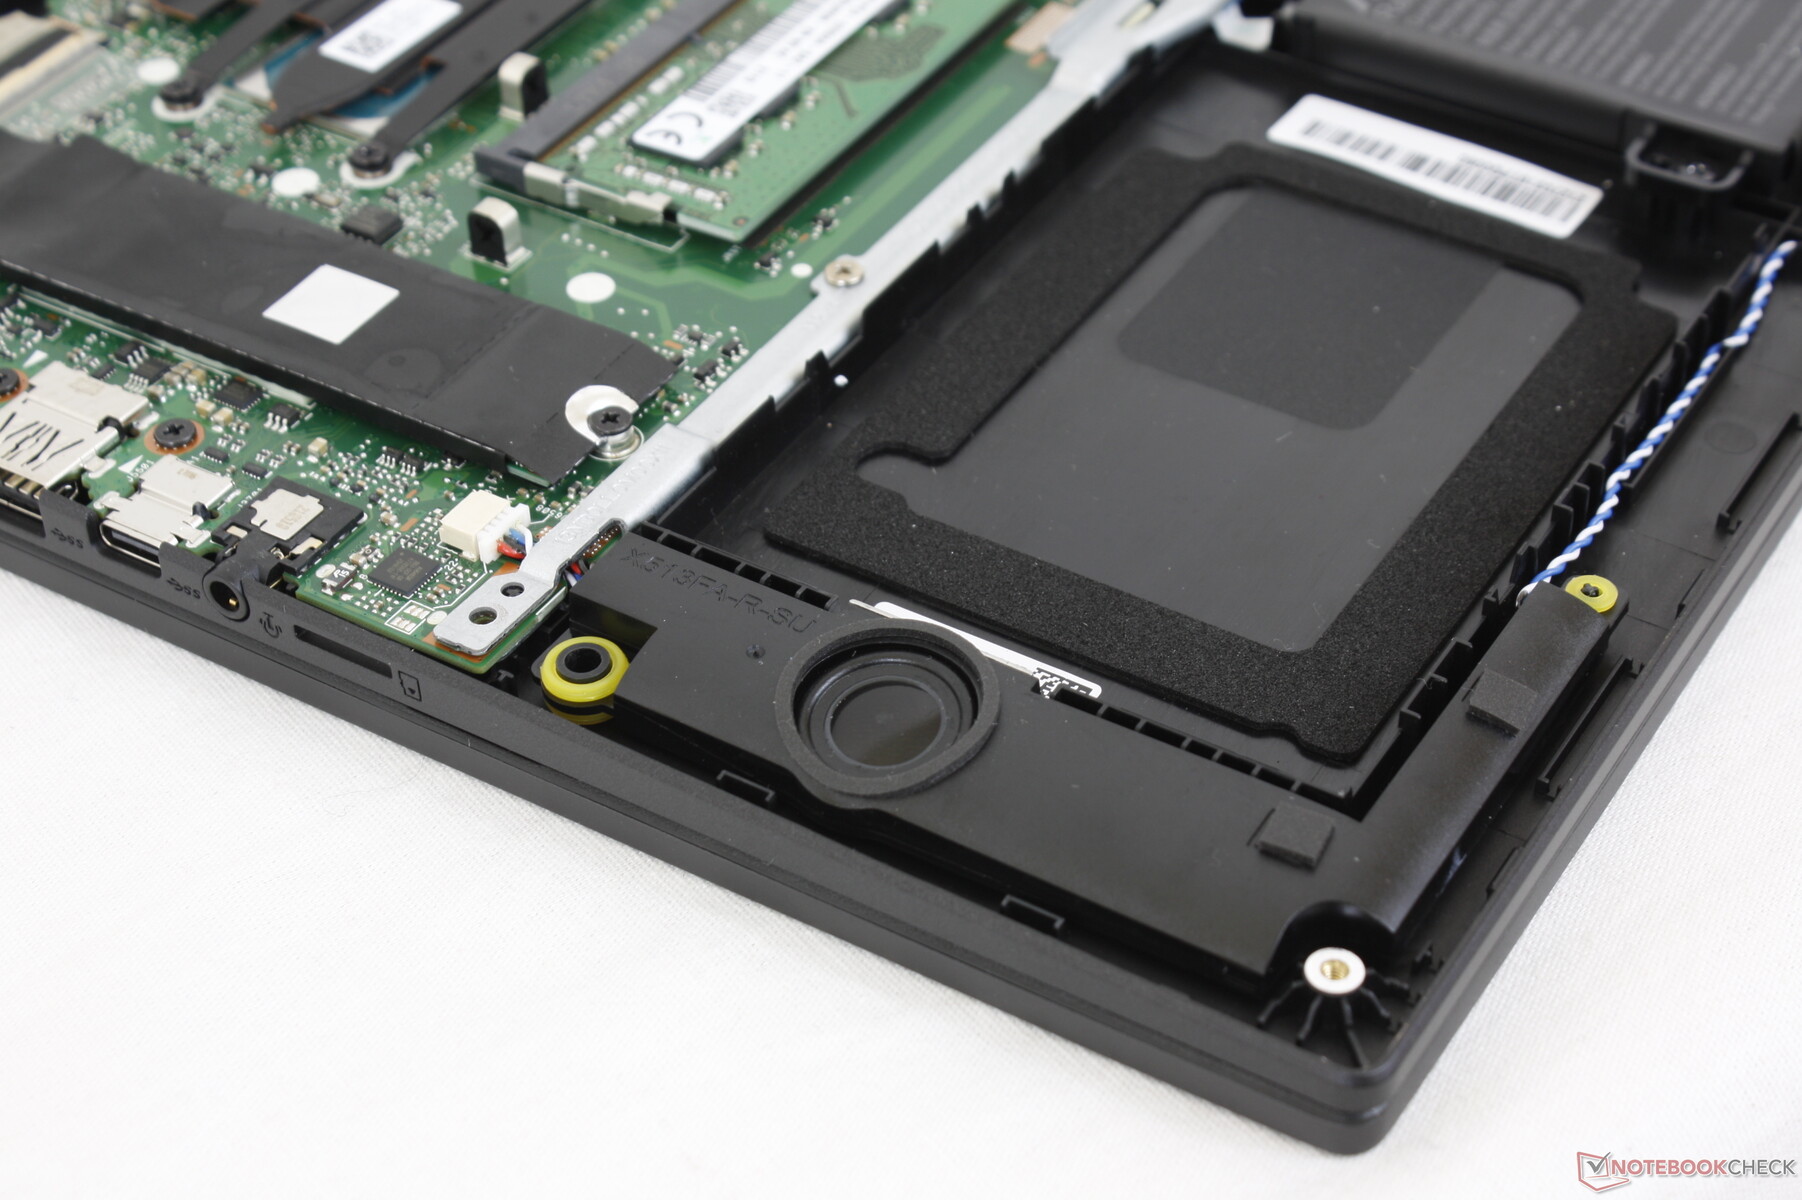
维护 - 易于打开
底部面板可以用飞利浦螺丝刀和锋利的边缘很容易地取出来,以揭开单一的SODIMM插槽,WLAN模块和M.2 2280 PCIe3 x4插槽。一个基本的8GB单通道RAM是焊接的,可以与一个8GB的可移动模块配对,总容量可达16GB。
配件和保修
除了文件和交流电适配器外,零售盒中没有其他额外的东西。标准的一年有限制造商保修适用。
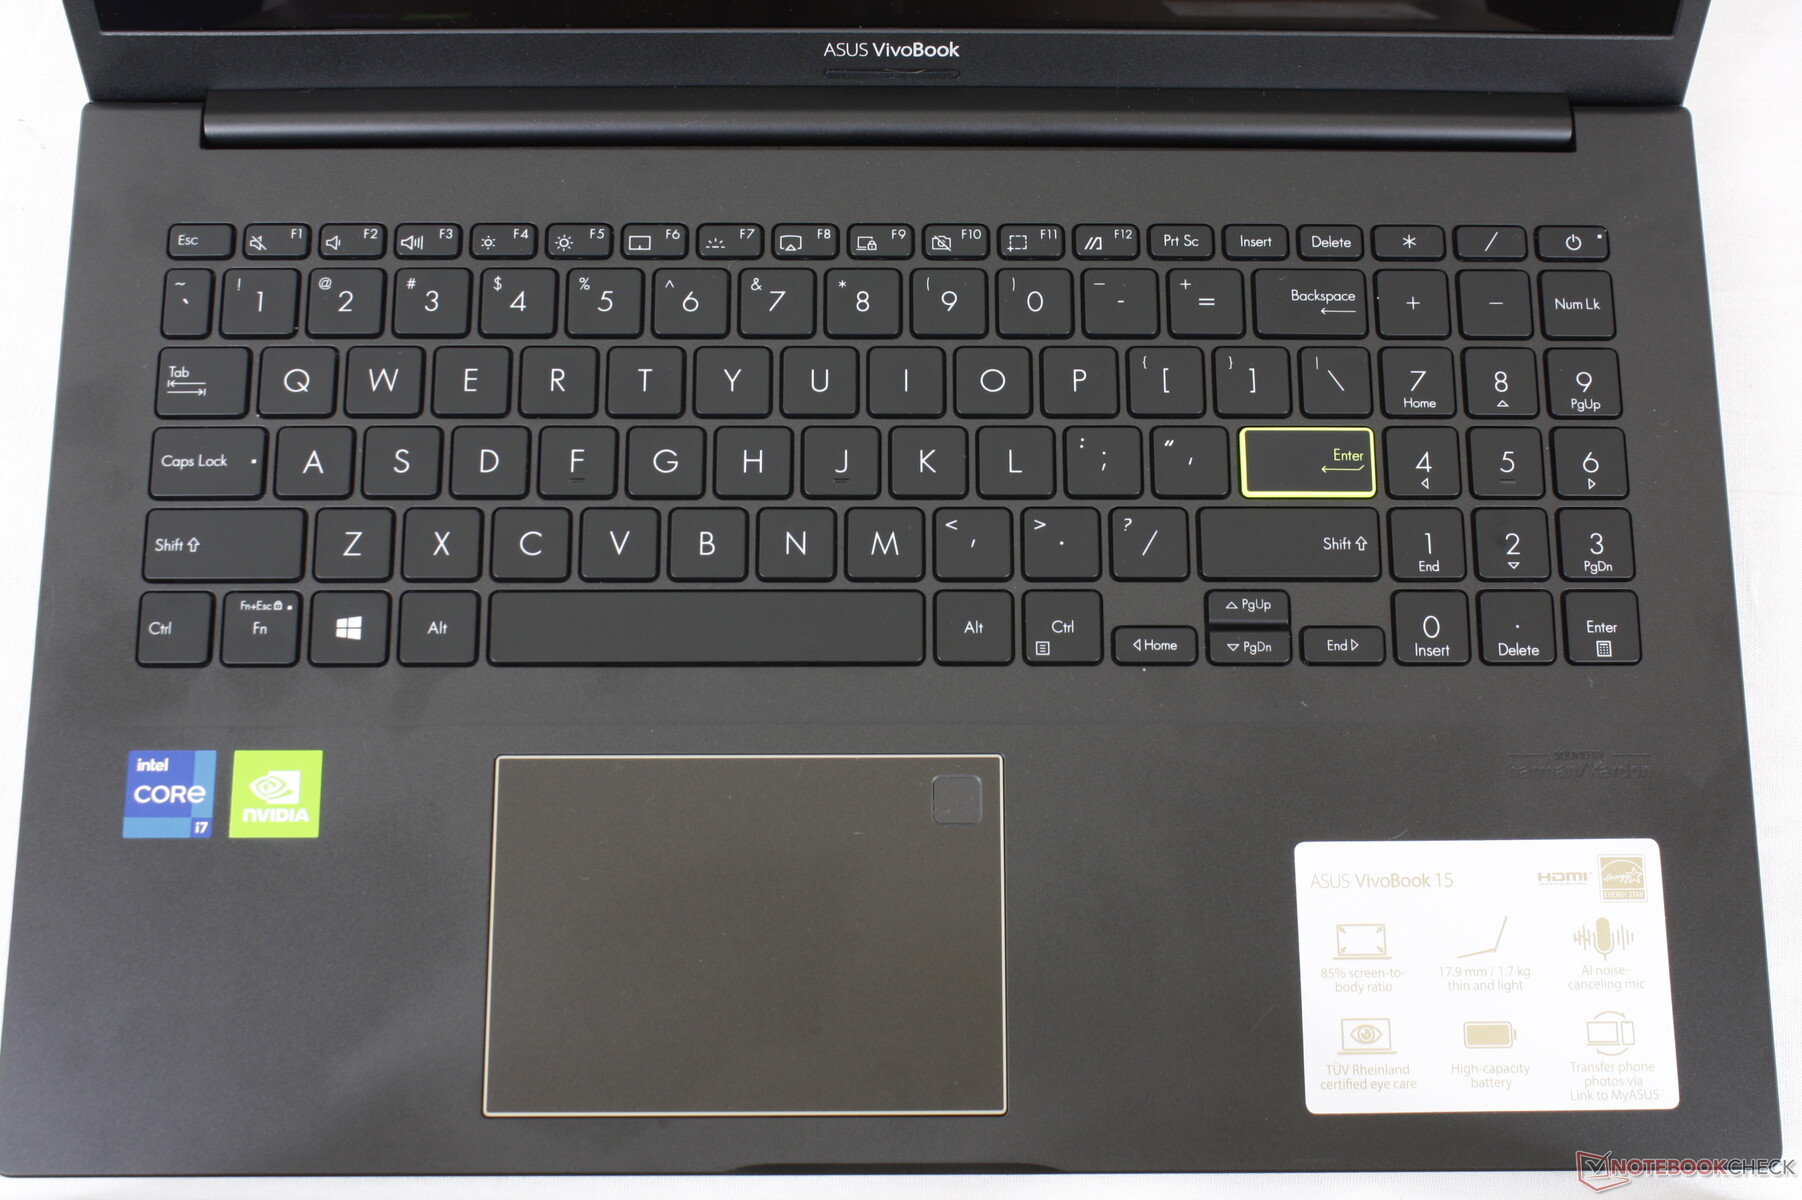
输入设备--海绵状点击板
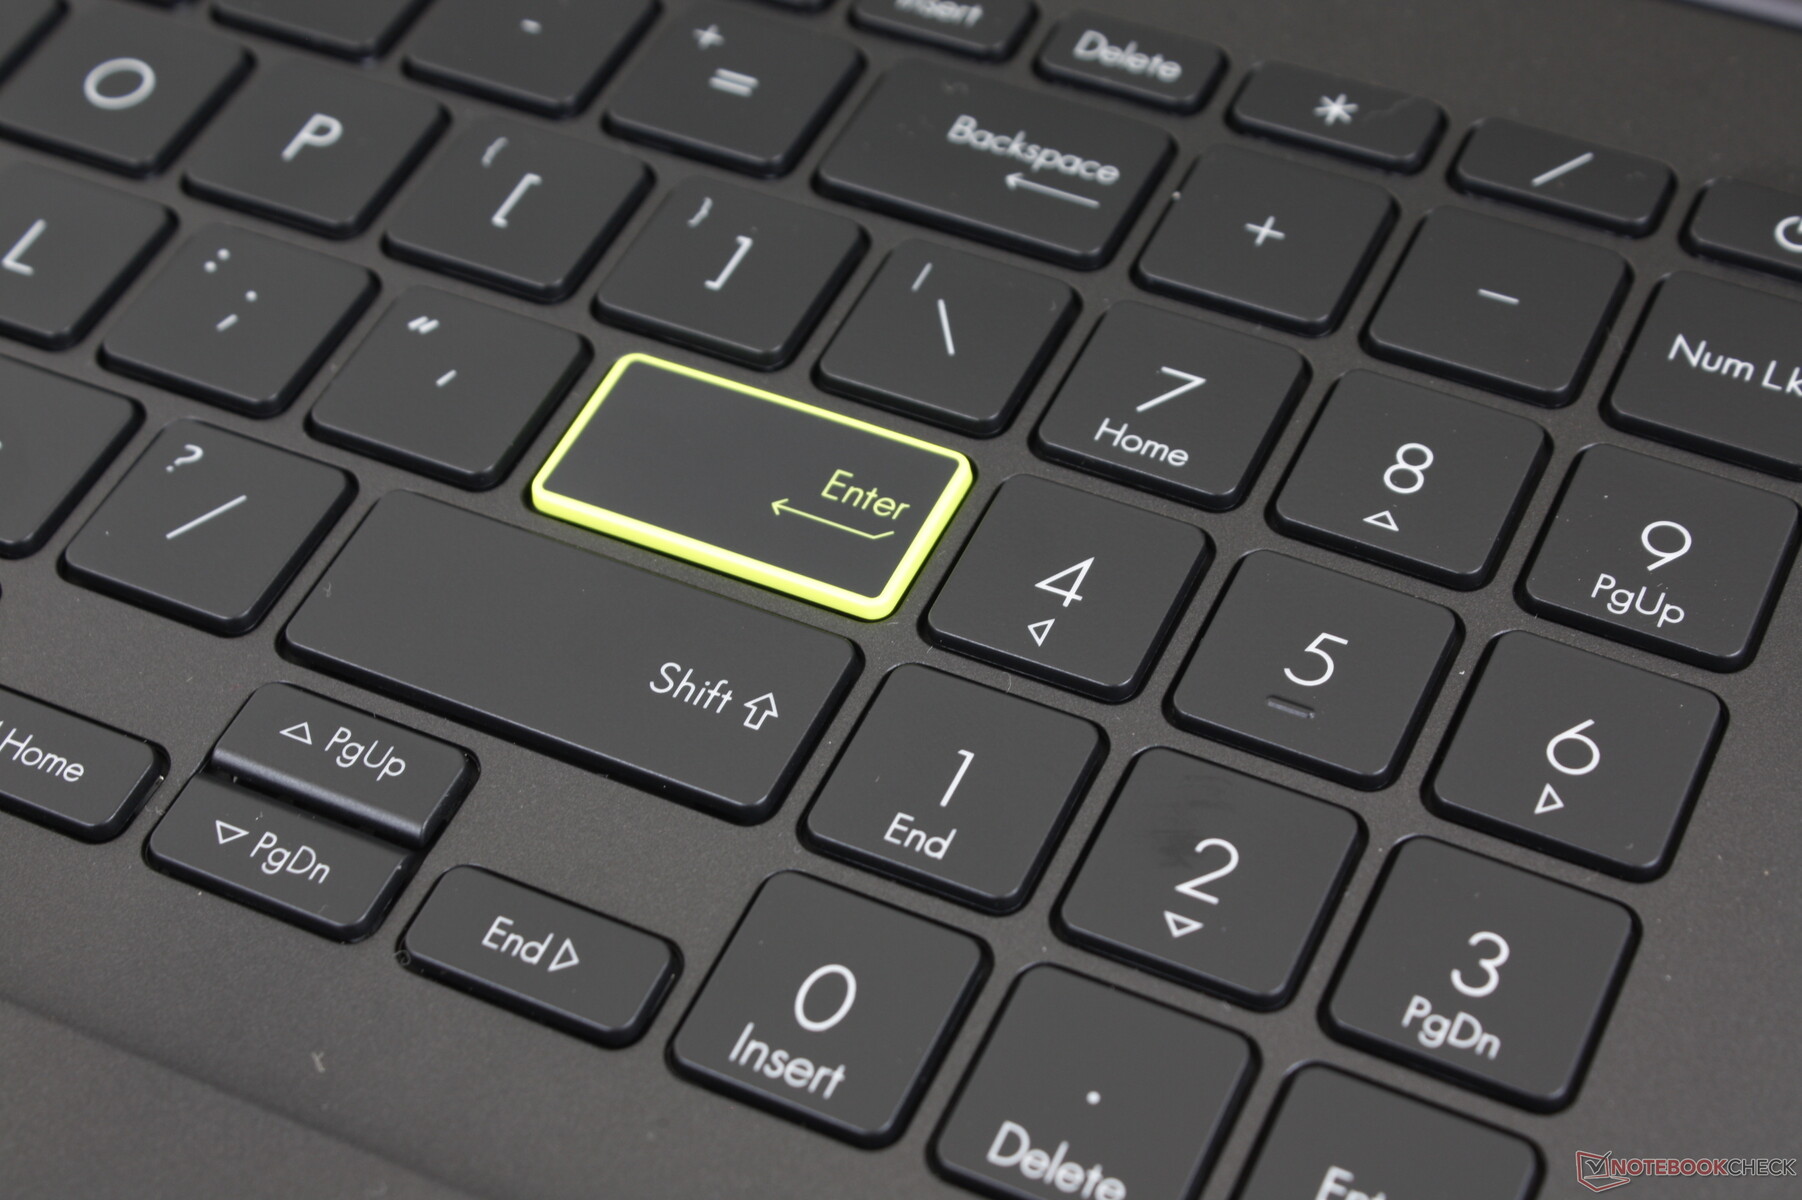
键盘
如果你以前在VivoBook笔记本电脑上打过字,那么你会清楚地知道对VivoBook 15 K513的期望,因为在键盘反馈方面,各型号之间的差异非常小。与以商务为中心的笔记本电脑的较硬的按键相比,行程和触感都分别保持较浅和较软。 联想ThinkPad或惠普EliteBook更硬。键盘的按键 联想IdeaPad 5 15感觉与我们这里的华硕相似,但华硕的按键声音适度偏大。
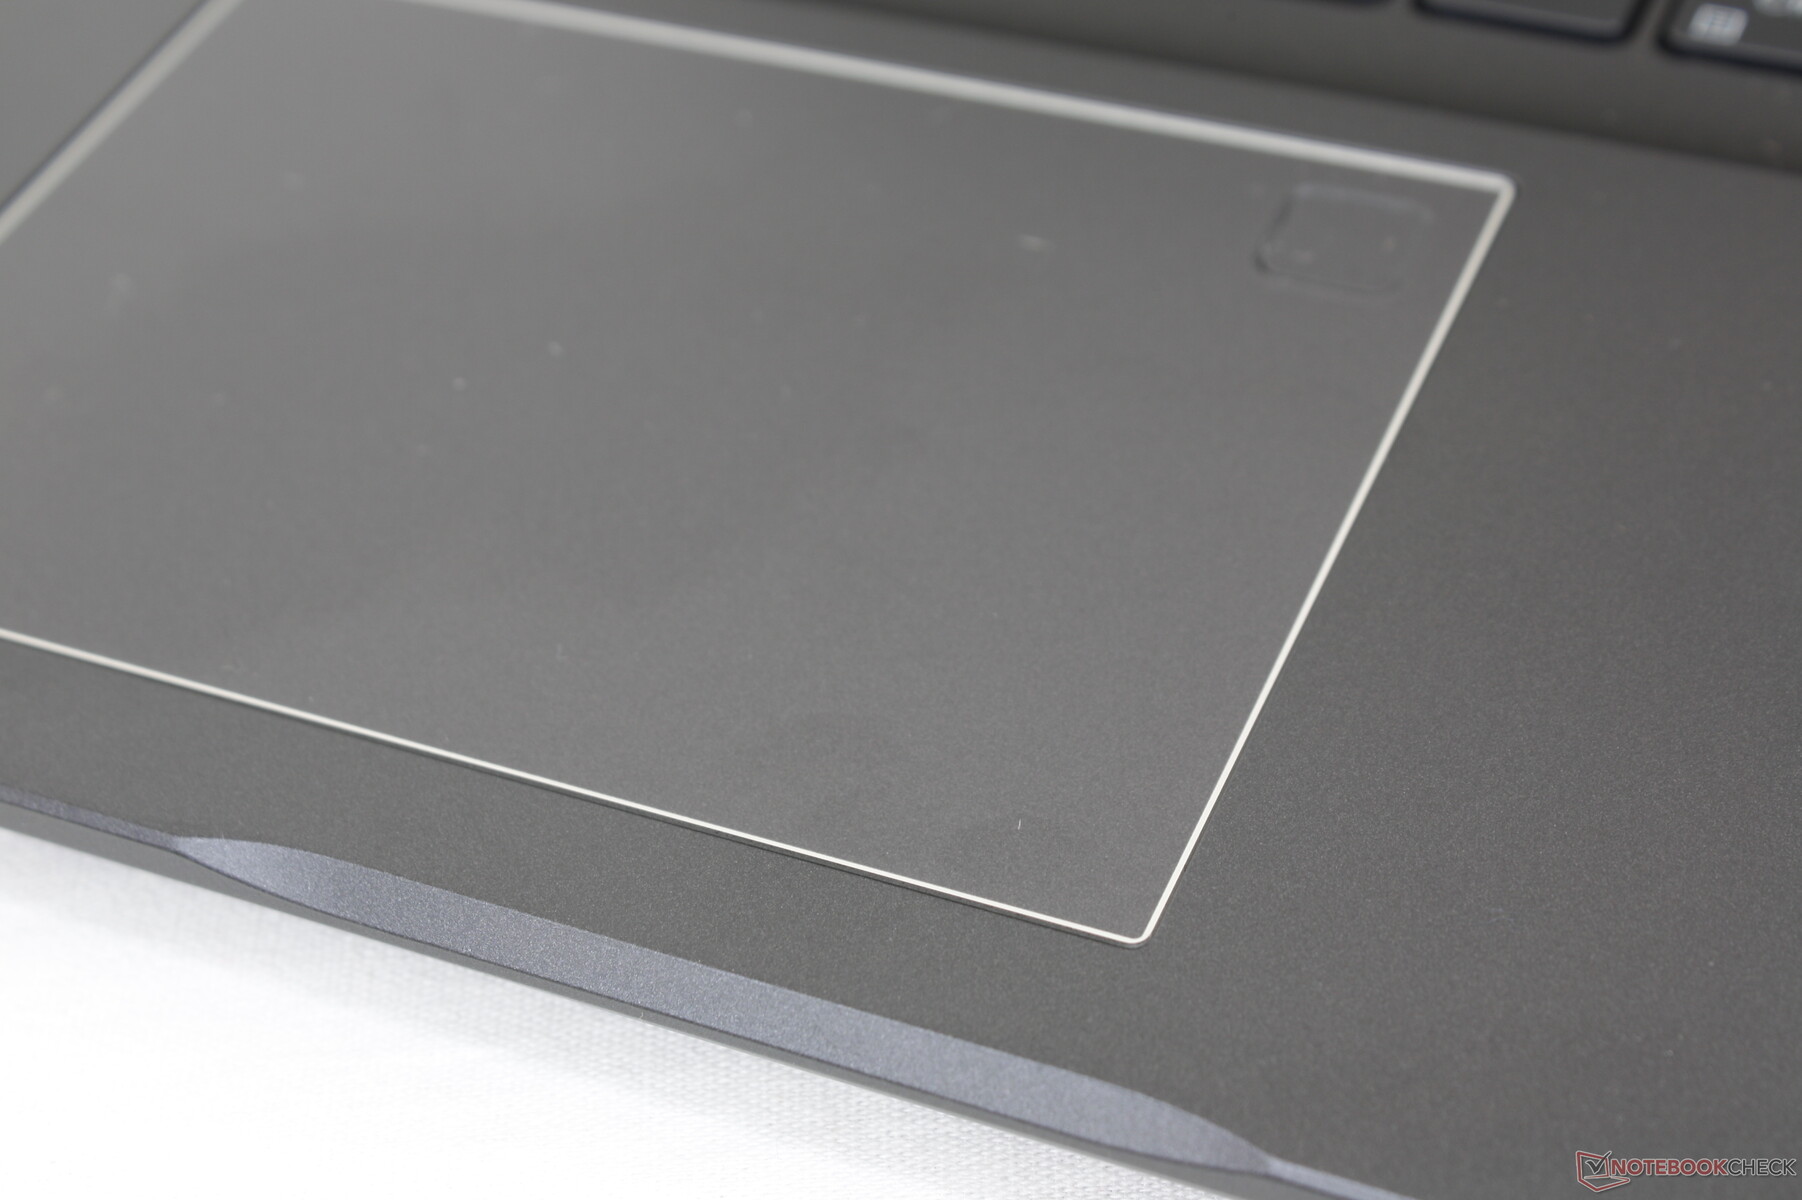
触摸板
点击板(约10.5 x 7.3厘米)很差,即使按预算标准也低于平均水平。虽然常规的光标移动是平滑的,没有任何突然的跳跃,但其集成的鼠标键太过松软和浅薄。因此,点击感觉不满意,特别是在点击和拖动或执行其他多点触摸动作时。

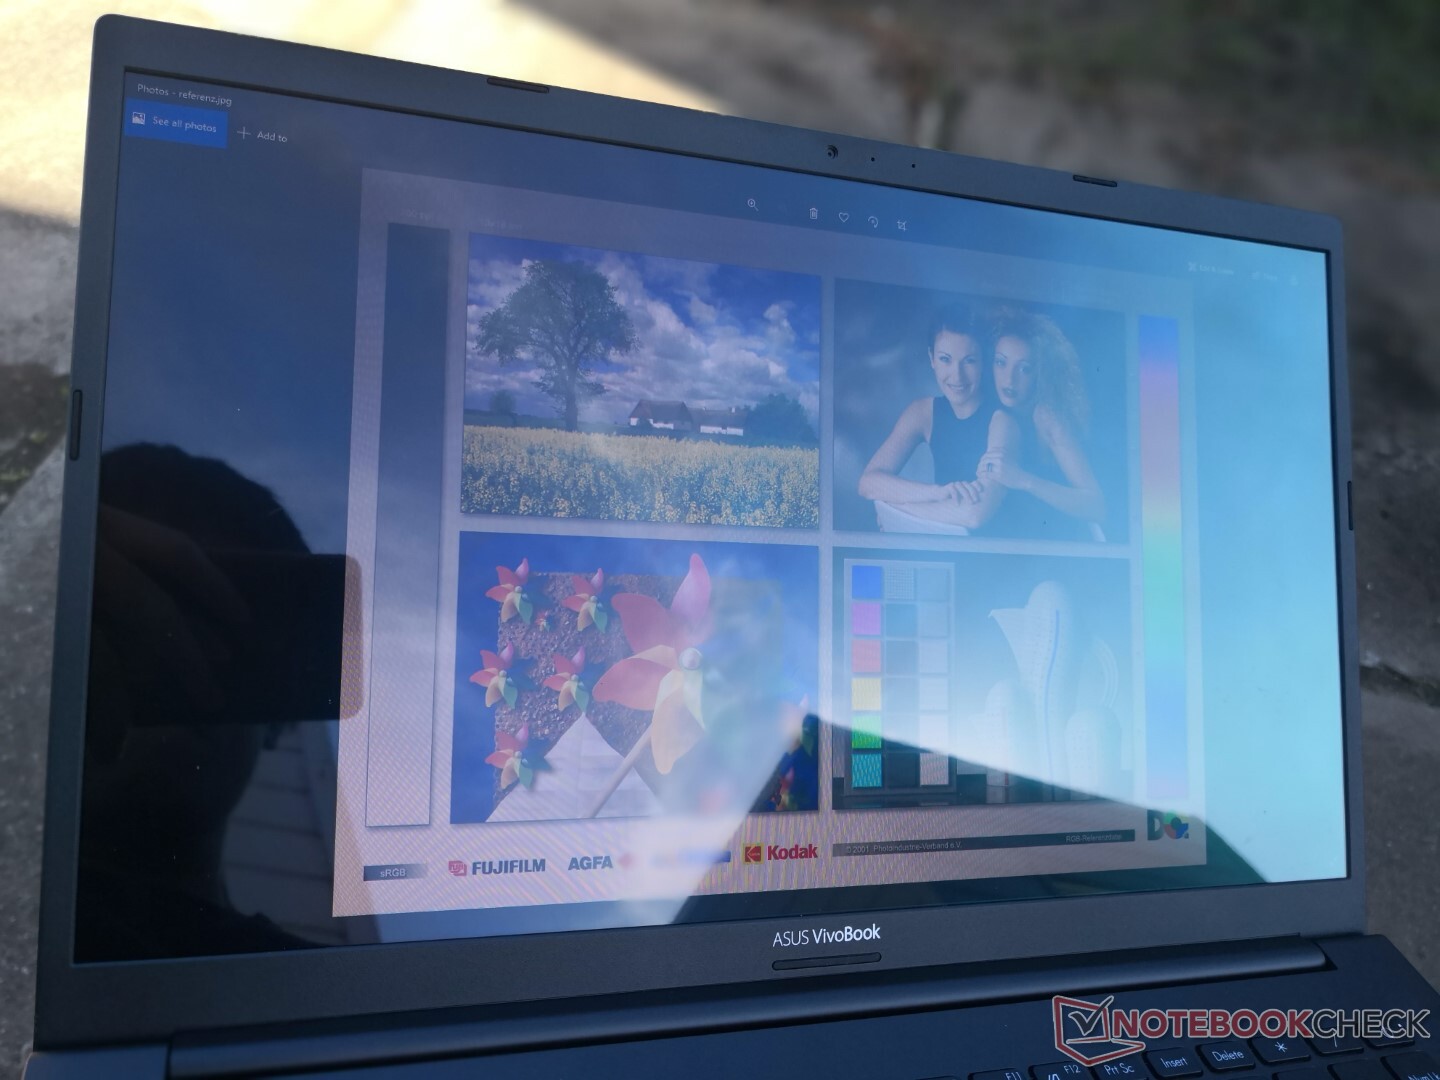
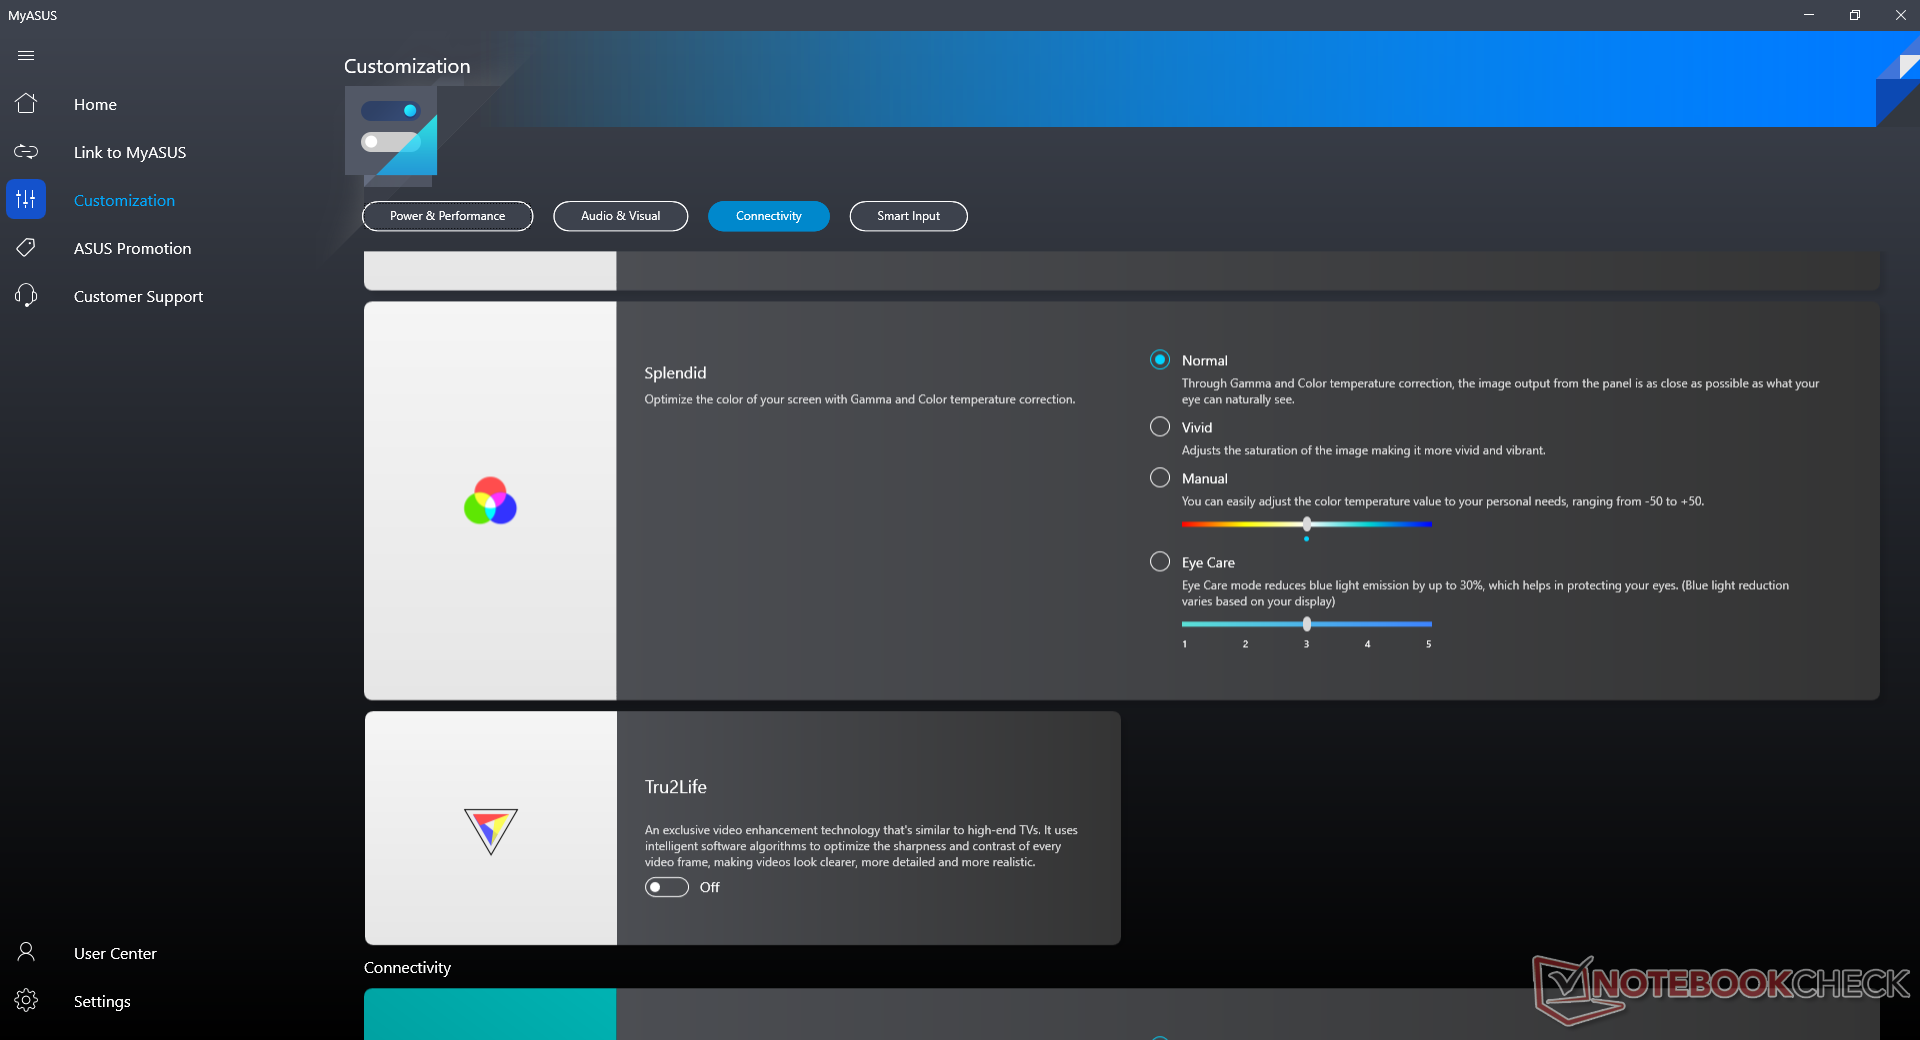
显示屏 - 大多数情况下比IPS好
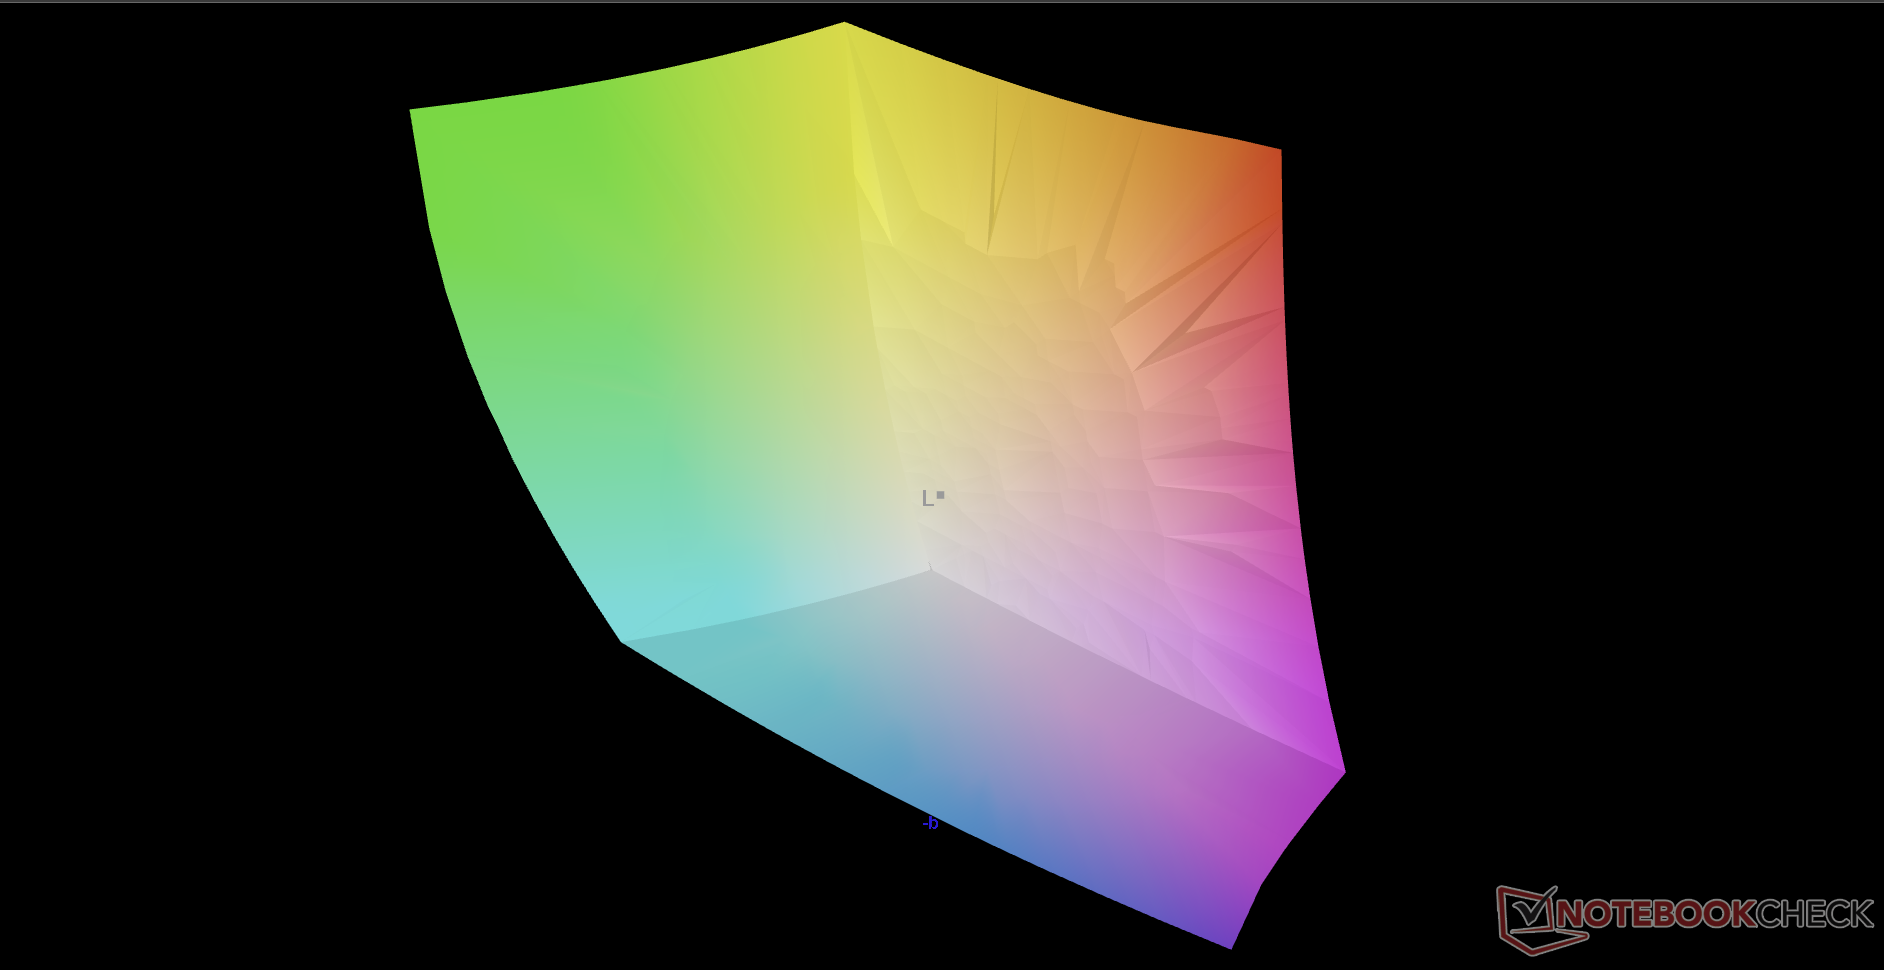
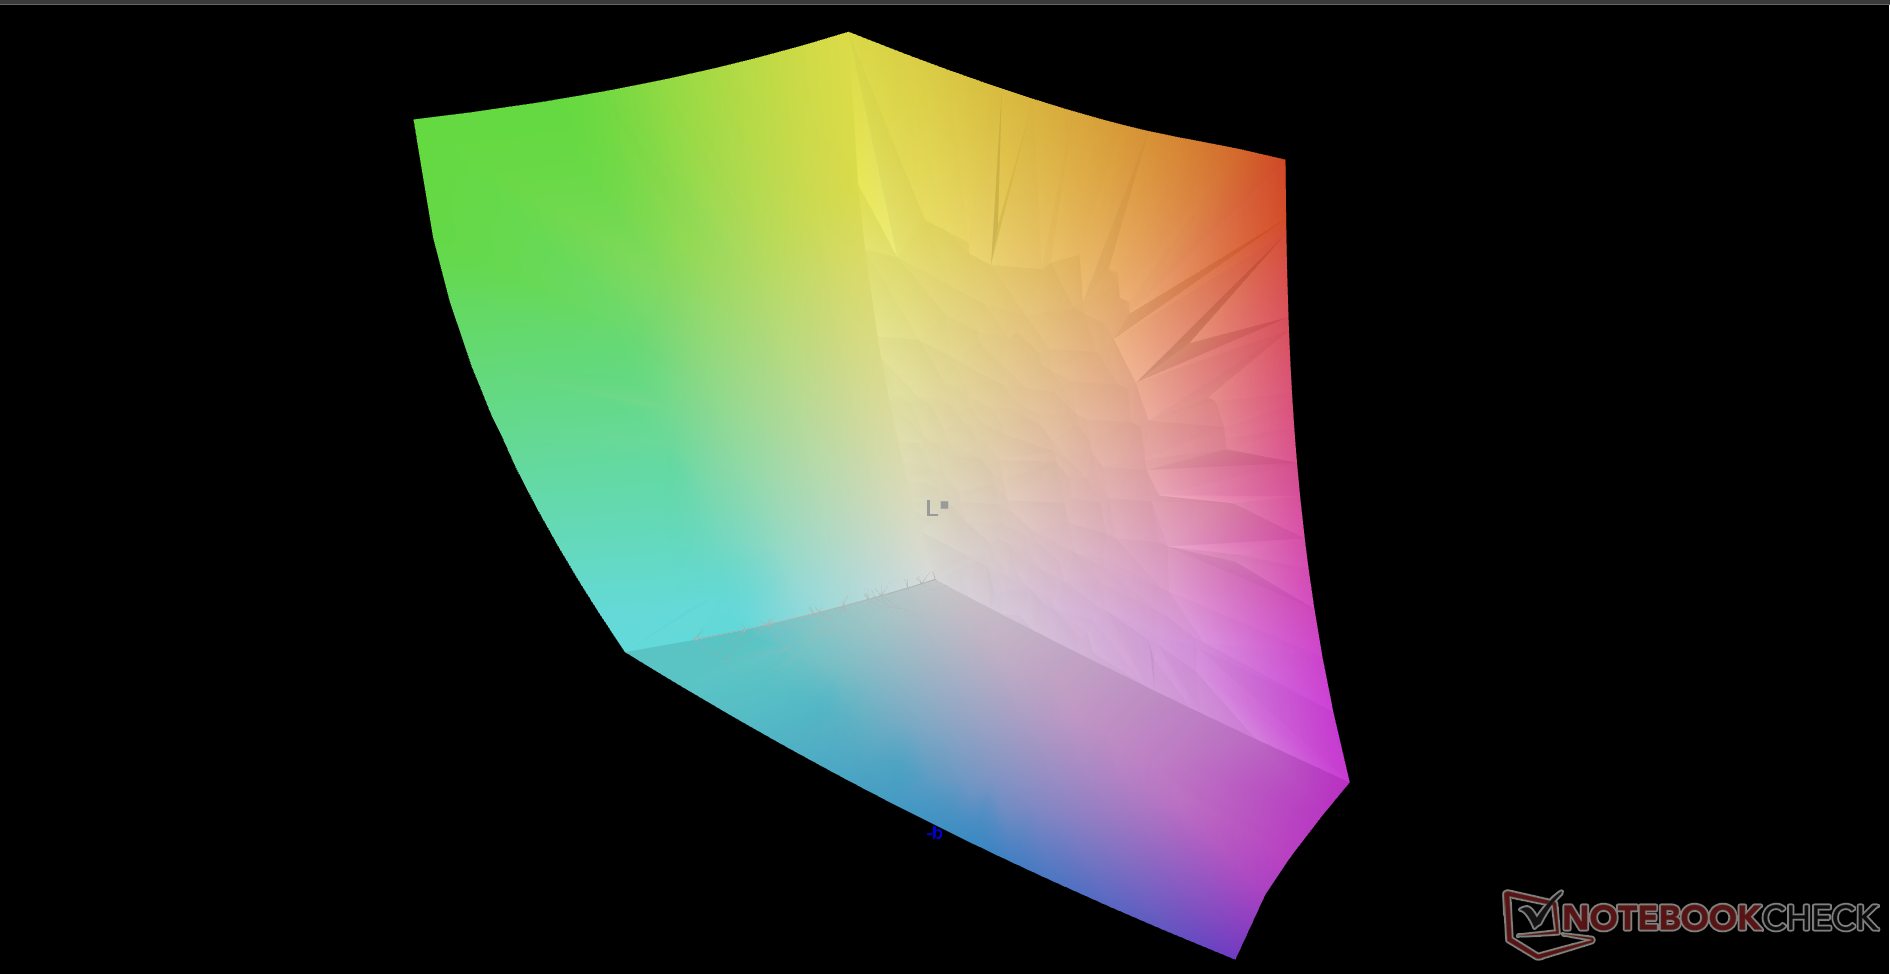
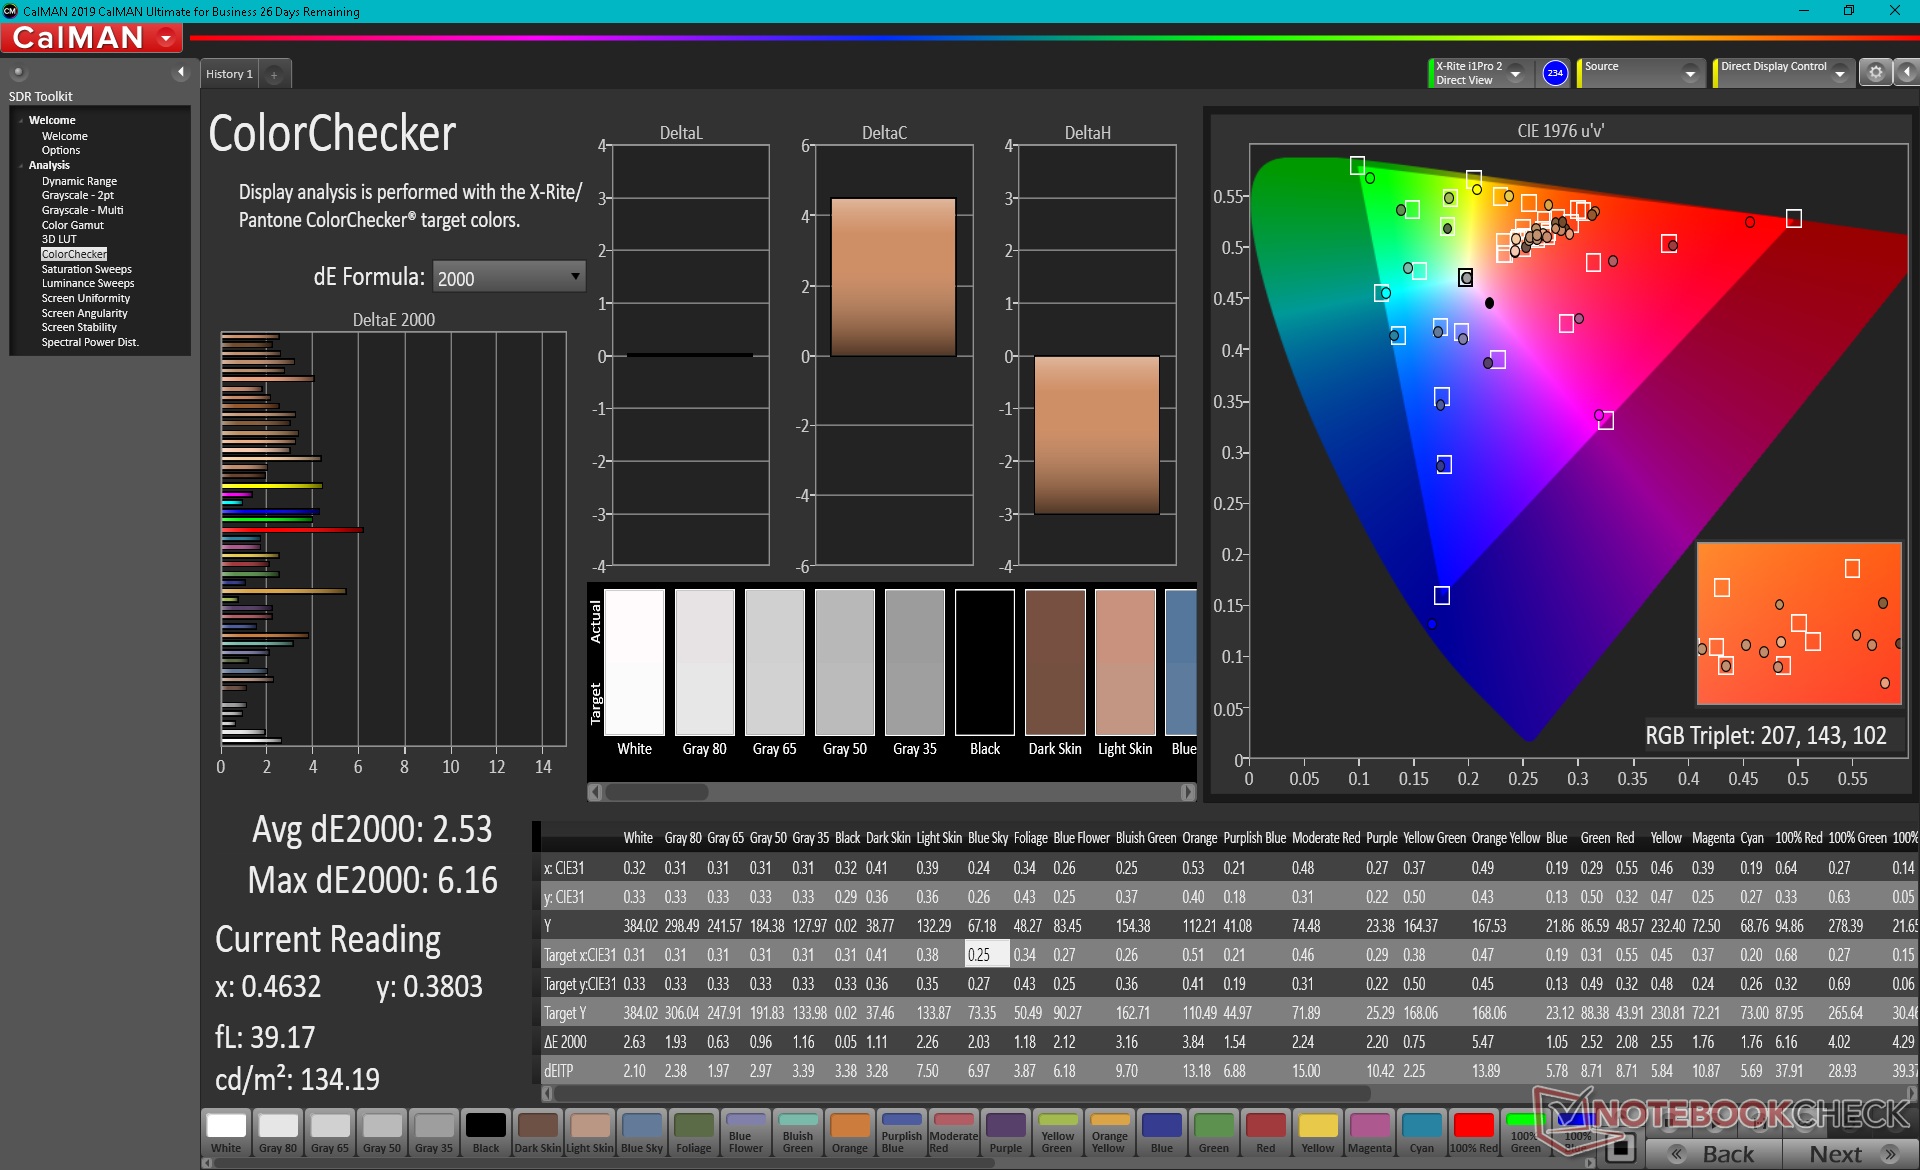
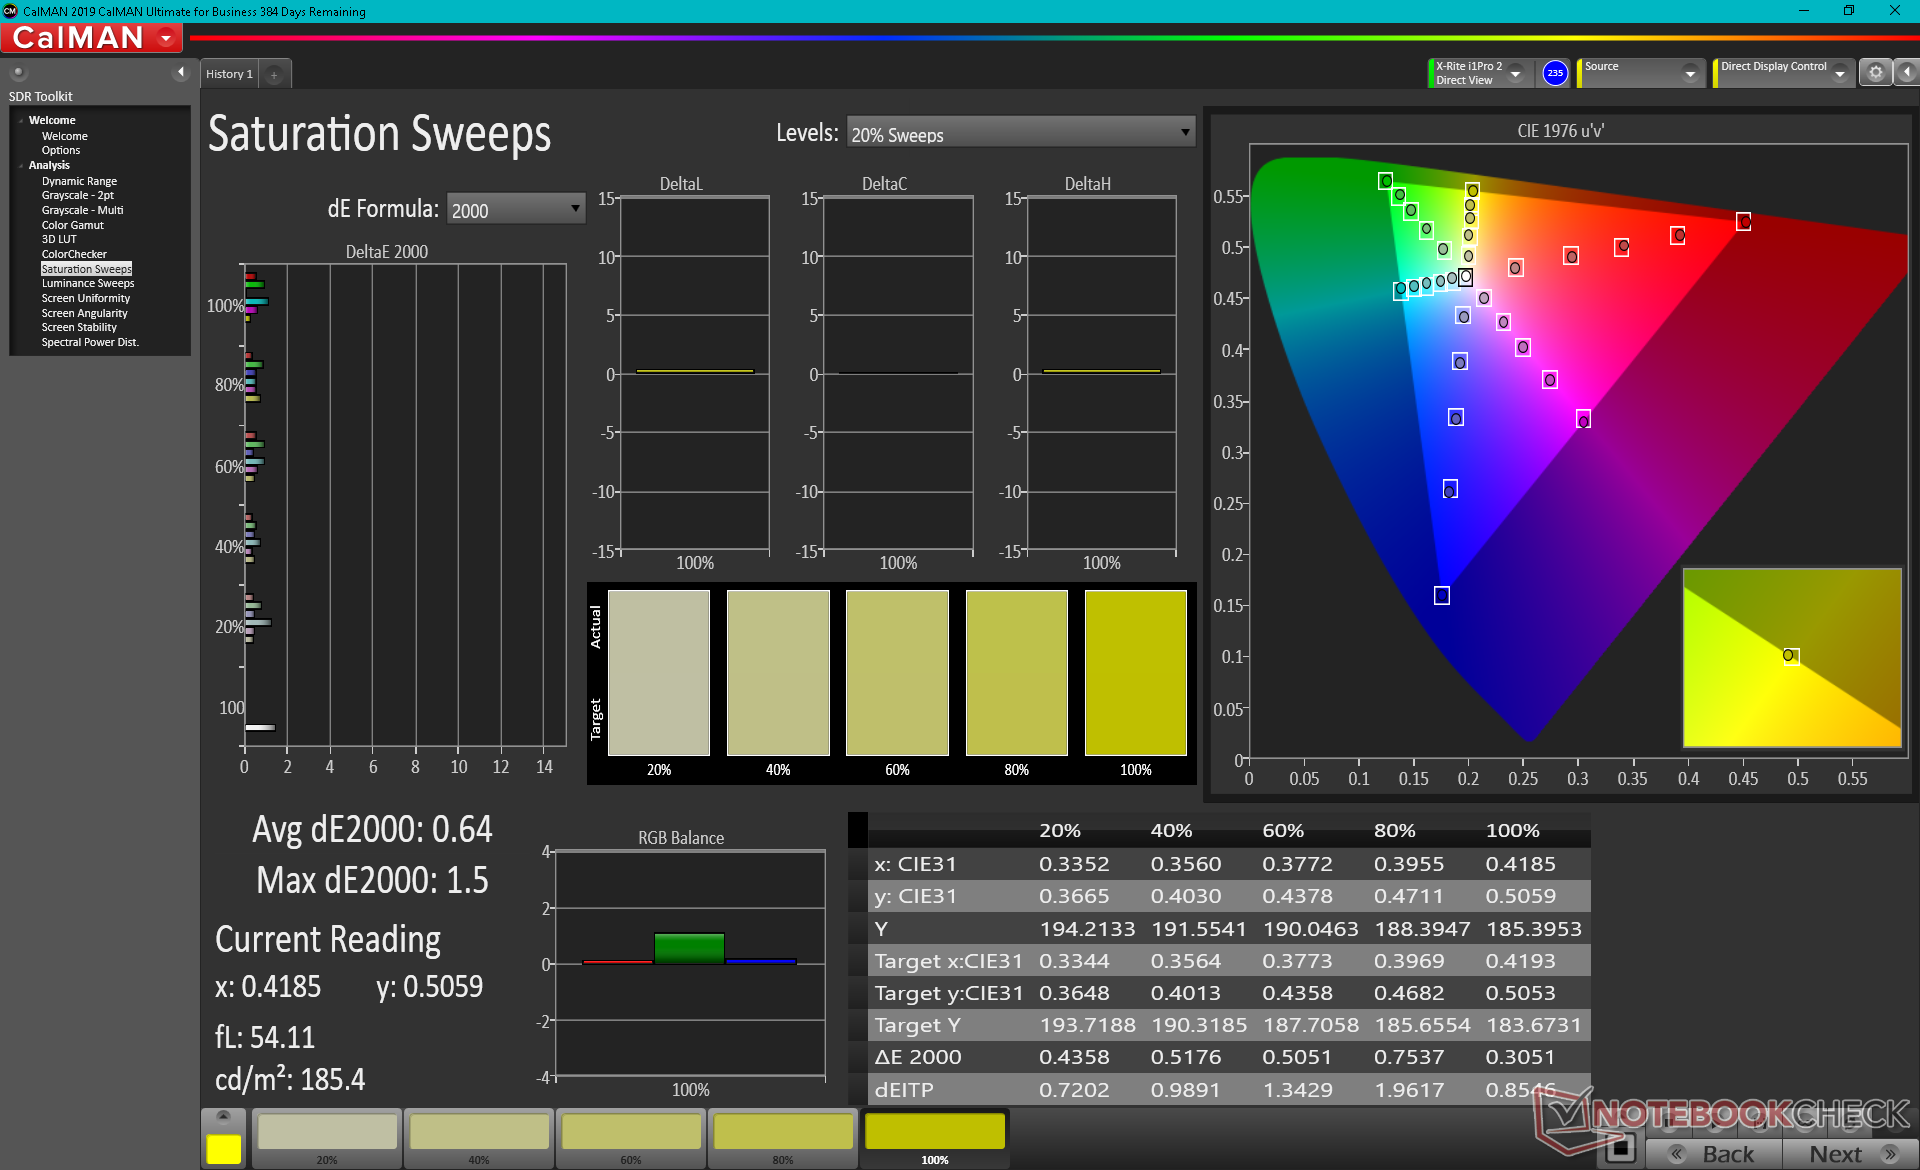
华硕在其VivoBook 15 K513和VivoBook 15 Pro系列中使用了相同的1080p三星ATNA56YX03-0 OLED面板。该面板因提供完整的DCI-P3覆盖率而引人注目,这是大多数IPS面板无法达到的,特别是在这个<1000美元的价格范围内。超快的响应时间、相对明亮的背光和极端的对比度使我们的VivoBook在图形编辑方面比预期的要好。
请记住,脉宽调制存在于所有的亮度水平,与大多数其他笔记本电脑不同。当亮度设置为50%或更高时,我们能够记录到59赫兹的频率,当亮度设置为49%或更低时,能够记录到434赫兹。


| |||||||||||||||||||||||||
Brightness Distribution: 98 %
Center on Battery: 384.5 cd/m²
Contrast: ∞:1 (Black: 0 cd/m²)
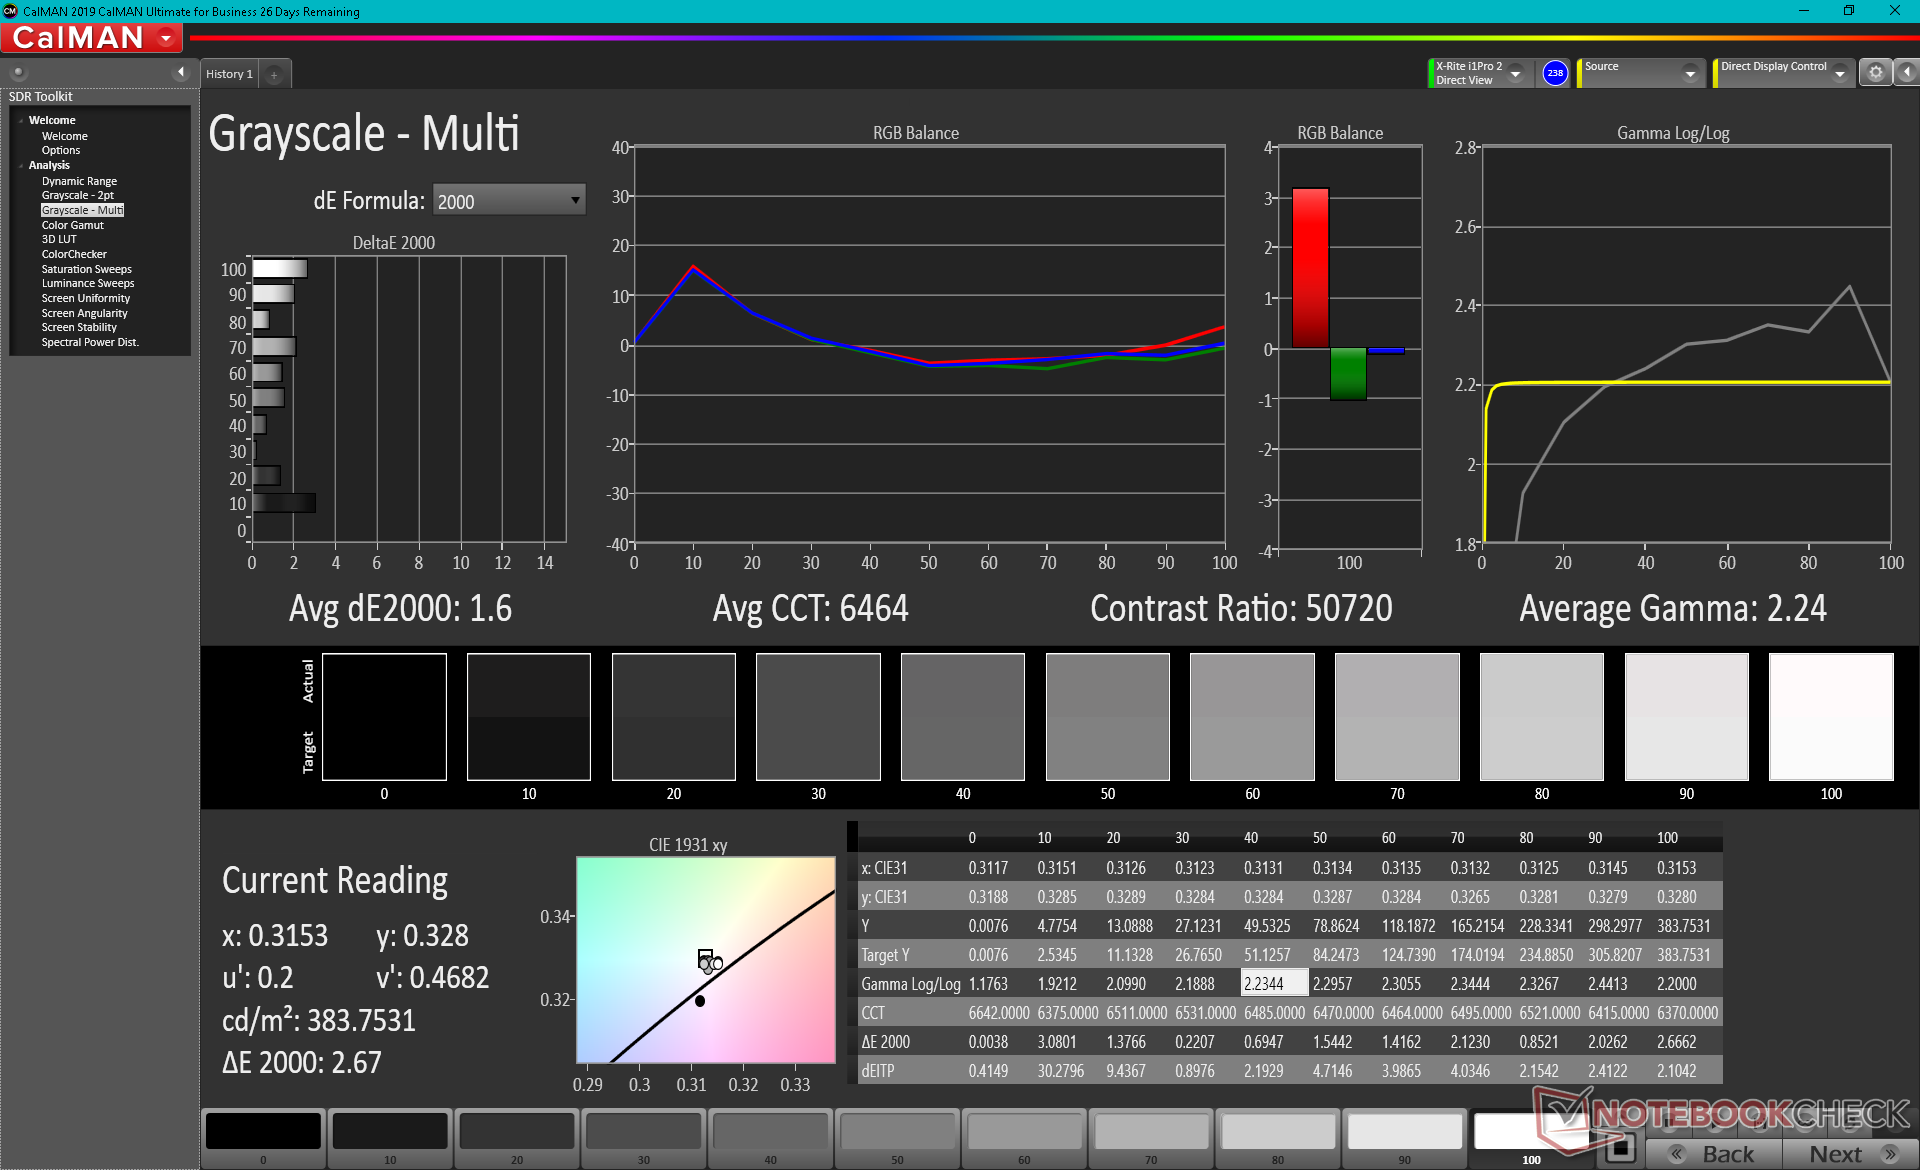
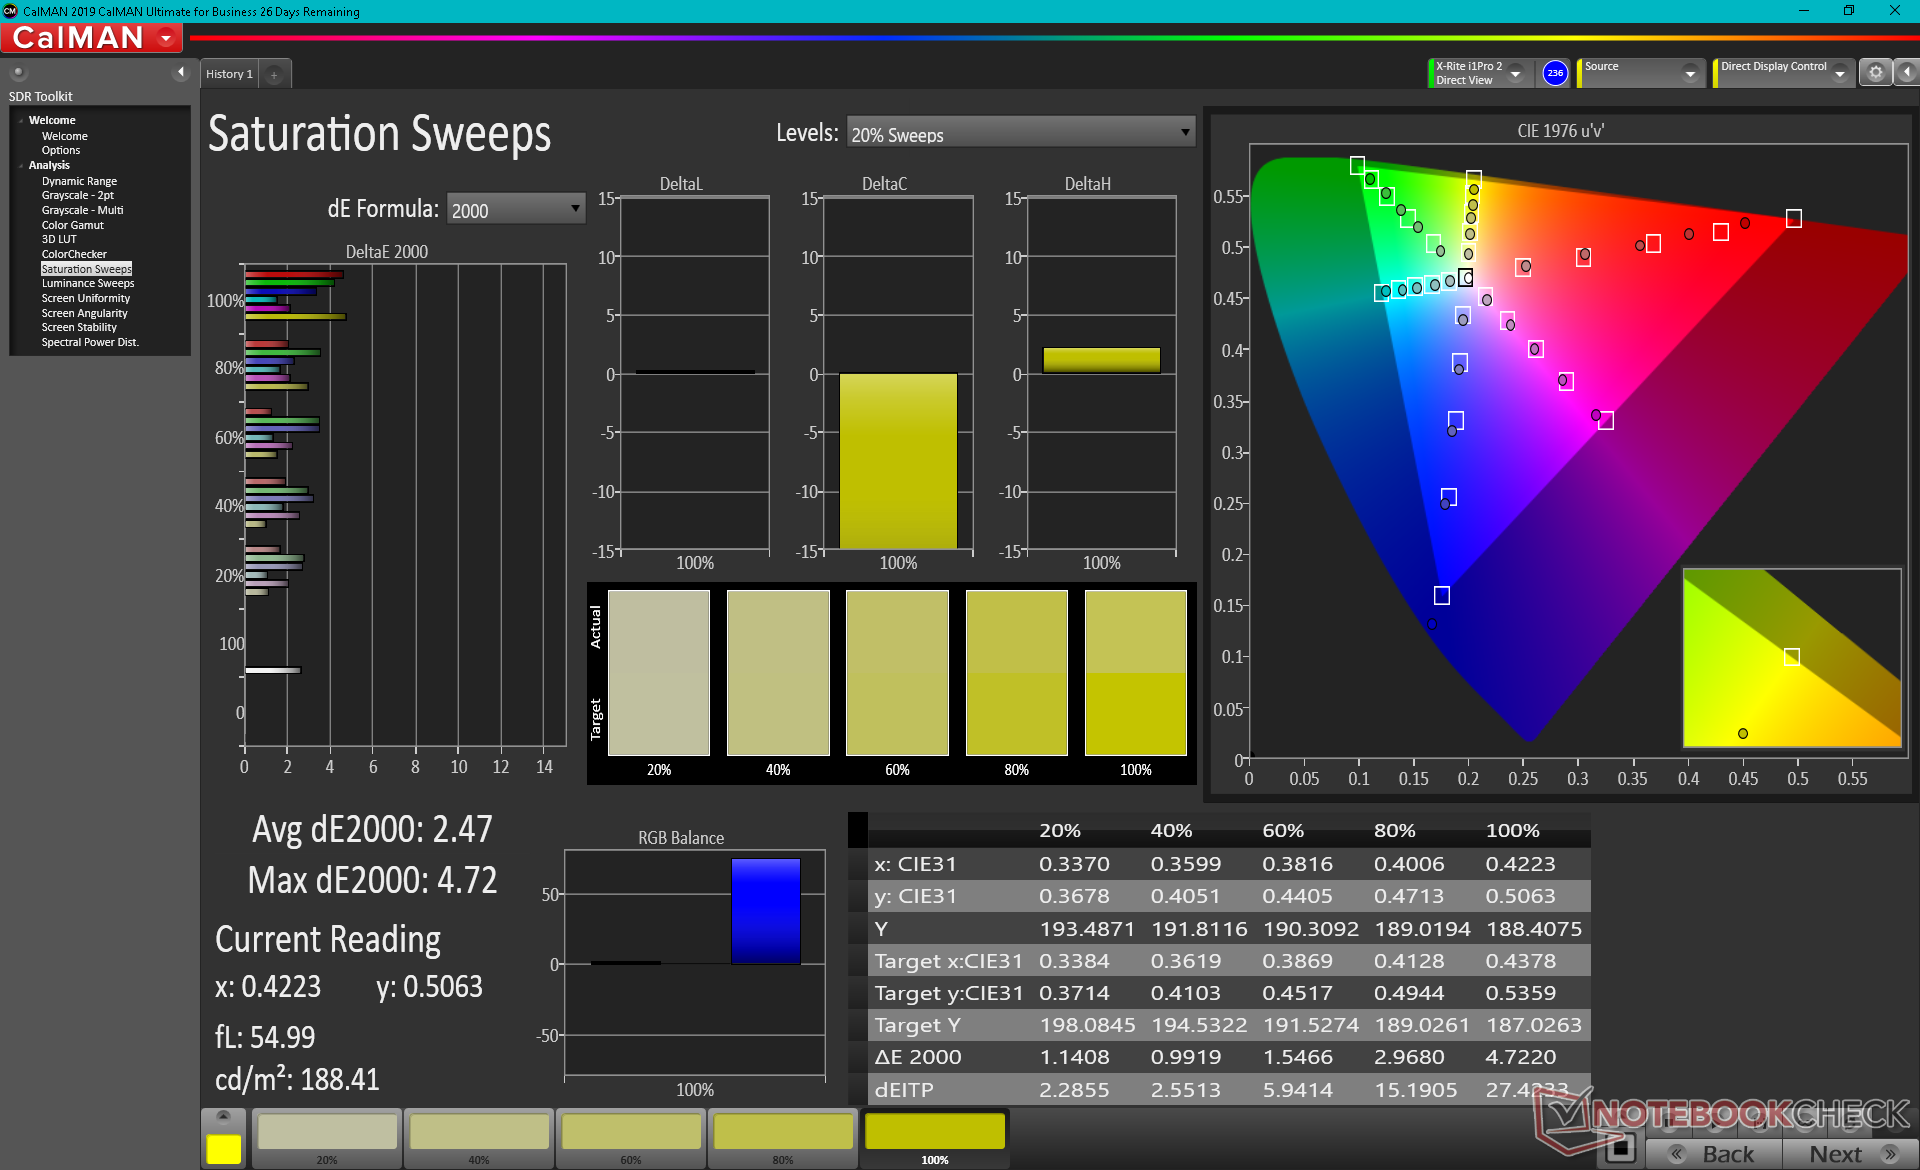
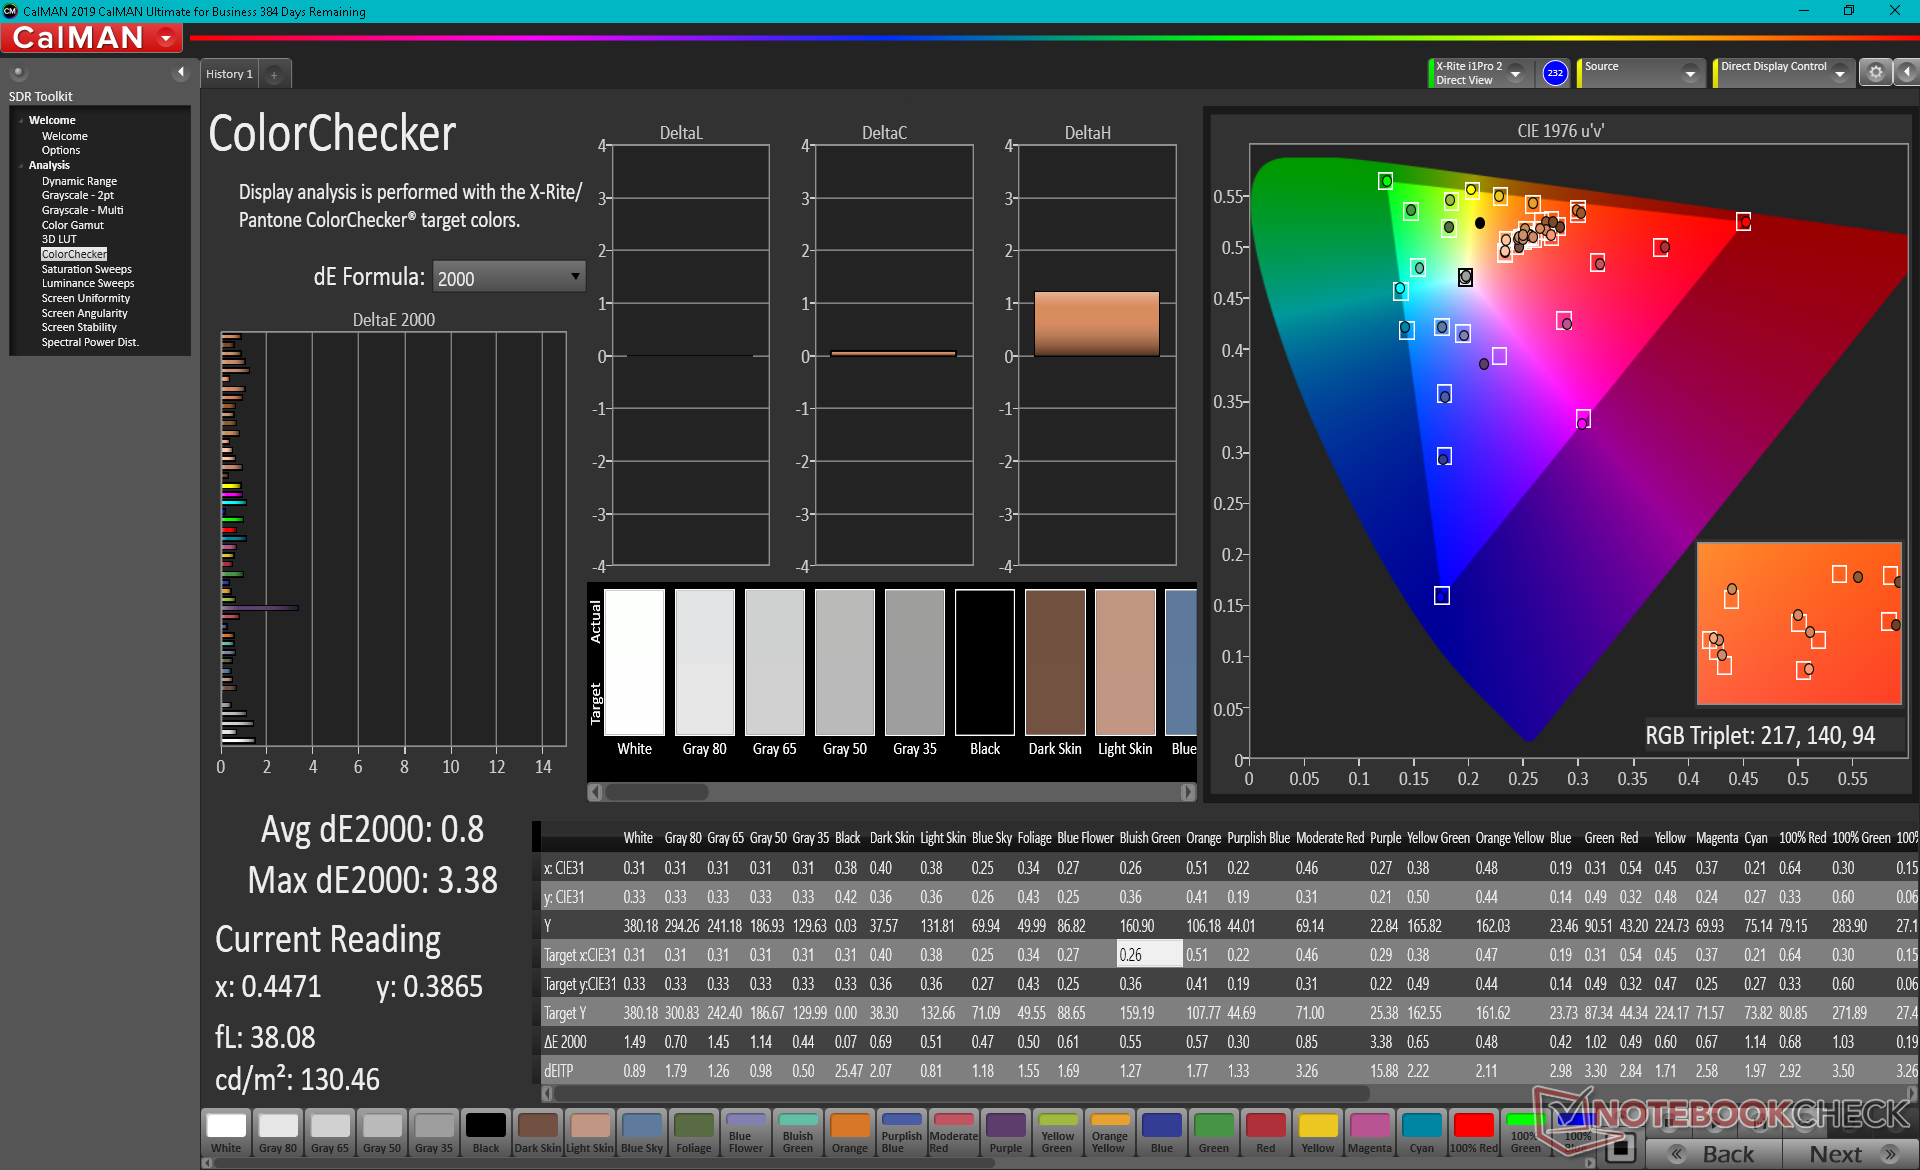
ΔE ColorChecker Calman: 2.53 | ∀{0.5-29.43 Ø4.72}
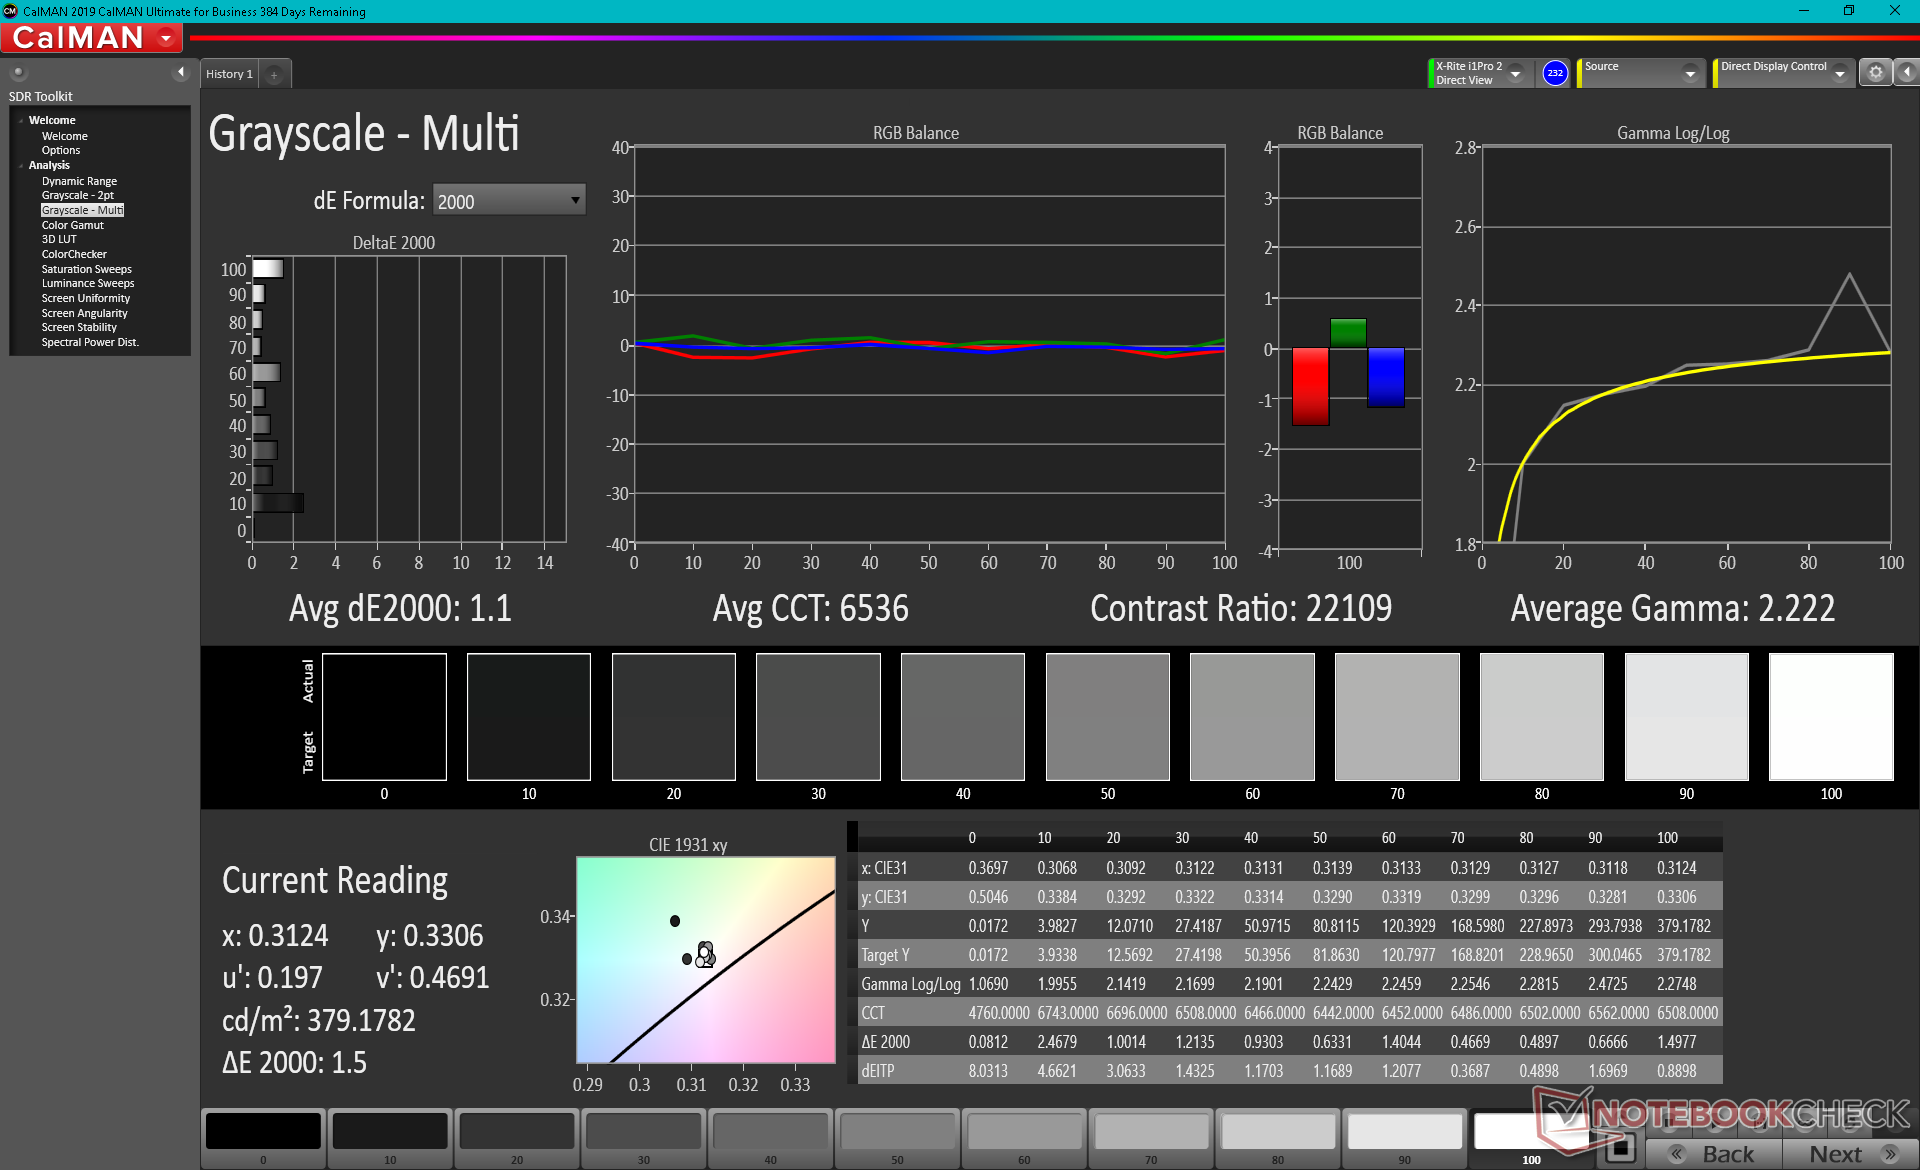
ΔE Greyscale Calman: 1.6 | ∀{0.09-98 Ø4.97}
99.9% AdobeRGB 1998 (Argyll 3D)
100% sRGB (Argyll 3D)
99.9% Display P3 (Argyll 3D)
Gamma: 2.24
CCT: 6464 K
| Asus Vivobook 15 K513EQ Samsung ATNA56YX03-0, OLED, 1920x1080, 15.6" | Asus VivoBook 15 Pro M3500QC-L1062 ATNA56YX03-0, AMOLED, 1920x1080, 15.6" | Asus VivoBook S15 S533EQ-BQ002T Panda LM156LF-5L04, IPS, 1920x1080, 15.6" | Lenovo IdeaPad 5 15ALC05 Lenovo LEN156FHD, IPS, 1920x1080, 15.6" | Dell Inspiron 15 3501 BOE NV15N3D (Dell P/N: N39X1), IPS, 1920x1080, 15.6" | HP Pavilion 15-eg Chi Mei CMN1523, IPS, 1920x1080, 15.6" | |
|---|---|---|---|---|---|---|
| Display | -1% | -54% | -52% | -54% | -50% | |
| Display P3 Coverage (%) | 99.9 | 99.9 0% | 39.01 -61% | 39.4 -61% | 42.9 -57% | |
| sRGB Coverage (%) | 100 | 99.9 0% | 58.5 -41% | 59 -41% | 58.7 -41% | 64 -36% |
| AdobeRGB 1998 Coverage (%) | 99.9 | 95.8 -4% | 40.33 -60% | 38 -62% | 40.7 -59% | 44.4 -56% |
| Response Times | -28% | -1229% | -870% | -1429% | -825% | |
| Response Time Grey 50% / Grey 80% * (ms) | 2.2 ? | 3.2 ? -45% | 38 ? -1627% | 29 ? -1218% | 43 ? -1855% | 22.8 ? -936% |
| Response Time Black / White * (ms) | 2.9 ? | 3.2 ? -10% | 27 ? -831% | 18 ? -521% | 32 ? -1003% | 23.6 ? -714% |
| PWM Frequency (Hz) | 59.5 ? | 60.2 ? | 1000 ? | 26320 ? | ||
| Screen | 14% | -65% | -101% | -47% | -74% | |
| Brightness middle (cd/m²) | 384.5 | 396 3% | 287 -25% | 376 -2% | 271 -30% | 294.3 -23% |
| Brightness (cd/m²) | 388 | 397 2% | 261 -33% | 341 -12% | 263 -32% | 251 -35% |
| Brightness Distribution (%) | 98 | 99 1% | 84 -14% | 78 -20% | 92 -6% | 76 -22% |
| Black Level * (cd/m²) | 0.51 | 0.66 | 0.15 | 0.26 | ||
| Colorchecker dE 2000 * | 2.53 | 2 21% | 4.72 -87% | 6.4 -153% | 4.83 -91% | 4.08 -61% |
| Colorchecker dE 2000 max. * | 6.16 | 4.8 22% | 17.94 -191% | 20.45 -232% | 7 -14% | 19.49 -216% |
| Greyscale dE 2000 * | 1.6 | 1 37% | 2.2 -38% | 4.59 -187% | 3.36 -110% | 3 -88% |
| Gamma | 2.24 98% | 2.17 101% | 2.51 88% | 2.26 97% | 2.56 86% | 2.21 100% |
| CCT | 6464 101% | 6608 98% | 6758 96% | 6819 95% | 6764 96% | 6616 98% |
| Colorchecker dE 2000 calibrated * | 1.8 | 3.74 | 3.7 | |||
| Contrast (:1) | 563 | 570 | 1807 | 1132 | ||
| Color Space (Percent of AdobeRGB 1998) (%) | 37 | 38 | ||||
| Color Space (Percent of sRGB) (%) | 58 | 59 | ||||
| Total Average (Program / Settings) | -5% /
2% | -449% /
-273% | -341% /
-245% | -510% /
-300% | -316% /
-204% |
* ... smaller is better
该显示器开箱即被校准,与P3标准相比,平均灰度和色彩deltaE值分别只有1.6和2.53。与其他原色和辅色相比,红色和黄色似乎更不准确。
Display Response Times
| ↔ Response Time Black to White | ||
|---|---|---|
| 2.9 ms ... rise ↗ and fall ↘ combined | ↗ 1.1 ms rise | 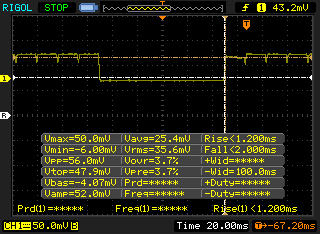 |
| ↘ 1.8 ms fall | ||
| The screen shows very fast response rates in our tests and should be very well suited for fast-paced gaming. In comparison, all tested devices range from 0.1 (minimum) to 240 (maximum) ms. » 14 % of all devices are better. This means that the measured response time is better than the average of all tested devices (19.8 ms). | ||
| ↔ Response Time 50% Grey to 80% Grey | ||
| 2.2 ms ... rise ↗ and fall ↘ combined | ↗ 1.1 ms rise | 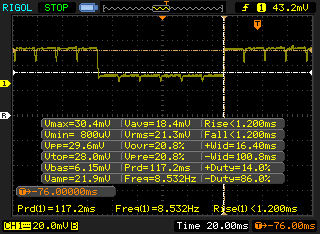 |
| ↘ 1.1 ms fall | ||
| The screen shows very fast response rates in our tests and should be very well suited for fast-paced gaming. In comparison, all tested devices range from 0.165 (minimum) to 636 (maximum) ms. » 11 % of all devices are better. This means that the measured response time is better than the average of all tested devices (31 ms). | ||
Screen Flickering / PWM (Pulse-Width Modulation)
| Screen flickering / PWM detected | 59.5 Hz | ≤ 100 % brightness setting | 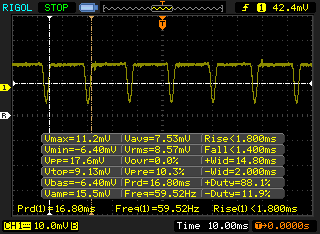 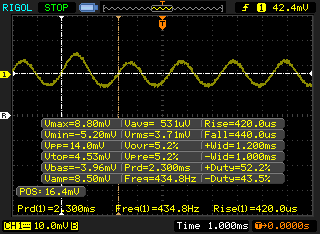 |
The display backlight flickers at 59.5 Hz (worst case, e.g., utilizing PWM) Flickering detected at a brightness setting of 100 % and below. There should be no flickering or PWM above this brightness setting. The frequency of 59.5 Hz is very low, so the flickering may cause eyestrain and headaches after extended use. In comparison: 52 % of all tested devices do not use PWM to dim the display. If PWM was detected, an average of 7763 (minimum: 5 - maximum: 343500) Hz was measured. | |||
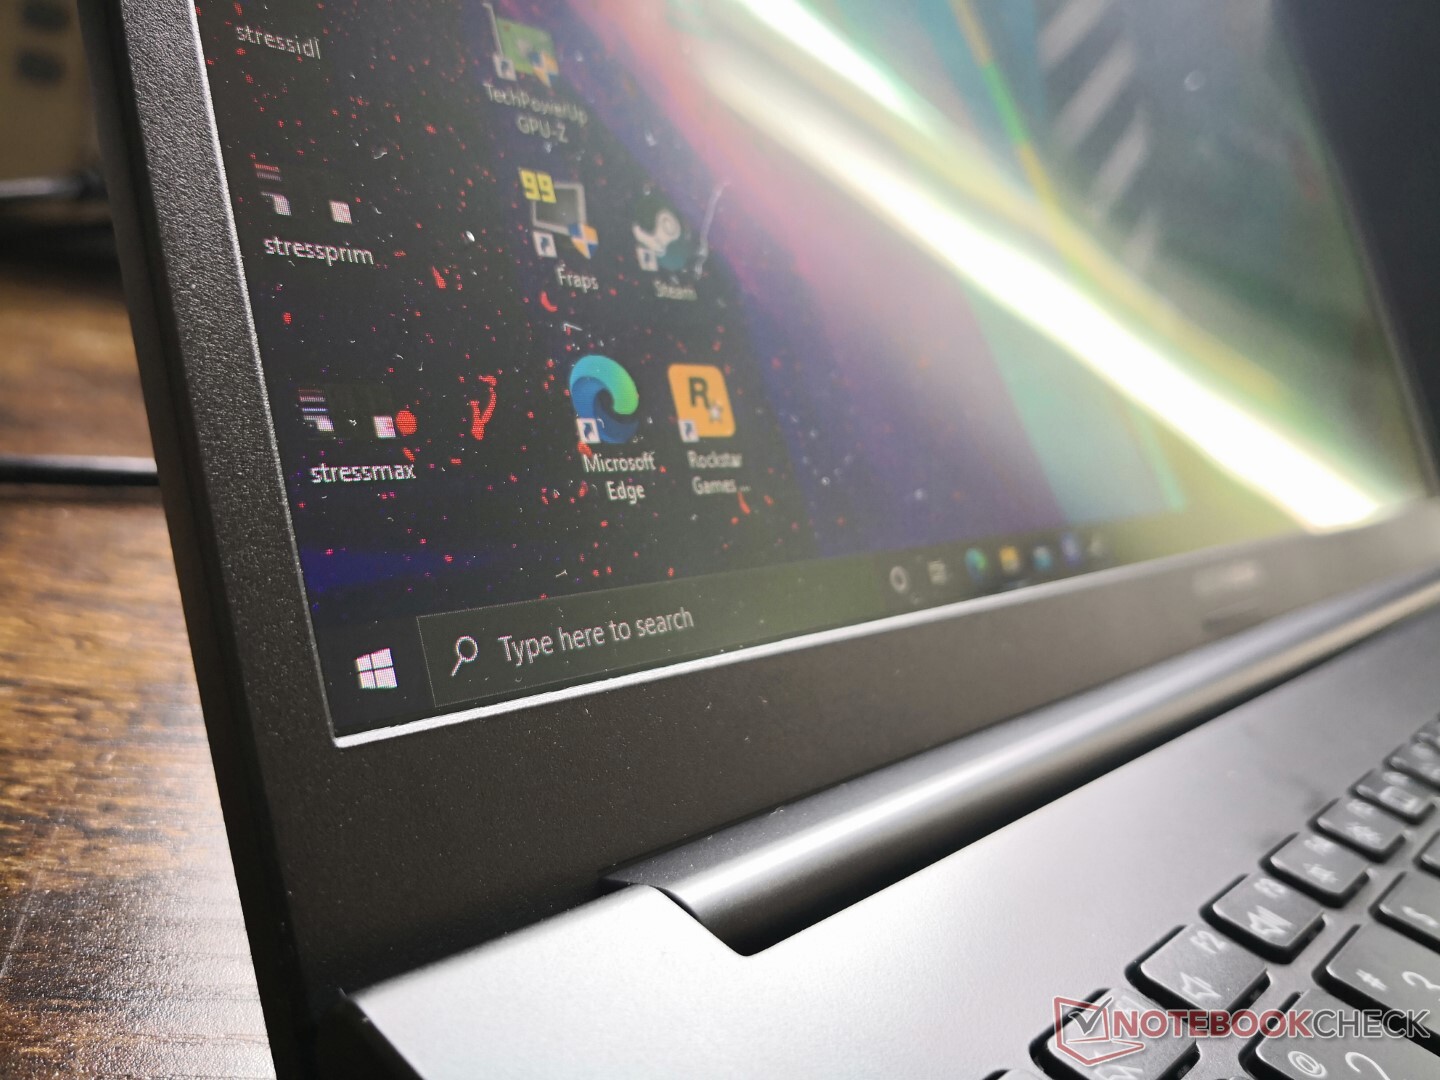
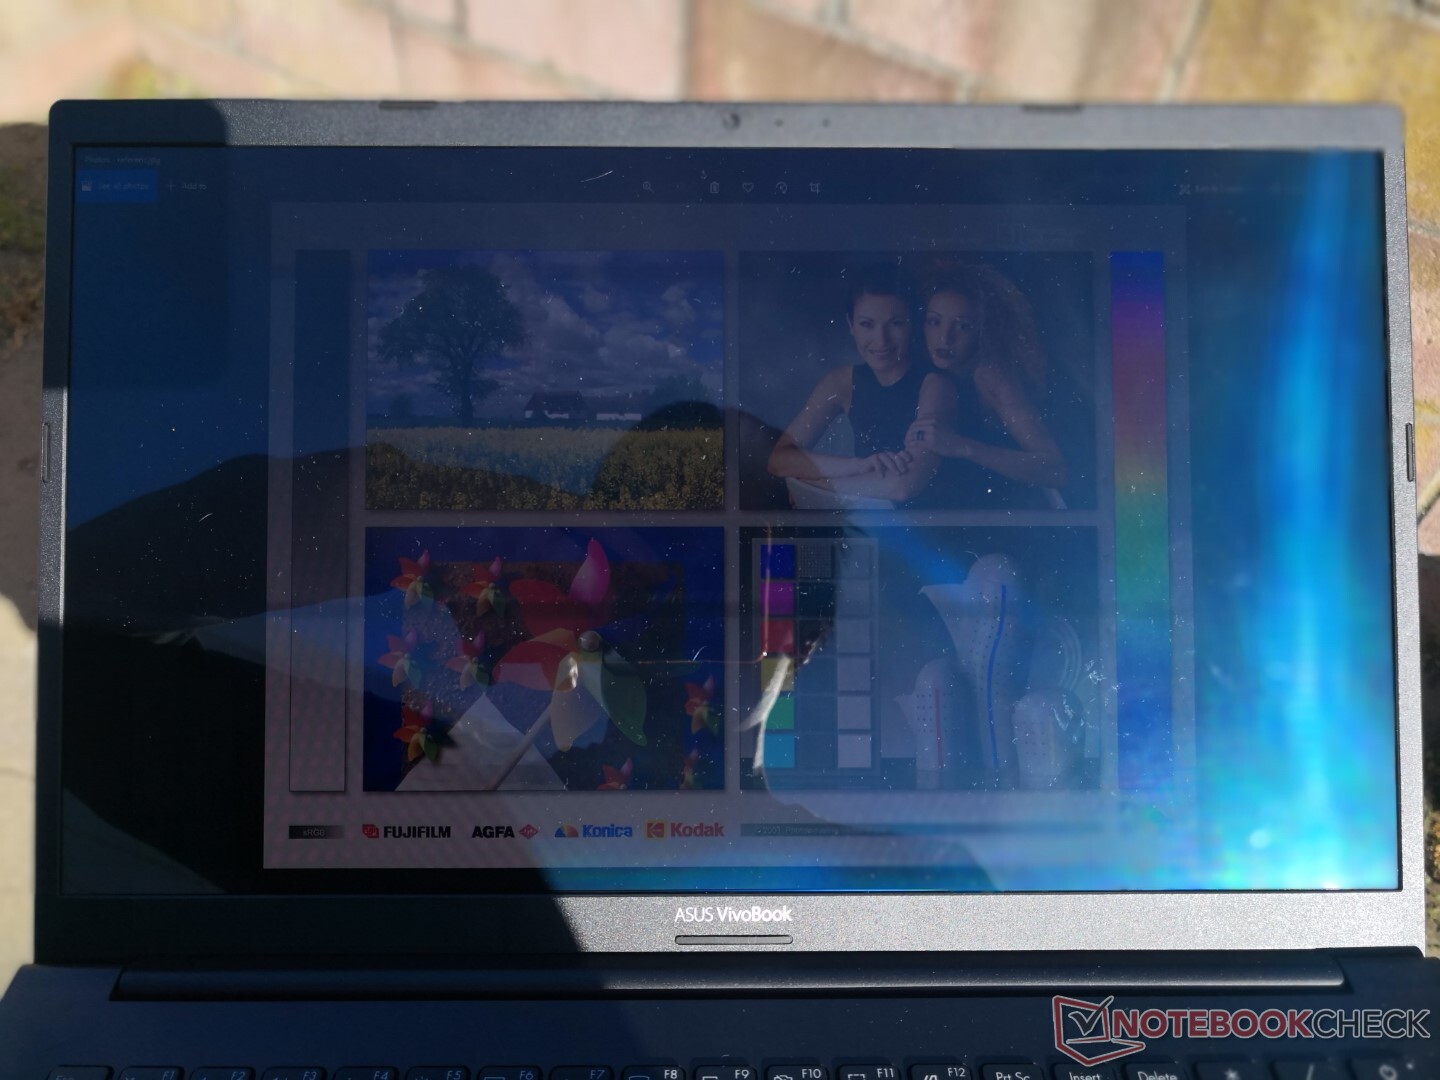
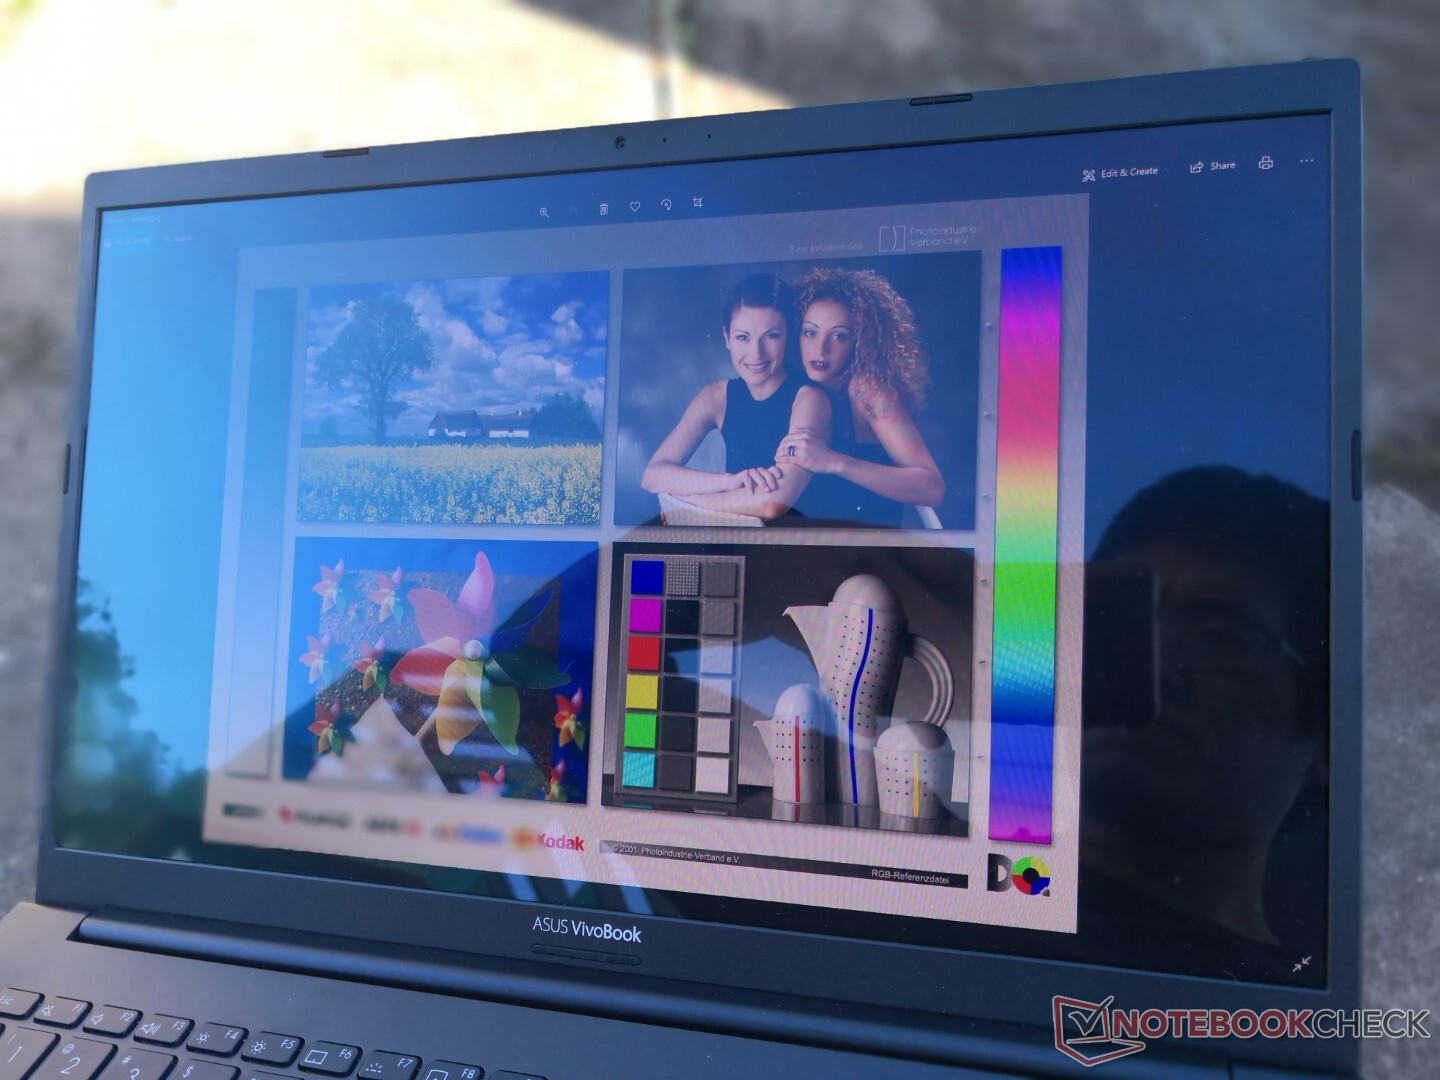
如果在阴凉处,户外能见度一般,在相同的亮度水平下,由于OLED的黑度更深,比IPS略好。因此,屏幕不容易被洗掉,但眩光仍然难以避免。

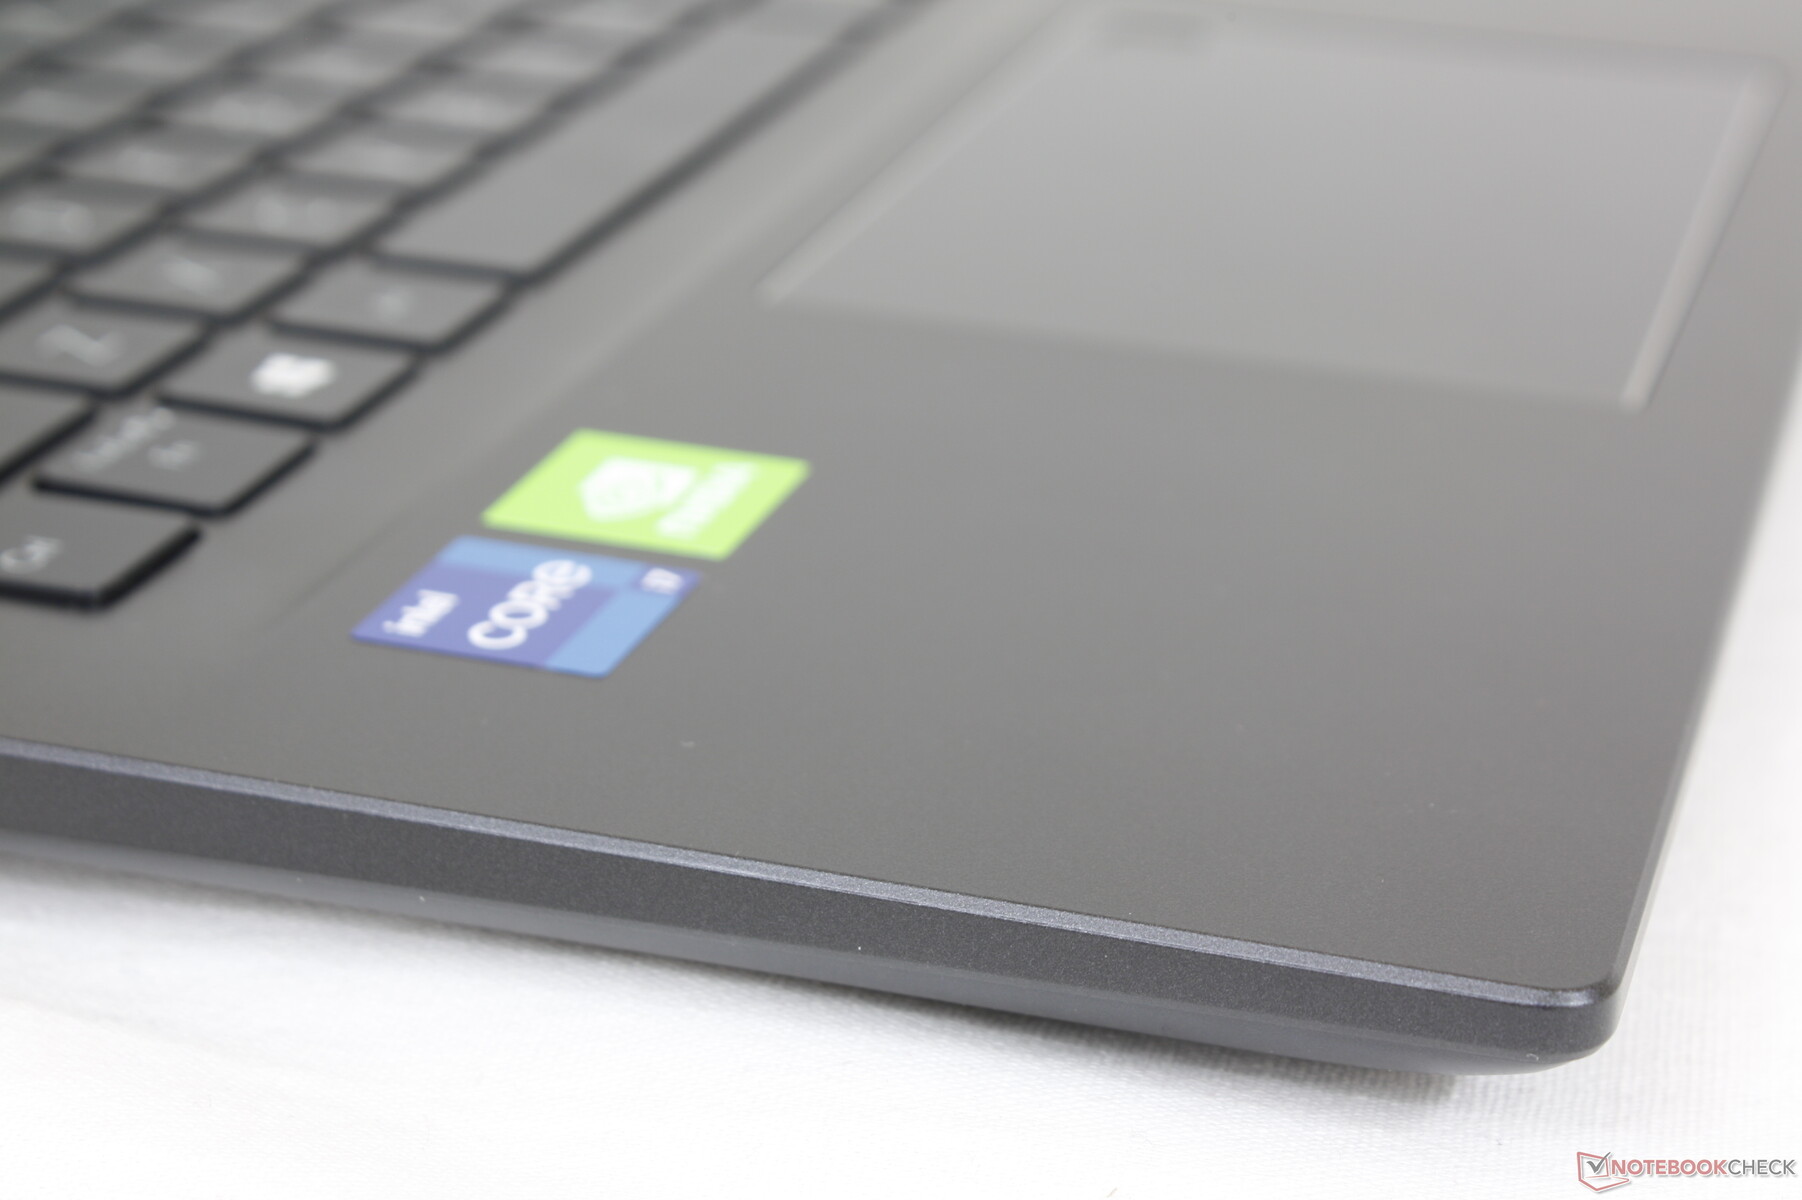
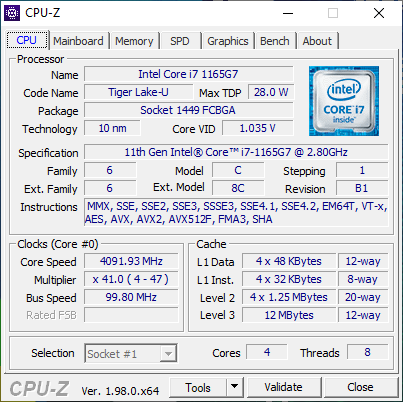
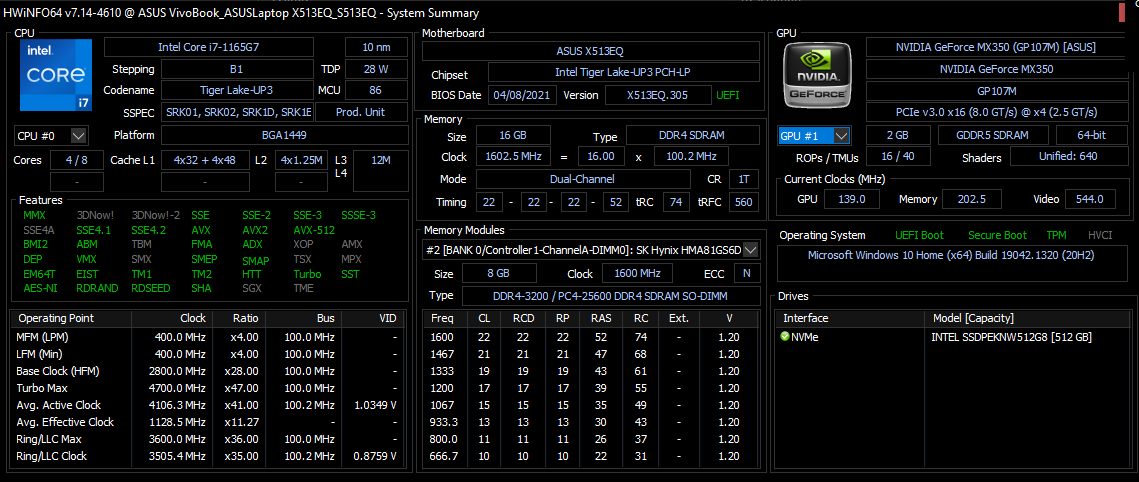
性能 - 第11代Tiger Lake-U
目前的SKU配备了U系列的 酷睿i3-1115G4CPU,直至酷睿i7-1165G7,外加Optimus 1.0上可选的GeForce MX330或MX350图形。前面提到的酷睿i3 SKU只配备了集成的UHD Graphics ,要明显慢于Iris Xe或独立的Nvidia GPU。用户将不得不看一下更高端的 VivoBook 15 Pro系列,如果他们想要更快的Core H系列CPU和GeForce RTX图形。
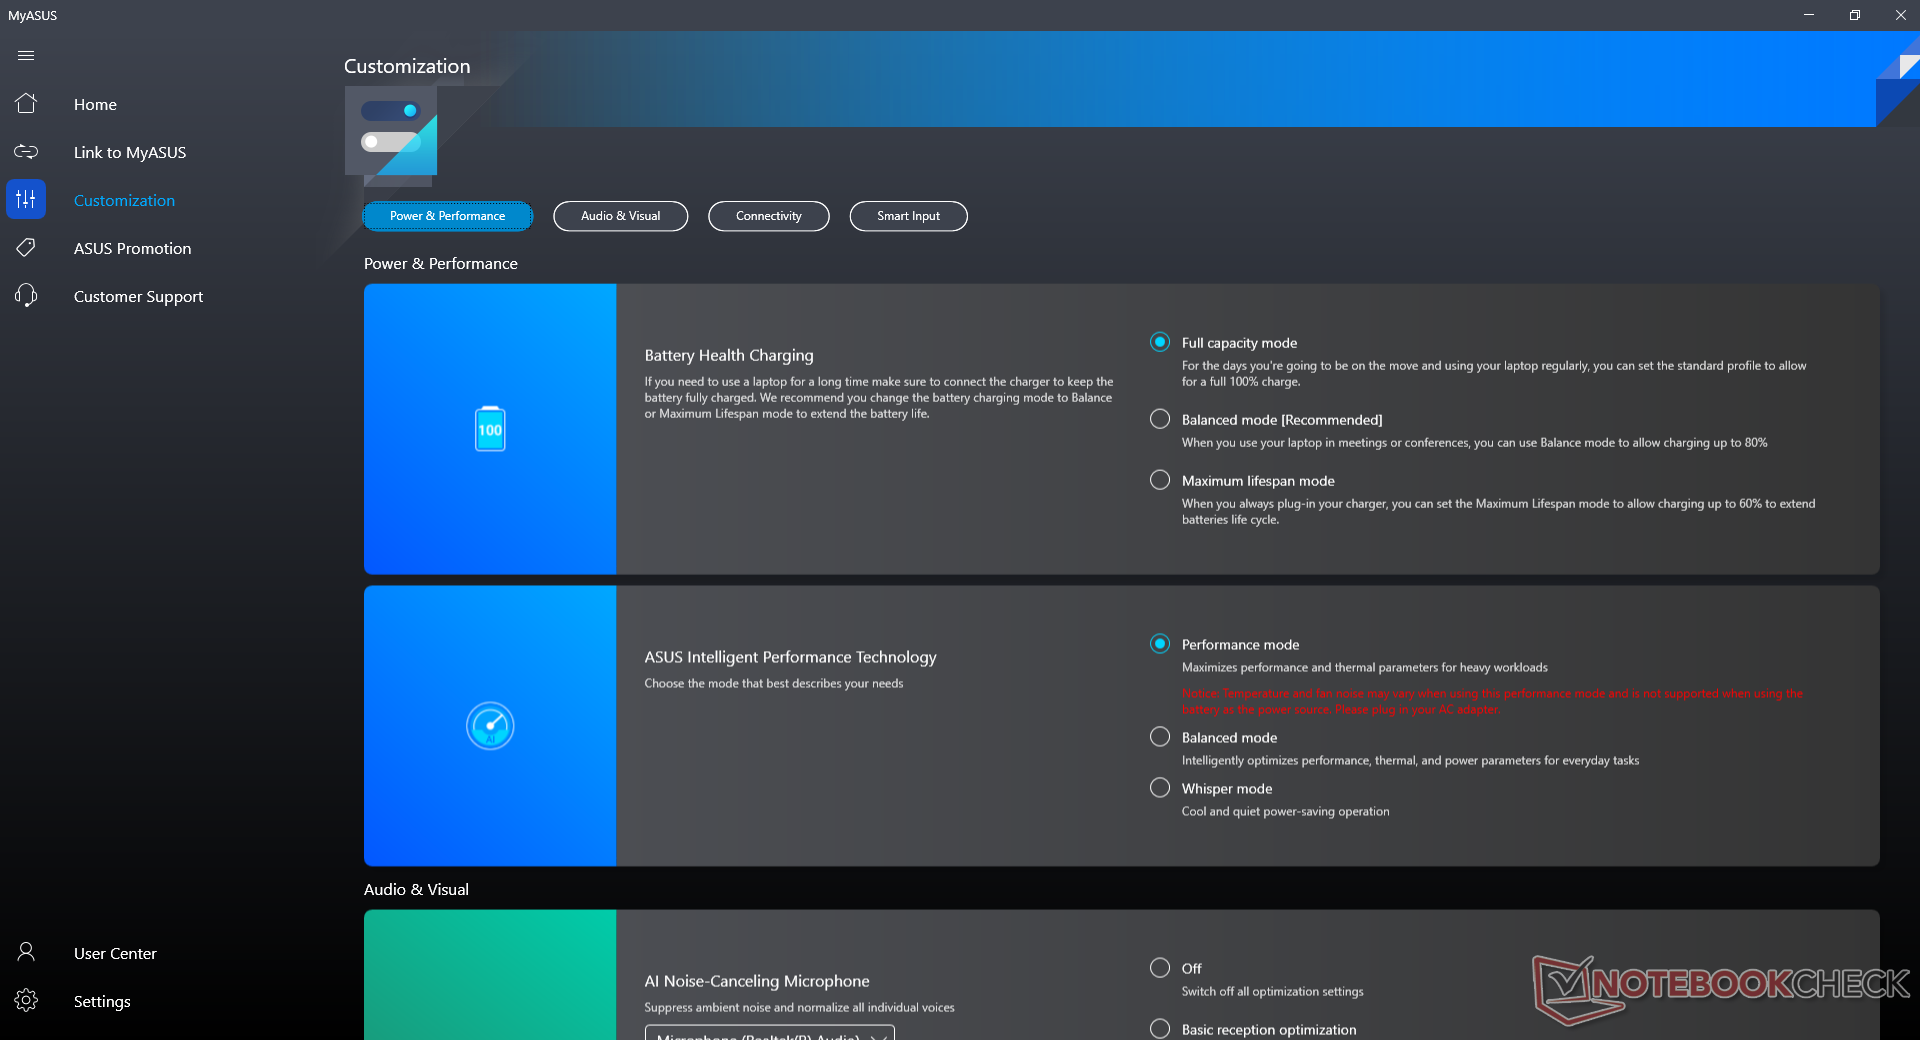
测试条件
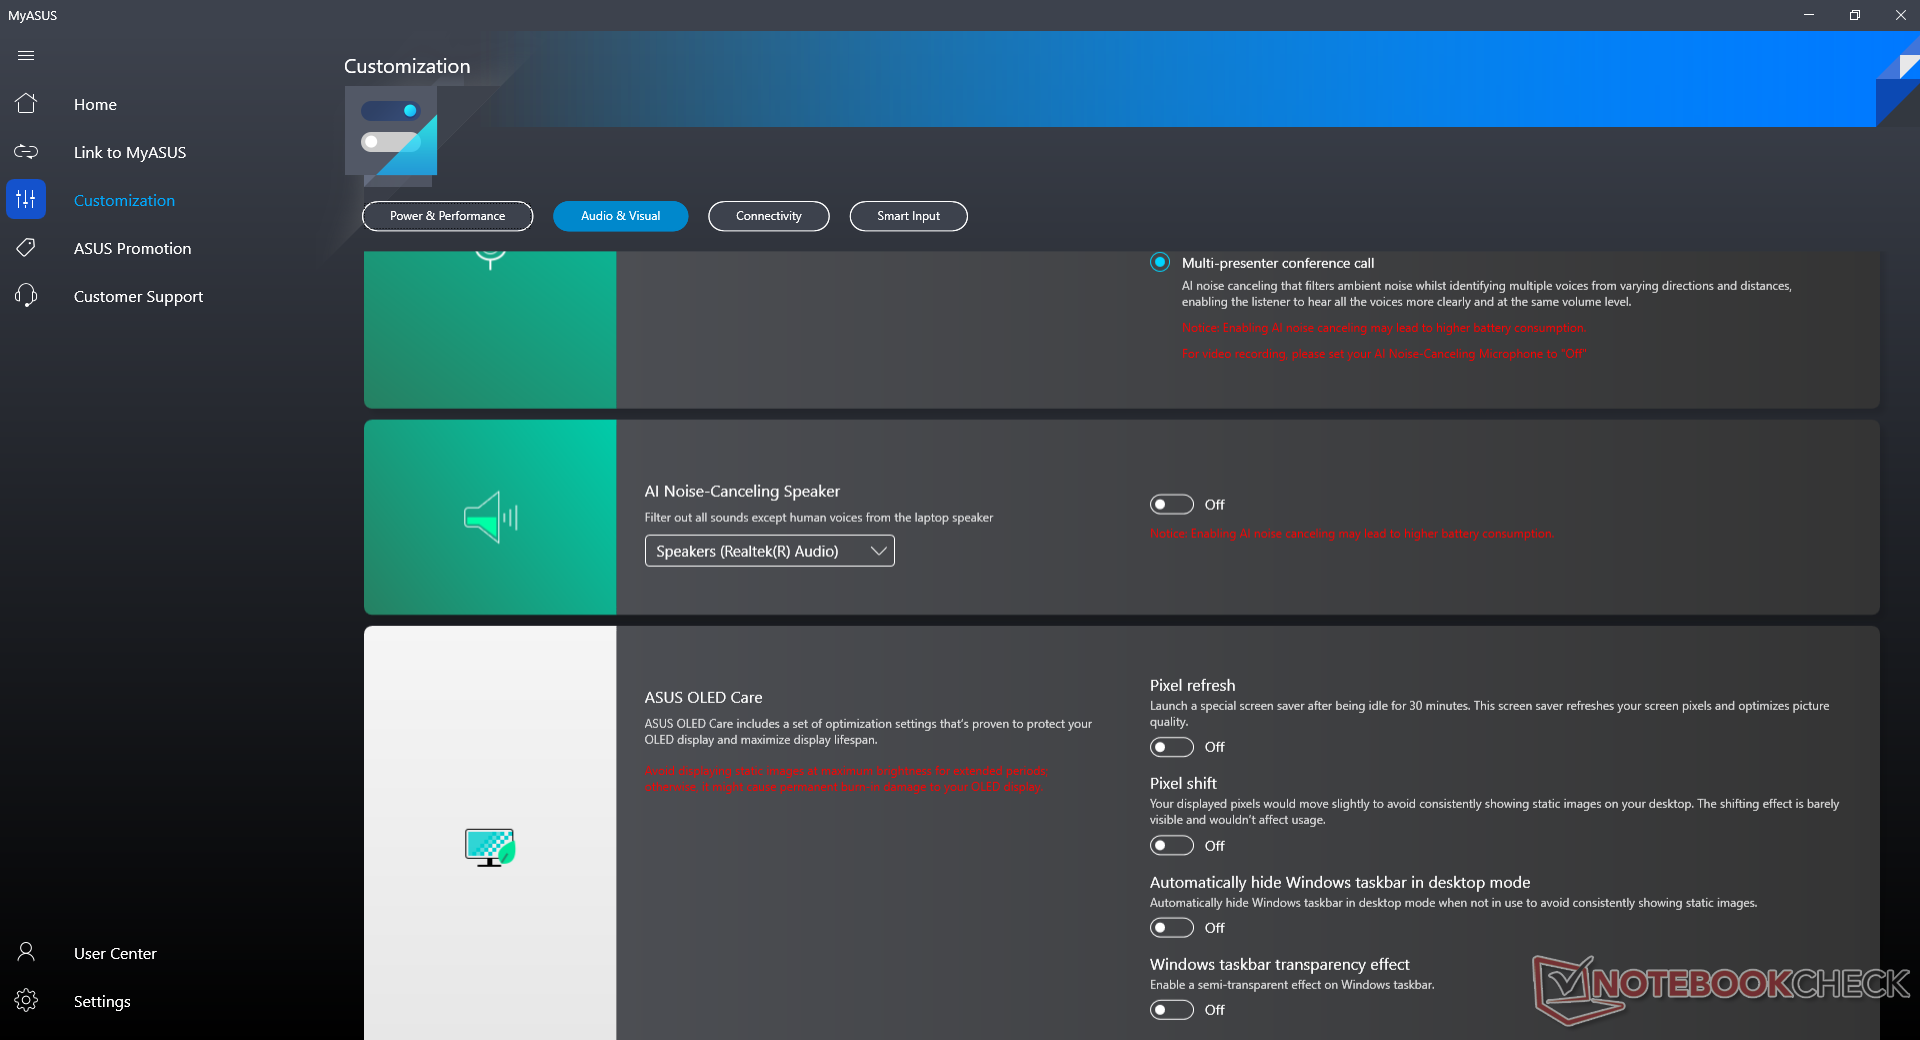
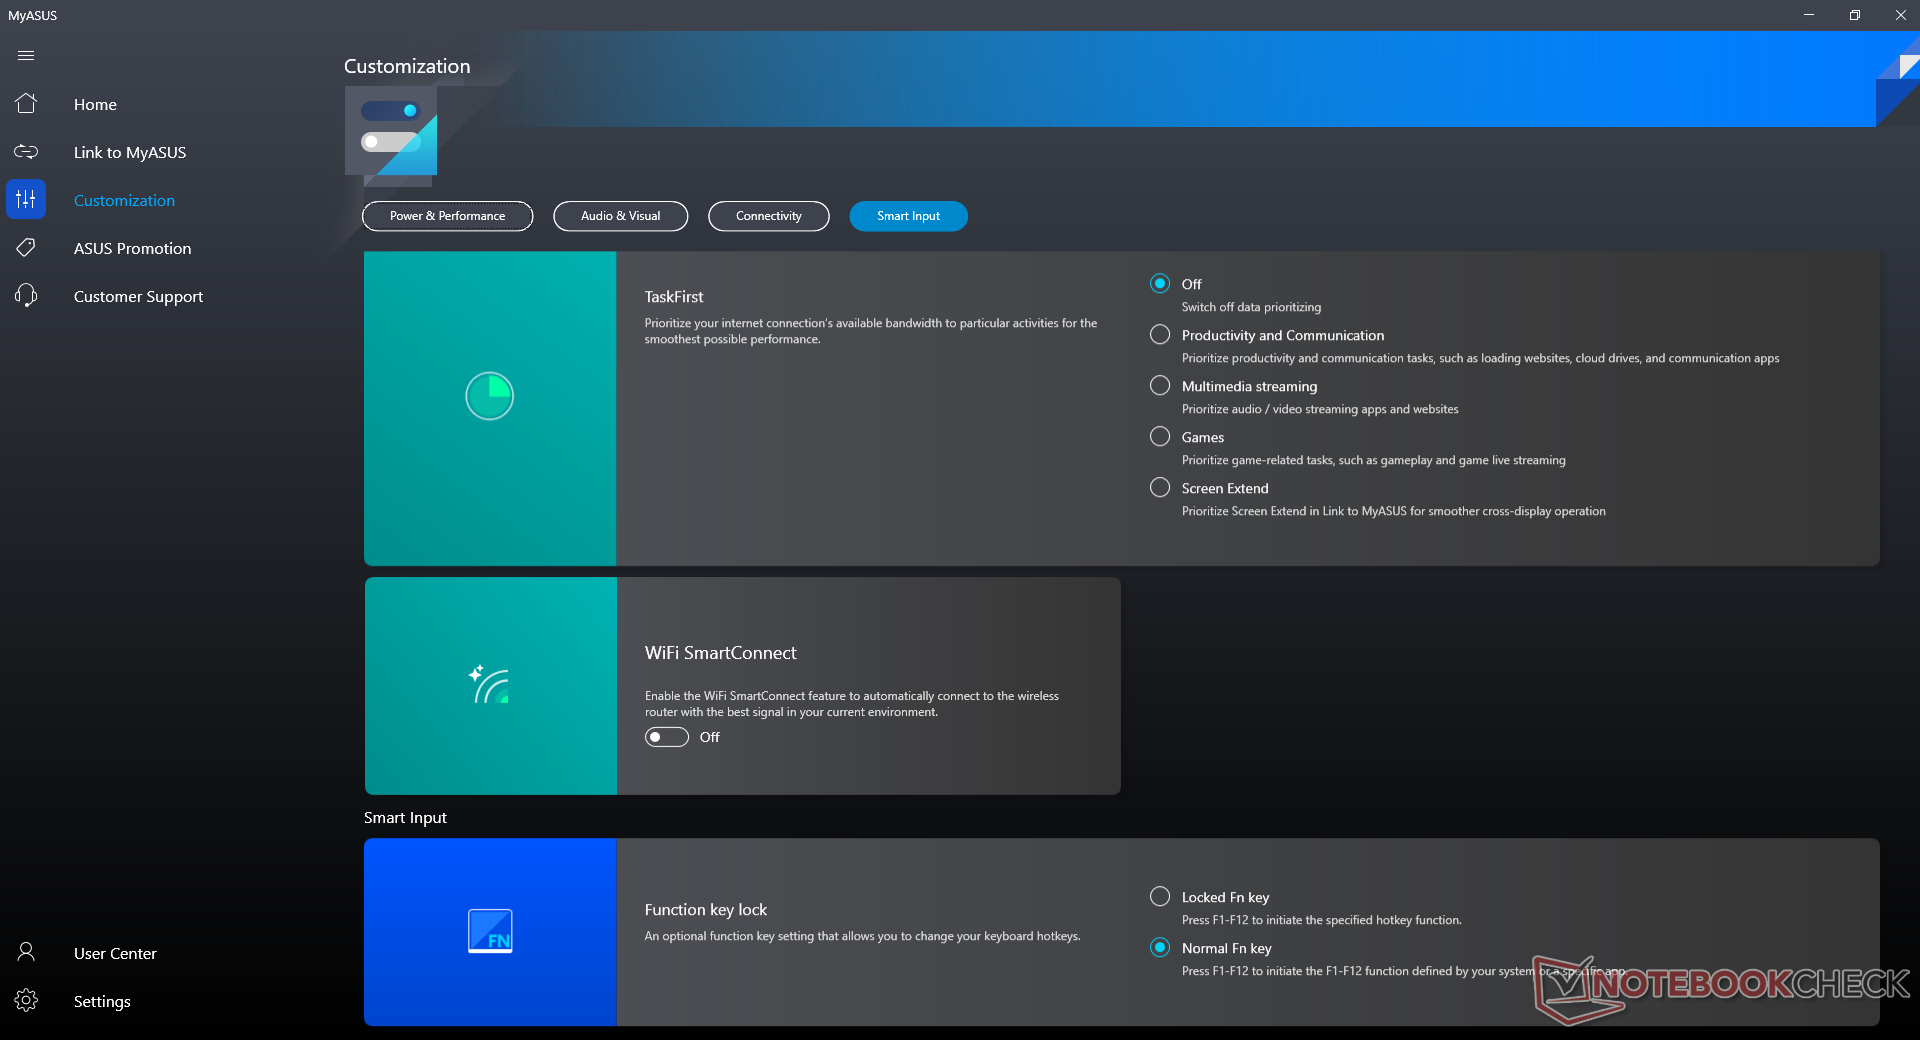
我们的设备通过MyAsus软件被设置为性能模式,以获得最佳的基准分数。我们建议用户熟悉这个软件,因为与OLED、麦克风、电池健康、华硕更新等相关的关键功能都可以在这里获得。
处理器
CPU性能非常好,多线程结果比我们数据库中相同的笔记本电脑平均快10%左右。 酷睿i7-1165G7处理器。选择较小的 酷睿i5-1135G7选项将导致性能下降约10%至15%。
Cinebench R15 Multi Loop
Cinebench R23: Multi Core | Single Core
Cinebench R20: CPU (Multi Core) | CPU (Single Core)
Cinebench R15: CPU Multi 64Bit | CPU Single 64Bit
Blender: v2.79 BMW27 CPU
7-Zip 18.03: 7z b 4 | 7z b 4 -mmt1
Geekbench 5.5: Multi-Core | Single-Core
HWBOT x265 Benchmark v2.2: 4k Preset
LibreOffice : 20 Documents To PDF
R Benchmark 2.5: Overall mean
| CPU Performance rating | |
| HP Pavilion Aero 13 be0097nr -2! | |
| Lenovo ThinkPad E15 G3-20YG003UGE | |
| Microsoft Surface Laptop 4 15 AMD TFF_00028 | |
| MSI Prestige 15 A10SC -10! | |
| VAIO SX14 VJS144X0111K -2! | |
| Asus Vivobook 15 K513EQ -2! | |
| Average Intel Core i7-1165G7 | |
| Microsoft Surface Laptop 3 15 i7-1065G7 -10! | |
| HP Pavilion x360 15-er0155ng | |
| Asus ZenBook 15 UX534FT-DB77 -10! | |
| Lenovo ThinkPad P15s Gen1-20T4000JGE -2! | |
| HP 250 G7-15S40ES -2! | |
| Dell Inspiron 15 5000 5502 -2! | |
| Cinebench R23 / Multi Core | |
| Microsoft Surface Laptop 4 15 AMD TFF_00028 | |
| Lenovo ThinkPad E15 G3-20YG003UGE | |
| HP Pavilion Aero 13 be0097nr | |
| VAIO SX14 VJS144X0111K | |
| Asus Vivobook 15 K513EQ | |
| Average Intel Core i7-1165G7 (2525 - 6862, n=64) | |
| HP Pavilion x360 15-er0155ng | |
| Cinebench R23 / Single Core | |
| VAIO SX14 VJS144X0111K | |
| Asus Vivobook 15 K513EQ | |
| Average Intel Core i7-1165G7 (1110 - 1539, n=59) | |
| HP Pavilion Aero 13 be0097nr | |
| HP Pavilion x360 15-er0155ng | |
| Microsoft Surface Laptop 4 15 AMD TFF_00028 | |
| Lenovo ThinkPad E15 G3-20YG003UGE | |
| Cinebench R20 / CPU (Multi Core) | |
| Lenovo ThinkPad E15 G3-20YG003UGE | |
| Microsoft Surface Laptop 4 15 AMD TFF_00028 | |
| HP Pavilion Aero 13 be0097nr | |
| MSI Prestige 15 A10SC | |
| VAIO SX14 VJS144X0111K | |
| Asus Vivobook 15 K513EQ | |
| Average Intel Core i7-1165G7 (1060 - 2657, n=81) | |
| HP Pavilion x360 15-er0155ng | |
| Microsoft Surface Laptop 3 15 i7-1065G7 | |
| Asus ZenBook 15 UX534FT-DB77 | |
| Lenovo ThinkPad P15s Gen1-20T4000JGE | |
| HP 250 G7-15S40ES | |
| Dell Inspiron 15 5000 5502 | |
| Cinebench R20 / CPU (Single Core) | |
| VAIO SX14 VJS144X0111K | |
| Asus Vivobook 15 K513EQ | |
| HP Pavilion Aero 13 be0097nr | |
| Average Intel Core i7-1165G7 (442 - 589, n=81) | |
| HP Pavilion x360 15-er0155ng | |
| Dell Inspiron 15 5000 5502 | |
| Microsoft Surface Laptop 4 15 AMD TFF_00028 | |
| Lenovo ThinkPad E15 G3-20YG003UGE | |
| Lenovo ThinkPad P15s Gen1-20T4000JGE | |
| MSI Prestige 15 A10SC | |
| Microsoft Surface Laptop 3 15 i7-1065G7 | |
| Asus ZenBook 15 UX534FT-DB77 | |
| HP 250 G7-15S40ES | |
| Cinebench R15 / CPU Multi 64Bit | |
| Microsoft Surface Laptop 4 15 AMD TFF_00028 | |
| Lenovo ThinkPad E15 G3-20YG003UGE | |
| HP Pavilion Aero 13 be0097nr | |
| MSI Prestige 15 A10SC | |
| VAIO SX14 VJS144X0111K | |
| Asus Vivobook 15 K513EQ | |
| Average Intel Core i7-1165G7 (553 - 1027, n=86) | |
| HP Pavilion x360 15-er0155ng | |
| Microsoft Surface Laptop 3 15 i7-1065G7 | |
| Lenovo ThinkPad P15s Gen1-20T4000JGE | |
| Asus ZenBook 15 UX534FT-DB77 | |
| HP 250 G7-15S40ES | |
| Dell Inspiron 15 5000 5502 | |
| Cinebench R15 / CPU Single 64Bit | |
| VAIO SX14 VJS144X0111K | |
| HP Pavilion Aero 13 be0097nr | |
| Asus Vivobook 15 K513EQ | |
| Average Intel Core i7-1165G7 (115 - 230, n=78) | |
| HP Pavilion x360 15-er0155ng | |
| Dell Inspiron 15 5000 5502 | |
| MSI Prestige 15 A10SC | |
| Lenovo ThinkPad E15 G3-20YG003UGE | |
| Lenovo ThinkPad P15s Gen1-20T4000JGE | |
| Microsoft Surface Laptop 3 15 i7-1065G7 | |
| Microsoft Surface Laptop 4 15 AMD TFF_00028 | |
| Asus ZenBook 15 UX534FT-DB77 | |
| HP 250 G7-15S40ES | |
| Blender / v2.79 BMW27 CPU | |
| Dell Inspiron 15 5000 5502 | |
| HP 250 G7-15S40ES | |
| Lenovo ThinkPad P15s Gen1-20T4000JGE | |
| HP Pavilion x360 15-er0155ng | |
| Average Intel Core i7-1165G7 (468 - 1138, n=80) | |
| Asus Vivobook 15 K513EQ | |
| VAIO SX14 VJS144X0111K | |
| Microsoft Surface Laptop 4 15 AMD TFF_00028 | |
| HP Pavilion Aero 13 be0097nr | |
| Lenovo ThinkPad E15 G3-20YG003UGE | |
| 7-Zip 18.03 / 7z b 4 | |
| HP Pavilion Aero 13 be0097nr | |
| Microsoft Surface Laptop 4 15 AMD TFF_00028 | |
| Lenovo ThinkPad E15 G3-20YG003UGE | |
| VAIO SX14 VJS144X0111K | |
| Asus Vivobook 15 K513EQ | |
| Average Intel Core i7-1165G7 (15347 - 27405, n=80) | |
| HP Pavilion x360 15-er0155ng | |
| Lenovo ThinkPad P15s Gen1-20T4000JGE | |
| HP 250 G7-15S40ES | |
| Dell Inspiron 15 5000 5502 | |
| 7-Zip 18.03 / 7z b 4 -mmt1 | |
| HP Pavilion Aero 13 be0097nr | |
| Asus Vivobook 15 K513EQ | |
| Average Intel Core i7-1165G7 (4478 - 5507, n=80) | |
| VAIO SX14 VJS144X0111K | |
| HP Pavilion x360 15-er0155ng | |
| Lenovo ThinkPad P15s Gen1-20T4000JGE | |
| Dell Inspiron 15 5000 5502 | |
| Lenovo ThinkPad E15 G3-20YG003UGE | |
| Microsoft Surface Laptop 4 15 AMD TFF_00028 | |
| HP 250 G7-15S40ES | |
| Geekbench 5.5 / Multi-Core | |
| Microsoft Surface Laptop 4 15 AMD TFF_00028 | |
| Lenovo ThinkPad E15 G3-20YG003UGE | |
| Average Intel Core i7-1165G7 (3078 - 5926, n=77) | |
| HP Pavilion x360 15-er0155ng | |
| Lenovo ThinkPad P15s Gen1-20T4000JGE | |
| HP 250 G7-15S40ES | |
| Dell Inspiron 15 5000 5502 | |
| Geekbench 5.5 / Single-Core | |
| Average Intel Core i7-1165G7 (1302 - 1595, n=77) | |
| HP Pavilion x360 15-er0155ng | |
| Dell Inspiron 15 5000 5502 | |
| Lenovo ThinkPad P15s Gen1-20T4000JGE | |
| Lenovo ThinkPad E15 G3-20YG003UGE | |
| HP 250 G7-15S40ES | |
| Microsoft Surface Laptop 4 15 AMD TFF_00028 | |
| HWBOT x265 Benchmark v2.2 / 4k Preset | |
| HP Pavilion Aero 13 be0097nr | |
| Lenovo ThinkPad E15 G3-20YG003UGE | |
| Microsoft Surface Laptop 4 15 AMD TFF_00028 | |
| VAIO SX14 VJS144X0111K | |
| Asus Vivobook 15 K513EQ | |
| Average Intel Core i7-1165G7 (1.39 - 8.47, n=80) | |
| HP Pavilion x360 15-er0155ng | |
| Lenovo ThinkPad P15s Gen1-20T4000JGE | |
| HP 250 G7-15S40ES | |
| Dell Inspiron 15 5000 5502 | |
| LibreOffice / 20 Documents To PDF | |
| Microsoft Surface Laptop 4 15 AMD TFF_00028 | |
| Lenovo ThinkPad P15s Gen1-20T4000JGE | |
| Dell Inspiron 15 5000 5502 | |
| Lenovo ThinkPad E15 G3-20YG003UGE | |
| HP 250 G7-15S40ES | |
| HP Pavilion Aero 13 be0097nr | |
| VAIO SX14 VJS144X0111K | |
| Average Intel Core i7-1165G7 (21.5 - 88.1, n=78) | |
| HP Pavilion x360 15-er0155ng | |
| Asus Vivobook 15 K513EQ | |
| R Benchmark 2.5 / Overall mean | |
| HP 250 G7-15S40ES | |
| Dell Inspiron 15 5000 5502 | |
| Microsoft Surface Laptop 4 15 AMD TFF_00028 | |
| Lenovo ThinkPad P15s Gen1-20T4000JGE | |
| HP Pavilion x360 15-er0155ng | |
| Lenovo ThinkPad E15 G3-20YG003UGE | |
| Average Intel Core i7-1165G7 (0.552 - 1.002, n=80) | |
| Asus Vivobook 15 K513EQ | |
| VAIO SX14 VJS144X0111K | |
| HP Pavilion Aero 13 be0097nr | |
Cinebench R23: Multi Core | Single Core
Cinebench R20: CPU (Multi Core) | CPU (Single Core)
Cinebench R15: CPU Multi 64Bit | CPU Single 64Bit
Blender: v2.79 BMW27 CPU
7-Zip 18.03: 7z b 4 | 7z b 4 -mmt1
Geekbench 5.5: Multi-Core | Single-Core
HWBOT x265 Benchmark v2.2: 4k Preset
LibreOffice : 20 Documents To PDF
R Benchmark 2.5: Overall mean
* ... smaller is better
AIDA64: FP32 Ray-Trace | FPU Julia | CPU SHA3 | CPU Queen | FPU SinJulia | FPU Mandel | CPU AES | CPU ZLib | FP64 Ray-Trace | CPU PhotoWorxx
| Performance rating | |
| Asus VivoBook 15 Pro M3500QC-L1062 | |
| Lenovo IdeaPad 5 15ALC05 | |
| Asus Vivobook 15 K513EQ | |
| HP Pavilion 15-eg | |
| Asus VivoBook S15 S533EQ-BQ002T | |
| Average Intel Core i7-1165G7 | |
| Dell Inspiron 15 3501 | |
| AIDA64 / FP32 Ray-Trace | |
| Asus VivoBook 15 Pro M3500QC-L1062 | |
| Lenovo IdeaPad 5 15ALC05 | |
| Asus Vivobook 15 K513EQ | |
| Asus VivoBook S15 S533EQ-BQ002T | |
| Average Intel Core i7-1165G7 (3933 - 8184, n=58) | |
| HP Pavilion 15-eg | |
| Dell Inspiron 15 3501 | |
| AIDA64 / FPU Julia | |
| Asus VivoBook 15 Pro M3500QC-L1062 | |
| Lenovo IdeaPad 5 15ALC05 | |
| Asus Vivobook 15 K513EQ | |
| Asus VivoBook S15 S533EQ-BQ002T | |
| Average Intel Core i7-1165G7 (17720 - 34369, n=58) | |
| HP Pavilion 15-eg | |
| Dell Inspiron 15 3501 | |
| AIDA64 / CPU SHA3 | |
| Asus VivoBook 15 Pro M3500QC-L1062 | |
| Asus Vivobook 15 K513EQ | |
| Asus VivoBook S15 S533EQ-BQ002T | |
| Average Intel Core i7-1165G7 (958 - 2338, n=58) | |
| HP Pavilion 15-eg | |
| Dell Inspiron 15 3501 | |
| Lenovo IdeaPad 5 15ALC05 | |
| AIDA64 / CPU Queen | |
| Asus VivoBook 15 Pro M3500QC-L1062 | |
| Lenovo IdeaPad 5 15ALC05 | |
| HP Pavilion 15-eg | |
| Asus VivoBook S15 S533EQ-BQ002T | |
| Asus Vivobook 15 K513EQ | |
| Dell Inspiron 15 3501 | |
| Average Intel Core i7-1165G7 (44161 - 50624, n=58) | |
| AIDA64 / FPU SinJulia | |
| Lenovo IdeaPad 5 15ALC05 | |
| Asus VivoBook 15 Pro M3500QC-L1062 | |
| Asus Vivobook 15 K513EQ | |
| Asus VivoBook S15 S533EQ-BQ002T | |
| Average Intel Core i7-1165G7 (3183 - 4796, n=58) | |
| HP Pavilion 15-eg | |
| Dell Inspiron 15 3501 | |
| AIDA64 / FPU Mandel | |
| Asus VivoBook 15 Pro M3500QC-L1062 | |
| Lenovo IdeaPad 5 15ALC05 | |
| Asus Vivobook 15 K513EQ | |
| Asus VivoBook S15 S533EQ-BQ002T | |
| Average Intel Core i7-1165G7 (11876 - 20468, n=58) | |
| HP Pavilion 15-eg | |
| Dell Inspiron 15 3501 | |
| AIDA64 / CPU AES | |
| Asus VivoBook 15 Pro M3500QC-L1062 | |
| Asus Vivobook 15 K513EQ | |
| Asus VivoBook S15 S533EQ-BQ002T | |
| HP Pavilion 15-eg | |
| Dell Inspiron 15 3501 | |
| Average Intel Core i7-1165G7 (29506 - 73387, n=58) | |
| Lenovo IdeaPad 5 15ALC05 | |
| AIDA64 / CPU ZLib | |
| Asus VivoBook 15 Pro M3500QC-L1062 | |
| Lenovo IdeaPad 5 15ALC05 | |
| Asus Vivobook 15 K513EQ | |
| Asus VivoBook S15 S533EQ-BQ002T | |
| Dell Inspiron 15 3501 | |
| HP Pavilion 15-eg | |
| Average Intel Core i7-1165G7 (169 - 402, n=65) | |
| AIDA64 / FP64 Ray-Trace | |
| Asus VivoBook 15 Pro M3500QC-L1062 | |
| Lenovo IdeaPad 5 15ALC05 | |
| Asus Vivobook 15 K513EQ | |
| Asus VivoBook S15 S533EQ-BQ002T | |
| Dell Inspiron 15 3501 | |
| Average Intel Core i7-1165G7 (2033 - 4461, n=58) | |
| HP Pavilion 15-eg | |
| AIDA64 / CPU PhotoWorxx | |
| HP Pavilion 15-eg | |
| Average Intel Core i7-1165G7 (12392 - 45694, n=58) | |
| Asus VivoBook S15 S533EQ-BQ002T | |
| Asus Vivobook 15 K513EQ | |
| Dell Inspiron 15 3501 | |
| Lenovo IdeaPad 5 15ALC05 | |
| Asus VivoBook 15 Pro M3500QC-L1062 | |
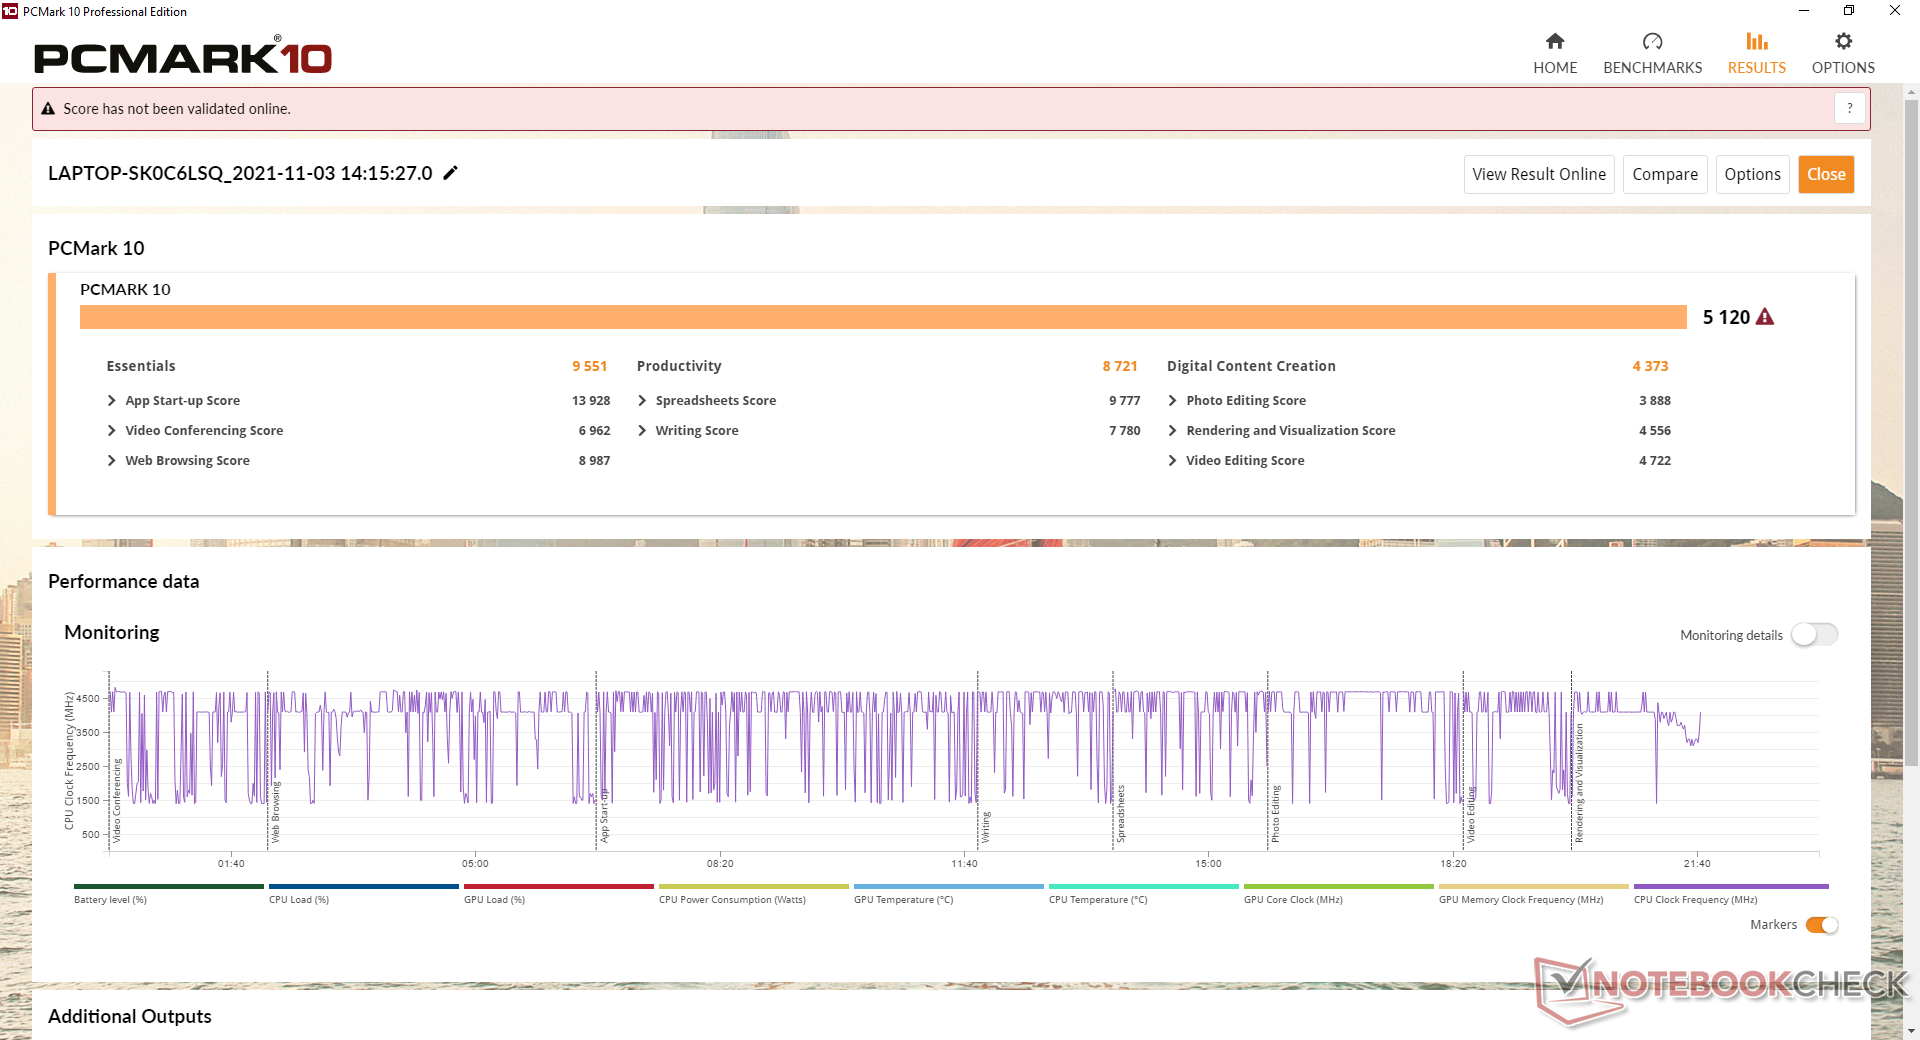
系统性能
| PCMark 10 / Score | |
| Asus VivoBook 15 Pro M3500QC-L1062 | |
| HP Pavilion 15-eg | |
| Asus VivoBook S15 S533EQ-BQ002T | |
| Lenovo IdeaPad 5 15ALC05 | |
| Asus Vivobook 15 K513EQ | |
| Average Intel Core i7-1165G7, NVIDIA GeForce MX350 (4855 - 5306, n=5) | |
| Dell Inspiron 15 3501 | |
| PCMark 10 / Essentials | |
| Asus VivoBook 15 Pro M3500QC-L1062 | |
| HP Pavilion 15-eg | |
| Dell Inspiron 15 3501 | |
| Asus Vivobook 15 K513EQ | |
| Lenovo IdeaPad 5 15ALC05 | |
| Asus VivoBook S15 S533EQ-BQ002T | |
| Average Intel Core i7-1165G7, NVIDIA GeForce MX350 (8026 - 9551, n=5) | |
| PCMark 10 / Productivity | |
| HP Pavilion 15-eg | |
| Asus Vivobook 15 K513EQ | |
| Average Intel Core i7-1165G7, NVIDIA GeForce MX350 (8343 - 9071, n=5) | |
| Asus VivoBook 15 Pro M3500QC-L1062 | |
| Asus VivoBook S15 S533EQ-BQ002T | |
| Lenovo IdeaPad 5 15ALC05 | |
| Dell Inspiron 15 3501 | |
| PCMark 10 / Digital Content Creation | |
| Asus VivoBook 15 Pro M3500QC-L1062 | |
| HP Pavilion 15-eg | |
| Asus VivoBook S15 S533EQ-BQ002T | |
| Lenovo IdeaPad 5 15ALC05 | |
| Dell Inspiron 15 3501 | |
| Average Intel Core i7-1165G7, NVIDIA GeForce MX350 (4373 - 5330, n=5) | |
| Asus Vivobook 15 K513EQ | |
| PCMark 10 Score | 5120 points | |
Help | ||
| AIDA64 / Memory Copy | |
| Average Intel Core i7-1165G7 (20032 - 65446, n=58) | |
| HP Pavilion 15-eg | |
| Asus VivoBook 15 Pro M3500QC-L1062 | |
| Asus VivoBook S15 S533EQ-BQ002T | |
| Asus Vivobook 15 K513EQ | |
| Lenovo IdeaPad 5 15ALC05 | |
| Dell Inspiron 15 3501 | |
| AIDA64 / Memory Read | |
| Average Intel Core i7-1165G7 (23033 - 64524, n=58) | |
| HP Pavilion 15-eg | |
| Asus VivoBook 15 Pro M3500QC-L1062 | |
| Asus Vivobook 15 K513EQ | |
| Asus VivoBook S15 S533EQ-BQ002T | |
| Lenovo IdeaPad 5 15ALC05 | |
| Dell Inspiron 15 3501 | |
| AIDA64 / Memory Write | |
| Average Intel Core i7-1165G7 (21736 - 66791, n=58) | |
| HP Pavilion 15-eg | |
| Asus Vivobook 15 K513EQ | |
| Asus VivoBook S15 S533EQ-BQ002T | |
| Asus VivoBook 15 Pro M3500QC-L1062 | |
| Dell Inspiron 15 3501 | |
| Lenovo IdeaPad 5 15ALC05 | |
| AIDA64 / Memory Latency | |
| Lenovo IdeaPad 5 15ALC05 | |
| Dell Inspiron 15 3501 | |
| Asus Vivobook 15 K513EQ | |
| Asus VivoBook S15 S533EQ-BQ002T | |
| Average Intel Core i7-1165G7 (69 - 110, n=65) | |
| Asus VivoBook 15 Pro M3500QC-L1062 | |
| HP Pavilion 15-eg | |
* ... smaller is better
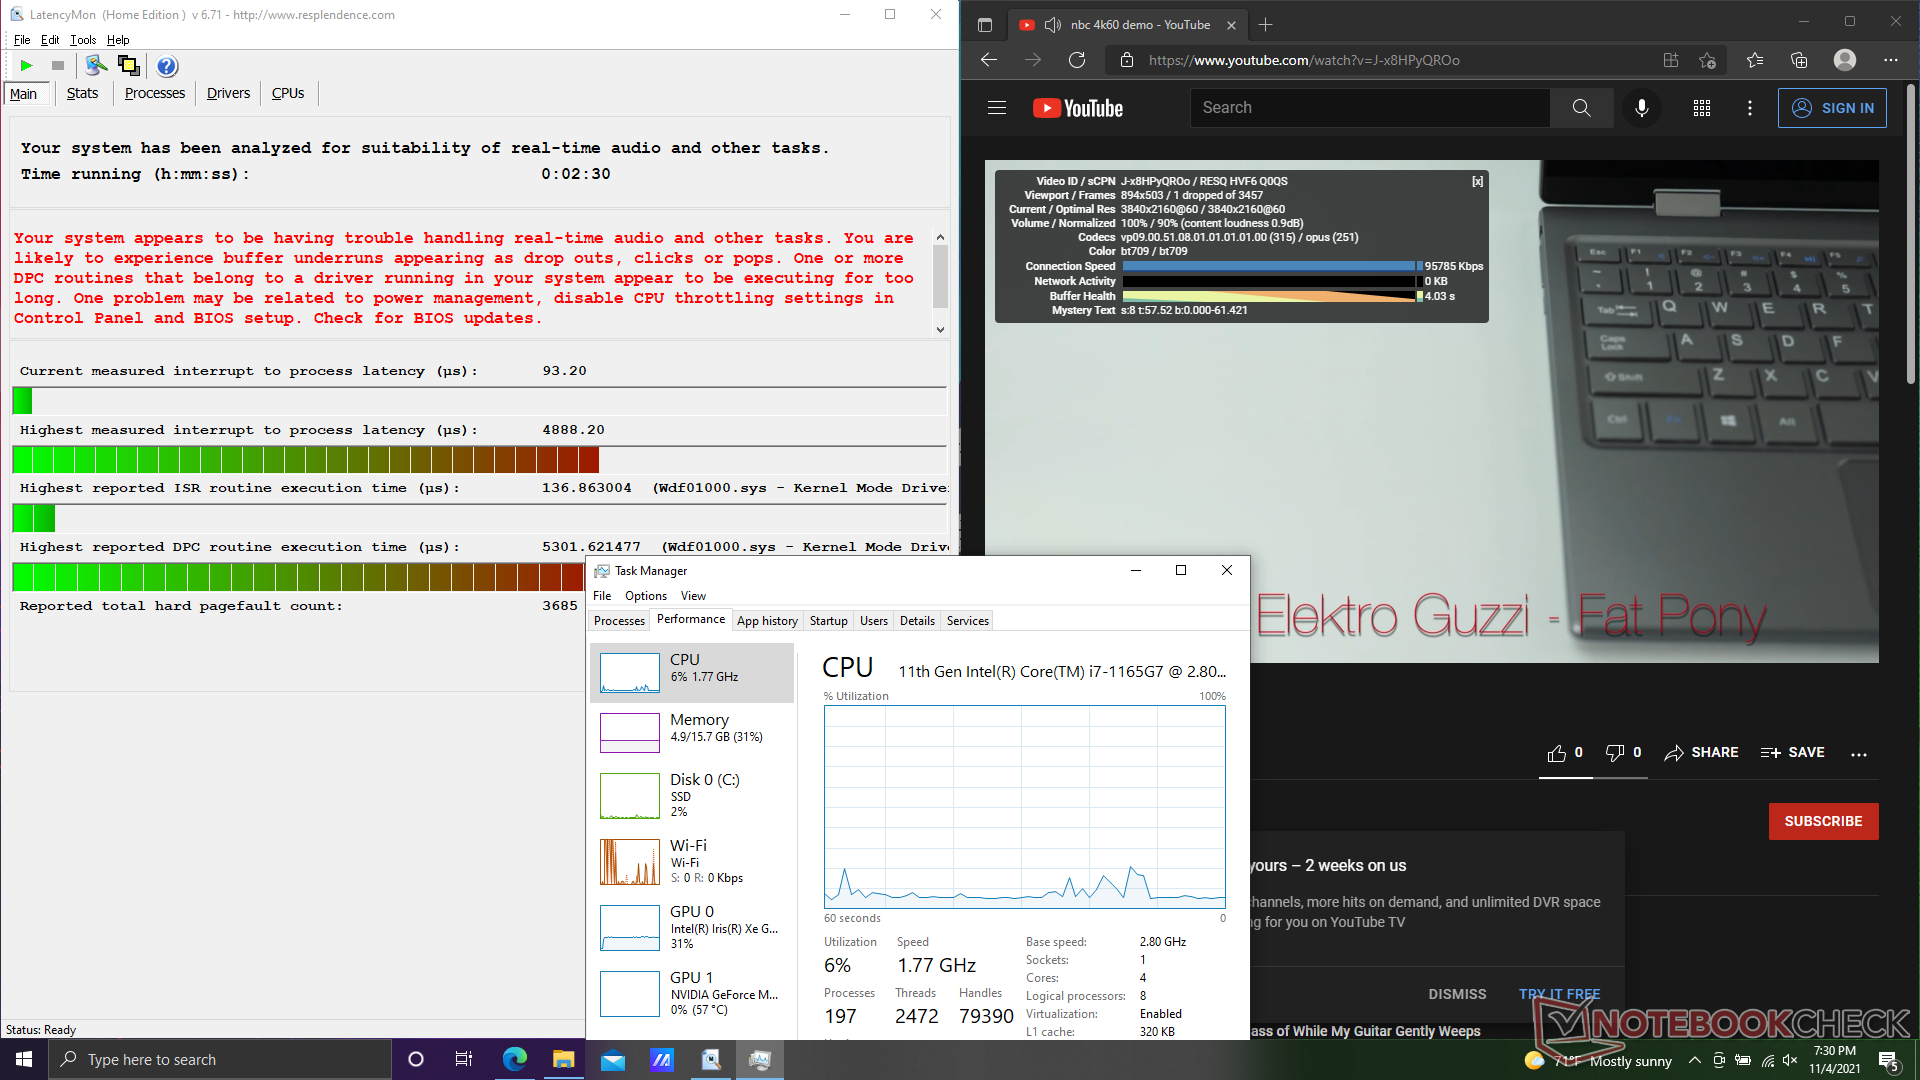
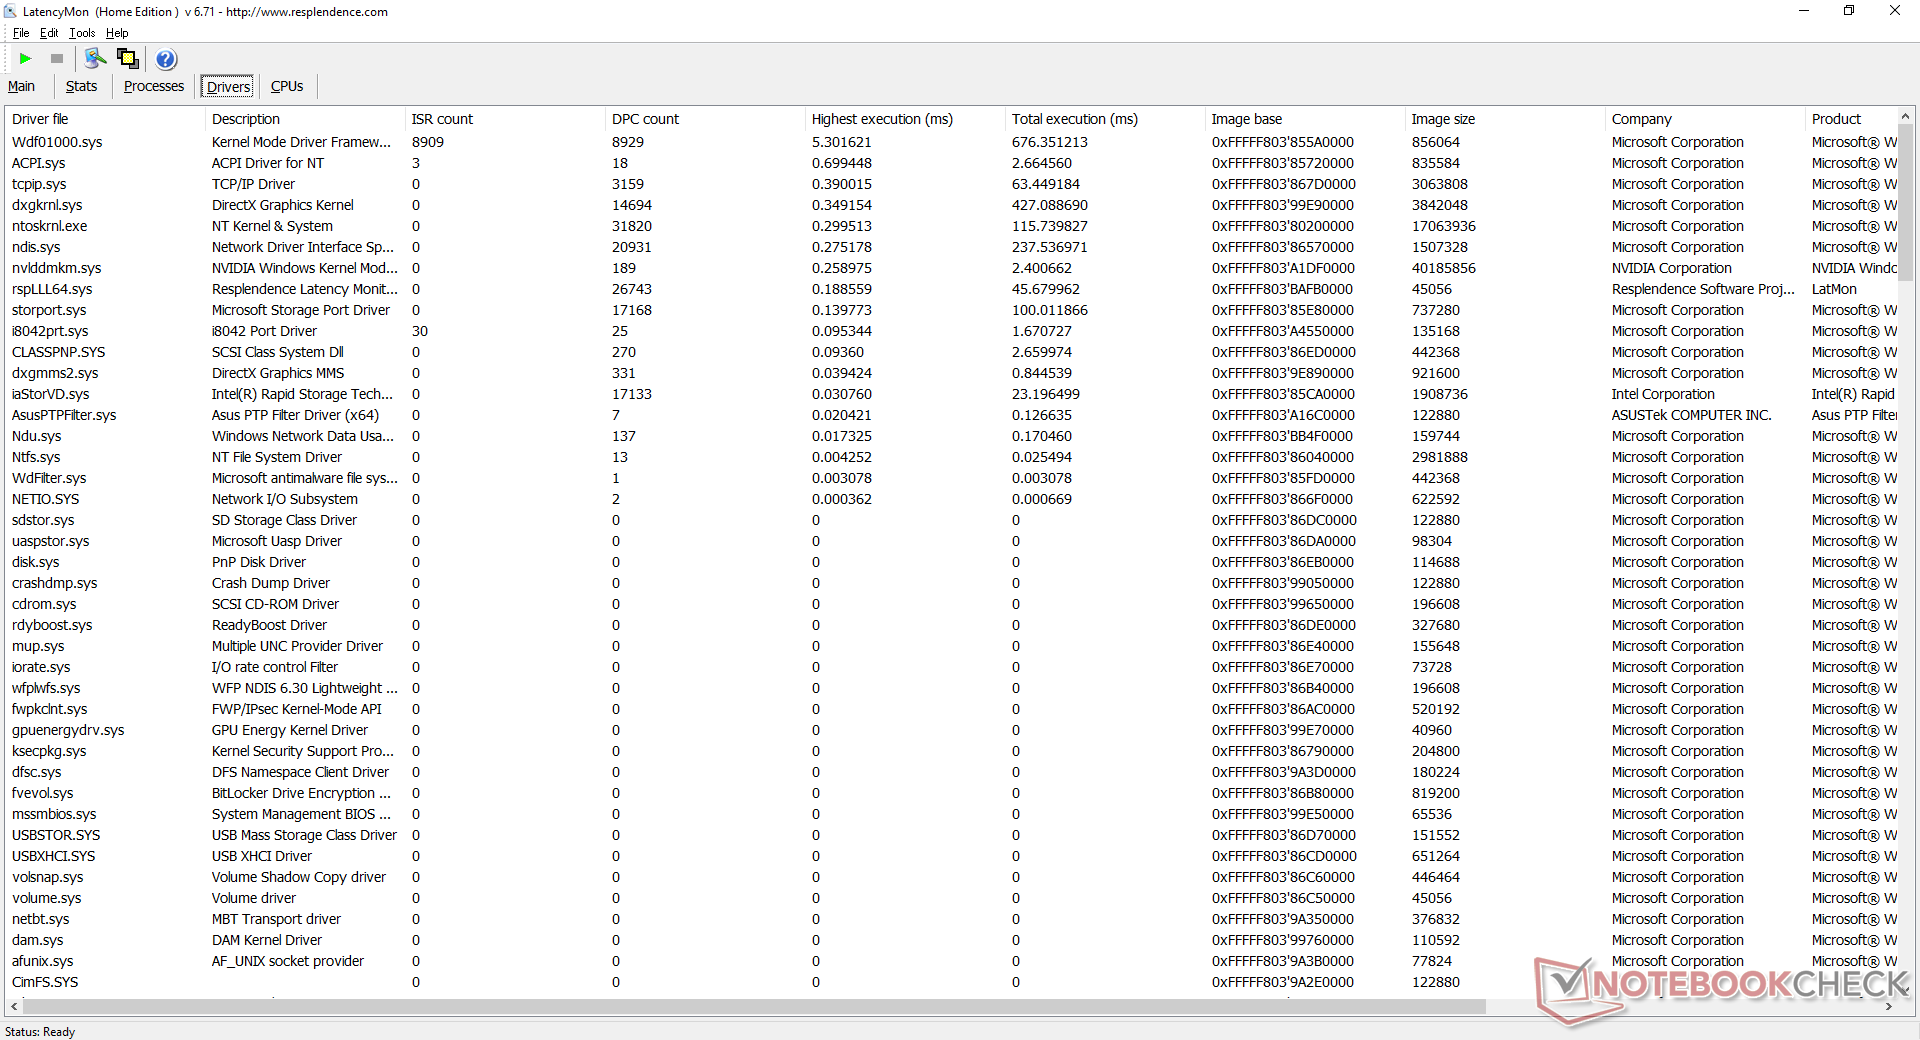
DPC延时
LatencyMon显示在我们的主页上打开多个浏览器标签时存在DPC问题。在60 FPS的情况下,本地4K视频播放很流畅,没有问题。
| DPC Latencies / LatencyMon - interrupt to process latency (max), Web, Youtube, Prime95 | |
| Asus Vivobook 15 K513EQ | |
| HP Pavilion 15-eg | |
| Dell Inspiron 15 3501 | |
| Lenovo IdeaPad 5 15ALC05 | |
| Asus VivoBook S15 S533EQ-BQ002T | |
| Asus VivoBook 15 Pro M3500QC-L1062 | |
* ... smaller is better
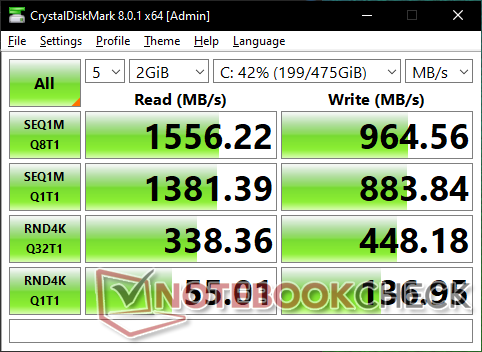
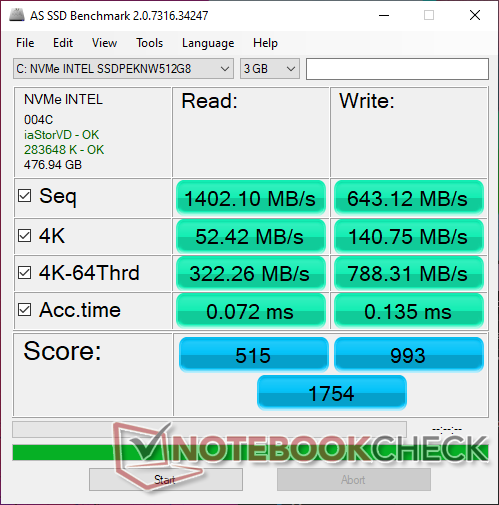
存储设备 - 只有一个驱动器的空间
我们的设备配置了一个512GB 英特尔660p SSDPEKNW512G8PCIe3 NVMe固态硬盘的理论最大读写速率分别只有1500MB/s和1000MB/s,这比更昂贵的三星PM981a系列慢了大约2倍。对于目标受众来说,性能可能是足够的,特别是考虑到该硬盘所搭配的ULV U系列CPU和GeForce MX图形。由于英特尔660p只是一个预算到中档的NVMe解决方案,所以在压力下,散热器对保持性能并不那么必要。

| Drive Performance rating - Percent | |
| Asus VivoBook 15 Pro M3500QC-L1062 | |
| Dell Inspiron 15 3501 | |
| Lenovo IdeaPad 5 15ALC05 | |
| Asus VivoBook S15 S533EQ-BQ002T | |
| HP Pavilion 15-eg | |
| Asus Vivobook 15 K513EQ | |
* ... smaller is better
Disk Throttling: DiskSpd Read Loop, Queue Depth 8
GPU性能 - Iris Xe与GeForce MX350相比
图形性能是我们所期望的,相对于其他配备相同的笔记本电脑而言。 GeForce MX350GPU。英特尔的竞争性集成 Iris Xe平台随着时间的推移,在驱动程序和游戏支持方面一直在稳步提高,现在在大多数情况下与Nvidia GPU并驾齐驱。GTA V和DOTA 2 Reborn是两个明显的例外,我们的GeForce-powered Vivobook与Iris Xe相比仍然拥有明显的性能优势。
从 MX330 升级到MX350将使性能提高约15%至20%。
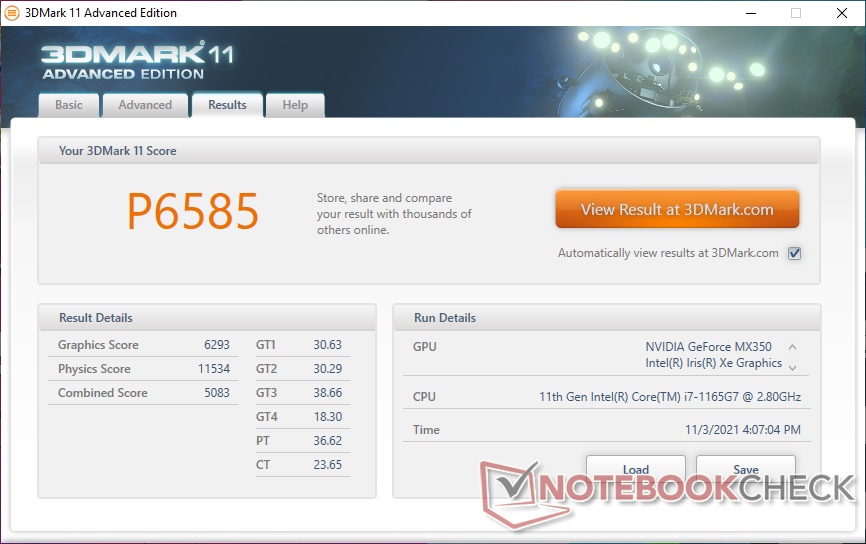
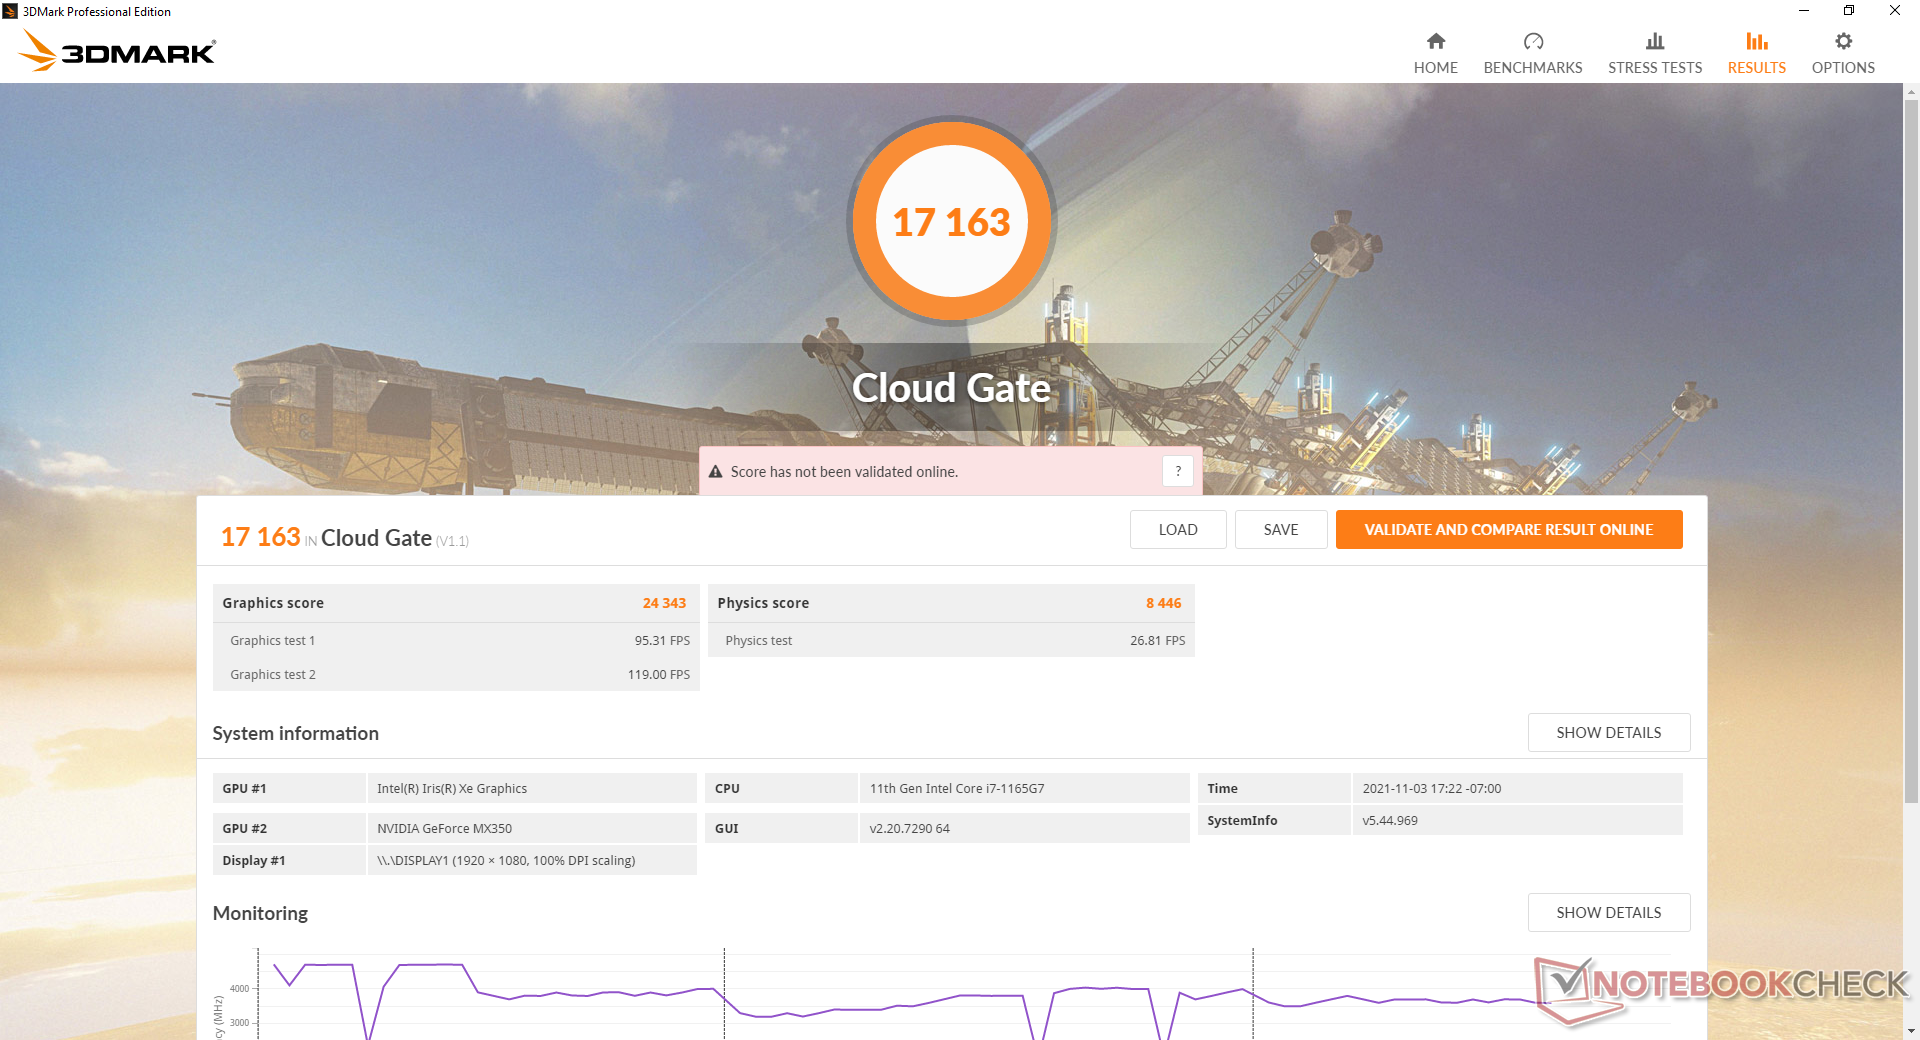
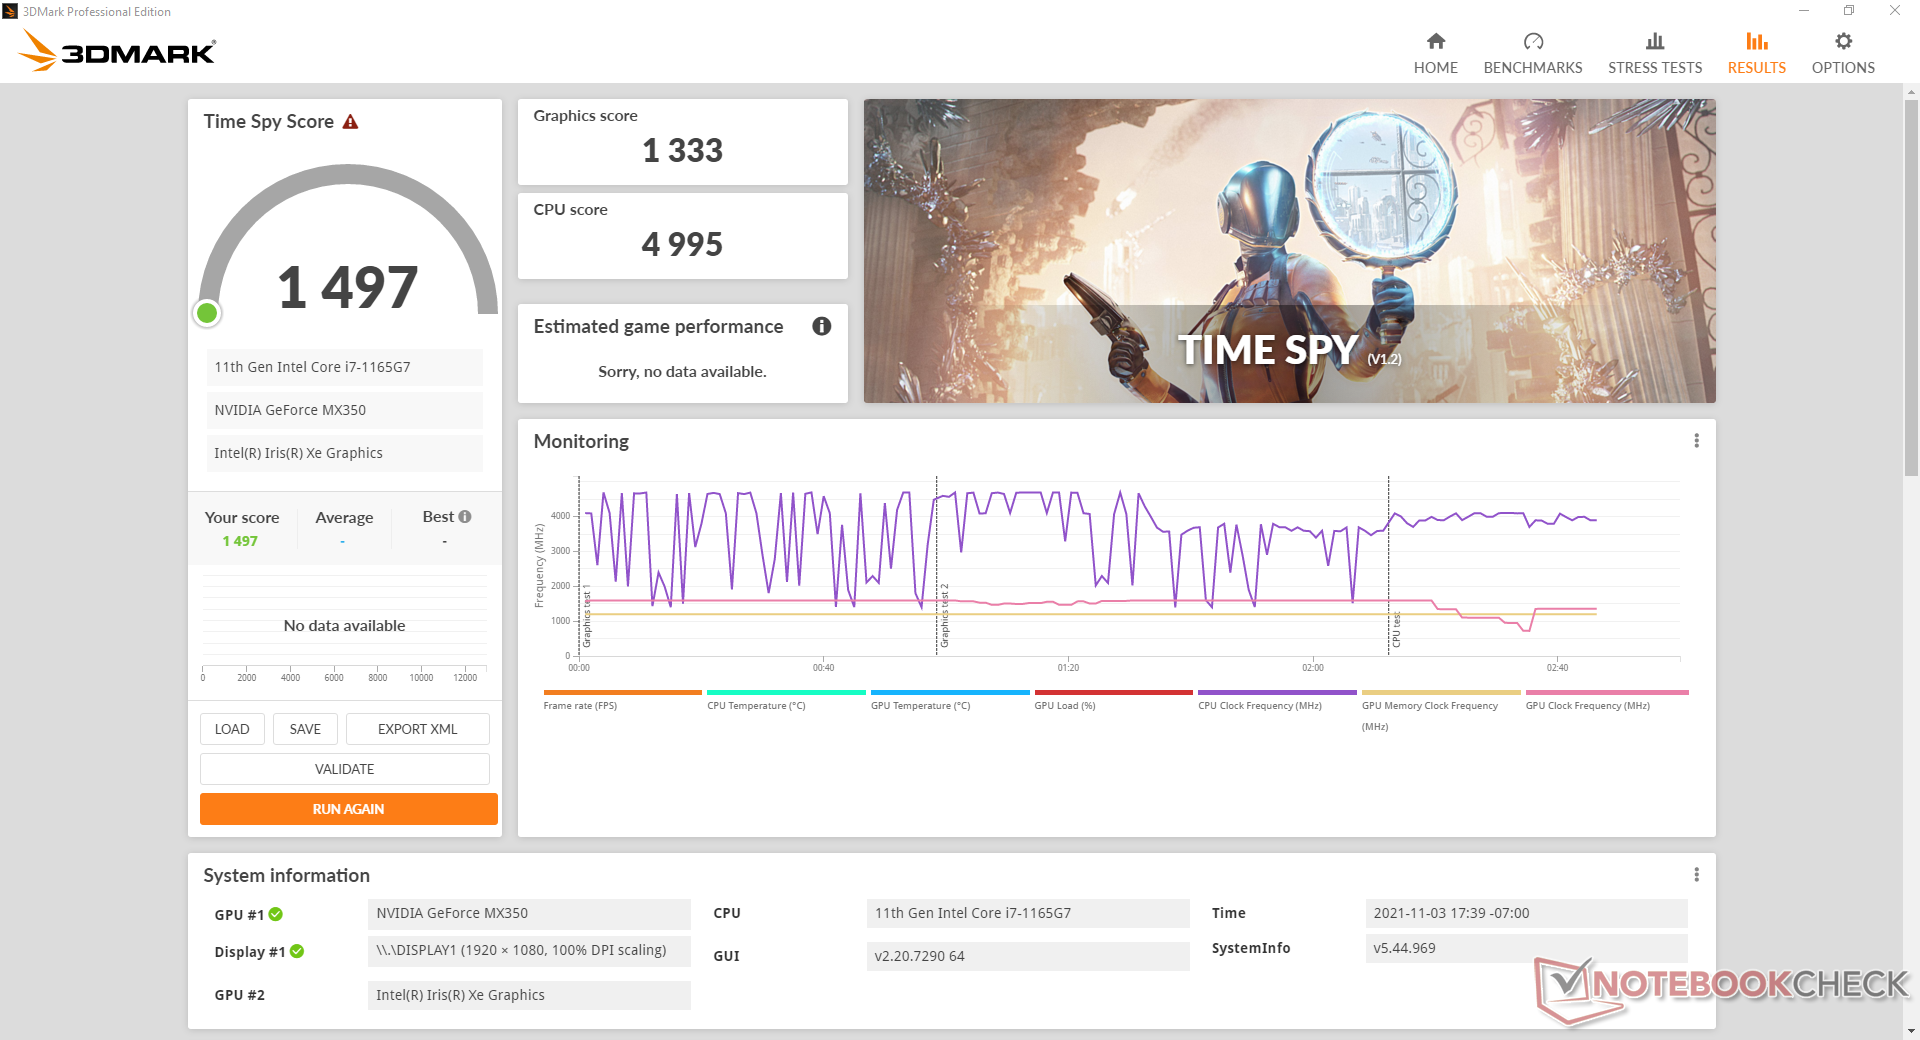
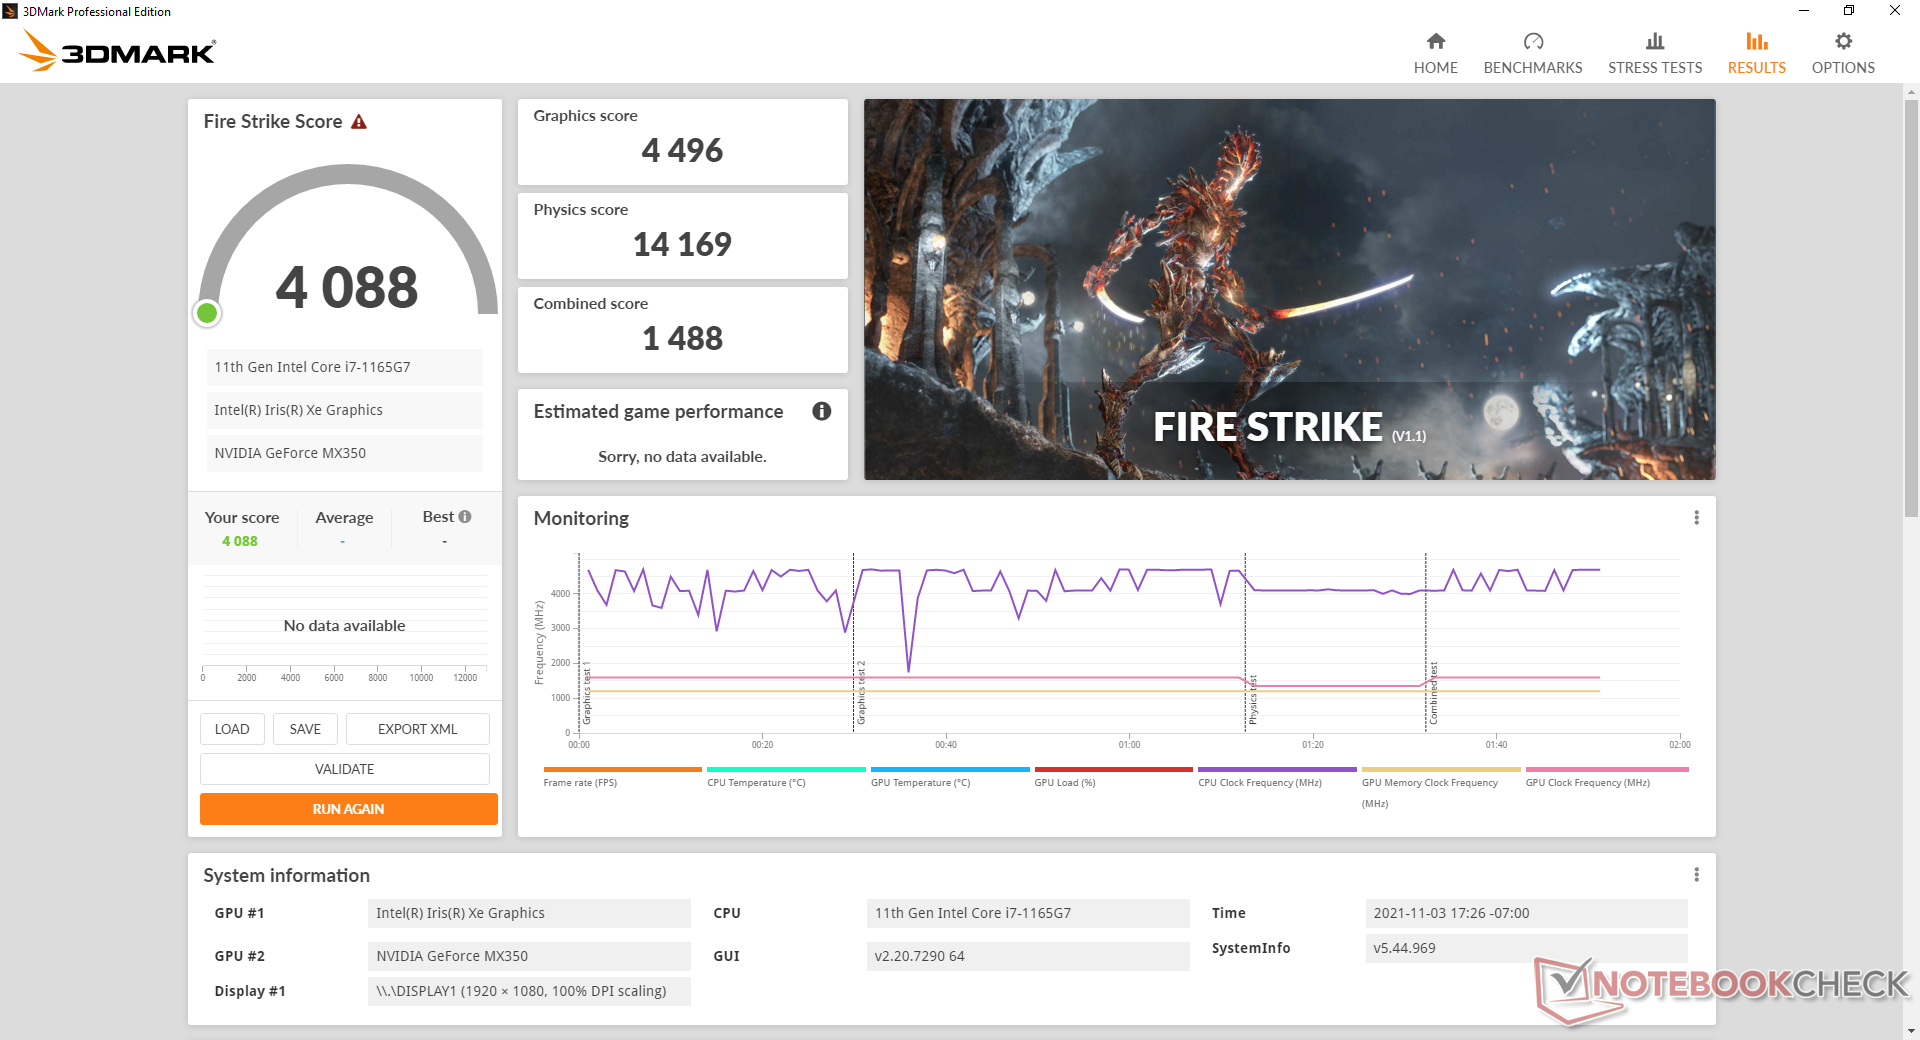
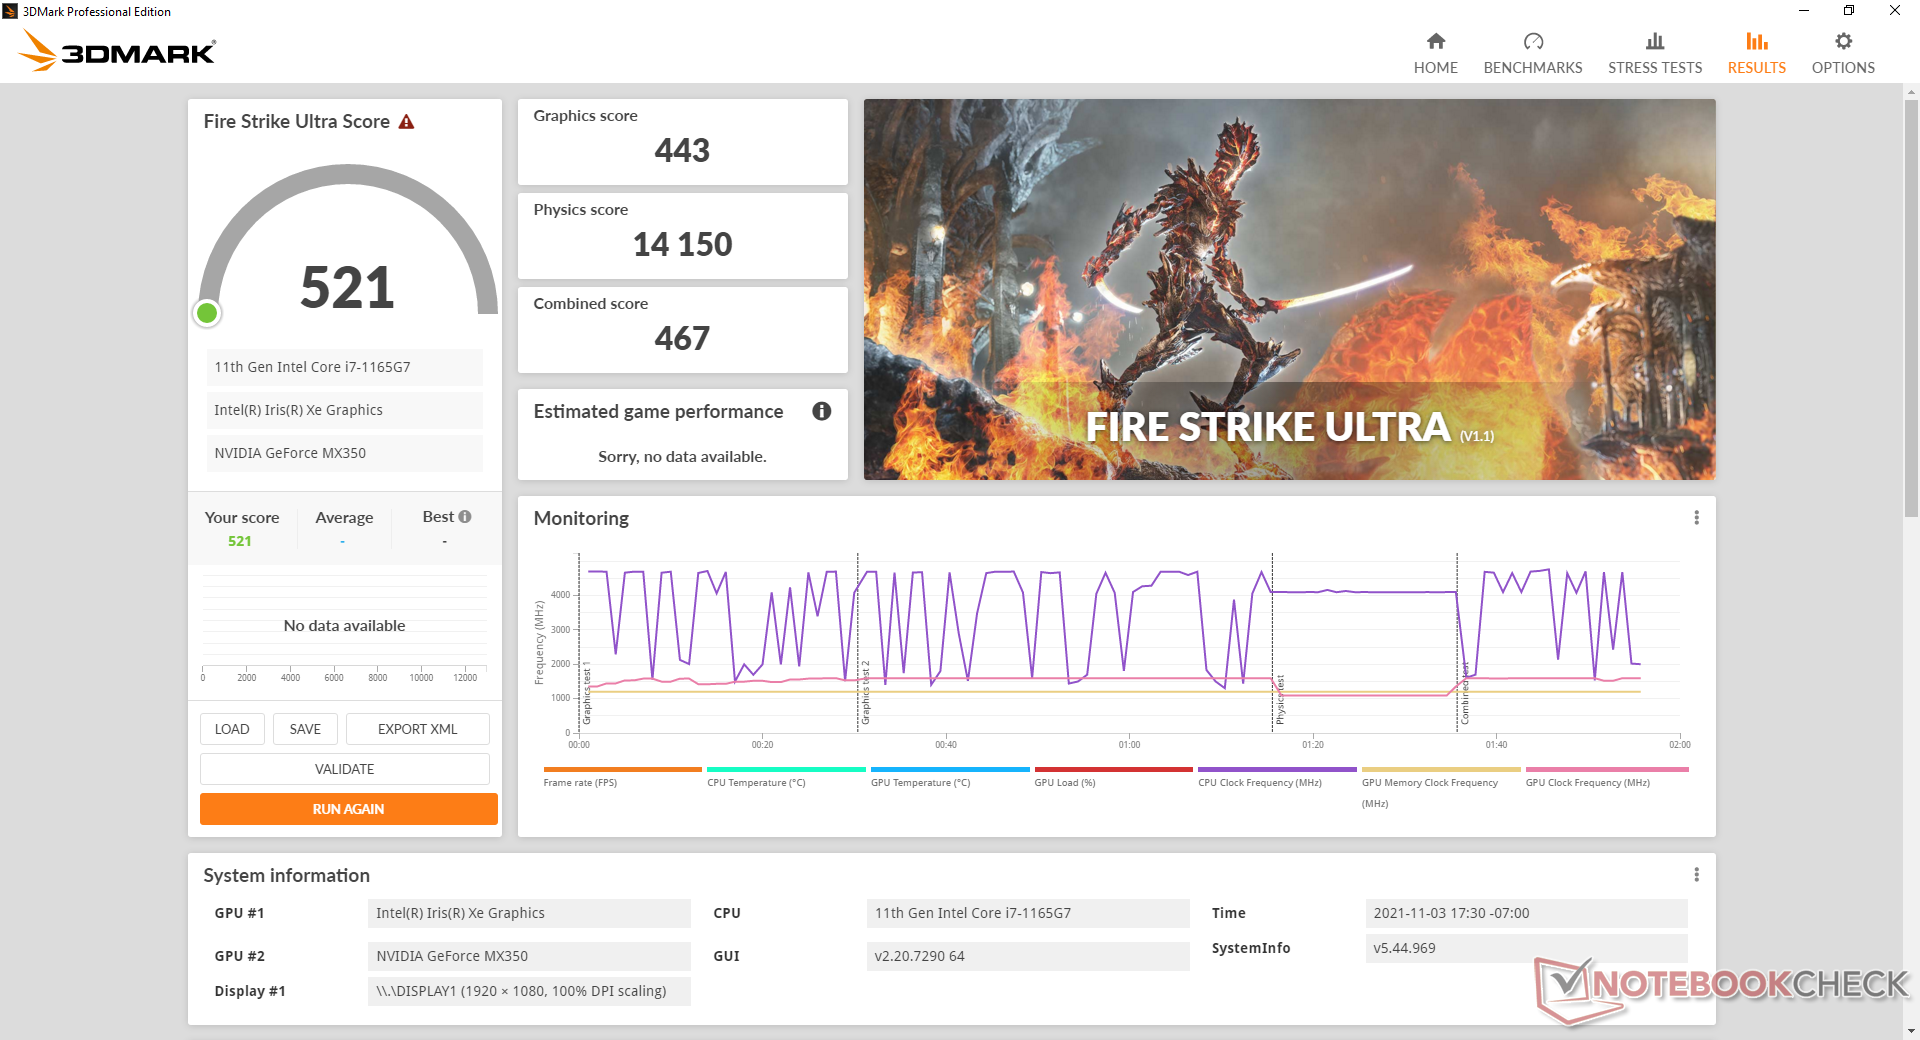
| 3DMark 11 Performance | 6585 points | |
| 3DMark Cloud Gate Standard Score | 17163 points | |
| 3DMark Fire Strike Score | 4088 points | |
| 3DMark Time Spy Score | 1497 points | |
Help | ||
| Far Cry 5 | |
| 1280x720 Low Preset AA:T | |
| VAIO SX14 VJS144X0111K | |
| Average NVIDIA GeForce MX350 (58 - 64, n=7) | |
| Asus Vivobook 15 K513EQ | |
| Microsoft Surface Laptop 4 15 AMD TFF_00028 | |
| HP Pavilion Aero 13 be0097nr | |
| HP 250 G7-15S40ES | |
| 1920x1080 Low Preset AA:T | |
| Average NVIDIA GeForce MX350 (32 - 34, n=3) | |
| VAIO SX14 VJS144X0111K | |
| Asus Vivobook 15 K513EQ | |
| HP Pavilion Aero 13 be0097nr | |
| HP 250 G7-15S40ES | |
| 1920x1080 Medium Preset AA:T | |
| VAIO SX14 VJS144X0111K | |
| Average NVIDIA GeForce MX350 (24 - 30, n=7) | |
| Asus Vivobook 15 K513EQ | |
| HP Pavilion Aero 13 be0097nr | |
| Microsoft Surface Laptop 4 15 AMD TFF_00028 | |
| HP 250 G7-15S40ES | |
| 1920x1080 High Preset AA:T | |
| VAIO SX14 VJS144X0111K | |
| Asus Vivobook 15 K513EQ | |
| Average NVIDIA GeForce MX350 (22 - 25, n=7) | |
| HP Pavilion Aero 13 be0097nr | |
| HP 250 G7-15S40ES | |
| 1920x1080 Ultra Preset AA:T | |
| VAIO SX14 VJS144X0111K | |
| Asus Vivobook 15 K513EQ | |
| Average NVIDIA GeForce MX350 (20 - 22, n=6) | |
| HP Pavilion Aero 13 be0097nr | |
| HP 250 G7-15S40ES | |
| X-Plane 11.11 | |
| 1280x720 low (fps_test=1) | |
| Average NVIDIA GeForce MX350 (49.1 - 90.8, n=14) | |
| Asus Vivobook 15 K513EQ | |
| Lenovo ThinkPad P15s Gen1-20T4000JGE | |
| HP Pavilion Aero 13 be0097nr | |
| VAIO SX14 VJS144X0111K | |
| Lenovo ThinkPad E15 G3-20YG003UGE | |
| HP 250 G7-15S40ES | |
| HP Pavilion x360 15-er0155ng | |
| Microsoft Surface Laptop 4 15 AMD TFF_00028 | |
| 1920x1080 med (fps_test=2) | |
| Asus Vivobook 15 K513EQ | |
| Average NVIDIA GeForce MX350 (35.5 - 72.3, n=14) | |
| VAIO SX14 VJS144X0111K | |
| HP Pavilion x360 15-er0155ng | |
| Lenovo ThinkPad E15 G3-20YG003UGE | |
| HP Pavilion Aero 13 be0097nr | |
| Microsoft Surface Laptop 4 15 AMD TFF_00028 | |
| HP 250 G7-15S40ES | |
| Lenovo ThinkPad P15s Gen1-20T4000JGE | |
| 1920x1080 high (fps_test=3) | |
| Asus Vivobook 15 K513EQ | |
| Average NVIDIA GeForce MX350 (30.2 - 63.7, n=14) | |
| VAIO SX14 VJS144X0111K | |
| HP Pavilion x360 15-er0155ng | |
| HP Pavilion Aero 13 be0097nr | |
| Lenovo ThinkPad E15 G3-20YG003UGE | |
| Microsoft Surface Laptop 4 15 AMD TFF_00028 | |
| HP 250 G7-15S40ES | |
| Lenovo ThinkPad P15s Gen1-20T4000JGE | |
Witcher 3 FPS Chart
| low | med. | high | ultra | |
|---|---|---|---|---|
| GTA V (2015) | 141 | 115 | 45.8 | 23.7 |
| The Witcher 3 (2015) | 86 | 48.6 | 29.9 | 16.7 |
| Dota 2 Reborn (2015) | 126 | 119 | 80.4 | 73.4 |
| Final Fantasy XV Benchmark (2018) | 48.6 | 23 | 14.5 | |
| X-Plane 11.11 (2018) | 66.7 | 62.7 | 53.9 | |
| Far Cry 5 (2018) | 59 | 26 | 23 | 22 |
| Strange Brigade (2018) | 92.7 | 32.3 | 25 | 18.8 |
排放 - 大部分情况下是安静的
系统噪音
内部风扇在保持尽可能的安静方面做得很好,在低处理负荷下的脉动行为最小。当浏览网页或视频流时,风扇噪音一般在27 dB(A)或更低,而静音背景为23.4 dB(A)。在我们的测试设备上,一些轻微的电子噪音或线圈啸叫使其无法做到绝对无噪音。
风扇噪音与MyAsus软件上的三种性能设置(低语、平衡和性能)有关。在平衡或性能模式下运行 Witcher 3在平衡或性能模式下运行将导致稳定的风扇噪音,分别为40.7 dB(A)或42.9 dB(A),比许多只采用集成显卡的超极本略大。像Prime95和FurMark这样的极端处理负载将引起更响亮的最大风扇噪音,达到47 dB(A)。
Noise level
| Idle |
| 23.6 / 23.6 / 23.6 dB(A) |
| Load |
| 41 / 47 dB(A) |
 | ||
30 dB silent 40 dB(A) audible 50 dB(A) loud |
||
min: | ||
| Asus Vivobook 15 K513EQ GeForce MX350, i7-1165G7, Intel SSD 660p SSDPEKNW512G8 | Asus VivoBook 15 Pro M3500QC-L1062 GeForce RTX 3050 4GB Laptop GPU, R5 5600H, SK Hynix HFM512GD3JX013N | Asus VivoBook S15 S533EQ-BQ002T GeForce MX350, i7-1165G7, Intel SSD 660p 1TB SSDPEKNW010T8 | Lenovo IdeaPad 5 15ALC05 Vega 7, R5 5500U | Dell Inspiron 15 3501 Iris Xe G7 96EUs, i7-1165G7, Samsung PM991a MZ9LQ512HBLU-00BD1 | HP Pavilion 15-eg GeForce MX450, i7-1165G7, Samsung PM991 MZVLQ1T0HALB | |
|---|---|---|---|---|---|---|
| Noise | -3% | -0% | -4% | -1% | -1% | |
| off / environment * (dB) | 23.4 | 24.8 -6% | 25 -7% | 26 -11% | 26 -11% | 25.4 -9% |
| Idle Minimum * (dB) | 23.6 | 24.8 -5% | 25 -6% | 26 -10% | 26 -10% | 25.6 -8% |
| Idle Average * (dB) | 23.6 | 24.8 -5% | 25 -6% | 26 -10% | 26 -10% | 25.6 -8% |
| Idle Maximum * (dB) | 23.6 | 26.4 -12% | 25 -6% | 26 -10% | 26 -10% | 25.6 -8% |
| Load Average * (dB) | 41 | 42.8 -4% | 39.5 4% | 42.6 -4% | 35.9 12% | 39.2 4% |
| Witcher 3 ultra * (dB) | 42.9 | 42.8 -0% | 39.3 8% | 39.1 9% | ||
| Load Maximum * (dB) | 47 | 42.8 9% | 41.6 11% | 37.4 20% | 35.8 24% | 41.5 12% |
* ... smaller is better
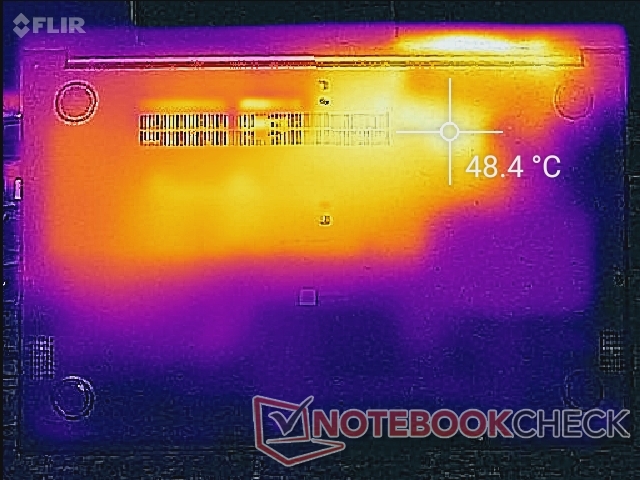
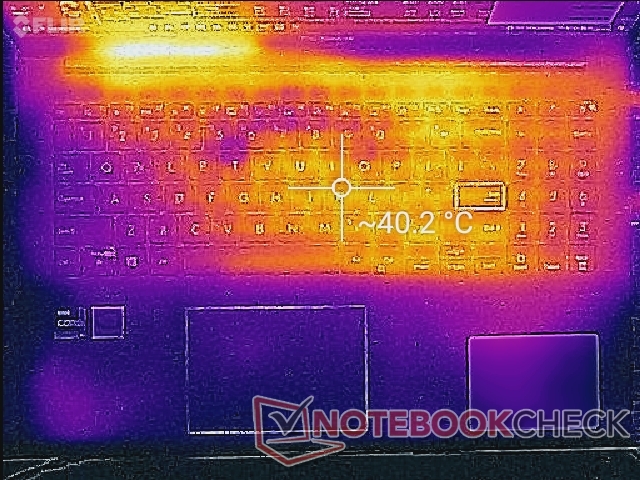
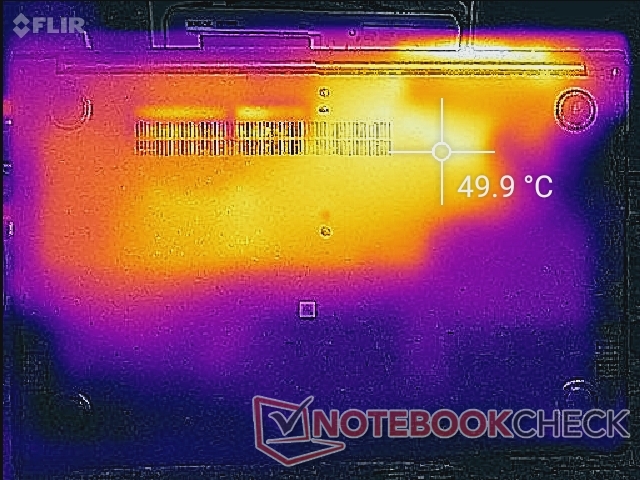
温度
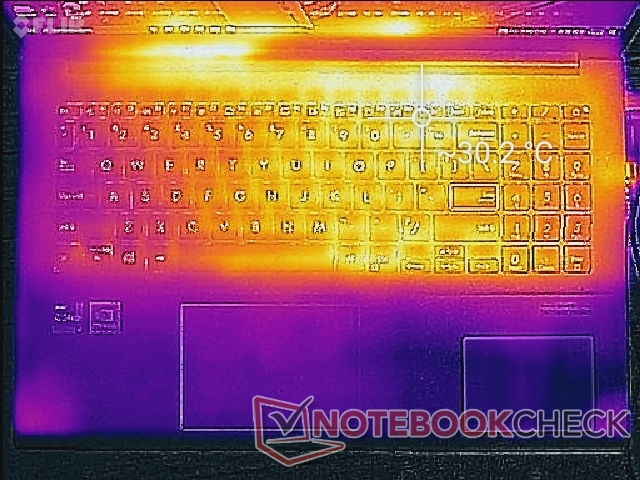
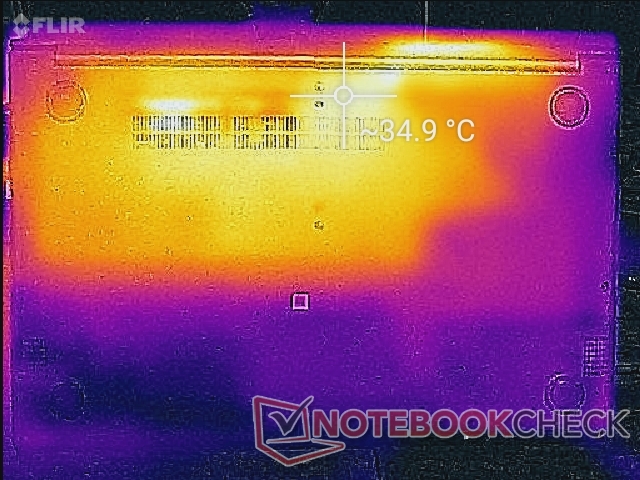
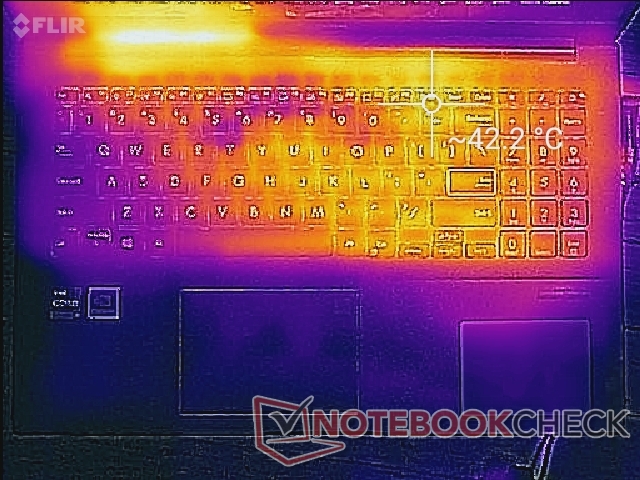
由于内部冷却方案的设计,笔记本电脑的右半部分总是比左半部分更热。在游戏时,键盘上的热点温度可以达到42摄氏度,这与 惠普Pavilion 15配有集成Iris Xe显卡。然而,底部靠近后部的温度甚至可以达到近50摄氏度。
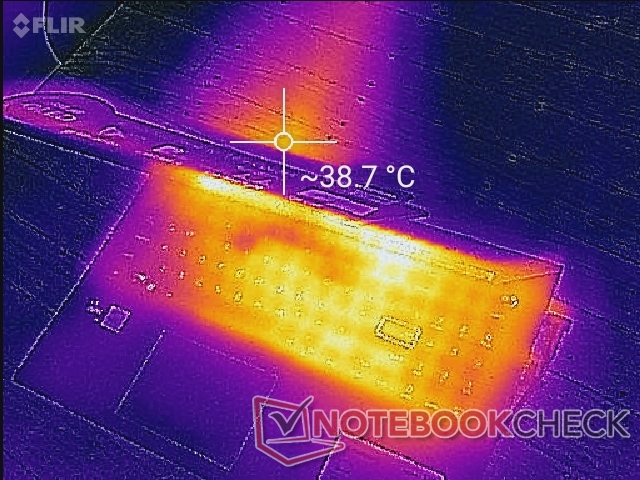
(-) The maximum temperature on the upper side is 48.8 °C / 120 F, compared to the average of 36.8 °C / 98 F, ranging from 21 to 71 °C for the class Multimedia.
(±) The bottom heats up to a maximum of 42 °C / 108 F, compared to the average of 39.1 °C / 102 F
(+) In idle usage, the average temperature for the upper side is 25.6 °C / 78 F, compared to the device average of 31.3 °C / 88 F.
(±) Playing The Witcher 3, the average temperature for the upper side is 33.9 °C / 93 F, compared to the device average of 31.3 °C / 88 F.
(+) The palmrests and touchpad are cooler than skin temperature with a maximum of 28.2 °C / 82.8 F and are therefore cool to the touch.
(±) The average temperature of the palmrest area of similar devices was 28.7 °C / 83.7 F (+0.5 °C / 0.9 F).
| Asus Vivobook 15 K513EQ Intel Core i7-1165G7, NVIDIA GeForce MX350 | Asus VivoBook 15 Pro M3500QC-L1062 AMD Ryzen 5 5600H, NVIDIA GeForce RTX 3050 4GB Laptop GPU | Asus VivoBook S15 S533EQ-BQ002T Intel Core i7-1165G7, NVIDIA GeForce MX350 | Lenovo IdeaPad 5 15ALC05 AMD Ryzen 5 5500U, AMD Radeon RX Vega 7 | Dell Inspiron 15 3501 Intel Core i7-1165G7, Intel Iris Xe Graphics G7 96EUs | HP Pavilion 15-eg Intel Core i7-1165G7, NVIDIA GeForce MX450 | |
|---|---|---|---|---|---|---|
| Heat | 14% | 16% | 12% | 8% | 3% | |
| Maximum Upper Side * (°C) | 48.8 | 37.8 23% | 38.1 22% | 40.5 17% | 45.6 7% | 44 10% |
| Maximum Bottom * (°C) | 42 | 48.4 -15% | 41.3 2% | 42 -0% | 41 2% | 53.4 -27% |
| Idle Upper Side * (°C) | 30 | 24 20% | 24.5 18% | 26.5 12% | 28.2 6% | 27.4 9% |
| Idle Bottom * (°C) | 35 | 25.1 28% | 26.8 23% | 29 17% | 29.1 17% | 28.8 18% |
* ... smaller is better
压力测试
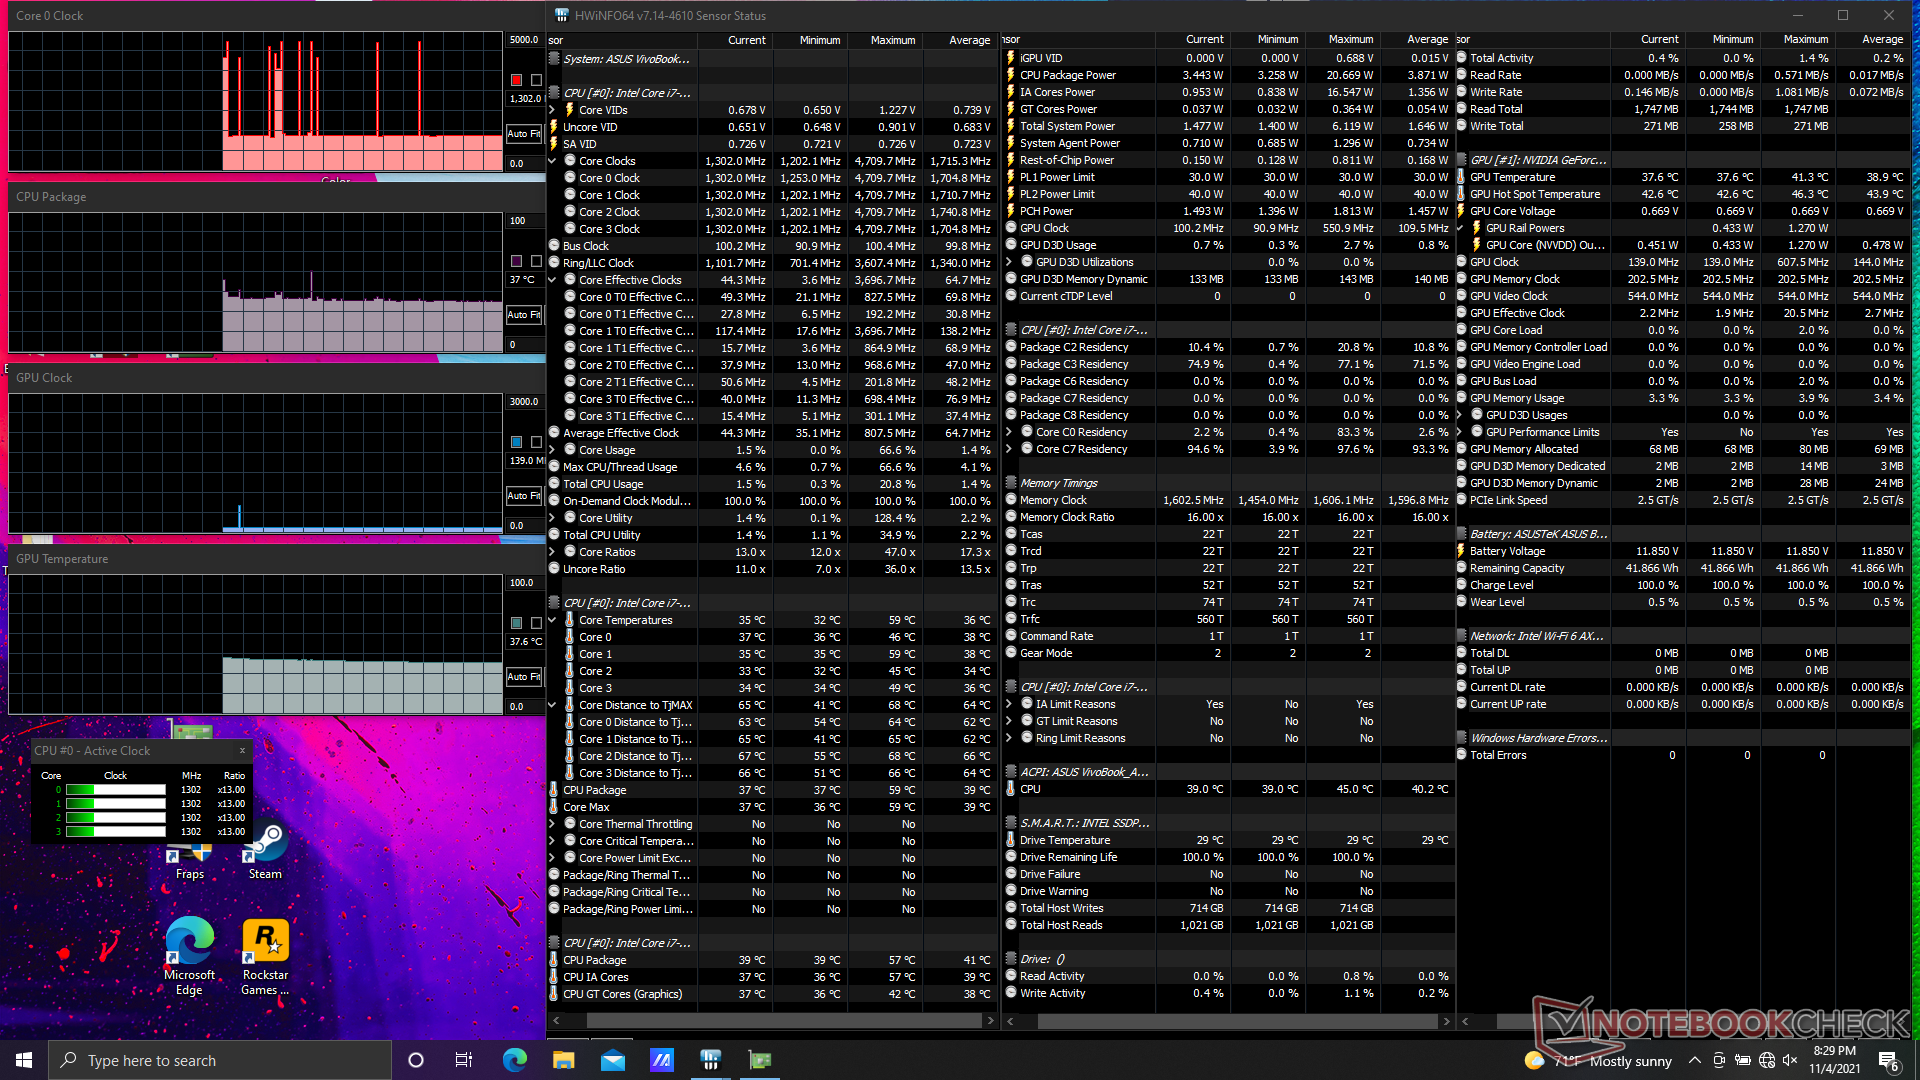
当在Prime95下受压时,CPU会在最初的30秒左右提升到4.1GHz,直到达到91℃的核心温度。 框架笔记本电脑使用相同的Core i7-1165G7 CPU,在承受类似负载时,会稳定在82摄氏度的稍高温度。
在性能模式下运行会带来稍快的图形性能。在平衡模式下运行时,GPU时钟速率将在1100至1455 MHz之间。 Witcher 3相比之下,在性能模式下运行同一游戏时,GPU的时钟频率为1595 MHz。因此,如果用户希望最大限度地利用笔记本电脑,就必须应对与性能模式相关的更大的风扇噪音。
用电池运行会影响性能。在电池上进行的3DMark 11测试将返回物理和图形分数,分别为8064和6075分,而在电源上则为11534和6293分。
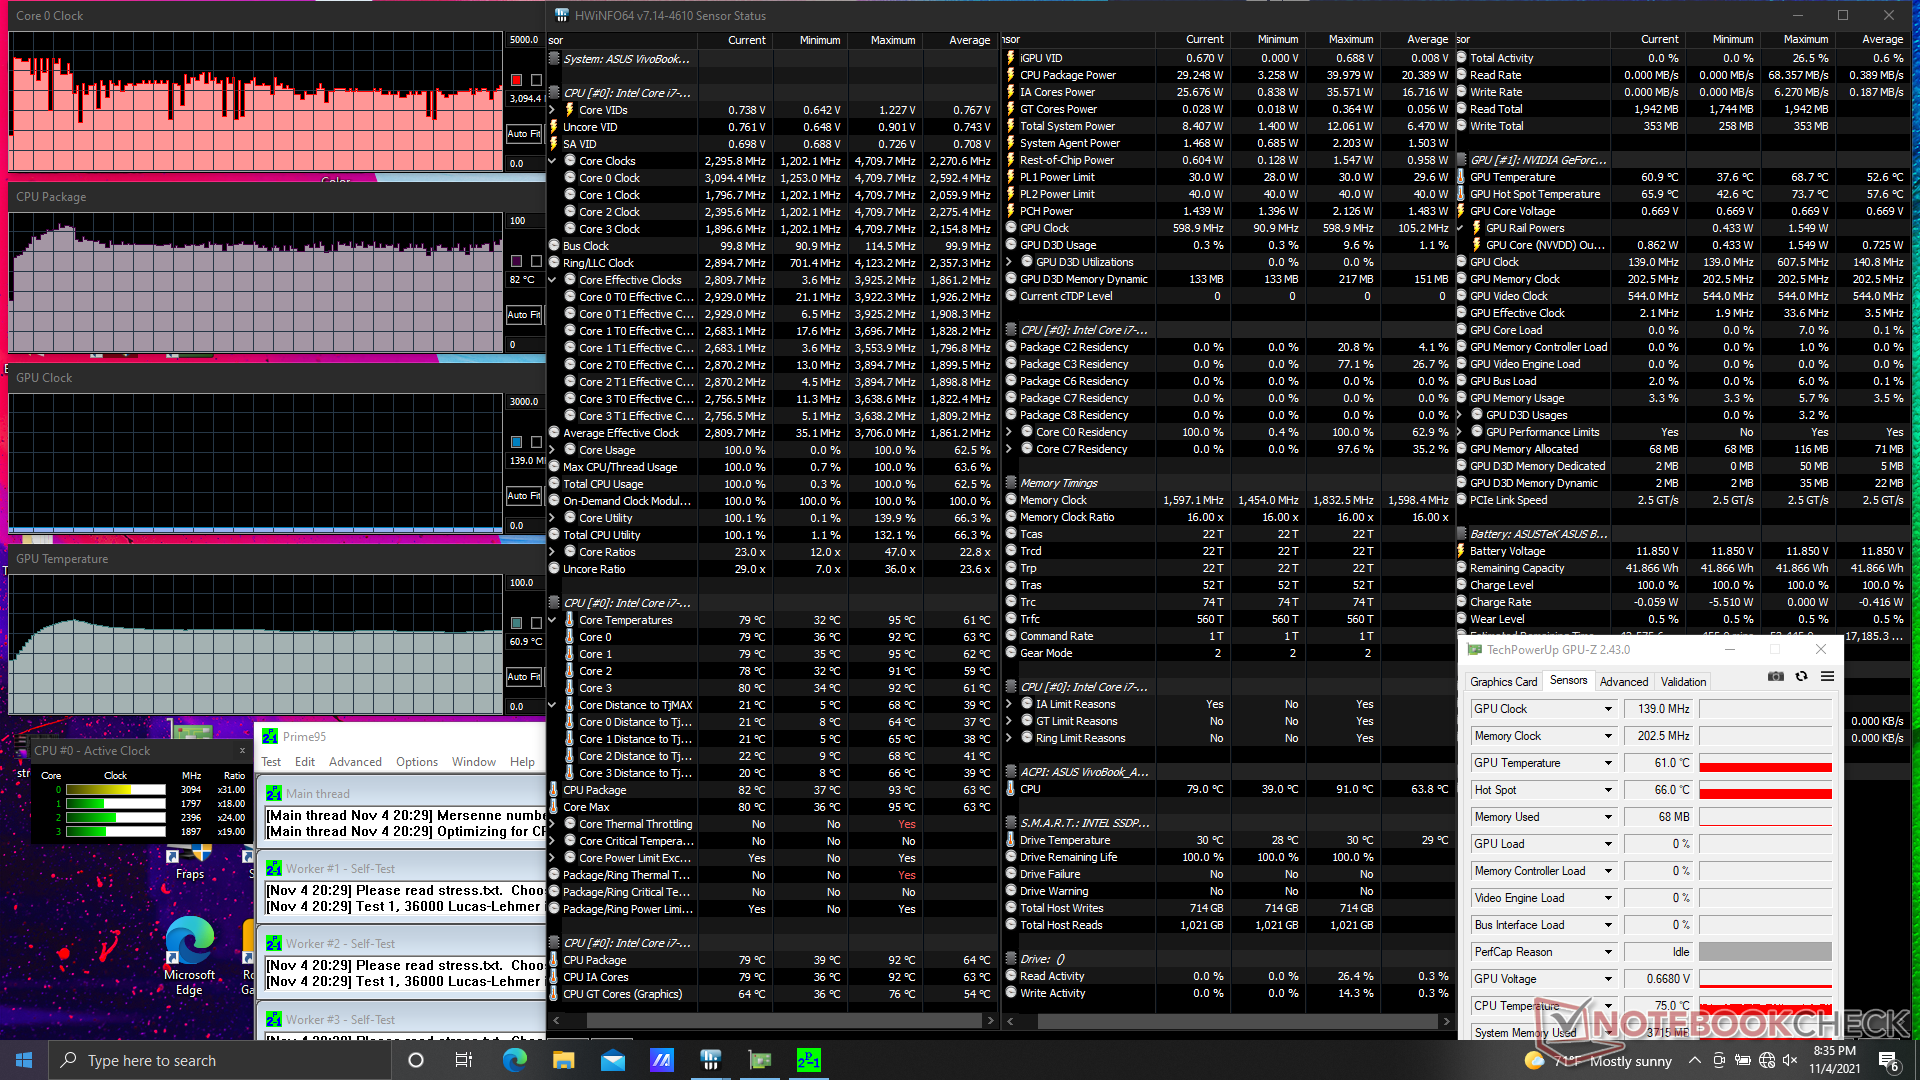
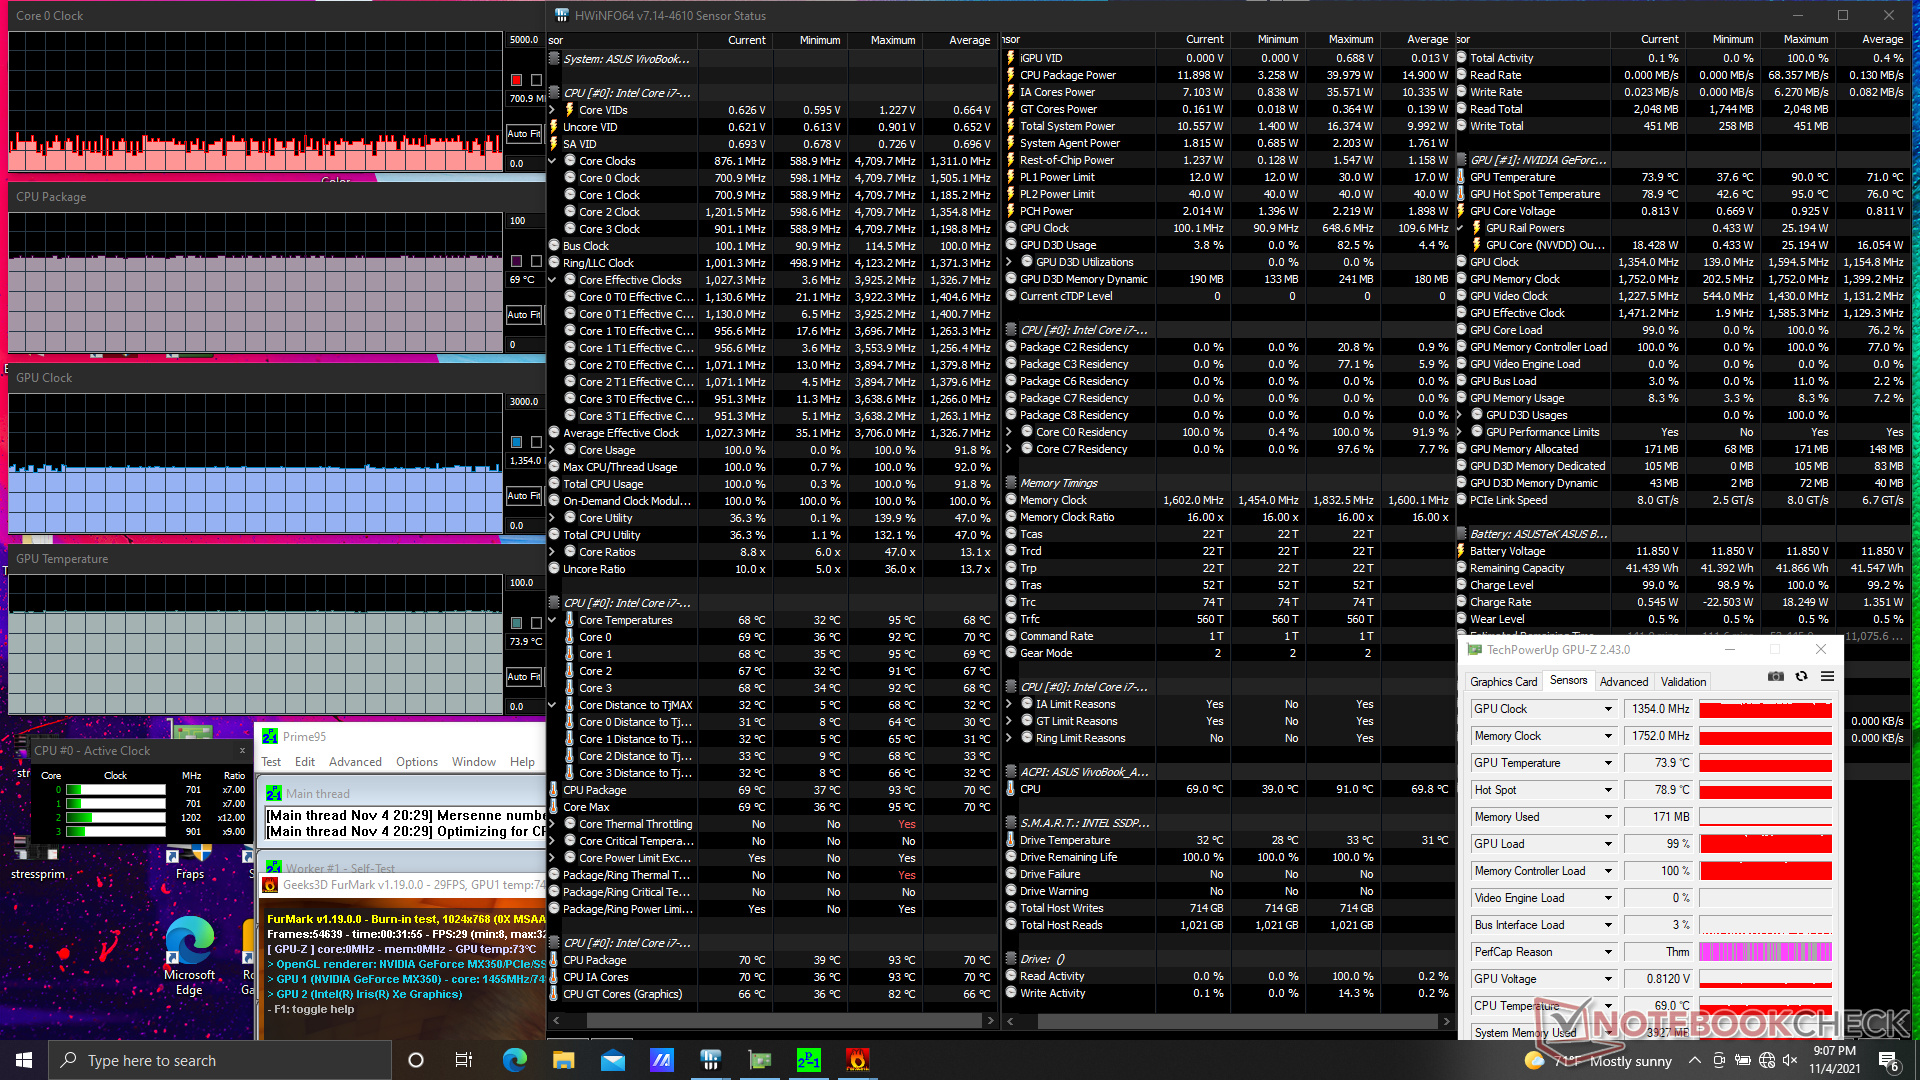
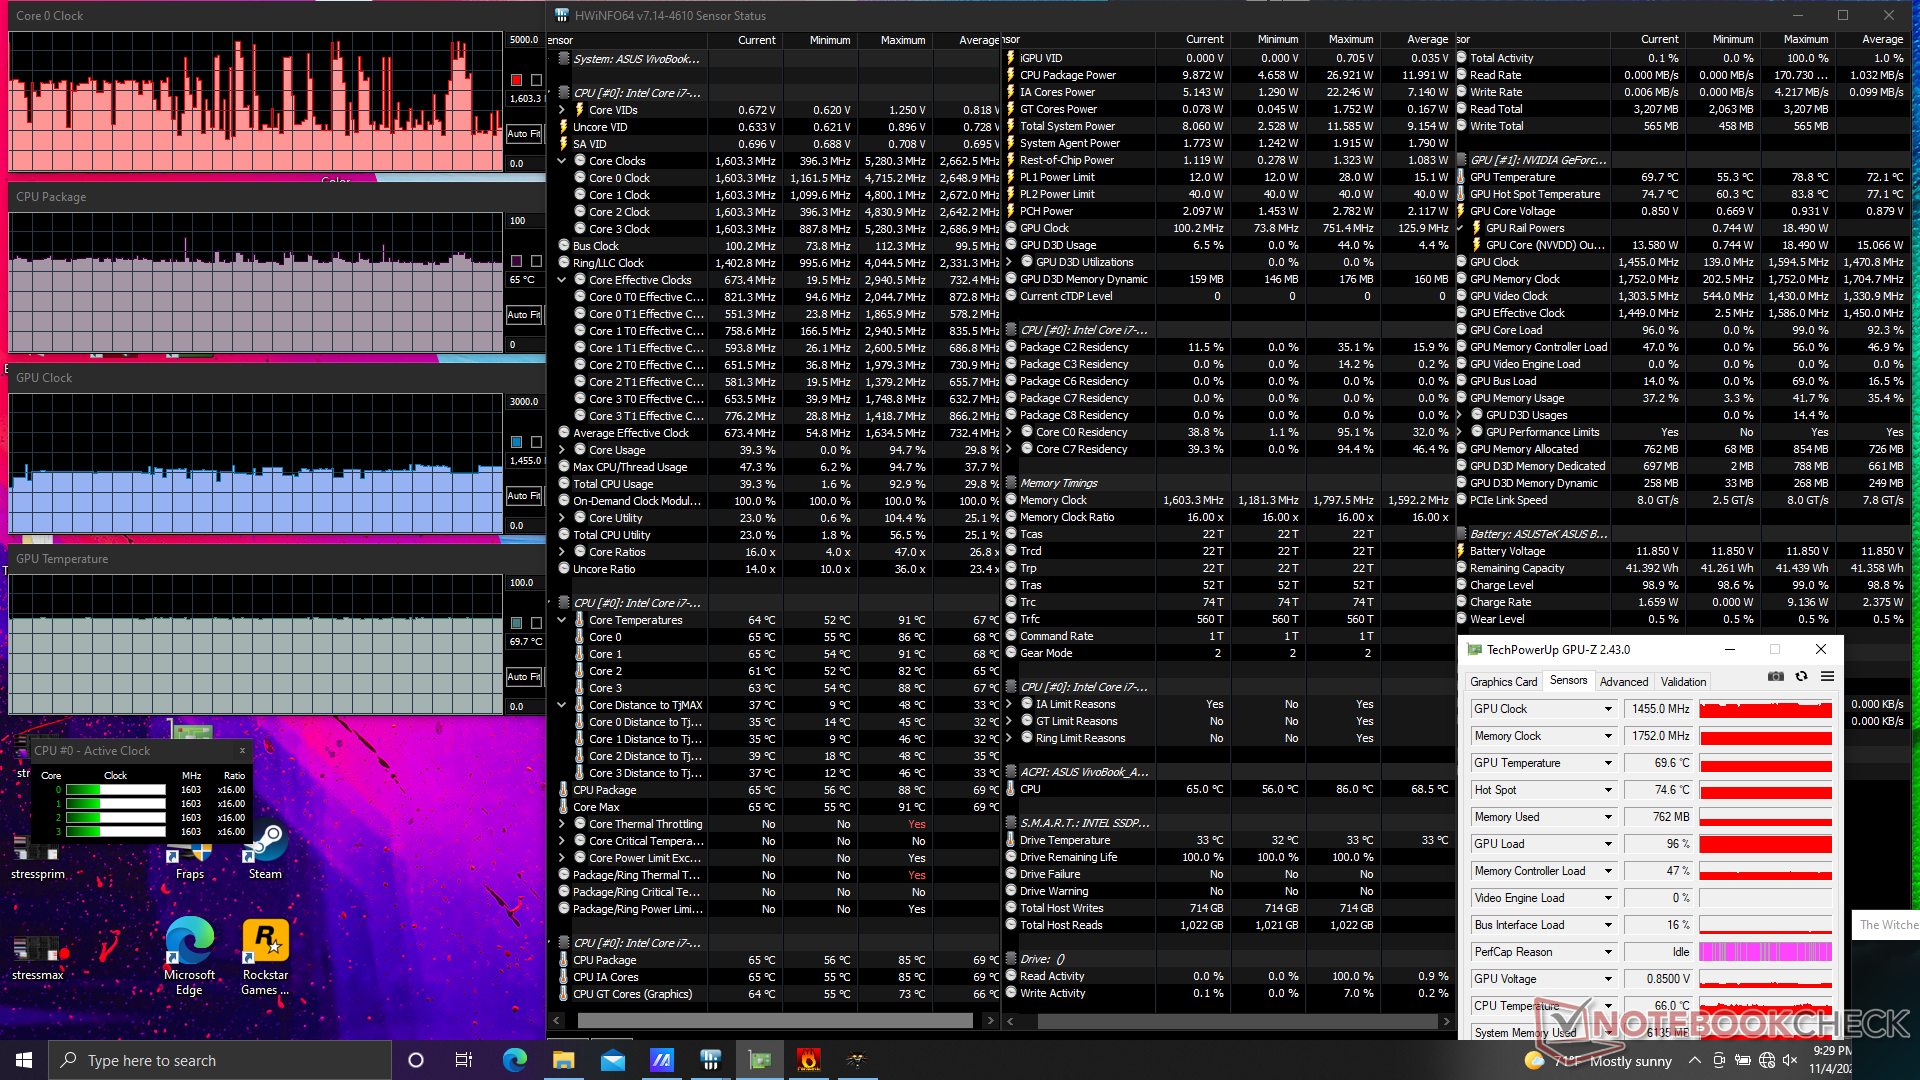
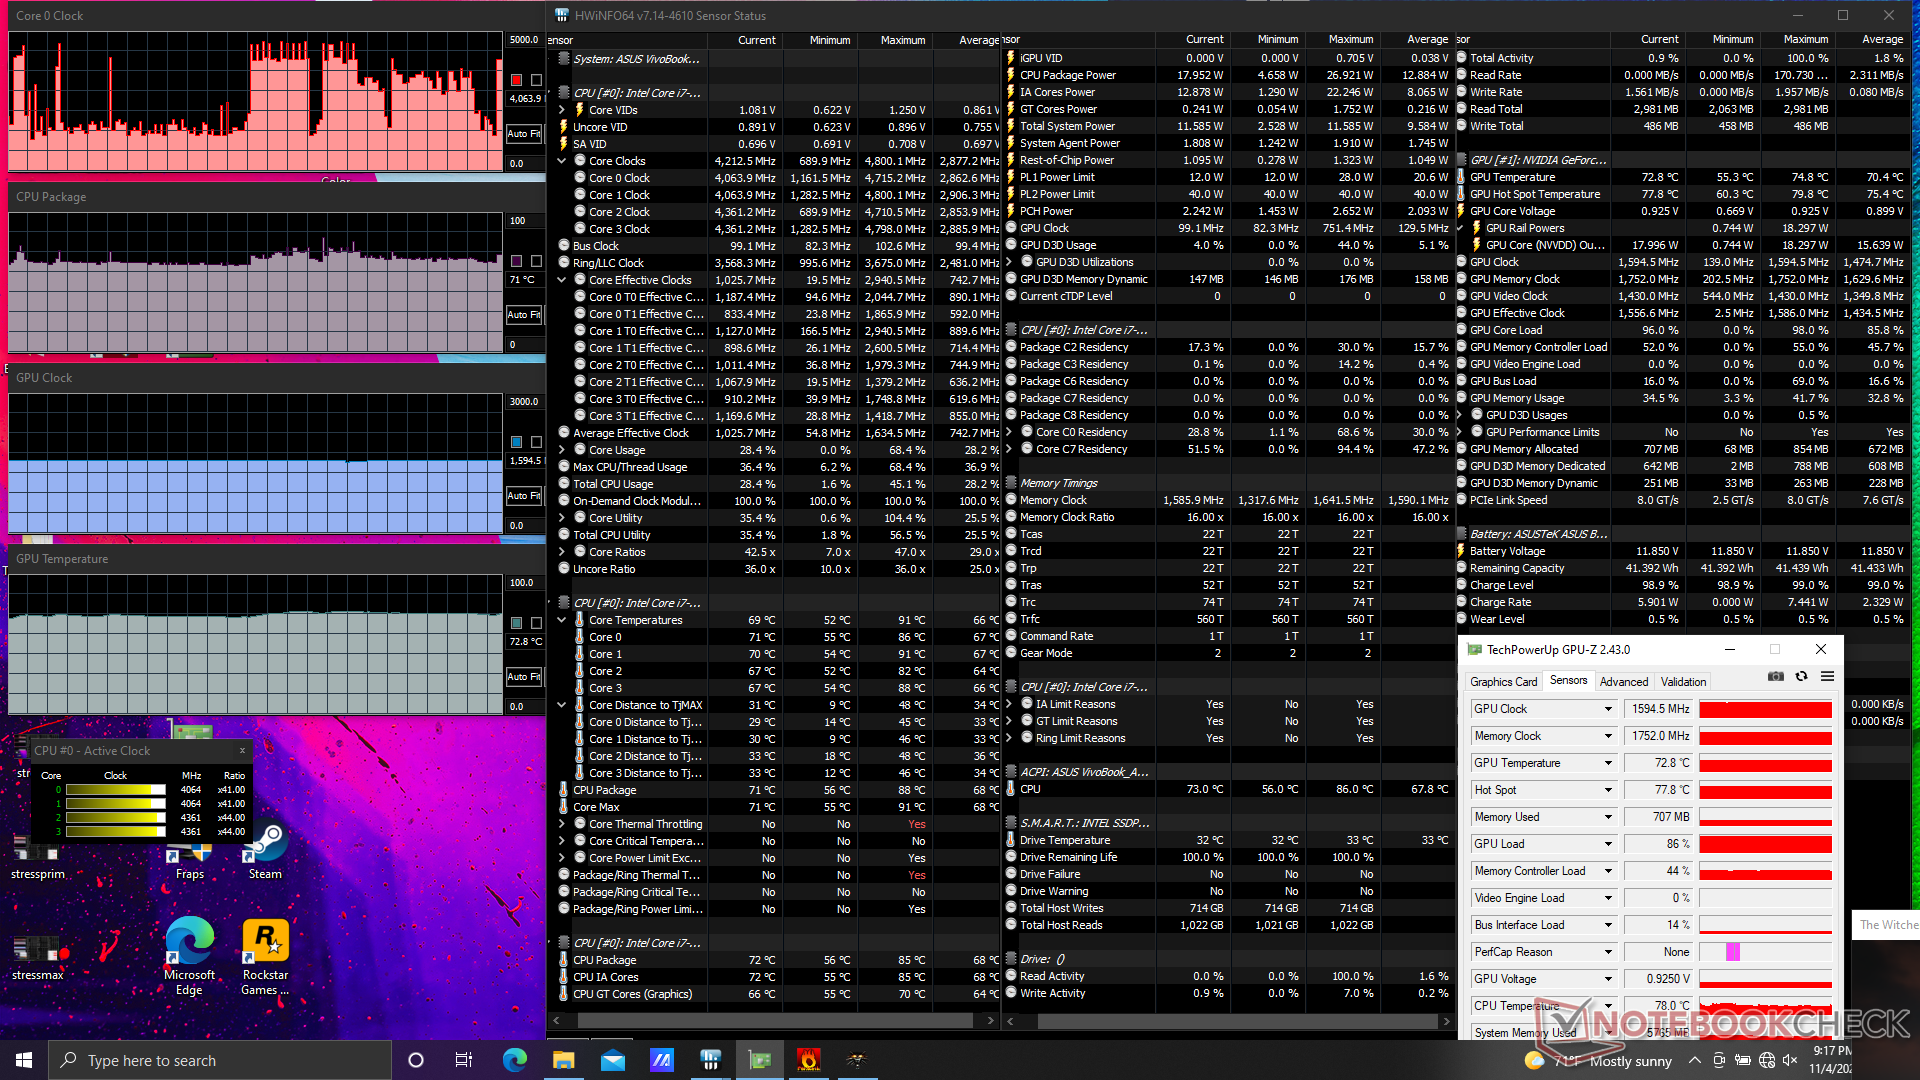
| CPU时钟(GHz) | GPU时钟(MHz) | CPU平均温度(℃) | GPU平均温度(℃) | |
| 系统空闲时 | -- | -- | 37 | 38 |
| Prime95压力 | 1.7 - 2.9 | ~82 | -- | 61 |
| Prime95 + FurMark压力 | 0.7 - 1.1 | 1354 | 69 | 74 |
| Witcher 3 压力(平衡模式) | 0.6 - 0.8 | 1100 - 1455 | 65 | 70 |
| Witcher 3 压力(性能模式) | 0.8 - 1.2 | 1595 | 71 | 73 |
发言人
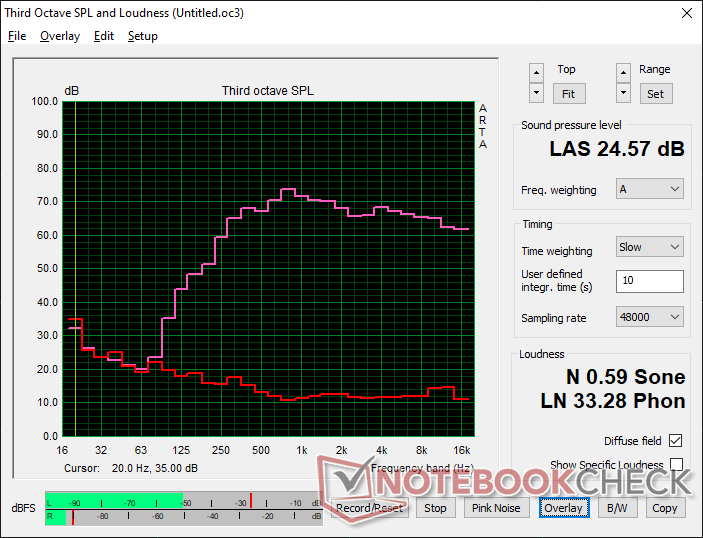
Asus Vivobook 15 K513EQ audio analysis
(±) | speaker loudness is average but good (80.8 dB)
Bass 100 - 315 Hz
(-) | nearly no bass - on average 15.3% lower than median
(±) | linearity of bass is average (13% delta to prev. frequency)
Mids 400 - 2000 Hz
(+) | balanced mids - only 4.2% away from median
(+) | mids are linear (3.8% delta to prev. frequency)
Highs 2 - 16 kHz
(+) | balanced highs - only 0.8% away from median
(+) | highs are linear (2.3% delta to prev. frequency)
Overall 100 - 16.000 Hz
(+) | overall sound is linear (12.5% difference to median)
Compared to same class
» 24% of all tested devices in this class were better, 3% similar, 73% worse
» The best had a delta of 5%, average was 17%, worst was 45%
Compared to all devices tested
» 11% of all tested devices were better, 2% similar, 87% worse
» The best had a delta of 4%, average was 24%, worst was 134%
Apple MacBook 12 (Early 2016) 1.1 GHz audio analysis
(+) | speakers can play relatively loud (83.6 dB)
Bass 100 - 315 Hz
(±) | reduced bass - on average 11.3% lower than median
(±) | linearity of bass is average (14.2% delta to prev. frequency)
Mids 400 - 2000 Hz
(+) | balanced mids - only 2.4% away from median
(+) | mids are linear (5.5% delta to prev. frequency)
Highs 2 - 16 kHz
(+) | balanced highs - only 2% away from median
(+) | highs are linear (4.5% delta to prev. frequency)
Overall 100 - 16.000 Hz
(+) | overall sound is linear (10.2% difference to median)
Compared to same class
» 7% of all tested devices in this class were better, 2% similar, 91% worse
» The best had a delta of 5%, average was 18%, worst was 53%
Compared to all devices tested
» 5% of all tested devices were better, 1% similar, 94% worse
» The best had a delta of 4%, average was 24%, worst was 134%
能源管理
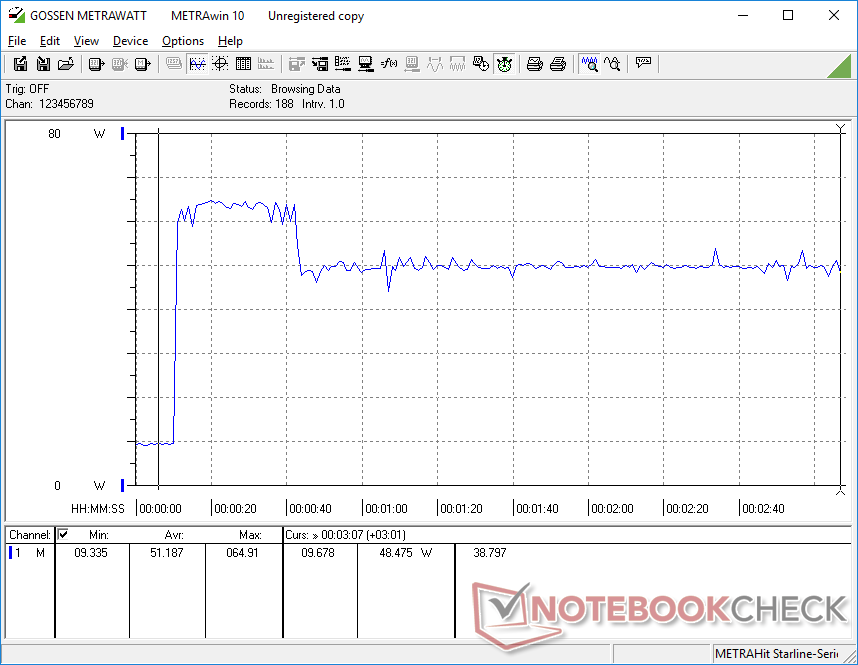
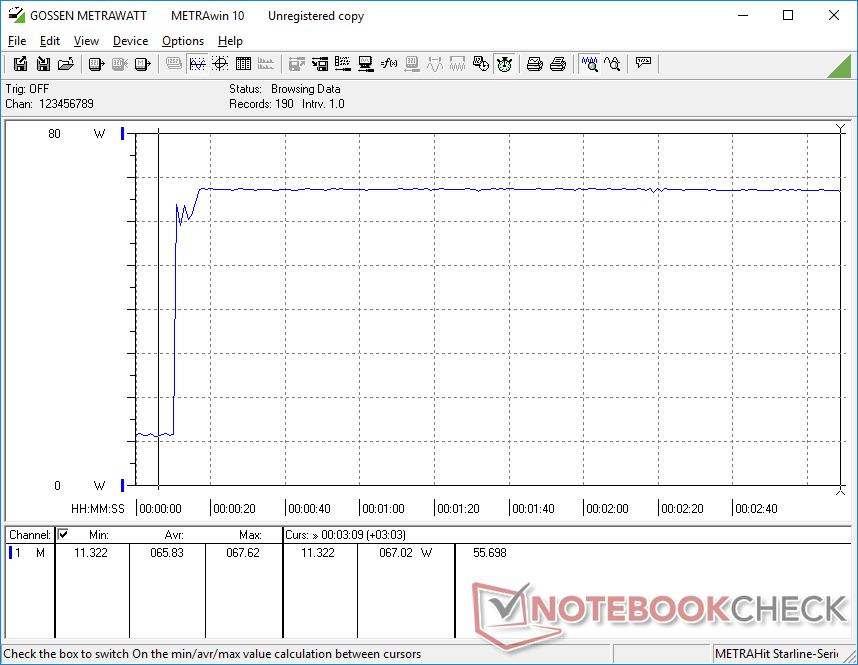
功耗--由于Nvidia的GPU,要求更高
在桌面上空转,消耗3W到9W,取决于亮度设置和电源配置文件。功耗还取决于显示的颜色,因为我们的设备使用的是OLED面板,详见我们的调查结果。 这里的发现.
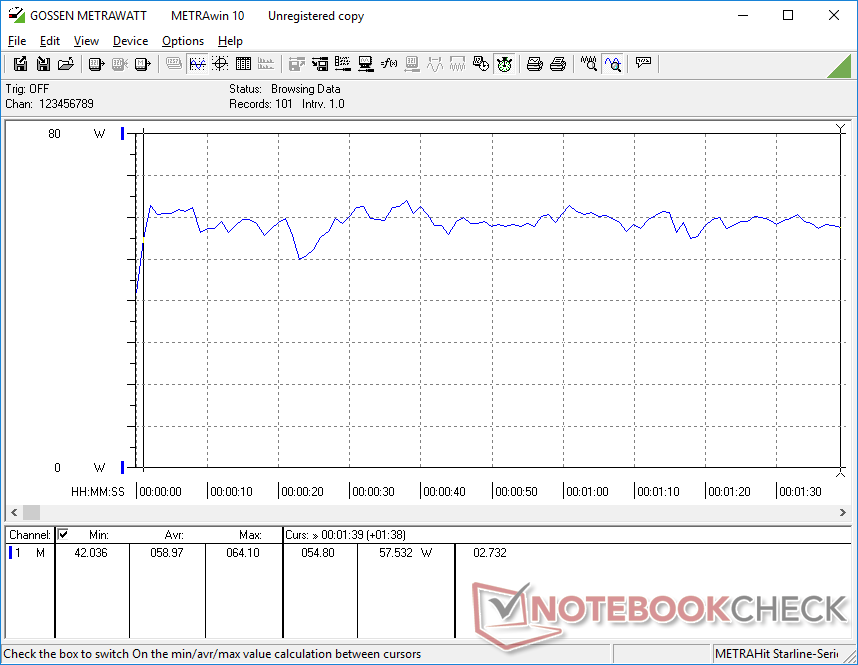
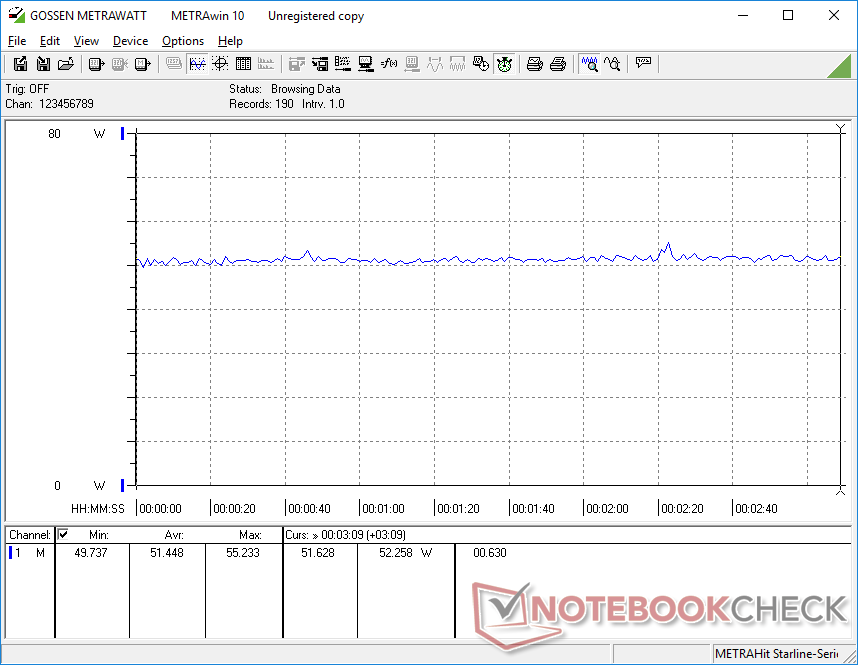
运行更高的负载,如游戏,会消耗51W到59W,而采用AMD技术的联想IdeaPad 5 15ALC05或采用Iris X技术的联想IdeaPad 5 15ALC05各消耗约40W。戴尔 Inspiron 15 3501.独立的Nvidia GPU是导致功耗比其他只采用集成显卡的超极本明显增加48%的主要原因。当然,用户也将受益于GeForce MX350的更可靠和普遍更快的性能。
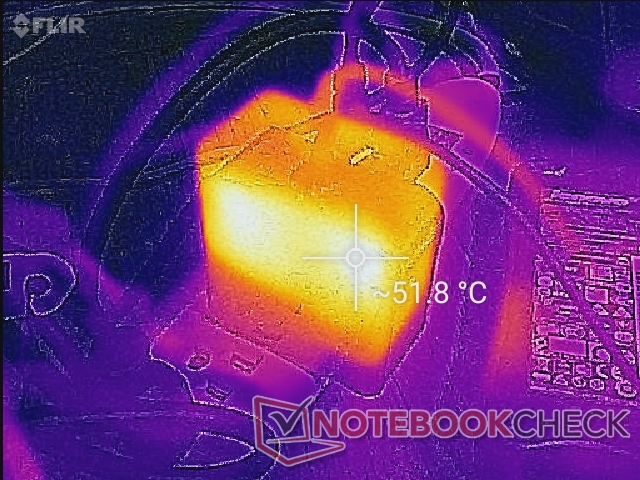
在运行极端的Prime95和FurMark负载时,我们能够记录到最大的67.6W。小型适配器(约6.4×6.4×3厘米)的额定功率只有65瓦,这意味着如果运行如此高的负载,电池充电速度将减慢到爬行状态。该系统有可能受益于一个更大和更有能力的交流适配器。
| Off / Standby | |
| Idle | |
| Load |
|
Key:
min: | |
| Asus Vivobook 15 K513EQ i7-1165G7, GeForce MX350, Intel SSD 660p SSDPEKNW512G8, OLED, 1920x1080, 15.6" | Asus VivoBook 15 Pro M3500QC-L1062 R5 5600H, GeForce RTX 3050 4GB Laptop GPU, SK Hynix HFM512GD3JX013N, AMOLED, 1920x1080, 15.6" | Asus VivoBook S15 S533EQ-BQ002T i7-1165G7, GeForce MX350, Intel SSD 660p 1TB SSDPEKNW010T8, IPS, 1920x1080, 15.6" | Lenovo IdeaPad 5 15ALC05 R5 5500U, Vega 7, , IPS, 1920x1080, 15.6" | Dell Inspiron 15 3501 i7-1165G7, Iris Xe G7 96EUs, Samsung PM991a MZ9LQ512HBLU-00BD1, IPS, 1920x1080, 15.6" | HP Pavilion 15-eg i7-1165G7, GeForce MX450, Samsung PM991 MZVLQ1T0HALB, IPS, 1920x1080, 15.6" | |
|---|---|---|---|---|---|---|
| Power Consumption | -33% | 7% | 9% | 20% | -20% | |
| Idle Minimum * (Watt) | 3.7 | 4.7 -27% | 3 19% | 3.7 -0% | 3.6 3% | 4.9 -32% |
| Idle Average * (Watt) | 6.3 | 9.4 -49% | 6.4 -2% | 7.9 -25% | 6.4 -2% | 7.9 -25% |
| Idle Maximum * (Watt) | 9.7 | 10 -3% | 7.9 19% | 9.3 4% | 7.9 19% | 14.2 -46% |
| Load Average * (Watt) | 59 | 74.3 -26% | 59 -0% | 41 31% | 39 34% | 64.3 -9% |
| Witcher 3 ultra * (Watt) | 51.4 | 67.7 -32% | 48 7% | 41 20% | 37.6 27% | 55.6 -8% |
| Load Maximum * (Watt) | 67.7 | 106.9 -58% | 68 -0% | 52.2 23% | 41.8 38% | 65.4 3% |
* ... smaller is better
Power Consumption Witcher 3 / Stresstest
电池寿命 - 小容量意味着更短的运行时间
电池容量很小,只有41Wh,而价格较高的是71Wh。 禅书15.运行时间只有平均水平,在实际的WLAN使用中约为6小时,而上述的ZenBook在类似负载下可以达到12小时以上。然而,作为一个预算系统,6小时与惠普Pavilion 15或戴尔Inspiron 15等机型相当。
从空电到满电只需要不到90分钟。
| Asus Vivobook 15 K513EQ i7-1165G7, GeForce MX350, 42 Wh | Asus VivoBook 15 Pro M3500QC-L1062 R5 5600H, GeForce RTX 3050 4GB Laptop GPU, 63 Wh | Asus VivoBook S15 S533EQ-BQ002T i7-1165G7, GeForce MX350, 50 Wh | Lenovo IdeaPad 5 15ALC05 R5 5500U, Vega 7, 70 Wh | Dell Inspiron 15 3501 i7-1165G7, Iris Xe G7 96EUs, 42 Wh | HP Pavilion 15-eg i7-1165G7, GeForce MX450, 41 Wh | |
|---|---|---|---|---|---|---|
| Battery runtime | 19% | 40% | 101% | 13% | 5% | |
| Reader / Idle (h) | 13.3 | 15 13% | ||||
| WiFi v1.3 (h) | 6 | 8.3 38% | 8.4 40% | 14 133% | 6.8 13% | 6.6 10% |
| Load (h) | 1.3 | 1.3 0% | 2.2 69% | 1.2 -8% | ||
| H.264 (h) | 12.1 | 15.4 | ||||
| Witcher 3 ultra (h) | 1.2 | 1.8 |
Pros
Cons
结论 - 负担得起的OLED
OLED "一词通常让人联想到奢华或更高的价格。华硕正在改变这一切,为其经济实惠的VivoBook系列引入新的1080p OLED面板,而不是通常在高端笔记本电脑上发现的成本较高的4K OLED面板。用户现在可以拥有一个系统,配备最新的英特尔酷睿i7 U系列CPU,独立的GeForce MX显卡,以及一个能够再现DCI-P3色彩的明亮的OLED显示屏,所有这些只需900多美元。用户对大多数中端超极本(如联想IdeaPad)"只有"~95%的sRGB覆盖率感到不满意。 联想IdeaPad, 微星现代,或 戴尔Inspiron由于这个原因,你会发现新的OLED VivoBook非常有吸引力。
VivoBook 15 OLED在图像质量和色彩特征方面为预算和中档超极本设定了新的标准。性能也很好,而大部分塑料机箱可以使用一些升级。
笔记本电脑的其余部分是相当标准的,无论好坏。在一台带有塑料底座、海绵状点击板和小型内部电池的廉价笔记本电脑上看到如此清晰和多彩的OLED显示屏,绝对是件奇怪的事。你必须多花几百美元购买一台更时尚的ZenBook,才能获得完整的旗舰体验。然而,就中档笔记本电脑而言,VivoBook 15 K513配备了你在这个价格范围内可以得到的最好的显示屏之一。
价格和可用性
VivoBook 15 K513系列现在在网上广泛销售,价格从700美元到1000美元不等,取决于配置。我们的MX350和OLED配置可以在Amazon上找到。,Newegg, 和沃尔玛.
Asus Vivobook 15 K513EQ
- 08/30/2022 v7 (old)
Allen Ngo
Price comparison

