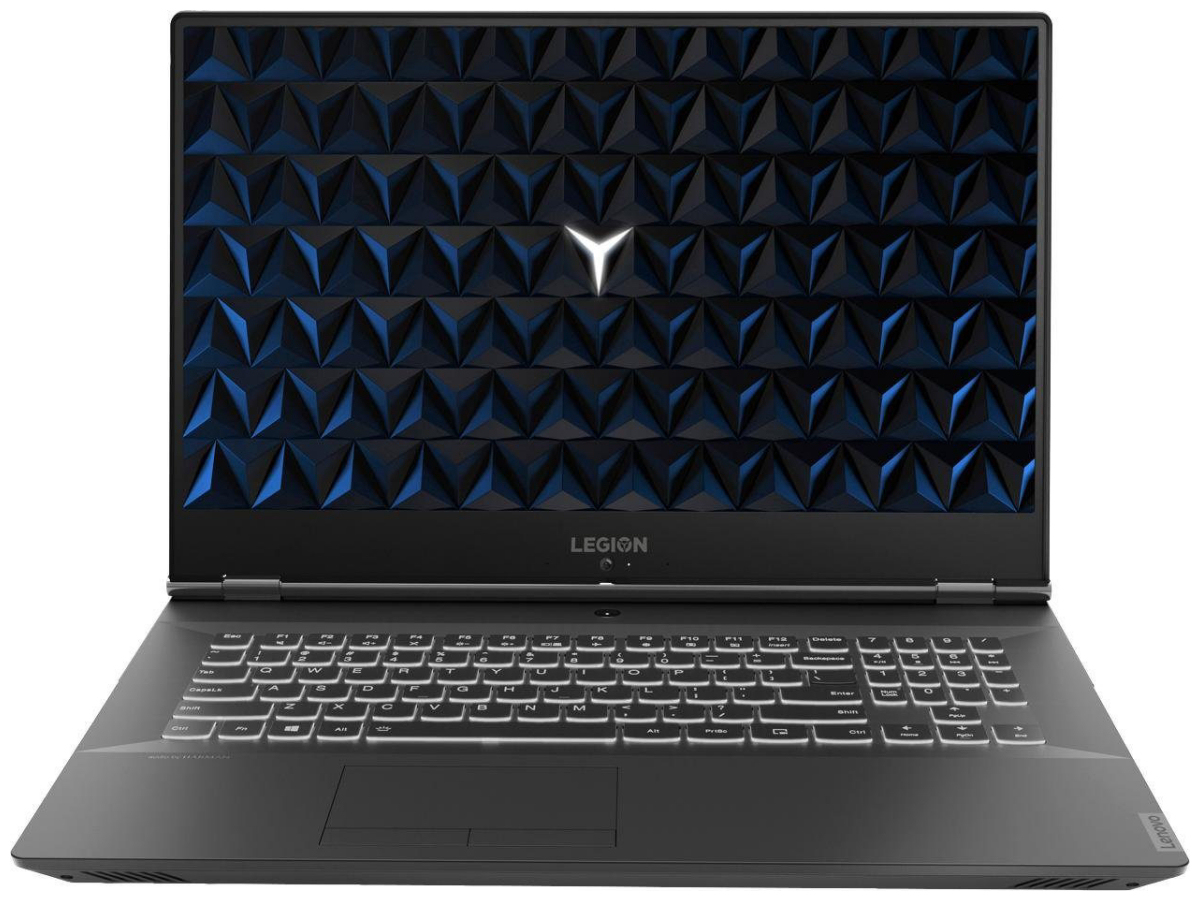
联想Legion Y540-17IRH笔记本电脑评测:一台用尽i5一切的游戏本
| Networking | |
| iperf3 transmit AX12 | |
| Lenovo Legion Y540-17IRH | |
| Dell G7 17 7790 | |
| MSI GP75 Leopard 9SD | |
| Schenker XMG Core 17 | |
| Lenovo Legion Y740-17ICH | |
| Gigabyte Sabre 17-W8 | |
| iperf3 receive AX12 | |
| MSI GP75 Leopard 9SD | |
| Schenker XMG Core 17 | |
| Lenovo Legion Y540-17IRH | |
| Dell G7 17 7790 | |
| Lenovo Legion Y740-17ICH | |
| Gigabyte Sabre 17-W8 | |
| |||||||||||||||||||||||||
Brightness Distribution: 87 %
Center on Battery: 286 cd/m²
Contrast: 1505:1 (Black: 0.19 cd/m²)
ΔE ColorChecker Calman: 3.57 | ∀{0.5-29.43 Ø4.73}
calibrated: 1.31
ΔE Greyscale Calman: 4.51 | ∀{0.09-98 Ø4.97}
98% sRGB (Argyll 1.6.3 3D)
64% AdobeRGB 1998 (Argyll 1.6.3 3D)
70.7% AdobeRGB 1998 (Argyll 3D)
98.3% sRGB (Argyll 3D)
69% Display P3 (Argyll 3D)
Gamma: 2.36
CCT: 7411 K
| Lenovo Legion Y540-17IRH AU Optronics B173HAN04.4 (AUO449D), IPS, 1920x1080 | Schenker XMG Core 17 LG Philips LP173WFG-SPB1 (LGD0615), IPS, 1920x1080 | Lenovo Legion Y740-17ICH AU Optronics B173HAN03.2, IPS, 1920x1080 | MSI GP75 Leopard 9SD Chi Mei N173HCE-G33 (CMN175C), IPS, 1920x1080 | Dell G7 17 7790 AU Optronics AUO409D, B173HAN, IPS, 1920x1080 | Gigabyte Sabre 17-W8 Chi Mei CMN1747, TN, 1920x1080 | |
|---|---|---|---|---|---|---|
| Display | -6% | -8% | -6% | -10% | 17% | |
| Display P3 Coverage (%) | 69 | 64.4 -7% | 64 -7% | 63.4 -8% | 61.9 -10% | 89.9 30% |
| sRGB Coverage (%) | 98.3 | 95.6 -3% | 90.4 -8% | 94.9 -3% | 89.6 -9% | 100 2% |
| AdobeRGB 1998 Coverage (%) | 70.7 | 65.6 -7% | 64.8 -8% | 65.1 -8% | 63.2 -11% | 85.1 20% |
| Response Times | 23% | 7% | 44% | 5% | 44% | |
| Response Time Grey 50% / Grey 80% * (ms) | 18 ? | 14.4 ? 20% | 15.6 ? 13% | 8 ? 56% | 17.2 ? 4% | 9 ? 50% |
| Response Time Black / White * (ms) | 12.8 ? | 9.6 ? 25% | 12.8 ? -0% | 8.8 ? 31% | 12 ? 6% | 8 ? 37% |
| PWM Frequency (Hz) | 25510 ? | 25000 ? | ||||
| Screen | -1% | -34% | 6% | -22% | -47% | |
| Brightness middle (cd/m²) | 286 | 329 15% | 299.1 5% | 420 47% | 308.6 8% | 326 14% |
| Brightness (cd/m²) | 282 | 286 1% | 273 -3% | 393 39% | 299 6% | 309 10% |
| Brightness Distribution (%) | 87 | 79 -9% | 81 -7% | 91 5% | 92 6% | 82 -6% |
| Black Level * (cd/m²) | 0.19 | 0.3 -58% | 0.27 -42% | 0.32 -68% | 0.29 -53% | 0.27 -42% |
| Contrast (:1) | 1505 | 1097 -27% | 1108 -26% | 1313 -13% | 1064 -29% | 1207 -20% |
| Colorchecker dE 2000 * | 3.57 | 2.52 29% | 5.07 -42% | 3.04 15% | 4.26 -19% | 9.11 -155% |
| Colorchecker dE 2000 max. * | 7.5 | 6.9 8% | 10.55 -41% | 7.22 4% | 7.83 -4% | 14.14 -89% |
| Colorchecker dE 2000 calibrated * | 1.31 | 1.31 -0% | 3.31 -153% | 0.89 32% | 2.93 -124% | 2.62 -100% |
| Greyscale dE 2000 * | 4.51 | 2.98 34% | 6.8 -51% | 3.91 13% | 5 -11% | 11.17 -148% |
| Gamma | 2.36 93% | 2.38 92% | 2.46 89% | 2.26 97% | 2.07 106% | 2.28 96% |
| CCT | 7411 88% | 6738 96% | 7805 83% | 7138 91% | 7488 87% | 12475 52% |
| Color Space (Percent of AdobeRGB 1998) (%) | 64 | 60 -6% | 58.5 -9% | 60 -6% | 57.8 -10% | 76 19% |
| Color Space (Percent of sRGB) (%) | 98 | 95 -3% | 89.9 -8% | 95 -3% | 89.2 -9% | 100 2% |
| Total Average (Program / Settings) | 5% /
1% | -12% /
-24% | 15% /
8% | -9% /
-16% | 5% /
-24% |
* ... smaller is better
Display Response Times
| ↔ Response Time Black to White | ||
|---|---|---|
| 12.8 ms ... rise ↗ and fall ↘ combined | ↗ 7.6 ms rise | 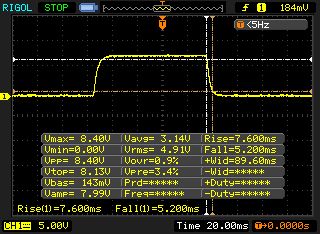 |
| ↘ 5.2 ms fall | ||
| The screen shows good response rates in our tests, but may be too slow for competitive gamers. In comparison, all tested devices range from 0.1 (minimum) to 240 (maximum) ms. » 33 % of all devices are better. This means that the measured response time is better than the average of all tested devices (19.9 ms). | ||
| ↔ Response Time 50% Grey to 80% Grey | ||
| 18 ms ... rise ↗ and fall ↘ combined | ↗ 8.4 ms rise | 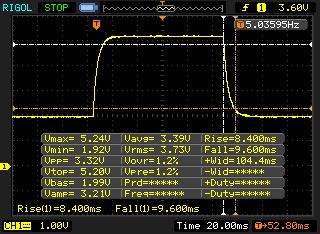 |
| ↘ 9.6 ms fall | ||
| The screen shows good response rates in our tests, but may be too slow for competitive gamers. In comparison, all tested devices range from 0.165 (minimum) to 636 (maximum) ms. » 32 % of all devices are better. This means that the measured response time is better than the average of all tested devices (31.1 ms). | ||
Screen Flickering / PWM (Pulse-Width Modulation)
| Screen flickering / PWM not detected | 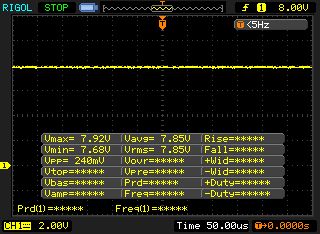 | ||
In comparison: 52 % of all tested devices do not use PWM to dim the display. If PWM was detected, an average of 7798 (minimum: 5 - maximum: 343500) Hz was measured. | |||
| Cinebench R15 | |
| CPU Single 64Bit | |
| Average of class Gaming (188.8 - 343, n=112, last 2 years) | |
| MSI GP75 Leopard 9SD | |
| Schenker XMG Core 17 | |
| Lenovo Legion Y540-17IRH | |
| Gigabyte Sabre 17-W8 | |
| Lenovo Legion Y740-17ICH | |
| Dell G7 17 7790 | |
| CPU Multi 64Bit | |
| Average of class Gaming (1578 - 6271, n=113, last 2 years) | |
| Lenovo Legion Y740-17ICH | |
| Gigabyte Sabre 17-W8 | |
| MSI GP75 Leopard 9SD | |
| Dell G7 17 7790 | |
| Schenker XMG Core 17 | |
| Lenovo Legion Y540-17IRH | |
| Cinebench R10 | |
| Rendering Single 32Bit | |
| Average of class Gaming (7457 - 11779, n=8, last 2 years) | |
| Schenker XMG Core 17 | |
| Lenovo Legion Y540-17IRH | |
| Rendering Multiple CPUs 32Bit | |
| Average of class Gaming (42932 - 81339, n=8, last 2 years) | |
| Schenker XMG Core 17 | |
| Lenovo Legion Y540-17IRH | |
| Cinebench R20 | |
| CPU (Single Core) | |
| Average of class Gaming (442 - 895, n=112, last 2 years) | |
| Schenker XMG Core 17 | |
| Lenovo Legion Y540-17IRH | |
| CPU (Multi Core) | |
| Average of class Gaming (4029 - 16108, n=112, last 2 years) | |
| Schenker XMG Core 17 | |
| Lenovo Legion Y540-17IRH | |
| Geekbench 3 | |
| 32 Bit Multi-Core Score | |
| Schenker XMG Core 17 | |
| Lenovo Legion Y540-17IRH | |
| 32 Bit Single-Core Score | |
| Schenker XMG Core 17 | |
| Lenovo Legion Y540-17IRH | |
| Geekbench 4.4 | |
| 64 Bit Multi-Core Score | |
| Average of class Gaming (89200 - 97490, n=2, last 2 years) | |
| Schenker XMG Core 17 | |
| Lenovo Legion Y540-17IRH | |
| 64 Bit Single-Core Score | |
| Average of class Gaming (9335 - 9492, n=2, last 2 years) | |
| Schenker XMG Core 17 | |
| Lenovo Legion Y540-17IRH | |
| Mozilla Kraken 1.1 - Total | |
| Lenovo Legion Y540-17IRH (Edge 44) | |
| Gigabyte Sabre 17-W8 | |
| Lenovo Legion Y740-17ICH (Edge 44.17763.1.0) | |
| MSI GP75 Leopard 9SD | |
| Schenker XMG Core 17 (Edge 44) | |
| Average of class Gaming (391 - 590, n=106, last 2 years) | |
| Octane V2 - Total Score | |
| Average of class Gaming (87588 - 139447, n=31, last 2 years) | |
| MSI GP75 Leopard 9SD | |
| Schenker XMG Core 17 (Edge 44) | |
| Lenovo Legion Y740-17ICH (Edge 44.17763.1.0) | |
| Gigabyte Sabre 17-W8 | |
| Lenovo Legion Y540-17IRH (Edge 44) | |
| JetStream 1.1 - 1.1 Total | |
| Average of class Gaming (518 - 647, n=6, last 2 years) | |
| Schenker XMG Core 17 (Edge 44) | |
| MSI GP75 Leopard 9SD | |
| Lenovo Legion Y740-17ICH (Edge 44.17763.1.0) | |
| Gigabyte Sabre 17-W8 | |
| Lenovo Legion Y540-17IRH (Edge 44) | |
* ... smaller is better
| PCMark 7 Score | 7284 points | |
| PCMark 8 Home Score Accelerated v2 | 4818 points | |
| PCMark 8 Creative Score Accelerated v2 | 5506 points | |
| PCMark 8 Work Score Accelerated v2 | 5138 points | |
| PCMark 10 Score | 5613 points | |
Help | ||
| PCMark 10 - Score | |
| Average of class Gaming (5828 - 11574, n=96, last 2 years) | |
| Lenovo Legion Y740-17ICH | |
| Schenker XMG Core 17 | |
| Lenovo Legion Y540-17IRH | |
| MSI GP75 Leopard 9SD | |
| Dell G7 17 7790 | |
| Gigabyte Sabre 17-W8 | |
| PCMark 8 | |
| Home Score Accelerated v2 | |
| Average of class Gaming (n=1last 2 years) | |
| Lenovo Legion Y740-17ICH | |
| Lenovo Legion Y540-17IRH | |
| Schenker XMG Core 17 | |
| Gigabyte Sabre 17-W8 | |
| Dell G7 17 7790 | |
| MSI GP75 Leopard 9SD | |
| Work Score Accelerated v2 | |
| Lenovo Legion Y740-17ICH | |
| Schenker XMG Core 17 | |
| MSI GP75 Leopard 9SD | |
| Gigabyte Sabre 17-W8 | |
| Dell G7 17 7790 | |
| Lenovo Legion Y540-17IRH | |
| Average of class Gaming (n=1last 2 years) | |

| Lenovo Legion Y540-17IRH WDC PC SN520 SDAPNUW-512G | Schenker XMG Core 17 Samsung SSD 970 EVO Plus 500GB | Lenovo Legion Y740-17ICH Samsung SSD PM981 MZVLB256HAHQ | MSI GP75 Leopard 9SD Kingston RBUSNS8154P3256GJ1 | Dell G7 17 7790 Toshiba BG3 KBG30ZMS256G | Gigabyte Sabre 17-W8 Toshiba NVMe THNSN5256GPU7 | |
|---|---|---|---|---|---|---|
| CrystalDiskMark 5.2 / 6 | 42% | 39% | -22% | -32% | 4% | |
| Write 4K (MB/s) | 105.1 | 99.3 -6% | 99.8 -5% | 105.8 1% | 78.6 -25% | 104.7 0% |
| Read 4K (MB/s) | 34.41 | 38.47 12% | 40.81 19% | 27.89 -19% | 31.89 -7% | 37.39 9% |
| Write Seq (MB/s) | 1298 | 1449 12% | 1385 7% | 270.8 -79% | 230.4 -82% | 866 -33% |
| Read Seq (MB/s) | 1099 | 1237 13% | 2089 90% | 879 -20% | 925 -16% | 944 -14% |
| Write 4K Q32T1 (MB/s) | 335.7 | 364.4 9% | 380 13% | 273.3 -19% | 159.1 -53% | 293.3 -13% |
| Read 4K Q32T1 (MB/s) | 231.4 | 421.9 82% | 445.5 93% | 361.2 56% | 315.6 36% | 374.3 62% |
| Write Seq Q32T1 (MB/s) | 1454 | 3276 125% | 1380 -5% | 253 -83% | 230.7 -84% | 1064 -27% |
| Read Seq Q32T1 (MB/s) | 1740 | 3338 92% | 3471 99% | 1505 -14% | 1323 -24% | 2616 50% |
| 3DMark 06 Standard Score | 36563 points | |
| 3DMark 11 Performance | 16162 points | |
| 3DMark Ice Storm Standard Score | 139756 points | |
| 3DMark Cloud Gate Standard Score | 29390 points | |
| 3DMark Fire Strike Score | 12263 points | |
| 3DMark Time Spy Score | 5467 points | |
Help | ||
| 3DMark | |
| 1920x1080 Fire Strike Graphics | |
| Average of class Gaming (12242 - 62849, n=121, last 2 years) | |
| Lenovo Legion Y740-17ICH | |
| Dell G7 17 7790 | |
| MSI GP75 Leopard 9SD | |
| Schenker XMG Core 17 | |
| Lenovo Legion Y540-17IRH | |
| Gigabyte Sabre 17-W8 | |
| 2560x1440 Time Spy Graphics | |
| Average of class Gaming (5012 - 26212, n=120, last 2 years) | |
| Lenovo Legion Y740-17ICH | |
| Dell G7 17 7790 | |
| MSI GP75 Leopard 9SD | |
| Lenovo Legion Y540-17IRH | |
| Schenker XMG Core 17 | |
| 3DMark 11 - 1280x720 Performance GPU | |
| Average of class Gaming (21841 - 80022, n=109, last 2 years) | |
| Lenovo Legion Y740-17ICH | |
| Dell G7 17 7790 | |
| MSI GP75 Leopard 9SD | |
| Lenovo Legion Y540-17IRH | |
| Schenker XMG Core 17 | |
| Gigabyte Sabre 17-W8 | |
| The Witcher 3 - 1920x1080 Ultra Graphics & Postprocessing (HBAO+) | |
| Average of class Gaming (95 - 240, n=8, last 2 years) | |
| Lenovo Legion Y740-17ICH | |
| Dell G7 17 7790 | |
| MSI GP75 Leopard 9SD | |
| Lenovo Legion Y540-17IRH | |
| Schenker XMG Core 17 | |
| Gigabyte Sabre 17-W8 | |
| BioShock Infinite - 1920x1080 Ultra Preset, DX11 (DDOF) | |
| Lenovo Legion Y740-17ICH | |
| MSI GP75 Leopard 9SD | |
| Lenovo Legion Y540-17IRH | |
| Schenker XMG Core 17 | |
| Dell G7 17 7790 | |
| For Honor - 1920x1080 Extreme Preset AA:T AF:16x | |
| Schenker XMG Core 17 | |
| Lenovo Legion Y540-17IRH | |
| Far Cry New Dawn - 1920x1080 Ultra Preset | |
| Schenker XMG Core 17 | |
| Lenovo Legion Y540-17IRH | |
| F1 2019 - 1920x1080 Ultra High Preset AA:T AF:16x | |
| Schenker XMG Core 17 | |
| Lenovo Legion Y540-17IRH | |
| Total War: Three Kingdoms - 1920x1080 Ultra (incl textures) | |
| Lenovo Legion Y540-17IRH | |
| low | med. | high | ultra | |
|---|---|---|---|---|
| BioShock Infinite (2013) | 313.9 | 284.2 | 265.6 | 138 |
| The Witcher 3 (2015) | 264 | 185 | 109.6 | 55.1 |
| For Honor (2017) | 245.1 | 126.1 | 120.4 | 92.6 |
| Ghost Recon Wildlands (2017) | 150.6 | 88.7 | 82.6 | 47.8 |
| Final Fantasy XV Benchmark (2018) | 129 | 78.1 | 55.4 | |
| X-Plane 11.11 (2018) | 91.5 | 83.6 | 71 | |
| Far Cry 5 (2018) | 117 | 90 | 84 | 83 |
| Far Cry New Dawn (2019) | 106 | 86 | 83 | 75 |
| Total War: Three Kingdoms (2019) | 202.9 | 101.5 | 63.9 | 46.1 |
| F1 2019 (2019) | 210 | 154 | 131 | 91 |
Noise level
| Idle |
| 30 / 32 / 34 dB(A) |
| Load |
| 44 / 52 dB(A) |
 | ||
30 dB silent 40 dB(A) audible 50 dB(A) loud |
||
min: | ||
| Lenovo Legion Y540-17IRH i5-9300H, GeForce GTX 1660 Ti Mobile | Schenker XMG Core 17 i7-9750H, GeForce GTX 1660 Ti Mobile | Lenovo Legion Y740-17ICH i7-8750H, GeForce RTX 2080 Max-Q | MSI GP75 Leopard 9SD i7-9750H, GeForce GTX 1660 Ti Mobile | Dell G7 17 7790 i7-8750H, GeForce RTX 2070 Max-Q | Gigabyte Sabre 17-W8 i7-8750H, GeForce GTX 1060 Mobile | Average of class Gaming | |
|---|---|---|---|---|---|---|---|
| Noise | -1% | 9% | -5% | 10% | 1% | 10% | |
| off / environment * (dB) | 30 | 30 -0% | 28.3 6% | 29 3% | 28.2 6% | 30.5 -2% | 24.1 ? 20% |
| Idle Minimum * (dB) | 30 | 30 -0% | 31.5 -5% | 29 3% | 28.6 5% | 32.1 -7% | 25.8 ? 14% |
| Idle Average * (dB) | 32 | 32 -0% | 31.6 1% | 34 -6% | 28.6 11% | 32.1 -0% | 27.5 ? 14% |
| Idle Maximum * (dB) | 34 | 35 -3% | 31.6 7% | 37 -9% | 28.6 16% | 32.3 5% | 30 ? 12% |
| Load Average * (dB) | 44 | 47 -7% | 32.3 27% | 53 -20% | 31.8 28% | 42.9 2% | 43.1 ? 2% |
| Witcher 3 ultra * (dB) | 50 | 48 4% | 43 14% | 51 -2% | 50.6 -1% | ||
| Load Maximum * (dB) | 52 | 51 2% | 45.5 12% | 55 -6% | 50.8 2% | 48.8 6% | 54 ? -4% |
* ... smaller is better
(-) The maximum temperature on the upper side is 48 °C / 118 F, compared to the average of 40.4 °C / 105 F, ranging from 21.2 to 68.8 °C for the class Gaming.
(-) The bottom heats up to a maximum of 56 °C / 133 F, compared to the average of 43.2 °C / 110 F
(+) In idle usage, the average temperature for the upper side is 31.6 °C / 89 F, compared to the device average of 33.9 °C / 93 F.
(-) Playing The Witcher 3, the average temperature for the upper side is 39.8 °C / 104 F, compared to the device average of 33.9 °C / 93 F.
(-) The palmrests and touchpad can get very hot to the touch with a maximum of 40 °C / 104 F.
(-) The average temperature of the palmrest area of similar devices was 28.8 °C / 83.8 F (-11.2 °C / -20.2 F).
| Lenovo Legion Y540-17IRH i5-9300H, GeForce GTX 1660 Ti Mobile | Schenker XMG Core 17 i7-9750H, GeForce GTX 1660 Ti Mobile | Lenovo Legion Y740-17ICH i7-8750H, GeForce RTX 2080 Max-Q | MSI GP75 Leopard 9SD i7-9750H, GeForce GTX 1660 Ti Mobile | Dell G7 17 7790 i7-8750H, GeForce RTX 2070 Max-Q | Gigabyte Sabre 17-W8 i7-8750H, GeForce GTX 1060 Mobile | Average of class Gaming | |
|---|---|---|---|---|---|---|---|
| Heat | 9% | 17% | 16% | 4% | 26% | 11% | |
| Maximum Upper Side * (°C) | 48 | 47 2% | 38.6 20% | 45 6% | 46.6 3% | 35 27% | 45.2 ? 6% |
| Maximum Bottom * (°C) | 56 | 50 11% | 43.6 22% | 42 25% | 57 -2% | 34.3 39% | 48.2 ? 14% |
| Idle Upper Side * (°C) | 36 | 34 6% | 30.2 16% | 30 17% | 34.4 4% | 30.1 16% | 31.1 ? 14% |
| Idle Bottom * (°C) | 38 | 32 16% | 35 8% | 32 16% | 34.6 9% | 30.5 20% | 34.3 ? 10% |
* ... smaller is better
Lenovo Legion Y540-17IRH audio analysis
(+) | speakers can play relatively loud (84 dB)
Bass 100 - 315 Hz
(-) | nearly no bass - on average 16.1% lower than median
(±) | linearity of bass is average (13% delta to prev. frequency)
Mids 400 - 2000 Hz
(±) | higher mids - on average 5% higher than median
(+) | mids are linear (3.6% delta to prev. frequency)
Highs 2 - 16 kHz
(+) | balanced highs - only 3.5% away from median
(+) | highs are linear (5.9% delta to prev. frequency)
Overall 100 - 16.000 Hz
(±) | linearity of overall sound is average (15.7% difference to median)
Compared to same class
» 36% of all tested devices in this class were better, 7% similar, 57% worse
» The best had a delta of 6%, average was 18%, worst was 132%
Compared to all devices tested
» 24% of all tested devices were better, 5% similar, 71% worse
» The best had a delta of 4%, average was 24%, worst was 134%
Lenovo Legion Y740-17ICH audio analysis
(±) | speaker loudness is average but good (74.3 dB)
Bass 100 - 315 Hz
(-) | nearly no bass - on average 21.1% lower than median
(-) | bass is not linear (16.5% delta to prev. frequency)
Mids 400 - 2000 Hz
(+) | balanced mids - only 3.3% away from median
(±) | linearity of mids is average (9.7% delta to prev. frequency)
Highs 2 - 16 kHz
(+) | balanced highs - only 1.7% away from median
(+) | highs are linear (4.6% delta to prev. frequency)
Overall 100 - 16.000 Hz
(±) | linearity of overall sound is average (23.4% difference to median)
Compared to same class
» 85% of all tested devices in this class were better, 5% similar, 11% worse
» The best had a delta of 6%, average was 18%, worst was 132%
Compared to all devices tested
» 70% of all tested devices were better, 6% similar, 24% worse
» The best had a delta of 4%, average was 24%, worst was 134%
| Off / Standby | |
| Idle | |
| Load |
|
Key:
min: | |
| Lenovo Legion Y540-17IRH i5-9300H, GeForce GTX 1660 Ti Mobile | Schenker XMG Core 17 i7-9750H, GeForce GTX 1660 Ti Mobile | Lenovo Legion Y740-17ICH i7-8750H, GeForce RTX 2080 Max-Q | MSI GP75 Leopard 9SD i7-9750H, GeForce GTX 1660 Ti Mobile | Dell G7 17 7790 i7-8750H, GeForce RTX 2070 Max-Q | Gigabyte Sabre 17-W8 i7-8750H, GeForce GTX 1060 Mobile | Average of class Gaming | |
|---|---|---|---|---|---|---|---|
| Power Consumption | 20% | -6% | 12% | 11% | 28% | -0% | |
| Idle Minimum * (Watt) | 19 | 10 47% | 20.2 -6% | 10 47% | 9.5 50% | 9.3 51% | 13.3 ? 30% |
| Idle Average * (Watt) | 22 | 13 41% | 27.2 -24% | 15 32% | 16.2 26% | 14.8 33% | 19 ? 14% |
| Idle Maximum * (Watt) | 30 | 21 30% | 28.7 4% | 22 27% | 23.8 21% | 22 27% | 24.5 ? 18% |
| Load Average * (Watt) | 79 | 89 -13% | 90.8 -15% | 92 -16% | 101.7 -29% | 63 20% | 108.1 ? -37% |
| Witcher 3 ultra * (Watt) | 134 | 128 4% | 152.1 -14% | 153 -14% | 155 -16% | ||
| Load Maximum * (Watt) | 201 | 177 12% | 165.4 18% | 216 -7% | 172.2 14% | 187 7% | 254 ? -26% |
* ... smaller is better
| Lenovo Legion Y540-17IRH i5-9300H, GeForce GTX 1660 Ti Mobile, 57 Wh | Schenker XMG Core 17 i7-9750H, GeForce GTX 1660 Ti Mobile, 46.74 Wh | Lenovo Legion Y740-17ICH i7-8750H, GeForce RTX 2080 Max-Q, 76 Wh | MSI GP75 Leopard 9SD i7-9750H, GeForce GTX 1660 Ti Mobile, 51 Wh | Dell G7 17 7790 i7-8750H, GeForce RTX 2070 Max-Q, 60 Wh | Gigabyte Sabre 17-W8 i7-8750H, GeForce GTX 1060 Mobile, 62 Wh | Average of class Gaming | |
|---|---|---|---|---|---|---|---|
| Battery runtime | 39% | -14% | -22% | 50% | 41% | 84% | |
| Reader / Idle (h) | 5.2 | 8.1 56% | 4.8 -8% | 8.5 63% | 6.9 33% | 8.71 ? 68% | |
| H.264 (h) | 3.4 | 5.3 56% | 5.3 56% | 8.26 ? 143% | |||
| WiFi v1.3 (h) | 3.7 | 4.7 27% | 3.2 -14% | 3.2 -14% | 3.9 5% | 5.4 46% | 7.01 ? 89% |
| Load (h) | 1.1 | 1.3 18% | 0.6 -45% | 2 82% | 1.4 27% | 1.47 ? 34% |
Pros
Cons
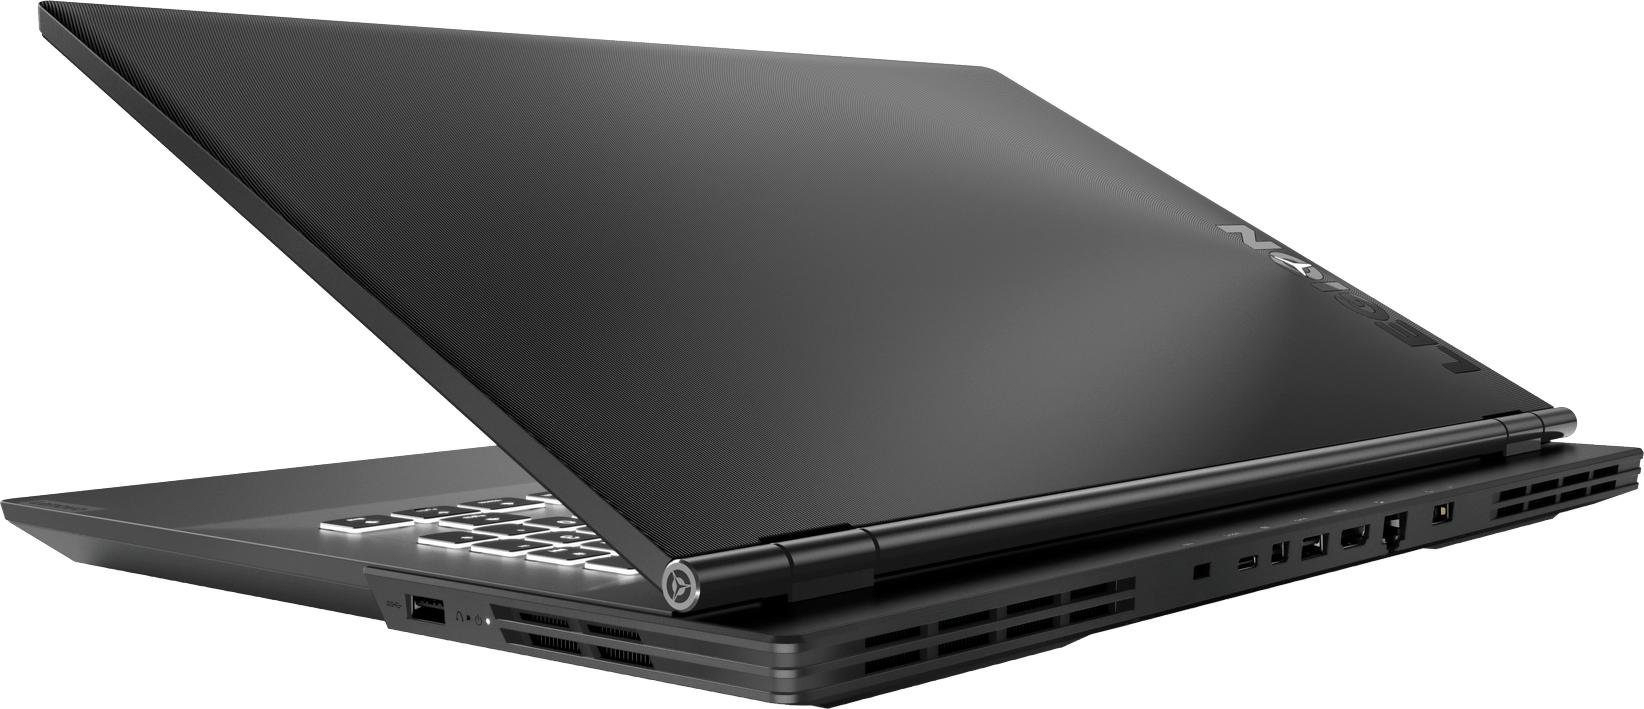
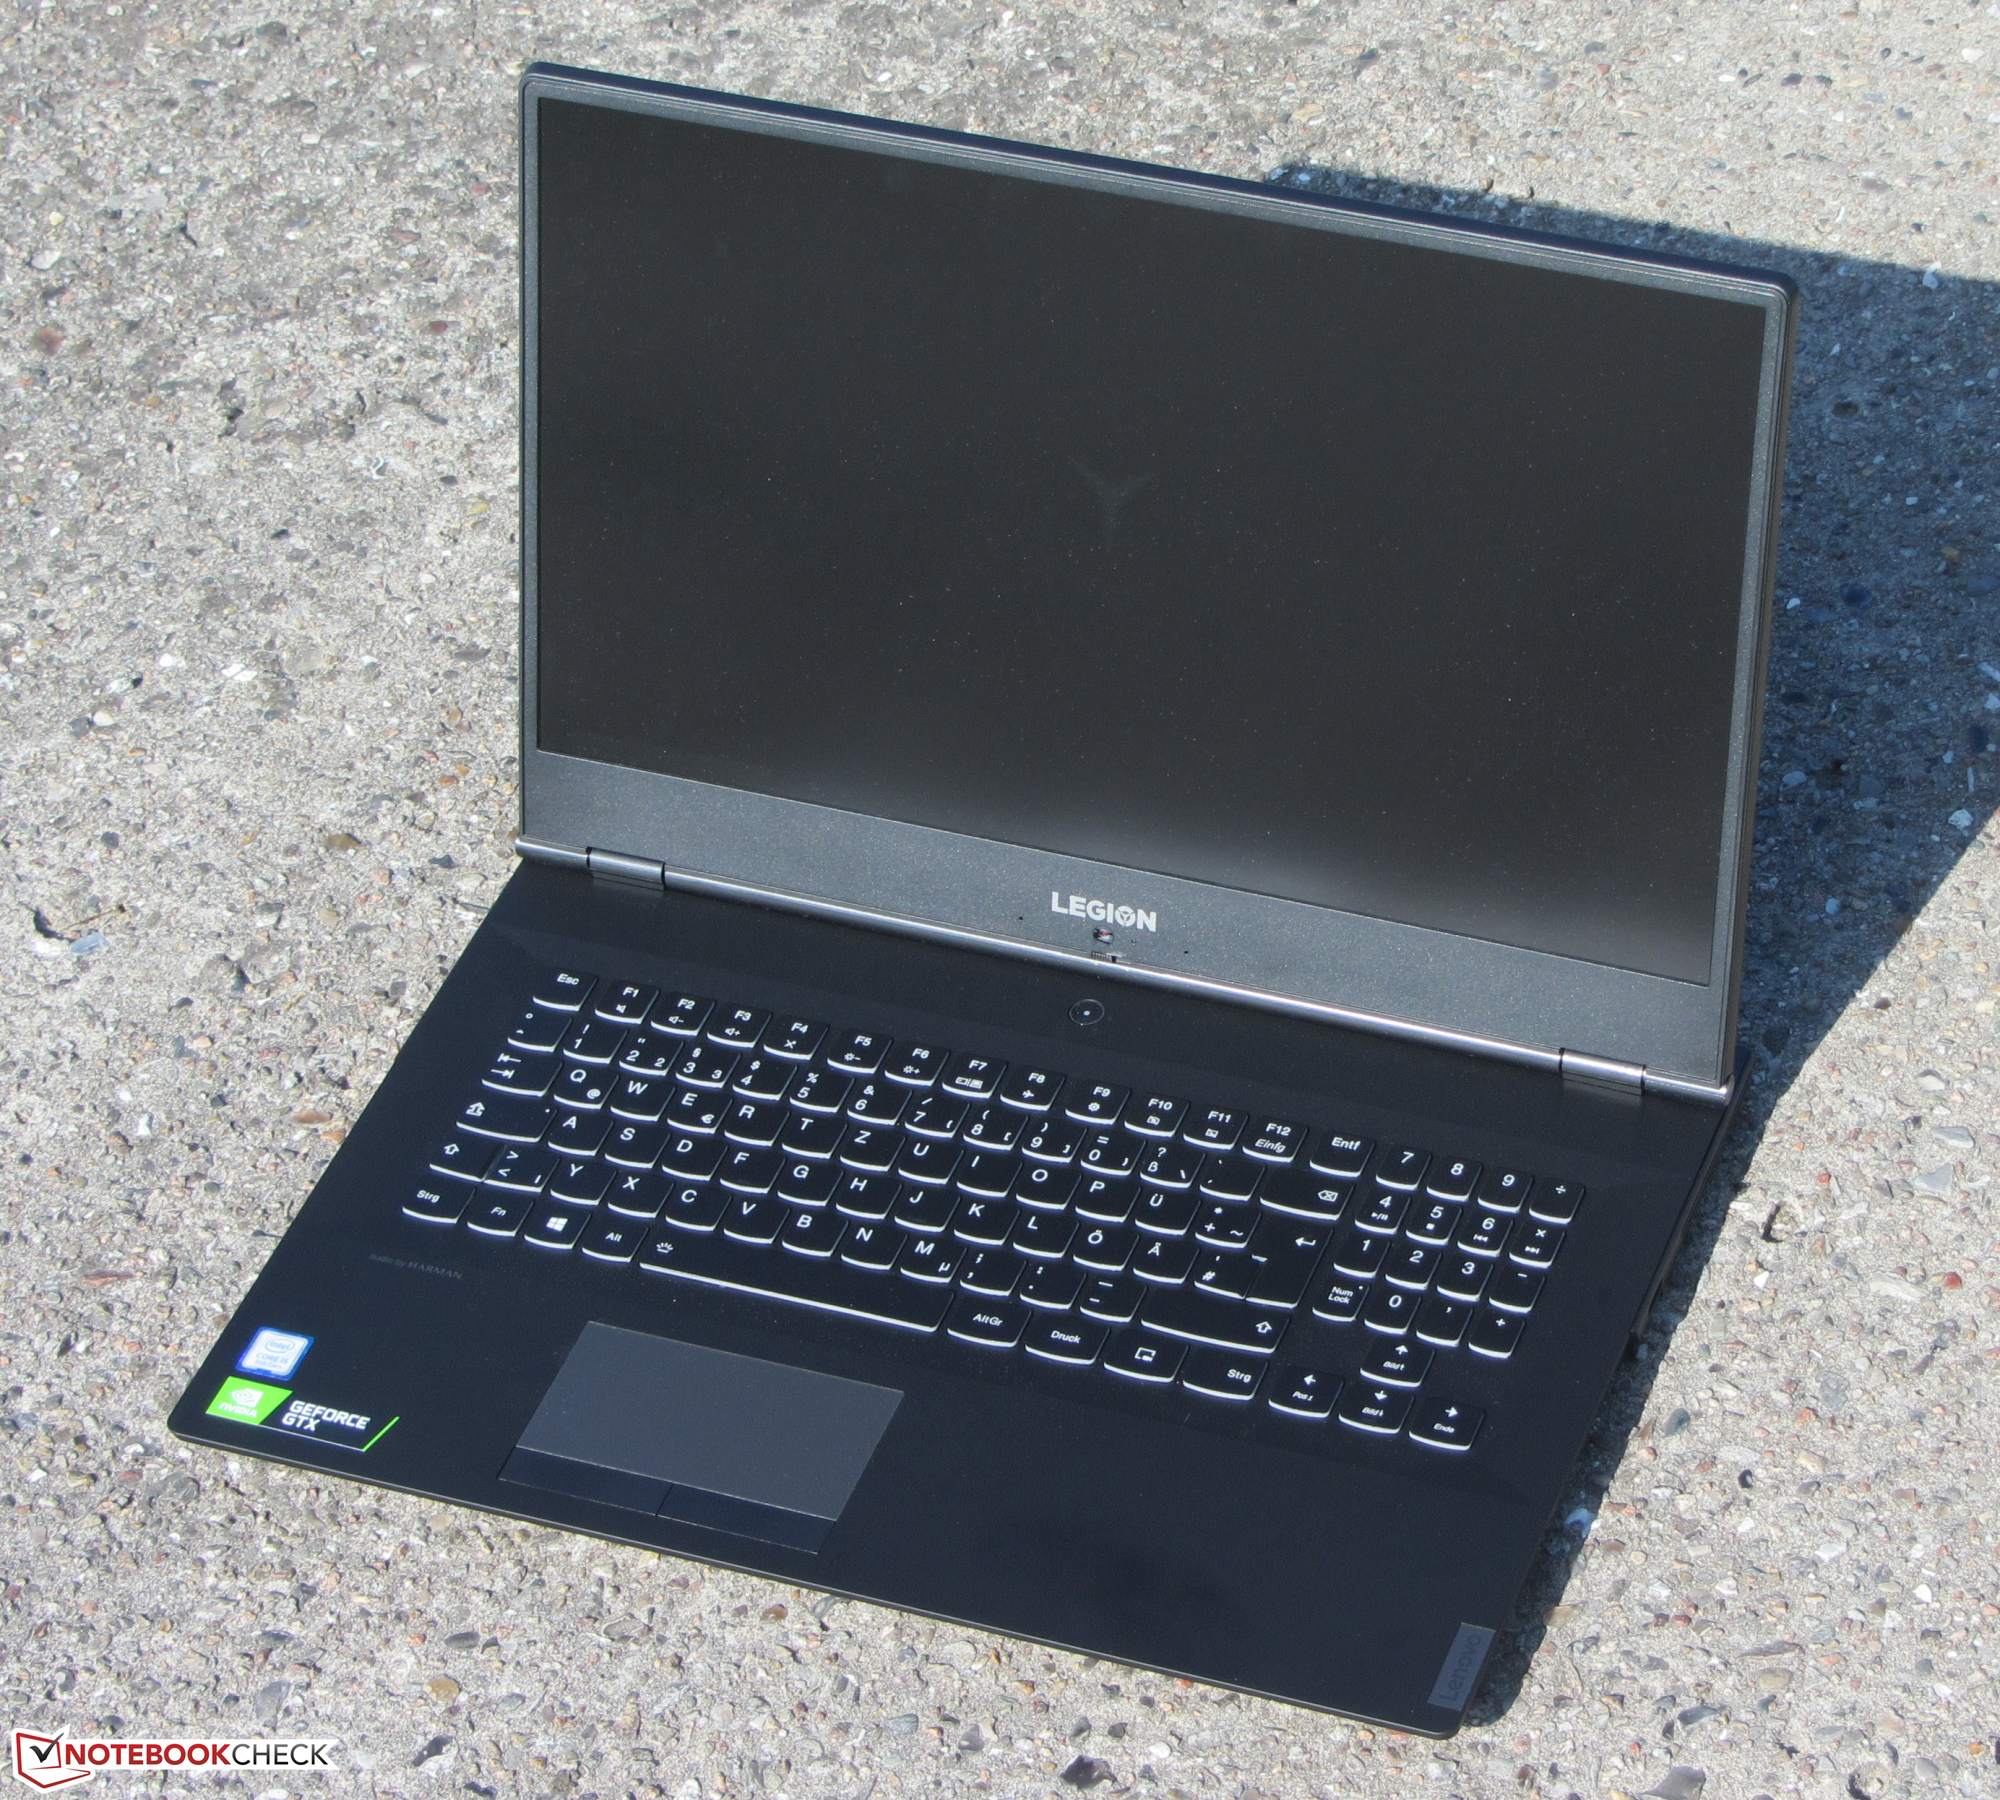
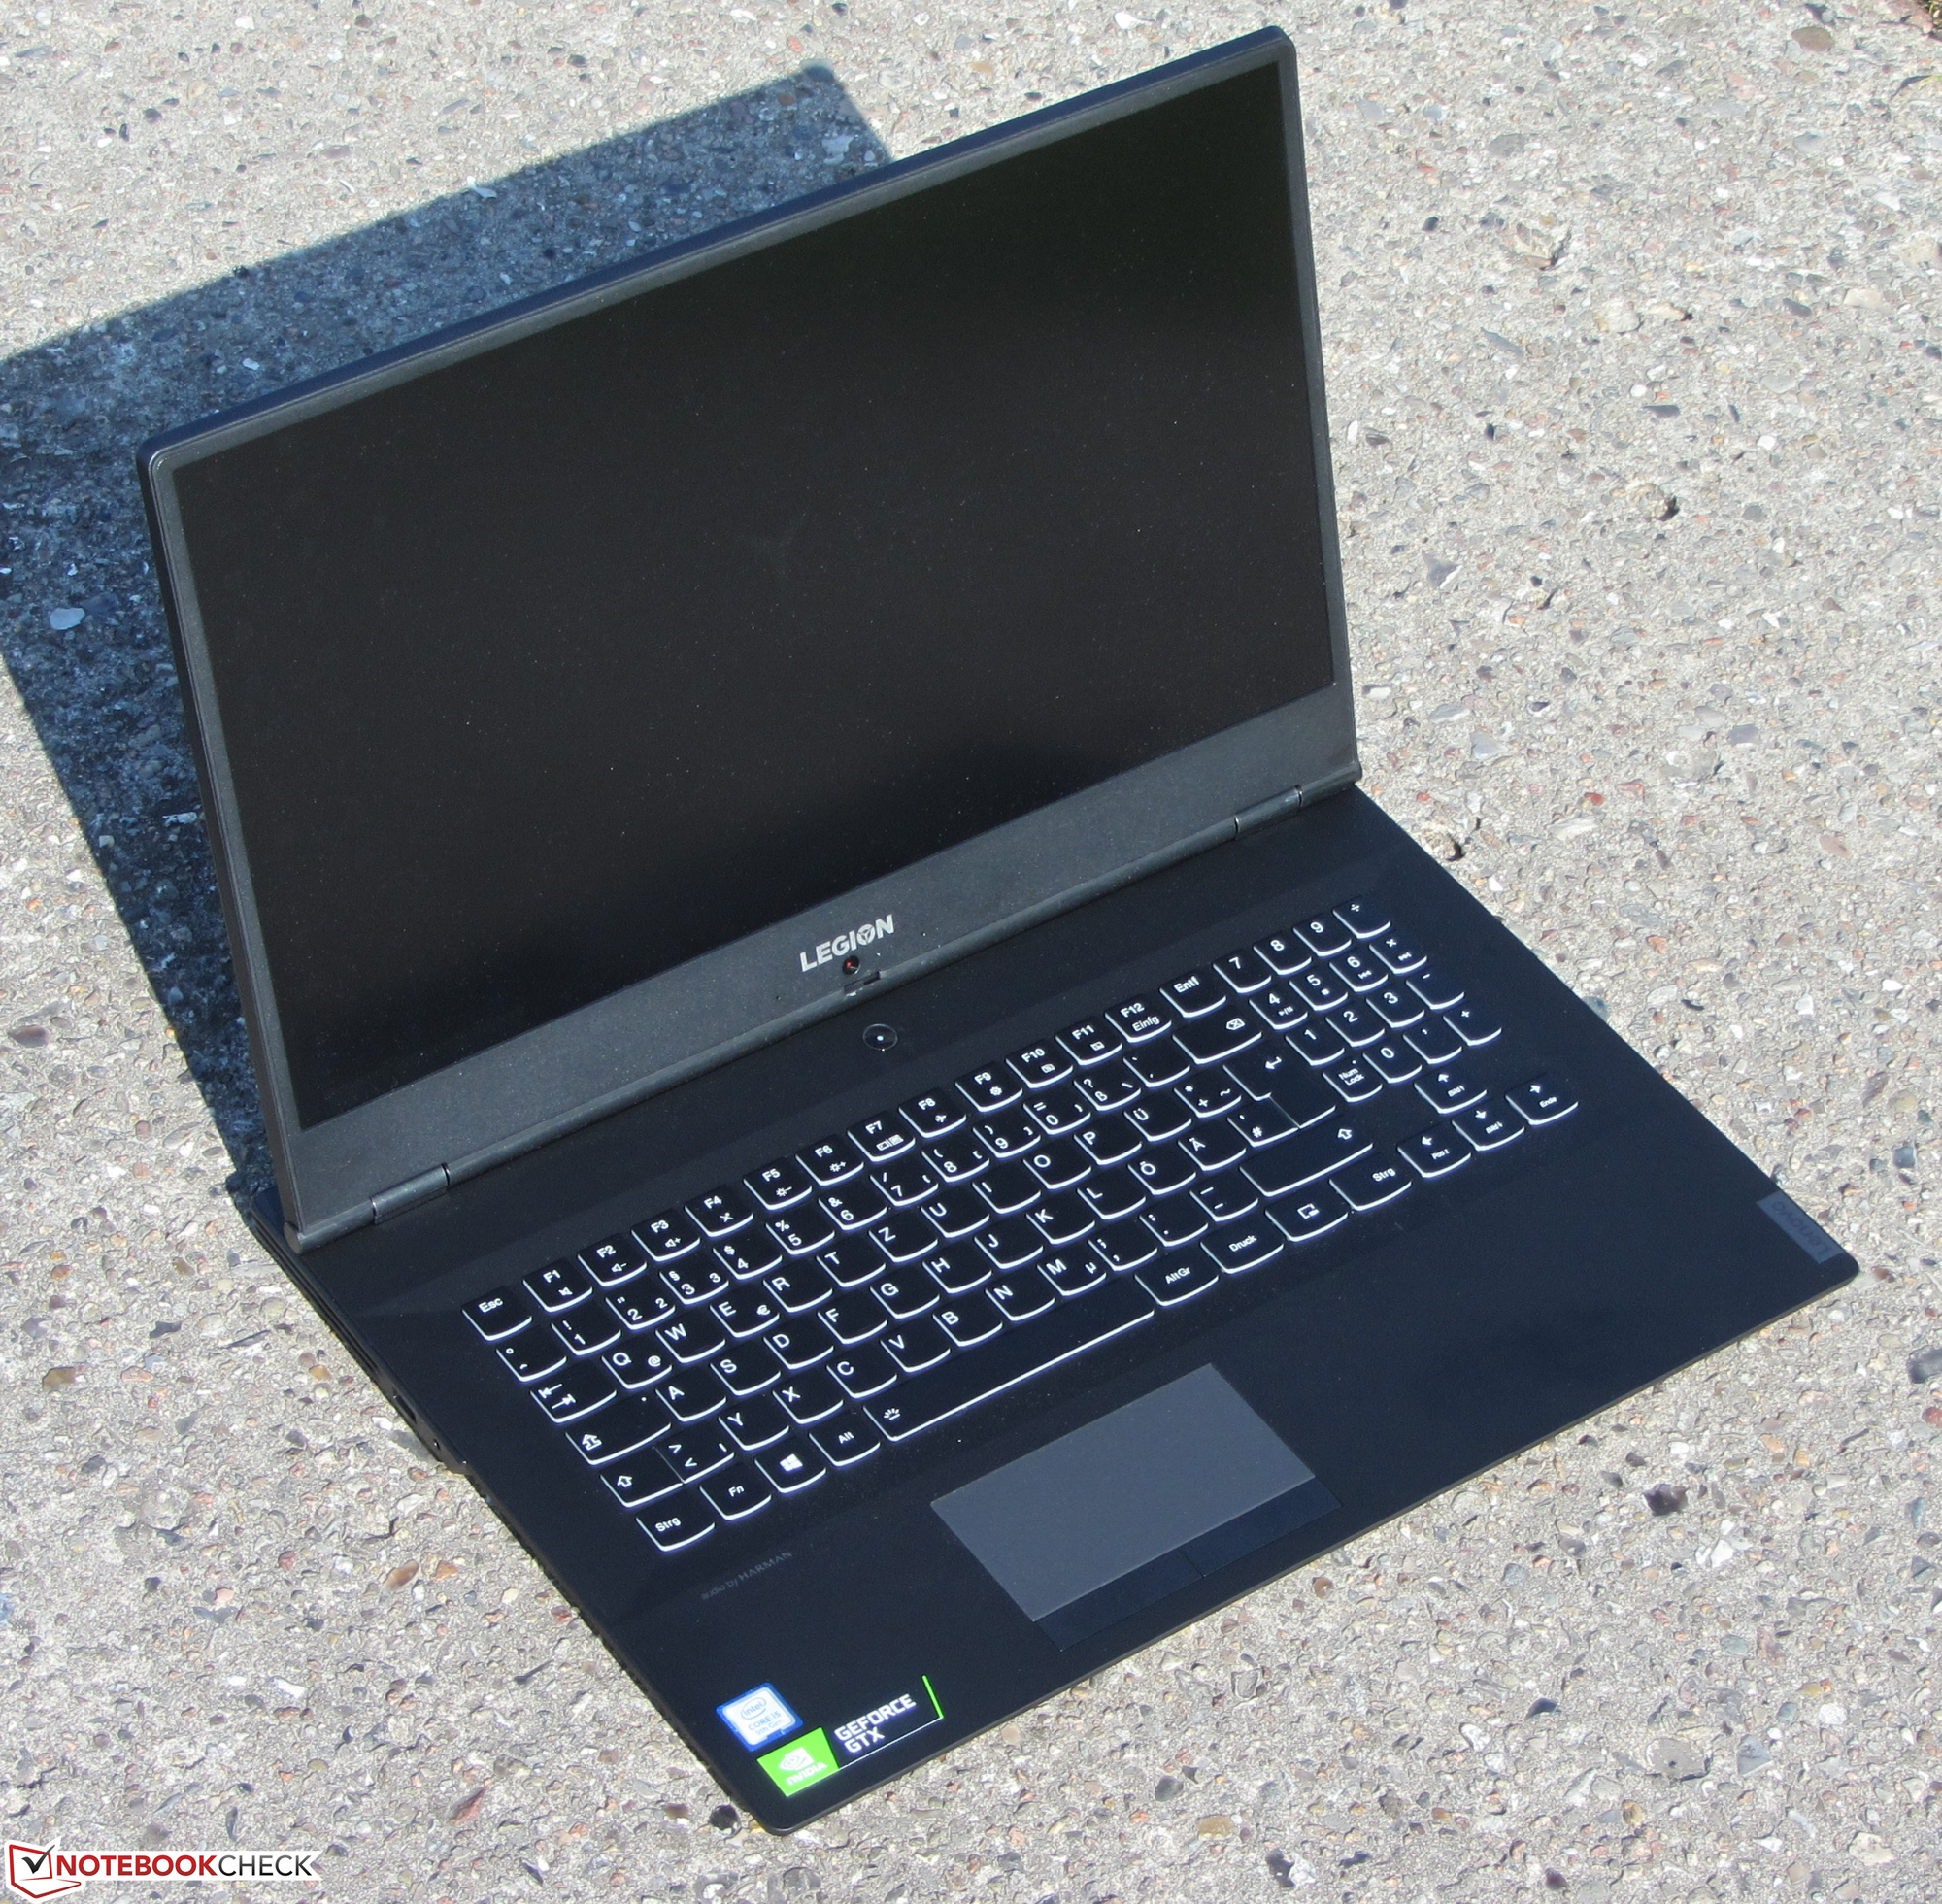
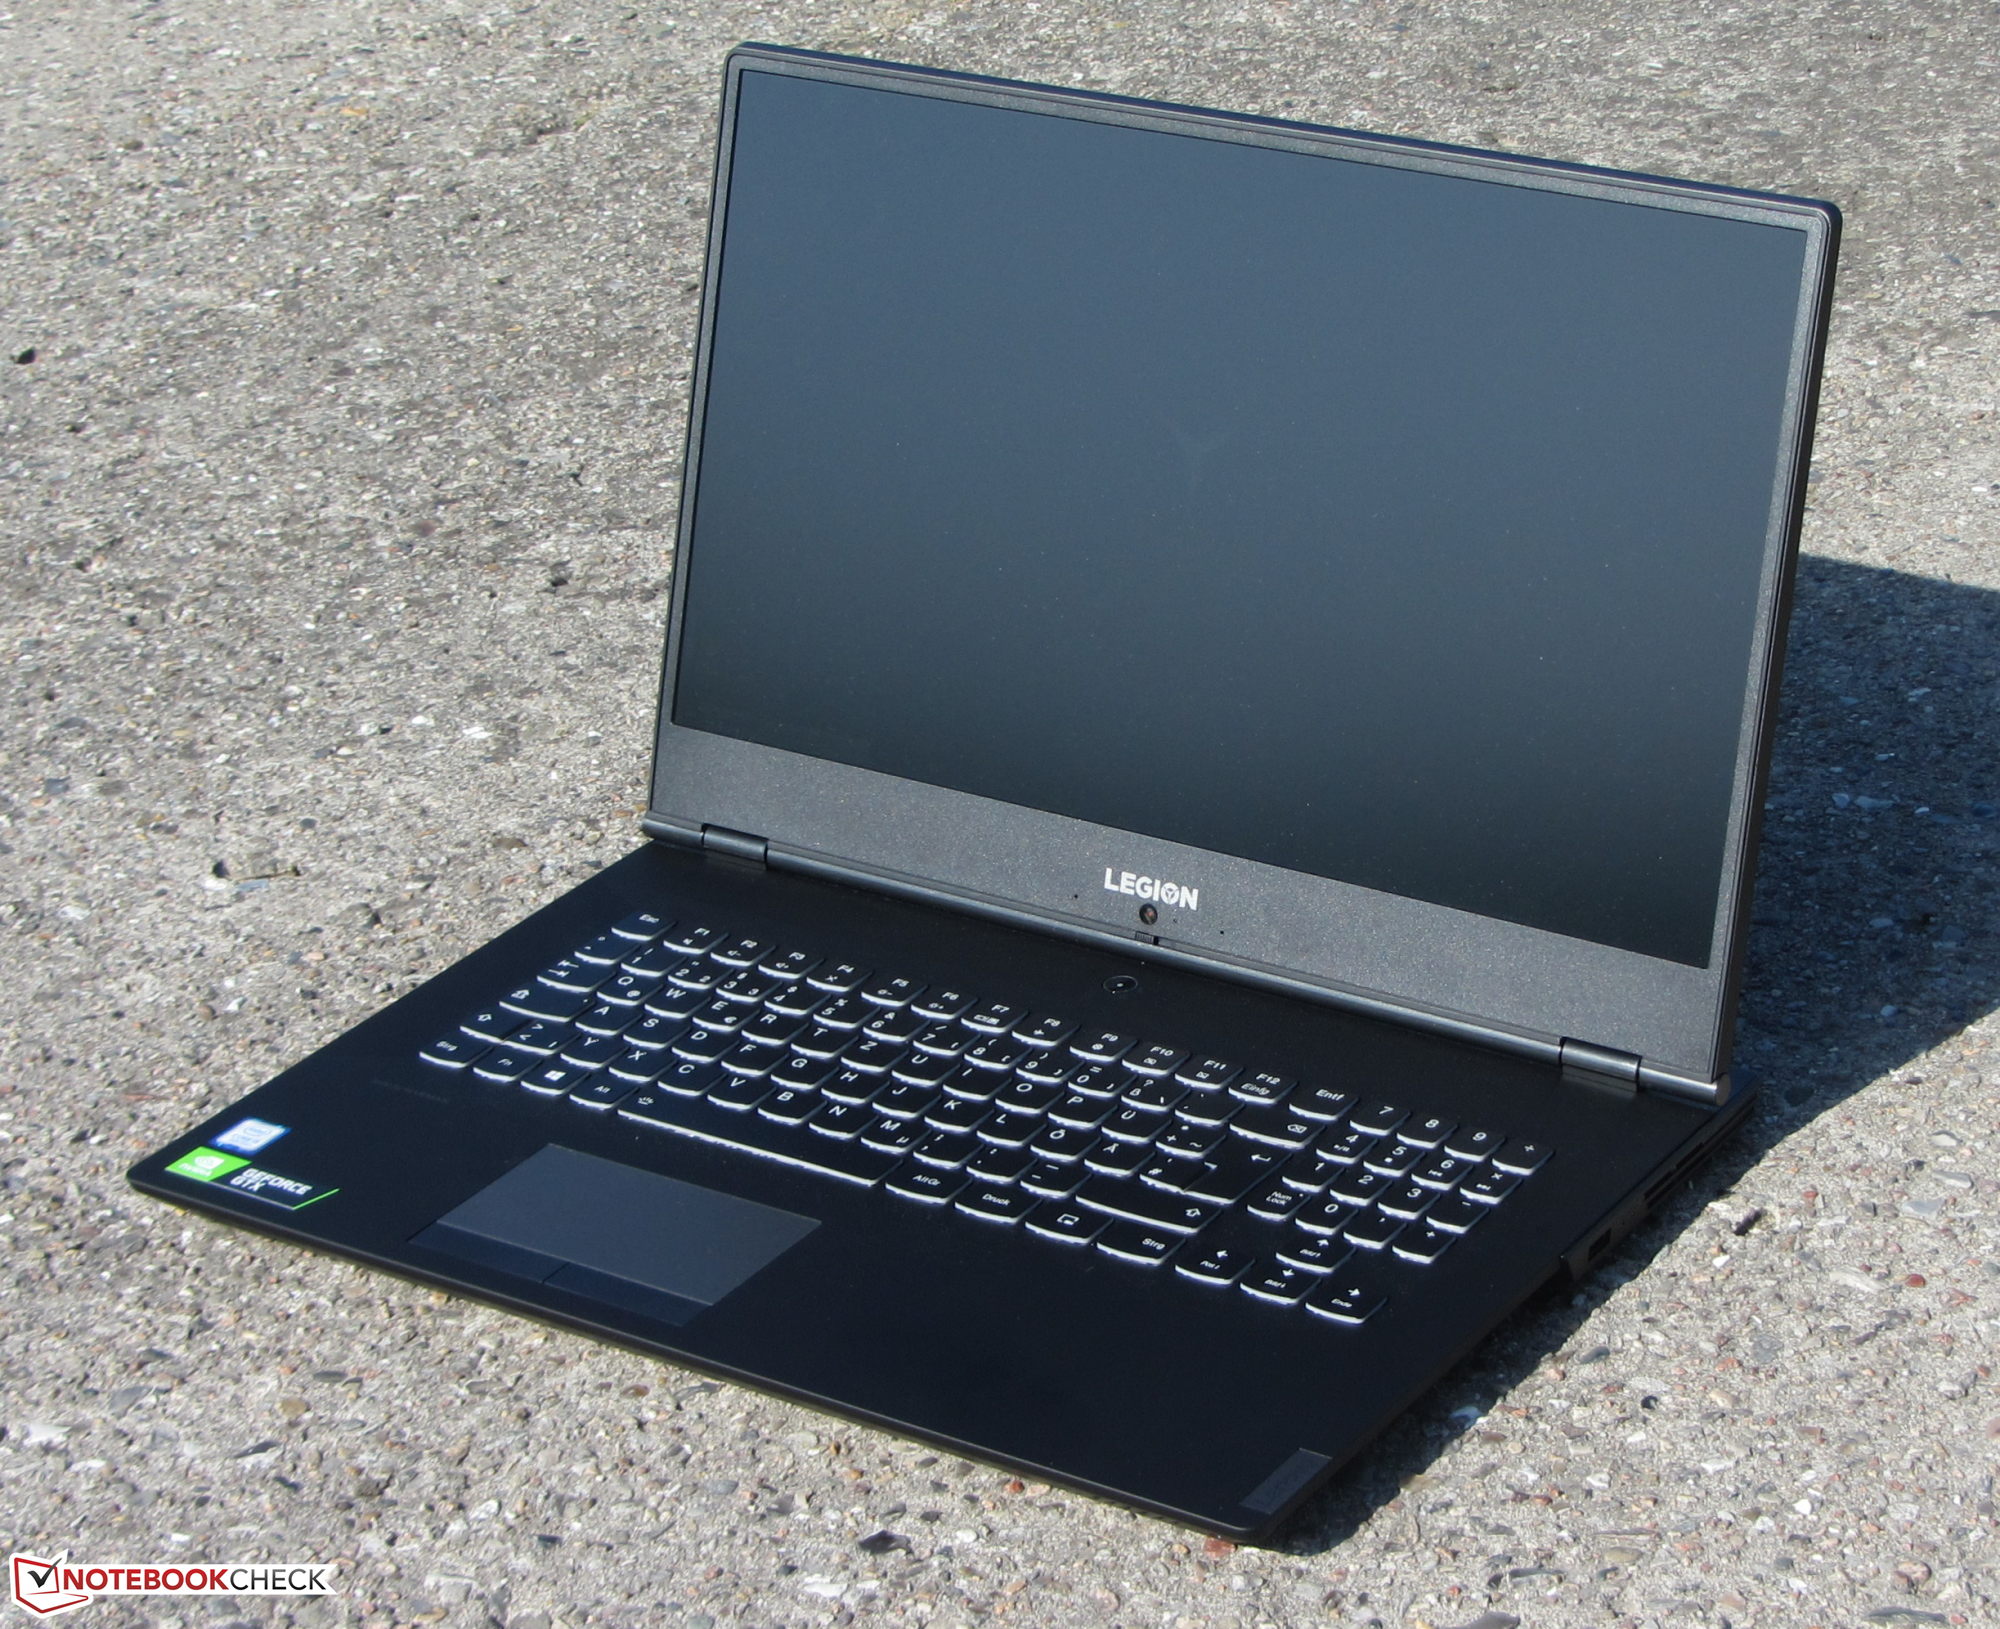
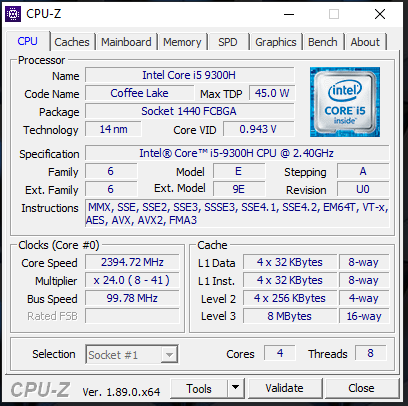
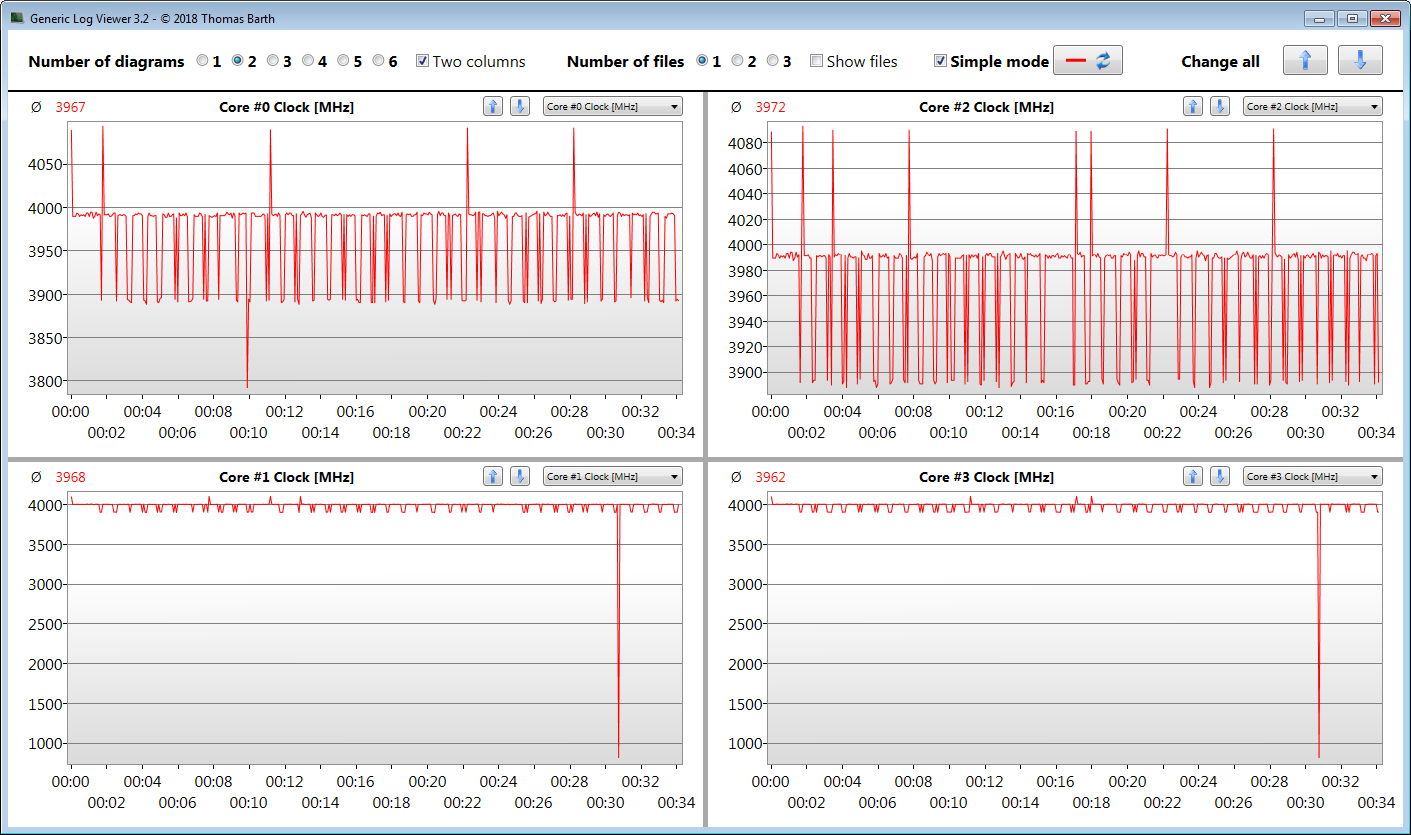
联想利用Legion Y540-17IRH提供了中端的17.3英寸游戏笔记本电脑。 Core i5-9300H CPU和GeForce GTX 1660 Ti GPU的组合不仅能够流畅运行现代游戏。在大多数游戏中,更可以选择Full HD分辨率和高至最高设置。该处理器特别令人印象深刻,因为它可以一直维持其完整的Turbo Boost。
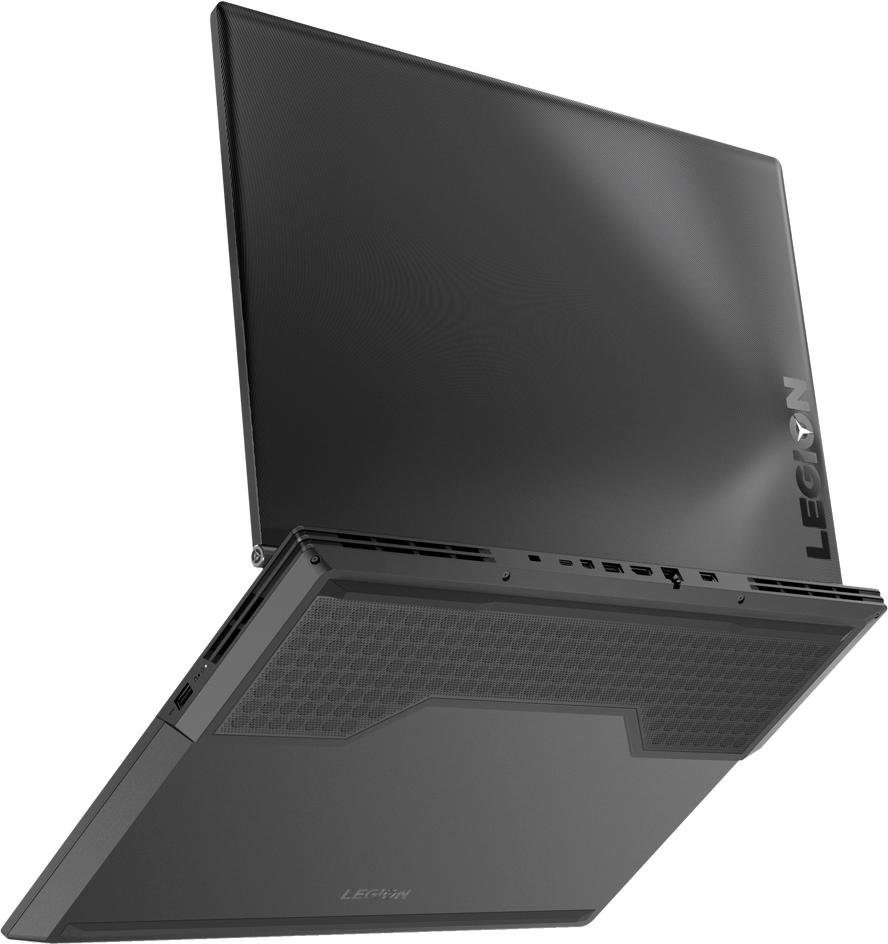
由于安装了NVMe SSD,因此系统运行流畅。但是,由于其PCI Express x2接口,它不是最快的型号之一。由于笔记本电脑具有易于使用的维护舱口,因此将SSD更换为更快的型号是没有问题的。此外,用户可以选择安装额外的2.5英寸驱动器。
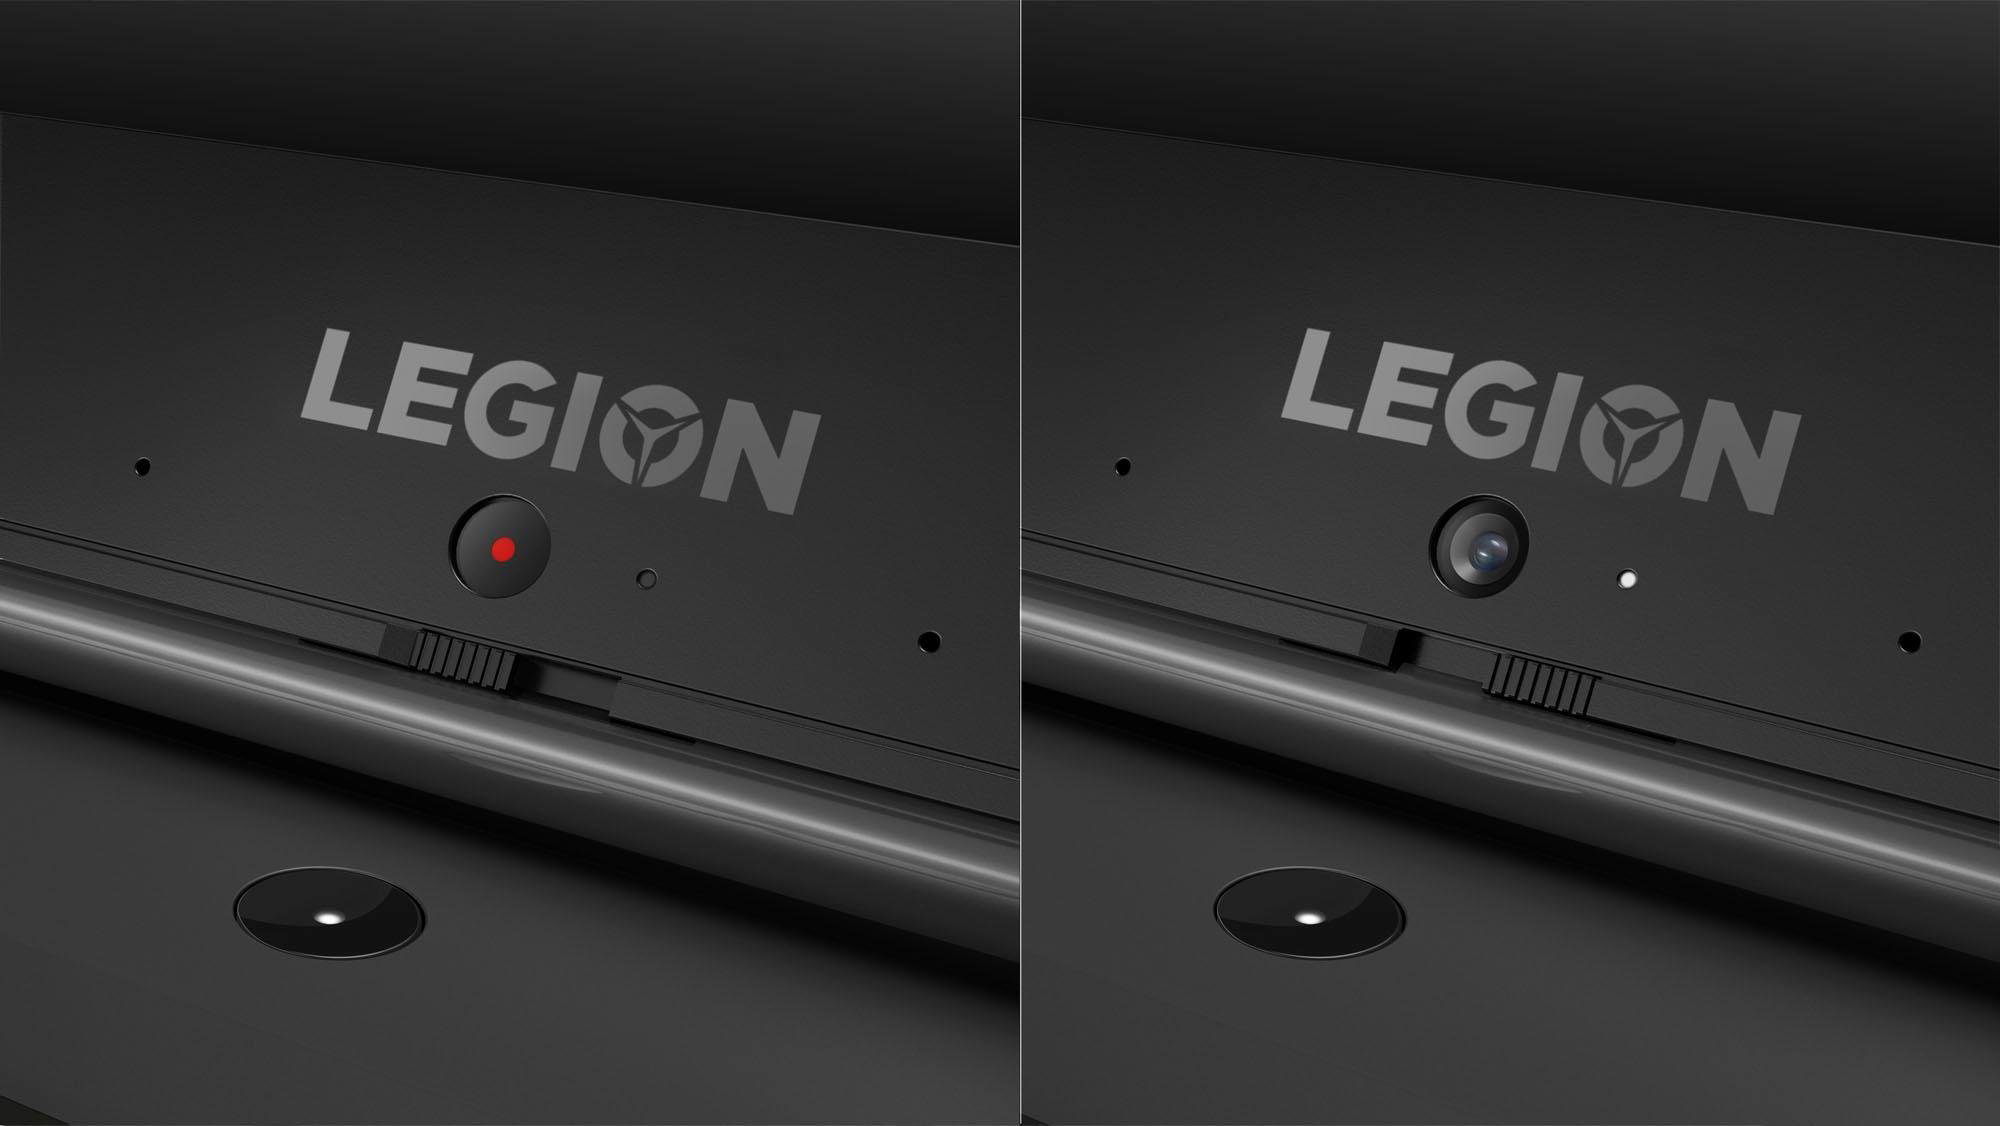
方便:只需单击一下即可启用和禁用集成GPU。
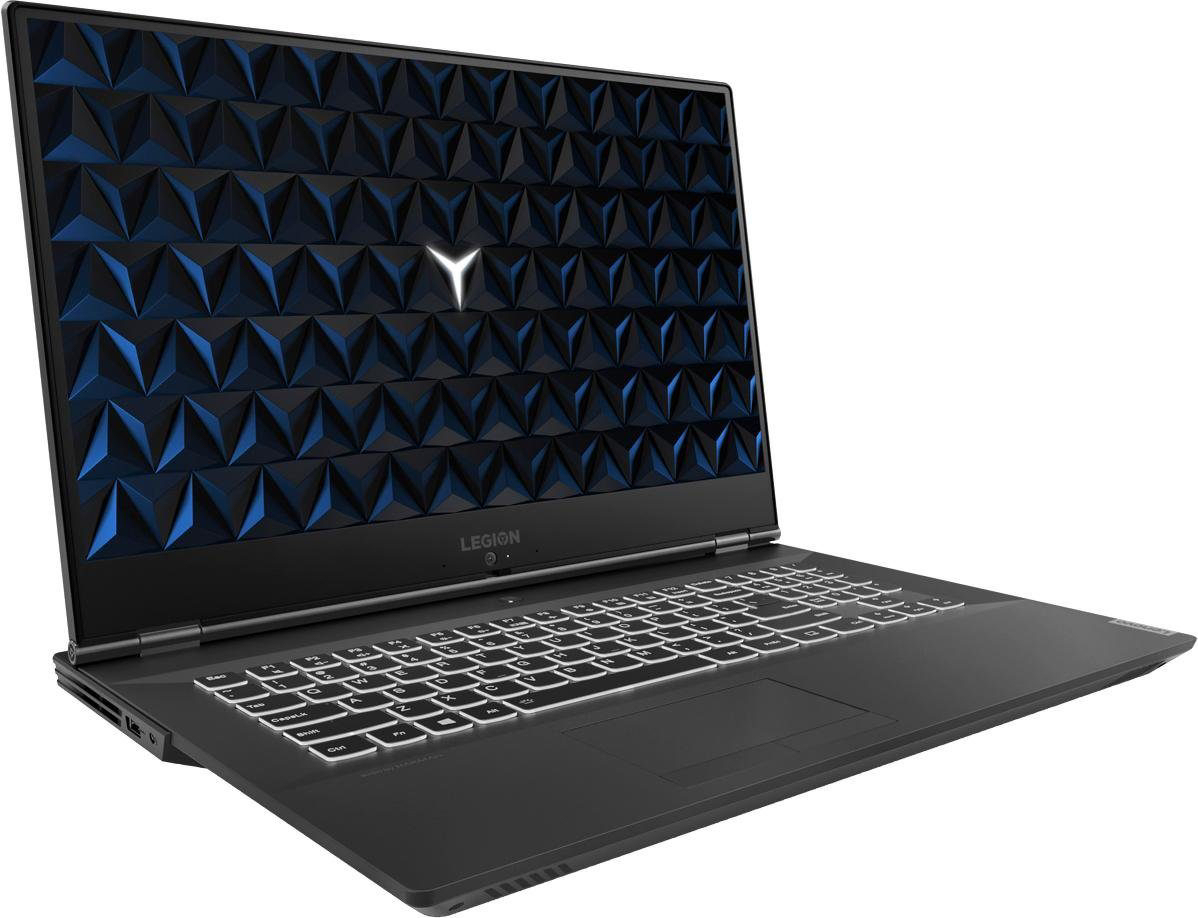
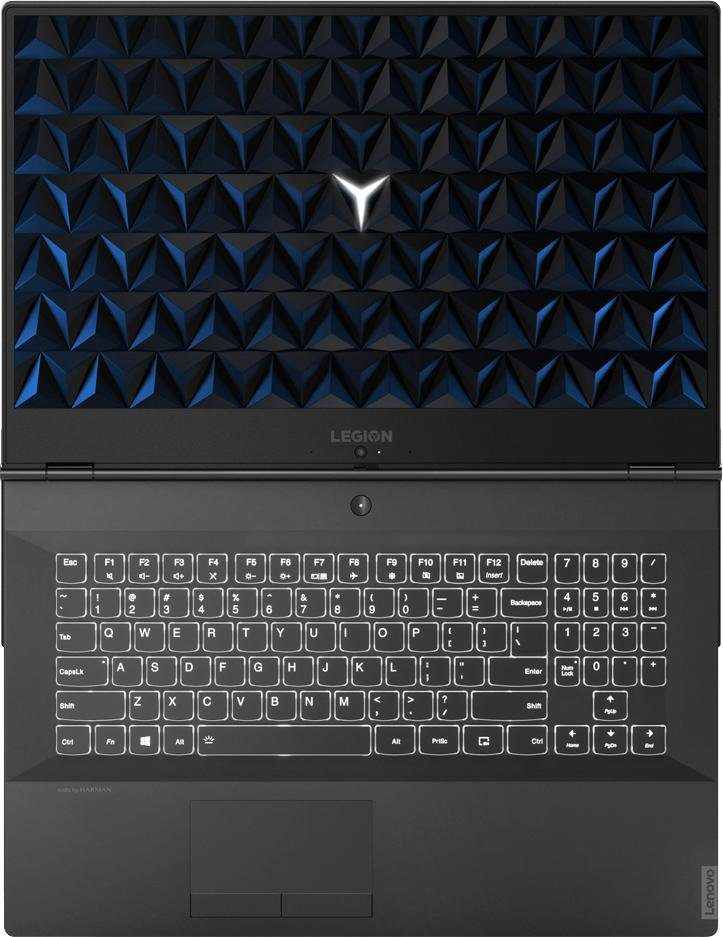
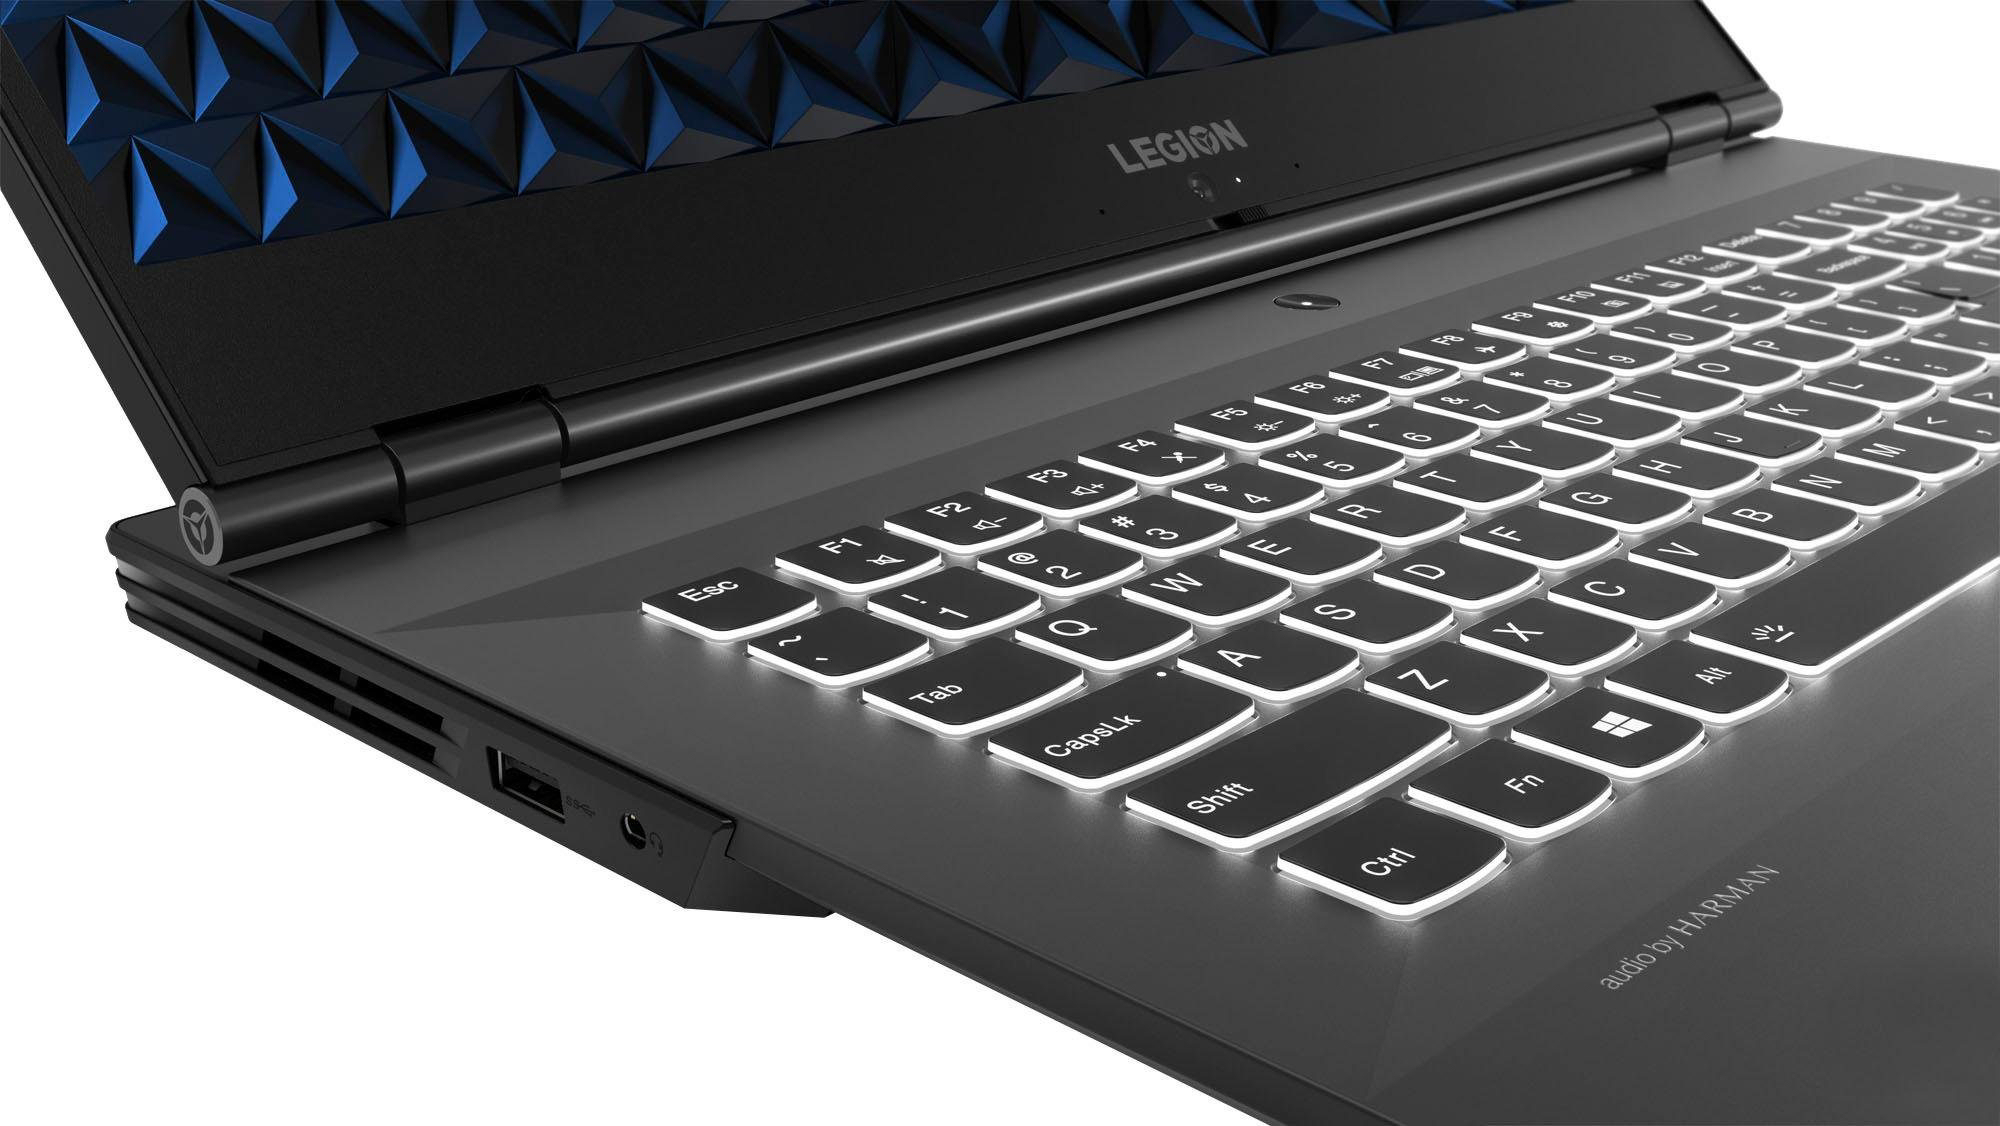
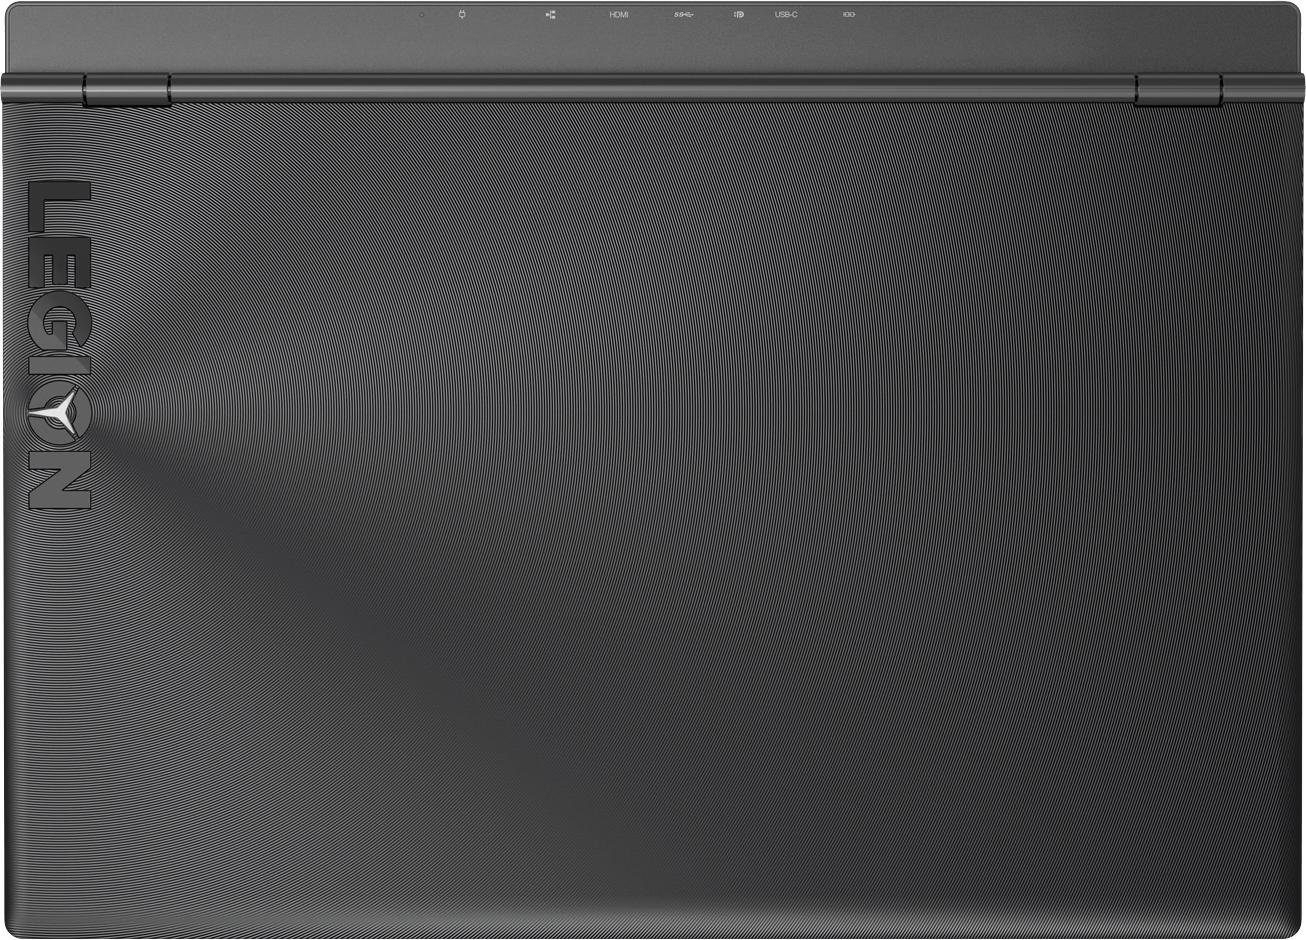
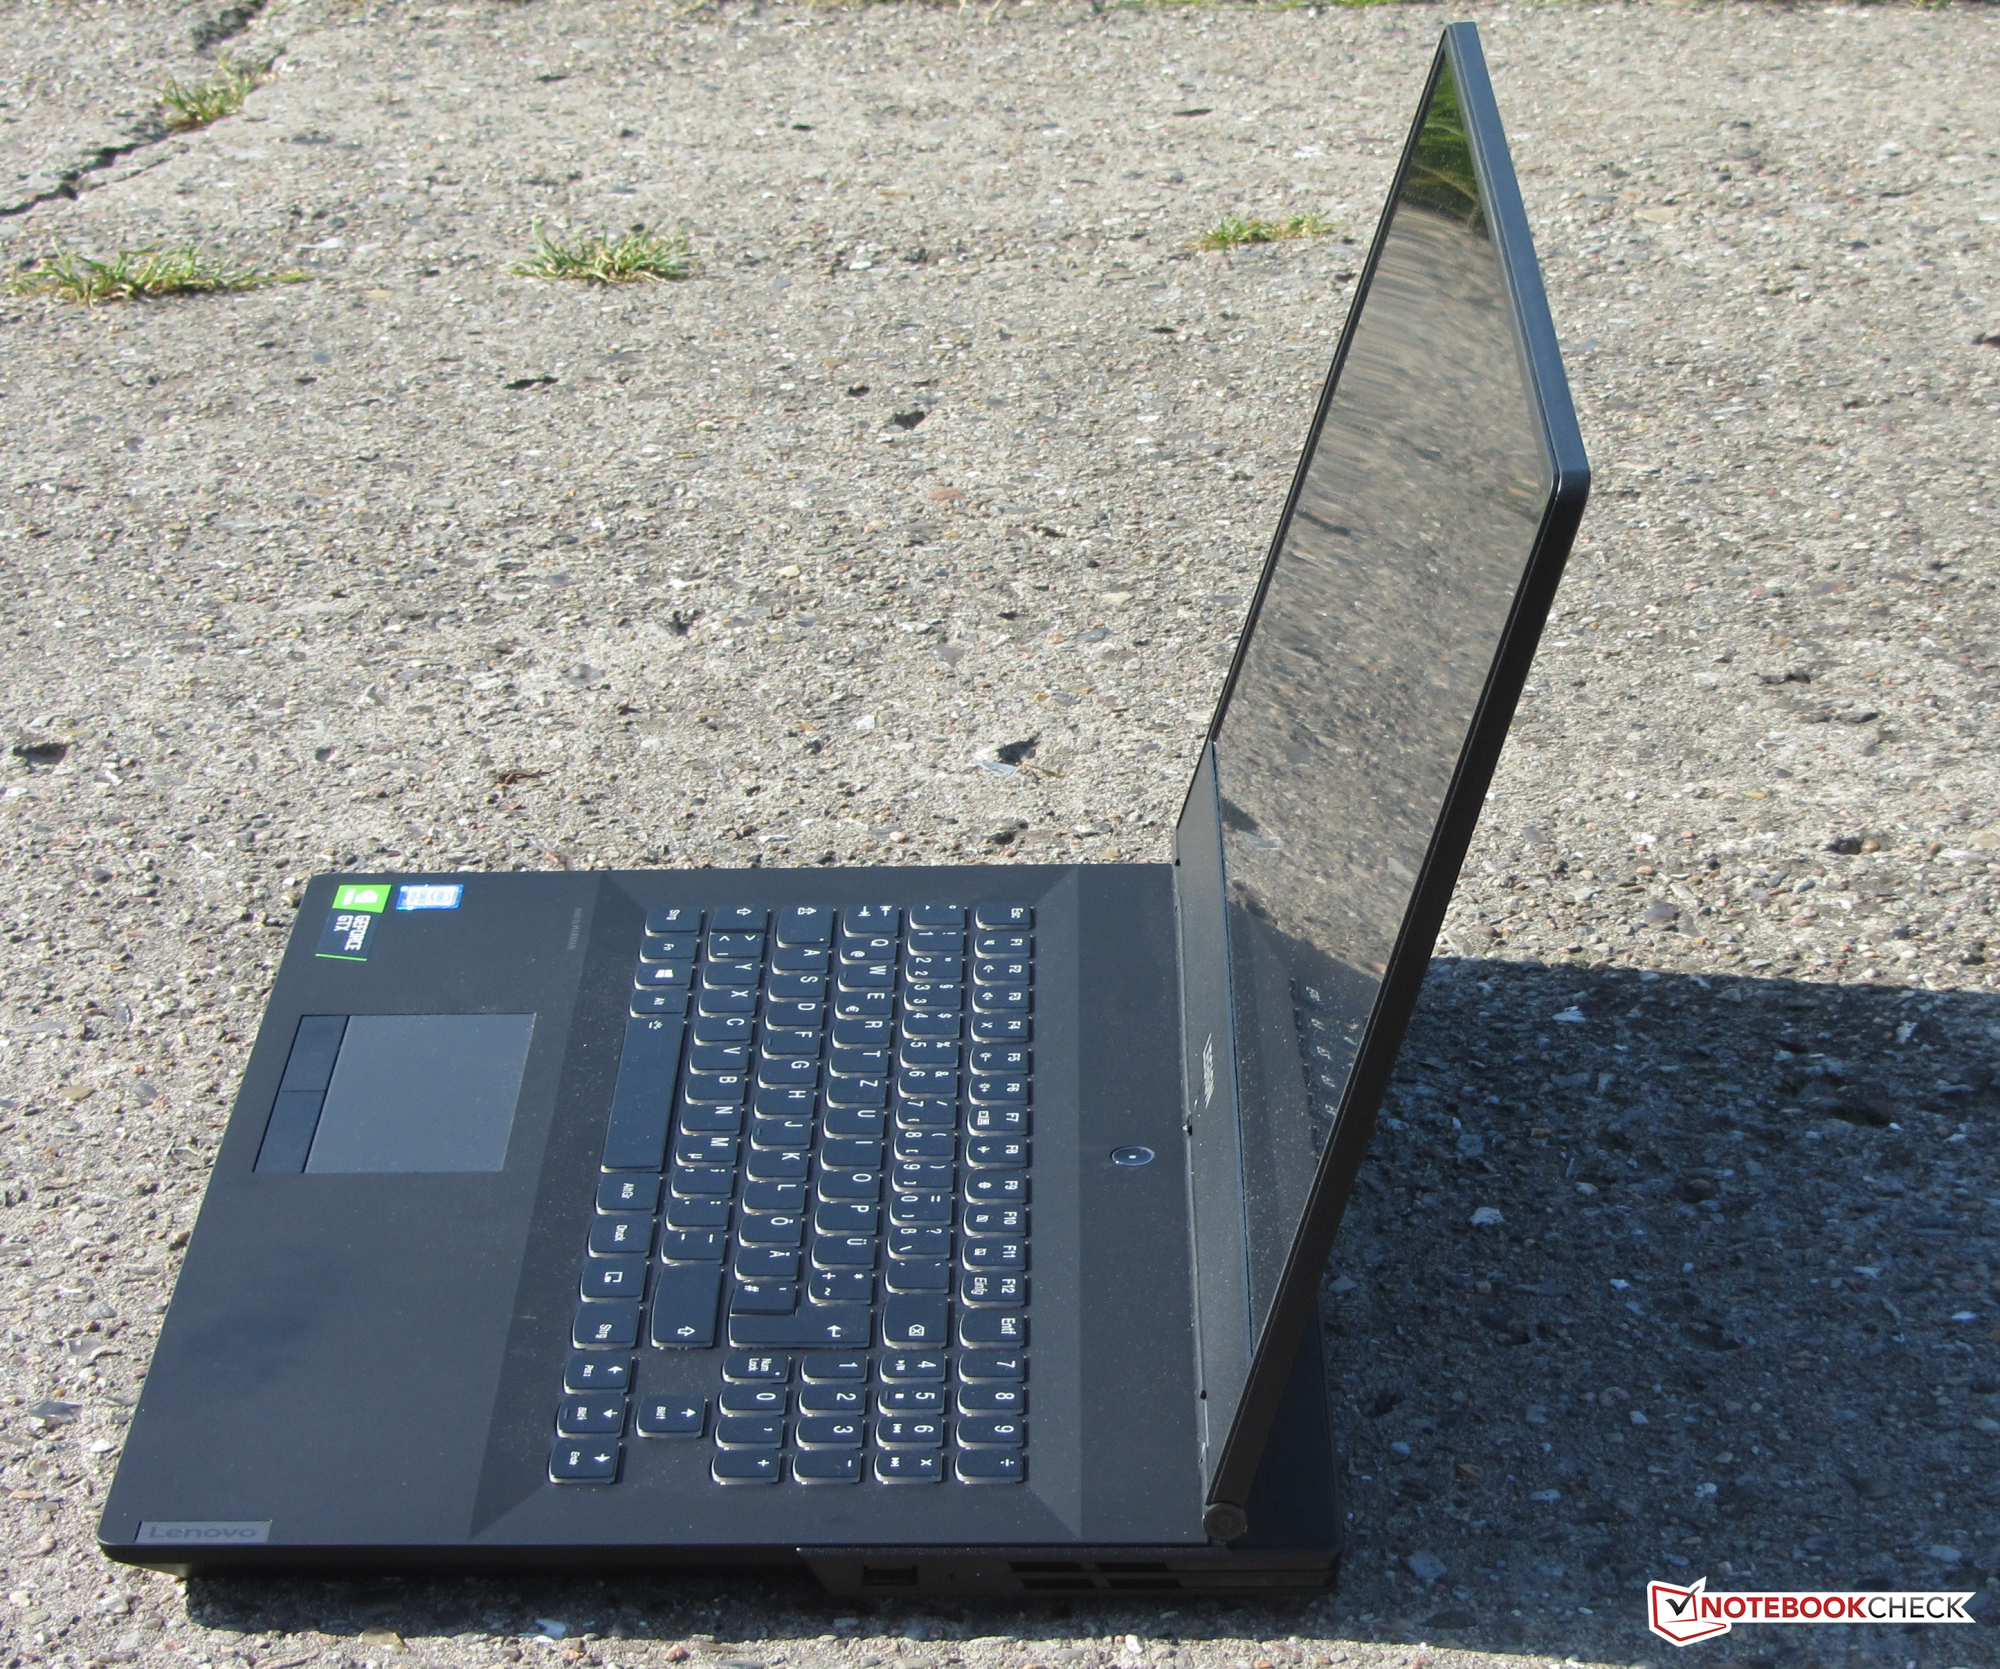
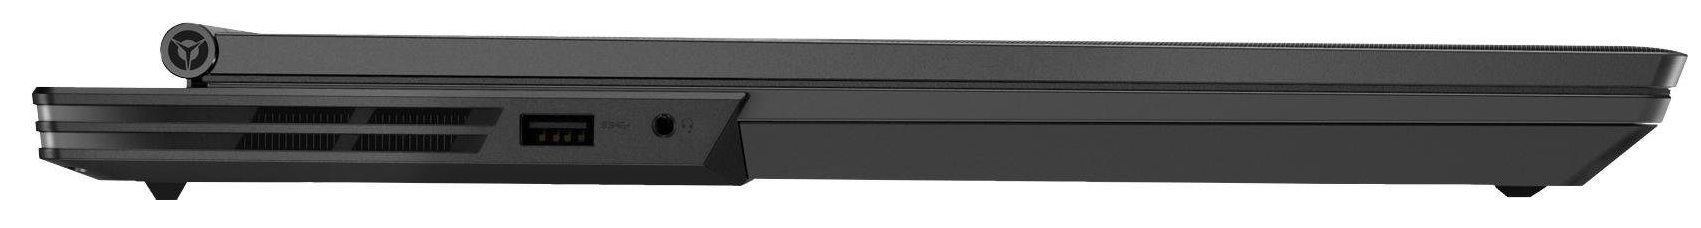
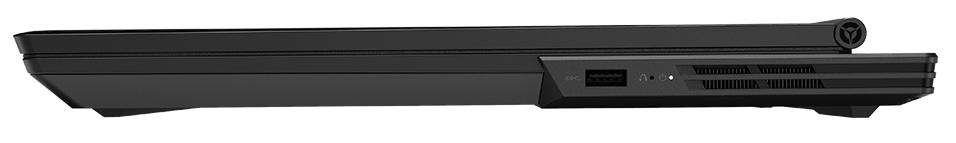
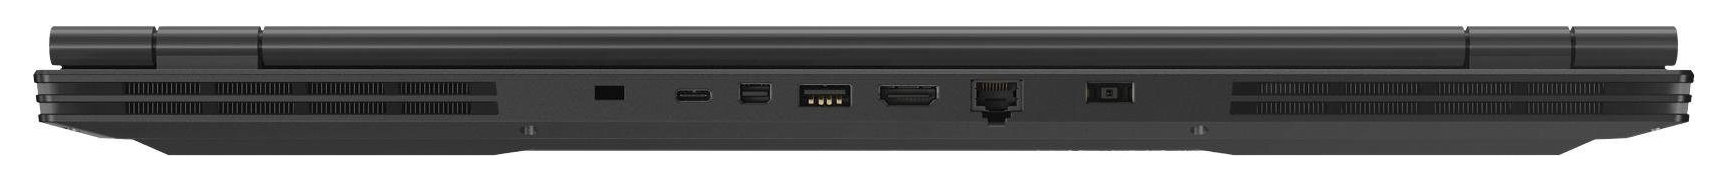
144 Hz IPS屏幕因其响应时间短,视角宽,对比度好和色彩表现出色而在我们的测试中发光。尽管显示器的亮度仍然不错,但考虑到笔记本电脑的价格,它还不够好。 Chiclet键盘非常适合日常使用。良好:键盘背光,尽管没有RGB照明。端口选择相当大。但是,很遗憾没有Thunderbolt 3端口。
电池续航时间并不是什么特别的。但是,可以通过启用更经济的集成GPU来大幅增加它。这可以通过联想预先安装的Vantage软件或BIOS来完成。在我们的Wi-Fi测试中,我们可以将运行时间从3:40小时增加到5:22小时。
Lenovo Legion Y540-17IRH
- 05/14/2020 v7 (old)
Sascha Mölck
Price comparison

