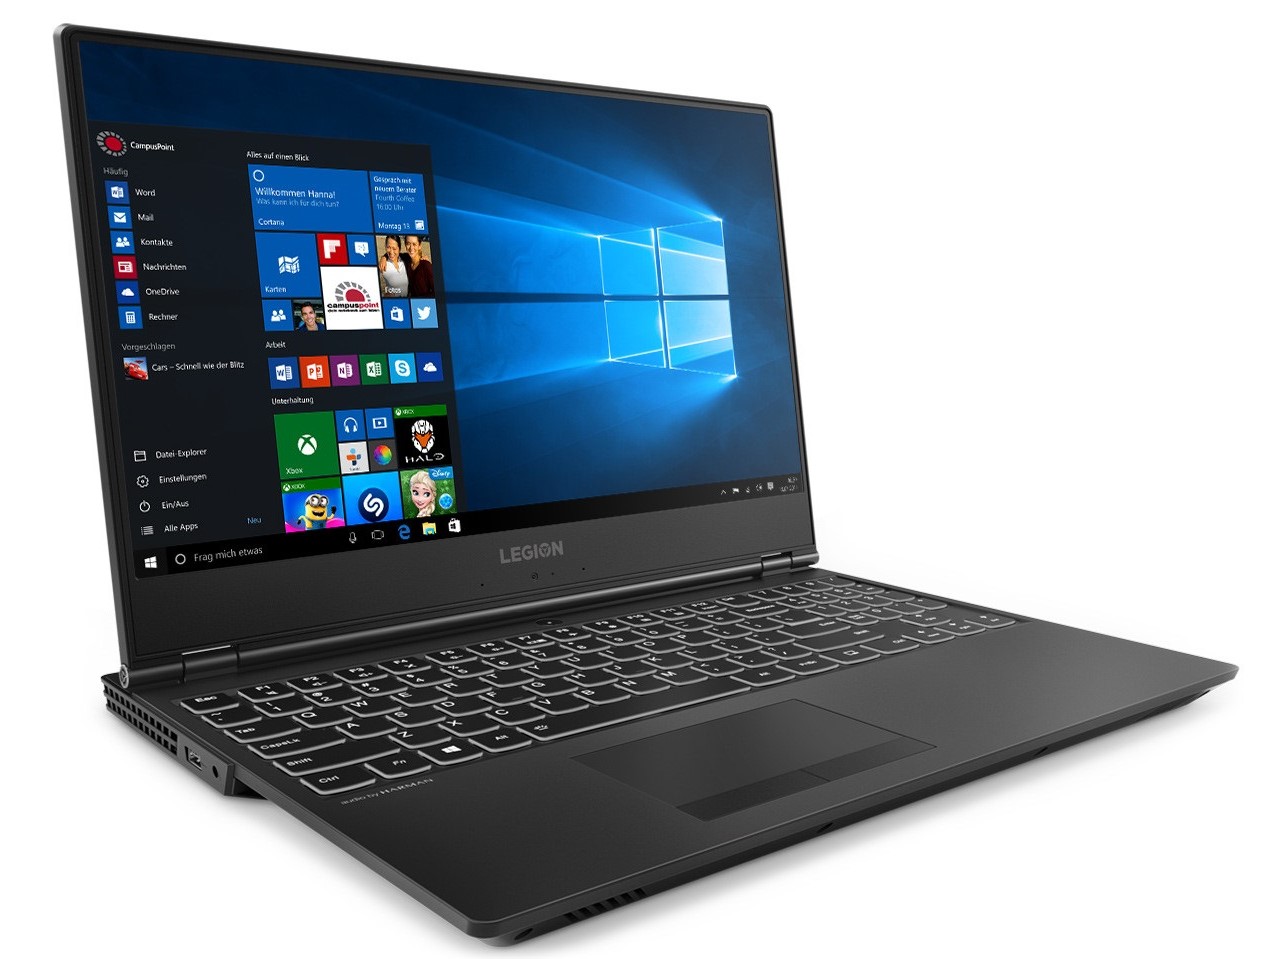
联想Legion Y540-15IRH笔记本电脑评测:配备GeForce GTX 1660 Ti GPU的出色游戏笔记本电脑
| Networking | |
| iperf3 transmit AX12 | |
| Lenovo Legion Y540-15IRH | |
| HP Gaming Pavilion 15-dk0009ng | |
| Lenovo Legion Y540-15IRH-81SX00B2GE | |
| CUK Model Z GK5CQ7Z | |
| Asus Strix GL531GV-PB74 | |
| Lenovo Legion Y530-15ICH | |
| iperf3 receive AX12 | |
| Lenovo Legion Y540-15IRH | |
| Asus Strix GL531GV-PB74 | |
| CUK Model Z GK5CQ7Z | |
| Lenovo Legion Y540-15IRH-81SX00B2GE | |
| HP Gaming Pavilion 15-dk0009ng | |
| Lenovo Legion Y530-15ICH | |
| |||||||||||||||||||||||||
Brightness Distribution: 89 %
Center on Battery: 299 cd/m²
Contrast: 1031:1 (Black: 0.29 cd/m²)
ΔE ColorChecker Calman: 3.7 | ∀{0.5-29.43 Ø4.71}
calibrated: 2
ΔE Greyscale Calman: 4.1 | ∀{0.09-98 Ø4.96}
91.5% sRGB (Argyll 1.6.3 3D)
59.3% AdobeRGB 1998 (Argyll 1.6.3 3D)
65.2% AdobeRGB 1998 (Argyll 3D)
91.7% sRGB (Argyll 3D)
63.6% Display P3 (Argyll 3D)
Gamma: 2.19
CCT: 7166 K
| Lenovo Legion Y540-15IRH-81SX00B2GE BOE 084D, , 1920x1080, 15.6" | Asus Strix GL531GV-PB74 Panda LM156LF-GL02, , 1920x1080, 15.6" | CUK Model Z GK5CQ7Z LG Philips LGD05C0, , 1920x1080, 15.6" | HP Gaming Pavilion 15-dk0009ng LG Philips LGD05FE, , 1920x1080, 15.6" | Lenovo Legion Y530-15ICH LG Display LP156WFG-SPB2, , 1920x1080, 15.6" | Lenovo Legion Y540-15IRH BOE NV156FHM-N4G (BOE084D), , 1920x1080, 15.6" | |
|---|---|---|---|---|---|---|
| Display | -36% | 1% | 2% | -1% | 1% | |
| Display P3 Coverage (%) | 63.6 | 40.13 -37% | 64.5 1% | 64.2 1% | 62.5 -2% | 64.5 1% |
| sRGB Coverage (%) | 91.7 | 60.3 -34% | 93 1% | 95.1 4% | 93 1% | 91.6 0% |
| AdobeRGB 1998 Coverage (%) | 65.2 | 41.48 -36% | 65.7 1% | 65.8 1% | 63.8 -2% | 65.9 1% |
| Response Times | -154% | -28% | -37% | -31% | 9% | |
| Response Time Grey 50% / Grey 80% * (ms) | 8.8 ? | 26 ? -195% | 13.6 ? -55% | 16.4 ? -86% | 15 ? -70% | 8.8 ? -0% |
| Response Time Black / White * (ms) | 12 ? | 25.6 ? -113% | 12 ? -0% | 10.4 ? 13% | 11 ? 8% | 10 ? 17% |
| PWM Frequency (Hz) | ||||||
| Screen | -49% | 1% | 19% | -11% | 1% | |
| Brightness middle (cd/m²) | 299 | 290.1 -3% | 306.8 3% | 345 15% | 305 2% | 284 -5% |
| Brightness (cd/m²) | 290 | 274 -6% | 309 7% | 324 12% | 284 -2% | 277 -4% |
| Brightness Distribution (%) | 89 | 86 -3% | 87 -2% | 86 -3% | 83 -7% | 87 -2% |
| Black Level * (cd/m²) | 0.29 | 0.54 -86% | 0.38 -31% | 0.42 -45% | 0.52 -79% | 0.3 -3% |
| Contrast (:1) | 1031 | 537 -48% | 807 -22% | 821 -20% | 587 -43% | 947 -8% |
| Colorchecker dE 2000 * | 3.7 | 5.16 -39% | 3.16 15% | 1.3 65% | 3.63 2% | 3.53 5% |
| Colorchecker dE 2000 max. * | 7 | 18.09 -158% | 6.05 14% | 2.8 60% | 8.18 -17% | 6.11 13% |
| Colorchecker dE 2000 calibrated * | 2 | 4.35 -117% | 2.4 -20% | 1.1 45% | 1.31 34% | 1.81 9% |
| Greyscale dE 2000 * | 4.1 | 4.4 -7% | 2.3 44% | 1.2 71% | 4.77 -16% | 3.56 13% |
| Gamma | 2.19 100% | 2.1 105% | 2.17 101% | 2.31 95% | 2.54 87% | 2.47 89% |
| CCT | 7166 91% | 7362 88% | 6557 99% | 6476 100% | 7500 87% | 7257 90% |
| Color Space (Percent of AdobeRGB 1998) (%) | 59.3 | 38.1 -36% | 60 1% | 60.5 2% | 59 -1% | 59 -1% |
| Color Space (Percent of sRGB) (%) | 91.5 | 60 -34% | 92.6 1% | 94.9 4% | 93 2% | 91 -1% |
| Total Average (Program / Settings) | -80% /
-60% | -9% /
-3% | -5% /
9% | -14% /
-12% | 4% /
2% |
* ... smaller is better
Display Response Times
| ↔ Response Time Black to White | ||
|---|---|---|
| 12 ms ... rise ↗ and fall ↘ combined | ↗ 6.8 ms rise | 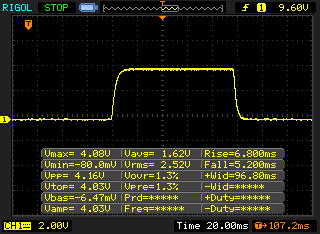 |
| ↘ 5.2 ms fall | ||
| The screen shows good response rates in our tests, but may be too slow for competitive gamers. In comparison, all tested devices range from 0.1 (minimum) to 240 (maximum) ms. » 32 % of all devices are better. This means that the measured response time is better than the average of all tested devices (19.8 ms). | ||
| ↔ Response Time 50% Grey to 80% Grey | ||
| 8.8 ms ... rise ↗ and fall ↘ combined | ↗ 4 ms rise | 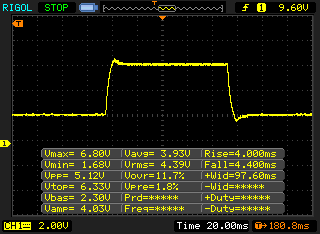 |
| ↘ 4.4 ms fall | ||
| The screen shows fast response rates in our tests and should be suited for gaming. In comparison, all tested devices range from 0.165 (minimum) to 636 (maximum) ms. » 22 % of all devices are better. This means that the measured response time is better than the average of all tested devices (31 ms). | ||
Screen Flickering / PWM (Pulse-Width Modulation)
| Screen flickering / PWM not detected | 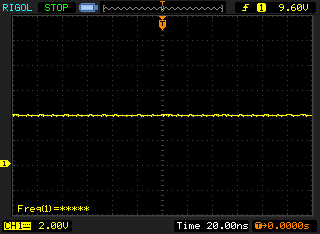 | ||
In comparison: 52 % of all tested devices do not use PWM to dim the display. If PWM was detected, an average of 7757 (minimum: 5 - maximum: 343500) Hz was measured. | |||
| Cinebench R15 | |
| CPU Single 64Bit | |
| Average of class Gaming (188.8 - 350, n=106, last 2 years) | |
| Lenovo Legion Y540-15IRH | |
| CUK Model Z GK5CQ7Z | |
| Lenovo Legion Y540-15IRH-81SX00B2GE | |
| HP Gaming Pavilion 15-dk0009ng | |
| Average Intel Core i7-9750H (170 - 194, n=82) | |
| Asus Strix GL531GV-PB74 | |
| Lenovo Legion Y530-15ICH | |
| CPU Multi 64Bit | |
| Average of class Gaming (1578 - 6330, n=105, last 2 years) | |
| Lenovo Legion Y540-15IRH | |
| CUK Model Z GK5CQ7Z | |
| Asus Strix GL531GV-PB74 | |
| Lenovo Legion Y530-15ICH | |
| Average Intel Core i7-9750H (952 - 1306, n=85) | |
| Lenovo Legion Y540-15IRH-81SX00B2GE | |
| HP Gaming Pavilion 15-dk0009ng | |
| PCMark 8 | |
| Home Score Accelerated v2 | |
| Average of class Gaming (n=1last 2 years) | |
| Lenovo Legion Y540-15IRH | |
| Average Intel Core i7-9750H, NVIDIA GeForce GTX 1660 Ti Mobile (4074 - 5217, n=11) | |
| Lenovo Legion Y540-15IRH-81SX00B2GE | |
| CUK Model Z GK5CQ7Z | |
| Lenovo Legion Y530-15ICH | |
| HP Gaming Pavilion 15-dk0009ng | |
| Asus Strix GL531GV-PB74 | |
| Work Score Accelerated v2 | |
| Lenovo Legion Y540-15IRH | |
| CUK Model Z GK5CQ7Z | |
| HP Gaming Pavilion 15-dk0009ng | |
| Lenovo Legion Y530-15ICH | |
| Average Intel Core i7-9750H, NVIDIA GeForce GTX 1660 Ti Mobile (5041 - 5913, n=12) | |
| Asus Strix GL531GV-PB74 | |
| Lenovo Legion Y540-15IRH-81SX00B2GE | |
| Average of class Gaming (n=1last 2 years) | |
| PCMark 8 Home Score Accelerated v2 | 4507 points | |
| PCMark 8 Work Score Accelerated v2 | 5041 points | |
| PCMark 10 Score | 5716 points | |
Help | ||
| Lenovo Legion Y540-15IRH-81SX00B2GE WDC PC SN720 SDAPNTW-512G | Asus Strix GL531GV-PB74 Intel SSD 660p SSDPEKNW512G8 | CUK Model Z GK5CQ7Z Intel SSD 660p 2TB SSDPEKNW020T8 | HP Gaming Pavilion 15-dk0009ng Samsung SSD PM981 MZVLB256HAHQ | Lenovo Legion Y530-15ICH Samsung SSD PM981 MZVLB256HAHQ | Lenovo Legion Y540-15IRH Samsung PM981a MZVLB1T0HBLR | Average WDC PC SN720 SDAPNTW-512G | |
|---|---|---|---|---|---|---|---|
| CrystalDiskMark 5.2 / 6 | -16% | 12% | -18% | -16% | 11% | -4% | |
| Write 4K (MB/s) | 158.8 | 121.9 -23% | 134.4 -15% | 100 -37% | 108.9 -31% | 131.7 -17% | 110 ? -31% |
| Read 4K (MB/s) | 29.11 | 53.6 84% | 56.8 95% | 31.39 8% | 40.23 38% | 48.06 65% | 36.9 ? 27% |
| Write Seq (MB/s) | 1584 | 967 -39% | 1742 10% | 1308 -17% | 1390 -12% | 1234 -22% | 1976 ? 25% |
| Read Seq (MB/s) | 1694 | 1461 -14% | 1687 0% | 1083 -36% | 964 -43% | 973 -43% | 1710 ? 1% |
| Write 4K Q32T1 (MB/s) | 536 | 431.4 -20% | 535 0% | 362.9 -32% | 314.2 -41% | 576 7% | 339 ? -37% |
| Read 4K Q32T1 (MB/s) | 363.9 | 337.3 -7% | 639 76% | 425.7 17% | 369.2 1% | 655 80% | 417 ? 15% |
| Write Seq Q32T1 (MB/s) | 2536 | 972 -62% | 1903 -25% | 1411 -44% | 1506 -41% | 3012 19% | 2218 ? -13% |
| Read Seq Q32T1 (MB/s) | 3458 | 1727 -50% | 1849 -47% | 3240 -6% | 3446 0% | 3481 1% | 2940 ? -15% |
| AS SSD | -44% | -26% | -43% | -45% | 13% | -22% | |
| Seq Read (MB/s) | 2927 | 1280 -56% | 1283 -56% | 2088 -29% | 1808 -38% | 1954 -33% | 2544 ? -13% |
| Seq Write (MB/s) | 2149 | 905 -58% | 1730 -19% | 1347 -37% | 1429 -34% | 2484 16% | 2034 ? -5% |
| 4K Read (MB/s) | 42.43 | 48.73 15% | 49.89 18% | 36.14 -15% | 46.1 9% | 56.7 34% | 36.5 ? -14% |
| 4K Write (MB/s) | 147.1 | 107 -27% | 110.1 -25% | 96.5 -34% | 97 -34% | 124.3 -15% | 110.8 ? -25% |
| 4K-64 Read (MB/s) | 1286 | 321.1 -75% | 904 -30% | 565 -56% | 536 -58% | 1599 24% | 1112 ? -14% |
| 4K-64 Write (MB/s) | 1432 | 761 -47% | 792 -45% | 588 -59% | 273.6 -81% | 1883 31% | 1222 ? -15% |
| Access Time Read * (ms) | 0.065 | 0.058 11% | 0.036 45% | 0.093 -43% | 0.085 -31% | 0.039 40% | 0.0965 ? -48% |
| Access Time Write * (ms) | 0.026 | 0.046 -77% | 0.042 -62% | 0.038 -46% | 0.038 -46% | 0.03 -15% | 0.04212 ? -62% |
| Score Read (Points) | 1621 | 498 -69% | 1082 -33% | 810 -50% | 763 -53% | 1851 14% | 1403 ? -13% |
| Score Write (Points) | 1794 | 958 -47% | 1075 -40% | 819 -54% | 514 -71% | 2256 26% | 1536 ? -14% |
| Score Total (Points) | 4208 | 1711 -59% | 2745 -35% | 2014 -52% | 1663 -60% | 5087 21% | 3633 ? -14% |
| Copy ISO MB/s (MB/s) | 1519 | 3089 | 1043 | 1506 ? | |||
| Copy Program MB/s (MB/s) | 749 | 549 | 371.7 | 410 ? | |||
| Copy Game MB/s (MB/s) | 943 | 1171 | 399.9 | 894 ? | |||
| Total Average (Program / Settings) | -30% /
-33% | -7% /
-10% | -31% /
-33% | -31% /
-33% | 12% /
12% | -13% /
-14% |
* ... smaller is better

| 3DMark 11 - 1280x720 Performance GPU | |
| Average of class Gaming (21841 - 80022, n=104, last 2 years) | |
| CUK Model Z GK5CQ7Z | |
| Asus Strix GL531GV-PB74 | |
| Average NVIDIA GeForce GTX 1660 Ti Mobile (18610 - 22670, n=24) | |
| Lenovo Legion Y540-15IRH-81SX00B2GE | |
| Lenovo Legion Y540-15IRH | |
| HP Gaming Pavilion 15-dk0009ng | |
| Lenovo Legion Y530-15ICH | |
| 3DMark | |
| 1280x720 Cloud Gate Standard Graphics | |
| Average of class Gaming (86886 - 223650, n=60, last 2 years) | |
| CUK Model Z GK5CQ7Z | |
| Asus Strix GL531GV-PB74 | |
| Lenovo Legion Y540-15IRH | |
| Average NVIDIA GeForce GTX 1660 Ti Mobile (59839 - 104780, n=18) | |
| Lenovo Legion Y540-15IRH-81SX00B2GE | |
| HP Gaming Pavilion 15-dk0009ng | |
| Lenovo Legion Y530-15ICH | |
| 1920x1080 Fire Strike Graphics | |
| Average of class Gaming (12242 - 62849, n=115, last 2 years) | |
| CUK Model Z GK5CQ7Z | |
| Asus Strix GL531GV-PB74 | |
| Lenovo Legion Y540-15IRH | |
| Average NVIDIA GeForce GTX 1660 Ti Mobile (14186 - 16488, n=24) | |
| Lenovo Legion Y540-15IRH-81SX00B2GE | |
| HP Gaming Pavilion 15-dk0009ng | |
| Lenovo Legion Y530-15ICH | |
| 2560x1440 Time Spy Graphics | |
| Average of class Gaming (5012 - 26212, n=115, last 2 years) | |
| CUK Model Z GK5CQ7Z | |
| Asus Strix GL531GV-PB74 | |
| Average NVIDIA GeForce GTX 1660 Ti Mobile (5335 - 6123, n=22) | |
| HP Gaming Pavilion 15-dk0009ng | |
| 3DMark 11 Performance | 17291 points | |
| 3DMark Cloud Gate Standard Score | 32884 points | |
| 3DMark Fire Strike Score | 12884 points | |
Help | ||
| The Witcher 3 - 1920x1080 Ultra Graphics & Postprocessing (HBAO+) | |
| Average of class Gaming (104.7 - 240, n=7, last 2 years) | |
| Asus Strix GL531GV-PB74 | |
| CUK Model Z GK5CQ7Z | |
| Lenovo Legion Y540-15IRH | |
| Average NVIDIA GeForce GTX 1660 Ti Mobile (51.6 - 65.1, n=21) | |
| HP Gaming Pavilion 15-dk0009ng | |
| Lenovo Legion Y540-15IRH-81SX00B2GE | |
| Lenovo Legion Y530-15ICH | |
| Anno 1800 - 1920x1080 Ultra Graphics Quality (DX11) | |
| Average of class Gaming (n=1last 2 years) | |
| Lenovo Legion Y540-15IRH-81SX00B2GE | |
| Average NVIDIA GeForce GTX 1660 Ti Mobile (31.1 - 54, n=4) | |
| HP Gaming Pavilion 15-dk0009ng | |
| BioShock Infinite | |
| 1920x1080 Ultra Preset, DX11 (DDOF) | |
| CUK Model Z GK5CQ7Z | |
| Asus Strix GL531GV-PB74 | |
| Lenovo Legion Y540-15IRH-81SX00B2GE | |
| Average NVIDIA GeForce GTX 1660 Ti Mobile (121.6 - 144.2, n=14) | |
| HP Gaming Pavilion 15-dk0009ng | |
| Lenovo Legion Y530-15ICH | |
| 1366x768 High Preset | |
| Asus Strix GL531GV-PB74 | |
| CUK Model Z GK5CQ7Z | |
| Average NVIDIA GeForce GTX 1660 Ti Mobile (202 - 275, n=13) | |
| HP Gaming Pavilion 15-dk0009ng | |
| Lenovo Legion Y530-15ICH | |
| low | med. | high | ultra | 4K | |
|---|---|---|---|---|---|
| BioShock Infinite (2013) | 138 | ||||
| The Witcher 3 (2015) | 53.1 | ||||
| Dota 2 Reborn (2015) | 137.2 | 130.2 | 121.3 | 118.2 | 85 |
| X-Plane 11.11 (2018) | 117 | 106 | 85 | ||
| Anno 1800 (2019) | 54 |
Noise level
| Idle |
| 29.3 / 29.3 / 29.3 dB(A) |
| Load |
| 35.7 / 45.6 dB(A) |
 | ||
30 dB silent 40 dB(A) audible 50 dB(A) loud |
||
min: | ||
(±) The maximum temperature on the upper side is 42.7 °C / 109 F, compared to the average of 40.4 °C / 105 F, ranging from 21.2 to 68.8 °C for the class Gaming.
(-) The bottom heats up to a maximum of 52.7 °C / 127 F, compared to the average of 43.2 °C / 110 F
(+) In idle usage, the average temperature for the upper side is 29.6 °C / 85 F, compared to the device average of 33.9 °C / 93 F.
(±) Playing The Witcher 3, the average temperature for the upper side is 35.2 °C / 95 F, compared to the device average of 33.9 °C / 93 F.
(+) The palmrests and touchpad are reaching skin temperature as a maximum (34.8 °C / 94.6 F) and are therefore not hot.
(-) The average temperature of the palmrest area of similar devices was 28.8 °C / 83.8 F (-6 °C / -10.8 F).
Lenovo Legion Y540-15IRH-81SX00B2GE audio analysis
(±) | speaker loudness is average but good (77.4 dB)
Bass 100 - 315 Hz
(-) | nearly no bass - on average 17.7% lower than median
(±) | linearity of bass is average (11.6% delta to prev. frequency)
Mids 400 - 2000 Hz
(+) | balanced mids - only 3.7% away from median
(+) | mids are linear (4.5% delta to prev. frequency)
Highs 2 - 16 kHz
(+) | balanced highs - only 3.3% away from median
(+) | highs are linear (5.9% delta to prev. frequency)
Overall 100 - 16.000 Hz
(±) | linearity of overall sound is average (18.1% difference to median)
Compared to same class
» 57% of all tested devices in this class were better, 8% similar, 35% worse
» The best had a delta of 6%, average was 18%, worst was 132%
Compared to all devices tested
» 39% of all tested devices were better, 8% similar, 54% worse
» The best had a delta of 4%, average was 23%, worst was 134%
Apple MacBook 12 (Early 2016) 1.1 GHz audio analysis
(+) | speakers can play relatively loud (83.6 dB)
Bass 100 - 315 Hz
(±) | reduced bass - on average 11.3% lower than median
(±) | linearity of bass is average (14.2% delta to prev. frequency)
Mids 400 - 2000 Hz
(+) | balanced mids - only 2.4% away from median
(+) | mids are linear (5.5% delta to prev. frequency)
Highs 2 - 16 kHz
(+) | balanced highs - only 2% away from median
(+) | highs are linear (4.5% delta to prev. frequency)
Overall 100 - 16.000 Hz
(+) | overall sound is linear (10.2% difference to median)
Compared to same class
» 7% of all tested devices in this class were better, 2% similar, 90% worse
» The best had a delta of 5%, average was 18%, worst was 53%
Compared to all devices tested
» 5% of all tested devices were better, 1% similar, 94% worse
» The best had a delta of 4%, average was 23%, worst was 134%
| Off / Standby | |
| Idle | |
| Load |
|
Key:
min: | |
| Lenovo Legion Y540-15IRH-81SX00B2GE i7-9750H, GeForce GTX 1660 Ti Mobile, WDC PC SN720 SDAPNTW-512G, IPS, 1920x1080, 15.6" | Asus Strix GL531GV-PB74 i7-9750H, GeForce RTX 2060 Mobile, Intel SSD 660p SSDPEKNW512G8, IPS, 1920x1080, 15.6" | CUK Model Z GK5CQ7Z i7-9750H, GeForce RTX 2070 Max-Q, Intel SSD 660p 2TB SSDPEKNW020T8, IPS, 1920x1080, 15.6" | HP Gaming Pavilion 15-dk0009ng i7-9750H, GeForce GTX 1660 Ti Max-Q, Samsung SSD PM981 MZVLB256HAHQ, IPS, 1920x1080, 15.6" | Lenovo Legion Y530-15ICH i7-8750H, GeForce GTX 1060 Mobile, Samsung SSD PM981 MZVLB256HAHQ, IPS, 1920x1080, 15.6" | Lenovo Legion Y540-15IRH i7-9750H, GeForce RTX 2060 Mobile, Samsung PM981a MZVLB1T0HBLR, IPS, 1920x1080, 15.6" | Average NVIDIA GeForce GTX 1660 Ti Mobile | Average of class Gaming | |
|---|---|---|---|---|---|---|---|---|
| Power Consumption | -13% | -34% | 24% | 22% | -14% | -3% | -15% | |
| Idle Minimum * (Watt) | 14.5 | 10.9 25% | 23.5 -62% | 6.8 53% | 7.3 50% | 15 -3% | 12.4 ? 14% | 13 ? 10% |
| Idle Average * (Watt) | 18.5 | 14.7 21% | 28 -51% | 10.7 42% | 11.1 40% | 20 -8% | 18 ? 3% | 19 ? -3% |
| Idle Maximum * (Watt) | 20 | 32.4 -62% | 32 -60% | 12.5 37% | 12.6 37% | 33 -65% | 25.3 ? -27% | 24.6 ? -23% |
| Load Average * (Watt) | 81.6 | 121.9 -49% | 102.4 -25% | 87.2 -7% | 109 -34% | 88 -8% | 93.5 ? -15% | 110.7 ? -36% |
| Witcher 3 ultra * (Watt) | 132 | 143.5 -9% | 142.8 -8% | 121 8% | 128 3% | |||
| Load Maximum * (Watt) | 208.1 | 209.6 -1% | 209 -0% | 191.4 8% | 168 19% | 213 -2% | 191.9 ? 8% | 259 ? -24% |
* ... smaller is better
| Lenovo Legion Y540-15IRH-81SX00B2GE i7-9750H, GeForce GTX 1660 Ti Mobile, 57 Wh | Asus Strix GL531GV-PB74 i7-9750H, GeForce RTX 2060 Mobile, 66 Wh | CUK Model Z GK5CQ7Z i7-9750H, GeForce RTX 2070 Max-Q, 46.74 Wh | HP Gaming Pavilion 15-dk0009ng i7-9750H, GeForce GTX 1660 Ti Max-Q, 52.5 Wh | Lenovo Legion Y530-15ICH i7-8750H, GeForce GTX 1060 Mobile, 52 Wh | Lenovo Legion Y540-15IRH i7-9750H, GeForce RTX 2060 Mobile, 57 Wh | Average of class Gaming | |
|---|---|---|---|---|---|---|---|
| Battery runtime | -21% | 25% | 72% | 32% | 5% | 106% | |
| Reader / Idle (h) | 4 | 8.7 117% | 8.3 108% | 3.9 -2% | 8.27 ? 107% | ||
| WiFi v1.3 (h) | 2.4 | 1.9 -21% | 3 25% | 4.8 100% | 3.8 58% | 3.2 33% | 7.11 ? 196% |
| Load (h) | 1.3 | 1.3 0% | 0.4 -69% | 1.1 -15% | 1.502 ? 16% | ||
| Witcher 3 ultra (h) | 1 |
Pros
Cons
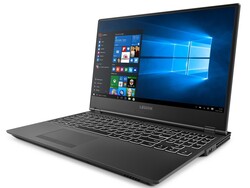
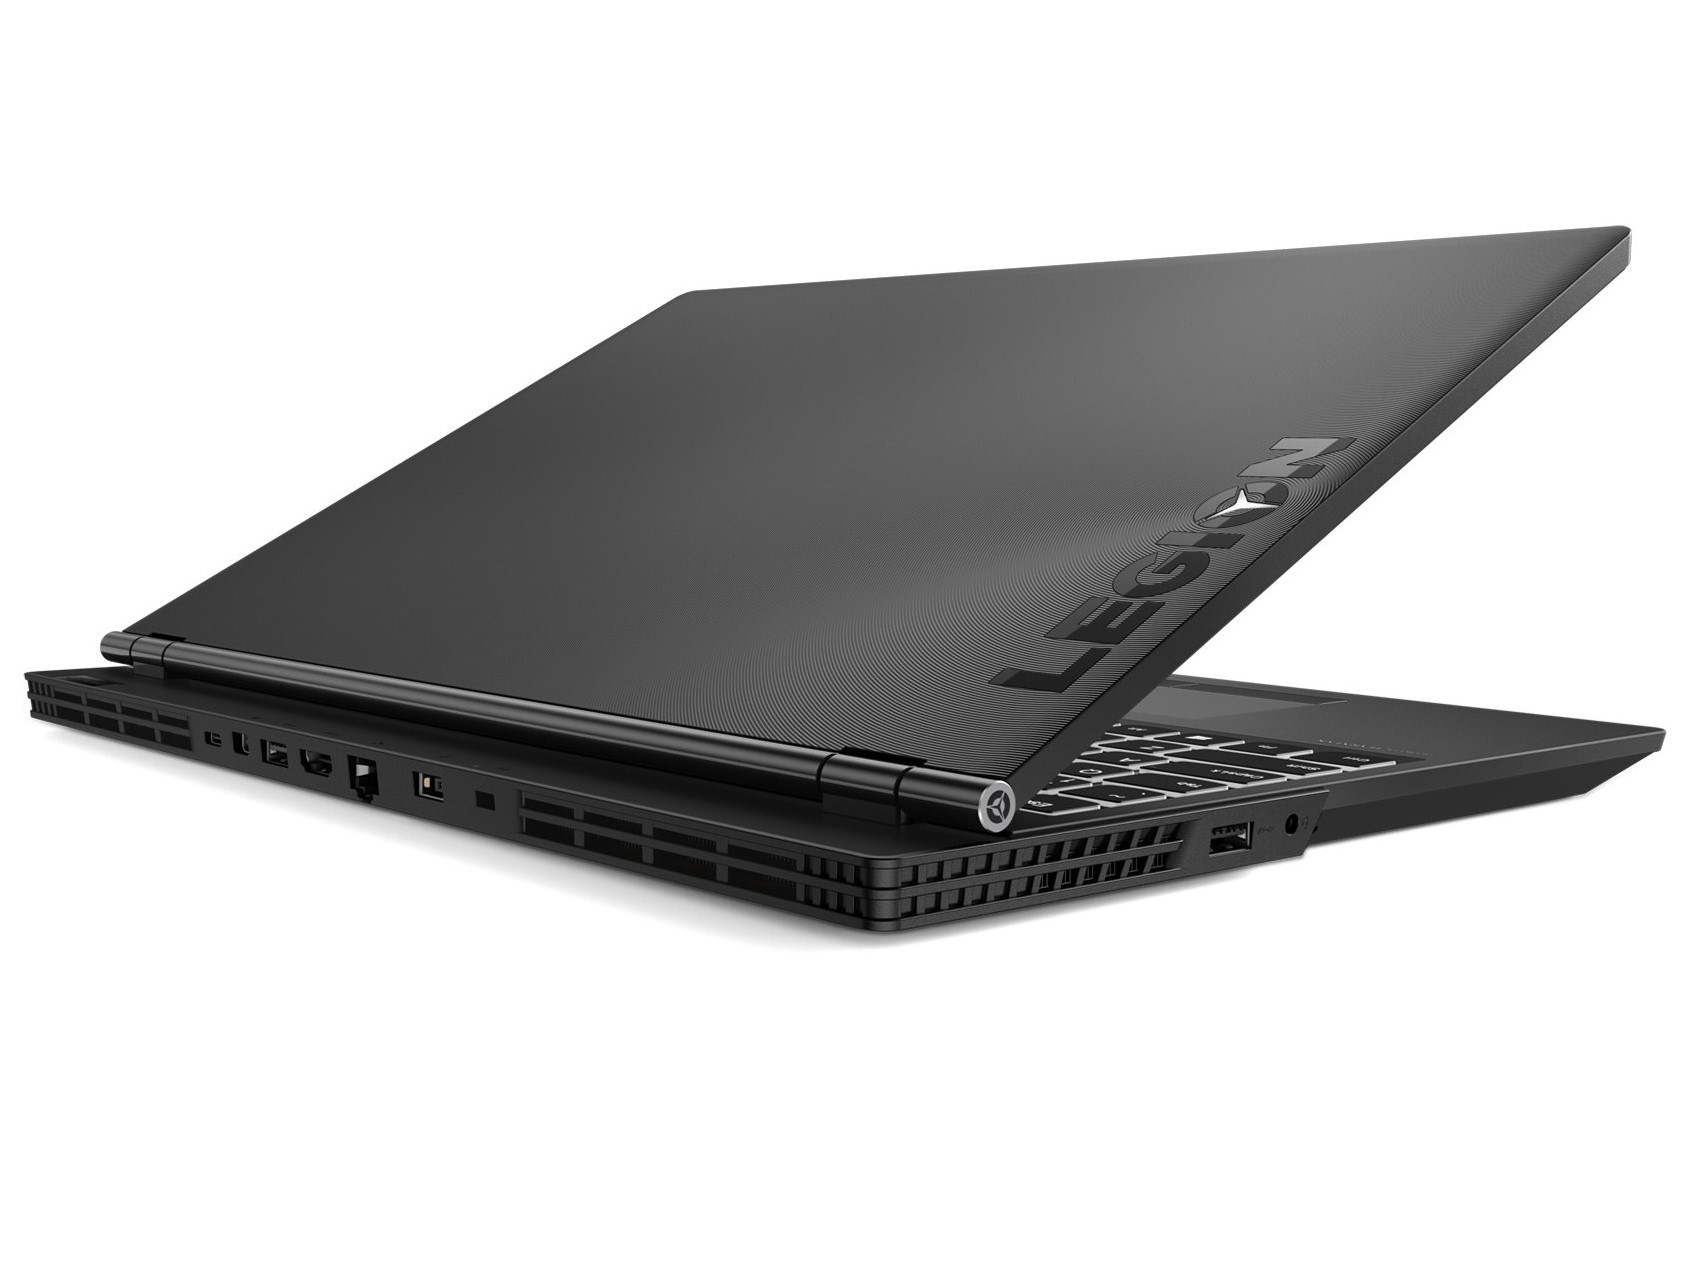
尽管改用了GeForce GTX 1660 Ti GPU,联想Legion Y540-15IRH仍然是一款功能强大的游戏笔记本电脑,可以在1080p的分辨率下运行所有现代的3A大作。虽然不像RTX 2060那样支持DLSS或光线追踪,但后者却没有足够的性能来充分利用这些新技术,因此,与RTX 2060相比,选择GTX 1660 Ti并没有使您错过太多。
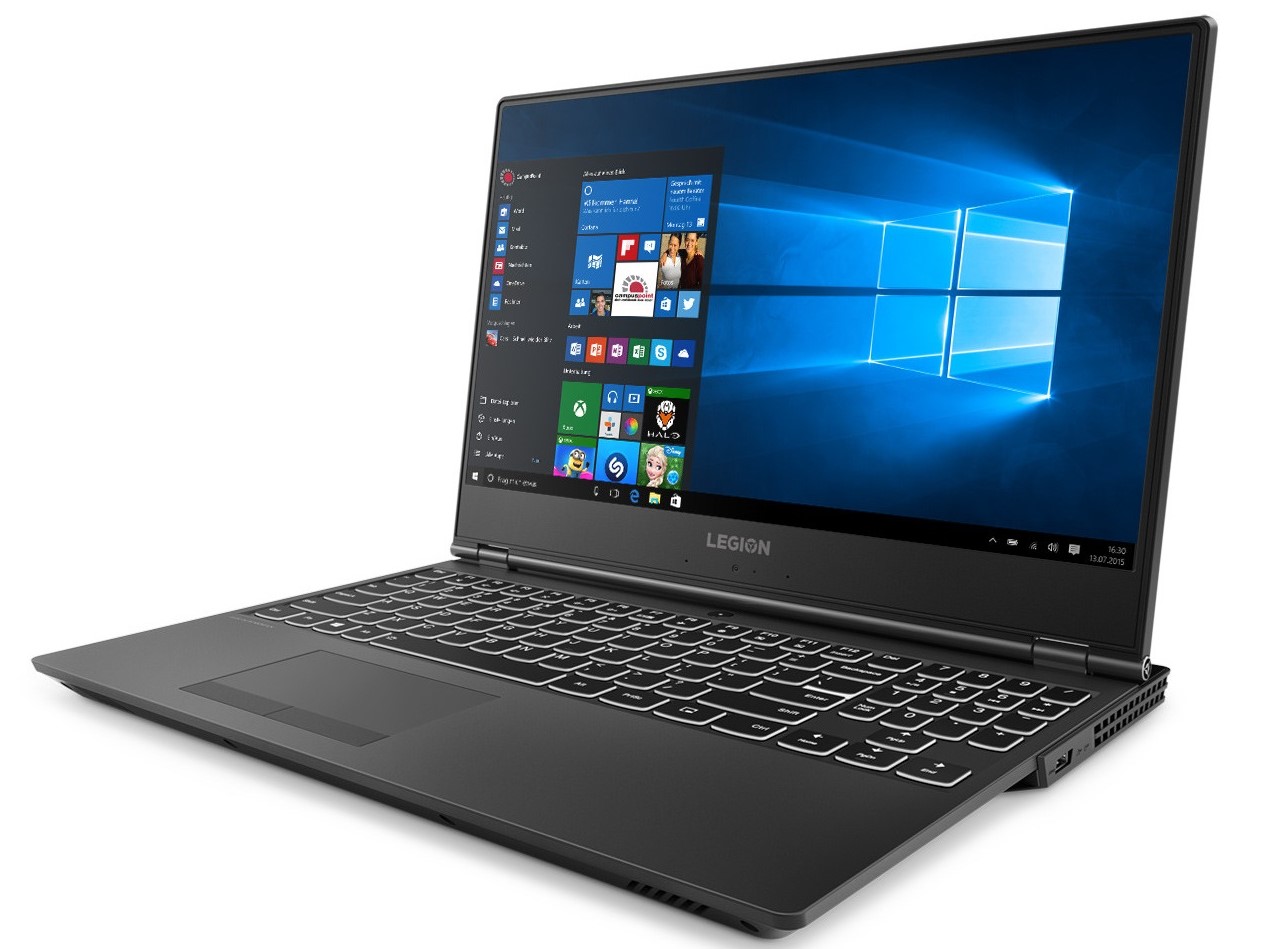
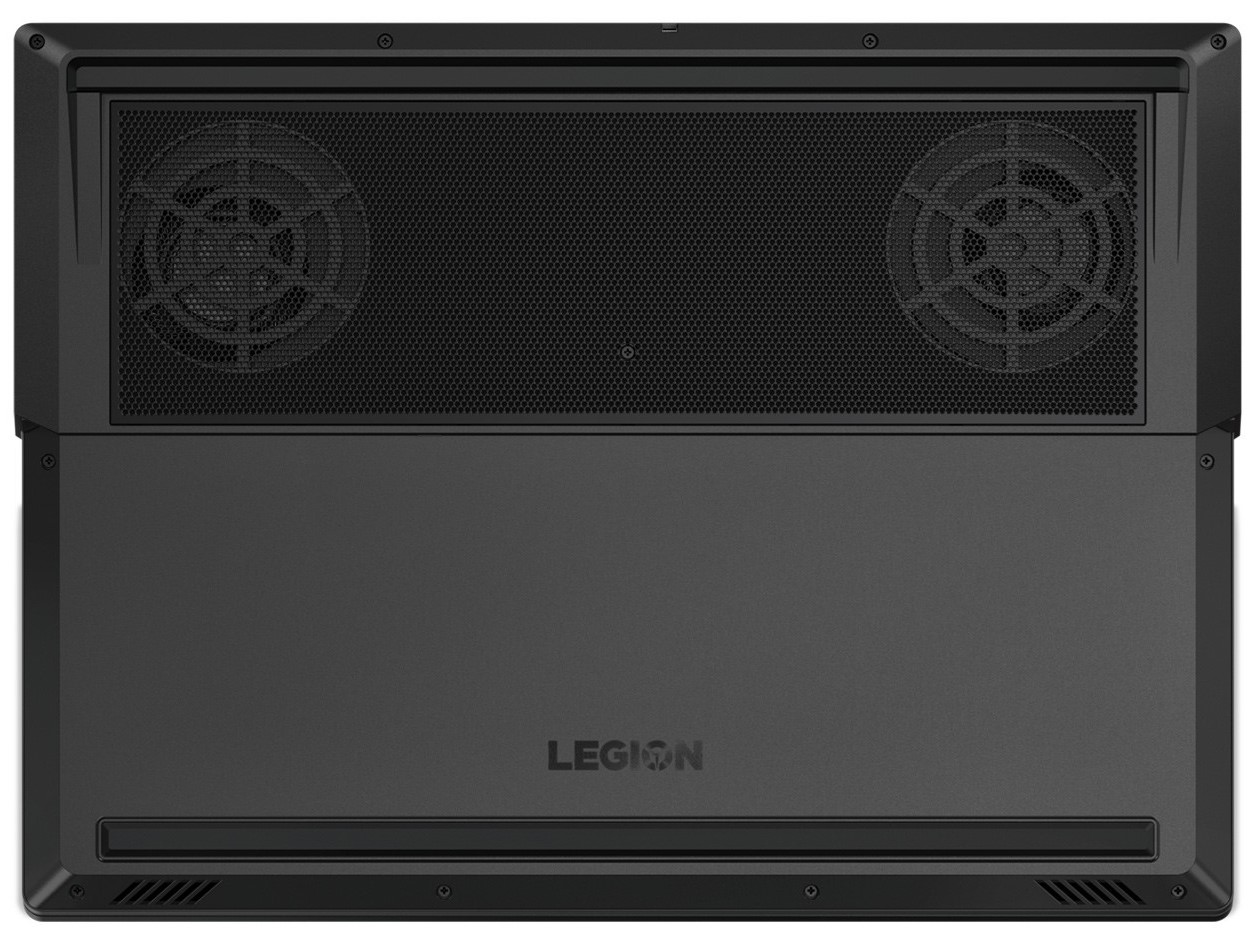
简而言之,Y540-15IRH是一款中端游戏笔记本电脑,得益于其出色的散热系统,它可以长期保持其性能。该设备还具有良好的维护性,如果您需要更多存储空间,则可以使用2.5英寸硬盘槽。
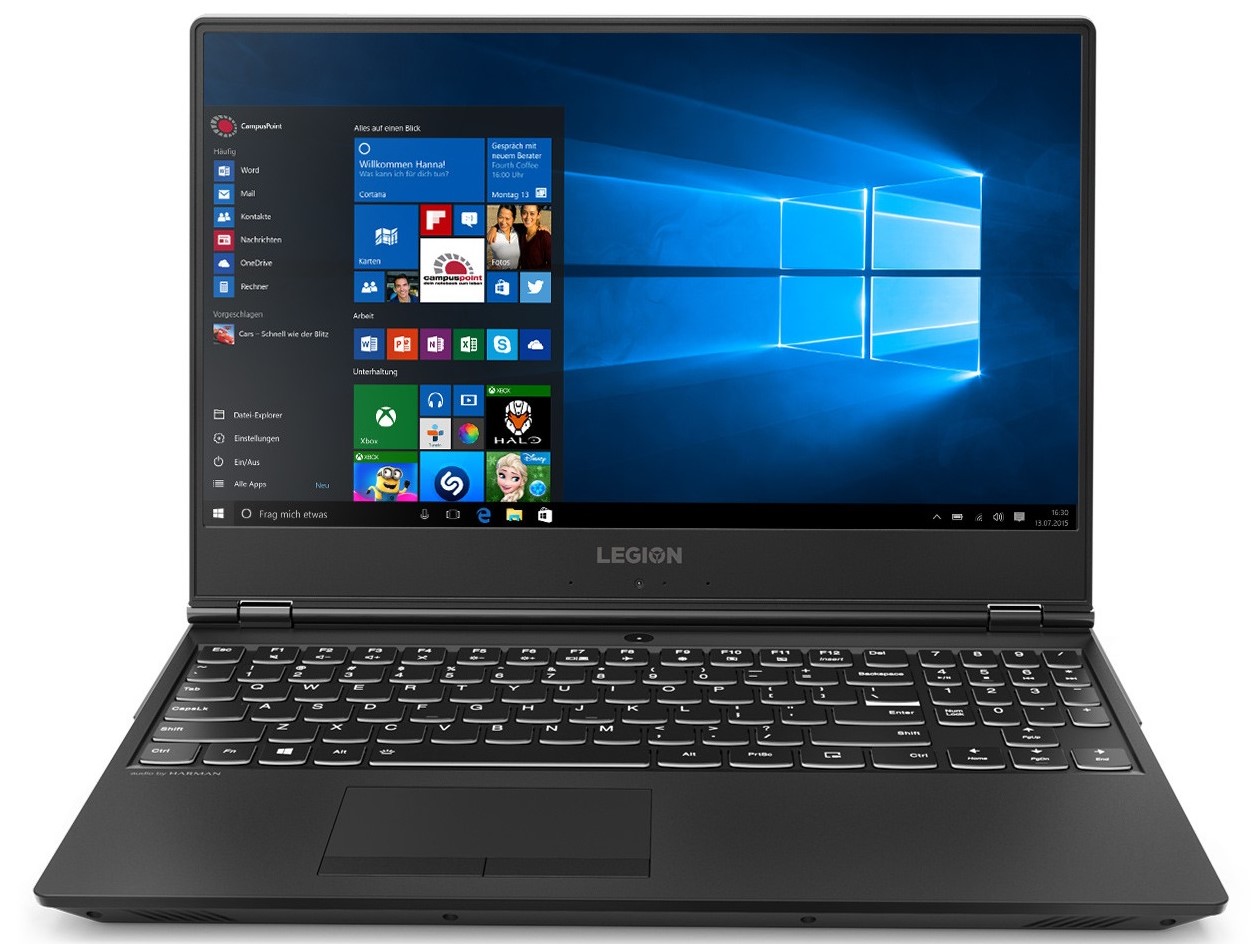
尽管没有RTX显卡,Lenovo Legion Y540-15IRH-81SX00B2GE还是一款功能强大的游戏笔记本电脑。
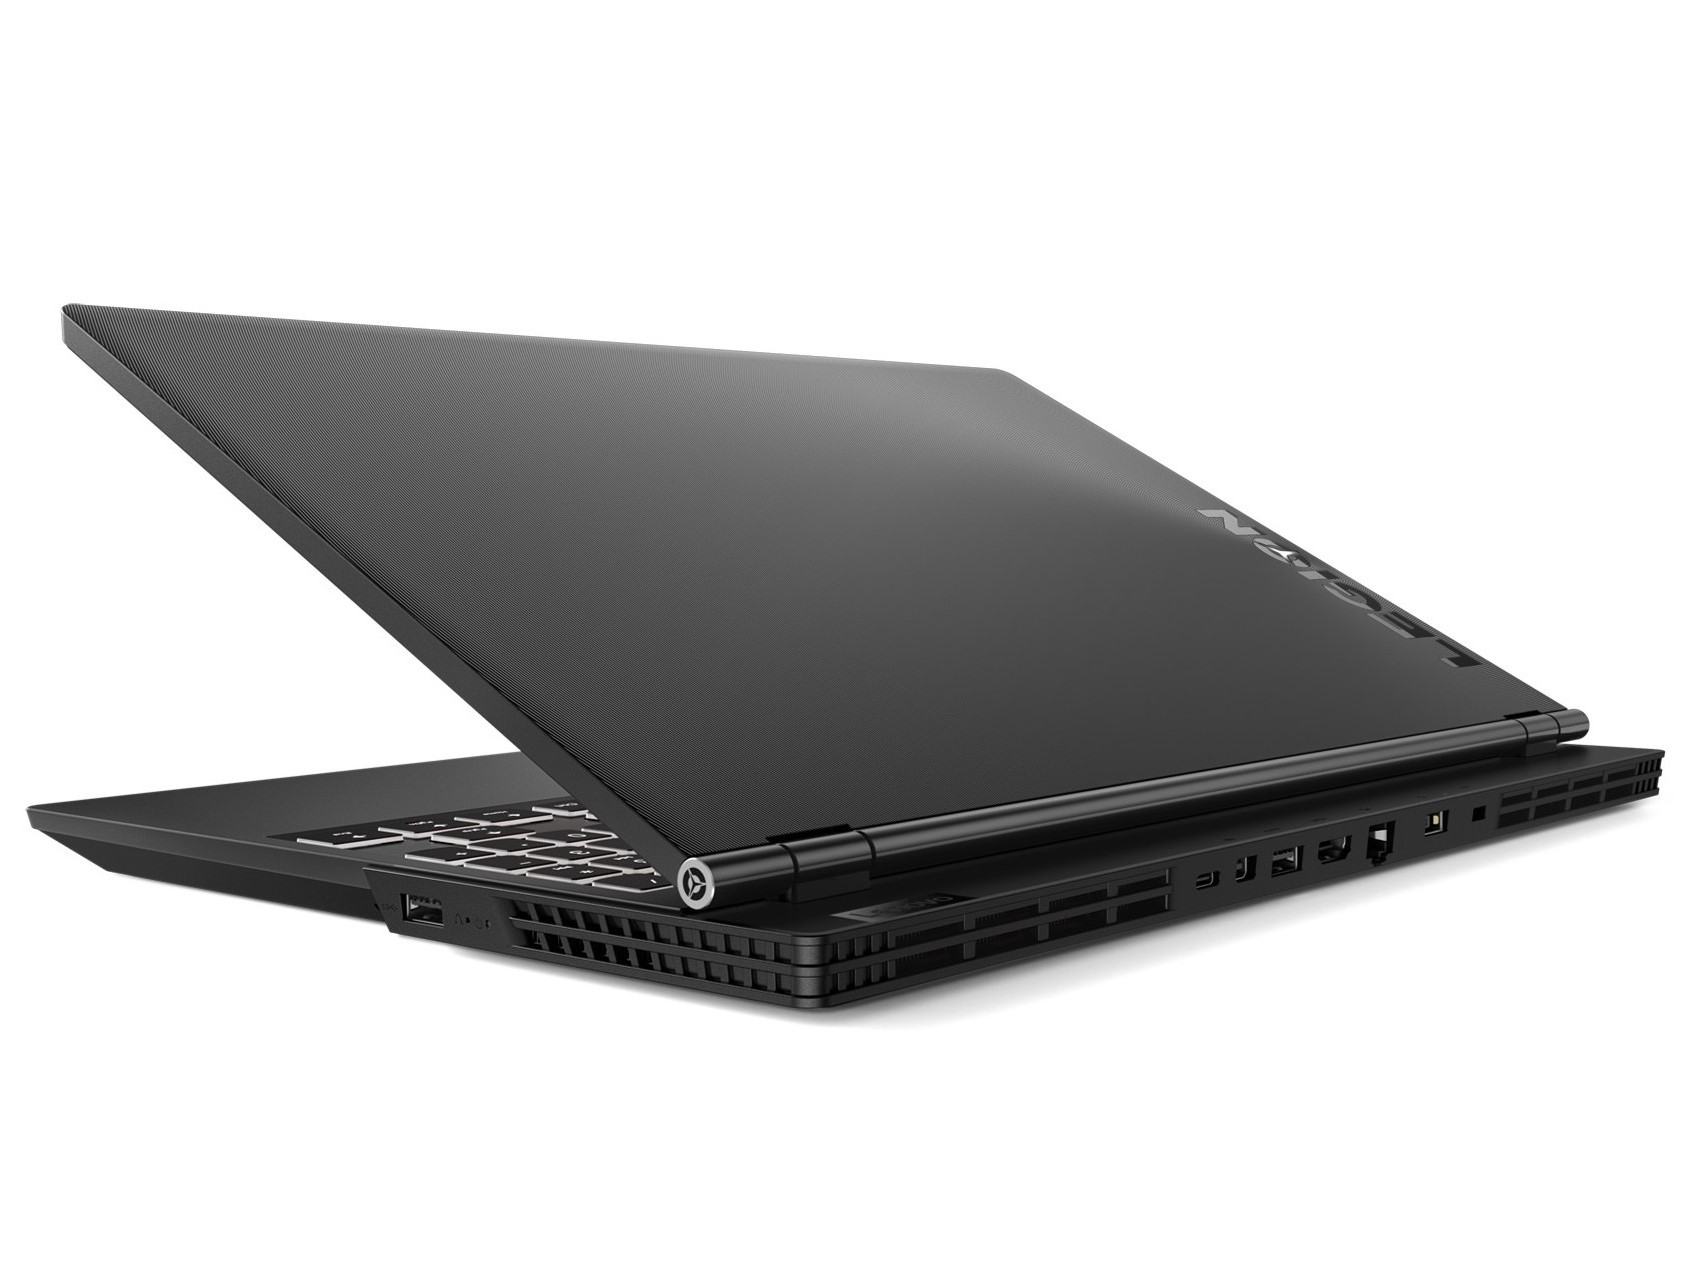
Y540-15IRH的主要问题是联想决定默认禁用集成GPU,从而使GTX 1660 Ti永久处于工作状态。相应地,我们的测评设备在原厂设置下电池续航很糟,但是可以在BIOS中启用集成GPU,从而大大改善了运行时间。除了有些不实用外,Lenovo Legion Y540-15IRH是一款物超所值的设备,如果您正在市场上购买15.6英寸游戏笔记本电脑,我们建议您考虑它。
Lenovo Legion Y540-15IRH-81SX00B2GE
- 05/15/2020 v7 (old)
Mike Wobker
Price comparison

