华硕TUF A17 FA706IU Ryzen 7笔记本电脑评测:$1100美元的i9性能
Rating | Date | Model | Weight | Height | Size | Resolution | Price |
|---|---|---|---|---|---|---|---|
| 82.9 % v7 (old) | 07 / 2020 | Asus TUF A17 FA706IU-AS76 R7 4800H, GeForce GTX 1660 Ti Mobile | 2.6 kg | 26 mm | 17.30" | 1920x1080 | |
| 85.1 % v6 (old) | 11 / 2019 | MSI GP75 Leopard 9SD i7-9750H, GeForce GTX 1660 Ti Mobile | 2.6 kg | 29 mm | 17.30" | 1920x1080 | |
| 85.3 % v6 (old) | 08 / 2019 | Dell G7 17 7790 i7-8750H, GeForce RTX 2070 Max-Q | 3.2 kg | 25 mm | 17.30" | 1920x1080 | |
| 81.6 % v7 (old) | 09 / 2019 | HP Pavilion Gaming 17-cd0085cl i7-9750H, GeForce GTX 1660 Ti Max-Q | 2.8 kg | 25 mm | 17.30" | 1920x1080 | |
| 82.3 % v7 (old) | 09 / 2019 | Lenovo Legion Y540-17IRH i5-9300H, GeForce GTX 1660 Ti Mobile | 2.8 kg | 26.3 mm | 17.30" | 1920x1080 | |
| 77.8 % v7 (old) | Asus TUF FX705DT-AU068T R5 3550H, GeForce GTX 1650 Mobile | 2.7 kg | 26.6 mm | 17.30" | 1920x1080 |
| Networking | |
| iperf3 transmit AX12 | |
| Asus Zephyrus G14 GA401IV | |
| Schenker XMG Apex 15 NH57AF1 | |
| MSI GS66 10SGS | |
| Asus TUF A17 FA706IU-AS76 | |
| iperf3 receive AX12 | |
| MSI GS66 10SGS | |
| Schenker XMG Apex 15 NH57AF1 | |
| Asus Zephyrus G14 GA401IV | |
| Asus TUF A17 FA706IU-AS76 | |


| |||||||||||||||||||||||||
Brightness Distribution: 90 %
Center on Battery: 264.8 cd/m²
Contrast: 854:1 (Black: 0.31 cd/m²)
ΔE ColorChecker Calman: 4.73 | ∀{0.5-29.43 Ø4.71}
calibrated: 4.64
ΔE Greyscale Calman: 1.4 | ∀{0.09-98 Ø4.96}
59.3% sRGB (Argyll 1.6.3 3D)
38.4% AdobeRGB 1998 (Argyll 1.6.3 3D)
41.89% AdobeRGB 1998 (Argyll 3D)
59.7% sRGB (Argyll 3D)
40.55% Display P3 (Argyll 3D)
Gamma: 2.16
CCT: 6641 K
| Asus TUF A17 FA706IU-AS76 BOE NV173FHM-NX1, IPS, 17.3", 1920x1080 | MSI GP75 Leopard 9SD Chi Mei N173HCE-G33 (CMN175C), IPS, 17.3", 1920x1080 | Dell G7 17 7790 AU Optronics AUO409D, B173HAN, IPS, 17.3", 1920x1080 | HP Pavilion Gaming 17-cd0085cl BOE0825, IPS, 17.3", 1920x1080 | Lenovo Legion Y540-17IRH AU Optronics B173HAN04.4 (AUO449D), IPS, 17.3", 1920x1080 | Asus TUF FX705DT-AU068T AU Optronics B173HAN04.2, IPS, 17.3", 1920x1080 | |
|---|---|---|---|---|---|---|
| Display | 57% | 51% | 53% | 68% | 52% | |
| Display P3 Coverage (%) | 40.55 | 63.4 56% | 61.9 53% | 63.3 56% | 69 70% | 62.3 54% |
| sRGB Coverage (%) | 59.7 | 94.9 59% | 89.6 50% | 90.2 51% | 98.3 65% | 89.1 49% |
| AdobeRGB 1998 Coverage (%) | 41.89 | 65.1 55% | 63.2 51% | 64.3 53% | 70.7 69% | 63.7 52% |
| Response Times | 59% | 30% | -22% | 27% | -70% | |
| Response Time Grey 50% / Grey 80% * (ms) | 22.4 ? | 8 ? 64% | 17.2 ? 23% | 31.6 ? -41% | 18 ? 20% | 41 ? -83% |
| Response Time Black / White * (ms) | 19.2 ? | 8.8 ? 54% | 12 ? 37% | 19.6 ? -2% | 12.8 ? 33% | 30 ? -56% |
| PWM Frequency (Hz) | 25510 ? | |||||
| Screen | 26% | 2% | 6% | 18% | 14% | |
| Brightness middle (cd/m²) | 264.8 | 420 59% | 308.6 17% | 299.6 13% | 286 8% | 316 19% |
| Brightness (cd/m²) | 253 | 393 55% | 299 18% | 285 13% | 282 11% | 294 16% |
| Brightness Distribution (%) | 90 | 91 1% | 92 2% | 86 -4% | 87 -3% | 84 -7% |
| Black Level * (cd/m²) | 0.31 | 0.32 -3% | 0.29 6% | 0.33 -6% | 0.19 39% | 0.32 -3% |
| Contrast (:1) | 854 | 1313 54% | 1064 25% | 908 6% | 1505 76% | 988 16% |
| Colorchecker dE 2000 * | 4.73 | 3.04 36% | 4.26 10% | 3.68 22% | 3.57 25% | 3.39 28% |
| Colorchecker dE 2000 max. * | 18.89 | 7.22 62% | 7.83 59% | 8.05 57% | 7.5 60% | 5.56 71% |
| Colorchecker dE 2000 calibrated * | 4.64 | 0.89 81% | 2.93 37% | 3.15 32% | 1.31 72% | 2.14 54% |
| Greyscale dE 2000 * | 1.4 | 3.91 -179% | 5 -257% | 3.8 -171% | 4.51 -222% | 3.17 -126% |
| Gamma | 2.16 102% | 2.26 97% | 2.07 106% | 2.12 104% | 2.36 93% | 2.39 92% |
| CCT | 6641 98% | 7138 91% | 7488 87% | 7240 90% | 7411 88% | 7098 92% |
| Color Space (Percent of AdobeRGB 1998) (%) | 38.4 | 60 56% | 57.8 51% | 58.1 51% | 64 67% | 51 33% |
| Color Space (Percent of sRGB) (%) | 59.3 | 95 60% | 89.2 50% | 89.8 51% | 98 65% | 89 50% |
| Total Average (Program / Settings) | 47% /
36% | 28% /
15% | 12% /
11% | 38% /
28% | -1% /
10% |
* ... smaller is better
Display Response Times
| ↔ Response Time Black to White | ||
|---|---|---|
| 19.2 ms ... rise ↗ and fall ↘ combined | ↗ 9.6 ms rise | 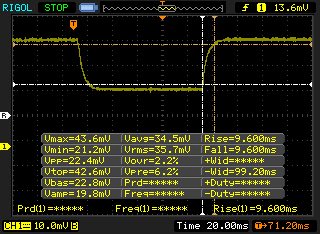 |
| ↘ 9.6 ms fall | ||
| The screen shows good response rates in our tests, but may be too slow for competitive gamers. In comparison, all tested devices range from 0.1 (minimum) to 240 (maximum) ms. » 43 % of all devices are better. This means that the measured response time is similar to the average of all tested devices (19.8 ms). | ||
| ↔ Response Time 50% Grey to 80% Grey | ||
| 22.4 ms ... rise ↗ and fall ↘ combined | ↗ 11.6 ms rise | 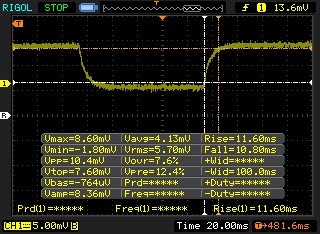 |
| ↘ 10.8 ms fall | ||
| The screen shows good response rates in our tests, but may be too slow for competitive gamers. In comparison, all tested devices range from 0.165 (minimum) to 636 (maximum) ms. » 34 % of all devices are better. This means that the measured response time is better than the average of all tested devices (31 ms). | ||
Screen Flickering / PWM (Pulse-Width Modulation)
| Screen flickering / PWM not detected | 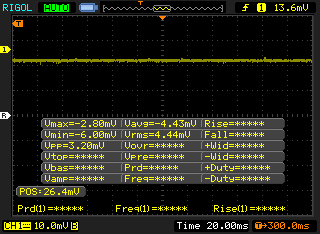 | ||
In comparison: 52 % of all tested devices do not use PWM to dim the display. If PWM was detected, an average of 7754 (minimum: 5 - maximum: 343500) Hz was measured. | |||
Cinebench R15: CPU Multi 64Bit | CPU Single 64Bit
Blender: v2.79 BMW27 CPU
7-Zip 18.03: 7z b 4 -mmt1 | 7z b 4
Geekbench 5.5: Single-Core | Multi-Core
HWBOT x265 Benchmark v2.2: 4k Preset
LibreOffice : 20 Documents To PDF
R Benchmark 2.5: Overall mean
| Cinebench R20 / CPU (Multi Core) | |
| Eurocom Sky X4C i9-9900KS | |
| Asus Zephyrus G14 GA401IV | |
| Average AMD Ryzen 7 4800H (3692 - 4663, n=18) | |
| Asus TUF A17 FA706IU-AS76 | |
| MSI GS66 Stealth 10SFS | |
| MSI GE65 Raider 9SF-049US | |
| Intel Core i5-10600K | |
| Gigabyte Aero 17 HDR XB | |
| MSI GS66 10SGS | |
| Average Intel Core i7-9750H (2017 - 3133, n=55) | |
| Gigabyte Aero 15-Y9 | |
| Asus ROG Zephyrus S GX701GXR | |
| Asus ROG Zephyrus G15 GA502DU | |
| MSI GF63 Thin 9SC | |
| Asus TUF FX705DT-AU068T | |
| Cinebench R20 / CPU (Single Core) | |
| Eurocom Sky X4C i9-9900KS | |
| Gigabyte Aero 17 HDR XB | |
| Asus Zephyrus G14 GA401IV | |
| Average AMD Ryzen 7 4800H (462 - 491, n=17) | |
| MSI GS66 Stealth 10SFS | |
| Asus TUF A17 FA706IU-AS76 | |
| MSI GE65 Raider 9SF-049US | |
| Intel Core i5-10600K | |
| MSI GS66 10SGS | |
| Average Intel Core i7-9750H (416 - 486, n=55) | |
| Asus ROG Zephyrus S GX701GXR | |
| MSI GF63 Thin 9SC | |
| Gigabyte Aero 15-Y9 | |
| Asus TUF FX705DT-AU068T | |
| Asus ROG Zephyrus G15 GA502DU | |
| Cinebench R15 / CPU Multi 64Bit | |
| Eurocom Sky X4C i9-9900KS | |
| Asus Zephyrus G14 GA401IV | |
| Average AMD Ryzen 7 4800H (1652 - 1995, n=21) | |
| Asus TUF A17 FA706IU-AS76 | |
| Gigabyte Aero 17 HDR XB | |
| MSI GS66 Stealth 10SFS | |
| MSI GE65 Raider 9SF-049US | |
| Intel Core i5-10600K | |
| MSI GS66 10SGS | |
| Gigabyte Aero 15-Y9 | |
| Average Intel Core i7-9750H (952 - 1306, n=85) | |
| Asus ROG Zephyrus S GX701GXR | |
| Asus ROG Zephyrus G15 GA502DU | |
| MSI GF63 Thin 9SC | |
| Asus TUF FX705DT-AU068T | |
| Cinebench R15 / CPU Single 64Bit | |
| Eurocom Sky X4C i9-9900KS | |
| Gigabyte Aero 17 HDR XB | |
| Intel Core i5-10600K | |
| MSI GS66 Stealth 10SFS | |
| MSI GE65 Raider 9SF-049US | |
| Gigabyte Aero 15-Y9 | |
| Asus Zephyrus G14 GA401IV | |
| Asus TUF A17 FA706IU-AS76 | |
| MSI GS66 10SGS | |
| Average AMD Ryzen 7 4800H (186 - 191, n=15) | |
| Average Intel Core i7-9750H (170 - 194, n=82) | |
| Asus ROG Zephyrus S GX701GXR | |
| MSI GF63 Thin 9SC | |
| Asus TUF FX705DT-AU068T | |
| Asus ROG Zephyrus G15 GA502DU | |
| Blender / v2.79 BMW27 CPU | |
| Asus ROG Zephyrus G15 GA502DU | |
| Average Intel Core i7-9750H (342 - 495, n=21) | |
| MSI GS66 10SGS | |
| Gigabyte Aero 17 HDR XB | |
| Intel Core i5-10600K | |
| Asus Zephyrus G14 GA401IV | |
| MSI GS66 Stealth 10SFS | |
| Asus TUF A17 FA706IU-AS76 | |
| Average AMD Ryzen 7 4800H (248 - 299, n=15) | |
| Eurocom Sky X4C i9-9900KS | |
| 7-Zip 18.03 / 7z b 4 -mmt1 | |
| Eurocom Sky X4C i9-9900KS | |
| Gigabyte Aero 17 HDR XB | |
| Intel Core i5-10600K | |
| MSI GS66 Stealth 10SFS | |
| MSI GS66 10SGS | |
| Average Intel Core i7-9750H (4580 - 5090, n=21) | |
| Asus TUF A17 FA706IU-AS76 | |
| Average AMD Ryzen 7 4800H (4575 - 4743, n=15) | |
| Asus Zephyrus G14 GA401IV | |
| Asus ROG Zephyrus G15 GA502DU | |
| 7-Zip 18.03 / 7z b 4 | |
| Eurocom Sky X4C i9-9900KS | |
| Average AMD Ryzen 7 4800H (44827 - 53883, n=15) | |
| Asus TUF A17 FA706IU-AS76 | |
| Asus Zephyrus G14 GA401IV | |
| Gigabyte Aero 17 HDR XB | |
| MSI GS66 Stealth 10SFS | |
| Intel Core i5-10600K | |
| MSI GS66 10SGS | |
| Average Intel Core i7-9750H (28512 - 35174, n=21) | |
| Asus ROG Zephyrus G15 GA502DU | |
| Geekbench 5.5 / Single-Core | |
| Eurocom Sky X4C i9-9900KS | |
| Intel Core i5-10600K | |
| MSI GS66 Stealth 10SFS | |
| Gigabyte Aero 17 HDR XB | |
| Asus Zephyrus G14 GA401IV | |
| MSI GS66 10SGS | |
| Average Intel Core i7-9750H (1117 - 1251, n=13) | |
| Asus TUF A17 FA706IU-AS76 | |
| Average AMD Ryzen 7 4800H (1154 - 1207, n=17) | |
| Geekbench 5.5 / Multi-Core | |
| Eurocom Sky X4C i9-9900KS | |
| Asus TUF A17 FA706IU-AS76 | |
| Average AMD Ryzen 7 4800H (5920 - 8672, n=17) | |
| Asus Zephyrus G14 GA401IV | |
| MSI GS66 Stealth 10SFS | |
| Gigabyte Aero 17 HDR XB | |
| Intel Core i5-10600K | |
| MSI GS66 10SGS | |
| Average Intel Core i7-9750H (4859 - 6262, n=13) | |
| HWBOT x265 Benchmark v2.2 / 4k Preset | |
| Eurocom Sky X4C i9-9900KS | |
| Average AMD Ryzen 7 4800H (10.8 - 14.1, n=16) | |
| MSI GS66 Stealth 10SFS | |
| Intel Core i5-10600K | |
| Asus TUF A17 FA706IU-AS76 | |
| Asus Zephyrus G14 GA401IV | |
| Gigabyte Aero 17 HDR XB | |
| MSI GS66 10SGS | |
| Average Intel Core i7-9750H (7.1 - 10.7, n=21) | |
| Asus ROG Zephyrus G15 GA502DU | |
| LibreOffice / 20 Documents To PDF | |
| Gigabyte Aero 17 HDR XB | |
| Average AMD Ryzen 7 4800H (28.6 - 95.8, n=14) | |
| Asus TUF A17 FA706IU-AS76 | |
| Average Intel Core i7-9750H (54.5 - 64.7, n=9) | |
| MSI GS66 10SGS | |
| MSI GS66 Stealth 10SFS | |
| Intel Core i5-10600K | |
| R Benchmark 2.5 / Overall mean | |
| Average Intel Core i7-9750H (0.608 - 0.695, n=14) | |
| MSI GS66 10SGS | |
| Asus TUF A17 FA706IU-AS76 | |
| Intel Core i5-10600K | |
| MSI GS66 Stealth 10SFS | |
| Average AMD Ryzen 7 4800H (0.562 - 0.603, n=15) | |
| Gigabyte Aero 17 HDR XB | |
Cinebench R15: CPU Multi 64Bit | CPU Single 64Bit
Blender: v2.79 BMW27 CPU
7-Zip 18.03: 7z b 4 -mmt1 | 7z b 4
Geekbench 5.5: Single-Core | Multi-Core
HWBOT x265 Benchmark v2.2: 4k Preset
LibreOffice : 20 Documents To PDF
R Benchmark 2.5: Overall mean
* ... smaller is better
| PCMark 10 | |
| Score | |
| Gigabyte Aero 17 HDR XB | |
| Asus TUF A17 FA706IU-AS76 | |
| MSI GP75 Leopard 9SD | |
| HP Pavilion Gaming 17-cd0085cl | |
| Dell G7 17 7790 | |
| Asus TUF FX705DT-AU068T | |
| Essentials | |
| Gigabyte Aero 17 HDR XB | |
| Asus TUF A17 FA706IU-AS76 | |
| HP Pavilion Gaming 17-cd0085cl | |
| MSI GP75 Leopard 9SD | |
| Dell G7 17 7790 | |
| Asus TUF FX705DT-AU068T | |
| Productivity | |
| Gigabyte Aero 17 HDR XB | |
| Asus TUF A17 FA706IU-AS76 | |
| MSI GP75 Leopard 9SD | |
| HP Pavilion Gaming 17-cd0085cl | |
| Dell G7 17 7790 | |
| Asus TUF FX705DT-AU068T | |
| Digital Content Creation | |
| Gigabyte Aero 17 HDR XB | |
| MSI GP75 Leopard 9SD | |
| Dell G7 17 7790 | |
| HP Pavilion Gaming 17-cd0085cl | |
| Asus TUF A17 FA706IU-AS76 | |
| Asus TUF FX705DT-AU068T | |
| PCMark 8 | |
| Home Score Accelerated v2 | |
| Asus TUF A17 FA706IU-AS76 | |
| Asus TUF FX705DT-AU068T | |
| HP Pavilion Gaming 17-cd0085cl | |
| Dell G7 17 7790 | |
| MSI GP75 Leopard 9SD | |
| Work Score Accelerated v2 | |
| Asus TUF A17 FA706IU-AS76 | |
| MSI GP75 Leopard 9SD | |
| Dell G7 17 7790 | |
| HP Pavilion Gaming 17-cd0085cl | |
| Asus TUF FX705DT-AU068T | |
| PCMark 8 Home Score Accelerated v2 | 4780 points | |
| PCMark 8 Work Score Accelerated v2 | 5749 points | |
| PCMark 10 Score | 5617 points | |
Help | ||
| DPC Latencies / LatencyMon - interrupt to process latency (max), Web, Youtube, Prime95 | |
| Asus TUF A17 FA706IU-AS76 | |
| Asus Zephyrus G14 GA401IV | |
| MSI GS66 10SGS | |
| MSI GP65 10SFK-047US | |
* ... smaller is better
| Asus TUF A17 FA706IU-AS76 Intel SSD 660p 1TB SSDPEKNW010T8 | MSI GP75 Leopard 9SD Kingston RBUSNS8154P3256GJ1 | Dell G7 17 7790 Toshiba BG3 KBG30ZMS256G | HP Pavilion Gaming 17-cd0085cl Samsung SSD PM981 MZVLB256HAHQ | Asus TUF FX705DT-AU068T WDC PC SN520 SDAPNUW-256G | |
|---|---|---|---|---|---|
| AS SSD | -71% | -90% | 7% | -34% | |
| Seq Read (MB/s) | 1320 | 748 -43% | 1033 -22% | 1709 29% | 1546 17% |
| Seq Write (MB/s) | 1539 | 219 -86% | 218.3 -86% | 1345 -13% | 1182 -23% |
| 4K Read (MB/s) | 56.3 | 25.7 -54% | 24.12 -57% | 49.73 -12% | 36.54 -35% |
| 4K Write (MB/s) | 158.5 | 82.4 -48% | 55 -65% | 108.2 -32% | 109.2 -31% |
| 4K-64 Read (MB/s) | 586 | 259.3 -56% | 330.3 -44% | 731 25% | 612 4% |
| 4K-64 Write (MB/s) | 820 | 190.2 -77% | 155.8 -81% | 1233 50% | 436.6 -47% |
| Access Time Read * (ms) | 0.043 | 0.159 -270% | 0.18 -319% | 0.073 -70% | 0.113 -163% |
| Access Time Write * (ms) | 0.113 | 0.058 49% | 0.314 -178% | 0.034 70% | 0.034 70% |
| Score Read (Points) | 775 | 360 -54% | 458 -41% | 951 23% | 803 4% |
| Score Write (Points) | 1132 | 294 -74% | 233 -79% | 1476 30% | 664 -41% |
| Score Total (Points) | 2333 | 821 -65% | 891 -62% | 2909 25% | 1869 -20% |
| Copy ISO MB/s (MB/s) | 1736 | 382.9 -78% | 1284 -26% | 698 -60% | |
| Copy Program MB/s (MB/s) | 553 | 234.9 -58% | 589 7% | 114.1 -79% | |
| Copy Game MB/s (MB/s) | 1264 | 218.7 -83% | 1107 -12% | 379.6 -70% | |
| CrystalDiskMark 5.2 / 6 | -51% | -58% | 5% | -26% | |
| Write 4K (MB/s) | 189.7 | 105.8 -44% | 78.6 -59% | 135.3 -29% | 145 -24% |
| Read 4K (MB/s) | 62.3 | 27.89 -55% | 31.89 -49% | 63.7 2% | 45.28 -27% |
| Write Seq (MB/s) | 1681 | 270.8 -84% | 230.4 -86% | 1337 -20% | 1301 -23% |
| Read Seq (MB/s) | 1608 | 879 -45% | 925 -42% | 1617 1% | 1362 -15% |
| Write 4K Q32T1 (MB/s) | 468.6 | 273.3 -42% | 159.1 -66% | 568 21% | 249.1 -47% |
| Read 4K Q32T1 (MB/s) | 541 | 361.2 -33% | 315.6 -42% | 645 19% | 342.1 -37% |
| Write Seq Q32T1 (MB/s) | 1770 | 253 -86% | 230.7 -87% | 1428 -19% | 1301 -26% |
| Read Seq Q32T1 (MB/s) | 1898 | 1505 -21% | 1323 -30% | 3184 68% | 1732 -9% |
| Total Average (Program / Settings) | -61% /
-63% | -74% /
-78% | 6% /
6% | -30% /
-31% |
* ... smaller is better

Disk Throttling: DiskSpd Read Loop, Queue Depth 8
| 3DMark 11 | |
| 1280x720 Performance GPU | |
| Asus ROG Mothership GZ700GX | |
| Schenker XMG Ultra 17 | |
| Aorus 17G XB | |
| Asus ASUS ROG Strix SCAR III G731GW-XB74 | |
| Alienware 17 R5 | |
| Dell G7 17 7790 | |
| Zotac GeForce GTX 1660 Ti 6 GB | |
| Asus Zephyrus G14 GA401IV | |
| Asus TUF A17 FA706IU-AS76 | |
| Average NVIDIA GeForce GTX 1660 Ti Mobile (18610 - 22670, n=24) | |
| Asus ROG Zephyrus G15 GA502DU | |
| Asus Strix GL703VM-DB74 | |
| MSI GF75 Thin 10SCXR | |
| 1280x720 Performance Combined | |
| Asus ROG Mothership GZ700GX | |
| Aorus 17G XB | |
| Zotac GeForce GTX 1660 Ti 6 GB | |
| Asus Zephyrus G14 GA401IV | |
| Asus TUF A17 FA706IU-AS76 | |
| Schenker XMG Ultra 17 | |
| Average NVIDIA GeForce GTX 1660 Ti Mobile (9500 - 13311, n=23) | |
| Alienware 17 R5 | |
| Asus ASUS ROG Strix SCAR III G731GW-XB74 | |
| Dell G7 17 7790 | |
| MSI GF75 Thin 10SCXR | |
| Asus Strix GL703VM-DB74 | |
| Asus ROG Zephyrus G15 GA502DU | |
| 3DMark 11 Performance | 18607 points | |
| 3DMark Cloud Gate Standard Score | 35957 points | |
| 3DMark Fire Strike Score | 14010 points | |
| 3DMark Time Spy Score | 6045 points | |
Help | ||
| Shadow of the Tomb Raider | |
| 1280x720 Lowest Preset | |
| Walmart EVOO Gaming 17 | |
| HP Omen 15-dc0015ng | |
| Average NVIDIA GeForce GTX 1660 Ti Mobile (88 - 151, n=6) | |
| Lenovo Legion Y740-17IRH | |
| Asus Strix Scar III G531GW-AZ062T | |
| Asus TUF A17 FA706IU-AS76 | |
| Dell G5 15 5590-PCNJJ | |
| Alienware 17 R4 | |
| 1920x1080 Highest Preset AA:T | |
| Walmart EVOO Gaming 17 | |
| Asus Strix Scar III G531GW-AZ062T | |
| Alienware 17 R4 | |
| Lenovo Legion Y740-17IRH | |
| Asus TUF A17 FA706IU-AS76 | |
| Average NVIDIA GeForce GTX 1660 Ti Mobile (62 - 73, n=8) | |
| HP Omen 15-dc0015ng | |
| Asus TUF FX705GM | |
| Dell G5 15 5590-PCNJJ | |
| The Witcher 3 | |
| 1024x768 Low Graphics & Postprocessing | |
| Walmart EVOO Gaming 17 | |
| Lenovo Legion Y740-17IRH | |
| Asus Strix Scar III G531GW-AZ062T | |
| Asus TUF A17 FA706IU-AS76 | |
| Average NVIDIA GeForce GTX 1660 Ti Mobile (177.3 - 298, n=14) | |
| HP Omen 15-dc0015ng | |
| Dell G5 15 5590-PCNJJ | |
| 1920x1080 Ultra Graphics & Postprocessing (HBAO+) | |
| Asus Strix Scar III G531GW-AZ062T | |
| Walmart EVOO Gaming 17 | |
| Lenovo Legion Y740-17IRH | |
| Average NVIDIA GeForce GTX 1660 Ti Mobile (51.6 - 65.1, n=21) | |
| Asus TUF A17 FA706IU-AS76 | |
| HP Omen 15-dc0015ng | |
| Asus TUF FX705GM | |
| Dell G5 15 5590-PCNJJ | |
| Dota 2 Reborn | |
| 1920x1080 ultra (3/3) best looking | |
| Average NVIDIA GeForce GTX 1660 Ti Mobile (94.6 - 125, n=11) | |
| HP Omen 15-dc0015ng | |
| Asus TUF A17 FA706IU-AS76 | |
| Asus Strix Scar III G531GW-AZ062T | |
| 1280x720 min (0/3) fastest | |
| Asus Strix Scar III G531GW-AZ062T | |
| Average NVIDIA GeForce GTX 1660 Ti Mobile (109 - 150, n=11) | |
| HP Omen 15-dc0015ng | |
| Asus TUF A17 FA706IU-AS76 | |
| Metro Exodus | |
| 1920x1080 Ultra Quality AF:16x | |
| Alienware 17 R4 | |
| Asus Strix Scar III G531GW-AZ062T | |
| Lenovo Legion Y740-17IRH | |
| Asus TUF A17 FA706IU-AS76 | |
| Average NVIDIA GeForce GTX 1660 Ti Mobile (38.2 - 43.1, n=4) | |
| Dell G5 15 5590-PCNJJ | |
| 1920x1080 Medium Quality AF:4x | |
| Alienware 17 R4 | |
| Asus Strix Scar III G531GW-AZ062T | |
| Lenovo Legion Y740-17IRH | |
| Asus TUF A17 FA706IU-AS76 | |
| Average NVIDIA GeForce GTX 1660 Ti Mobile (64 - 73.7, n=4) | |
| Dell G5 15 5590-PCNJJ | |
| Borderlands 3 | |
| 1280x720 Very Low Overall Quality (DX11) | |
| Lenovo Legion Y740-17IRH | |
| Average NVIDIA GeForce GTX 1660 Ti Mobile (107.9 - 131, n=2) | |
| Alienware 17 R4 | |
| Asus TUF A17 FA706IU-AS76 | |
| Dell G5 15 5590-PCNJJ | |
| 1920x1080 Badass Overall Quality (DX11) | |
| Alienware 17 R4 | |
| Lenovo Legion Y740-17IRH | |
| Asus TUF A17 FA706IU-AS76 | |
| Average NVIDIA GeForce GTX 1660 Ti Mobile (46.6 - 48.6, n=3) | |
| Dell G5 15 5590-PCNJJ | |
| low | med. | high | ultra | |
|---|---|---|---|---|
| The Witcher 3 (2015) | 254 | 175.1 | 103 | 55.6 |
| Dota 2 Reborn (2015) | 122 | 113 | 110 | 104 |
| X-Plane 11.11 (2018) | 93 | 83.7 | 70.2 | |
| Shadow of the Tomb Raider (2018) | 108 | 87 | 81 | 73 |
| Metro Exodus (2019) | 112.4 | 73.7 | 54.4 | 42.6 |
| Borderlands 3 (2019) | 107.9 | 87.5 | 61.7 | 47.8 |
| Asus TUF A17 FA706IU-AS76 GeForce GTX 1660 Ti Mobile, R7 4800H, Intel SSD 660p 1TB SSDPEKNW010T8 | MSI GP75 Leopard 9SD GeForce GTX 1660 Ti Mobile, i7-9750H, Kingston RBUSNS8154P3256GJ1 | Dell G7 17 7790 GeForce RTX 2070 Max-Q, i7-8750H, Toshiba BG3 KBG30ZMS256G | HP Pavilion Gaming 17-cd0085cl GeForce GTX 1660 Ti Max-Q, i7-9750H, Samsung SSD PM981 MZVLB256HAHQ | Lenovo Legion Y540-17IRH GeForce GTX 1660 Ti Mobile, i5-9300H, WDC PC SN520 SDAPNUW-512G | Asus TUF FX705DT-AU068T GeForce GTX 1650 Mobile, R5 3550H, WDC PC SN520 SDAPNUW-256G | |
|---|---|---|---|---|---|---|
| Noise | -8% | 7% | 11% | -3% | 2% | |
| off / environment * (dB) | 28.7 | 29 -1% | 28.2 2% | 28.2 2% | 30 -5% | 30.8 -7% |
| Idle Minimum * (dB) | 28.7 | 29 -1% | 28.6 -0% | 30.1 -5% | 30 -5% | 30.8 -7% |
| Idle Average * (dB) | 30.5 | 34 -11% | 28.6 6% | 30.1 1% | 32 -5% | 30.8 -1% |
| Idle Maximum * (dB) | 32.5 | 37 -14% | 28.6 12% | 30.1 7% | 34 -5% | 32.2 1% |
| Load Average * (dB) | 42.5 | 53 -25% | 31.8 25% | 34.2 20% | 44 -4% | 38.6 9% |
| Witcher 3 ultra * (dB) | 50.1 | 51 -2% | 50.6 -1% | 34.2 32% | 50 -0% | |
| Load Maximum * (dB) | 53.4 | 55 -3% | 50.8 5% | 43.8 18% | 52 3% | 44.8 16% |
* ... smaller is better
Noise level
| Idle |
| 28.7 / 30.5 / 32.5 dB(A) |
| Load |
| 42.5 / 53.4 dB(A) |
 | ||
30 dB silent 40 dB(A) audible 50 dB(A) loud |
||
min: | ||
(-) The maximum temperature on the upper side is 47.6 °C / 118 F, compared to the average of 40.4 °C / 105 F, ranging from 21.2 to 68.8 °C for the class Gaming.
(-) The bottom heats up to a maximum of 50.8 °C / 123 F, compared to the average of 43.2 °C / 110 F
(+) In idle usage, the average temperature for the upper side is 29.3 °C / 85 F, compared to the device average of 33.9 °C / 93 F.
(±) Playing The Witcher 3, the average temperature for the upper side is 32.3 °C / 90 F, compared to the device average of 33.9 °C / 93 F.
(+) The palmrests and touchpad are cooler than skin temperature with a maximum of 28.6 °C / 83.5 F and are therefore cool to the touch.
(±) The average temperature of the palmrest area of similar devices was 28.8 °C / 83.8 F (+0.2 °C / 0.3 F).
Asus TUF A17 FA706IU-AS76 audio analysis
(±) | speaker loudness is average but good (74 dB)
Bass 100 - 315 Hz
(±) | reduced bass - on average 12.7% lower than median
(±) | linearity of bass is average (11.5% delta to prev. frequency)
Mids 400 - 2000 Hz
(+) | balanced mids - only 4.8% away from median
(±) | linearity of mids is average (9.1% delta to prev. frequency)
Highs 2 - 16 kHz
(+) | balanced highs - only 3.1% away from median
(±) | linearity of highs is average (8.7% delta to prev. frequency)
Overall 100 - 16.000 Hz
(±) | linearity of overall sound is average (23.5% difference to median)
Compared to same class
» 85% of all tested devices in this class were better, 5% similar, 10% worse
» The best had a delta of 6%, average was 18%, worst was 132%
Compared to all devices tested
» 70% of all tested devices were better, 6% similar, 24% worse
» The best had a delta of 4%, average was 23%, worst was 134%
Apple MacBook 12 (Early 2016) 1.1 GHz audio analysis
(+) | speakers can play relatively loud (83.6 dB)
Bass 100 - 315 Hz
(±) | reduced bass - on average 11.3% lower than median
(±) | linearity of bass is average (14.2% delta to prev. frequency)
Mids 400 - 2000 Hz
(+) | balanced mids - only 2.4% away from median
(+) | mids are linear (5.5% delta to prev. frequency)
Highs 2 - 16 kHz
(+) | balanced highs - only 2% away from median
(+) | highs are linear (4.5% delta to prev. frequency)
Overall 100 - 16.000 Hz
(+) | overall sound is linear (10.2% difference to median)
Compared to same class
» 7% of all tested devices in this class were better, 2% similar, 90% worse
» The best had a delta of 5%, average was 18%, worst was 53%
Compared to all devices tested
» 5% of all tested devices were better, 1% similar, 94% worse
» The best had a delta of 4%, average was 23%, worst was 134%
| Off / Standby | |
| Idle | |
| Load |
|
Key:
min: | |
| Asus TUF A17 FA706IU-AS76 R7 4800H, GeForce GTX 1660 Ti Mobile, Intel SSD 660p 1TB SSDPEKNW010T8, IPS, 1920x1080, 17.3" | Asus ROG Strix G GL731GU-RB74 i7-9750H, GeForce GTX 1660 Ti Mobile, Intel SSD 660p SSDPEKNW512G8, IPS, 1920x1080, 17.3" | Dell G7 17 7790 i7-8750H, GeForce RTX 2070 Max-Q, Toshiba BG3 KBG30ZMS256G, IPS, 1920x1080, 17.3" | Lenovo Legion Y540-17IRH i5-9300H, GeForce GTX 1660 Ti Mobile, WDC PC SN520 SDAPNUW-512G, IPS, 1920x1080, 17.3" | Asus TUF FX705DT-AU068T R5 3550H, GeForce GTX 1650 Mobile, WDC PC SN520 SDAPNUW-256G, IPS, 1920x1080, 17.3" | Gigabyte Aero 17 HDR XB i7-10875H, GeForce RTX 2070 Super Max-Q, Samsung SSD PM981a MZVLB512HBJQ, IPS, 3840x2160, 17.3" | |
|---|---|---|---|---|---|---|
| Power Consumption | -61% | -23% | -56% | 37% | -57% | |
| Idle Minimum * (Watt) | 7.4 | 13.6 -84% | 9.5 -28% | 19 -157% | 3.9 47% | 16 -116% |
| Idle Average * (Watt) | 10.5 | 26.2 -150% | 16.2 -54% | 22 -110% | 9.6 9% | 19 -81% |
| Idle Maximum * (Watt) | 17 | 35 -106% | 23.8 -40% | 30 -76% | 12.2 28% | 30 -76% |
| Load Average * (Watt) | 103.7 | 113.6 -10% | 101.7 2% | 79 24% | 59 43% | 109 -5% |
| Witcher 3 ultra * (Watt) | 128.1 | 134.1 -5% | 155 -21% | 134 -5% | 167 -30% | |
| Load Maximum * (Watt) | 183.2 | 200.2 -9% | 172.2 6% | 201 -10% | 80 56% | 246 -34% |
* ... smaller is better
| Asus TUF A17 FA706IU-AS76 R7 4800H, GeForce GTX 1660 Ti Mobile, 90 Wh | MSI GP75 Leopard 9SD i7-9750H, GeForce GTX 1660 Ti Mobile, 51 Wh | Dell G7 17 7790 i7-8750H, GeForce RTX 2070 Max-Q, 60 Wh | HP Pavilion Gaming 17-cd0085cl i7-9750H, GeForce GTX 1660 Ti Max-Q, 52.5 Wh | Lenovo Legion Y540-17IRH i5-9300H, GeForce GTX 1660 Ti Mobile, 57 Wh | Asus TUF FX705DT-AU068T R5 3550H, GeForce GTX 1650 Mobile, 64 Wh | |
|---|---|---|---|---|---|---|
| Battery runtime | -64% | -33% | -25% | -55% | 2% | |
| Reader / Idle (h) | 9.1 | 4.8 -47% | 8.5 -7% | 11.6 27% | 5.2 -43% | 13.6 49% |
| WiFi v1.3 (h) | 8.5 | 3.2 -62% | 3.9 -54% | 5.7 -33% | 3.7 -56% | 7.8 -8% |
| Load (h) | 3.3 | 0.6 -82% | 2 -39% | 1 -70% | 1.1 -67% | 2.1 -36% |
Pros
Cons
Verdict — Better than the FX705 in Almost Every Way
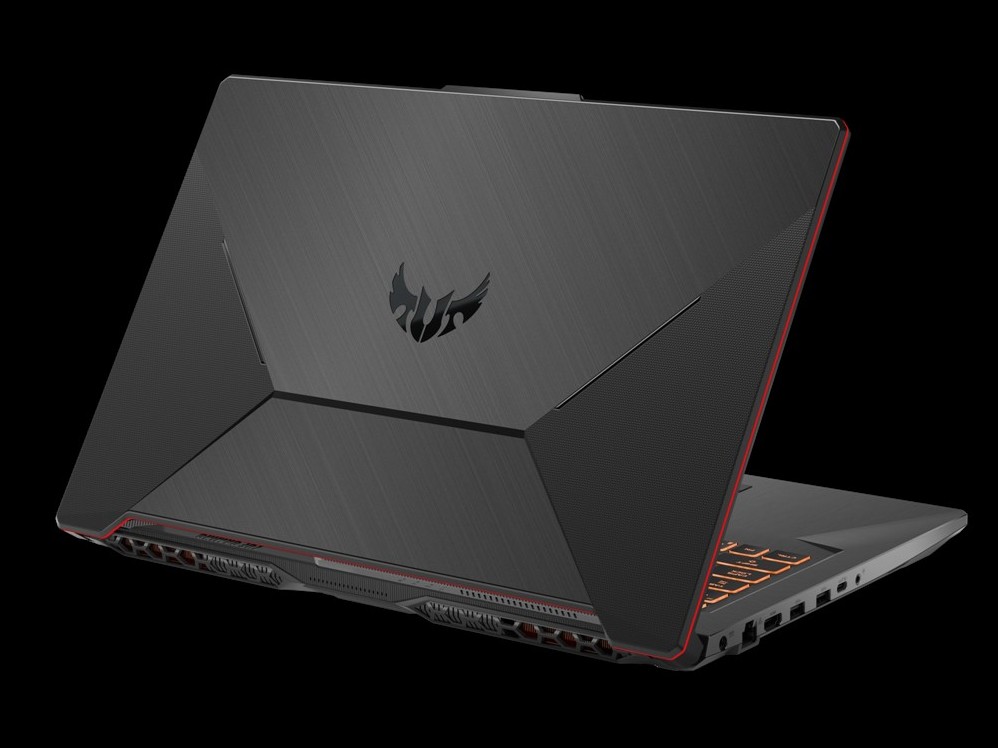
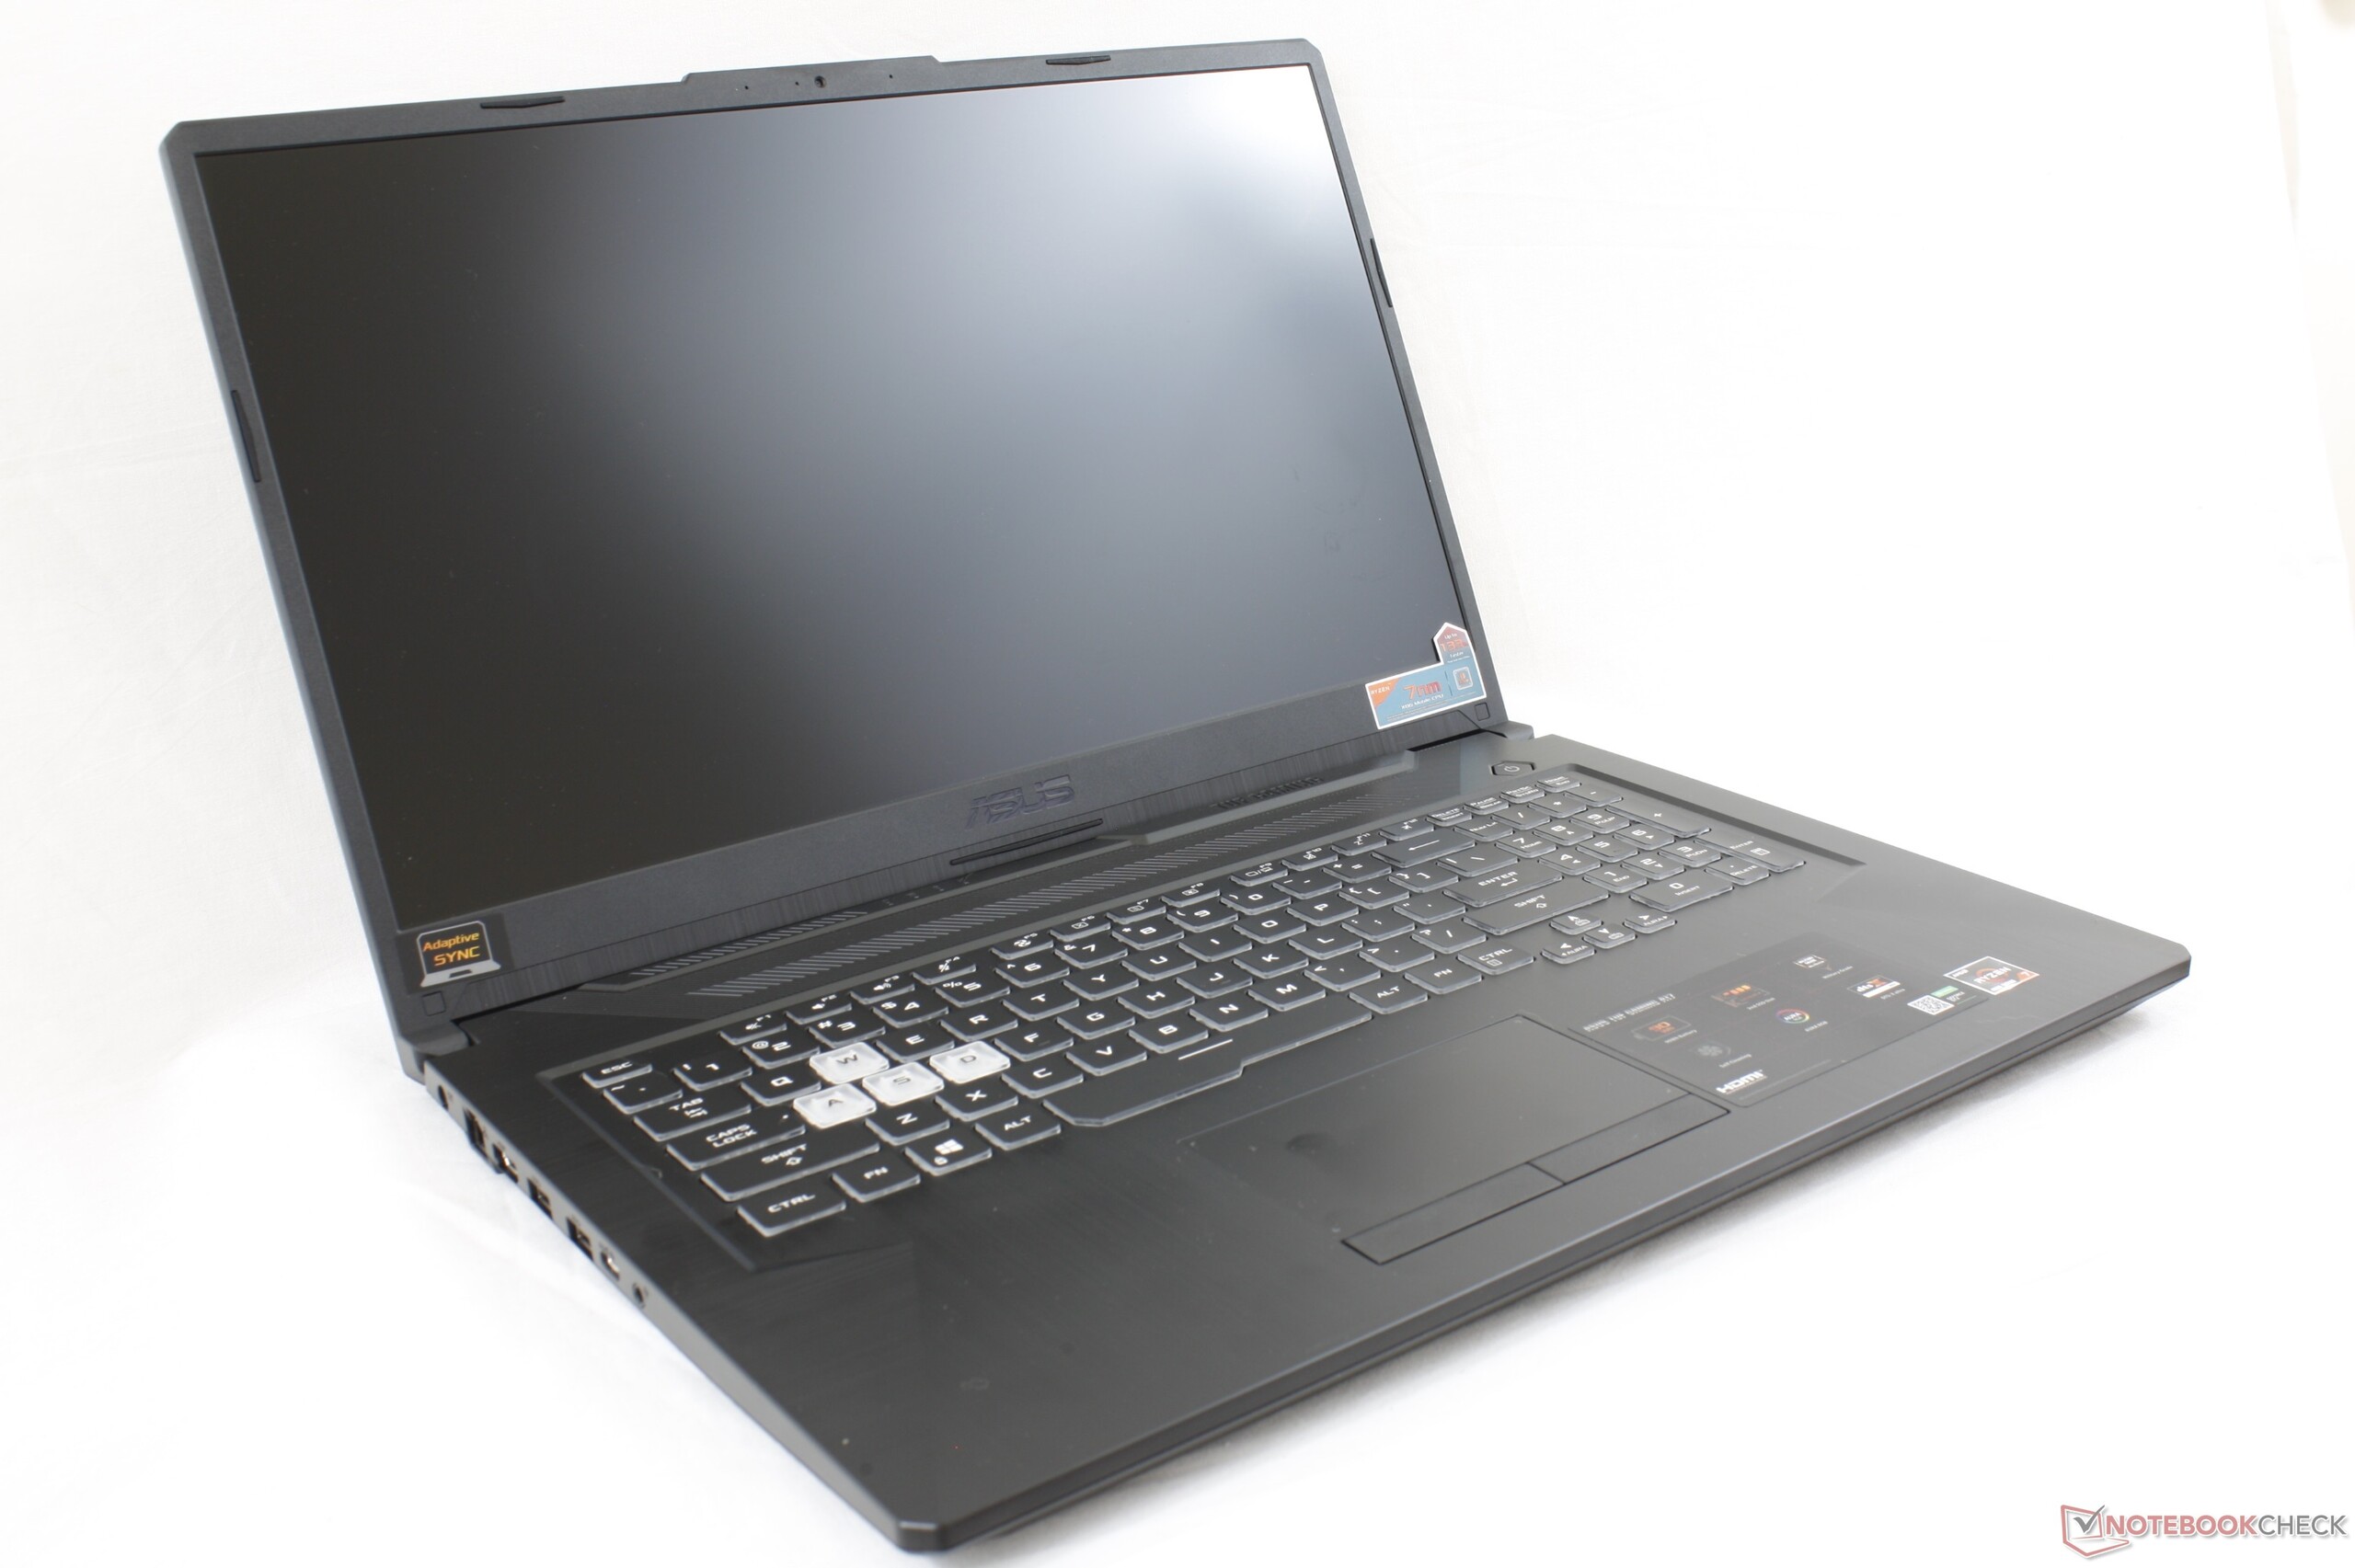
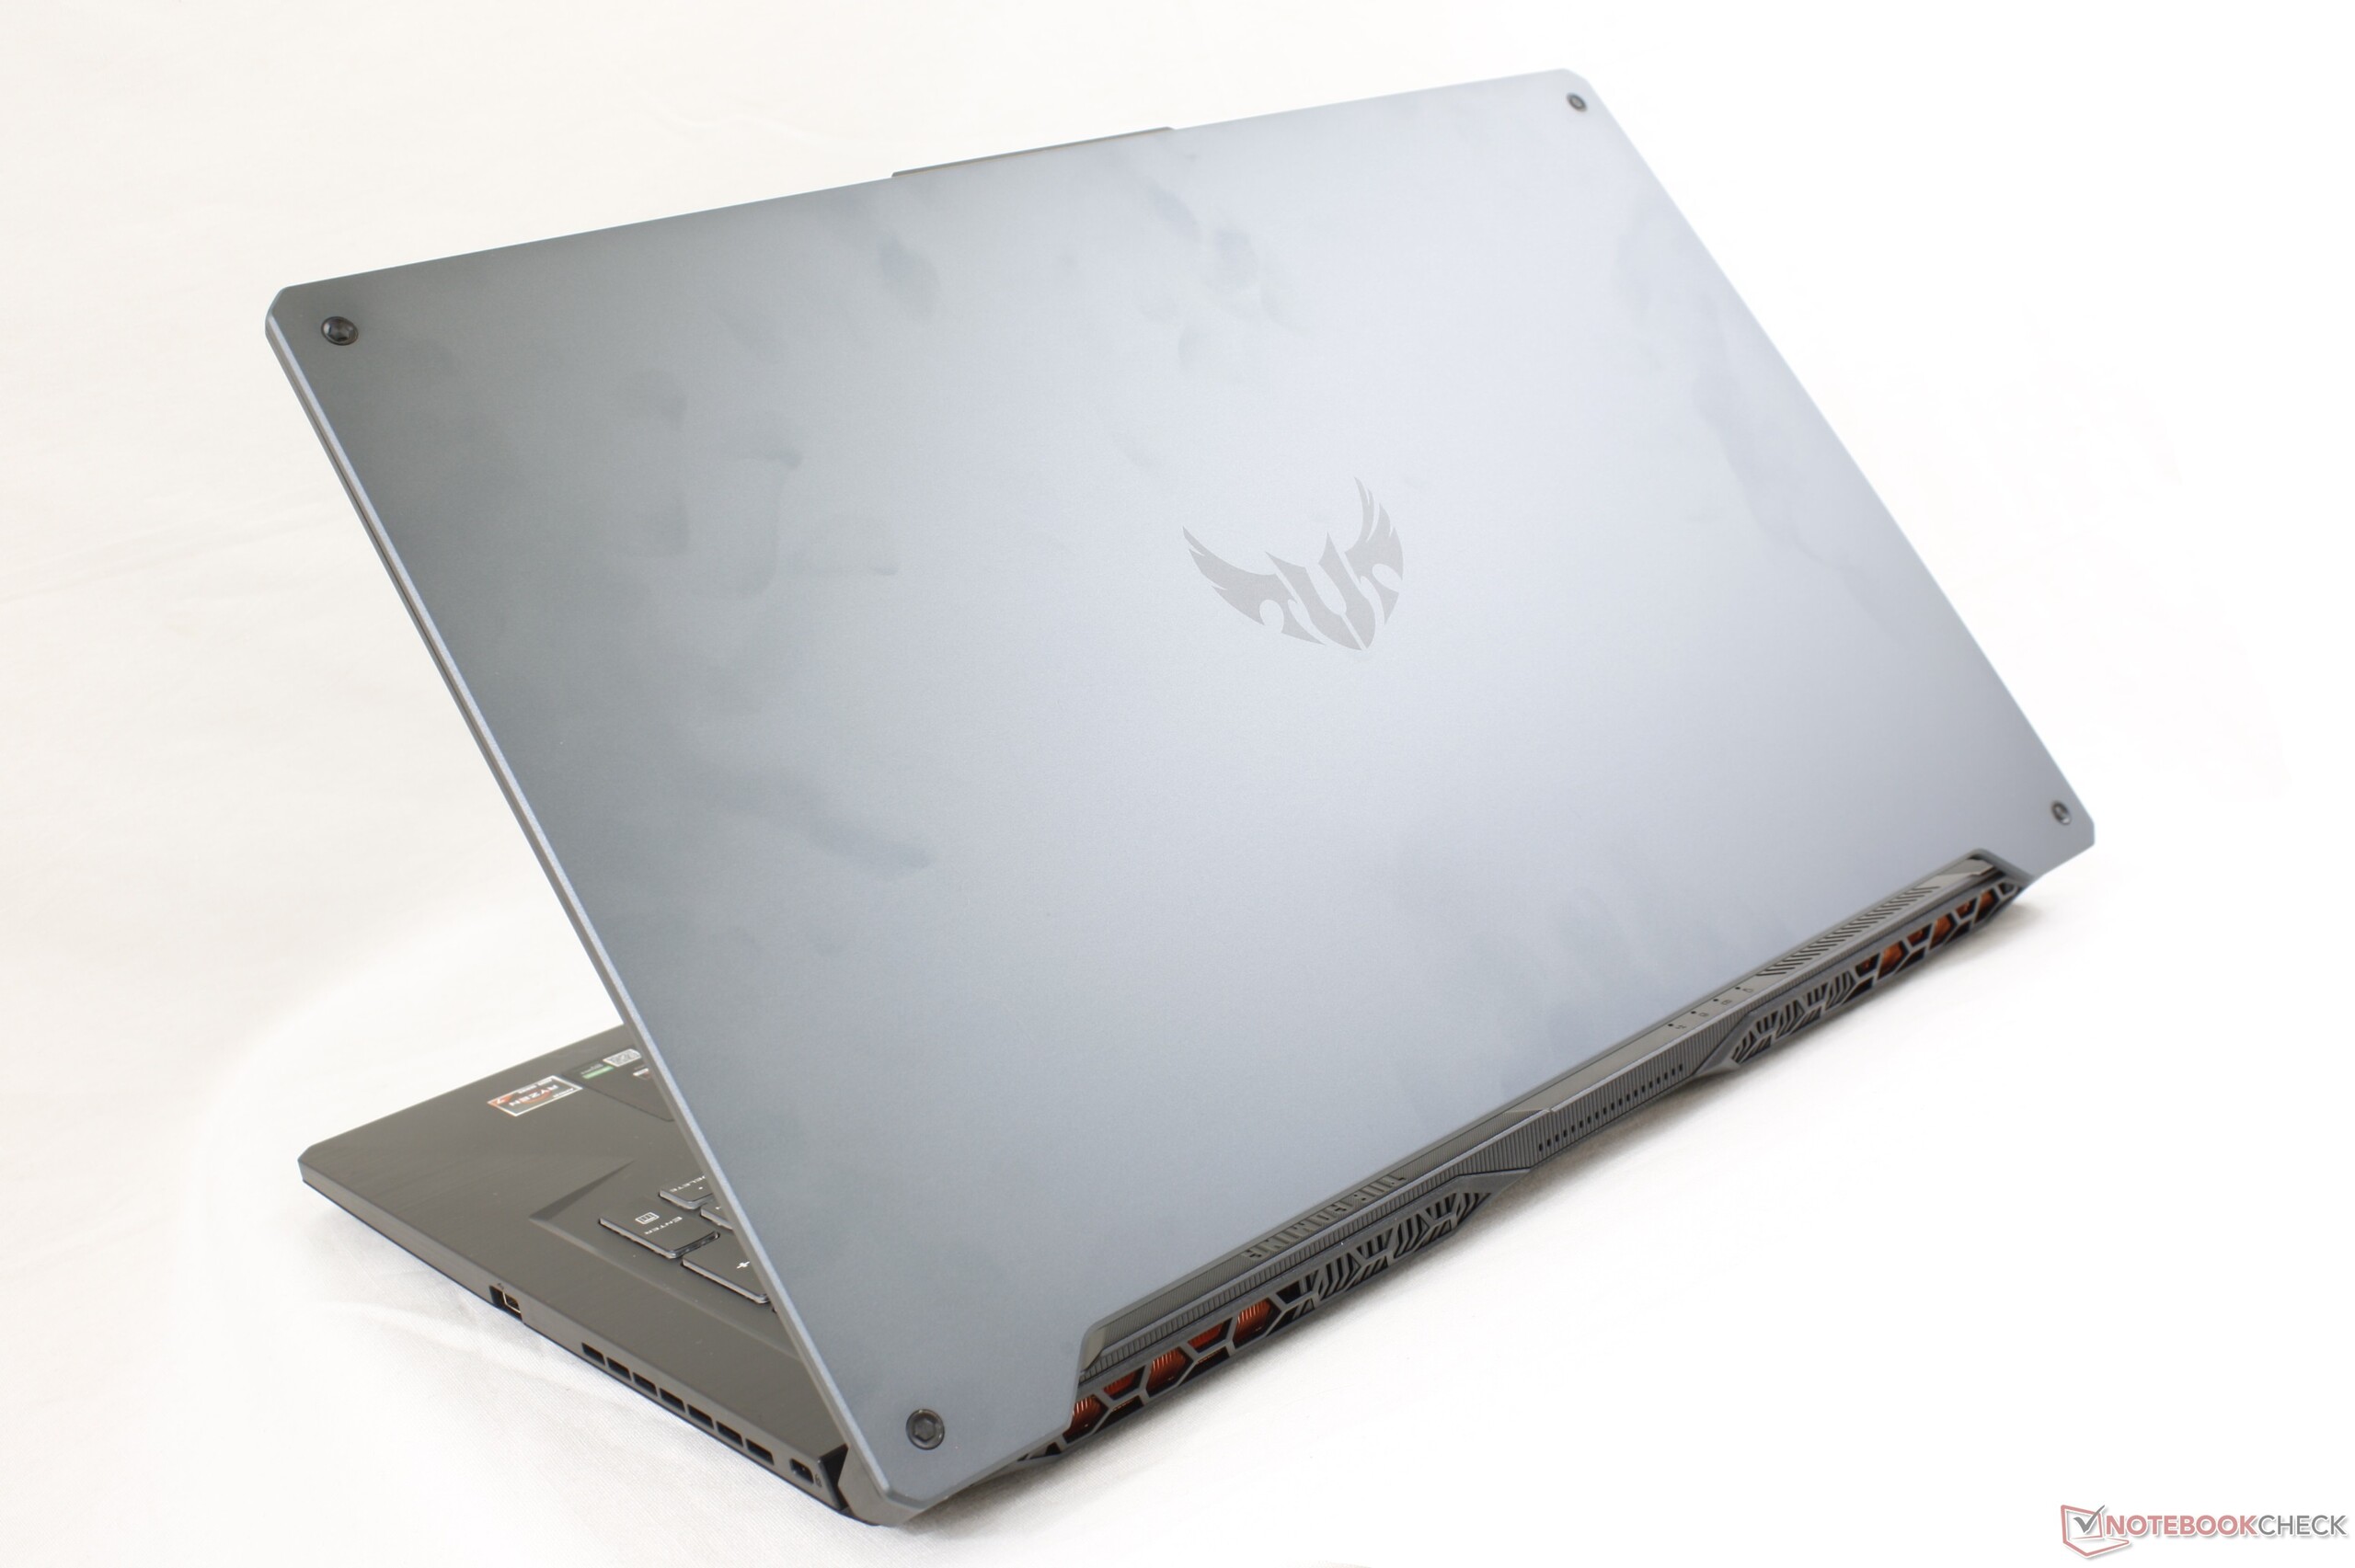
与高端ROG系列相比,TUF系列应该是华硕的性价比游戏笔记本电脑系列。但是,这种最新模具使其在功能和性能方面比我们预期的更接近ROG系列。事实上,您可以得到一个120 Hz的显示屏,具有高刷新率,自适应同步和Optimus驱动,较长的续航时间,易于更换的存储选项,坚固的金属机身以及匹敌酷睿i9的性能,而这一切都来自于一台1100美元(约合人民币8000元)的游戏笔记本电脑非常出色。仅仅几年前,其中一些功能是昂贵的Zephyrus笔记本电脑或其他超薄笔记本电脑所独有的。
当然,必须有一些偷工减料的地方,但大多数是无伤大雅的或表面的。想要单键RGB照明,Wi-Fi 6、144+ Hz刷新率,更快的黑白响应时间,更强大的扬声器,更大的sRGB覆盖范围,Thunderbolt 3和非塑料机身的游戏玩家将不得不花费更多去选择更高端的系列。只要您能够接受吵闹的风扇和不合理的小方向键,TUF系列核心游戏体验便是迄今为止最好的。
TUF FA706是一代巨大升级,使以前的TUF FX705系列看起来像小孩子的玩具。它很容易成为您现在可以购买的性价比最高的游戏笔记本电脑之一,其CPU性能可与大多数Core i9笔记本电脑相媲美,并且机身设计比大多数其他塑料的游戏笔记本电脑更强。
Asus TUF A17 FA706IU-AS76
- 05/25/2020 v7 (old)
Allen Ngo
Price comparison

