技嘉Aorus 15-SA (Core i7-9750H, GTX 1660 Ti, 144 Hz FHD)笔记本电脑评测
| |||||||||||||||||||||||||
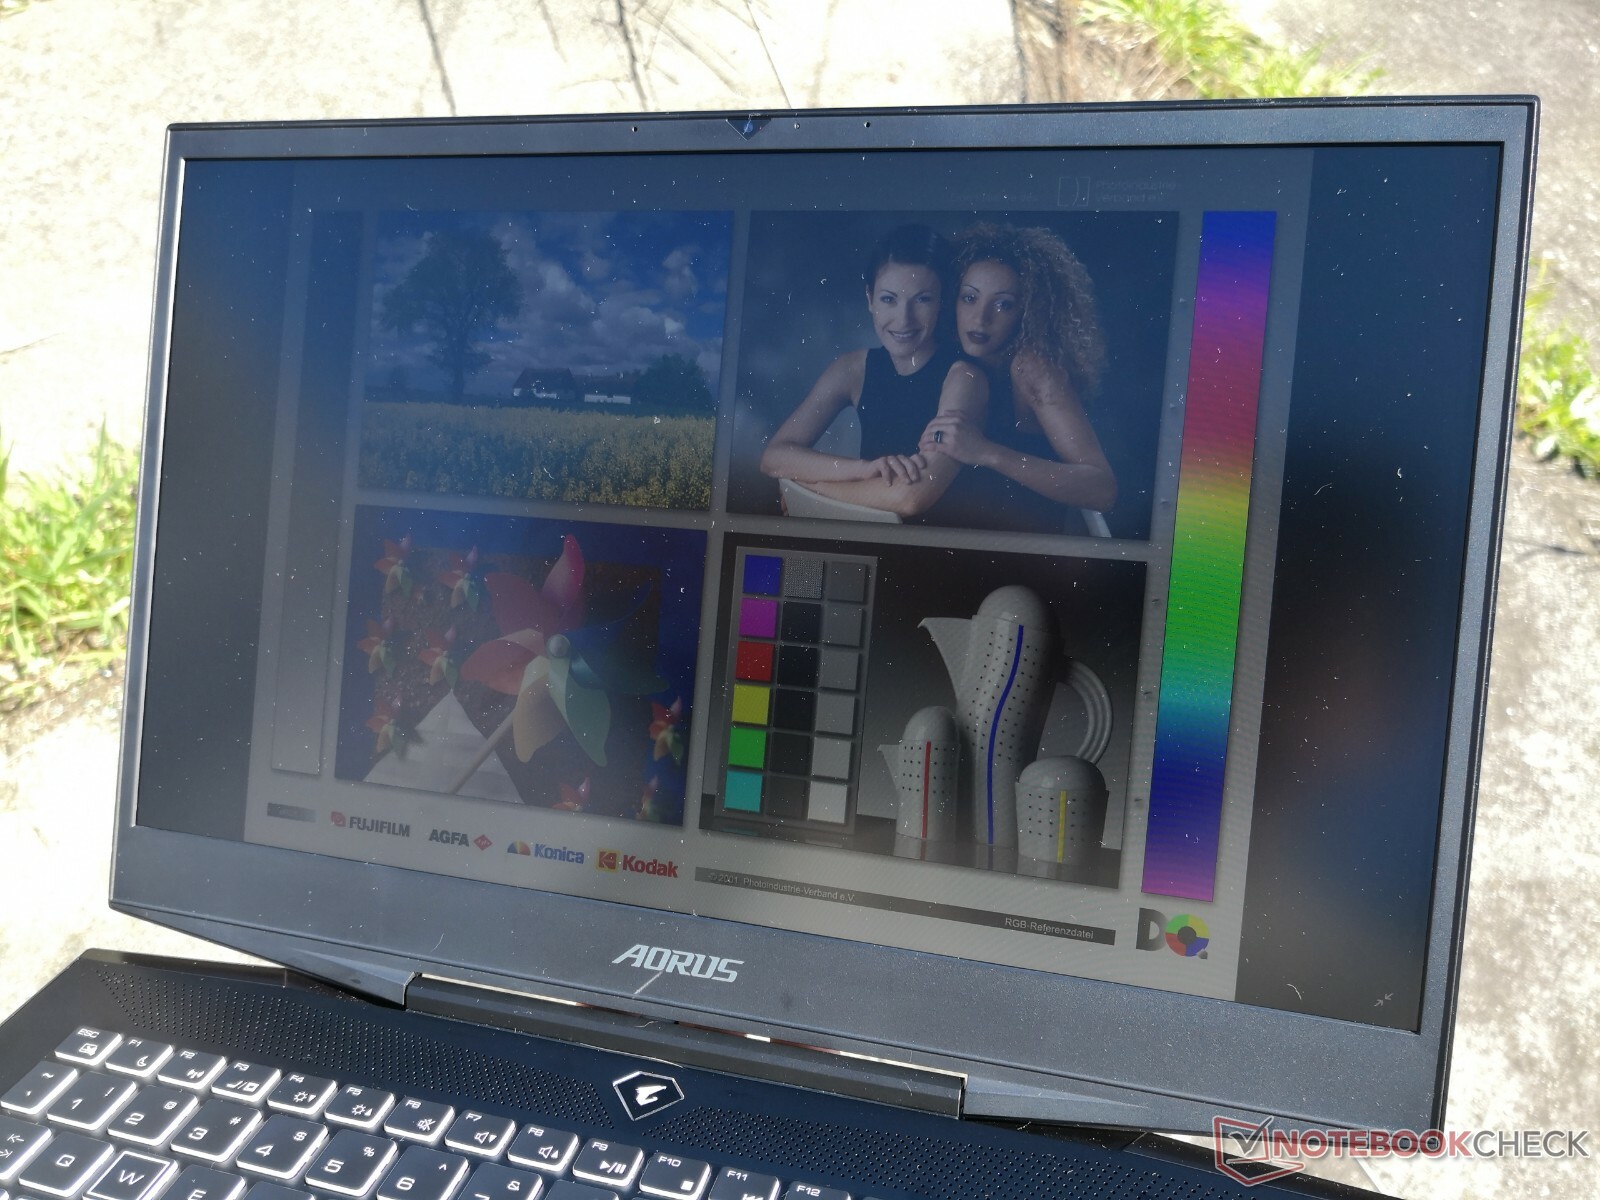
Brightness Distribution: 90 %
Center on Battery: 266 cd/m²
Contrast: 950:1 (Black: 0.28 cd/m²)
ΔE ColorChecker Calman: 3.11 | ∀{0.5-29.43 Ø4.71}
calibrated: 1.37
ΔE Greyscale Calman: 3.94 | ∀{0.09-98 Ø4.96}
93% sRGB (Argyll 1.6.3 3D)
60% AdobeRGB 1998 (Argyll 1.6.3 3D)
65.6% AdobeRGB 1998 (Argyll 3D)
93.6% sRGB (Argyll 3D)
64.3% Display P3 (Argyll 3D)
Gamma: 2.53
CCT: 6210 K
| Aorus 15-SA LG Philips LP156WFG-SPB2 (LGD05E8), IPS, 1920x1080 | Razer Blade 15 Base Model BOE NV156FHM-N61, IPS, 1920x1080 | Asus Zephyrus S GX531GM AU Optronics B156HAN08.2, IPS, 1920x1080 | Lenovo Legion Y530-15ICH LG Display LP156WFG-SPB2, IPS, 1920x1080 | MSI GS65 8RF-019DE Stealth Thin AU Optronics B156HAN08.0 (AUO80ED), IPS, 1920x1080 | Alienware m15 GTX 1070 Max-Q AU Optronics B156HAN, IPS, 1920x1080 | Gigabyte Aero 15 Classic-XA Sharp LQ156M1JW03 (SHP14C5), IGZO, 1920x1080 | |
|---|---|---|---|---|---|---|---|
| Display | -3% | -1% | -2% | 1% | -2% | 2% | |
| Display P3 Coverage (%) | 64.3 | 66.3 3% | 64.9 1% | 62.5 -3% | 66.2 3% | 63.5 -1% | 65.3 2% |
| sRGB Coverage (%) | 93.6 | 86.6 -7% | 90.1 -4% | 93 -1% | 92.1 -2% | 89.4 -4% | 95.5 2% |
| AdobeRGB 1998 Coverage (%) | 65.6 | 63.3 -4% | 65.8 0% | 63.8 -3% | 67.2 2% | 64.5 -2% | 66.5 1% |
| Response Times | -163% | 35% | 9% | -7% | -5% | 8% | |
| Response Time Grey 50% / Grey 80% * (ms) | 15.6 ? | 39.2 ? -151% | 7 ? 55% | 15 ? 4% | 17.6 ? -13% | 18 ? -15% | 15.2 ? 3% |
| Response Time Black / White * (ms) | 12.8 ? | 35.2 ? -175% | 11 ? 14% | 11 ? 14% | 12.8 ? -0% | 12 ? 6% | 11.2 ? 13% |
| PWM Frequency (Hz) | 21190 ? | 23580 ? | |||||
| Screen | -17% | -2% | -16% | 10% | -14% | 3% | |
| Brightness middle (cd/m²) | 266 | 273.6 3% | 323 21% | 305 15% | 254 -5% | 353.6 33% | 266 0% |
| Brightness (cd/m²) | 254 | 262 3% | 309 22% | 284 12% | 262 3% | 346 36% | 248 -2% |
| Brightness Distribution (%) | 90 | 86 -4% | 93 3% | 83 -8% | 89 -1% | 86 -4% | 89 -1% |
| Black Level * (cd/m²) | 0.28 | 0.3 -7% | 0.29 -4% | 0.52 -86% | 0.22 21% | 0.3 -7% | 0.31 -11% |
| Contrast (:1) | 950 | 912 -4% | 1114 17% | 587 -38% | 1155 22% | 1179 24% | 858 -10% |
| Colorchecker dE 2000 * | 3.11 | 3.22 -4% | 4.33 -39% | 3.63 -17% | 2.37 24% | 4.55 -46% | 2.78 11% |
| Colorchecker dE 2000 max. * | 5.84 | 7.61 -30% | 7.64 -31% | 8.18 -40% | 4.71 19% | 7.91 -35% | 5.96 -2% |
| Colorchecker dE 2000 calibrated * | 1.37 | 4.1 -199% | 1.31 4% | 1.84 -34% | 3.37 -146% | 0.91 34% | |
| Greyscale dE 2000 * | 3.94 | 1.4 64% | 4.12 -5% | 4.77 -21% | 1.58 60% | 4.1 -4% | 3.58 9% |
| Gamma | 2.53 87% | 2.24 98% | 2.43 91% | 2.54 87% | 2.48 89% | 2.27 97% | 2.46 89% |
| CCT | 6210 105% | 6636 98% | 7427 88% | 7500 87% | 6785 96% | 7434 87% | 7186 90% |
| Color Space (Percent of AdobeRGB 1998) (%) | 60 | 56.4 -6% | 59 -2% | 59 -2% | 60 0% | 57.9 -3% | 62 3% |
| Color Space (Percent of sRGB) (%) | 93 | 86.2 -7% | 90 -3% | 93 0% | 92 -1% | 88.9 -4% | 96 3% |
| Total Average (Program / Settings) | -61% /
-33% | 11% /
3% | -3% /
-11% | 1% /
6% | -7% /
-11% | 4% /
3% |
* ... smaller is better
Display Response Times
| ↔ Response Time Black to White | ||
|---|---|---|
| 12.8 ms ... rise ↗ and fall ↘ combined | ↗ 8.4 ms rise | 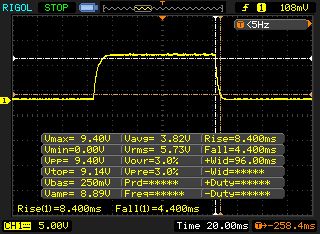 |
| ↘ 4.4 ms fall | ||
| The screen shows good response rates in our tests, but may be too slow for competitive gamers. In comparison, all tested devices range from 0.1 (minimum) to 240 (maximum) ms. » 33 % of all devices are better. This means that the measured response time is better than the average of all tested devices (19.8 ms). | ||
| ↔ Response Time 50% Grey to 80% Grey | ||
| 15.6 ms ... rise ↗ and fall ↘ combined | ↗ 8 ms rise | 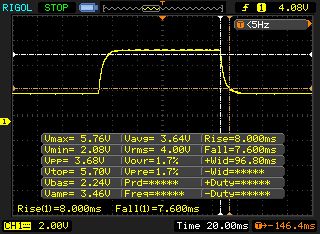 |
| ↘ 7.6 ms fall | ||
| The screen shows good response rates in our tests, but may be too slow for competitive gamers. In comparison, all tested devices range from 0.165 (minimum) to 636 (maximum) ms. » 30 % of all devices are better. This means that the measured response time is better than the average of all tested devices (30.9 ms). | ||
Screen Flickering / PWM (Pulse-Width Modulation)
| Screen flickering / PWM not detected | 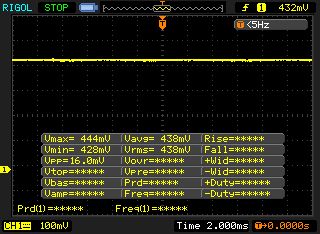 | ||
In comparison: 52 % of all tested devices do not use PWM to dim the display. If PWM was detected, an average of 7741 (minimum: 5 - maximum: 343500) Hz was measured. | |||
| Cinebench R10 | |
| Rendering Single 32Bit | |
| Average of class Gaming (7457 - 12575, n=9, last 2 years) | |
| Gigabyte Aero 15 Classic-XA | |
| Aorus 15-SA | |
| Asus Zephyrus S GX531GM | |
| Rendering Multiple CPUs 32Bit | |
| Average of class Gaming (42932 - 102066, n=9, last 2 years) | |
| Gigabyte Aero 15 Classic-XA | |
| Aorus 15-SA | |
| Asus Zephyrus S GX531GM | |
| Cinebench R20 | |
| CPU (Single Core) | |
| Average of class Gaming (622 - 913, n=103, last 2 years) | |
| Gigabyte Aero 15 Classic-XA | |
| Aorus 15-SA | |
| CPU (Multi Core) | |
| Average of class Gaming (4029 - 16433, n=103, last 2 years) | |
| Gigabyte Aero 15 Classic-XA | |
| Aorus 15-SA | |
| Geekbench 3 | |
| 32 Bit Multi-Core Score | |
| Gigabyte Aero 15 Classic-XA | |
| Asus Zephyrus S GX531GM | |
| Aorus 15-SA | |
| 32 Bit Single-Core Score | |
| Gigabyte Aero 15 Classic-XA | |
| Aorus 15-SA | |
| Asus Zephyrus S GX531GM | |
| Geekbench 4.4 | |
| 64 Bit Multi-Core Score | |
| Average of class Gaming (89200 - 101054, n=3, last 2 years) | |
| Gigabyte Aero 15 Classic-XA | |
| Aorus 15-SA | |
| Asus Zephyrus S GX531GM | |
| 64 Bit Single-Core Score | |
| Average of class Gaming (9335 - 9775, n=3, last 2 years) | |
| Gigabyte Aero 15 Classic-XA | |
| Aorus 15-SA | |
| Asus Zephyrus S GX531GM | |
| Mozilla Kraken 1.1 - Total | |
| Razer Blade 15 Base Model (Edge 42.17134.1.0) | |
| Alienware m15 GTX 1070 Max-Q (Edge 42.17134.1.0) | |
| Aorus 15-SA (Edge 44) | |
| Gigabyte Aero 15 Classic-XA (Edge 44) | |
| Lenovo Legion Y530-15ICH | |
| Average of class Gaming (391 - 590, n=100, last 2 years) | |
| Octane V2 - Total Score | |
| Average of class Gaming (93292 - 139447, n=26, last 2 years) | |
| Lenovo Legion Y530-15ICH | |
| Gigabyte Aero 15 Classic-XA (Edge 44) | |
| Aorus 15-SA (Edge 44) | |
| Alienware m15 GTX 1070 Max-Q (Edge 42.17134.1.0) | |
| Razer Blade 15 Base Model (Edge 42.17134.1.0) | |
| JetStream 1.1 - 1.1 Total | |
| Average of class Gaming (549 - 647, n=2, last 2 years) | |
| Alienware m15 GTX 1070 Max-Q (Edge 42.17134.1.0) | |
| Gigabyte Aero 15 Classic-XA (Edge 44) | |
| Asus Zephyrus S GX531GM (Edge 44) | |
| Aorus 15-SA (Edge 44) | |
| Razer Blade 15 Base Model (Edge 42.17134.1.0) | |
| Lenovo Legion Y530-15ICH | |
* ... smaller is better
| PCMark 7 Score | 7445 points | |
| PCMark 8 Home Score Accelerated v2 | 5081 points | |
| PCMark 8 Creative Score Accelerated v2 | 6075 points | |
| PCMark 8 Work Score Accelerated v2 | 5913 points | |
| PCMark 10 Score | 5761 points | |
Help | ||

| Aorus 15-SA Intel SSD 760p SSDPEKKW512G8 | Razer Blade 15 Base Model Samsung SSD PM981 MZVLB256HAHQ | Asus Zephyrus S GX531GM Intel SSD 660p SSDPEKNW512G8 | Lenovo Legion Y530-15ICH Samsung SSD PM981 MZVLB256HAHQ | MSI GS65 8RF-019DE Stealth Thin Samsung SSD PM981 MZVLB512HAJQ | Alienware m15 GTX 1070 Max-Q Toshiba XG5 KXG50ZNV512G | Gigabyte Aero 15 Classic-XA Intel SSD 760p SSDPEKKW512G8 | |
|---|---|---|---|---|---|---|---|
| CrystalDiskMark 5.2 / 6 | -6% | -26% | -11% | -8% | -23% | 6% | |
| Write 4K (MB/s) | 104 | 112.5 8% | 100.8 -3% | 108.9 5% | 95.3 -8% | 107.4 3% | 115.5 11% |
| Read 4K (MB/s) | 55.1 | 43.09 -22% | 48.75 -12% | 40.23 -27% | 40.13 -27% | 42.91 -22% | 58 5% |
| Write Seq (MB/s) | 1519 | 1450 -5% | 975 -36% | 1390 -8% | 1883 24% | 467.5 -69% | 1555 2% |
| Read Seq (MB/s) | 2486 | 1392 -44% | 1344 -46% | 964 -61% | 1322 -47% | 2335 -6% | 2590 4% |
| Write 4K Q32T1 (MB/s) | 320.5 | 356.1 11% | 283.7 -11% | 314.2 -2% | 309.9 -3% | 289.7 -10% | 369.3 15% |
| Read 4K Q32T1 (MB/s) | 431.8 | 406.9 -6% | 330.3 -24% | 369.2 -14% | 353.7 -18% | 354.4 -18% | 441.7 2% |
| Write Seq Q32T1 (MB/s) | 1498 | 1451 -3% | 986 -34% | 1506 1% | 1919 28% | 460.9 -69% | 1547 3% |
| Read Seq Q32T1 (MB/s) | 2868 | 3272 14% | 1579 -45% | 3446 20% | 2466 -14% | 3111 8% | 2969 4% |
| 3DMark 06 Standard Score | 38166 points | |
| 3DMark 11 Performance | 17701 points | |
| 3DMark Ice Storm Standard Score | 167159 points | |
| 3DMark Cloud Gate Standard Score | 33672 points | |
| 3DMark Fire Strike Score | 13409 points | |
| 3DMark Time Spy Score | 5944 points | |
Help | ||
| The Witcher 3 - 1920x1080 Ultra Graphics & Postprocessing (HBAO+) | |
| Average of class Gaming (104.7 - 240, n=7, last 2 years) | |
| Gigabyte Aero 15 Classic-XA | |
| Aorus 15-SA | |
| Alienware m15 GTX 1070 Max-Q | |
| MSI GS65 8RF-019DE Stealth Thin | |
| Lenovo Legion Y530-15ICH | |
| Asus Zephyrus S GX531GM | |
| Razer Blade 15 Base Model | |
| BioShock Infinite - 1920x1080 Ultra Preset, DX11 (DDOF) | |
| Gigabyte Aero 15 Classic-XA | |
| Aorus 15-SA | |
| Alienware m15 GTX 1070 Max-Q | |
| Lenovo Legion Y530-15ICH | |
| Razer Blade 15 Base Model | |
| Asus Zephyrus S GX531GM | |
| GTA V - 1920x1080 Highest AA:4xMSAA + FX AF:16x | |
| Average of class Gaming (67.1 - 186.9, n=90, last 2 years) | |
| Aorus 15-SA | |
| Asus Zephyrus S GX531GM | |
| X-Plane 11.11 - 1920x1080 high (fps_test=3) | |
| Average of class Gaming (55.5 - 148.5, n=106, last 2 years) | |
| Aorus 15-SA | |
| Asus Zephyrus S GX531GM | |
| World of Tanks enCore - 1920x1080 Ultra AA:TSSAA HQ | |
| Gigabyte Aero 15 Classic-XA | |
| Aorus 15-SA | |
| low | med. | high | ultra | |
|---|---|---|---|---|
| BioShock Infinite (2013) | 331.2 | 287.2 | 252 | 140.3 |
| GTA V (2015) | 152.7 | 142.5 | 123.7 | 68.1 |
| The Witcher 3 (2015) | 257.1 | 180.8 | 104.3 | 57.1 |
| World of Warships (2015) | 220.1 | 179.7 | 148.2 | 141.1 |
| X-Plane 11.11 (2018) | 105.3 | 95 | 79.8 | |
| World of Tanks enCore (2018) | 559 | 247.6 | 119.3 | |
| Forza Horizon 4 (2018) | 161 | 134 | 125 | 99 |
| Far Cry New Dawn (2019) | 104 | 90 | 86 | 78 |
| Metro Exodus (2019) | 123.9 | 64.1 | 48.7 | 39.6 |
| Rage 2 (2019) | 162.7 | 81.6 | 69.5 | 67.9 |
Noise level
| Idle |
| 32 / 35 / 41 dB(A) |
| Load |
| 54 / 56 dB(A) |
 | ||
30 dB silent 40 dB(A) audible 50 dB(A) loud |
||
min: | ||
| Aorus 15-SA i7-9750H, GeForce GTX 1660 Ti Mobile | Razer Blade 15 Base Model i7-8750H, GeForce GTX 1060 Max-Q | Asus Zephyrus S GX531GM i7-8750H, GeForce GTX 1060 Mobile | Lenovo Legion Y530-15ICH i7-8750H, GeForce GTX 1060 Mobile | MSI GS65 8RF-019DE Stealth Thin i7-8750H, GeForce GTX 1070 Max-Q | Alienware m15 GTX 1070 Max-Q i7-8750H, GeForce GTX 1070 Max-Q | Gigabyte Aero 15 Classic-XA i7-9750H, GeForce RTX 2070 Max-Q | Average of class Gaming | |
|---|---|---|---|---|---|---|---|---|
| Noise | 11% | 16% | 14% | 13% | 14% | 3% | 18% | |
| off / environment * (dB) | 29 | 27.8 4% | 30.3 -4% | 30.2 -4% | 30 -3% | 28.6 1% | 30 -3% | 24.1 ? 17% |
| Idle Minimum * (dB) | 32 | 31 3% | 30.3 5% | 30.9 3% | 30 6% | 28.6 11% | 31 3% | 25.9 ? 19% |
| Idle Average * (dB) | 35 | 31.2 11% | 33.2 5% | 30.9 12% | 31 11% | 28.6 18% | 34 3% | 27.4 ? 22% |
| Idle Maximum * (dB) | 41 | 31.3 24% | 33.2 19% | 31.6 23% | 34 17% | 28.6 30% | 39 5% | 30.1 ? 27% |
| Load Average * (dB) | 54 | 47.2 13% | 32.3 40% | 42.3 22% | 43 20% | 40.8 24% | 46 15% | 43.7 ? 19% |
| Witcher 3 ultra * (dB) | 52 | 51.3 1% | 42 19% | 49.6 5% | 53 -2% | |||
| Load Maximum * (dB) | 56 | 44.3 21% | 39 30% | 40 29% | 44 21% | 49.6 11% | 55 2% | 54.3 ? 3% |
* ... smaller is better
(±) The maximum temperature on the upper side is 44 °C / 111 F, compared to the average of 40.4 °C / 105 F, ranging from 21.2 to 68.8 °C for the class Gaming.
(-) The bottom heats up to a maximum of 58 °C / 136 F, compared to the average of 43.2 °C / 110 F
(+) In idle usage, the average temperature for the upper side is 28.9 °C / 84 F, compared to the device average of 33.9 °C / 93 F.
(±) Playing The Witcher 3, the average temperature for the upper side is 37.6 °C / 100 F, compared to the device average of 33.9 °C / 93 F.
(±) The palmrests and touchpad can get very hot to the touch with a maximum of 39 °C / 102.2 F.
(-) The average temperature of the palmrest area of similar devices was 28.8 °C / 83.8 F (-10.2 °C / -18.4 F).
| Aorus 15-SA i7-9750H, GeForce GTX 1660 Ti Mobile | Razer Blade 15 Base Model i7-8750H, GeForce GTX 1060 Max-Q | Asus Zephyrus S GX531GM i7-8750H, GeForce GTX 1060 Mobile | Lenovo Legion Y530-15ICH i7-8750H, GeForce GTX 1060 Mobile | MSI GS65 8RF-019DE Stealth Thin i7-8750H, GeForce GTX 1070 Max-Q | Alienware m15 GTX 1070 Max-Q i7-8750H, GeForce GTX 1070 Max-Q | Gigabyte Aero 15 Classic-XA i7-9750H, GeForce RTX 2070 Max-Q | Average of class Gaming | |
|---|---|---|---|---|---|---|---|---|
| Heat | 8% | 12% | 10% | 7% | -1% | -8% | 3% | |
| Maximum Upper Side * (°C) | 44 | 45.2 -3% | 47.7 -8% | 48.4 -10% | 49 -11% | 52 -18% | 58 -32% | 45.1 ? -3% |
| Maximum Bottom * (°C) | 58 | 46.4 20% | 46.1 21% | 48 17% | 63 -9% | 55.6 4% | 64 -10% | 48.1 ? 17% |
| Idle Upper Side * (°C) | 30 | 27.2 9% | 26.2 13% | 26.7 11% | 24 20% | 29.8 1% | 30 -0% | 31 ? -3% |
| Idle Bottom * (°C) | 34 | 32.8 4% | 27.1 20% | 26.9 21% | 25 26% | 31 9% | 31 9% | 34.2 ? -1% |
* ... smaller is better
Aorus 15-SA audio analysis
(±) | speaker loudness is average but good (77 dB)
Bass 100 - 315 Hz
(-) | nearly no bass - on average 19.7% lower than median
(±) | linearity of bass is average (10.4% delta to prev. frequency)
Mids 400 - 2000 Hz
(+) | balanced mids - only 3.5% away from median
(+) | mids are linear (5.6% delta to prev. frequency)
Highs 2 - 16 kHz
(+) | balanced highs - only 2.7% away from median
(+) | highs are linear (5.9% delta to prev. frequency)
Overall 100 - 16.000 Hz
(±) | linearity of overall sound is average (19.5% difference to median)
Compared to same class
» 68% of all tested devices in this class were better, 7% similar, 26% worse
» The best had a delta of 6%, average was 18%, worst was 132%
Compared to all devices tested
» 49% of all tested devices were better, 7% similar, 44% worse
» The best had a delta of 4%, average was 23%, worst was 134%
Gigabyte Aero 15 Classic-XA audio analysis
(+) | speakers can play relatively loud (82 dB)
Bass 100 - 315 Hz
(-) | nearly no bass - on average 17% lower than median
(±) | linearity of bass is average (10.2% delta to prev. frequency)
Mids 400 - 2000 Hz
(+) | balanced mids - only 4.7% away from median
(+) | mids are linear (6.2% delta to prev. frequency)
Highs 2 - 16 kHz
(+) | balanced highs - only 2.3% away from median
(+) | highs are linear (5.5% delta to prev. frequency)
Overall 100 - 16.000 Hz
(±) | linearity of overall sound is average (15.5% difference to median)
Compared to same class
» 35% of all tested devices in this class were better, 7% similar, 58% worse
» The best had a delta of 6%, average was 18%, worst was 132%
Compared to all devices tested
» 23% of all tested devices were better, 4% similar, 73% worse
» The best had a delta of 4%, average was 23%, worst was 134%
| Off / Standby | |
| Idle | |
| Load |
|
Key:
min: | |
| Aorus 15-SA i7-9750H, GeForce GTX 1660 Ti Mobile | Razer Blade 15 Base Model i7-8750H, GeForce GTX 1060 Max-Q | Asus Zephyrus S GX531GM i7-8750H, GeForce GTX 1060 Mobile | Lenovo Legion Y530-15ICH i7-8750H, GeForce GTX 1060 Mobile | MSI GS65 8RF-019DE Stealth Thin i7-8750H, GeForce GTX 1070 Max-Q | Alienware m15 GTX 1070 Max-Q i7-8750H, GeForce GTX 1070 Max-Q | Gigabyte Aero 15 Classic-XA i7-9750H, GeForce RTX 2070 Max-Q | Average of class Gaming | |
|---|---|---|---|---|---|---|---|---|
| Power Consumption | 26% | 14% | 30% | 22% | 22% | -10% | -2% | |
| Idle Minimum * (Watt) | 20 | 10.2 49% | 13.8 31% | 7.3 63% | 7 65% | 7.6 62% | 21 -5% | 13.1 ? 34% |
| Idle Average * (Watt) | 23 | 13.2 43% | 20.9 9% | 11.1 52% | 11 52% | 13.8 40% | 23 -0% | 19 ? 17% |
| Idle Maximum * (Watt) | 29 | 17.6 39% | 26 10% | 12.6 57% | 20 31% | 14.6 50% | 32 -10% | 24.6 ? 15% |
| Load Average * (Watt) | 87 | 99.5 -14% | 89 -2% | 109 -25% | 98 -13% | 97.6 -12% | 97 -11% | 111.3 ? -28% |
| Witcher 3 ultra * (Watt) | 136 | 113.6 16% | 132 3% | 145.8 -7% | 148 -9% | |||
| Load Maximum * (Watt) | 173 | 133.3 23% | 131 24% | 168 3% | 182 -5% | 172.5 -0% | 213 -23% | 260 ? -50% |
* ... smaller is better
| Aorus 15-SA i7-9750H, GeForce GTX 1660 Ti Mobile, 62 Wh | Razer Blade 15 Base Model i7-8750H, GeForce GTX 1060 Max-Q, 65 Wh | Asus Zephyrus S GX531GM i7-8750H, GeForce GTX 1060 Mobile, 53 Wh | Lenovo Legion Y530-15ICH i7-8750H, GeForce GTX 1060 Mobile, 52 Wh | MSI GS65 8RF-019DE Stealth Thin i7-8750H, GeForce GTX 1070 Max-Q, 82 Wh | Alienware m15 GTX 1070 Max-Q i7-8750H, GeForce GTX 1070 Max-Q, 90 Wh | Gigabyte Aero 15 Classic-XA i7-9750H, GeForce RTX 2070 Max-Q, 94.24 Wh | Average of class Gaming | |
|---|---|---|---|---|---|---|---|---|
| Battery runtime | 100% | 14% | 31% | 85% | 120% | 126% | 112% | |
| Reader / Idle (h) | 3.5 | 11.5 229% | 8.3 137% | 8.5 143% | 10.5 200% | 9.1 160% | 7.84 ? 124% | |
| H.264 (h) | 2.8 | 5.9 111% | 6.8 143% | 8.27 ? 195% | ||||
| WiFi v1.3 (h) | 2.8 | 5.5 96% | 3.2 14% | 3.8 36% | 6 114% | 7.7 175% | 7 150% | 7.08 ? 153% |
| Load (h) | 2 | 1.5 -25% | 0.4 -80% | 1.4 -30% | 1.7 -15% | 3 50% | 1.496 ? -25% |
Pros
Cons
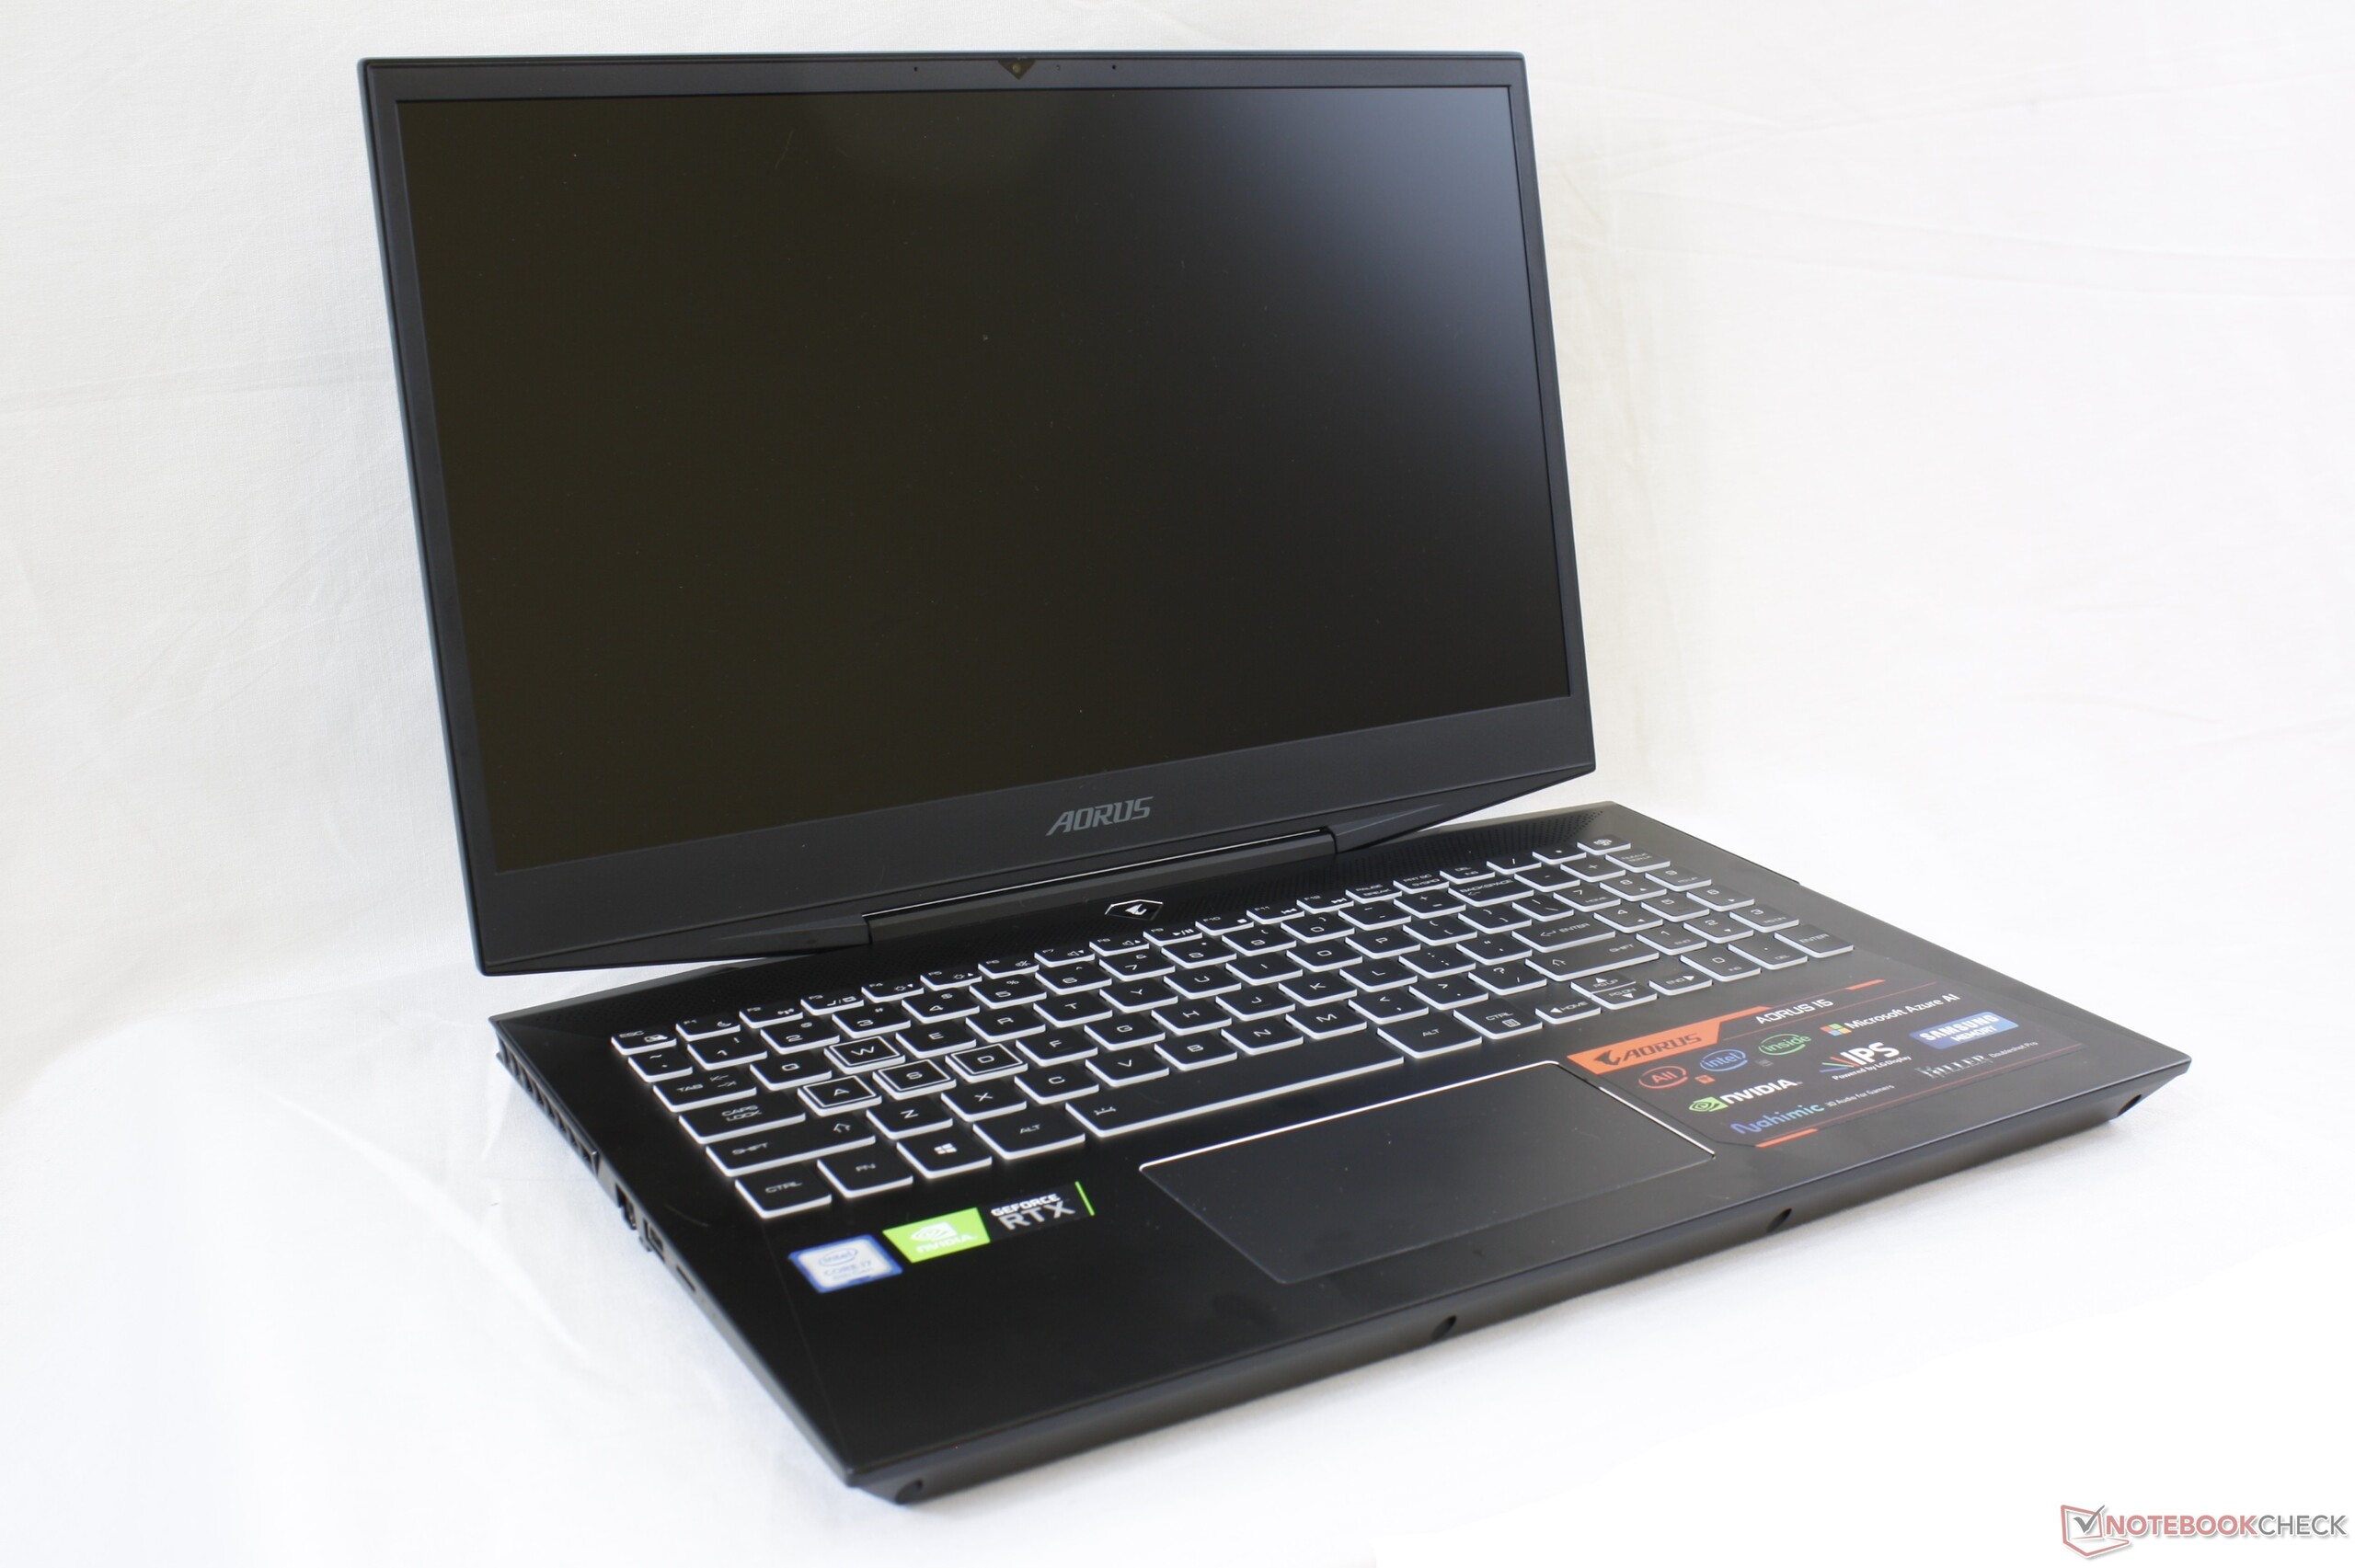
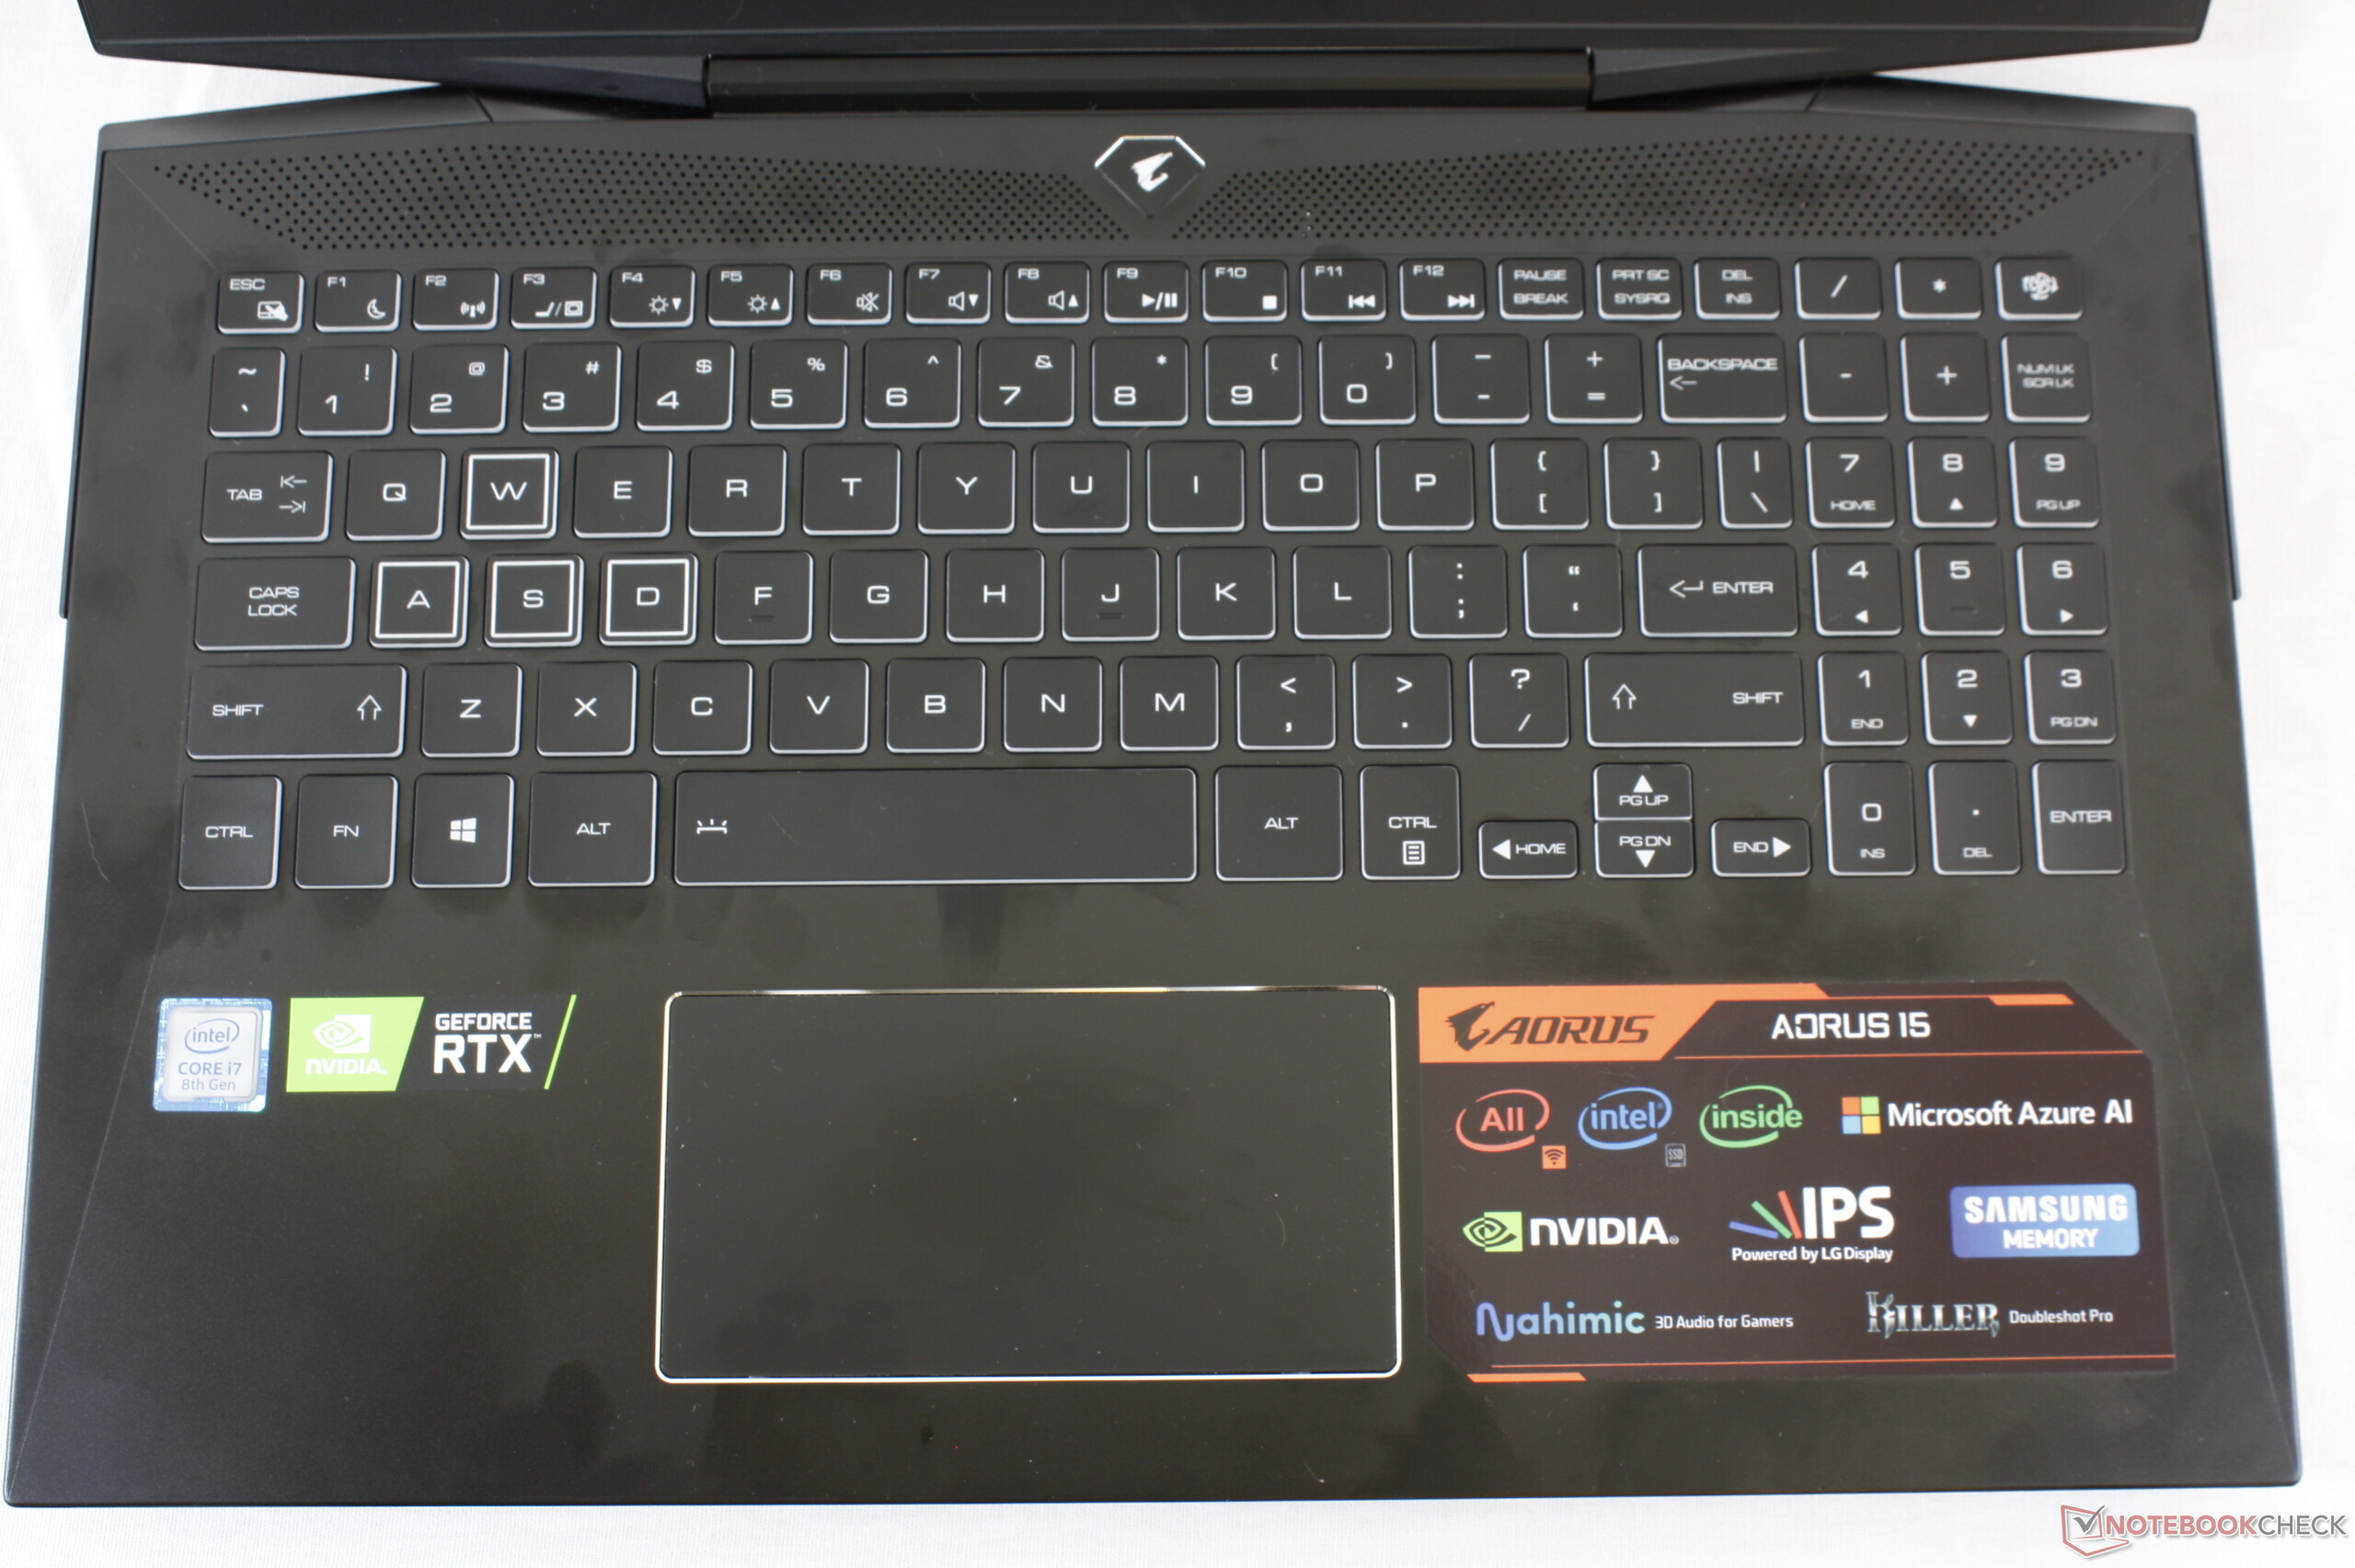
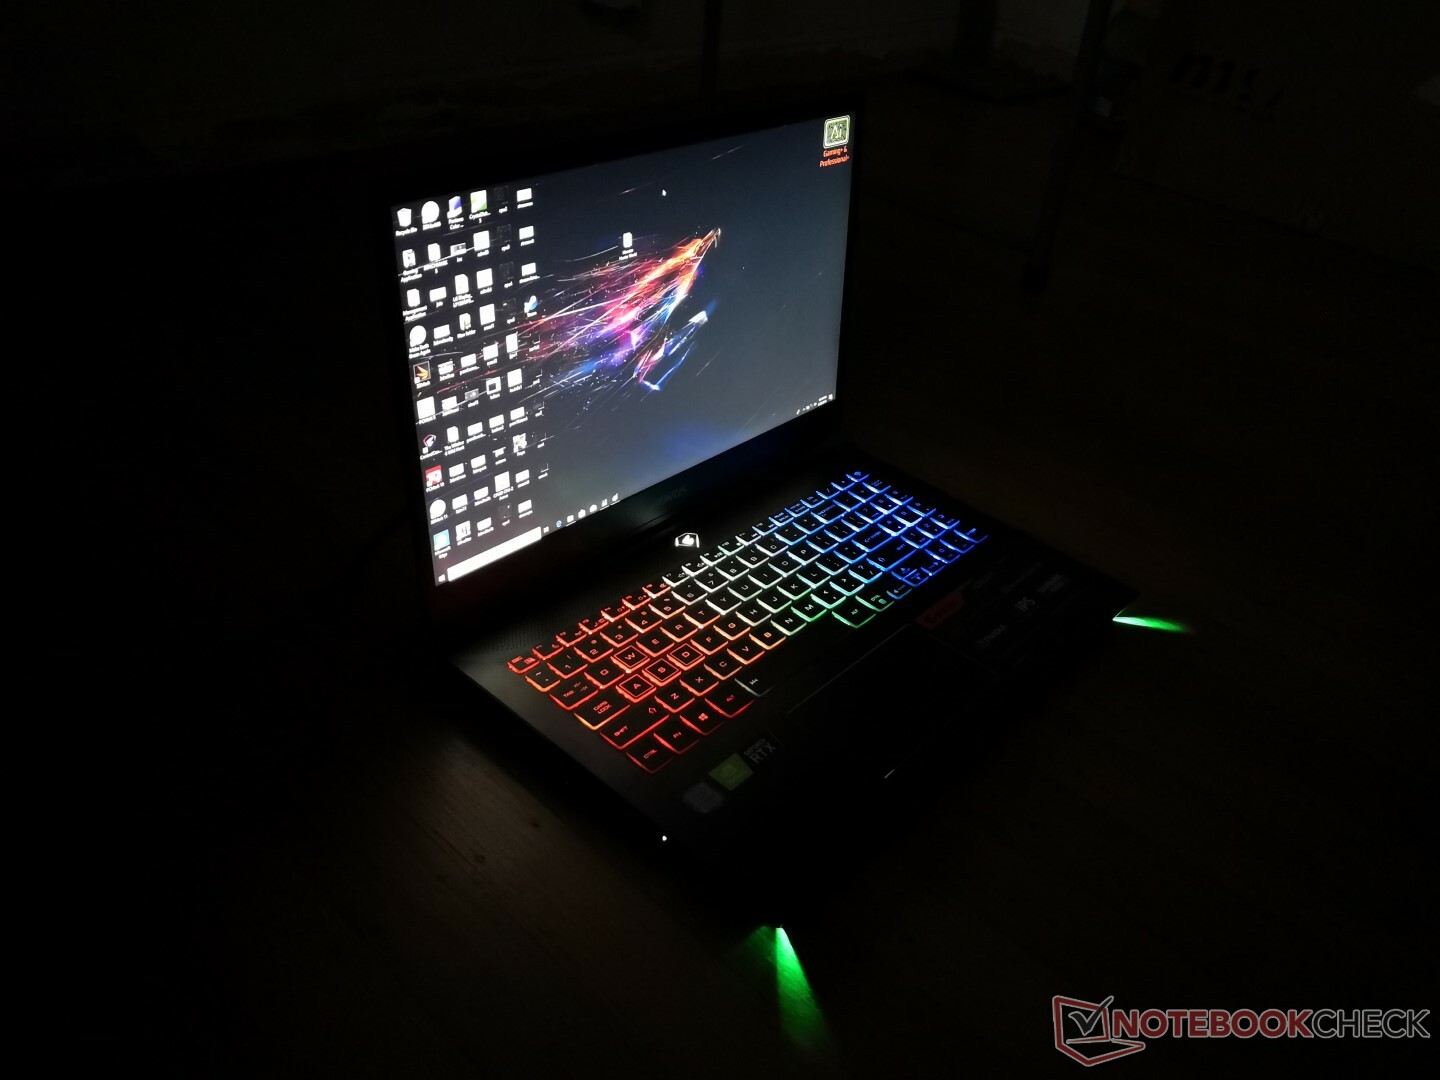
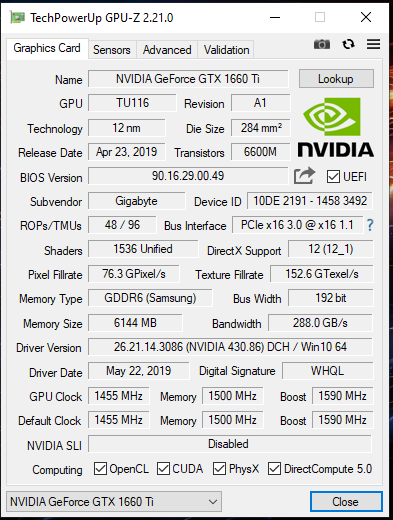
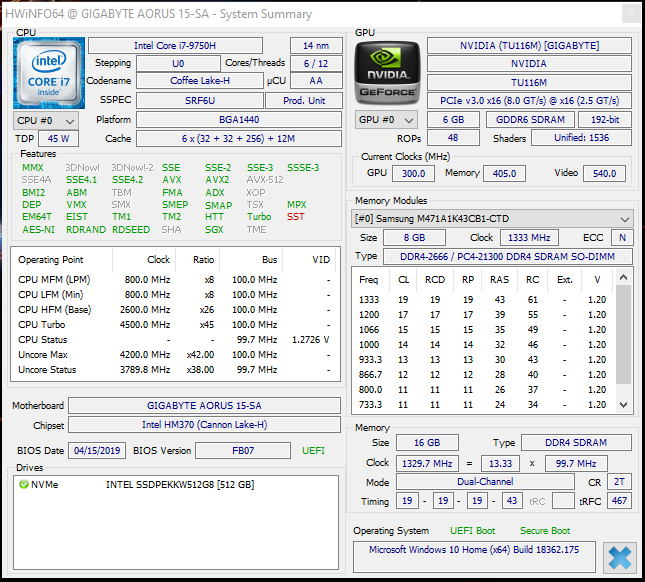
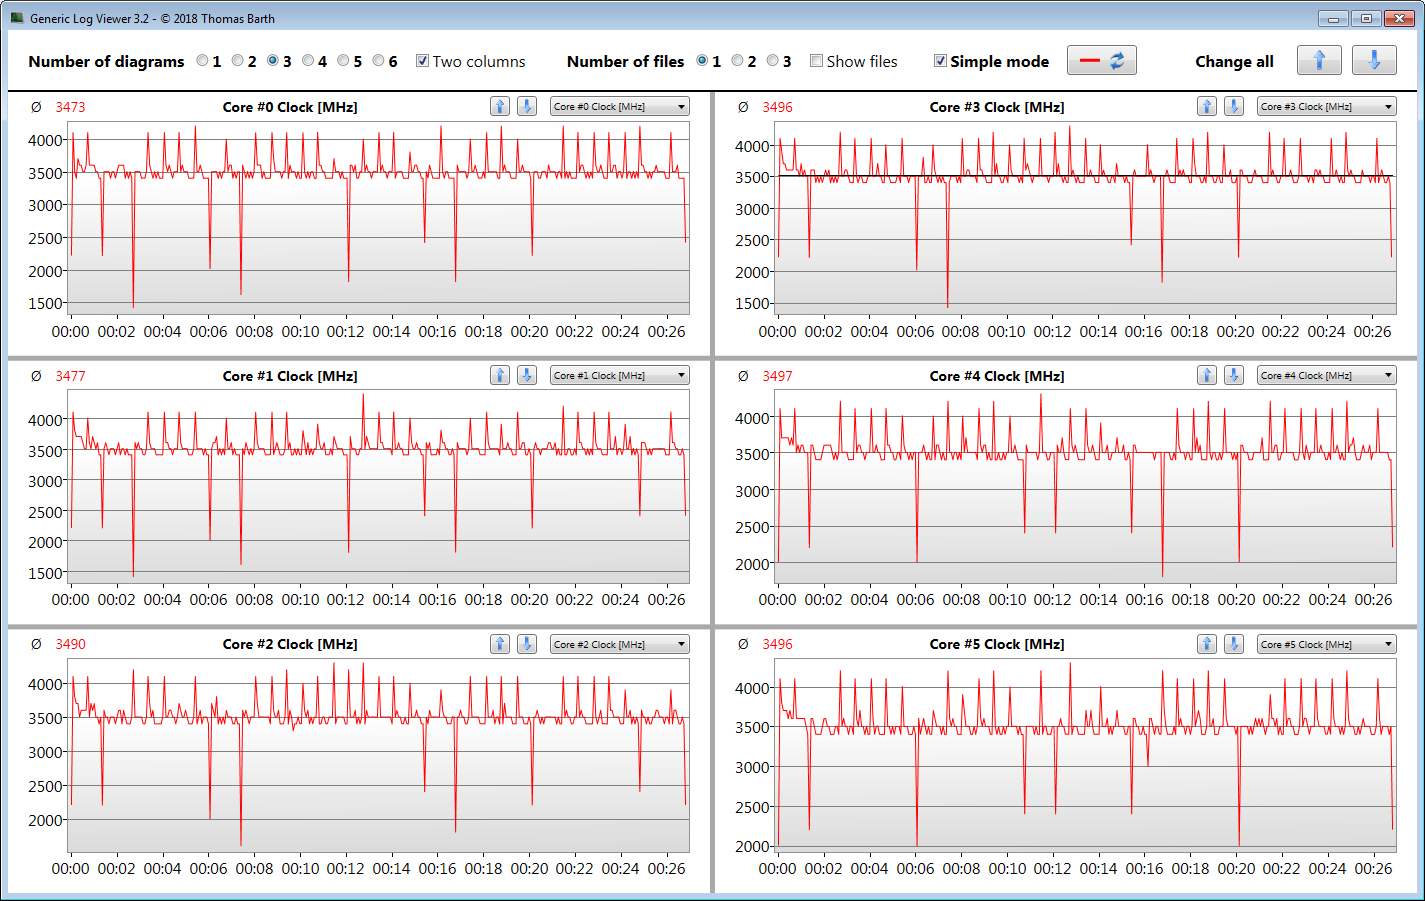
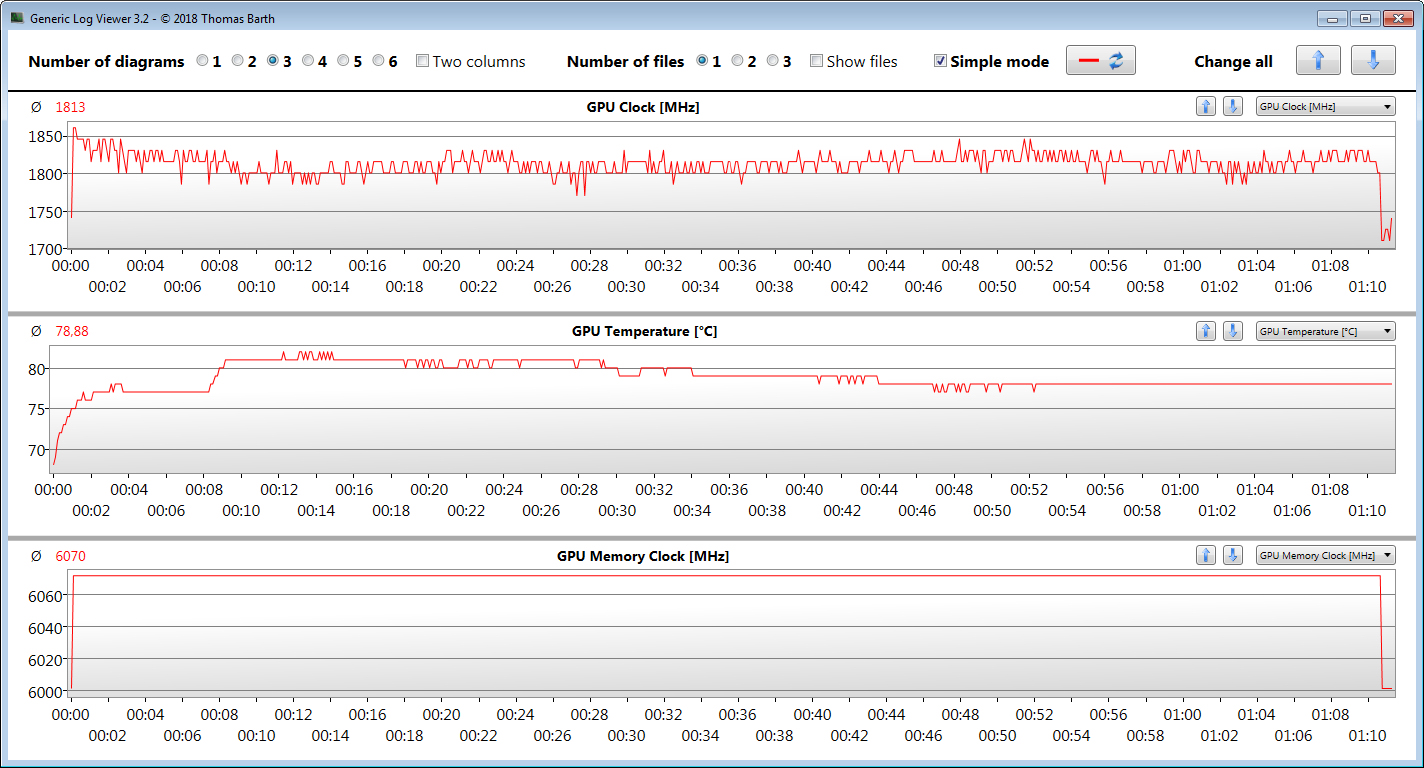
技嘉为Aorus 15-SA配备了先进的硬件组合。其Core i7-9750H处理器和GeForce GTX 1660 Ti GPU可以流畅的运行所有3A游戏,并充分利用15-SA的144 Hz显示屏。不要低估GTX 1660 Ti的性能,因为它几乎达到了GeForce RTX 2060的水准。不过Aorus 15-SA不是一款酷炫安静的游戏笔记本电脑。
Gigabyte Aorus 15-SA是一款不错的机子:一款真正的15.6英寸游戏笔记本电脑,可以在所有现代游戏中派上用场。不过它也并非没有缺点。
技嘉还为该设备配备了快速的NVMe SSD,确保系统始终顺畅运行。如果512 GB的存储空间不足,您可以随时添加第二个M.2 2280硬盘甚至2.5英寸硬盘。
技嘉还为该设备配备了快速的NVMe SSD,确保系统始终顺畅运行。如果512 GB的存储空间不足,您可以随时添加第二个M.2 2280硬盘甚至2.5英寸硬盘。
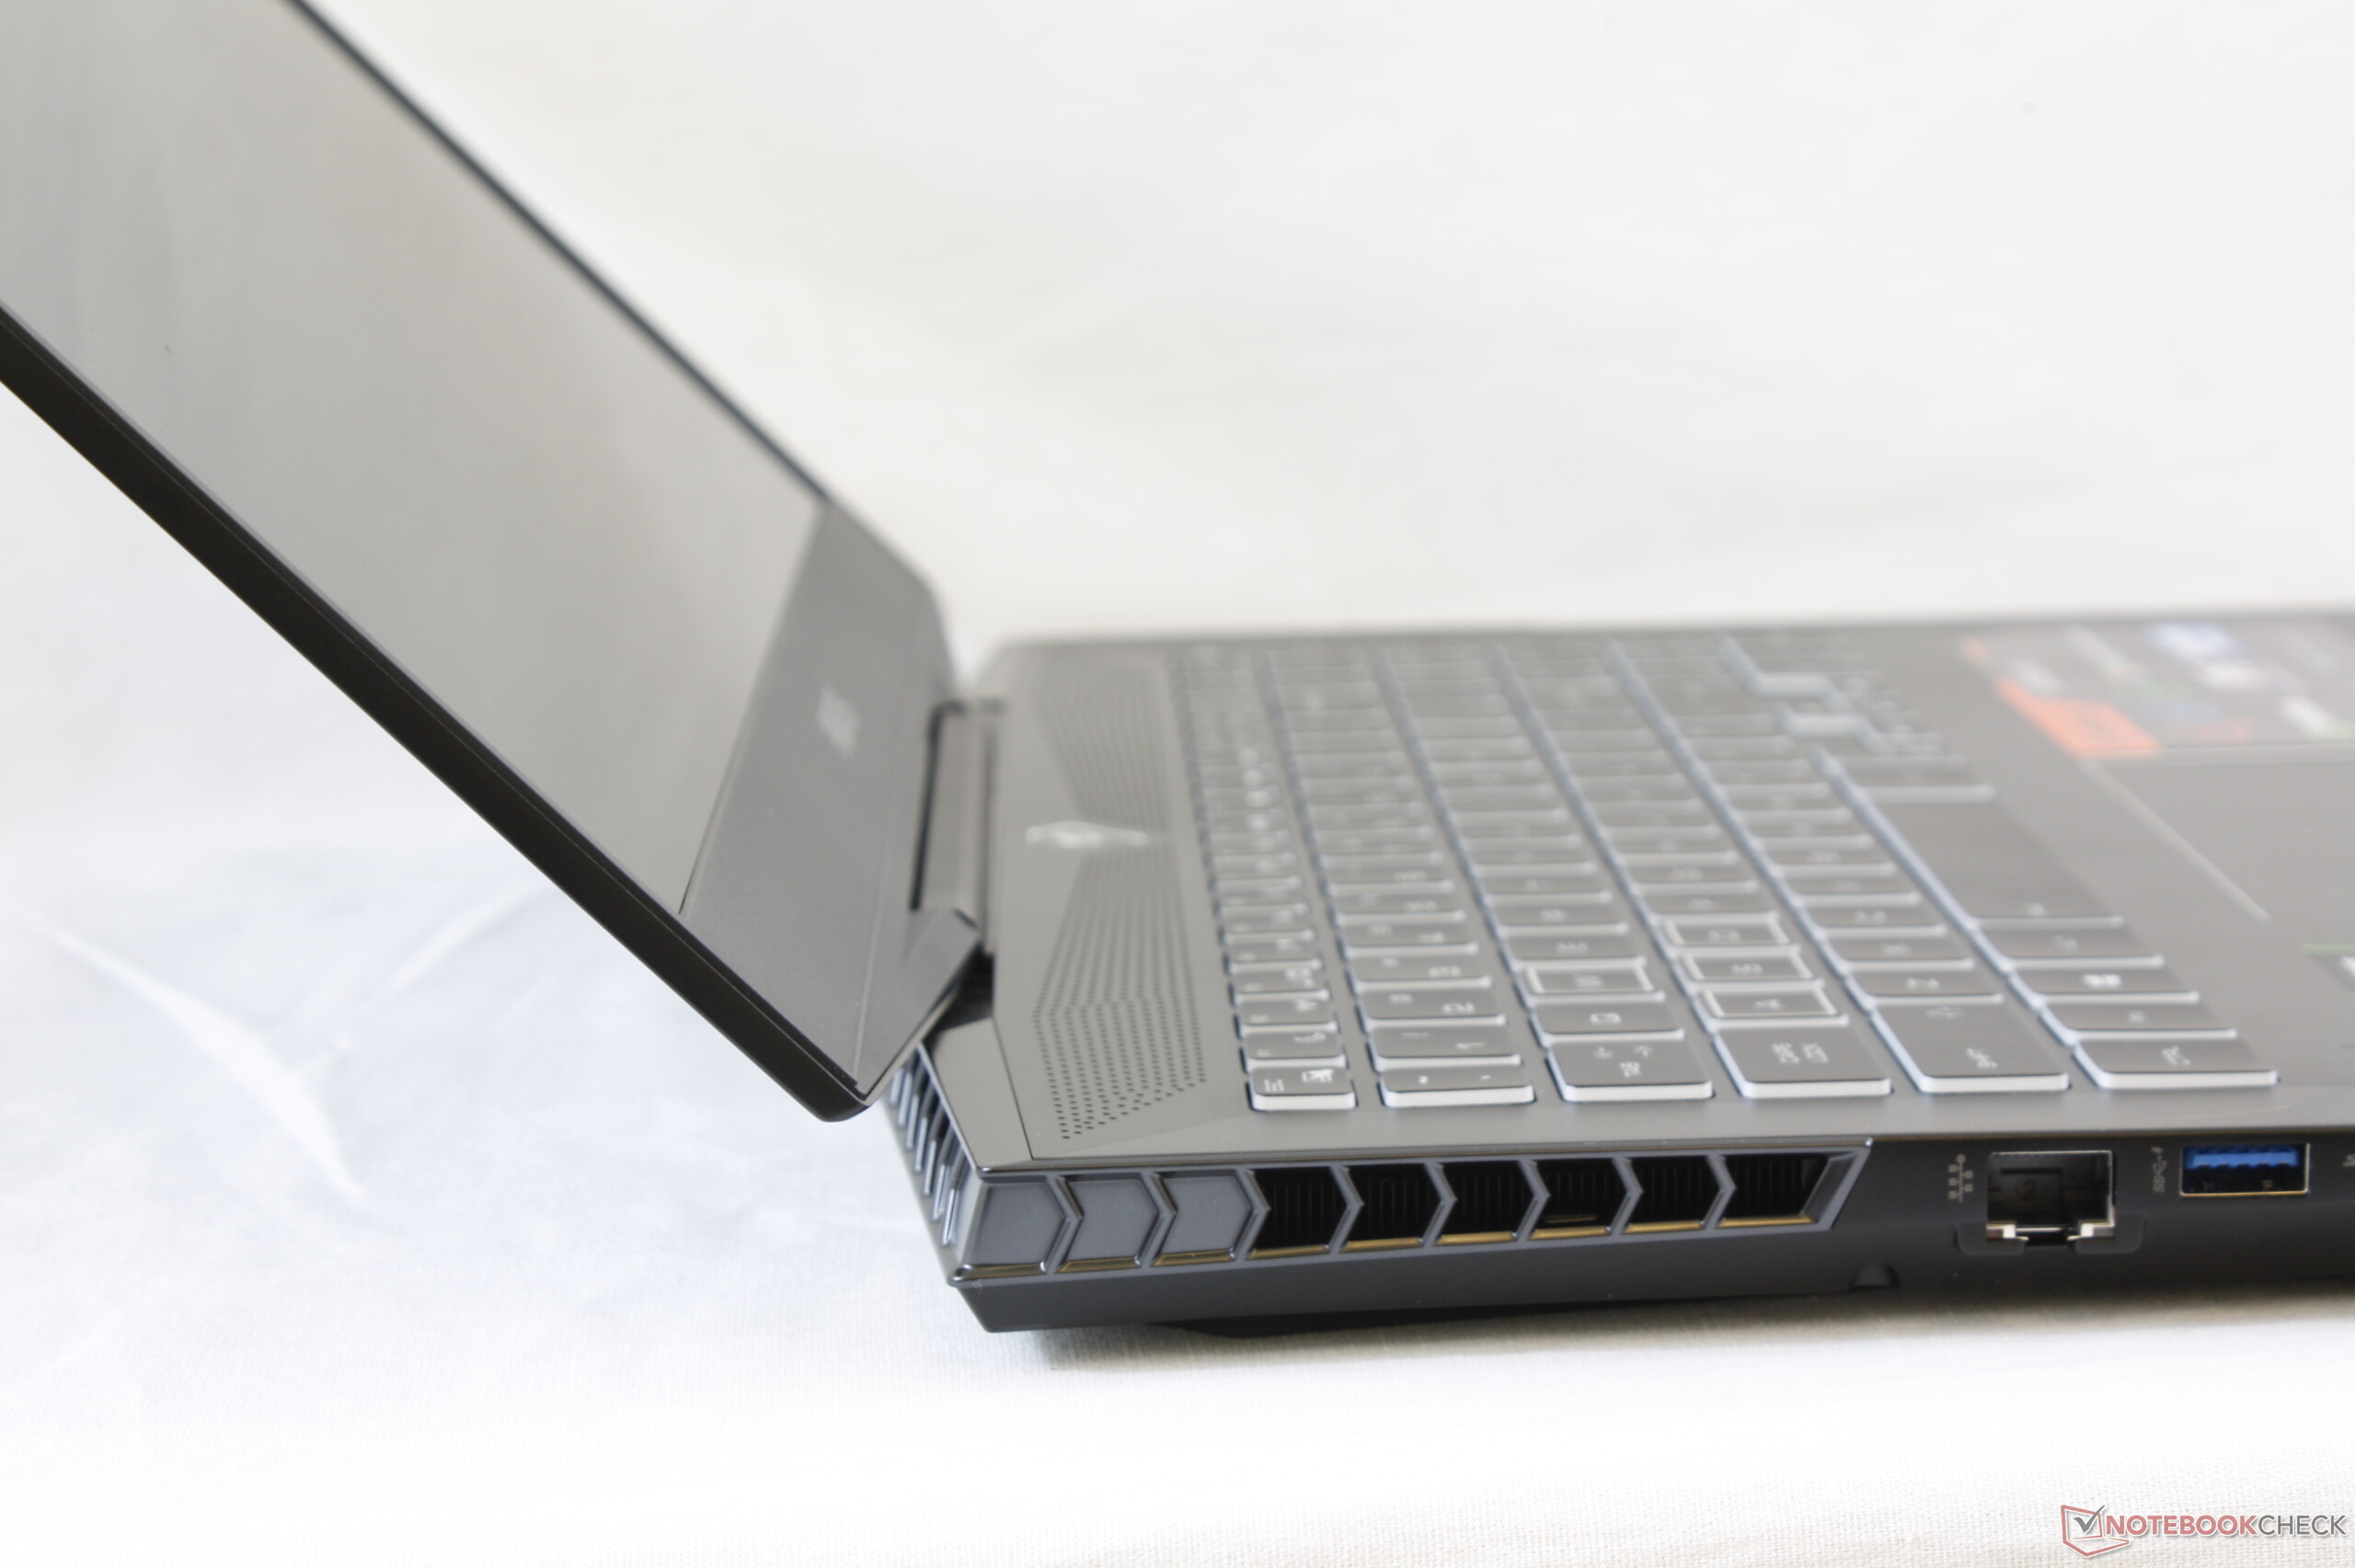
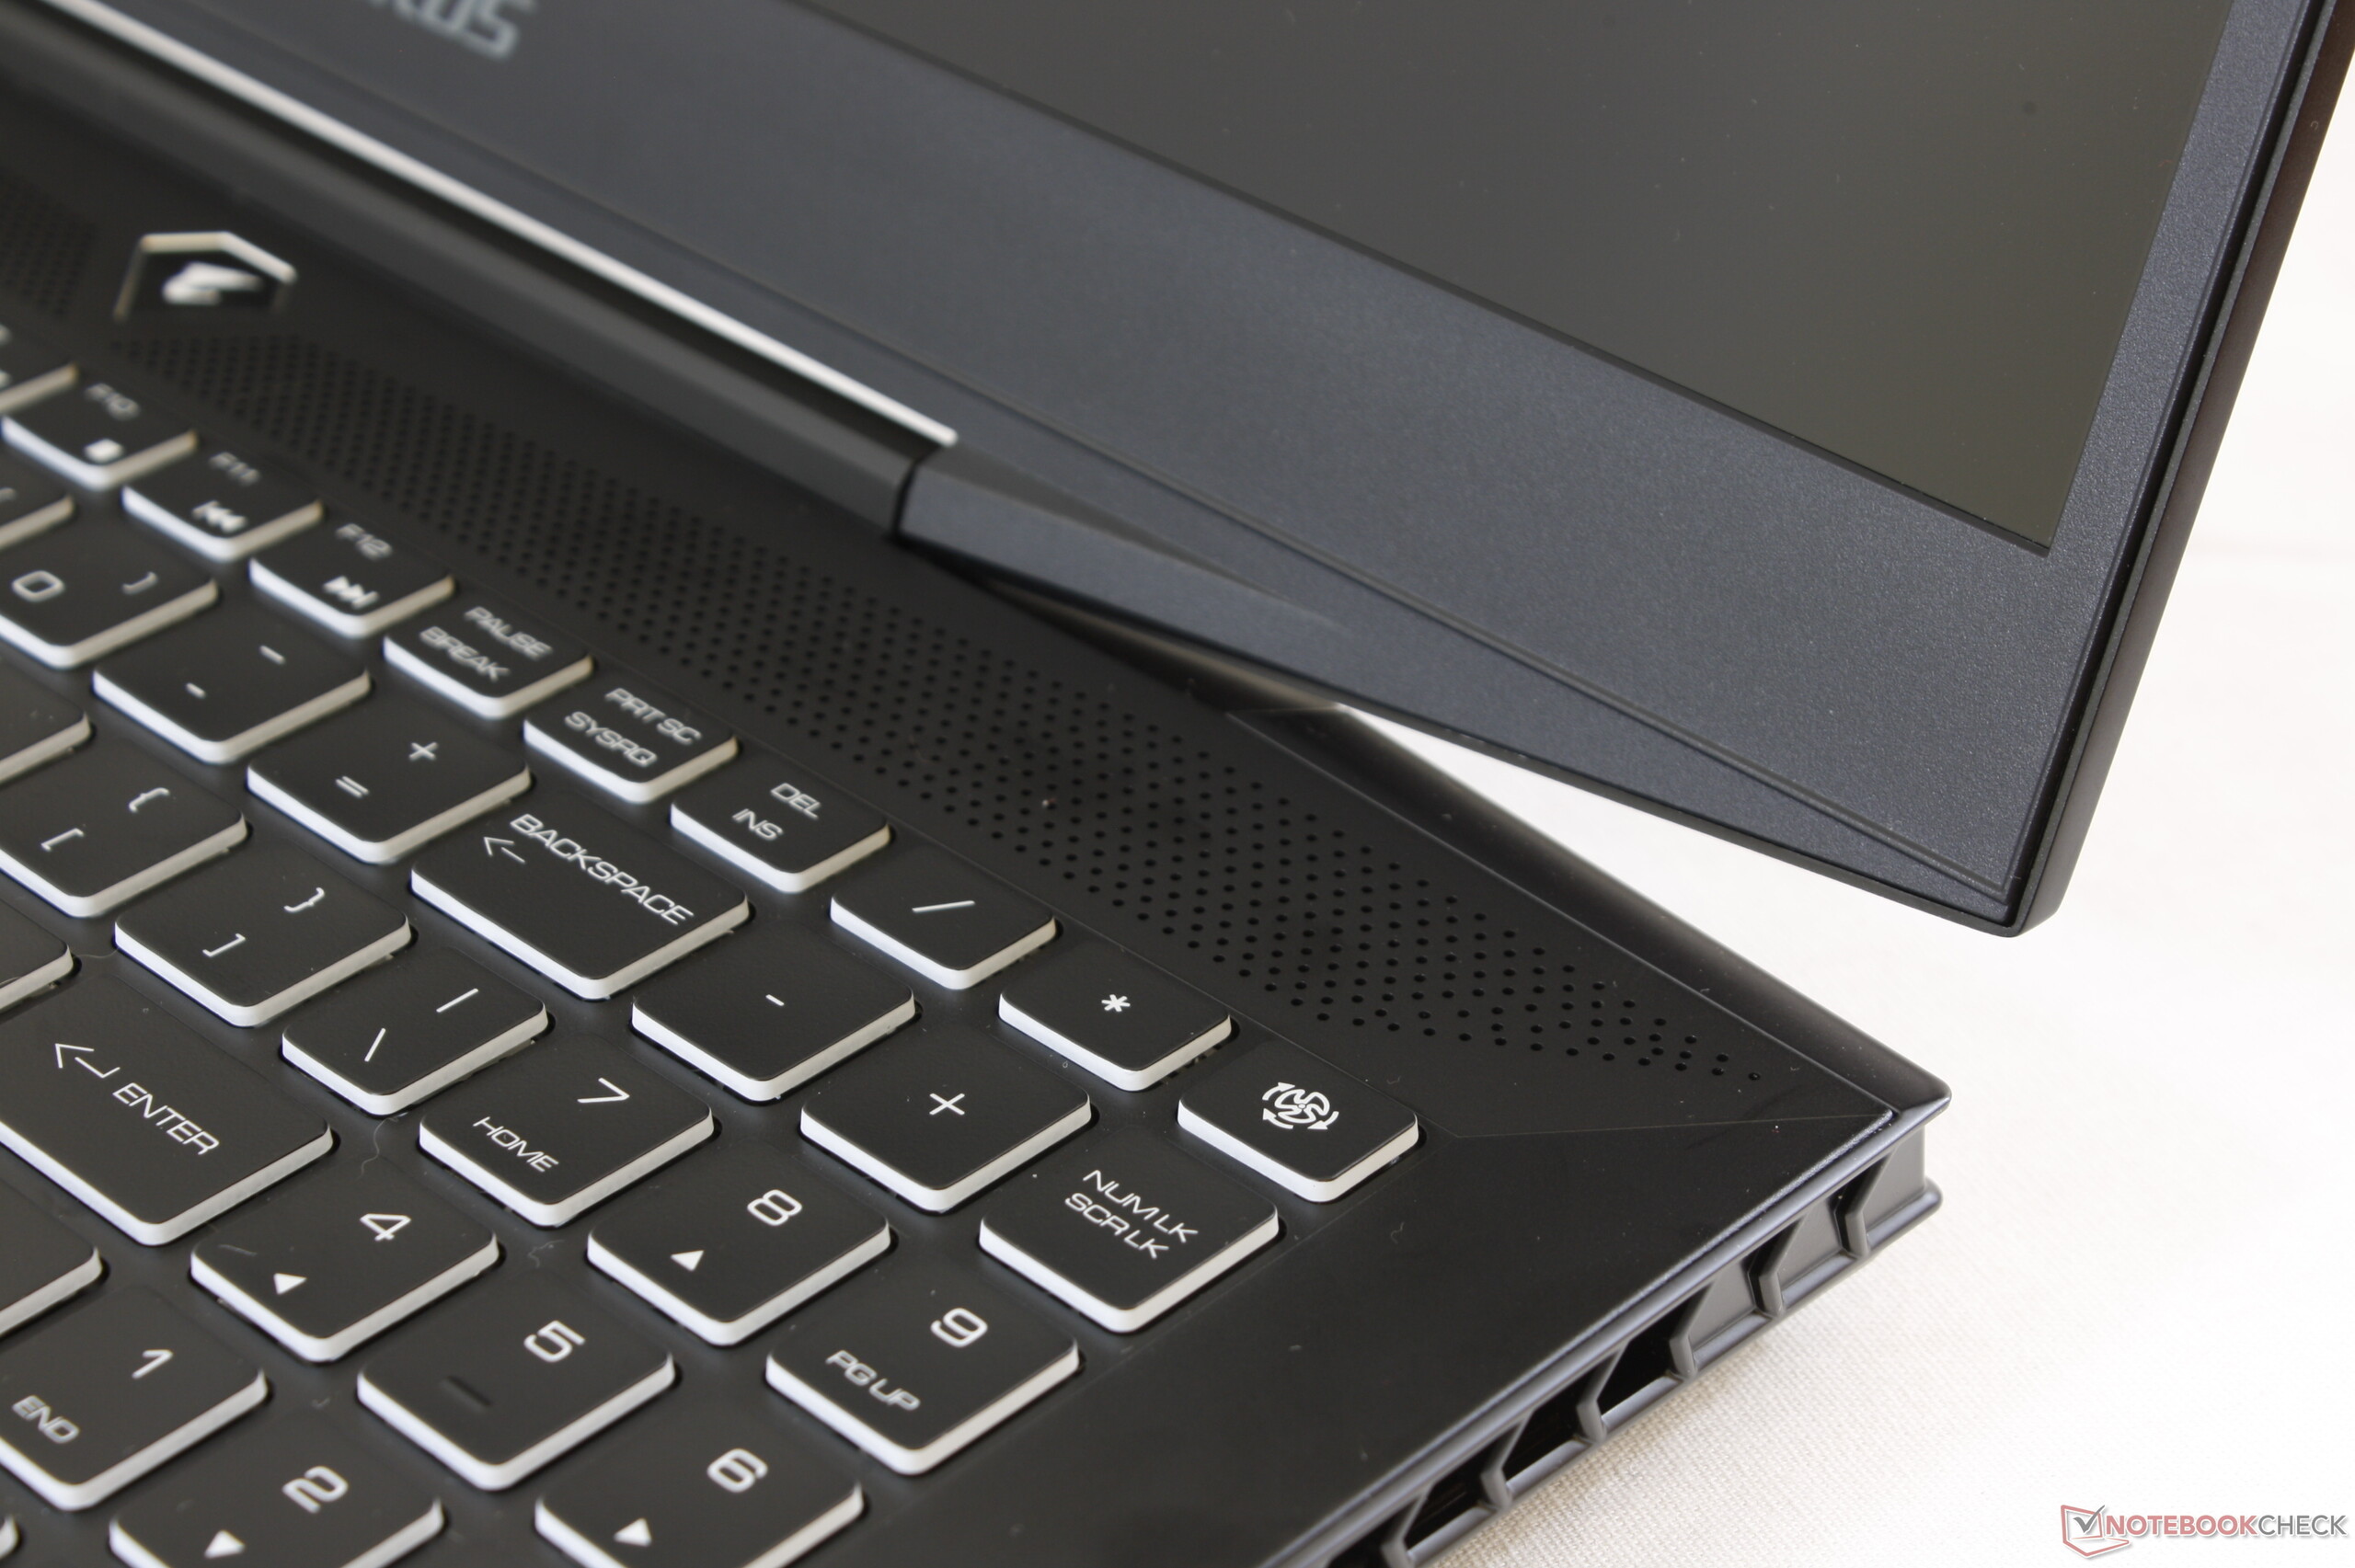
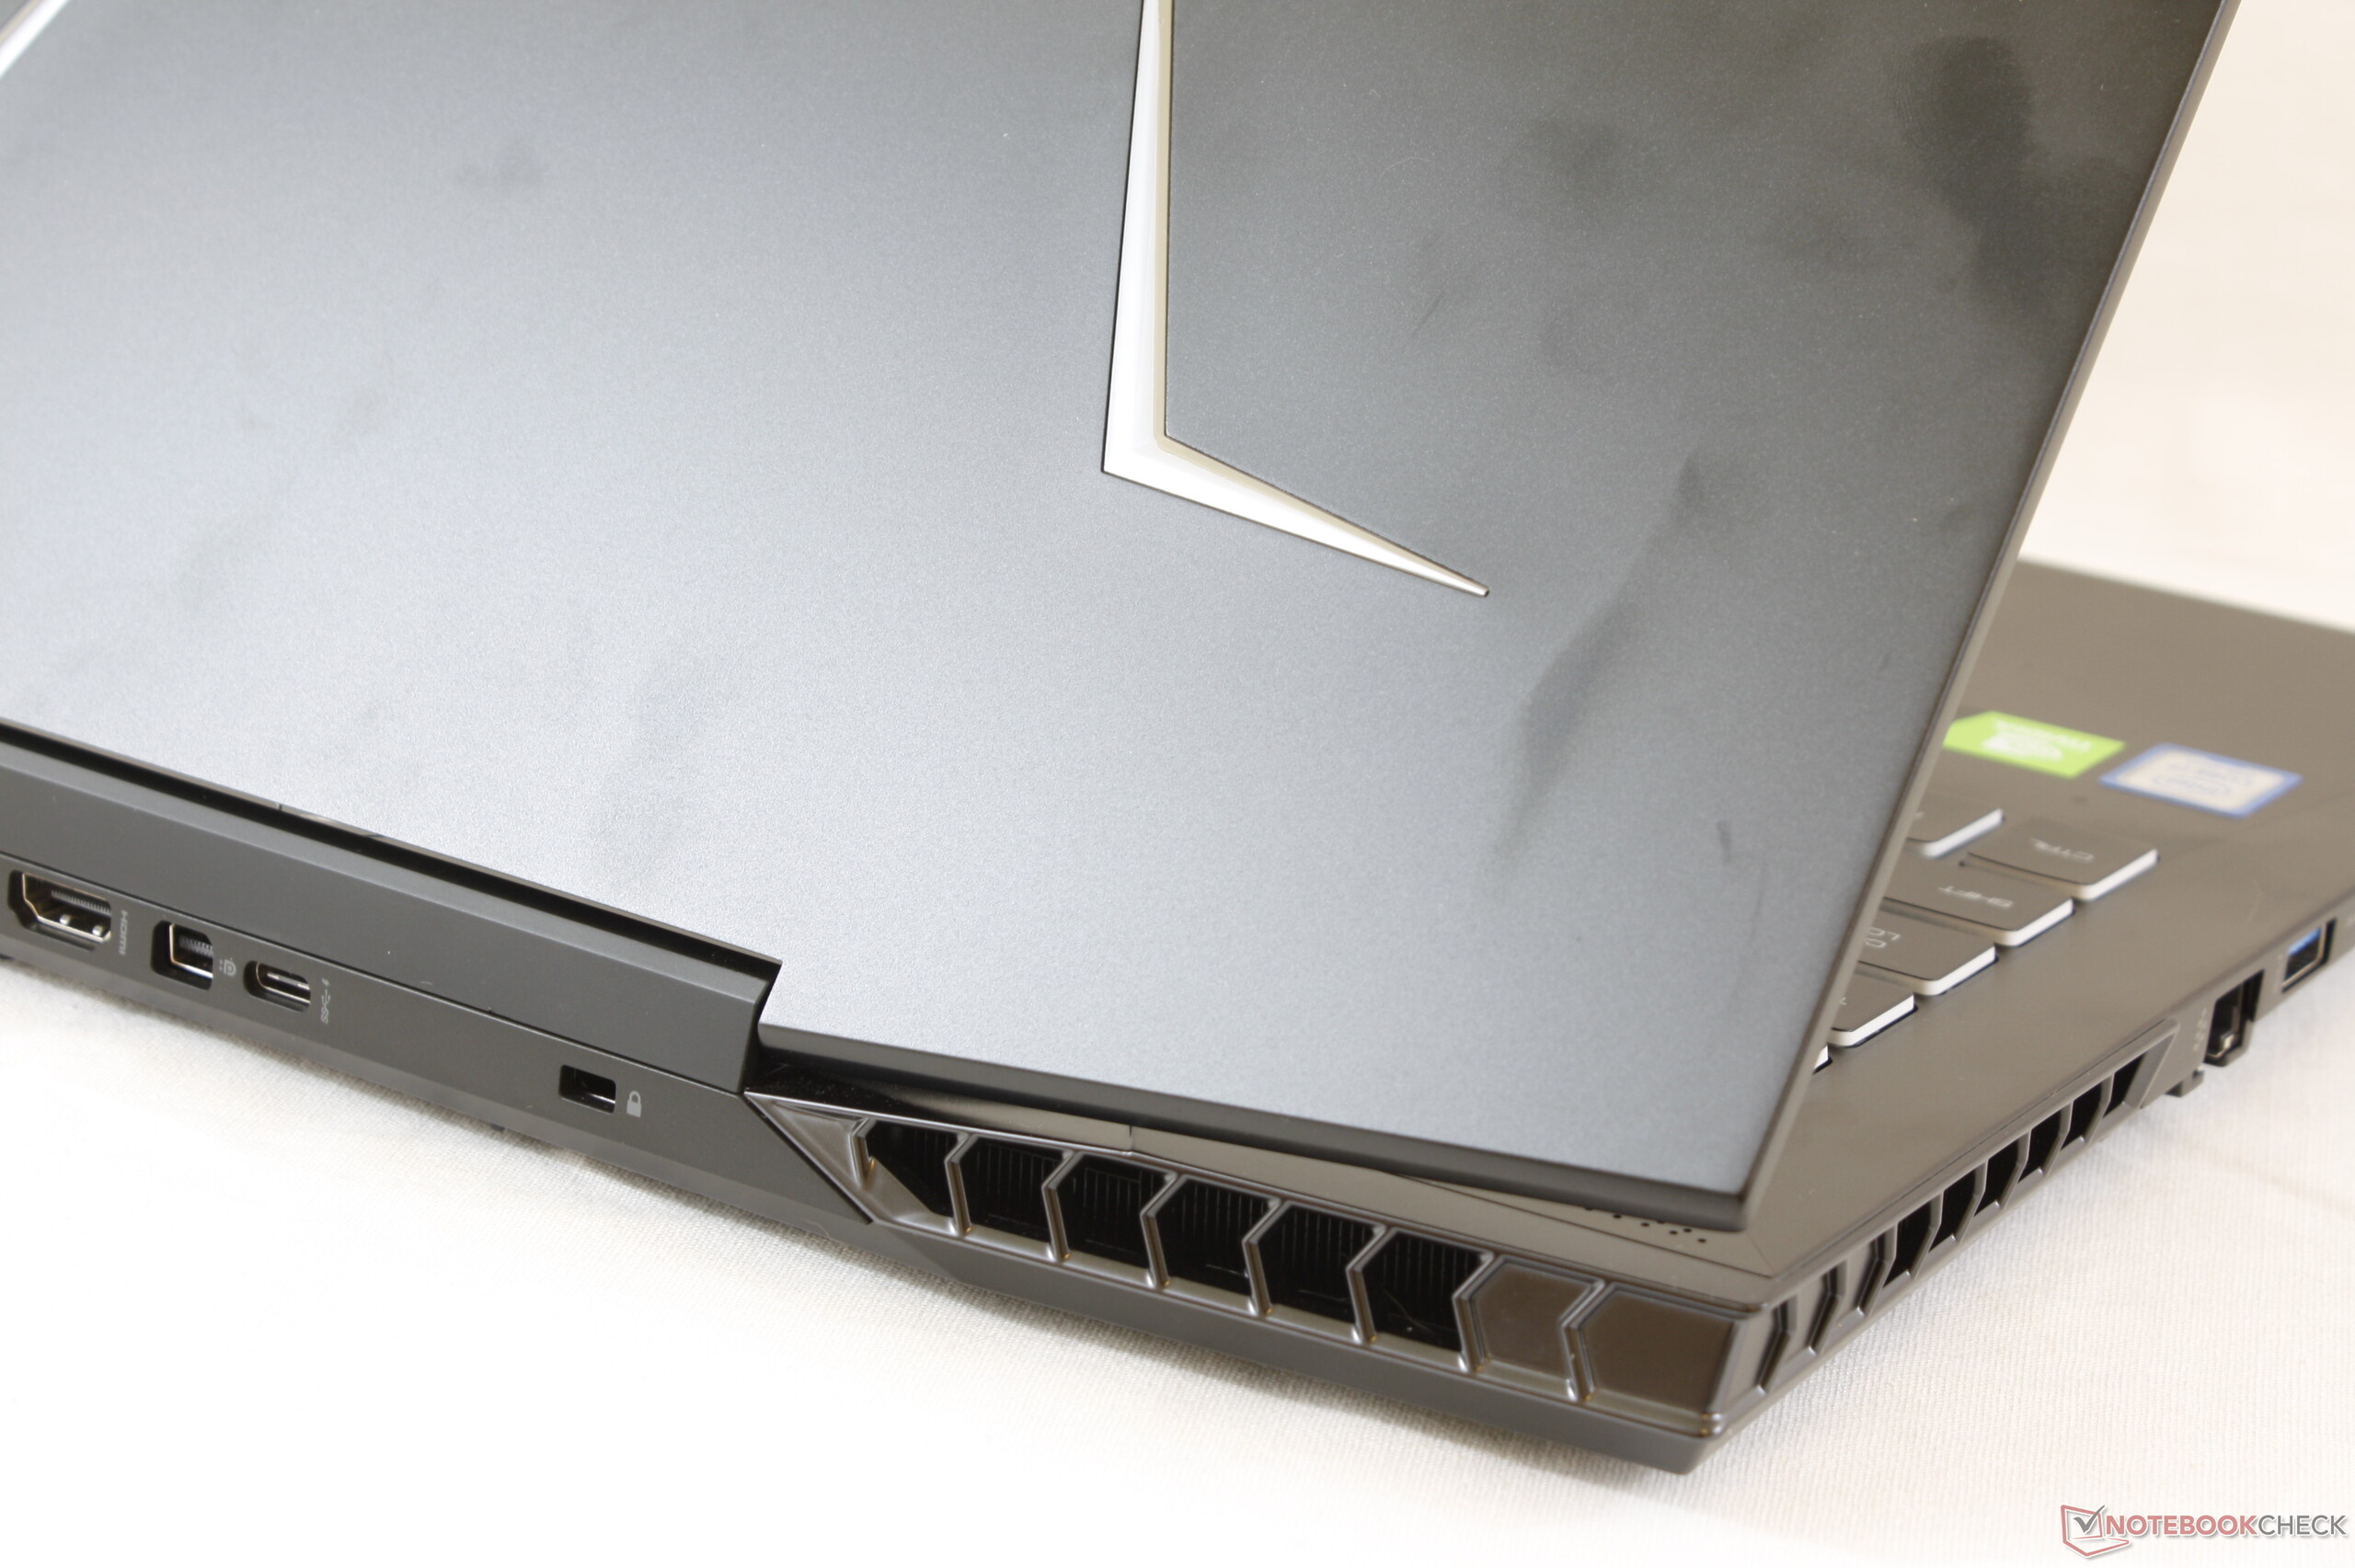
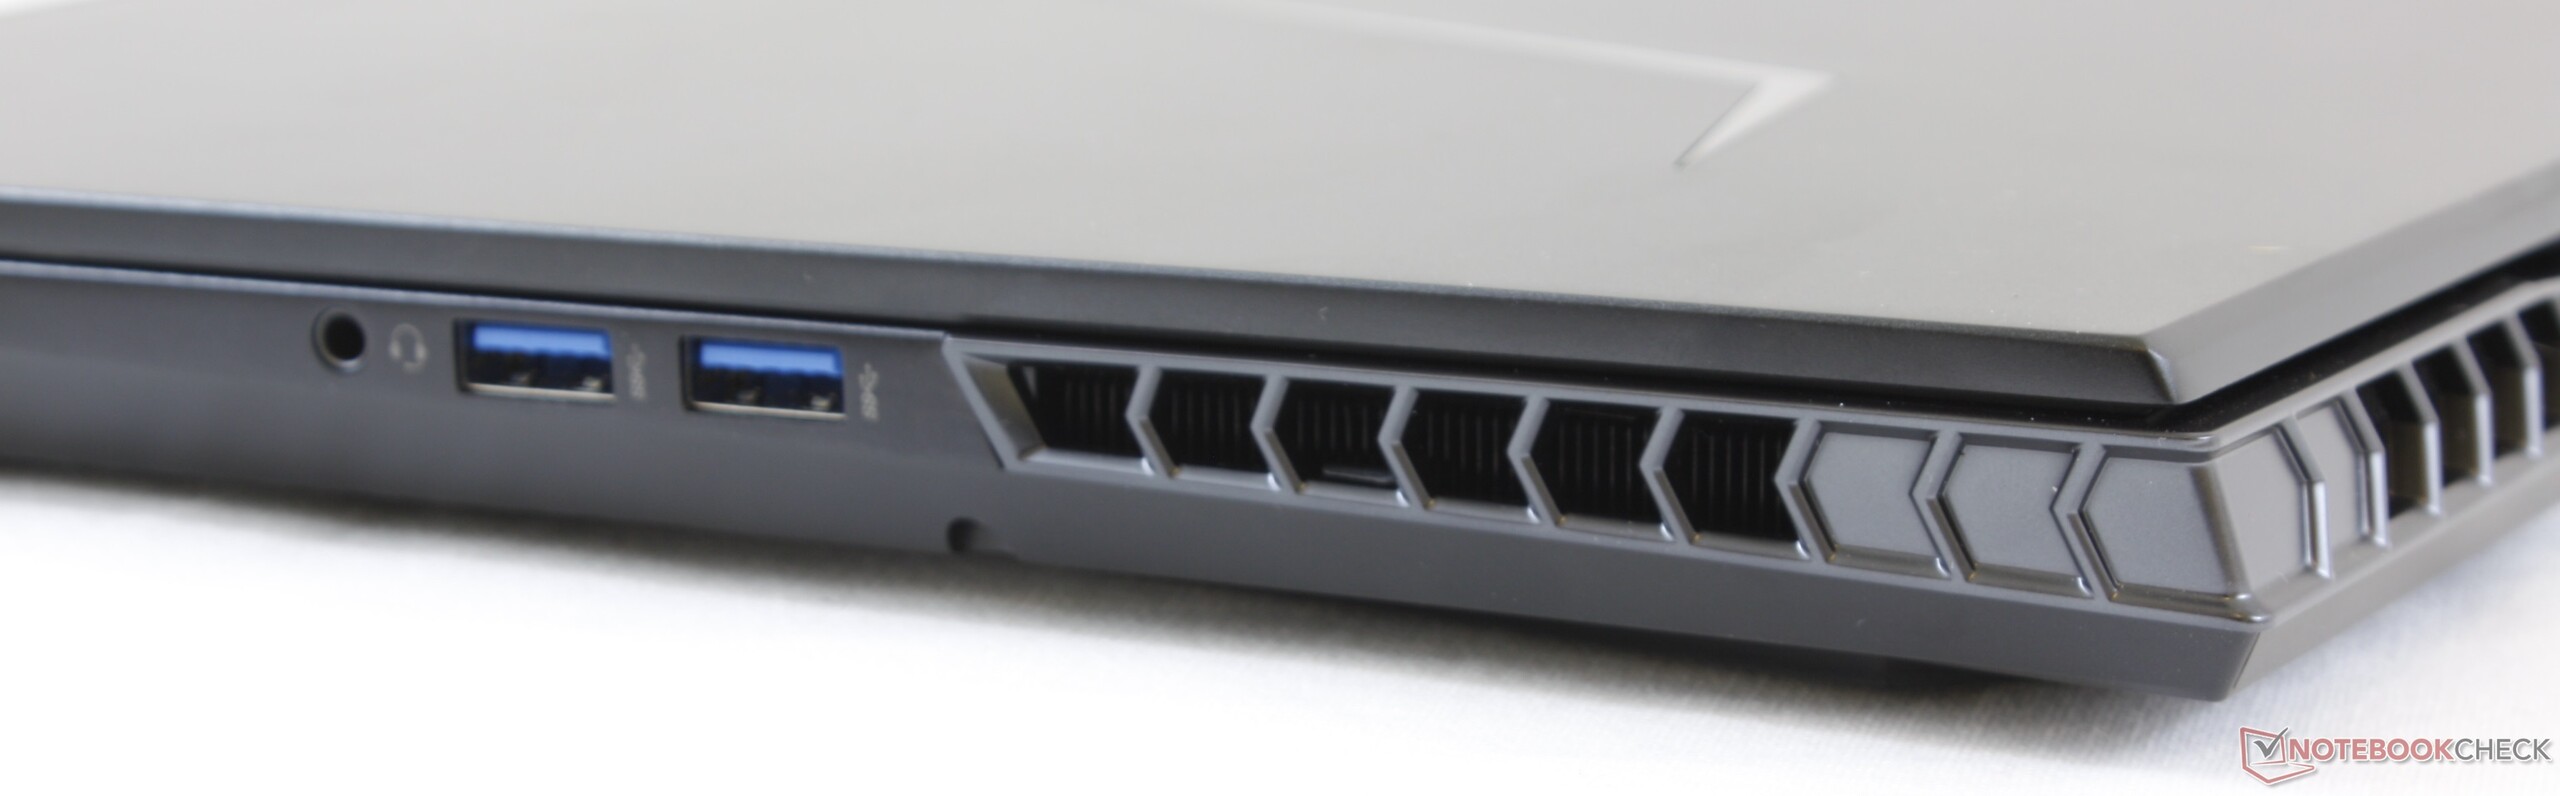
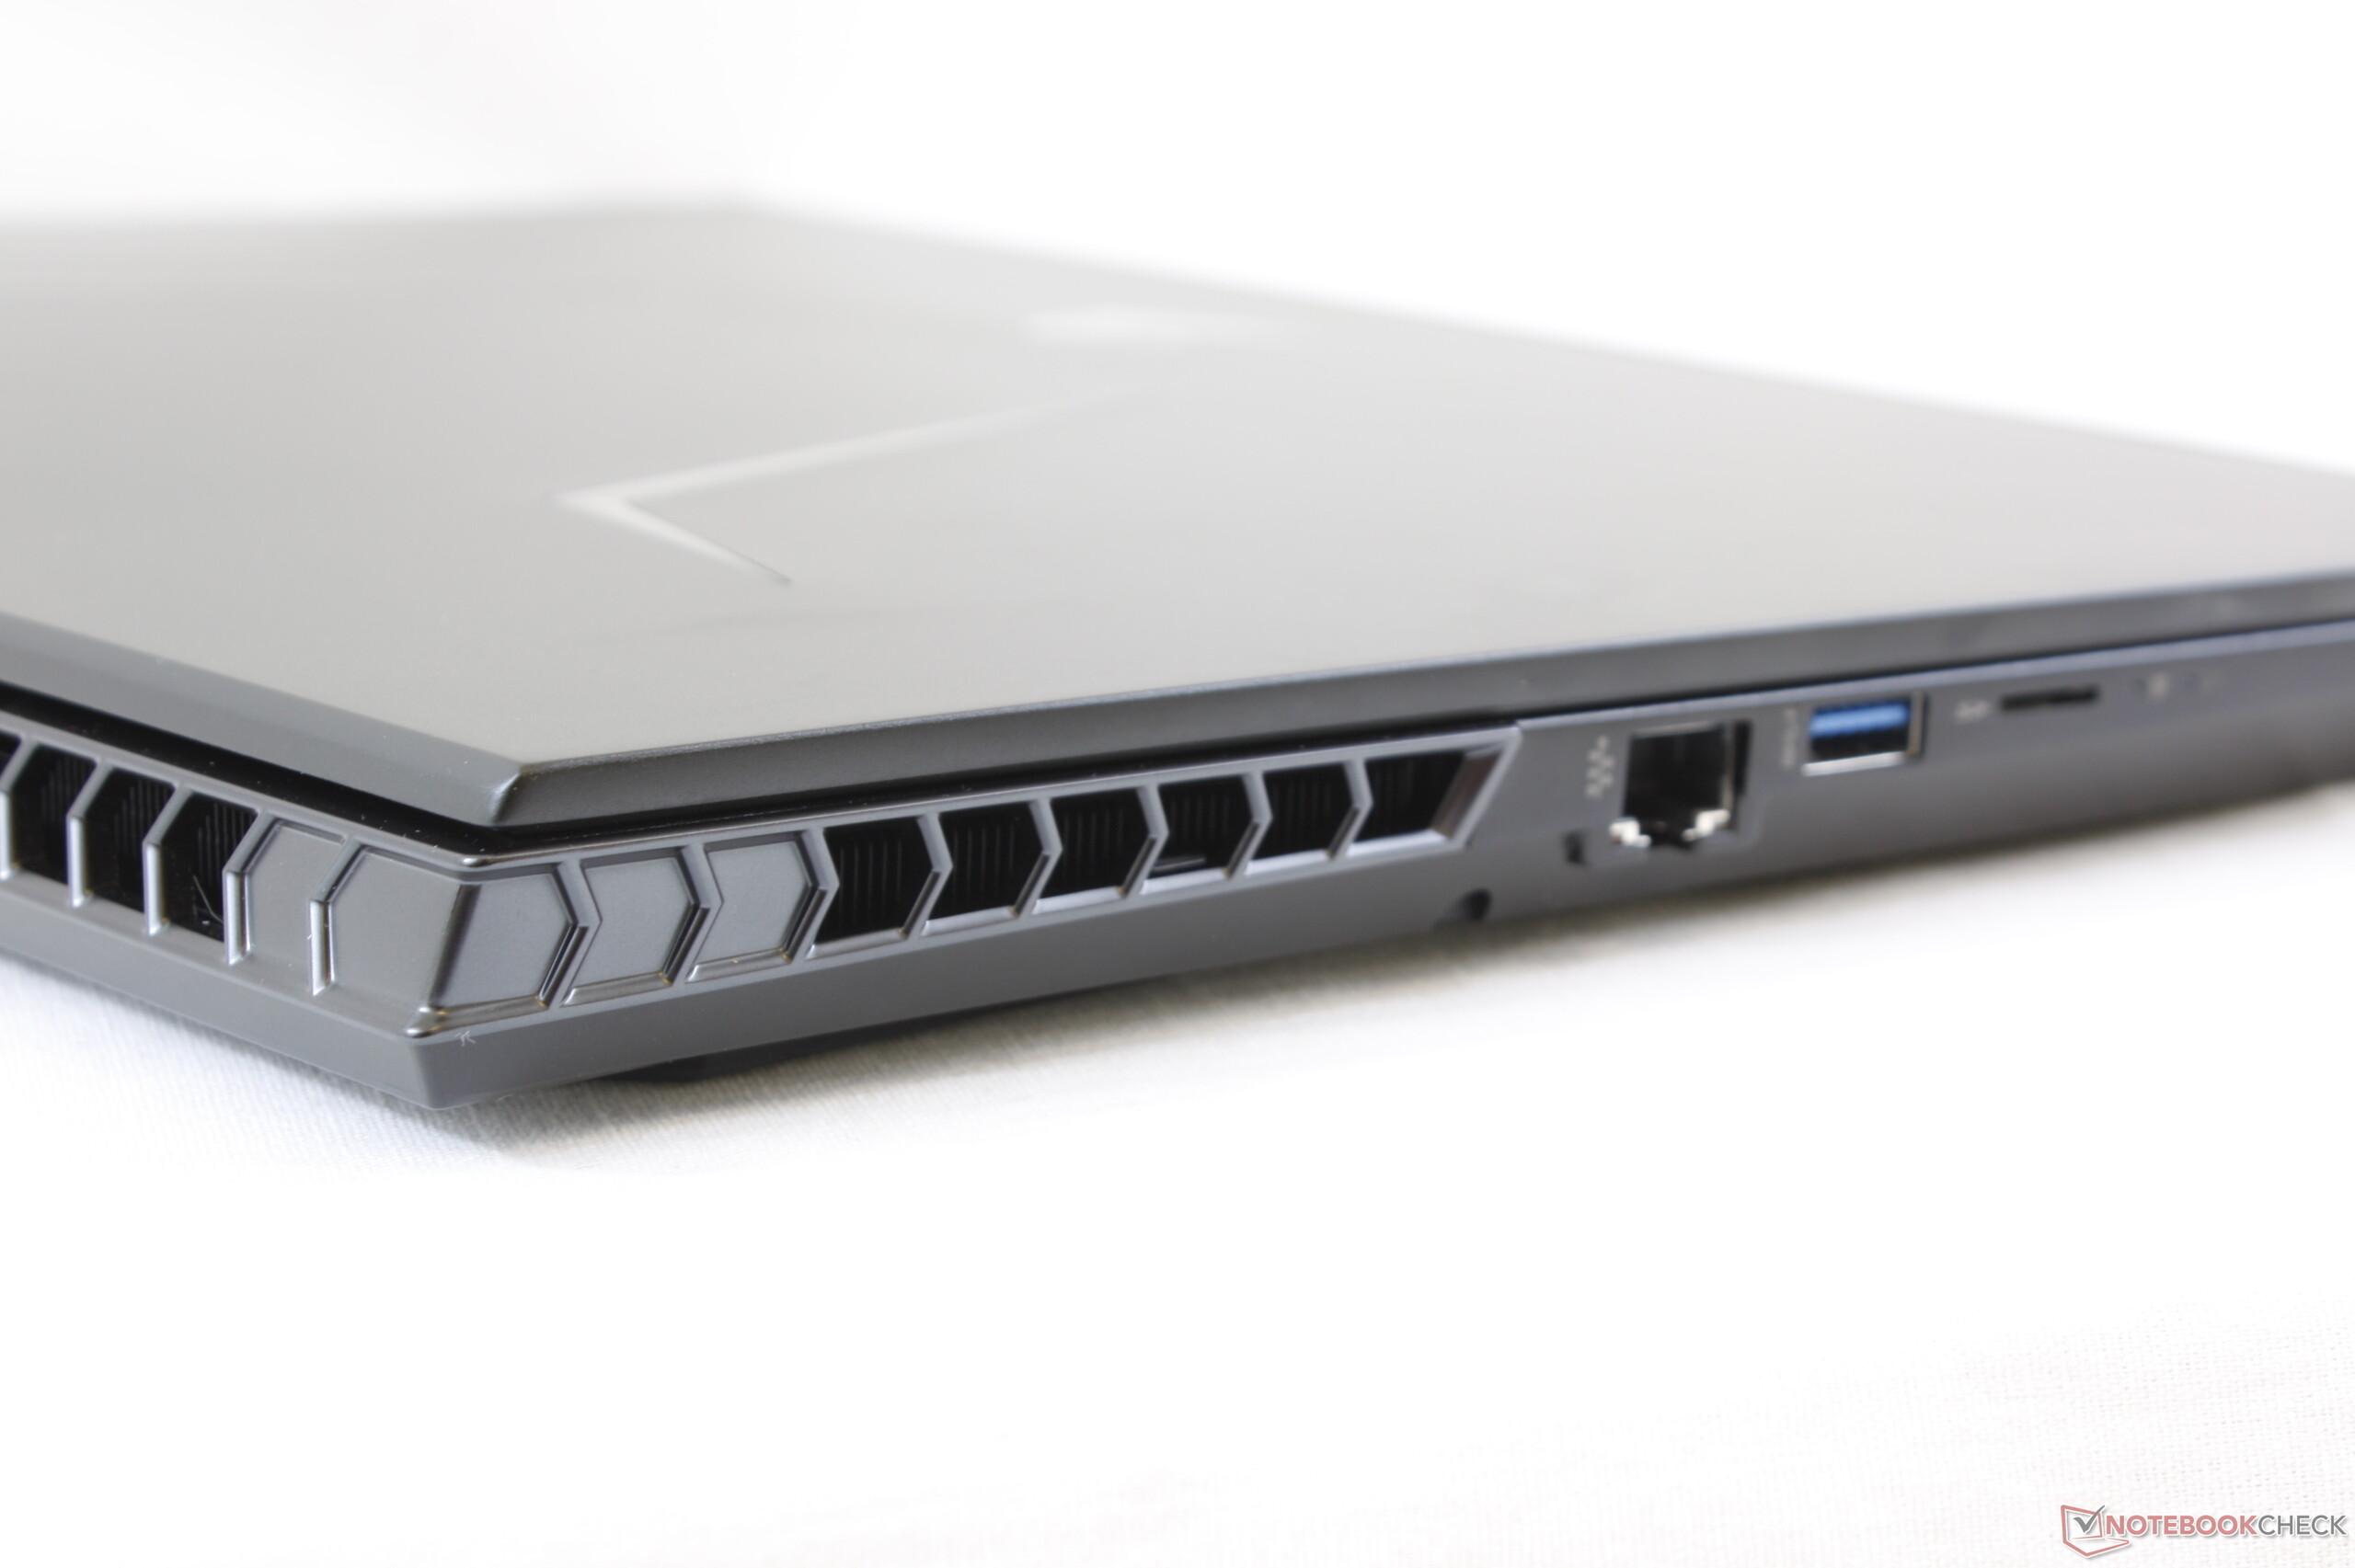
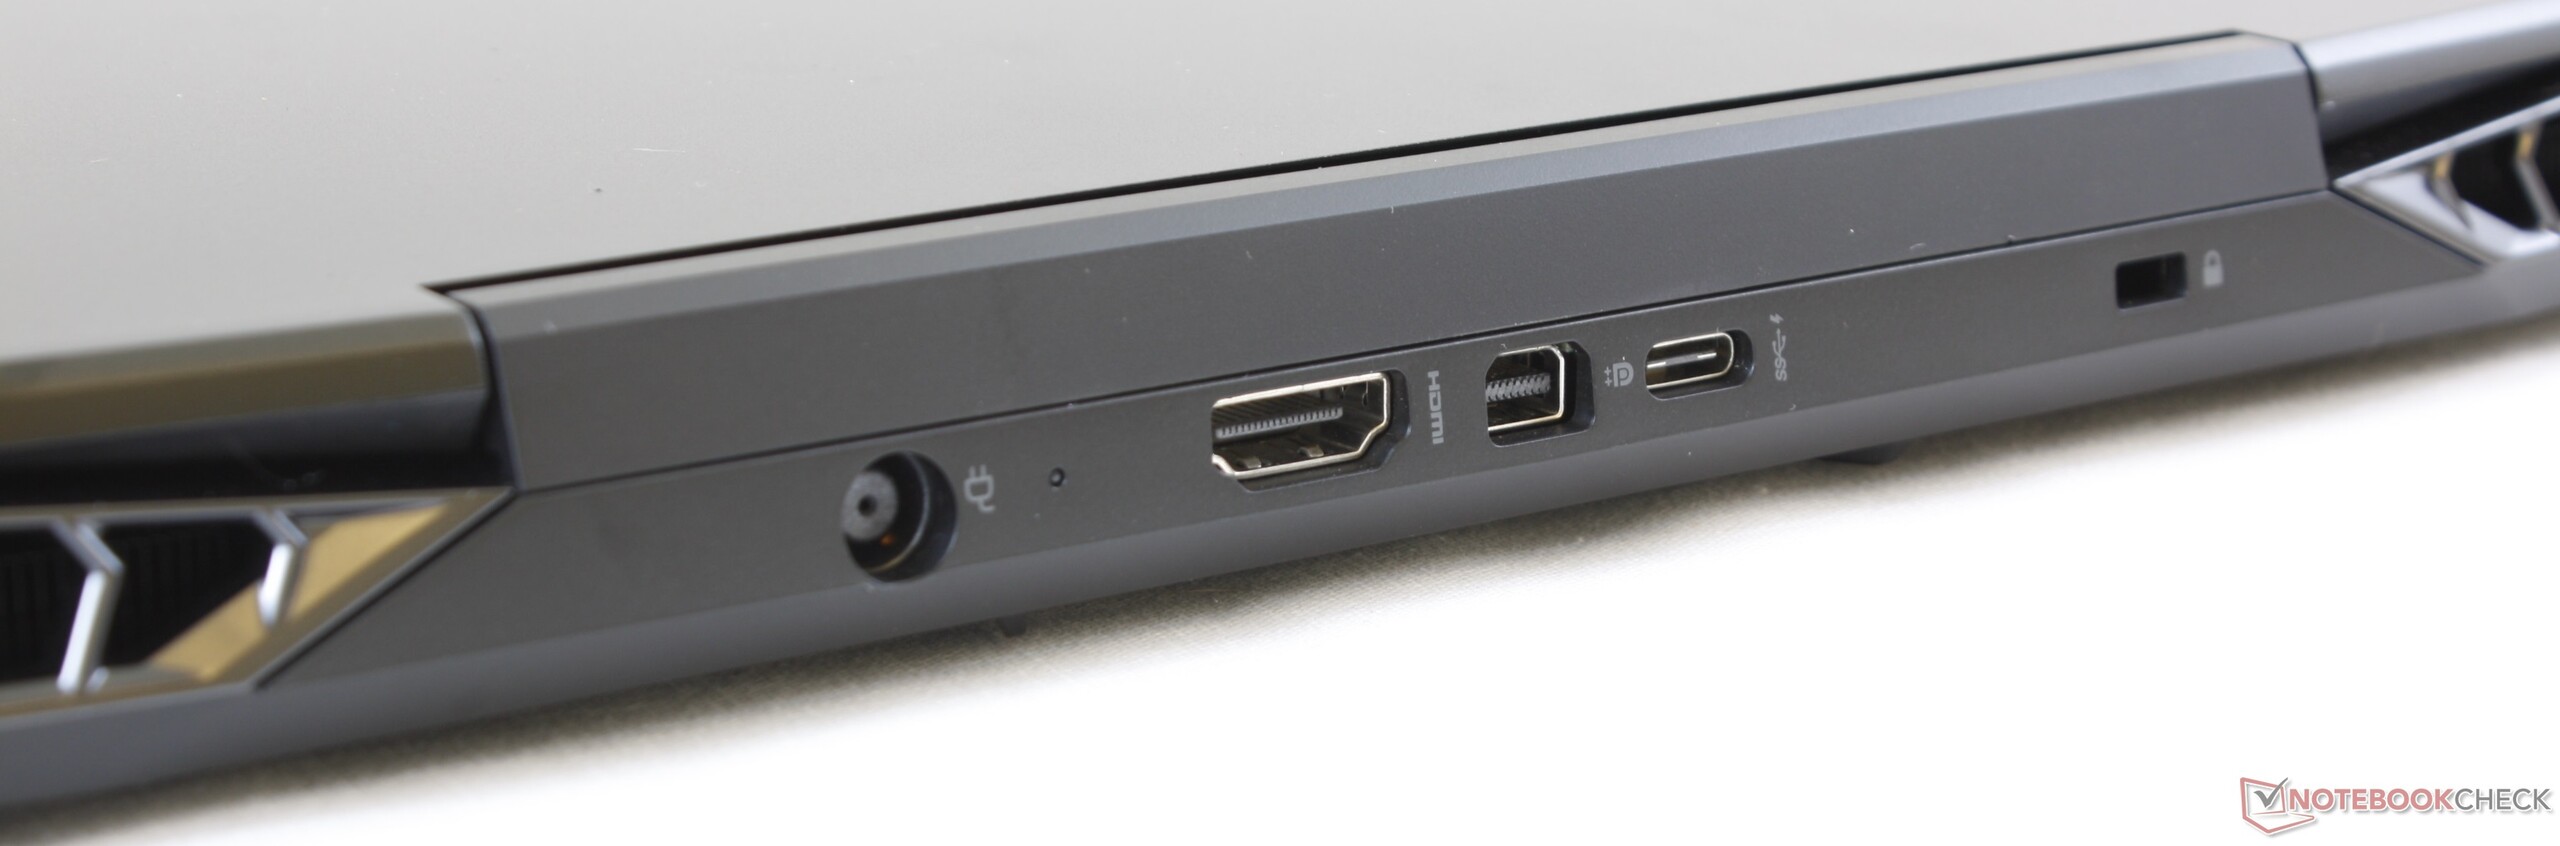
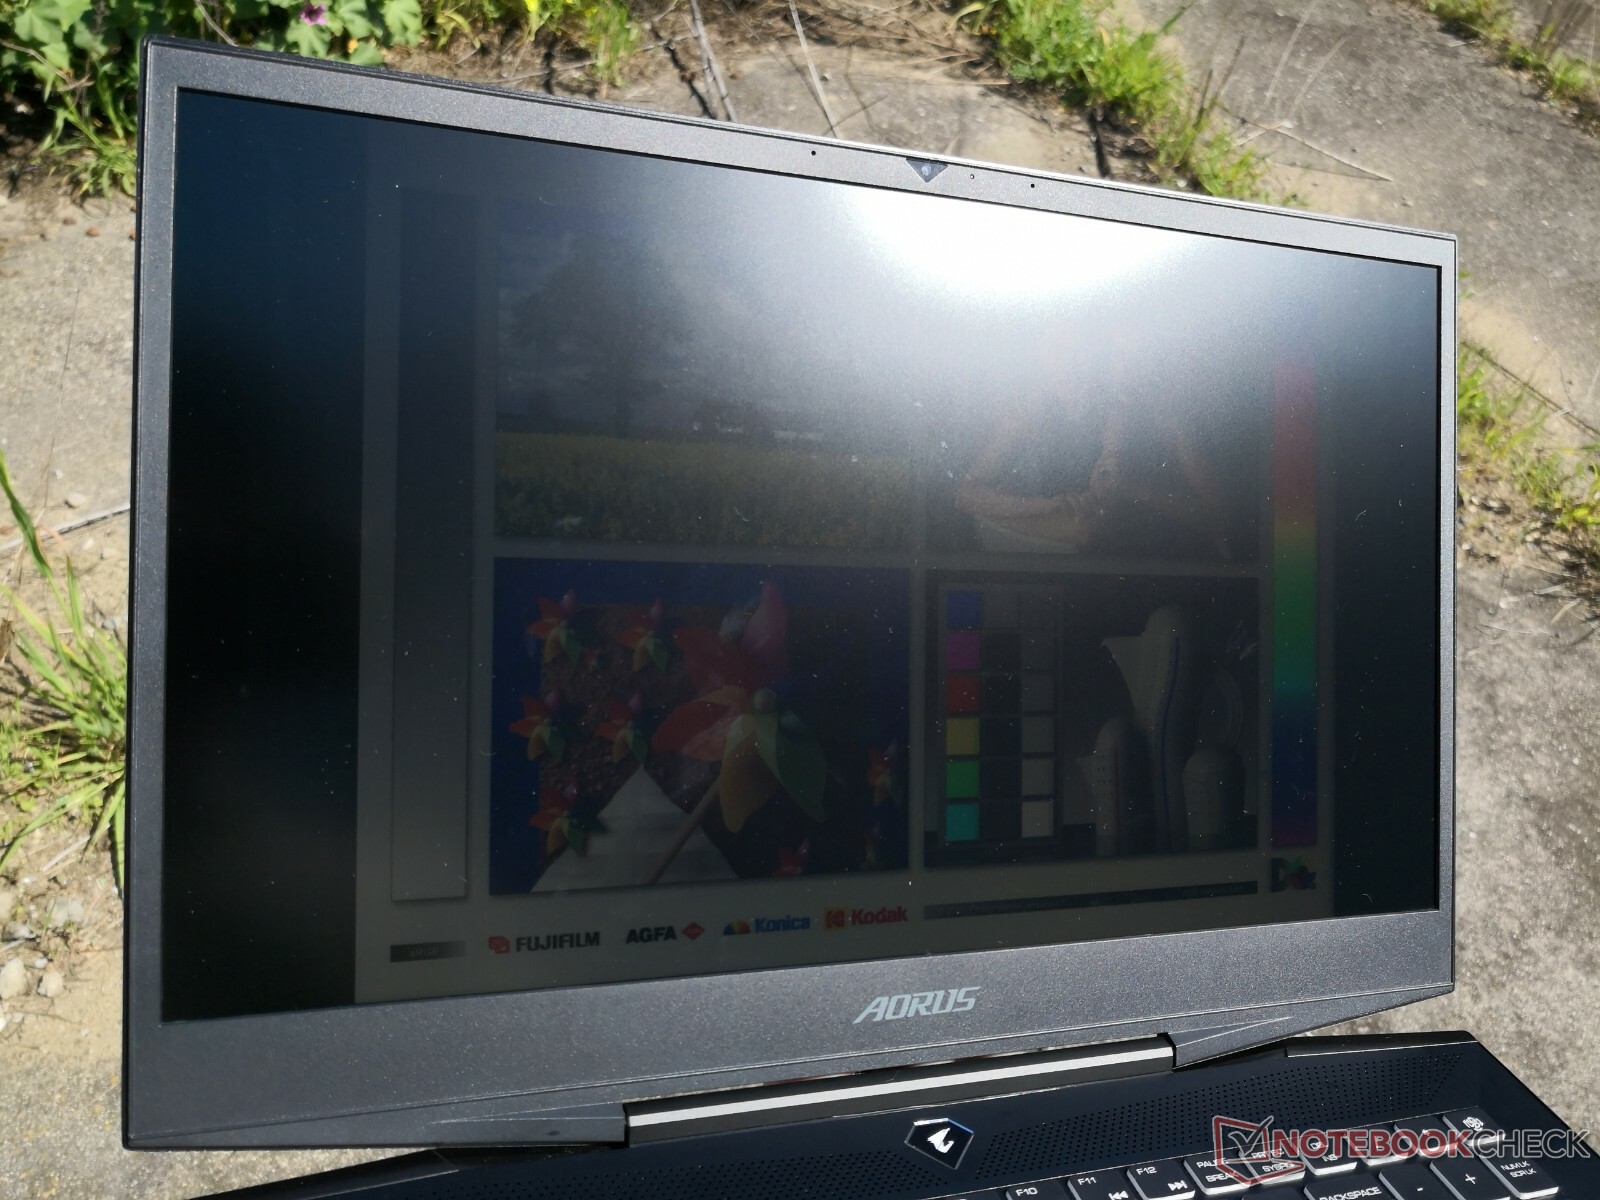
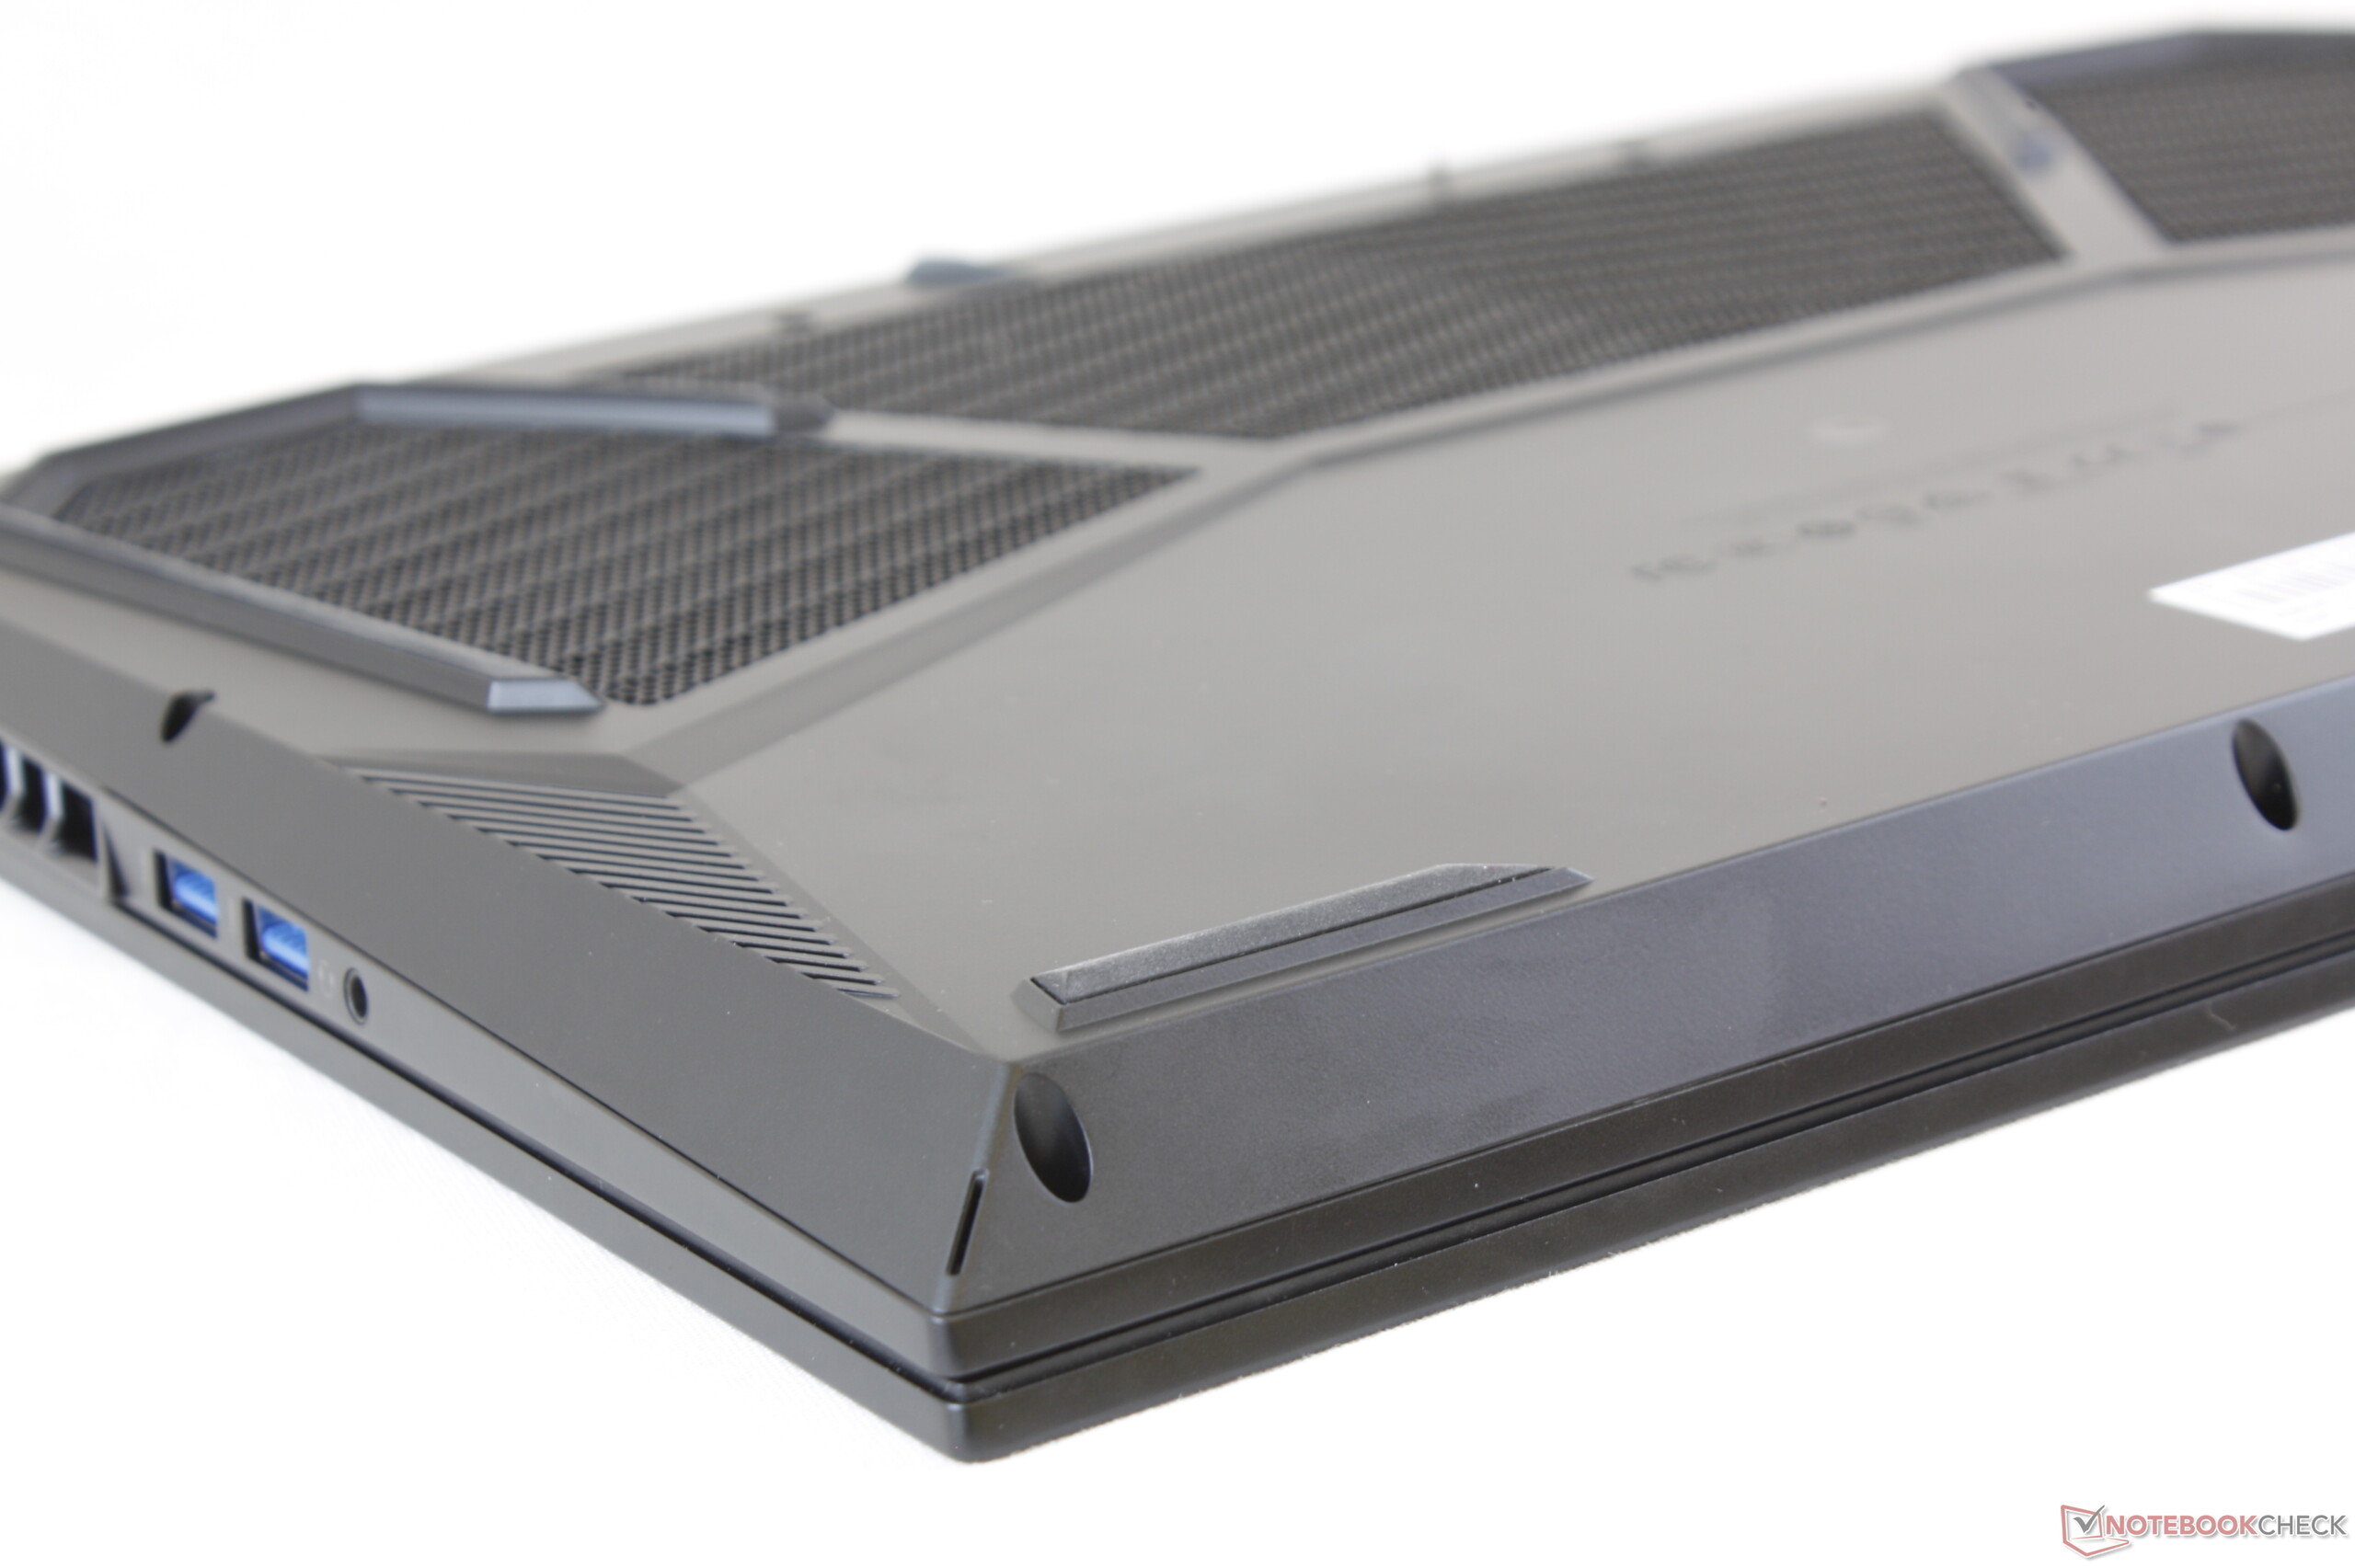
此外,我们无法理解为什么技嘉只为其配备了一个USB 3.1 Gen2 Type-C端口而不是更全能的Thunderbolt 3端口。只配备microSD卡读卡器也令人失望,特别是因为技嘉有空间可以包含全尺寸读卡器。总的来说,Gigabyte Aorus 15-SA是一款出色的游戏笔记本电脑,它的昏暗显示,有限的端口选择和糟糕的续航时间令人失望。
Aorus 15-SA
- 06/16/2019 v6 (old)
Sascha Mölck
Price comparison

