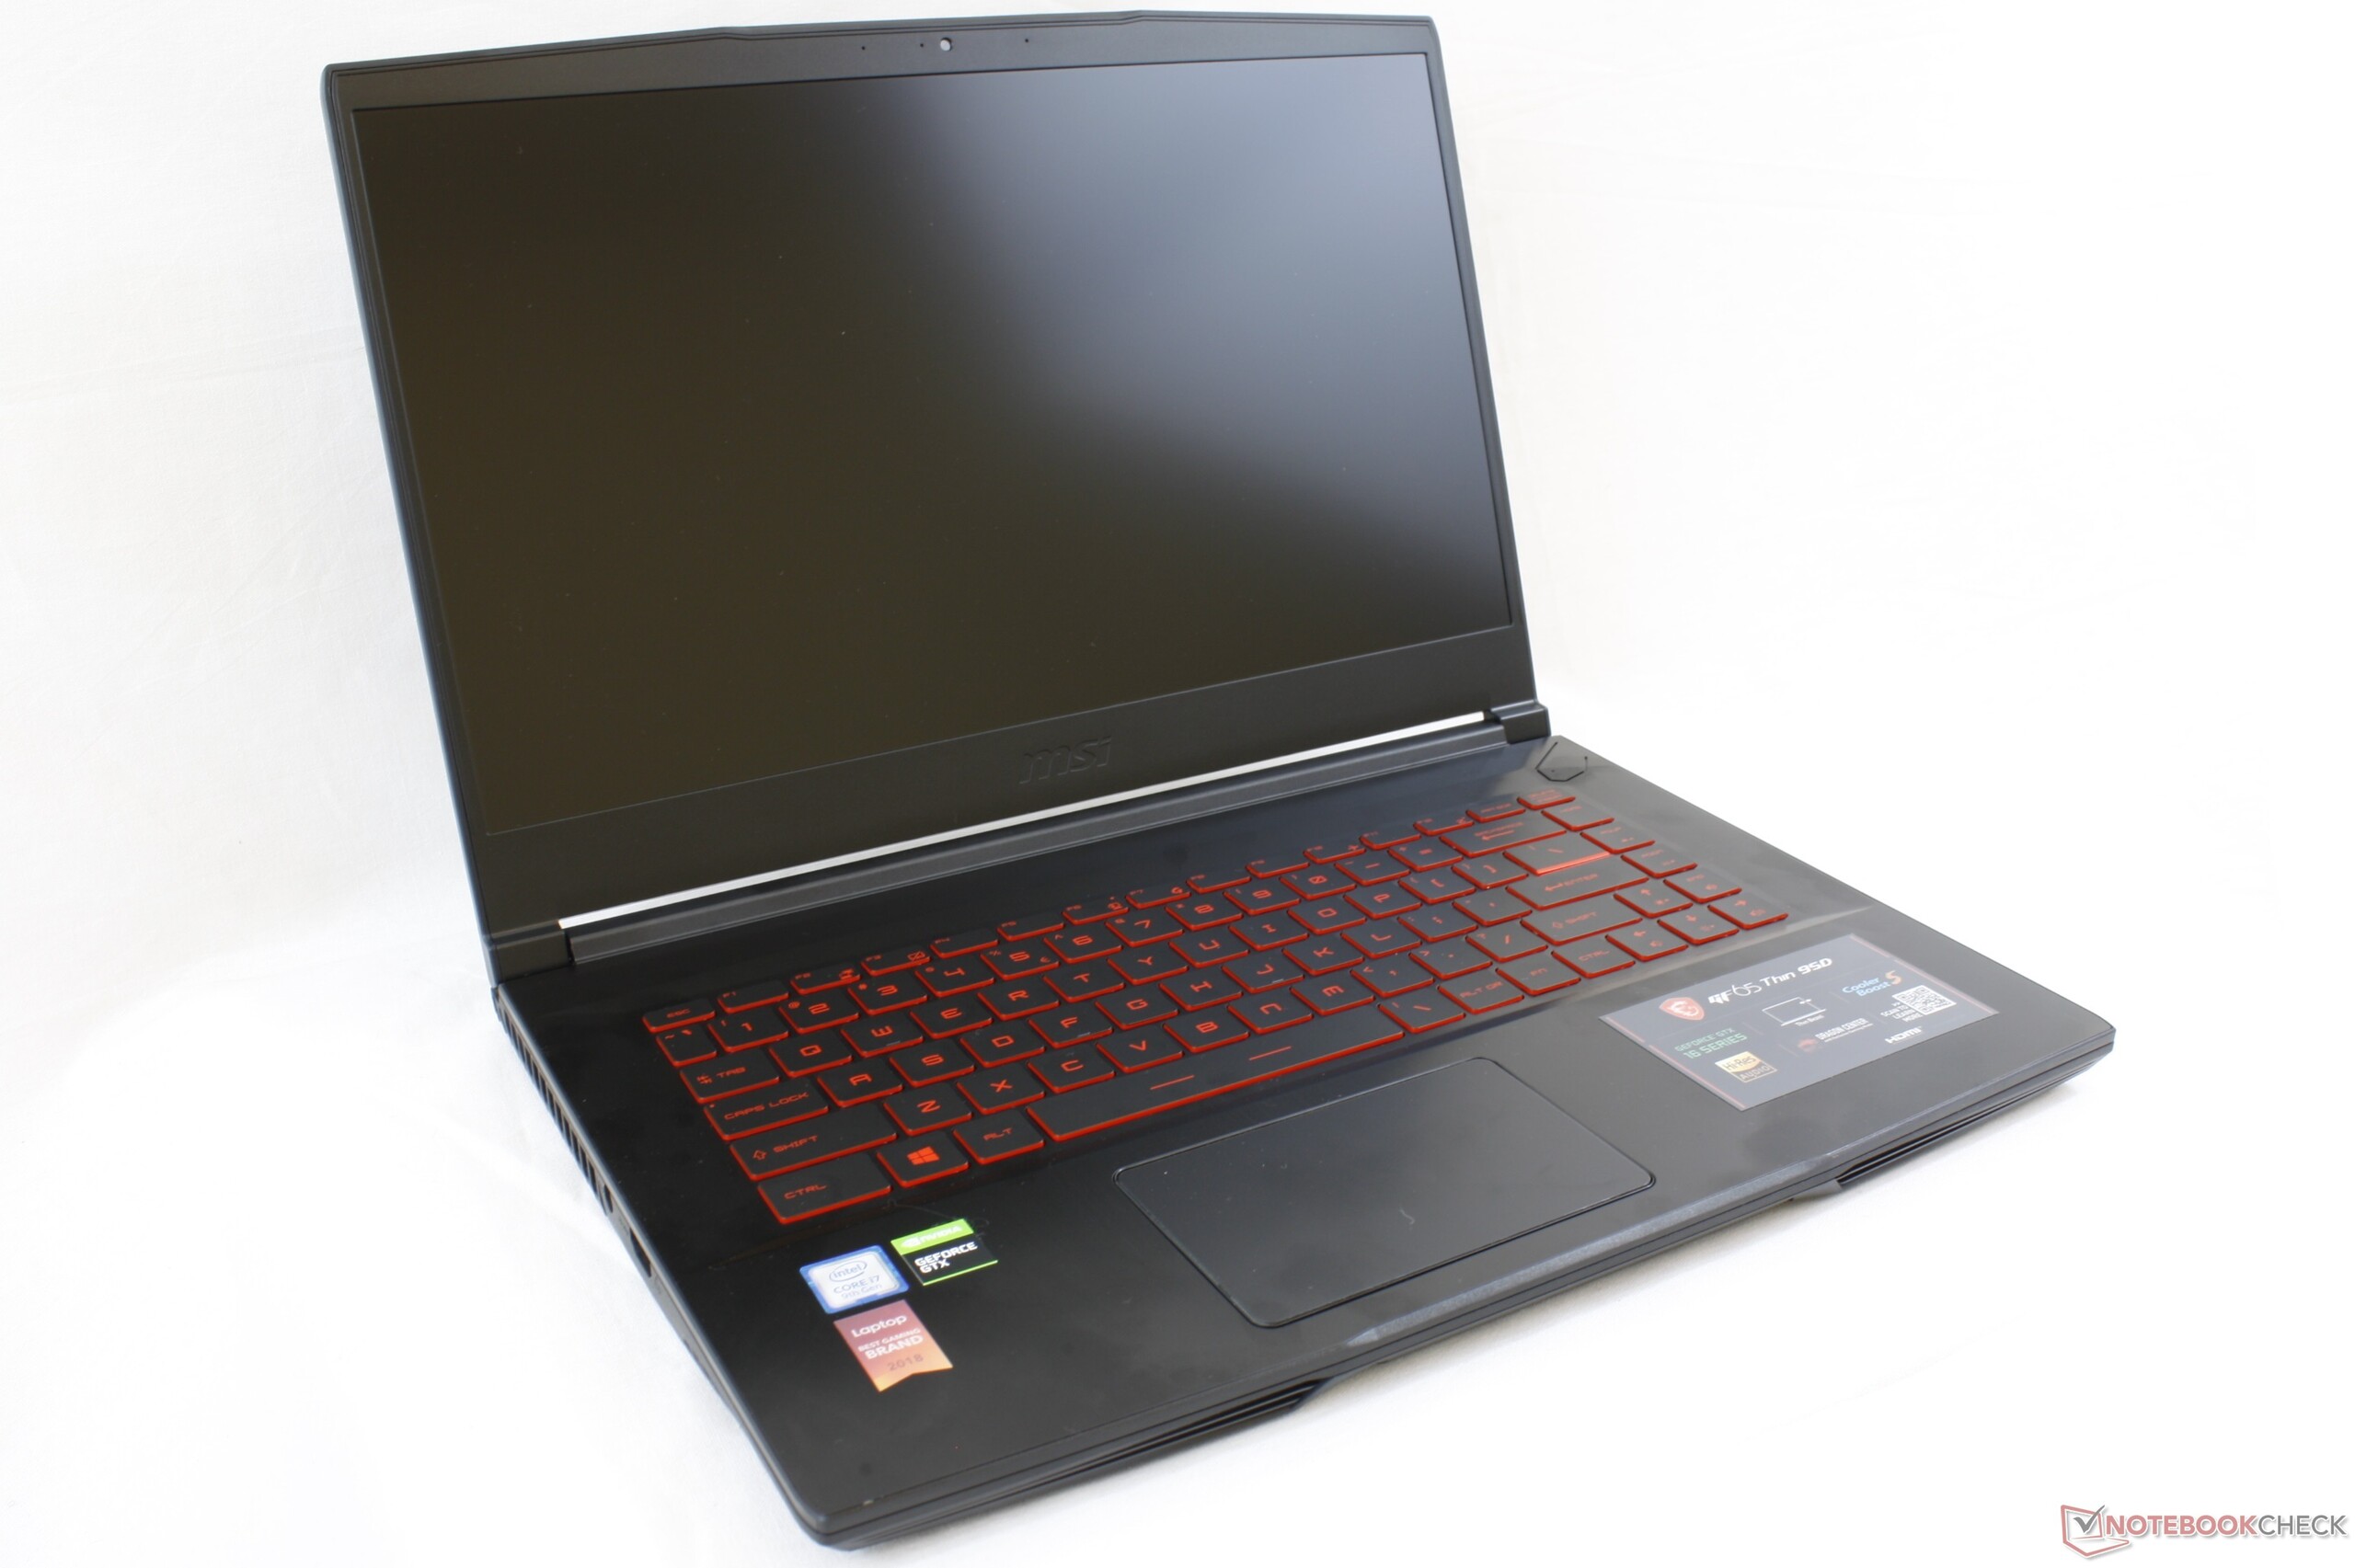
MSI GF65 9SD笔记本电脑评测:不到1000刀的GTX 1660 Ti笔记本
Rating | Date | Model | Weight | Height | Size | Resolution | Price |
|---|---|---|---|---|---|---|---|
| 78.8 % v7 (old) | 02 / 2020 | MSI GF65 9SD i7-9750H, GeForce GTX 1660 Ti Mobile | 1.9 kg | 21.7 mm | 15.60" | 1920x1080 | |
| 80.4 % v6 (old) | 08 / 2019 | Asus TUF FX505DT-EB73 R7 3750H, GeForce GTX 1650 Mobile | 2.2 kg | 26.8 mm | 15.60" | 1920x1080 | |
| 82.3 % v7 (old) | 02 / 2020 | Dell G7 7590 i7-9750H, GeForce RTX 2060 Mobile | 2.5 kg | 19.9 mm | 15.60" | 1920x1080 | |
| 82.3 % v7 (old) | 10 / 2019 | Lenovo Legion Y540-15IRH-81SX00B2GE i7-9750H, GeForce GTX 1660 Ti Mobile | 2.2 kg | 26 mm | 15.60" | 1920x1080 |
| Networking | |
| iperf3 transmit AX12 | |
| Aorus 15-SA | |
| Lenovo Legion Y540-15IRH-81SX00B2GE | |
| Asus TUF FX505DT-EB73 | |
| MSI GF63 8RC | |
| MSI GF65 9SD | |
| iperf3 receive AX12 | |
| Aorus 15-SA | |
| MSI GF65 9SD | |
| Lenovo Legion Y540-15IRH-81SX00B2GE | |
| Asus TUF FX505DT-EB73 | |
| MSI GF63 8RC | |
| |||||||||||||||||||||||||
Brightness Distribution: 90 %
Center on Battery: 258.5 cd/m²
Contrast: 923:1 (Black: 0.28 cd/m²)
ΔE ColorChecker Calman: 5.36 | ∀{0.5-29.43 Ø4.72}
calibrated: 4.92
ΔE Greyscale Calman: 3.4 | ∀{0.09-98 Ø4.97}
53.8% sRGB (Argyll 1.6.3 3D)
34.2% AdobeRGB 1998 (Argyll 1.6.3 3D)
37.26% AdobeRGB 1998 (Argyll 3D)
54.1% sRGB (Argyll 3D)
36.06% Display P3 (Argyll 3D)
Gamma: 2.06
CCT: 6192 K
| MSI GF65 9SD AU Optronics B156HAN13.0, IPS, 15.6", 1920x1080 | MSI GF63 8RC AU Optronics B156HAN02.1, IPS, 15.6", 1920x1080 | Asus TUF FX505DT-EB73 Panda LM156LF-GL, IPS, 15.6", 1920x1080 | Aorus 15-SA LG Philips LP156WFG-SPB2 (LGD05E8), IPS, 15.6", 1920x1080 | Dell G7 7590 AU Optronics B156HAN, IPS, 15.6", 1920x1080 | Lenovo Legion Y540-15IRH-81SX00B2GE BOE 084D, IPS, 15.6", 1920x1080 | |
|---|---|---|---|---|---|---|
| Display | 9% | 10% | 76% | 73% | 74% | |
| Display P3 Coverage (%) | 36.06 | 39.43 9% | 39.56 10% | 64.3 78% | 64.4 79% | 63.6 76% |
| sRGB Coverage (%) | 54.1 | 59.3 10% | 59.5 10% | 93.6 73% | 90 66% | 91.7 70% |
| AdobeRGB 1998 Coverage (%) | 37.26 | 40.73 9% | 40.91 10% | 65.6 76% | 65.3 75% | 65.2 75% |
| Response Times | 0% | 3% | 53% | 58% | 64% | |
| Response Time Grey 50% / Grey 80% * (ms) | 35.2 ? | 33.2 ? 6% | 30.4 ? 14% | 15.6 ? 56% | 14 ? 60% | 8.8 ? 75% |
| Response Time Black / White * (ms) | 25.6 ? | 27.2 ? -6% | 27.6 ? -8% | 12.8 ? 50% | 11.2 ? 56% | 12 ? 53% |
| PWM Frequency (Hz) | ||||||
| Screen | -3% | -2% | 30% | -3% | 29% | |
| Brightness middle (cd/m²) | 258.5 | 266.6 3% | 286.2 11% | 266 3% | 330.5 28% | 299 16% |
| Brightness (cd/m²) | 254 | 257 1% | 267 5% | 254 0% | 324 28% | 290 14% |
| Brightness Distribution (%) | 90 | 89 -1% | 84 -7% | 90 0% | 91 1% | 89 -1% |
| Black Level * (cd/m²) | 0.28 | 0.29 -4% | 0.33 -18% | 0.28 -0% | 0.71 -154% | 0.29 -4% |
| Contrast (:1) | 923 | 919 0% | 867 -6% | 950 3% | 465 -50% | 1031 12% |
| Colorchecker dE 2000 * | 5.36 | 5.93 -11% | 5.45 -2% | 3.11 42% | 5.33 1% | 3.7 31% |
| Colorchecker dE 2000 max. * | 23.23 | 16.28 30% | 18.08 22% | 5.84 75% | 11.08 52% | 7 70% |
| Colorchecker dE 2000 calibrated * | 4.92 | 3.6 27% | 4.47 9% | 1.37 72% | 3.63 26% | 2 59% |
| Greyscale dE 2000 * | 3.4 | 6.8 -100% | 5.3 -56% | 3.94 -16% | 6.7 -97% | 4.1 -21% |
| Gamma | 2.06 107% | 2.43 91% | 2.1 105% | 2.53 87% | 2.24 98% | 2.19 100% |
| CCT | 6192 105% | 7192 90% | 7679 85% | 6210 105% | 8035 81% | 7166 91% |
| Color Space (Percent of AdobeRGB 1998) (%) | 34.2 | 37.6 10% | 37.6 10% | 60 75% | 58.3 70% | 59.3 73% |
| Color Space (Percent of sRGB) (%) | 53.8 | 59.3 10% | 59.1 10% | 93 73% | 89.5 66% | 91.5 70% |
| Total Average (Program / Settings) | 2% /
-0% | 4% /
1% | 53% /
41% | 43% /
19% | 56% /
42% |
* ... smaller is better
Display Response Times
| ↔ Response Time Black to White | ||
|---|---|---|
| 25.6 ms ... rise ↗ and fall ↘ combined | ↗ 12.4 ms rise | 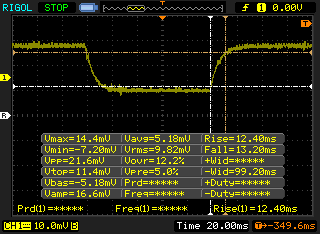 |
| ↘ 13.2 ms fall | ||
| The screen shows relatively slow response rates in our tests and may be too slow for gamers. In comparison, all tested devices range from 0.1 (minimum) to 240 (maximum) ms. » 61 % of all devices are better. This means that the measured response time is worse than the average of all tested devices (19.8 ms). | ||
| ↔ Response Time 50% Grey to 80% Grey | ||
| 35.2 ms ... rise ↗ and fall ↘ combined | ↗ 18 ms rise | 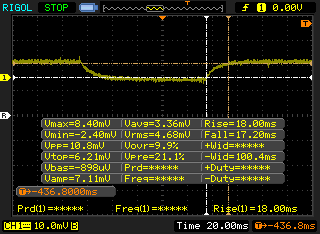 |
| ↘ 17.2 ms fall | ||
| The screen shows slow response rates in our tests and will be unsatisfactory for gamers. In comparison, all tested devices range from 0.165 (minimum) to 636 (maximum) ms. » 49 % of all devices are better. This means that the measured response time is worse than the average of all tested devices (31 ms). | ||
Screen Flickering / PWM (Pulse-Width Modulation)
| Screen flickering / PWM not detected | 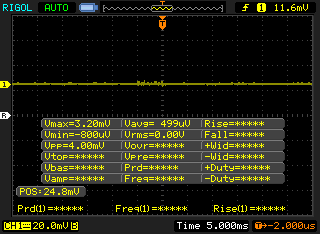 | ||
In comparison: 52 % of all tested devices do not use PWM to dim the display. If PWM was detected, an average of 7747 (minimum: 5 - maximum: 343500) Hz was measured. | |||
| Cinebench R15 | |
| CPU Single 64Bit | |
| MSI GT76 Titan DT 9SG | |
| MSI GT75 8RG-090 Titan | |
| MSI GE75 9SG | |
| Average Intel Core i7-9750H (170 - 194, n=82) | |
| MSI GF65 9SD | |
| MSI GE75 8SG Raider | |
| Dell XPS 13 7390 2-in-1 Core i7 | |
| Dell G3 3590 | |
| MSI GV62 8RE-016US | |
| MSI GF62VR 7RF-877 | |
| Asus ROG Zephyrus G15 GA502DU | |
| CPU Multi 64Bit | |
| MSI GT76 Titan DT 9SG | |
| MSI GE75 9SG | |
| MSI GT75 8RG-090 Titan | |
| MSI GF65 9SD | |
| Average Intel Core i7-9750H (952 - 1306, n=85) | |
| MSI GE75 8SG Raider | |
| Dell XPS 13 7390 2-in-1 Core i7 | |
| MSI GV62 8RE-016US | |
| Asus ROG Zephyrus G15 GA502DU | |
| Dell G3 3590 | |
| MSI GF62VR 7RF-877 | |
| Cinebench R11.5 | |
| CPU Single 64Bit | |
| MSI GT75 8RG-090 Titan | |
| Dell XPS 13 7390 2-in-1 Core i7 | |
| MSI GE75 9SG | |
| Average Intel Core i7-9750H (1.96 - 2.19, n=10) | |
| MSI GV62 8RE-016US | |
| MSI GF62VR 7RF-877 | |
| Asus ROG Zephyrus G15 GA502DU | |
| CPU Multi 64Bit | |
| MSI GE75 9SG | |
| MSI GT75 8RG-090 Titan | |
| Average Intel Core i7-9750H (11.3 - 14.1, n=10) | |
| Dell XPS 13 7390 2-in-1 Core i7 | |
| Asus ROG Zephyrus G15 GA502DU | |
| MSI GF62VR 7RF-877 | |
| MSI GV62 8RE-016US | |
| Cinebench R10 | |
| Rendering Multiple CPUs 32Bit | |
| MSI GE75 9SG | |
| Average Intel Core i7-9750H (28251 - 36304, n=13) | |
| Dell XPS 13 7390 2-in-1 Core i7 | |
| MSI GF62VR 7RF-877 | |
| MSI GV62 8RE-016US | |
| Asus ROG Zephyrus G15 GA502DU | |
| Rendering Single 32Bit | |
| Dell XPS 13 7390 2-in-1 Core i7 | |
| MSI GE75 9SG | |
| Average Intel Core i7-9750H (6659 - 7214, n=13) | |
| MSI GV62 8RE-016US | |
| MSI GF62VR 7RF-877 | |
| Asus ROG Zephyrus G15 GA502DU | |
| wPrime 2.10 - 1024m | |
| Dell XPS 13 7390 2-in-1 Core i7 | |
| MSI GF62VR 7RF-877 | |
| MSI GV62 8RE-016US | |
| Asus ROG Zephyrus G15 GA502DU | |
| Average Intel Core i7-9750H (n=1) | |
| MSI GE75 9SG | |
* ... smaller is better
| PCMark 8 Home Score Accelerated v2 | 4205 points | |
| PCMark 8 Work Score Accelerated v2 | 5357 points | |
| PCMark 10 Score | 5508 points | |
Help | ||
| MSI GF65 9SD Kingston RBUSNS8154P3512GJ | Asus TUF FX505DT-EB73 Intel SSD 660p SSDPEKNW512G8 | Aorus 15-SA Intel SSD 760p SSDPEKKW512G8 | Dell G7 7590 Toshiba BG3 KBG30ZMS256G | Lenovo Legion Y540-15IRH-81SX00B2GE WDC PC SN720 SDAPNTW-512G | |
|---|---|---|---|---|---|
| AS SSD | 7% | 50% | -52% | 92% | |
| Seq Read (MB/s) | 1148 | 1019 -11% | 2601 127% | 1013 -12% | 2927 155% |
| Seq Write (MB/s) | 962 | 889 -8% | 1507 57% | 203.8 -79% | 2149 123% |
| 4K Read (MB/s) | 22.87 | 48.22 111% | 56.3 146% | 29.57 29% | 42.43 86% |
| 4K Write (MB/s) | 80.6 | 115.5 43% | 110.3 37% | 71.4 -11% | 147.1 83% |
| 4K-64 Read (MB/s) | 772 | 321.5 -58% | 877 14% | 332.1 -57% | 1286 67% |
| 4K-64 Write (MB/s) | 711 | 787 11% | 914 29% | 152.9 -78% | 1432 101% |
| Access Time Read * (ms) | 0.125 | 0.065 48% | 0.05 60% | 0.183 -46% | 0.065 48% |
| Access Time Write * (ms) | 0.138 | 0.047 66% | 0.034 75% | 0.248 -80% | 0.026 81% |
| Score Read (Points) | 910 | 472 -48% | 1193 31% | 463 -49% | 1621 78% |
| Score Write (Points) | 887 | 992 12% | 1175 32% | 245 -72% | 1794 102% |
| Score Total (Points) | 2254 | 1717 -24% | 2938 30% | 913 -59% | 4208 87% |
| Copy ISO MB/s (MB/s) | 1103 | 942 -15% | 2104 91% | 263.6 -76% | |
| Copy Program MB/s (MB/s) | 537 | 444.5 -17% | 387.7 -28% | 213.8 -60% | |
| Copy Game MB/s (MB/s) | 997 | 867 -13% | 1021 2% | 188 -81% |
* ... smaller is better

| 3DMark | |
| 1280x720 Cloud Gate Standard Graphics | |
| MSI GT75VR 7RF-012 Titan Pro | |
| MSI GF65 9SD | |
| MSI GS63VR 7RG-005 | |
| Average NVIDIA GeForce GTX 1660 Ti Mobile (59839 - 104780, n=18) | |
| Zotac GeForce GTX 1660 Ti 6 GB | |
| MSI GP72VR 7RFX | |
| MSI GL73 8SE-010US | |
| MSI GE75 8SF | |
| MSI GF75 Thin 9SC | |
| Asus TUF FX705GE-EW096T | |
| Asus ROG Zephyrus G15 GA502DU | |
| Asus FX504GD | |
| 1920x1080 Fire Strike Graphics | |
| MSI GT75VR 7RF-012 Titan Pro | |
| MSI GE75 8SF | |
| Zotac GeForce GTX 1660 Ti 6 GB | |
| MSI GL73 8SE-010US | |
| MSI GF65 9SD | |
| Average NVIDIA GeForce GTX 1660 Ti Mobile (14186 - 16488, n=24) | |
| MSI GS63VR 7RG-005 | |
| Asus ROG Zephyrus G15 GA502DU | |
| MSI GP72VR 7RFX | |
| MSI GF75 Thin 9SC | |
| Asus TUF FX705GE-EW096T | |
| Asus FX504GD | |
| 2560x1440 Time Spy Graphics | |
| MSI GE75 8SF | |
| MSI GT75VR 7RF-012 Titan Pro | |
| Zotac GeForce GTX 1660 Ti 6 GB | |
| MSI GL73 8SE-010US | |
| MSI GF65 9SD | |
| Average NVIDIA GeForce GTX 1660 Ti Mobile (5335 - 6123, n=22) | |
| Asus ROG Zephyrus G15 GA502DU | |
| MSI GS63VR 7RG-005 | |
| MSI GP72VR 7RFX | |
| MSI GF75 Thin 9SC | |
| Asus TUF FX705GE-EW096T | |
| Asus FX504GD | |
| 3DMark 11 | |
| 1280x720 Performance GPU | |
| MSI GT75VR 7RF-012 Titan Pro | |
| MSI GE75 8SF | |
| Zotac GeForce GTX 1660 Ti 6 GB | |
| MSI GF65 9SD | |
| MSI GL73 8SE-010US | |
| Average NVIDIA GeForce GTX 1660 Ti Mobile (18610 - 22670, n=24) | |
| MSI GS63VR 7RG-005 | |
| Asus ROG Zephyrus G15 GA502DU | |
| MSI GP72VR 7RFX | |
| MSI GF75 Thin 9SC | |
| Asus TUF FX705GE-EW096T | |
| Asus FX504GD | |
| 1280x720 Performance Combined | |
| Zotac GeForce GTX 1660 Ti 6 GB | |
| MSI GF65 9SD | |
| Average NVIDIA GeForce GTX 1660 Ti Mobile (9500 - 13311, n=23) | |
| MSI GF75 Thin 9SC | |
| MSI GT75VR 7RF-012 Titan Pro | |
| MSI GL73 8SE-010US | |
| MSI GE75 8SF | |
| Asus TUF FX705GE-EW096T | |
| MSI GS63VR 7RG-005 | |
| MSI GP72VR 7RFX | |
| Asus FX504GD | |
| Asus ROG Zephyrus G15 GA502DU | |
| 3DMark 11 Performance | 18059 points | |
| 3DMark Cloud Gate Standard Score | 36975 points | |
| 3DMark Fire Strike Score | 13483 points | |
| 3DMark Time Spy Score | 5825 points | |
Help | ||
| The Witcher 3 - 1920x1080 Ultra Graphics & Postprocessing (HBAO+) | |
| MSI GT76 Titan DT 9SG | |
| MSI P65 Creator 9SF-657 | |
| MSI GT75VR 7RF-012 Titan Pro | |
| MSI GE75 8SF | |
| Dell G7 7590 | |
| Zotac GeForce GTX 1660 Ti 6 GB | |
| MSI GF65 9SD | |
| Average NVIDIA GeForce GTX 1660 Ti Mobile (51.6 - 65.1, n=21) | |
| MSI GL73 8SE-010US | |
| Lenovo Legion Y540-15IRH-81SX00B2GE | |
| MSI GS63VR 7RG-005 | |
| Asus ROG Zephyrus G15 GA502DU | |
| MSI GF75 8RD-001 | |
| MSI GF62VR 7RF-877 | |
| MSI GF75 Thin 9SC | |
| MSI GF63 8RC | |
| Dell XPS 13 7390 2-in-1 Core i7 | |
| Shadow of the Tomb Raider - 1920x1080 Highest Preset AA:T | |
| Zotac GeForce GTX 1660 Ti 6 GB | |
| Dell G7 7590 | |
| Average NVIDIA GeForce GTX 1660 Ti Mobile (62 - 73, n=8) | |
| MSI GL73 8SE-010US | |
| MSI GF65 9SD | |
| Asus ROG Zephyrus G15 GA502DU | |
| MSI GF75 Thin 9SC | |
| low | med. | high | ultra | |
|---|---|---|---|---|
| BioShock Infinite (2013) | 317.1 | 264 | 250.9 | 128.6 |
| The Witcher 3 (2015) | 287.9 | 191.6 | 116 | 60.6 |
| Shadow of the Tomb Raider (2018) | 135 | 81 | 72 | 64 |
| MSI GF65 9SD GeForce GTX 1660 Ti Mobile, i7-9750H, Kingston RBUSNS8154P3512GJ | MSI GF63 8RC GeForce GTX 1050 Mobile, i5-8300H, Seagate BarraCuda Pro Compute 1TB ST1000LM049 | Lenovo Legion Y540-15IRH-81SX00B2GE GeForce GTX 1660 Ti Mobile, i7-9750H, WDC PC SN720 SDAPNTW-512G | Dell G7 7590 GeForce RTX 2060 Mobile, i7-9750H, Toshiba BG3 KBG30ZMS256G | Aorus 15-SA GeForce GTX 1660 Ti Mobile, i7-9750H, Intel SSD 760p SSDPEKKW512G8 | Asus ROG Zephyrus G15 GA502DU GeForce GTX 1660 Ti Max-Q, R7 3750H, Intel SSD 660p SSDPEKNW512G8 | |
|---|---|---|---|---|---|---|
| Noise | 6% | 12% | 5% | -7% | 3% | |
| off / environment * (dB) | 28.7 | 28 2% | 29.3 -2% | 28.4 1% | 29 -1% | 28 2% |
| Idle Minimum * (dB) | 33.3 | 33.8 -2% | 29.3 12% | 29.5 11% | 32 4% | 29.4 12% |
| Idle Average * (dB) | 33.9 | 34 -0% | 29.3 14% | 29.6 13% | 35 -3% | 31.9 6% |
| Idle Maximum * (dB) | 33.9 | 34.2 -1% | 29.3 14% | 29.6 13% | 41 -21% | 33 3% |
| Load Average * (dB) | 41 | 37.3 9% | 35.7 13% | 45 -10% | 54 -32% | 41.2 -0% |
| Witcher 3 ultra * (dB) | 49.5 | 43.4 12% | 44.2 11% | 51.5 -4% | 52 -5% | 53.8 -9% |
| Load Maximum * (dB) | 59.5 | 46 23% | 45.6 23% | 53 11% | 56 6% | 55.7 6% |
* ... smaller is better
Noise level
| Idle |
| 33.3 / 33.9 / 33.9 dB(A) |
| Load |
| 41 / 59.5 dB(A) |
 | ||
30 dB silent 40 dB(A) audible 50 dB(A) loud |
||
min: | ||
(-) The maximum temperature on the upper side is 52.8 °C / 127 F, compared to the average of 40.4 °C / 105 F, ranging from 21.2 to 68.8 °C for the class Gaming.
(-) The bottom heats up to a maximum of 53 °C / 127 F, compared to the average of 43.2 °C / 110 F
(+) In idle usage, the average temperature for the upper side is 26.5 °C / 80 F, compared to the device average of 33.9 °C / 93 F.
(±) Playing The Witcher 3, the average temperature for the upper side is 33.4 °C / 92 F, compared to the device average of 33.9 °C / 93 F.
(+) The palmrests and touchpad are cooler than skin temperature with a maximum of 26.2 °C / 79.2 F and are therefore cool to the touch.
(+) The average temperature of the palmrest area of similar devices was 28.8 °C / 83.8 F (+2.6 °C / 4.6 F).
MSI GF65 9SD audio analysis
(+) | speakers can play relatively loud (84.6 dB)
Bass 100 - 315 Hz
(-) | nearly no bass - on average 19.5% lower than median
(-) | bass is not linear (15.4% delta to prev. frequency)
Mids 400 - 2000 Hz
(+) | balanced mids - only 1.9% away from median
(+) | mids are linear (5.8% delta to prev. frequency)
Highs 2 - 16 kHz
(+) | balanced highs - only 2.5% away from median
(±) | linearity of highs is average (10.5% delta to prev. frequency)
Overall 100 - 16.000 Hz
(±) | linearity of overall sound is average (17.4% difference to median)
Compared to same class
» 48% of all tested devices in this class were better, 12% similar, 40% worse
» The best had a delta of 6%, average was 18%, worst was 132%
Compared to all devices tested
» 33% of all tested devices were better, 8% similar, 58% worse
» The best had a delta of 4%, average was 23%, worst was 134%
Apple MacBook 12 (Early 2016) 1.1 GHz audio analysis
(+) | speakers can play relatively loud (83.6 dB)
Bass 100 - 315 Hz
(±) | reduced bass - on average 11.3% lower than median
(±) | linearity of bass is average (14.2% delta to prev. frequency)
Mids 400 - 2000 Hz
(+) | balanced mids - only 2.4% away from median
(+) | mids are linear (5.5% delta to prev. frequency)
Highs 2 - 16 kHz
(+) | balanced highs - only 2% away from median
(+) | highs are linear (4.5% delta to prev. frequency)
Overall 100 - 16.000 Hz
(+) | overall sound is linear (10.2% difference to median)
Compared to same class
» 7% of all tested devices in this class were better, 2% similar, 90% worse
» The best had a delta of 5%, average was 18%, worst was 53%
Compared to all devices tested
» 5% of all tested devices were better, 1% similar, 94% worse
» The best had a delta of 4%, average was 23%, worst was 134%
| Off / Standby | |
| Idle | |
| Load |
|
Key:
min: | |
| MSI GF65 9SD i7-9750H, GeForce GTX 1660 Ti Mobile, Kingston RBUSNS8154P3512GJ, IPS, 1920x1080, 15.6" | Asus ROG Zephyrus G15 GA502DU R7 3750H, GeForce GTX 1660 Ti Max-Q, Intel SSD 660p SSDPEKNW512G8, IPS, 1920x1080, 15.6" | MSI GF63 8RC i5-8300H, GeForce GTX 1050 Mobile, Seagate BarraCuda Pro Compute 1TB ST1000LM049, IPS, 1920x1080, 15.6" | Aorus 15-SA i7-9750H, GeForce GTX 1660 Ti Mobile, Intel SSD 760p SSDPEKKW512G8, IPS, 1920x1080, 15.6" | Dell G7 7590 i7-9750H, GeForce RTX 2060 Mobile, Toshiba BG3 KBG30ZMS256G, IPS, 1920x1080, 15.6" | Lenovo Legion Y7000P-1060 i7-8750H, GeForce GTX 1060 Mobile, Samsung SSD PM981 MZVLB256HAHQ, IPS, 1920x1080, 15.6" | |
|---|---|---|---|---|---|---|
| Power Consumption | 6% | 29% | -38% | -35% | 14% | |
| Idle Minimum * (Watt) | 9.5 | 7.4 22% | 5.4 43% | 20 -111% | 11.2 -18% | 4.9 48% |
| Idle Average * (Watt) | 12.4 | 8.6 31% | 10.4 16% | 23 -85% | 16.3 -31% | 8.1 35% |
| Idle Maximum * (Watt) | 22 | 39.1 -78% | 10.5 52% | 29 -32% | 46.2 -110% | 16.5 25% |
| Load Average * (Watt) | 80.8 | 65.9 18% | 84.7 -5% | 87 -8% | 123.3 -53% | 109.2 -35% |
| Witcher 3 ultra * (Watt) | 133.9 | 106.9 20% | 92.7 31% | 136 -2% | 135.6 -1% | 124.6 7% |
| Load Maximum * (Watt) | 187.1 | 141.3 24% | 119.9 36% | 173 8% | 181.5 3% | 175.2 6% |
* ... smaller is better
| MSI GF65 9SD i7-9750H, GeForce GTX 1660 Ti Mobile, 51 Wh | Asus ROG Zephyrus G15 GA502DU R7 3750H, GeForce GTX 1660 Ti Max-Q, 76 Wh | MSI GF63 8RC i5-8300H, GeForce GTX 1050 Mobile, 51 Wh | Lenovo Legion Y540-15IRH-81SX00B2GE i7-9750H, GeForce GTX 1660 Ti Mobile, 57 Wh | Dell G7 7590 i7-9750H, GeForce RTX 2060 Mobile, 60 Wh | Aorus 15-SA i7-9750H, GeForce GTX 1660 Ti Mobile, 62 Wh | |
|---|---|---|---|---|---|---|
| Battery runtime | 57% | 8% | -53% | -10% | -45% | |
| WiFi v1.3 (h) | 5.1 | 8 57% | 5.5 8% | 2.4 -53% | 4.6 -10% | 2.8 -45% |
| Reader / Idle (h) | 15.3 | 9.5 | 4 | 11.1 | 3.5 | |
| Load (h) | 2.1 | 0.9 | 1.3 | 1.8 | 2 |
Pros
Cons

相比较较老的GF63最为显着的升级是GF65中的GTX 1660 Ti GPU。 GF63选择仅限于GTX 1050 Ti,它的性能比GTX 1660 Ti差50%。游戏性能差异将是明显的。
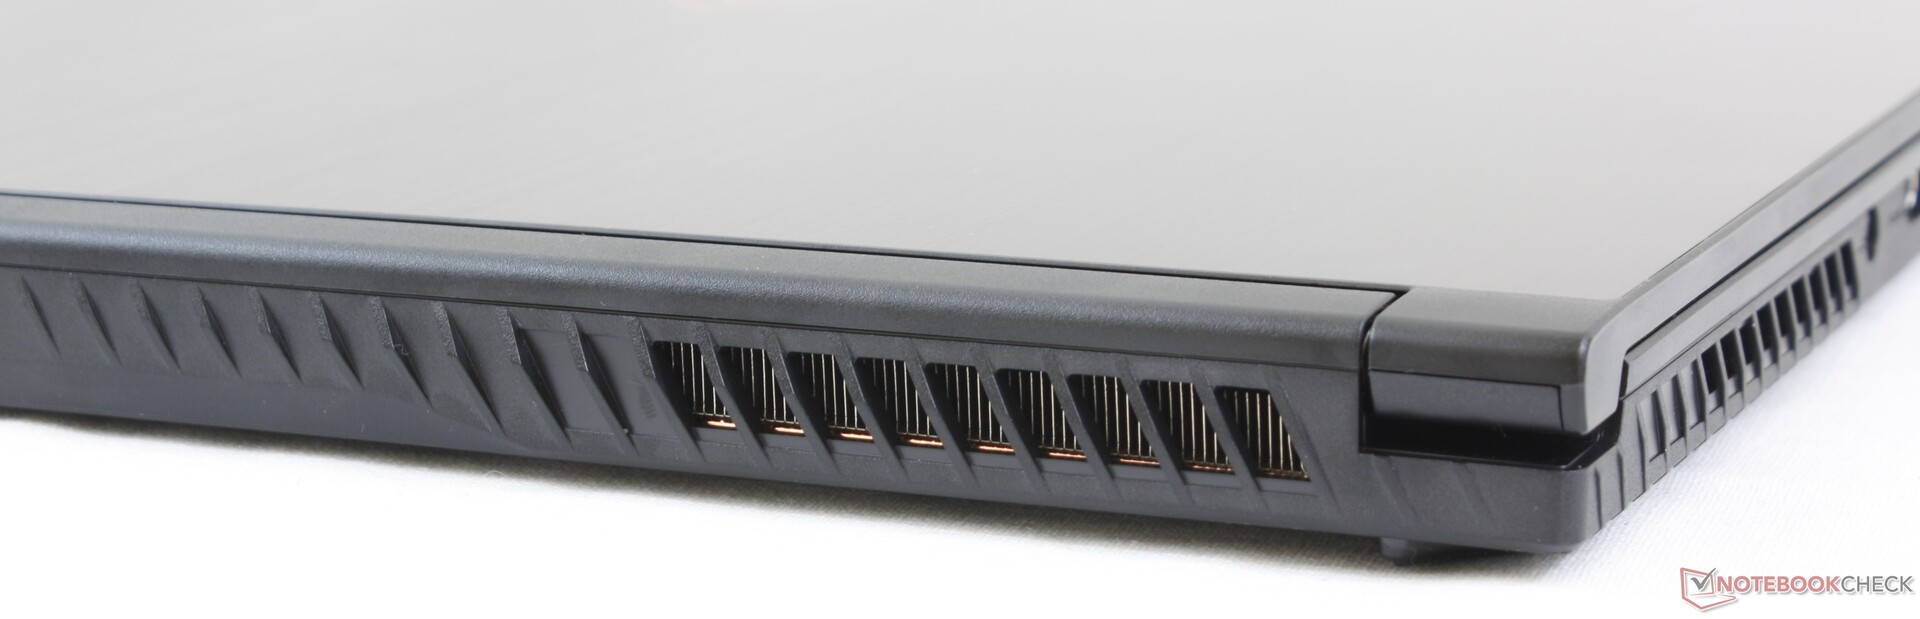
除了GPU更换以外,GF65还具有另一块M.2插槽,120/144 Hz显示选件,风扇和更多的热管,以便容纳更耗电的GPU。几乎所有其他配置都相同,包括平均续航时间,平均黑白响应时间,廉价机身,出色的扬声器以及中等难度的可维修性。然而,一个重要的变化是风扇噪音,因为GF65在游戏时声音更大。
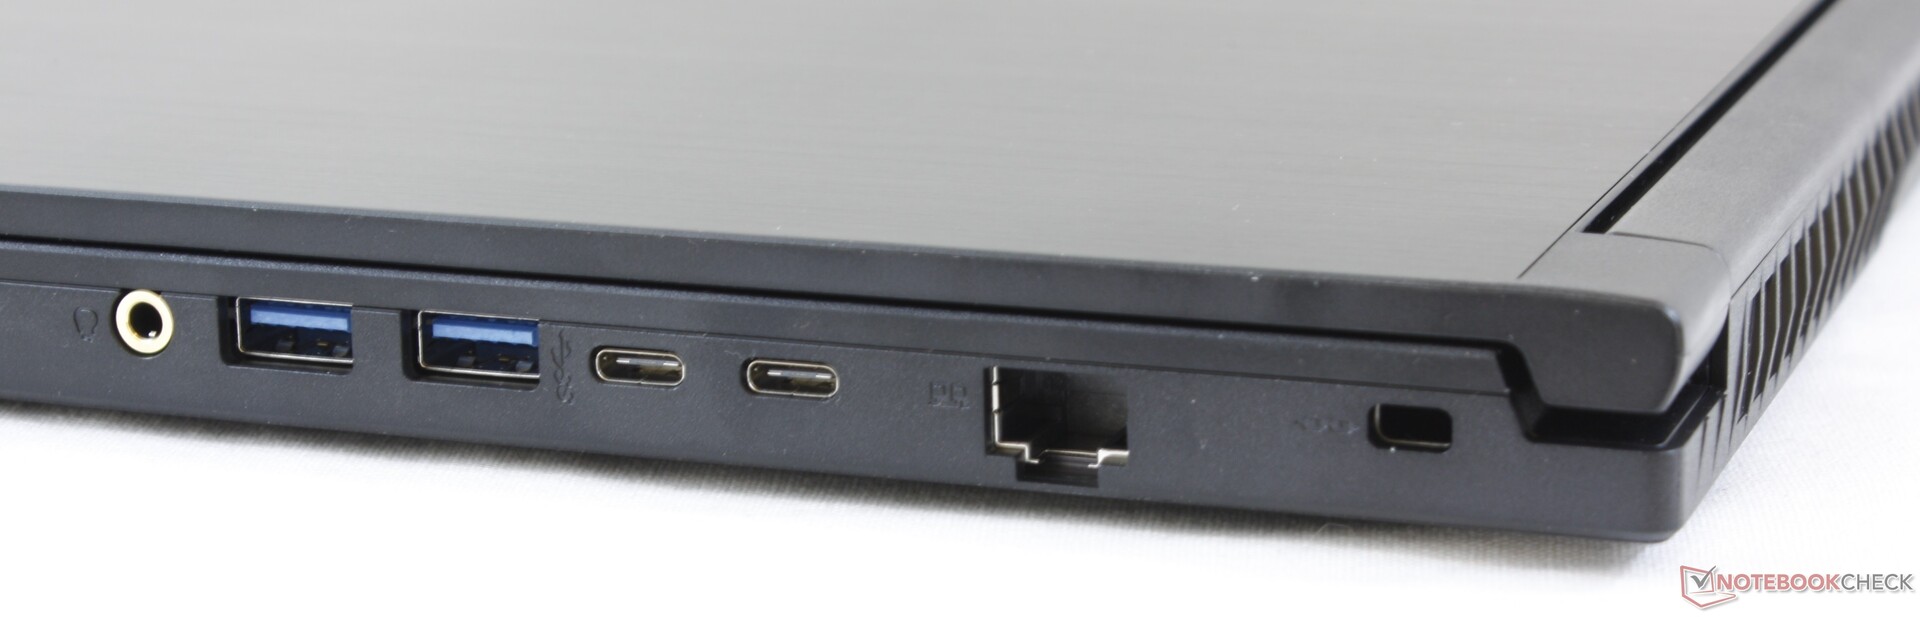
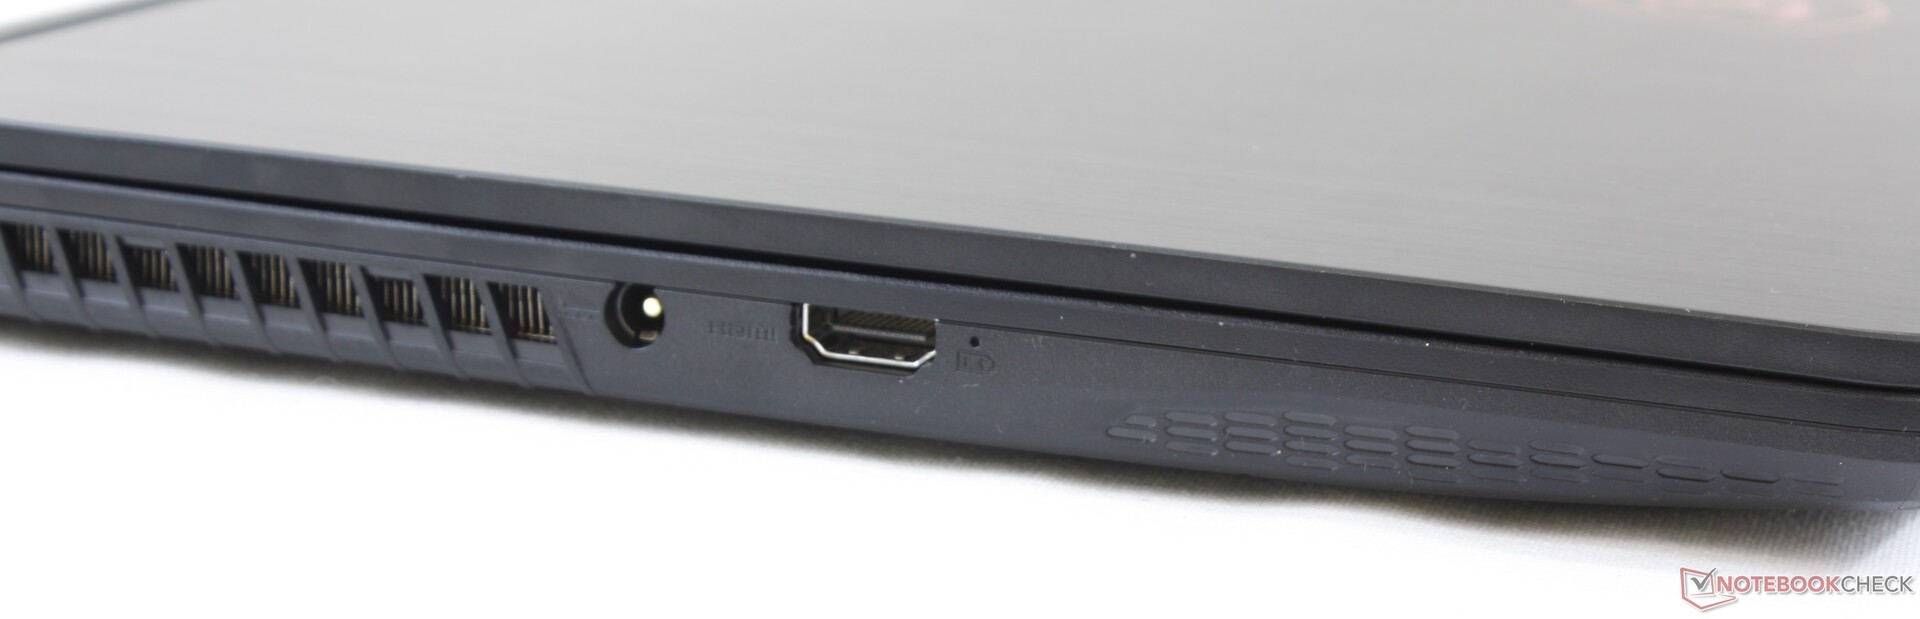
MSI GF65 GTX 1660 Ti的价格不到1000美元,从此您可以获得大的游戏性能,尤其是当您考虑以更低的价格购买较差的GTX 1060笔记本电脑时。您将不得不应对巨大的风扇噪音,适度的重影以及非常规的接口位置。
MSI GF65 9SD
- 05/15/2020 v7 (old)
Allen Ngo
Price comparison

