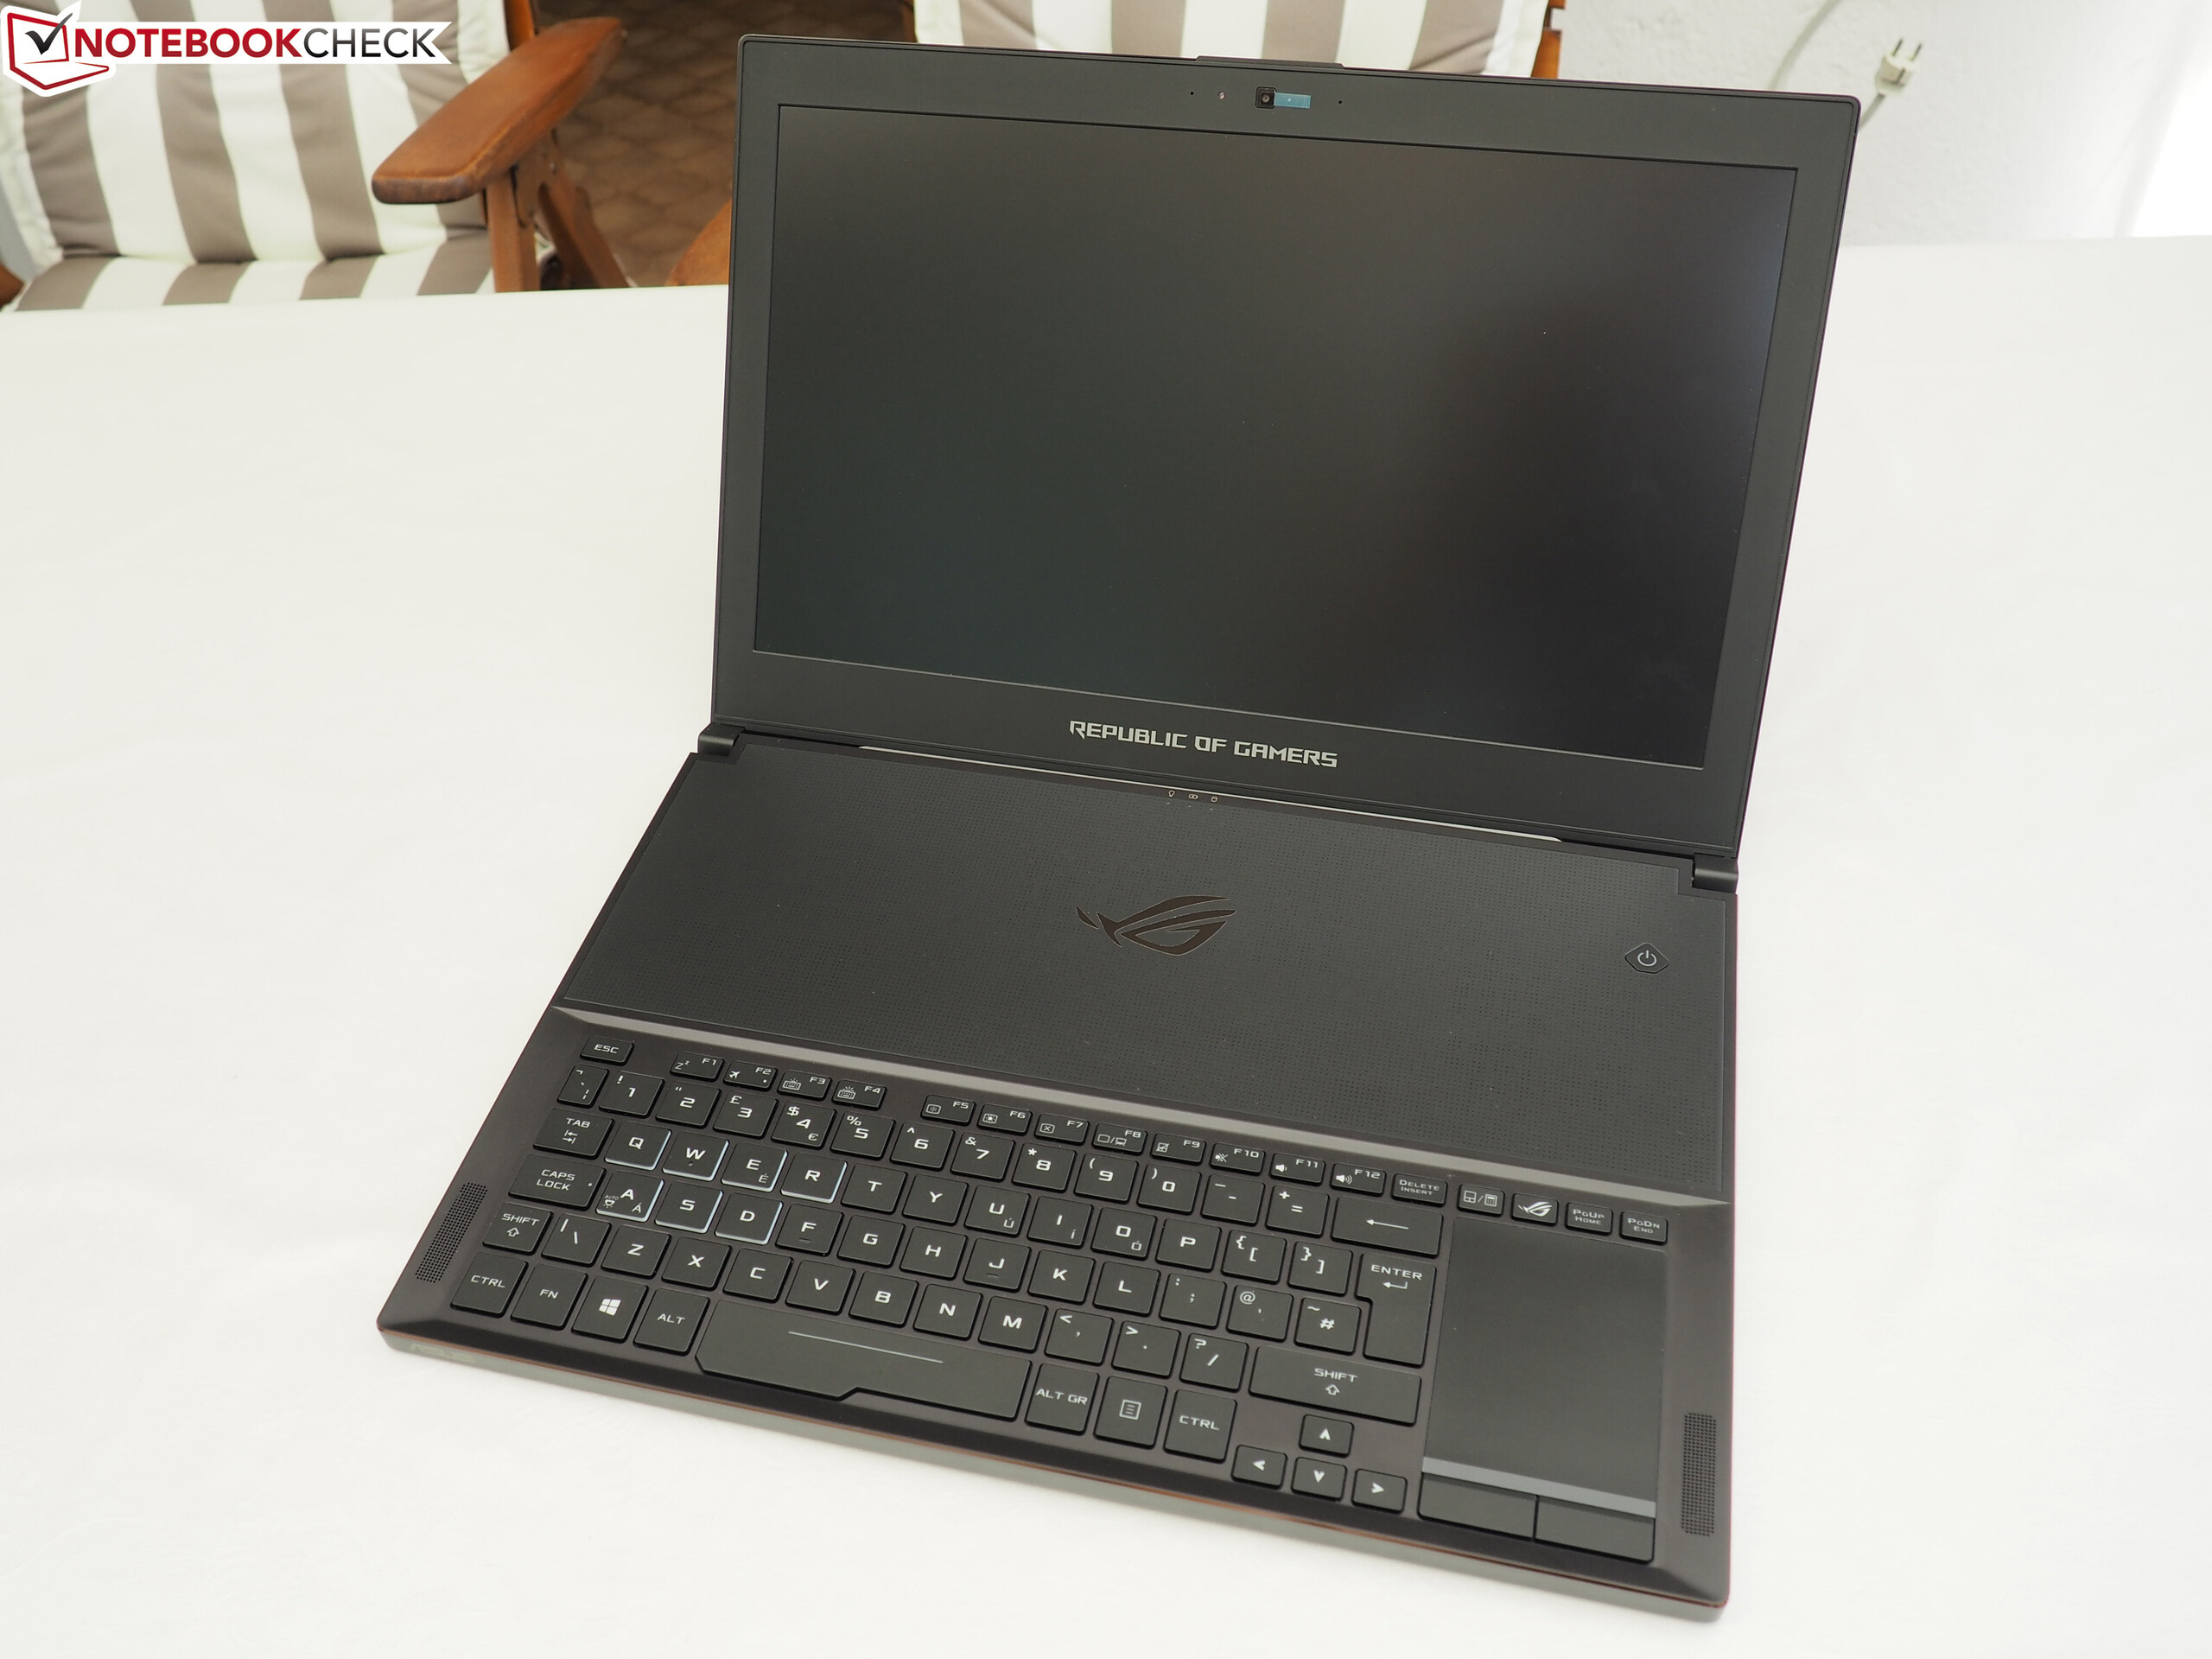
华硕 ROG Zephyrus GX501 笔记本电脑简短评测

| |||||||||||||||||||||||||
Brightness Distribution: 83 %
Center on Battery: 328 cd/m²
Contrast: 1312:1 (Black: 0.25 cd/m²)
ΔE ColorChecker Calman: 6.02 | ∀{0.5-29.43 Ø4.72}
ΔE Greyscale Calman: 6.32 | ∀{0.09-98 Ø4.97}
92% sRGB (Argyll 1.6.3 3D)
60% AdobeRGB 1998 (Argyll 1.6.3 3D)
65.9% AdobeRGB 1998 (Argyll 3D)
91.8% sRGB (Argyll 3D)
64.8% Display P3 (Argyll 3D)
Gamma: 2.28
CCT: 8194 K
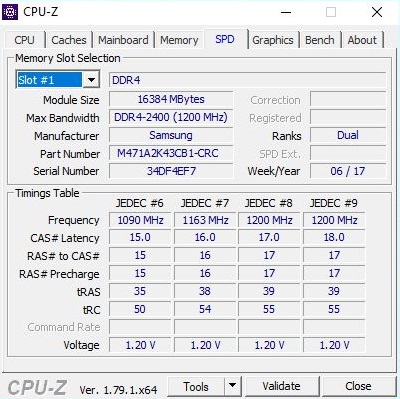
| Asus Zephyrus GX501 AUO B156HAN04.2 (AUO42ED), 1920x1080 | Alienware 15 R3 HPJGK_B156HTN (AUO51ED), 1920x1080 | Schenker XMG P507 PRO AUO B156HTN05.2 (AUO52ED), 1920x1080 | Asus FX502VM-AS73 1920x1080 | Gigabyte Aero 15 N156HCA-EA1 (CMN15D7), 1920x1080 | MSI GS63VR 7RF-228US 3840x2160 | |
|---|---|---|---|---|---|---|
| Display | 0% | -1% | -40% | 1% | -24% | |
| Display P3 Coverage (%) | 64.8 | 66 2% | 66.4 2% | 38.28 -41% | 65.2 1% | 48.21 -26% |
| sRGB Coverage (%) | 91.8 | 90.5 -1% | 88.9 -3% | 56.9 -38% | 92.5 1% | 72.6 -21% |
| AdobeRGB 1998 Coverage (%) | 65.9 | 66.2 0% | 65.1 -1% | 39.47 -40% | 66.5 1% | 49.81 -24% |
| Response Times | 44% | 46% | 19% | -20% | 17% | |
| Response Time Grey 50% / Grey 80% * (ms) | 40.4 ? | 25 ? 38% | 24 ? 41% | 28.4 ? 30% | 42.8 ? -6% | 28 ? 31% |
| Response Time Black / White * (ms) | 24 ? | 12 ? 50% | 12 ? 50% | 22.4 ? 7% | 32 ? -33% | 23.6 ? 2% |
| PWM Frequency (Hz) | 26000 ? | 1351 ? | ||||
| Screen | -23% | -30% | -39% | -3% | -32% | |
| Brightness middle (cd/m²) | 328 | 386 18% | 357 9% | 209.5 -36% | 320 -2% | 274.2 -16% |
| Brightness (cd/m²) | 305 | 382 25% | 365 20% | 205 -33% | 316 4% | 263 -14% |
| Brightness Distribution (%) | 83 | 93 12% | 85 2% | 92 11% | 90 8% | 92 11% |
| Black Level * (cd/m²) | 0.25 | 0.39 -56% | 0.5 -100% | 0.69 -176% | 0.36 -44% | 0.44 -76% |
| Contrast (:1) | 1312 | 990 -25% | 714 -46% | 304 -77% | 889 -32% | 623 -53% |
| Colorchecker dE 2000 * | 6.02 | 10.2 -69% | 9.93 -65% | 4.7 22% | 4.62 23% | 8 -33% |
| Colorchecker dE 2000 max. * | 10.14 | 15.81 -56% | 14.87 -47% | 19.7 -94% | 9.75 4% | 14.6 -44% |
| Greyscale dE 2000 * | 6.32 | 11.28 -78% | 10.32 -63% | 1.8 72% | 6 5% | 9.1 -44% |
| Gamma | 2.28 96% | 2.23 99% | 2.11 104% | 2.23 99% | 2.46 89% | 2.24 98% |
| CCT | 8194 79% | 11383 57% | 10096 64% | 6975 93% | 6761 96% | 5020 129% |
| Color Space (Percent of AdobeRGB 1998) (%) | 60 | 59 -2% | 58 -3% | 36.2 -40% | 60 0% | 45.7 -24% |
| Color Space (Percent of sRGB) (%) | 92 | 90 -2% | 89 -3% | 56.6 -38% | 92 0% | 72.1 -22% |
| Total Average (Program / Settings) | 7% /
-10% | 5% /
-14% | -20% /
-31% | -7% /
-5% | -13% /
-24% |
* ... smaller is better
Display Response Times
| ↔ Response Time Black to White | ||
|---|---|---|
| 24 ms ... rise ↗ and fall ↘ combined | ↗ 11.6 ms rise | 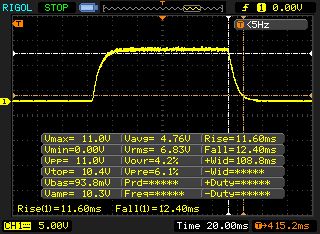 |
| ↘ 12.4 ms fall | ||
| The screen shows good response rates in our tests, but may be too slow for competitive gamers. In comparison, all tested devices range from 0.1 (minimum) to 240 (maximum) ms. » 54 % of all devices are better. This means that the measured response time is worse than the average of all tested devices (19.8 ms). | ||
| ↔ Response Time 50% Grey to 80% Grey | ||
| 40.4 ms ... rise ↗ and fall ↘ combined | ↗ 23.2 ms rise | 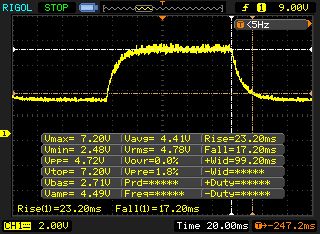 |
| ↘ 17.2 ms fall | ||
| The screen shows slow response rates in our tests and will be unsatisfactory for gamers. In comparison, all tested devices range from 0.165 (minimum) to 636 (maximum) ms. » 64 % of all devices are better. This means that the measured response time is worse than the average of all tested devices (31 ms). | ||
Screen Flickering / PWM (Pulse-Width Modulation)
| Screen flickering / PWM not detected | 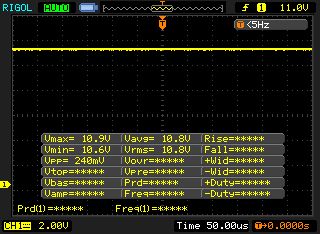 | ||
In comparison: 52 % of all tested devices do not use PWM to dim the display. If PWM was detected, an average of 7769 (minimum: 5 - maximum: 343500) Hz was measured. | |||
| PCMark 8 Home Score Accelerated v2 | 5057 points | |
| PCMark 8 Work Score Accelerated v2 | 5289 points | |
| PCMark 10 Score | 5125 points | |
Help | ||
| 3DMark Vantage P Result | 39562 points | |
| 3DMark 11 Performance | 16821 points | |
| 3DMark Ice Storm Standard Score | 140964 points | |
| 3DMark Cloud Gate Standard Score | 27935 points | |
| 3DMark Fire Strike Score | 14260 points | |
| 3DMark Time Spy Score | 5390 points | |
Help | ||
| low | med. | high | ultra | QHD | 4K | |
|---|---|---|---|---|---|---|
| The Witcher 3 (2015) | 118 | 61.9 | 43.7 | |||
| Batman: Arkham Knight (2015) | 124 | 88 | 48 | |||
| Star Wars Battlefront (2015) | 164 | 144 | 55.6 | |||
| Assassin's Creed Syndicate (2015) | 74.4 | 50.3 | 40 | |||
| Rainbow Six Siege (2015) | 197 | 172 | 65.7 | |||
| Rise of the Tomb Raider (2016) | 125 | 105 | 43.6 | |||
| Far Cry Primal (2016) | 92 | 87 | 41 | |||
| The Division (2016) | 107 | 83.8 | 40.8 | |||
| Doom (2016) | 134 | 128 | 53.9 | |||
| Mirror's Edge Catalyst (2016) | 106 | 97.8 | 38.8 | |||
| Deus Ex Mankind Divided (2016) | 87.3 | 47.9 | 29.6 | |||
| Battlefield 1 (2016) | 130 | 113 | 49 | |||
| Titanfall 2 (2016) | 131 | 113 | 46.6 | |||
| Call of Duty Infinite Warfare (2016) | 123 | 118 | 63.7 | |||
| Dishonored 2 (2016) | 78.2 | 66.5 | 43.4 | |||
| Watch Dogs 2 (2016) | 86.7 | 66.7 | 34.9 | |||
| Resident Evil 7 (2017) | 166 | 140 | 47.4 | |||
| For Honor (2017) | 155 | 115 | 47.9 | |||
| Ghost Recon Wildlands (2017) | 86.7 | 51.9 | 34.1 | |||
| Mass Effect Andromeda (2017) | 81.4 | 73.2 | 35.1 | |||
| Warhammer 40.000: Dawn of War III (2017) | 88 | 86 | 41.9 | |||
| Prey (2017) | 135 | 131 | 50.5 | |||
| Rocket League (2017) | 235 | 103 | ||||
| Dirt 4 (2017) | 136 | 88.4 | ||||
| Team Fortress 2 (2017) | 124 | 125 | ||||
| Playerunknown's Battlegrounds (PUBG) (2017) | 125 | 111 | 104 | 79 | 27.1 | |
| Final Fantasy XV Benchmark (2018) | 130 | 86 | 64 | 27.2 | ||
| Far Cry New Dawn (2019) | 66 | 38 | ||||
| Dirt Rally 2.0 (2019) | 75 | 55.9 | 33.7 | |||
| The Division 2 (2019) | 74 | 51.5 | 27.8 | |||
| League of Legends (2019) | 145 | 144 |
Noise level
| Idle |
| 32 / 33 / 34 dB(A) |
| Load |
| 39 / 46 dB(A) |
 | ||
30 dB silent 40 dB(A) audible 50 dB(A) loud |
||
min: | ||
(-) The maximum temperature on the upper side is 57 °C / 135 F, compared to the average of 40.4 °C / 105 F, ranging from 21.2 to 68.8 °C for the class Gaming.
(-) The bottom heats up to a maximum of 54 °C / 129 F, compared to the average of 43.2 °C / 110 F
(+) In idle usage, the average temperature for the upper side is 30.7 °C / 87 F, compared to the device average of 33.9 °C / 93 F.
(-) Playing The Witcher 3, the average temperature for the upper side is 46.8 °C / 116 F, compared to the device average of 33.9 °C / 93 F.
(-) The palmrests and touchpad can get very hot to the touch with a maximum of 42 °C / 107.6 F.
(-) The average temperature of the palmrest area of similar devices was 28.8 °C / 83.8 F (-13.2 °C / -23.8 F).
Asus Zephyrus GX501 audio analysis
(+) | speakers can play relatively loud (83 dB)
Bass 100 - 315 Hz
(-) | nearly no bass - on average 23.2% lower than median
(±) | linearity of bass is average (12.5% delta to prev. frequency)
Mids 400 - 2000 Hz
(+) | balanced mids - only 2.4% away from median
(+) | mids are linear (4.8% delta to prev. frequency)
Highs 2 - 16 kHz
(+) | balanced highs - only 2.2% away from median
(+) | highs are linear (2% delta to prev. frequency)
Overall 100 - 16.000 Hz
(±) | linearity of overall sound is average (16.8% difference to median)
Compared to same class
» 44% of all tested devices in this class were better, 11% similar, 46% worse
» The best had a delta of 6%, average was 18%, worst was 132%
Compared to all devices tested
» 29% of all tested devices were better, 8% similar, 63% worse
» The best had a delta of 4%, average was 24%, worst was 134%
Gigabyte Aero 15 audio analysis
(±) | speaker loudness is average but good (79 dB)
Bass 100 - 315 Hz
(-) | nearly no bass - on average 23.3% lower than median
(±) | linearity of bass is average (10.7% delta to prev. frequency)
Mids 400 - 2000 Hz
(+) | balanced mids - only 1.8% away from median
(+) | mids are linear (4.1% delta to prev. frequency)
Highs 2 - 16 kHz
(+) | balanced highs - only 2.6% away from median
(+) | highs are linear (5.1% delta to prev. frequency)
Overall 100 - 16.000 Hz
(±) | linearity of overall sound is average (18.3% difference to median)
Compared to same class
» 56% of all tested devices in this class were better, 7% similar, 38% worse
» The best had a delta of 5%, average was 17%, worst was 45%
Compared to all devices tested
» 40% of all tested devices were better, 8% similar, 52% worse
» The best had a delta of 4%, average was 24%, worst was 134%
| Off / Standby | |
| Idle | |
| Load |
|
Key:
min: | |
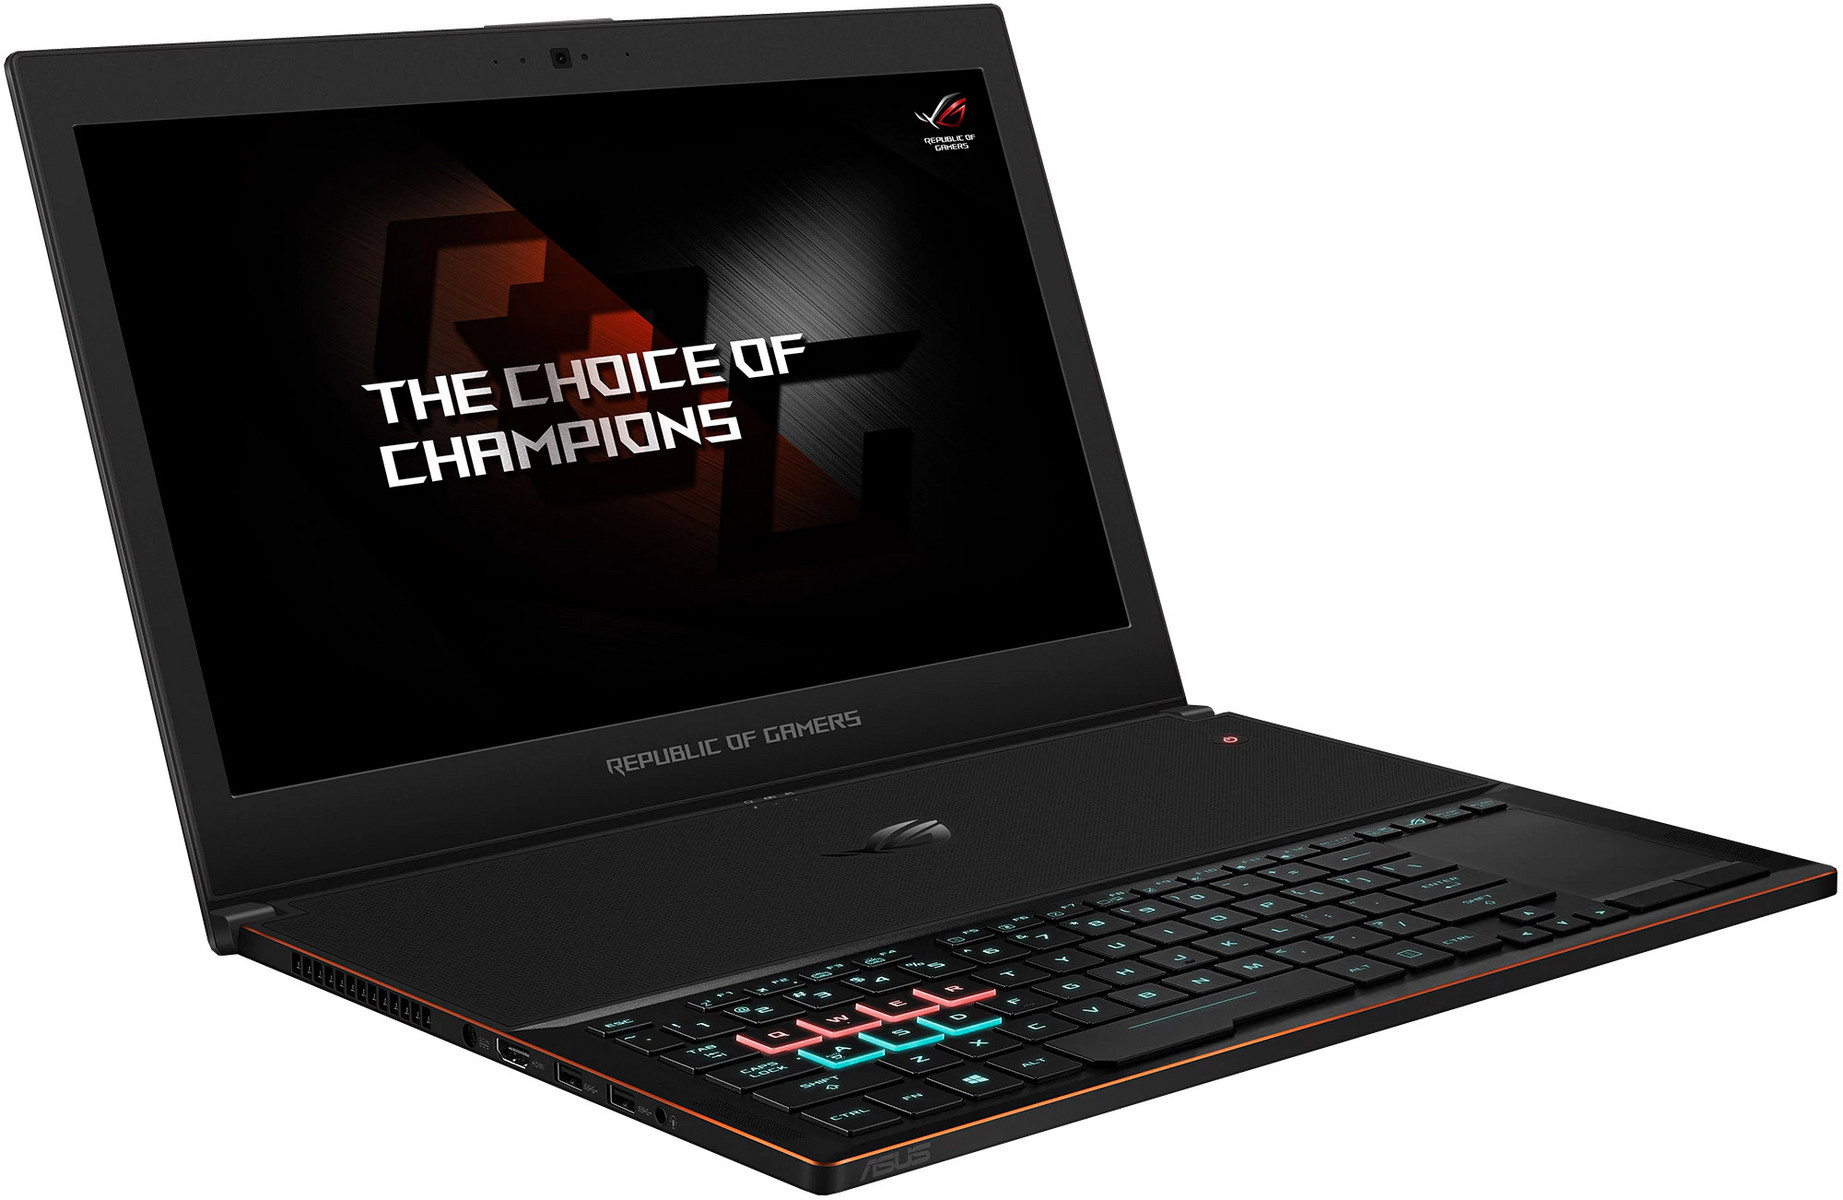
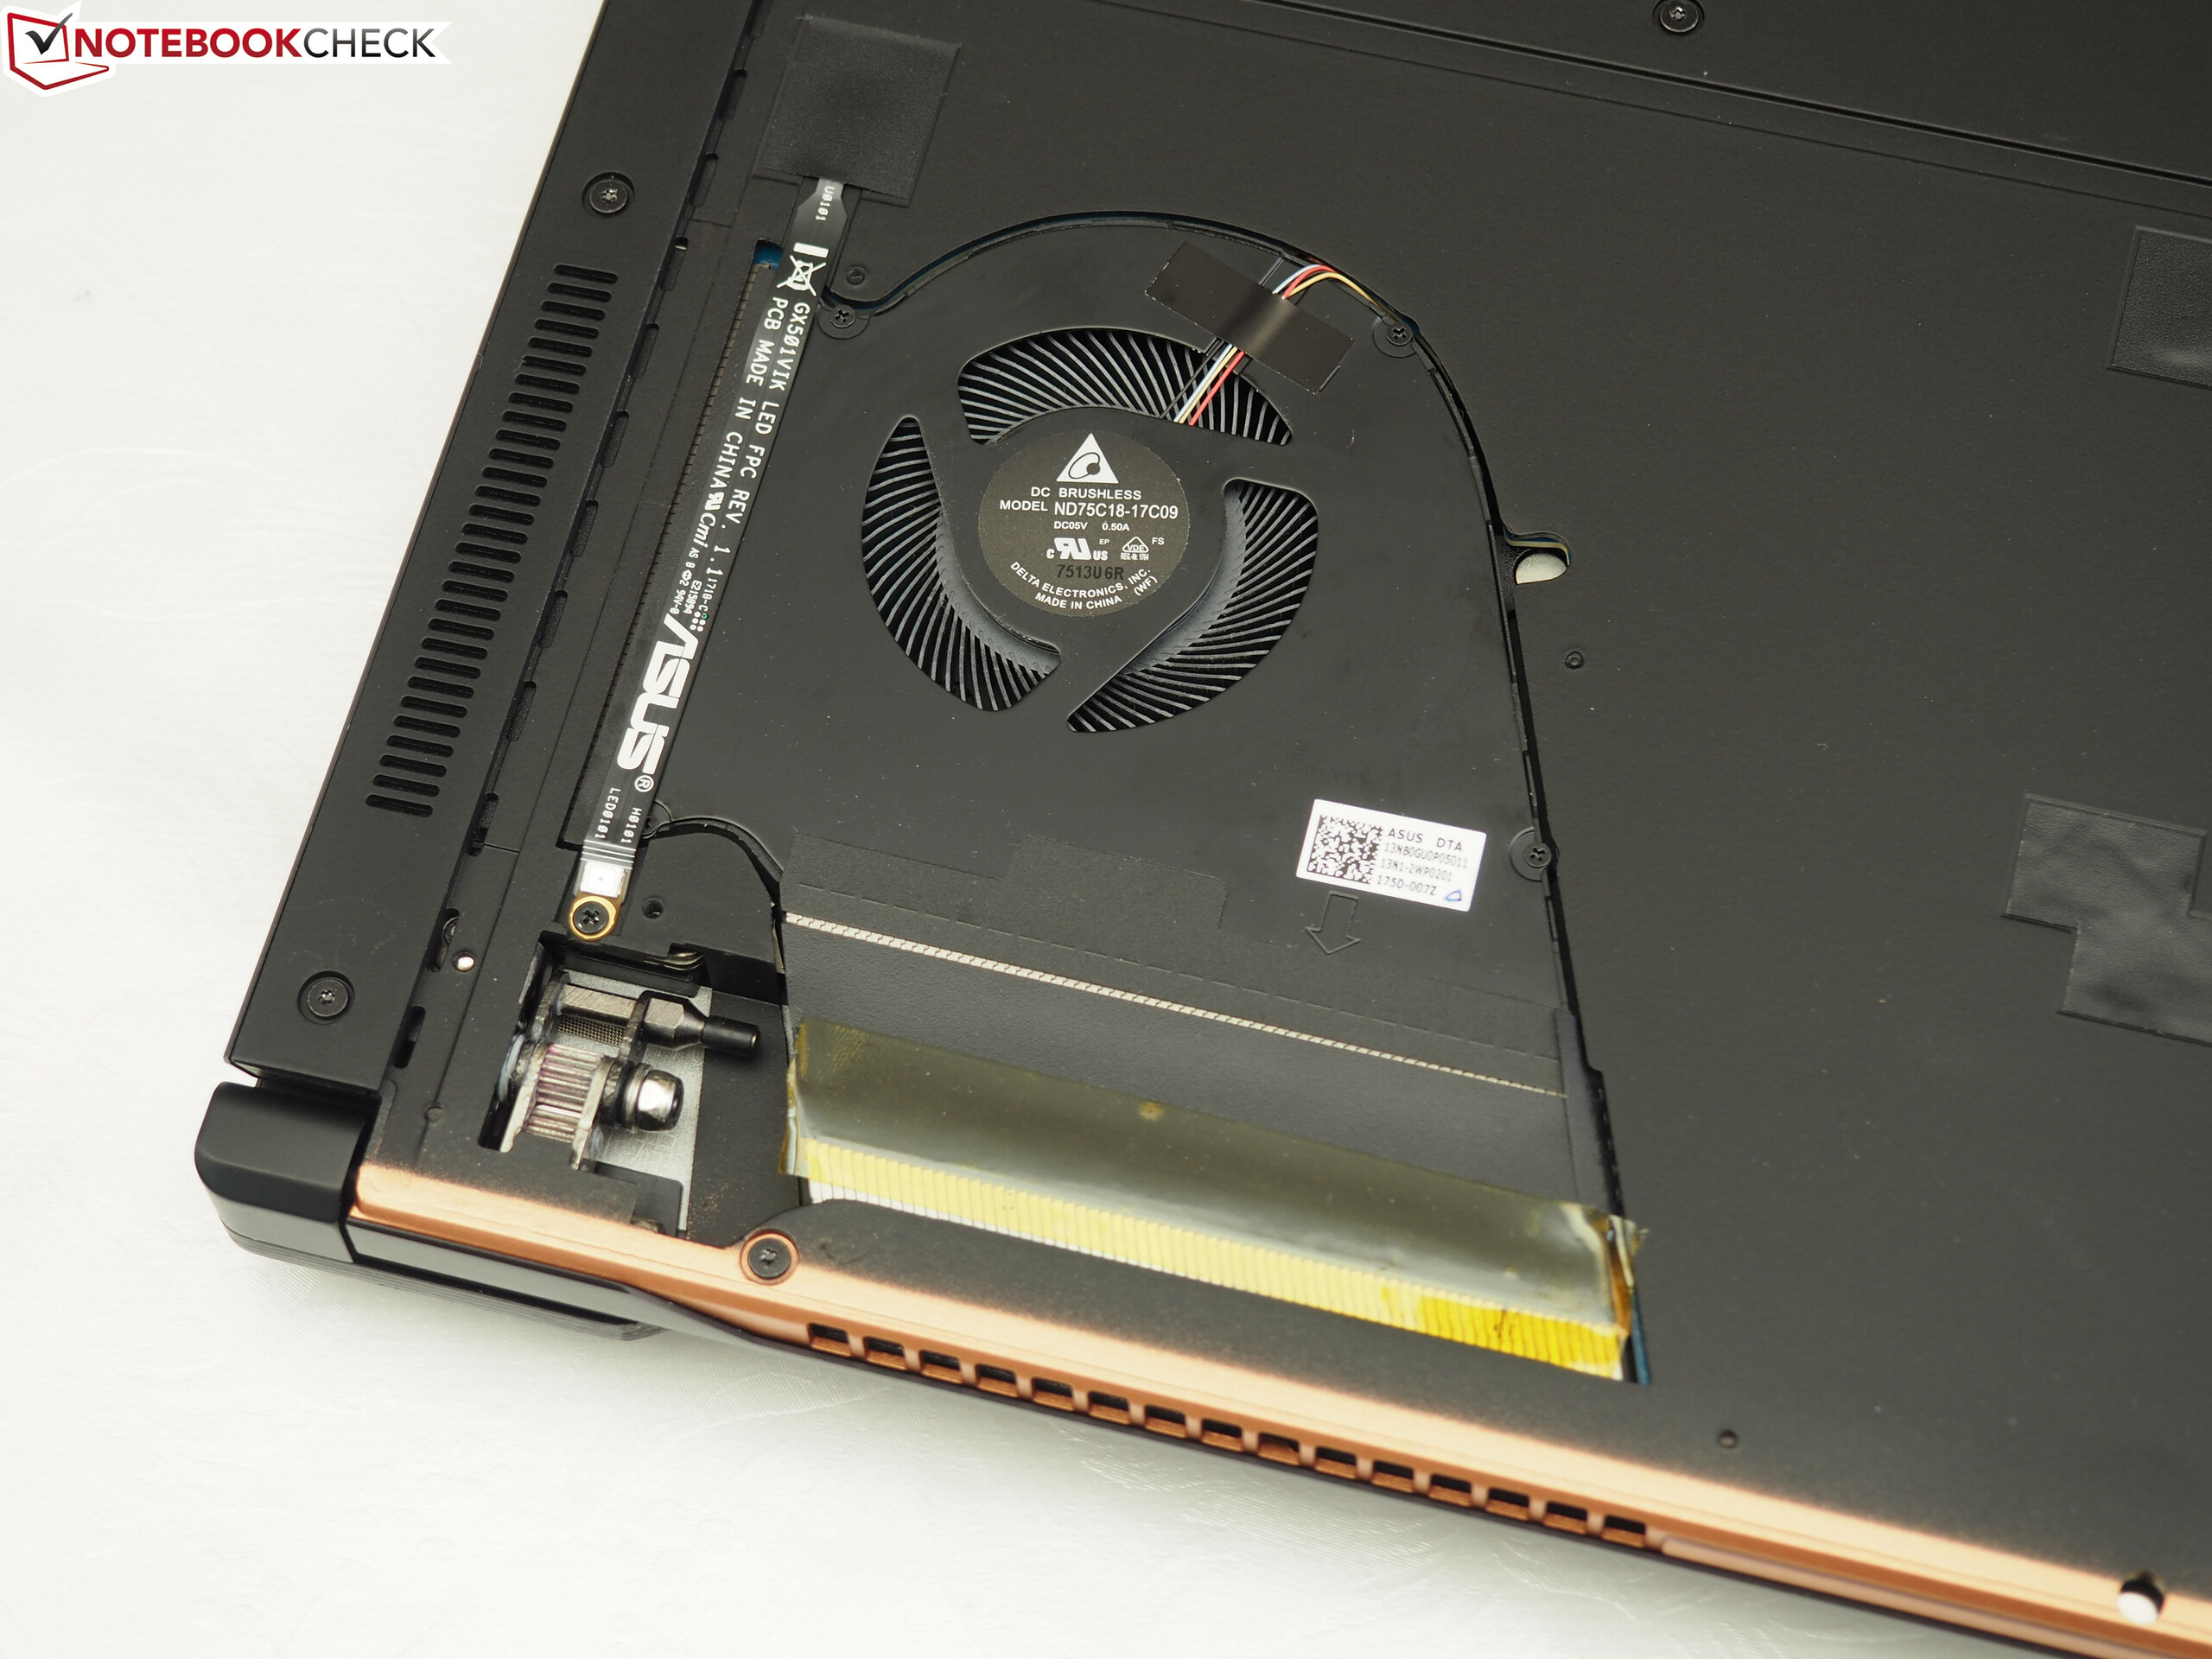
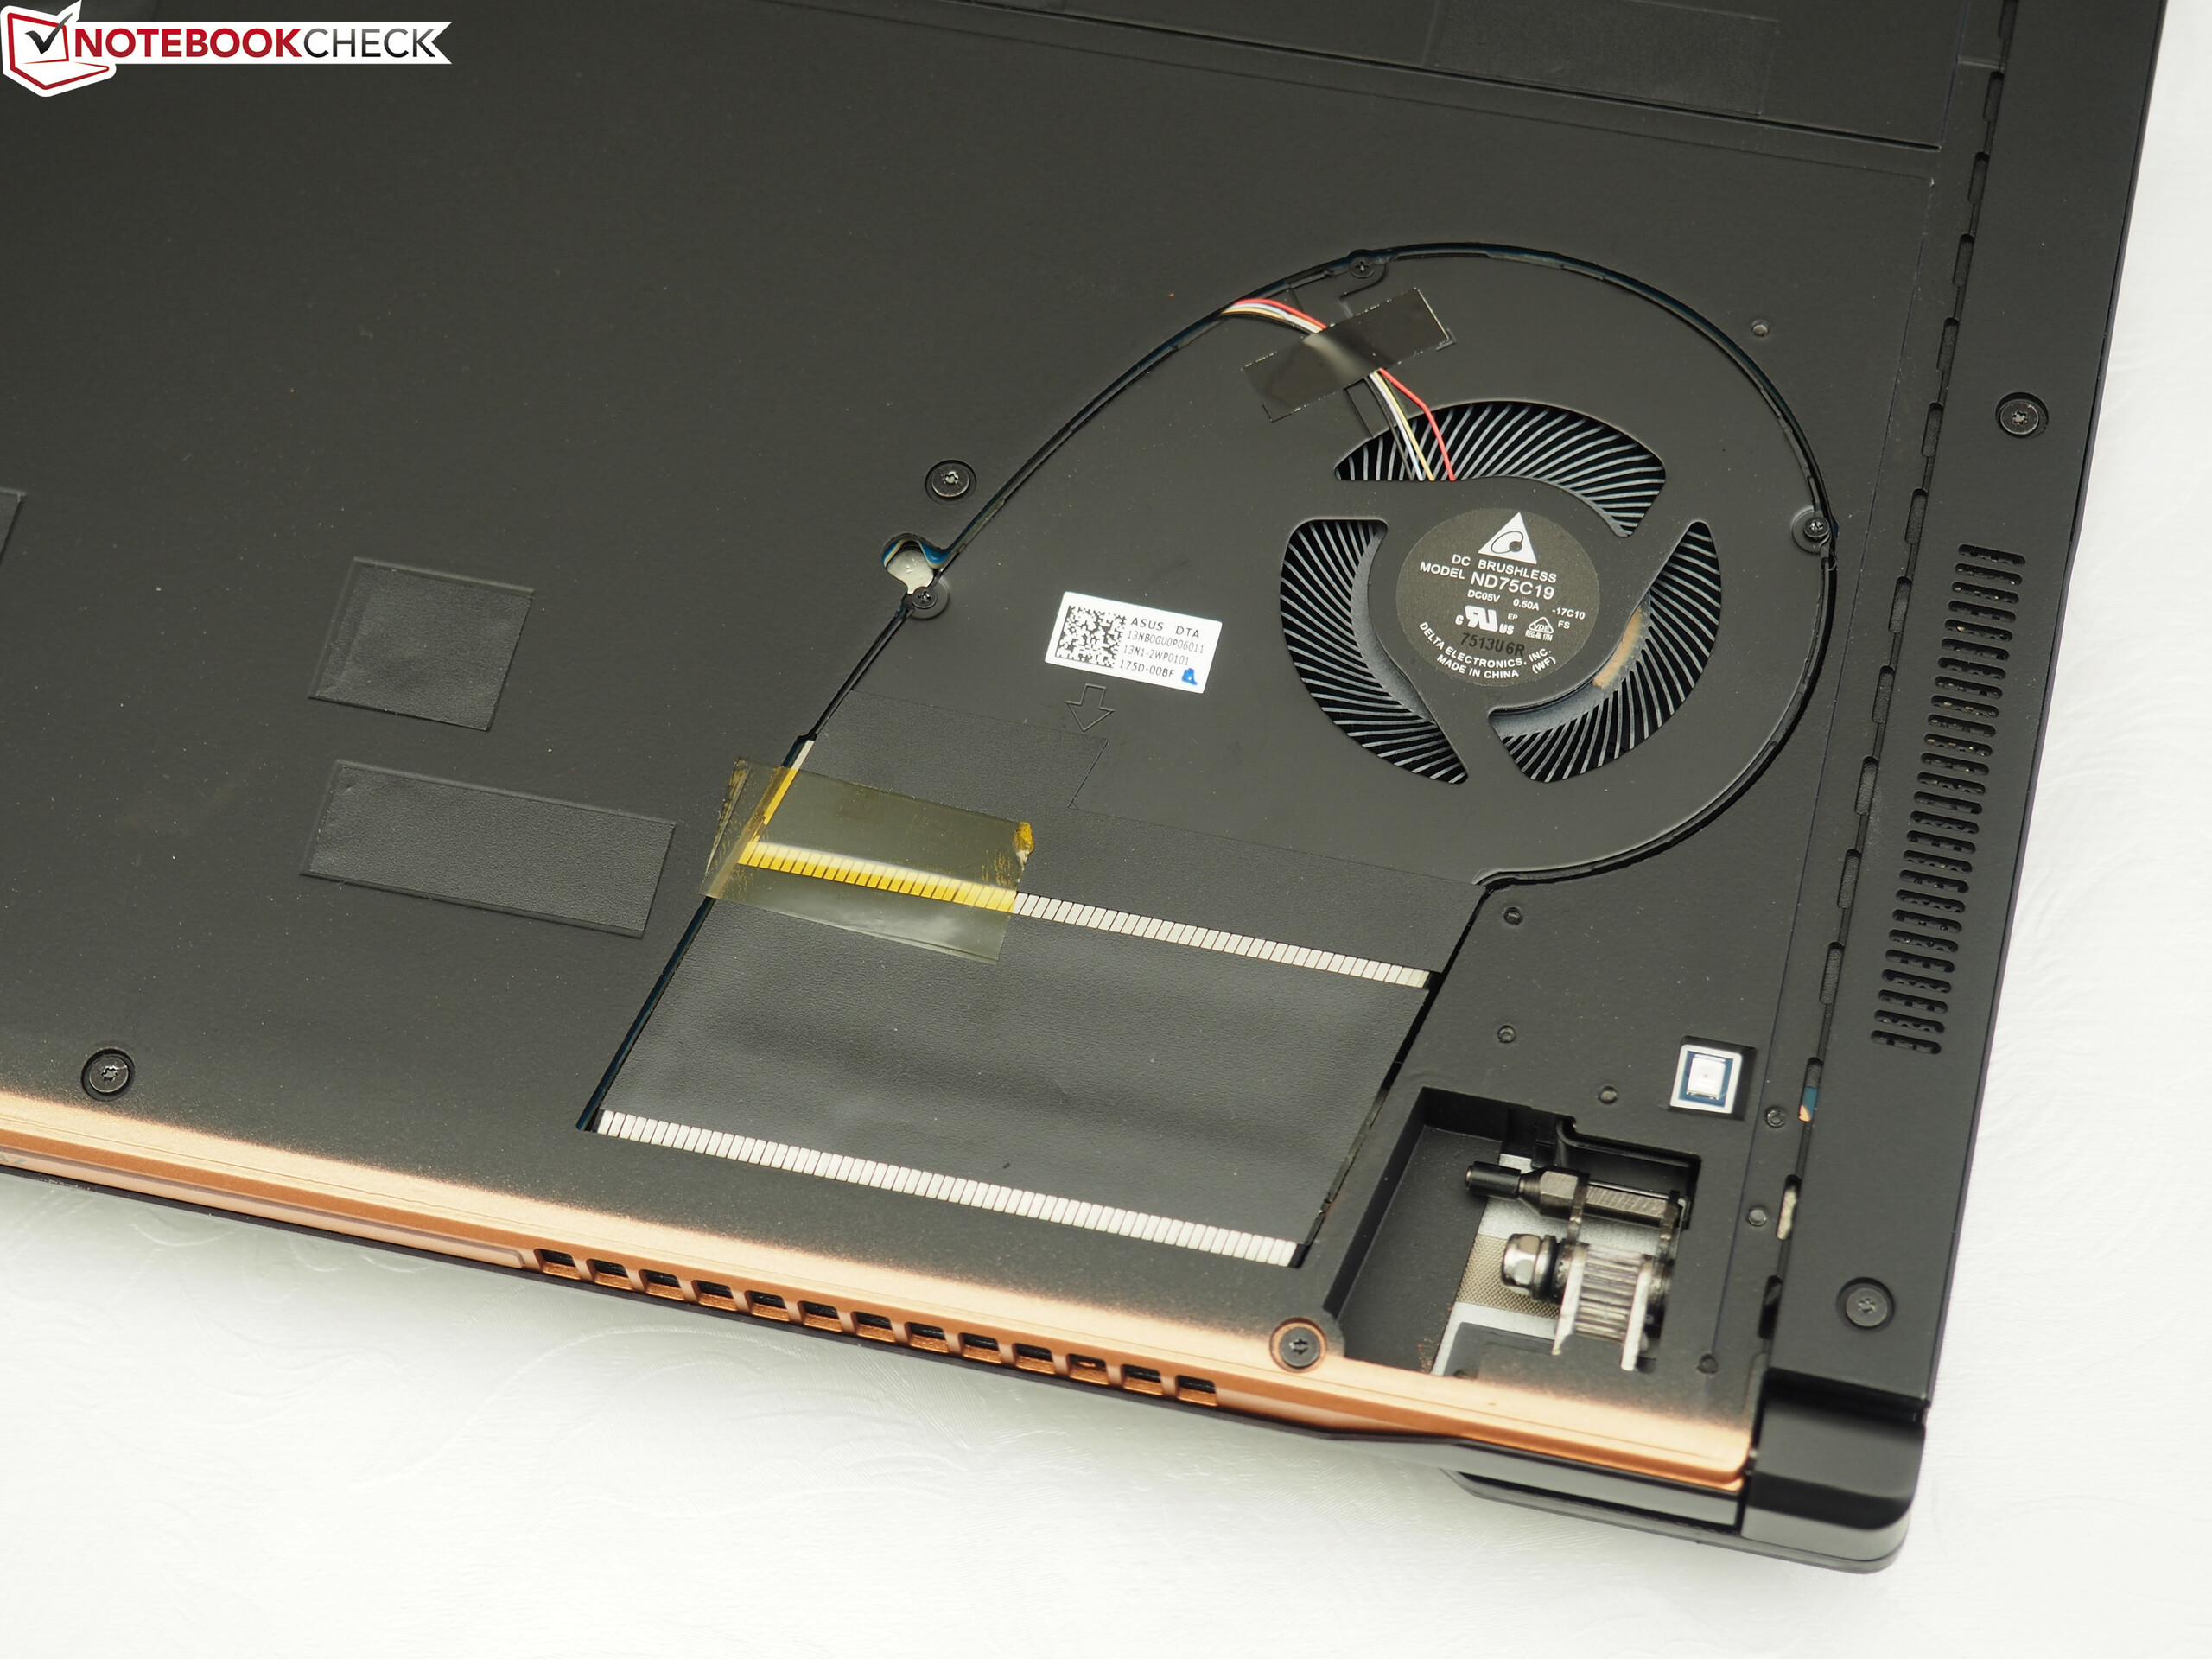
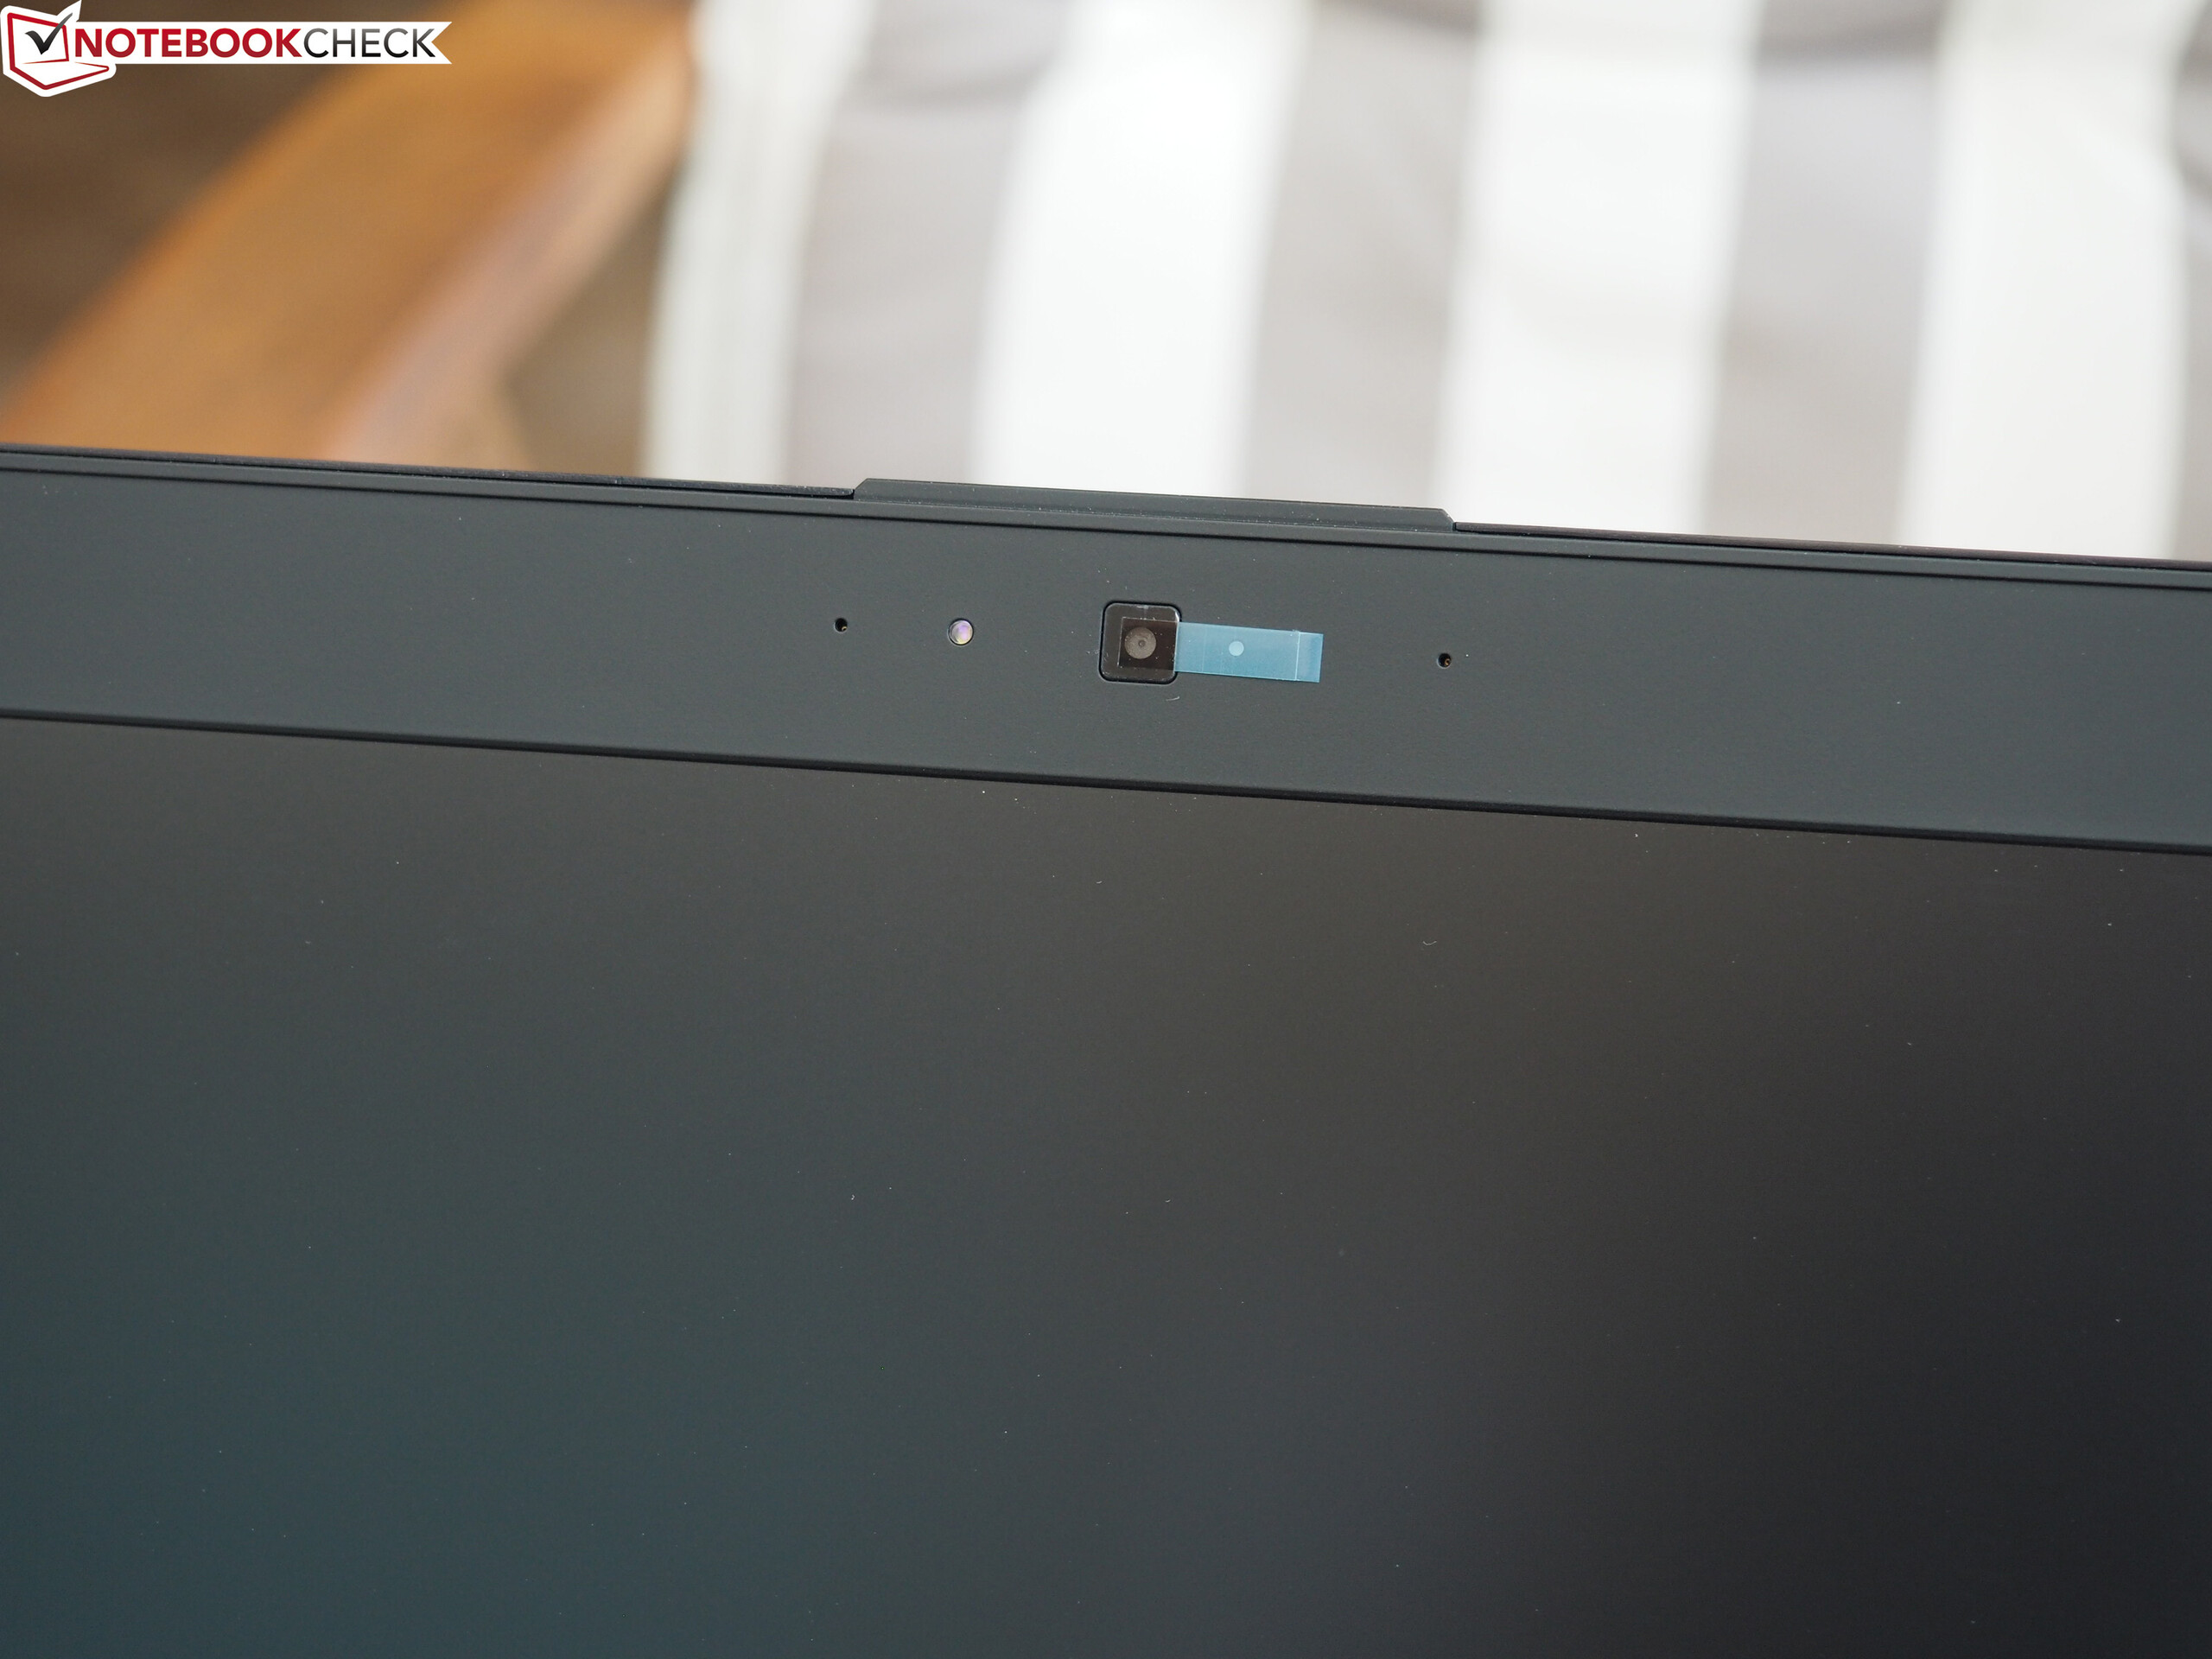
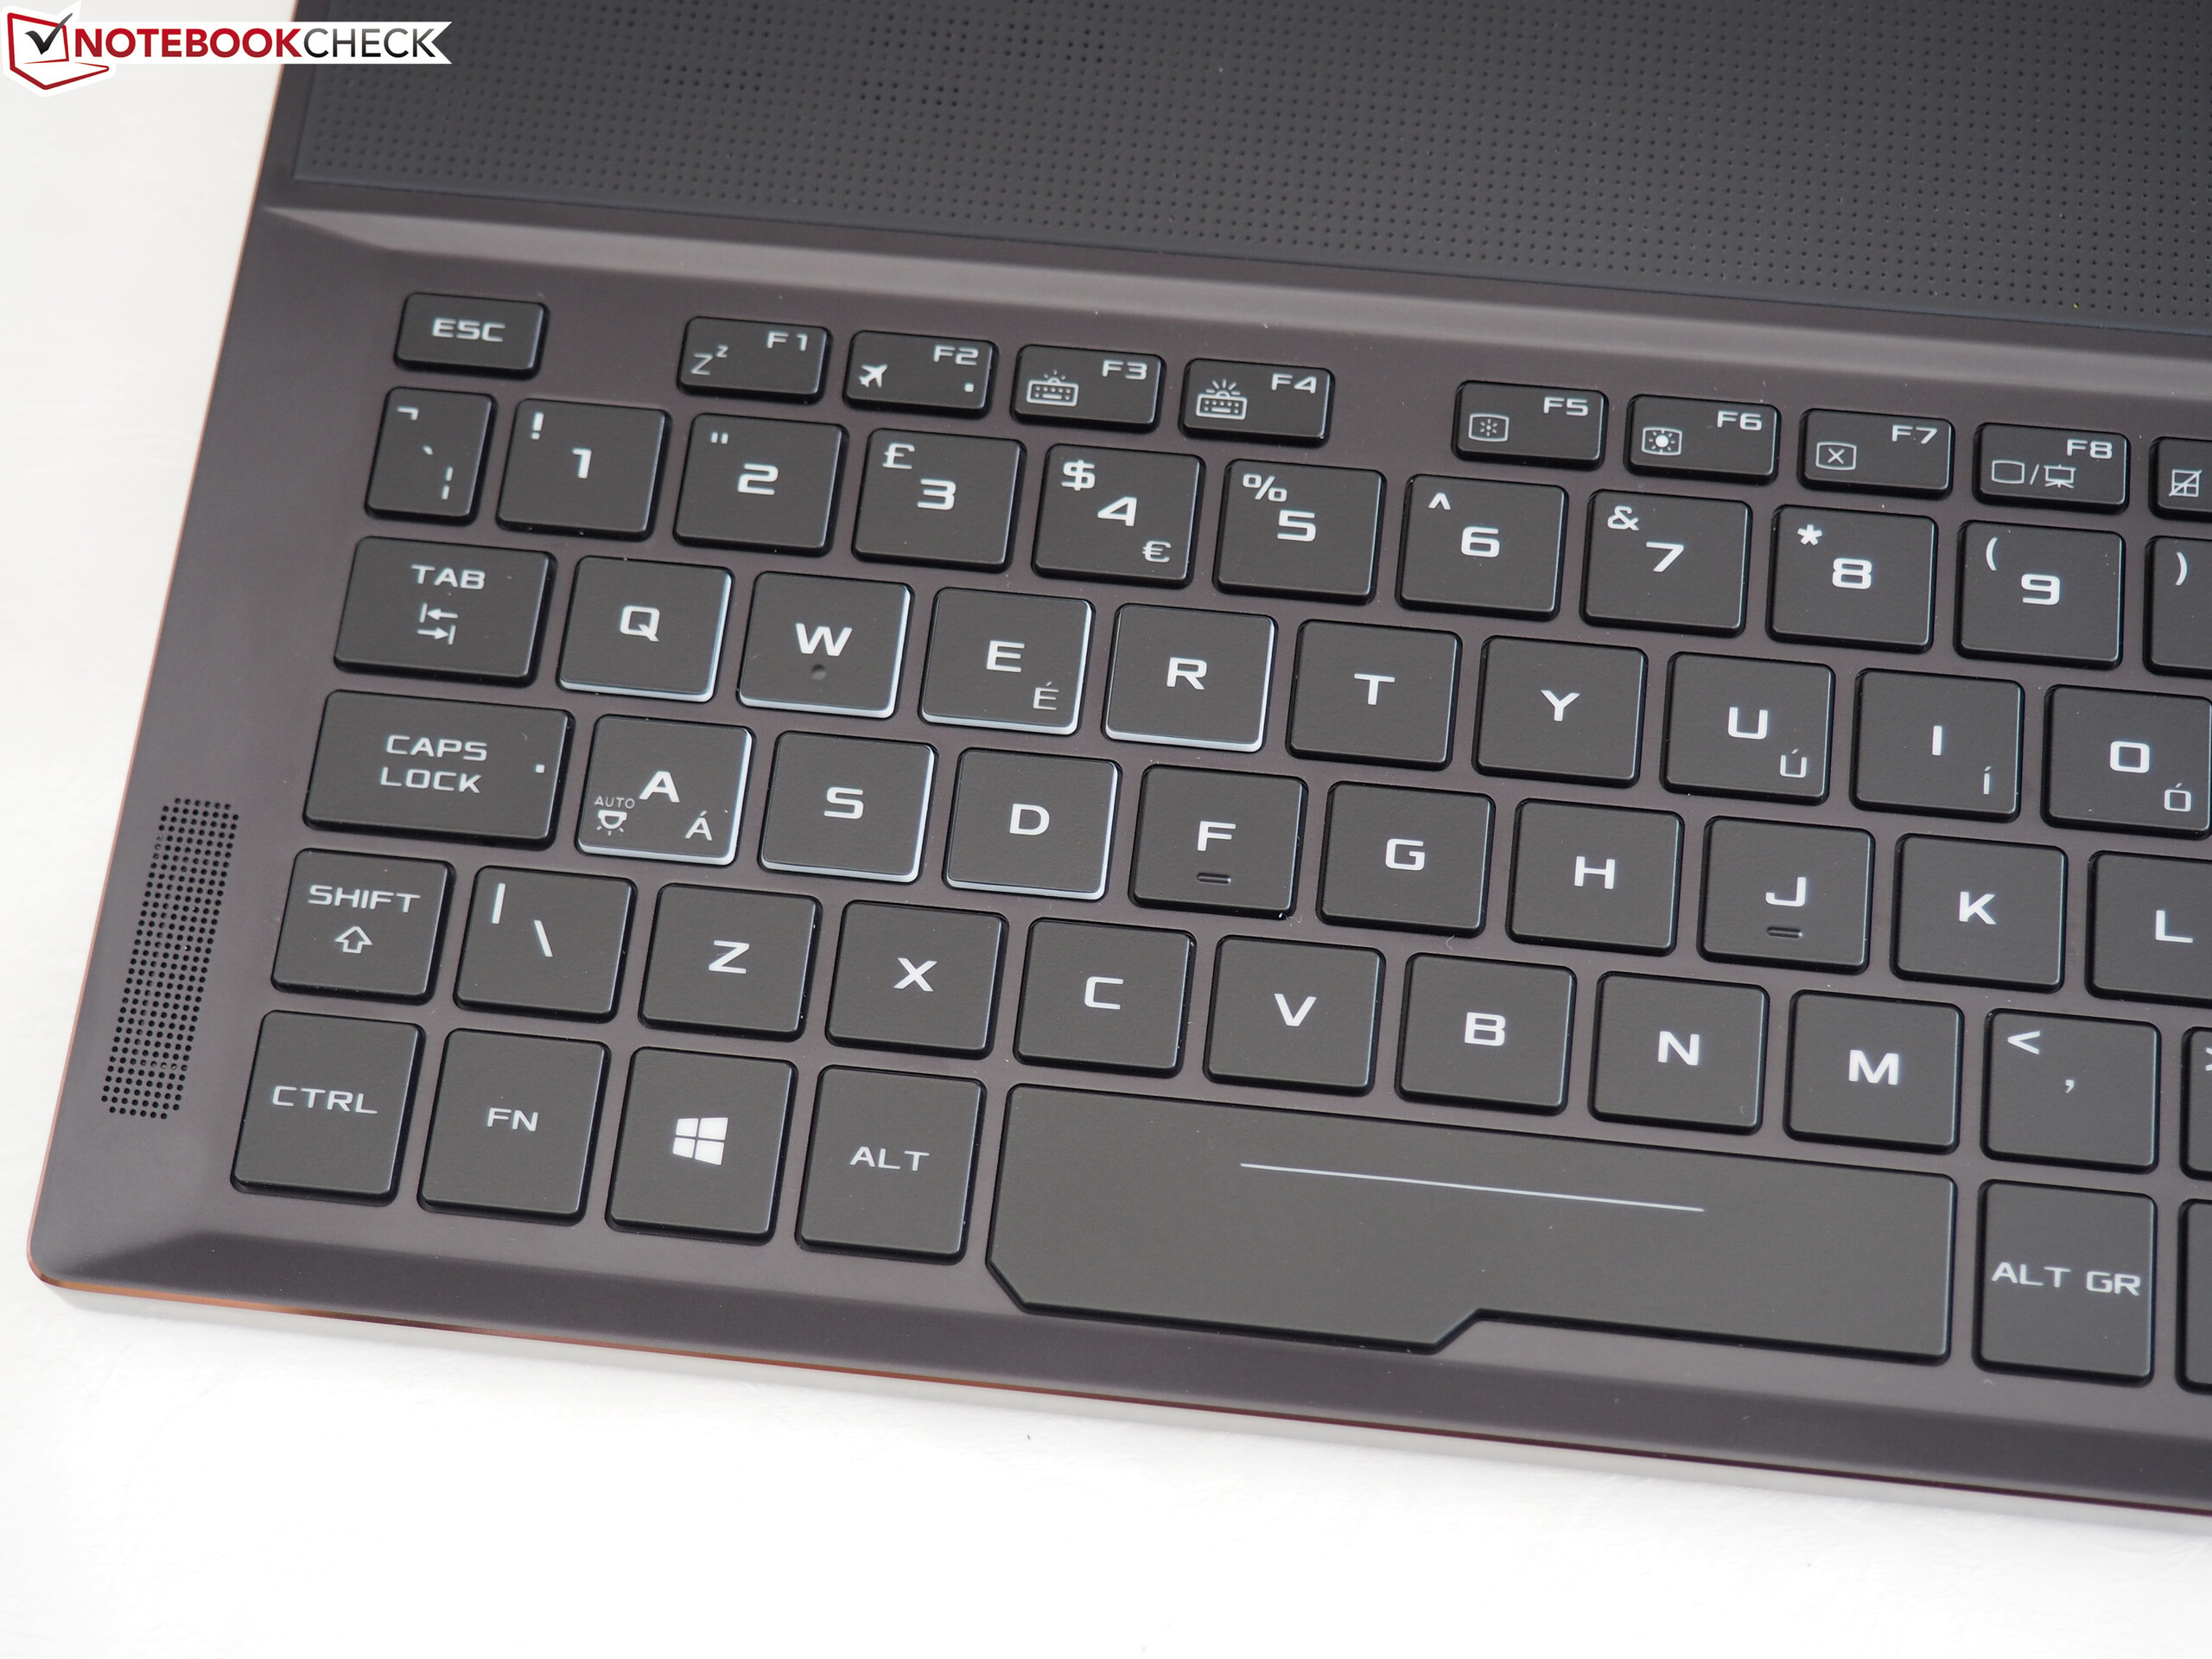
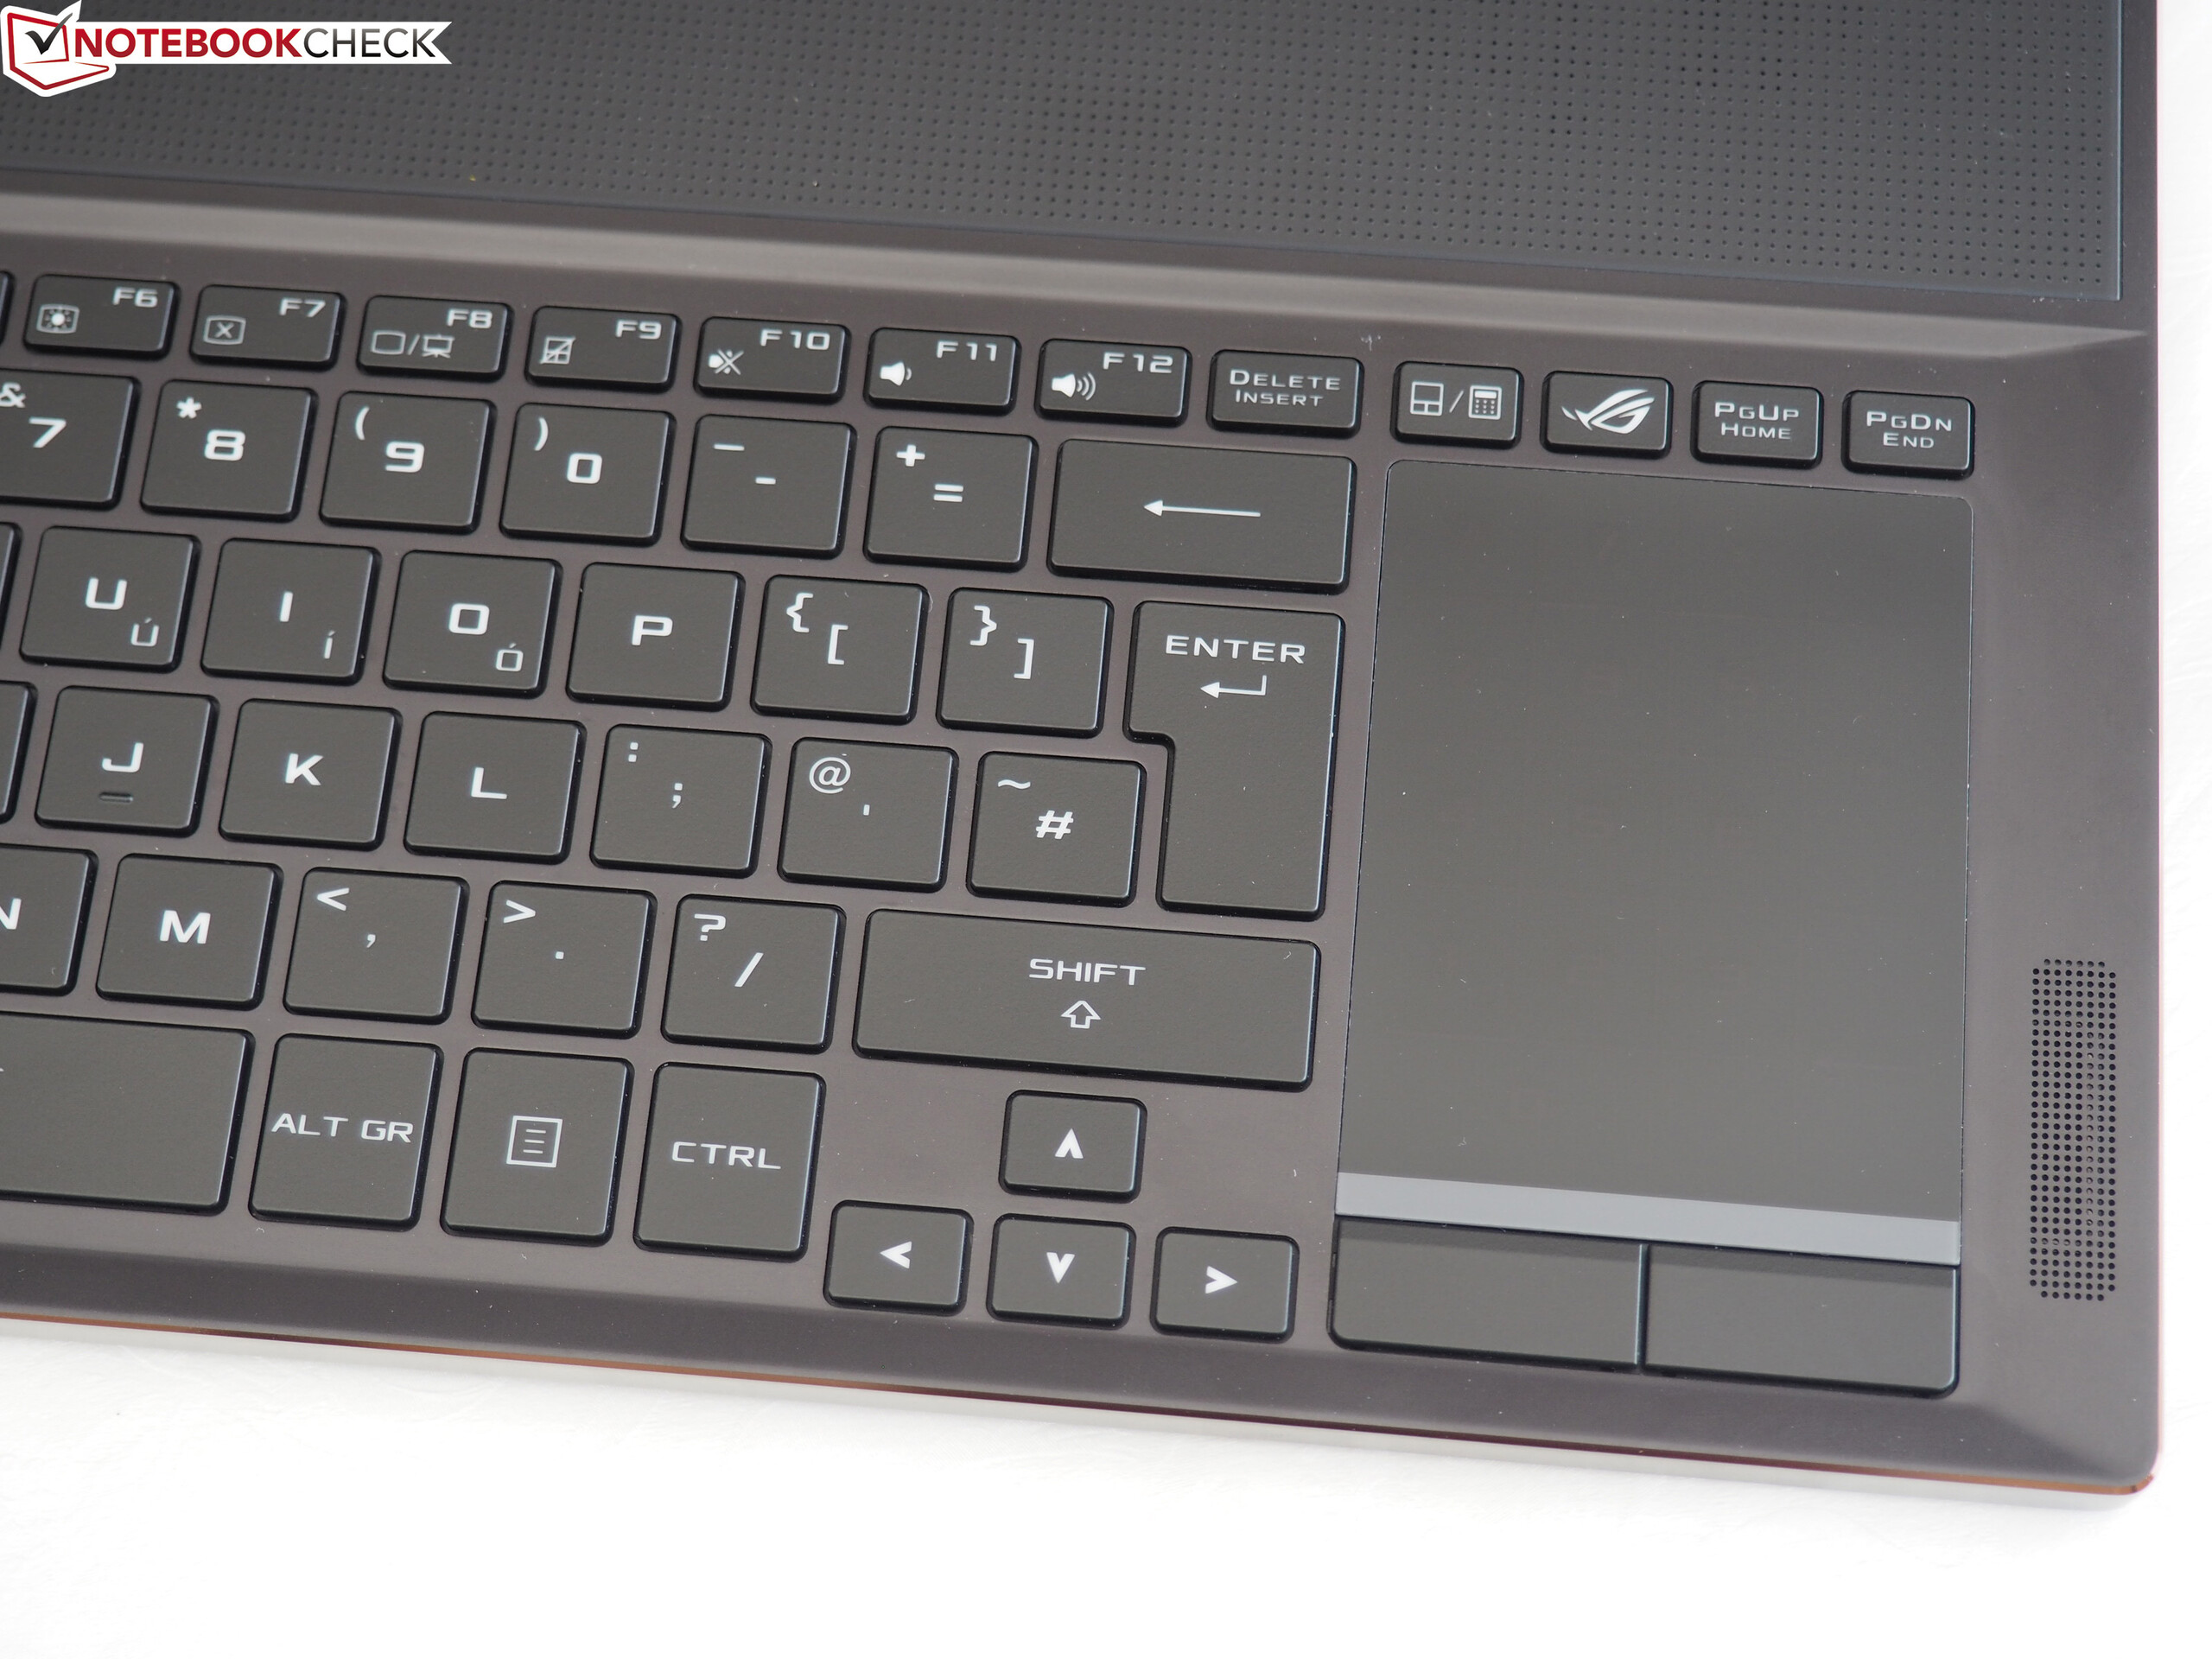
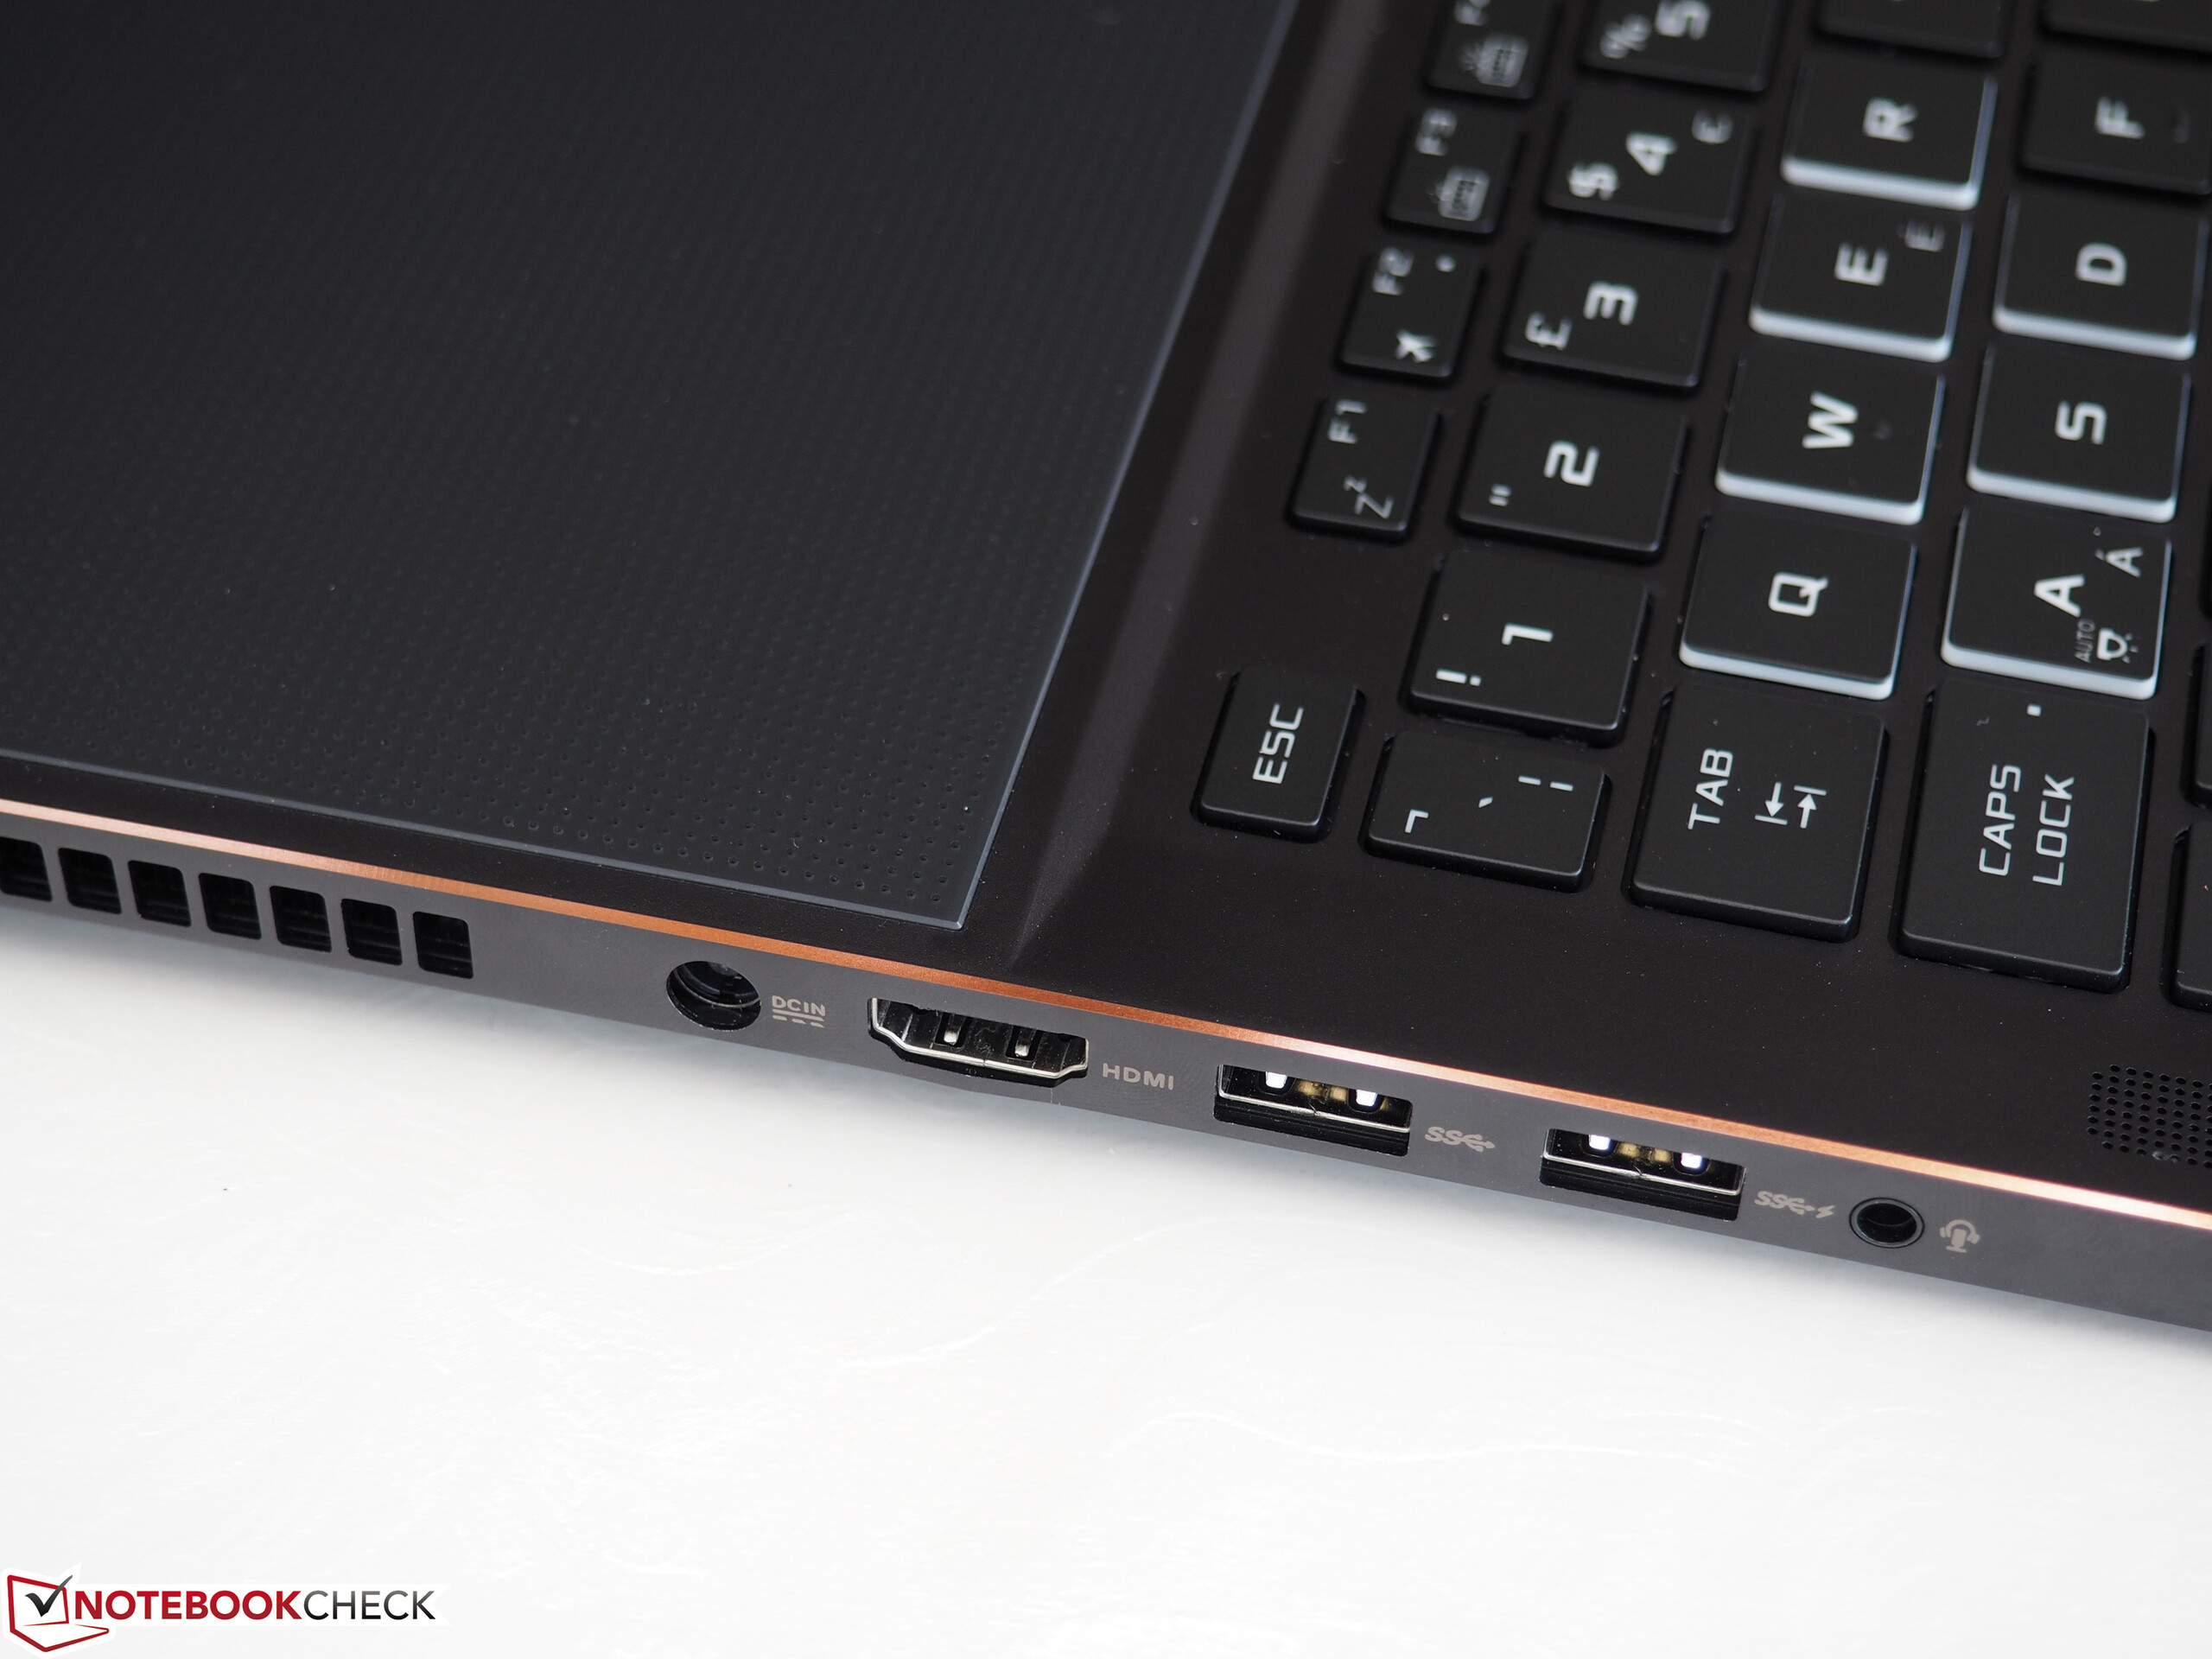
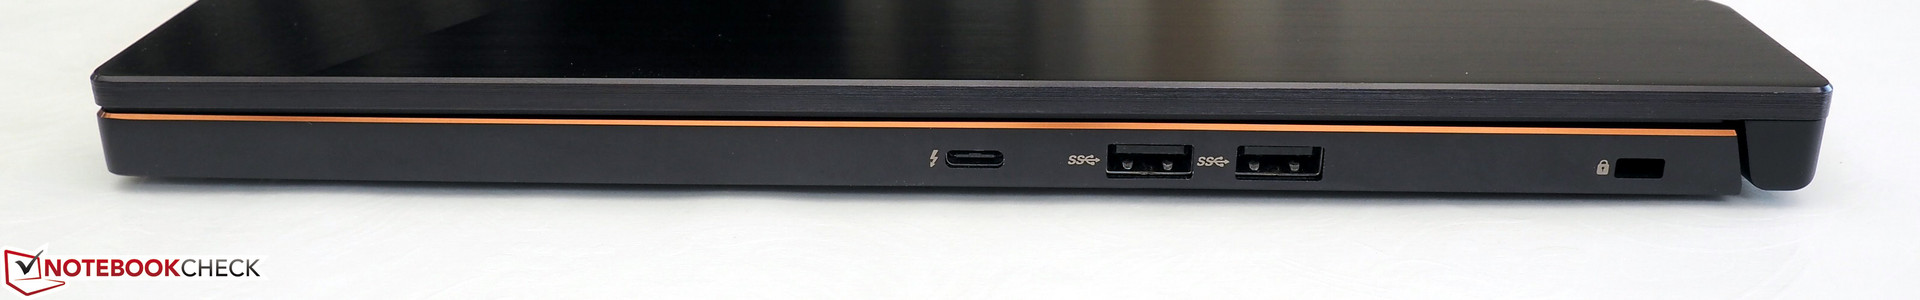
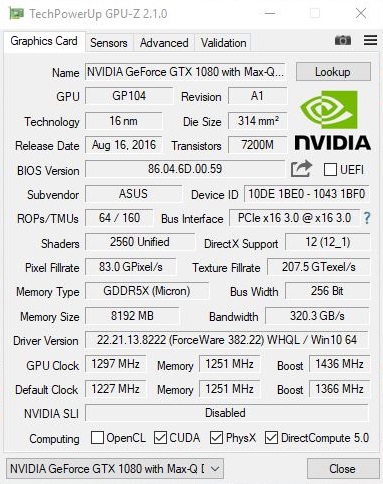
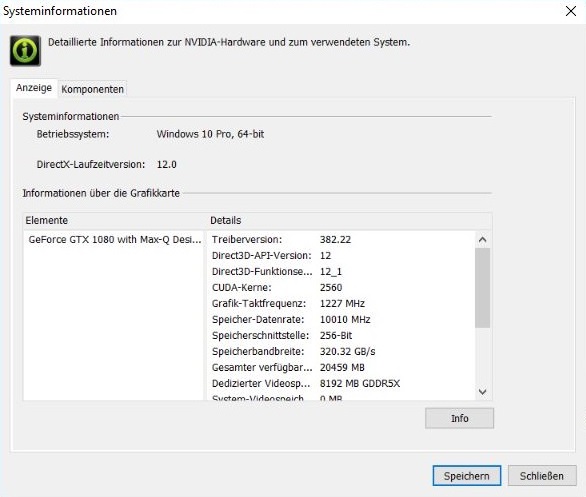
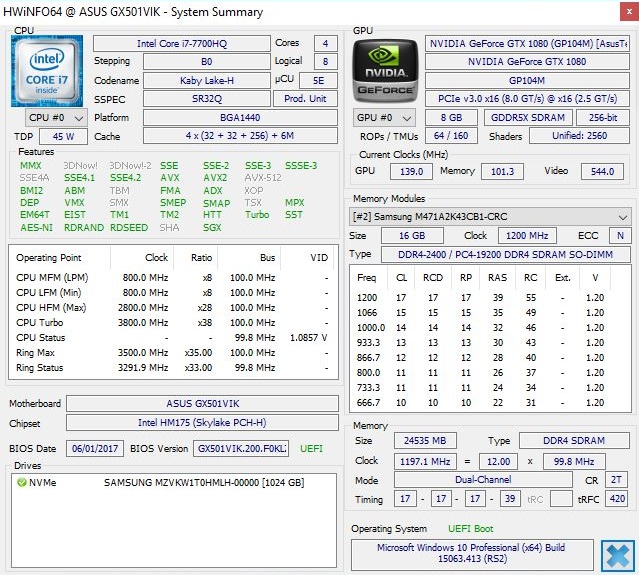
在我们实际使用这台设备一段不长的时间之后,我们已经可以感受到它超薄机身设计带来的一些缺点。它的键盘和GTX 1080 Max-Q显卡都受到了不小的挑战。我们的第一批测试结果显示它的性能更接近高分GTX 1070显卡而非GTX 1080。从我们的角度来看,它的散热系统可以说相对安静,噪音最高值达到了40 dB(A),在接下来的详尽测试后我们将会得到更确切的结果。在屏幕的方面我们也同样需要进一步的测试,尽管它提供了120赫兹刷新率和雾面设计。
目前我们预计它的完整测试将会在下周更新,敬请期待!
(更新:详尽测试已完成!)
注:本文是基于完整评测的缩减版本,阅读完整的英文评测,请点击这里。
Price comparison
