外星人 15 R3 (i7-7820HK, GTX 1080 Max-Q, Full-HD) 笔记本电脑简短评测
| Networking | |
| iperf3 transmit AX12 | |
| Alienware 15 R3 Max-Q | |
| Alienware 15 R3 | |
| Acer Predator Triton 700 | |
| Aorus X5 v7 | |
| Eurocom Q5 | |
| iperf3 receive AX12 | |
| Alienware 15 R3 Max-Q | |
| Acer Predator Triton 700 | |
| Alienware 15 R3 | |
| Eurocom Q5 | |
| Aorus X5 v7 | |
| |||||||||||||||||||||||||
Brightness Distribution: 89 %
Center on Battery: 306 cd/m²
Contrast: 1093:1 (Black: 0.28 cd/m²)
ΔE ColorChecker Calman: 5.45 | ∀{0.5-29.43 Ø4.71}
ΔE Greyscale Calman: 4.9 | ∀{0.09-98 Ø4.96}
83% sRGB (Argyll 1.6.3 3D)
54% AdobeRGB 1998 (Argyll 1.6.3 3D)
60.6% AdobeRGB 1998 (Argyll 3D)
82.9% sRGB (Argyll 3D)
64.3% Display P3 (Argyll 3D)
Gamma: 2.49
CCT: 7062 K
| Alienware 15 R3 Max-Q LG Philips LP156WF6 (LGD049B), 1920x1080, 15.6" | Alienware 15 R3 HPJGK_B156HTN (AUO51ED), 1920x1080, 15.6" | Acer Predator Triton 700 AUO B156HAN04.2 (AUO42ED), 1920x1080, 15.6" | Aorus X5 v7 AU Optronics B156ZAN02.3 (AUO23EB), 3840x2160, 15.6" | Eurocom Q5 ID: LGD04D4, Name: LG Philips LP156UD1-SPB1, 3840x2160, 15.6" | |
|---|---|---|---|---|---|
| Display | 7% | 3% | 7% | 5% | |
| Display P3 Coverage (%) | 64.3 | 66 3% | 62.5 -3% | 65.3 2% | 63 -2% |
| sRGB Coverage (%) | 82.9 | 90.5 9% | 88.7 7% | 91.9 11% | 92.7 12% |
| AdobeRGB 1998 Coverage (%) | 60.6 | 66.2 9% | 63.5 5% | 66.3 9% | 64.4 6% |
| Response Times | 47% | -9% | -2% | 8% | |
| Response Time Grey 50% / Grey 80% * (ms) | 40 ? | 25 ? 37% | 44.8 ? -12% | 44 ? -10% | 32.4 ? 19% |
| Response Time Black / White * (ms) | 28 ? | 12 ? 57% | 29.6 ? -6% | 26.4 ? 6% | 28.8 ? -3% |
| PWM Frequency (Hz) | 21100 ? | ||||
| Screen | -26% | -1% | 4% | -16% | |
| Brightness middle (cd/m²) | 306 | 386 26% | 291 -5% | 307 0% | 287.5 -6% |
| Brightness (cd/m²) | 297 | 382 29% | 277 -7% | 297 0% | 279 -6% |
| Brightness Distribution (%) | 89 | 93 4% | 84 -6% | 92 3% | 87 -2% |
| Black Level * (cd/m²) | 0.28 | 0.39 -39% | 0.22 21% | 0.3 -7% | 0.65 -132% |
| Contrast (:1) | 1093 | 990 -9% | 1323 21% | 1023 -6% | 442 -60% |
| Colorchecker dE 2000 * | 5.45 | 10.2 -87% | 5.52 -1% | 4.72 13% | 4.5 17% |
| Colorchecker dE 2000 max. * | 9.45 | 15.81 -67% | 10.72 -13% | 8.07 15% | 8.9 6% |
| Greyscale dE 2000 * | 4.9 | 11.28 -130% | 6.59 -34% | 4.79 2% | 4.6 6% |
| Gamma | 2.49 88% | 2.23 99% | 2.44 90% | 2.42 91% | 2.39 92% |
| CCT | 7062 92% | 11383 57% | 7816 83% | 7690 85% | 7393 88% |
| Color Space (Percent of AdobeRGB 1998) (%) | 54 | 59 9% | 58 7% | 60 11% | 59 9% |
| Color Space (Percent of sRGB) (%) | 83 | 90 8% | 89 7% | 92 11% | 92.3 11% |
| Total Average (Program / Settings) | 9% /
-9% | -2% /
-1% | 3% /
4% | -1% /
-8% |
* ... smaller is better
Screen Flickering / PWM (Pulse-Width Modulation)
| Screen flickering / PWM detected | 21100 Hz | ≤ 95 % brightness setting | 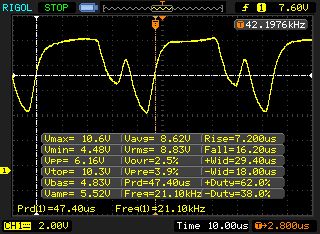 |
The display backlight flickers at 21100 Hz (worst case, e.g., utilizing PWM) Flickering detected at a brightness setting of 95 % and below. There should be no flickering or PWM above this brightness setting. The frequency of 21100 Hz is quite high, so most users sensitive to PWM should not notice any flickering. In comparison: 52 % of all tested devices do not use PWM to dim the display. If PWM was detected, an average of 7754 (minimum: 5 - maximum: 343500) Hz was measured. | |||
Display Response Times
| ↔ Response Time Black to White | ||
|---|---|---|
| 28 ms ... rise ↗ and fall ↘ combined | ↗ 16 ms rise | 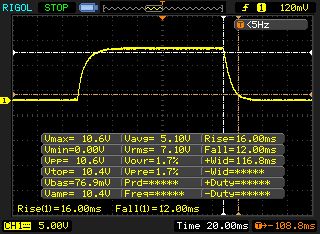 |
| ↘ 12 ms fall | ||
| The screen shows relatively slow response rates in our tests and may be too slow for gamers. In comparison, all tested devices range from 0.1 (minimum) to 240 (maximum) ms. » 71 % of all devices are better. This means that the measured response time is worse than the average of all tested devices (19.8 ms). | ||
| ↔ Response Time 50% Grey to 80% Grey | ||
| 40 ms ... rise ↗ and fall ↘ combined | ↗ 19.6 ms rise | 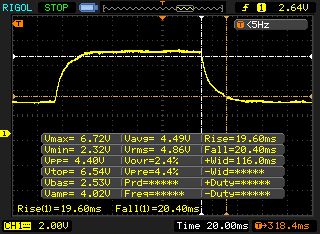 |
| ↘ 20.4 ms fall | ||
| The screen shows slow response rates in our tests and will be unsatisfactory for gamers. In comparison, all tested devices range from 0.165 (minimum) to 636 (maximum) ms. » 61 % of all devices are better. This means that the measured response time is worse than the average of all tested devices (31 ms). | ||
| Cinebench R15 | |
| CPU Single 64Bit | |
| Aorus X5 v7 | |
| Alienware 15 R3 Max-Q | |
| Alienware 15 R3 | |
| Acer Predator Triton 700 | |
| Eurocom Q5 | |
| CPU Multi 64Bit | |
| Aorus X5 v7 | |
| Alienware 15 R3 Max-Q | |
| Eurocom Q5 | |
| Alienware 15 R3 | |
| Acer Predator Triton 700 | |
| Cinebench R10 | |
| Rendering Single 32Bit | |
| Alienware 15 R3 Max-Q | |
| Eurocom Q5 | |
| Rendering Multiple CPUs 32Bit | |
| Alienware 15 R3 Max-Q | |
| Eurocom Q5 | |
| Geekbench 3 | |
| 32 Bit Multi-Core Score | |
| Alienware 15 R3 Max-Q | |
| 32 Bit Single-Core Score | |
| Alienware 15 R3 Max-Q | |
| Geekbench 4.0 | |
| 64 Bit Multi-Core Score | |
| Alienware 15 R3 Max-Q | |
| 64 Bit Single-Core Score | |
| Alienware 15 R3 Max-Q | |
| Geekbench 4.4 | |
| 64 Bit Multi-Core Score | |
| Alienware 15 R3 Max-Q | |
| 64 Bit Single-Core Score | |
| Alienware 15 R3 Max-Q | |
| JetStream 1.1 - 1.1 Total | |
| Alienware 15 R3 Max-Q | |
| Eurocom Q5 | |
| PCMark 7 Score | 6972 points | |
| PCMark 8 Home Score Accelerated v2 | 5121 points | |
| PCMark 8 Creative Score Accelerated v2 | 7892 points | |
| PCMark 8 Work Score Accelerated v2 | 5305 points | |
| PCMark 10 Score | 5295 points | |
Help | ||
| PCMark 8 | |
| Home Score Accelerated v2 | |
| Acer Predator Triton 700 | |
| Alienware 15 R3 Max-Q | |
| Alienware 15 R3 | |
| Aorus X5 v7 | |
| Eurocom Q5 | |
| Work Score Accelerated v2 | |
| Alienware 15 R3 Max-Q | |
| Alienware 15 R3 | |
| Acer Predator Triton 700 | |
| Eurocom Q5 | |

| Alienware 15 R3 Max-Q LiteOn CX2-8B256 | Aorus X5 v7 Toshiba NVMe THNSN5256GPU7 | Alienware 15 R3 | |
|---|---|---|---|
| CrystalDiskMark 3.0 | 19% | -20% | |
| Read Seq (MB/s) | 1840 | 1479 -20% | 1123 -39% |
| Write Seq (MB/s) | 802 | 1076 34% | 429.2 -46% |
| Read 512 (MB/s) | 944 | 1086 15% | 833 -12% |
| Write 512 (MB/s) | 671 | 1101 64% | 428.1 -36% |
| Read 4k (MB/s) | 43.03 | 44 2% | 37.8 -12% |
| Write 4k (MB/s) | 141 | 137.8 -2% | 122.9 -13% |
| Read 4k QD32 (MB/s) | 595 | 697 17% | 542 -9% |
| Write 4k QD32 (MB/s) | 403.6 | 556 38% | 429.8 6% |
| 3DMark 06 Standard Score | 31555 points | |
| 3DMark 11 Performance | 17829 points | |
| 3DMark Ice Storm Standard Score | 134673 points | |
| 3DMark Cloud Gate Standard Score | 28375 points | |
| 3DMark Fire Strike Score | 14631 points | |
| 3DMark Fire Strike Extreme Score | 7998 points | |
| 3DMark Time Spy Score | 5793 points | |
Help | ||
| 3DMark 11 - 1280x720 Performance GPU | |
| Guru Mars K | |
| MSI GT75VR 7RF-012 Titan Pro | |
| Alienware 15 R3 Max-Q | |
| Acer Predator Triton 700 | |
| Alienware 15 R3 | |
| Aorus X5 v7 | |
| Eurocom Q5 | |
| 3DMark - 1920x1080 Fire Strike Graphics | |
| Guru Mars K | |
| MSI GT75VR 7RF-012 Titan Pro | |
| Alienware 15 R3 Max-Q | |
| Acer Predator Triton 700 | |
| Alienware 15 R3 | |
| Aorus X5 v7 | |
| Eurocom Q5 | |
| The Witcher 3 - 1920x1080 Ultra Graphics & Postprocessing (HBAO+) | |
| MSI GT75VR 7RF-012 Titan Pro | |
| Guru Mars K | |
| Razer Blade Pro 2017 | |
| Alienware 15 R3 Max-Q | |
| Acer Predator Triton 700 | |
| Aorus X5 v7 | |
| Eurocom Q5 | |
| Prey - 1920x1080 Very High Preset AA:2TX SM AF:16x | |
| Alienware 15 R3 Max-Q | |
| Guru Mars K | |
| Eurocom Q5 | |
| MSI GT75VR 7RF-012 Titan Pro | |
| Acer Predator Triton 700 | |
| Razer Blade Pro 2017 | |
| BioShock Infinite - 1920x1080 Ultra Preset, DX11 (DDOF) | |
| Alienware 15 R3 Max-Q | |
| Eurocom Q5 | |
| Ghost Recon Wildlands - 1920x1080 Ultra Preset AA:T AF:16x | |
| Guru Mars K | |
| MSI GT75VR 7RF-012 Titan Pro | |
| Razer Blade Pro 2017 | |
| Alienware 15 R3 Max-Q | |
| Acer Predator Triton 700 | |
| low | med. | high | ultra | |
|---|---|---|---|---|
| Tomb Raider (2013) | 486.5 | 461.9 | 419.2 | 230.4 |
| BioShock Infinite (2013) | 272.3 | 243.6 | 232 | 151.7 |
| The Witcher 3 (2015) | 278.6 | 201.6 | 122.4 | 64.2 |
| For Honor (2017) | 229.6 | 161.2 | 152.9 | 121.3 |
| Ghost Recon Wildlands (2017) | 131.7 | 101.4 | 94.9 | 54.6 |
| Prey (2017) | 141.7 | 142 | 139.8 | 140.8 |
| Middle-earth: Shadow of War (2017) | 146 | 132 | 111 | 88 |
| The Evil Within 2 (2017) | 90.1 | 66.6 | 64 | 62.6 |
Noise level
| Idle |
| 32 / 33 / 35 dB(A) |
| HDD |
| 33 dB(A) |
| Load |
| 46 / 50 dB(A) |
 | ||
30 dB silent 40 dB(A) audible 50 dB(A) loud |
||
min: | ||
| Alienware 15 R3 Max-Q i7-7820HK, GeForce GTX 1080 Max-Q | Acer Predator Triton 700 i7-7700HQ, GeForce GTX 1080 Max-Q | Aorus X5 v7 i7-7820HK, GeForce GTX 1070 Mobile | Eurocom Q5 i7-7700HQ, GeForce GTX 1070 Max-Q | Alienware 15 R3 i7-7700HQ, GeForce GTX 1070 Mobile | Guru Mars K i7-7700, GeForce GTX 1080 Mobile | MSI GT75VR 7RF-012 Titan Pro i7-7820HK, GeForce GTX 1080 Mobile | |
|---|---|---|---|---|---|---|---|
| Noise | -0% | -6% | 2% | -4% | -7% | -8% | |
| off / environment * (dB) | 29 | 31 -7% | 30 -3% | 29 -0% | 30 -3% | 29 -0% | 30 -3% |
| Idle Minimum * (dB) | 32 | 33 -3% | 35 -9% | 31.5 2% | 31 3% | 36 -13% | 33 -3% |
| Idle Average * (dB) | 33 | 34 -3% | 36 -9% | 33.8 -2% | 32 3% | 37 -12% | 34 -3% |
| Idle Maximum * (dB) | 35 | 40 -14% | 40 -14% | 33.8 3% | 42 -20% | 40 -14% | 38 -9% |
| Load Average * (dB) | 46 | 41 11% | 43 7% | 41.7 9% | 49 -7% | 45 2% | 44 4% |
| Witcher 3 ultra * (dB) | 48 | 43 10% | 49 -2% | 41.7 13% | 50 -4% | 56 -17% | |
| Load Maximum * (dB) | 50 | 48 4% | 55 -10% | 54.2 -8% | 50 -0% | 55 -10% | 62 -24% |
* ... smaller is better
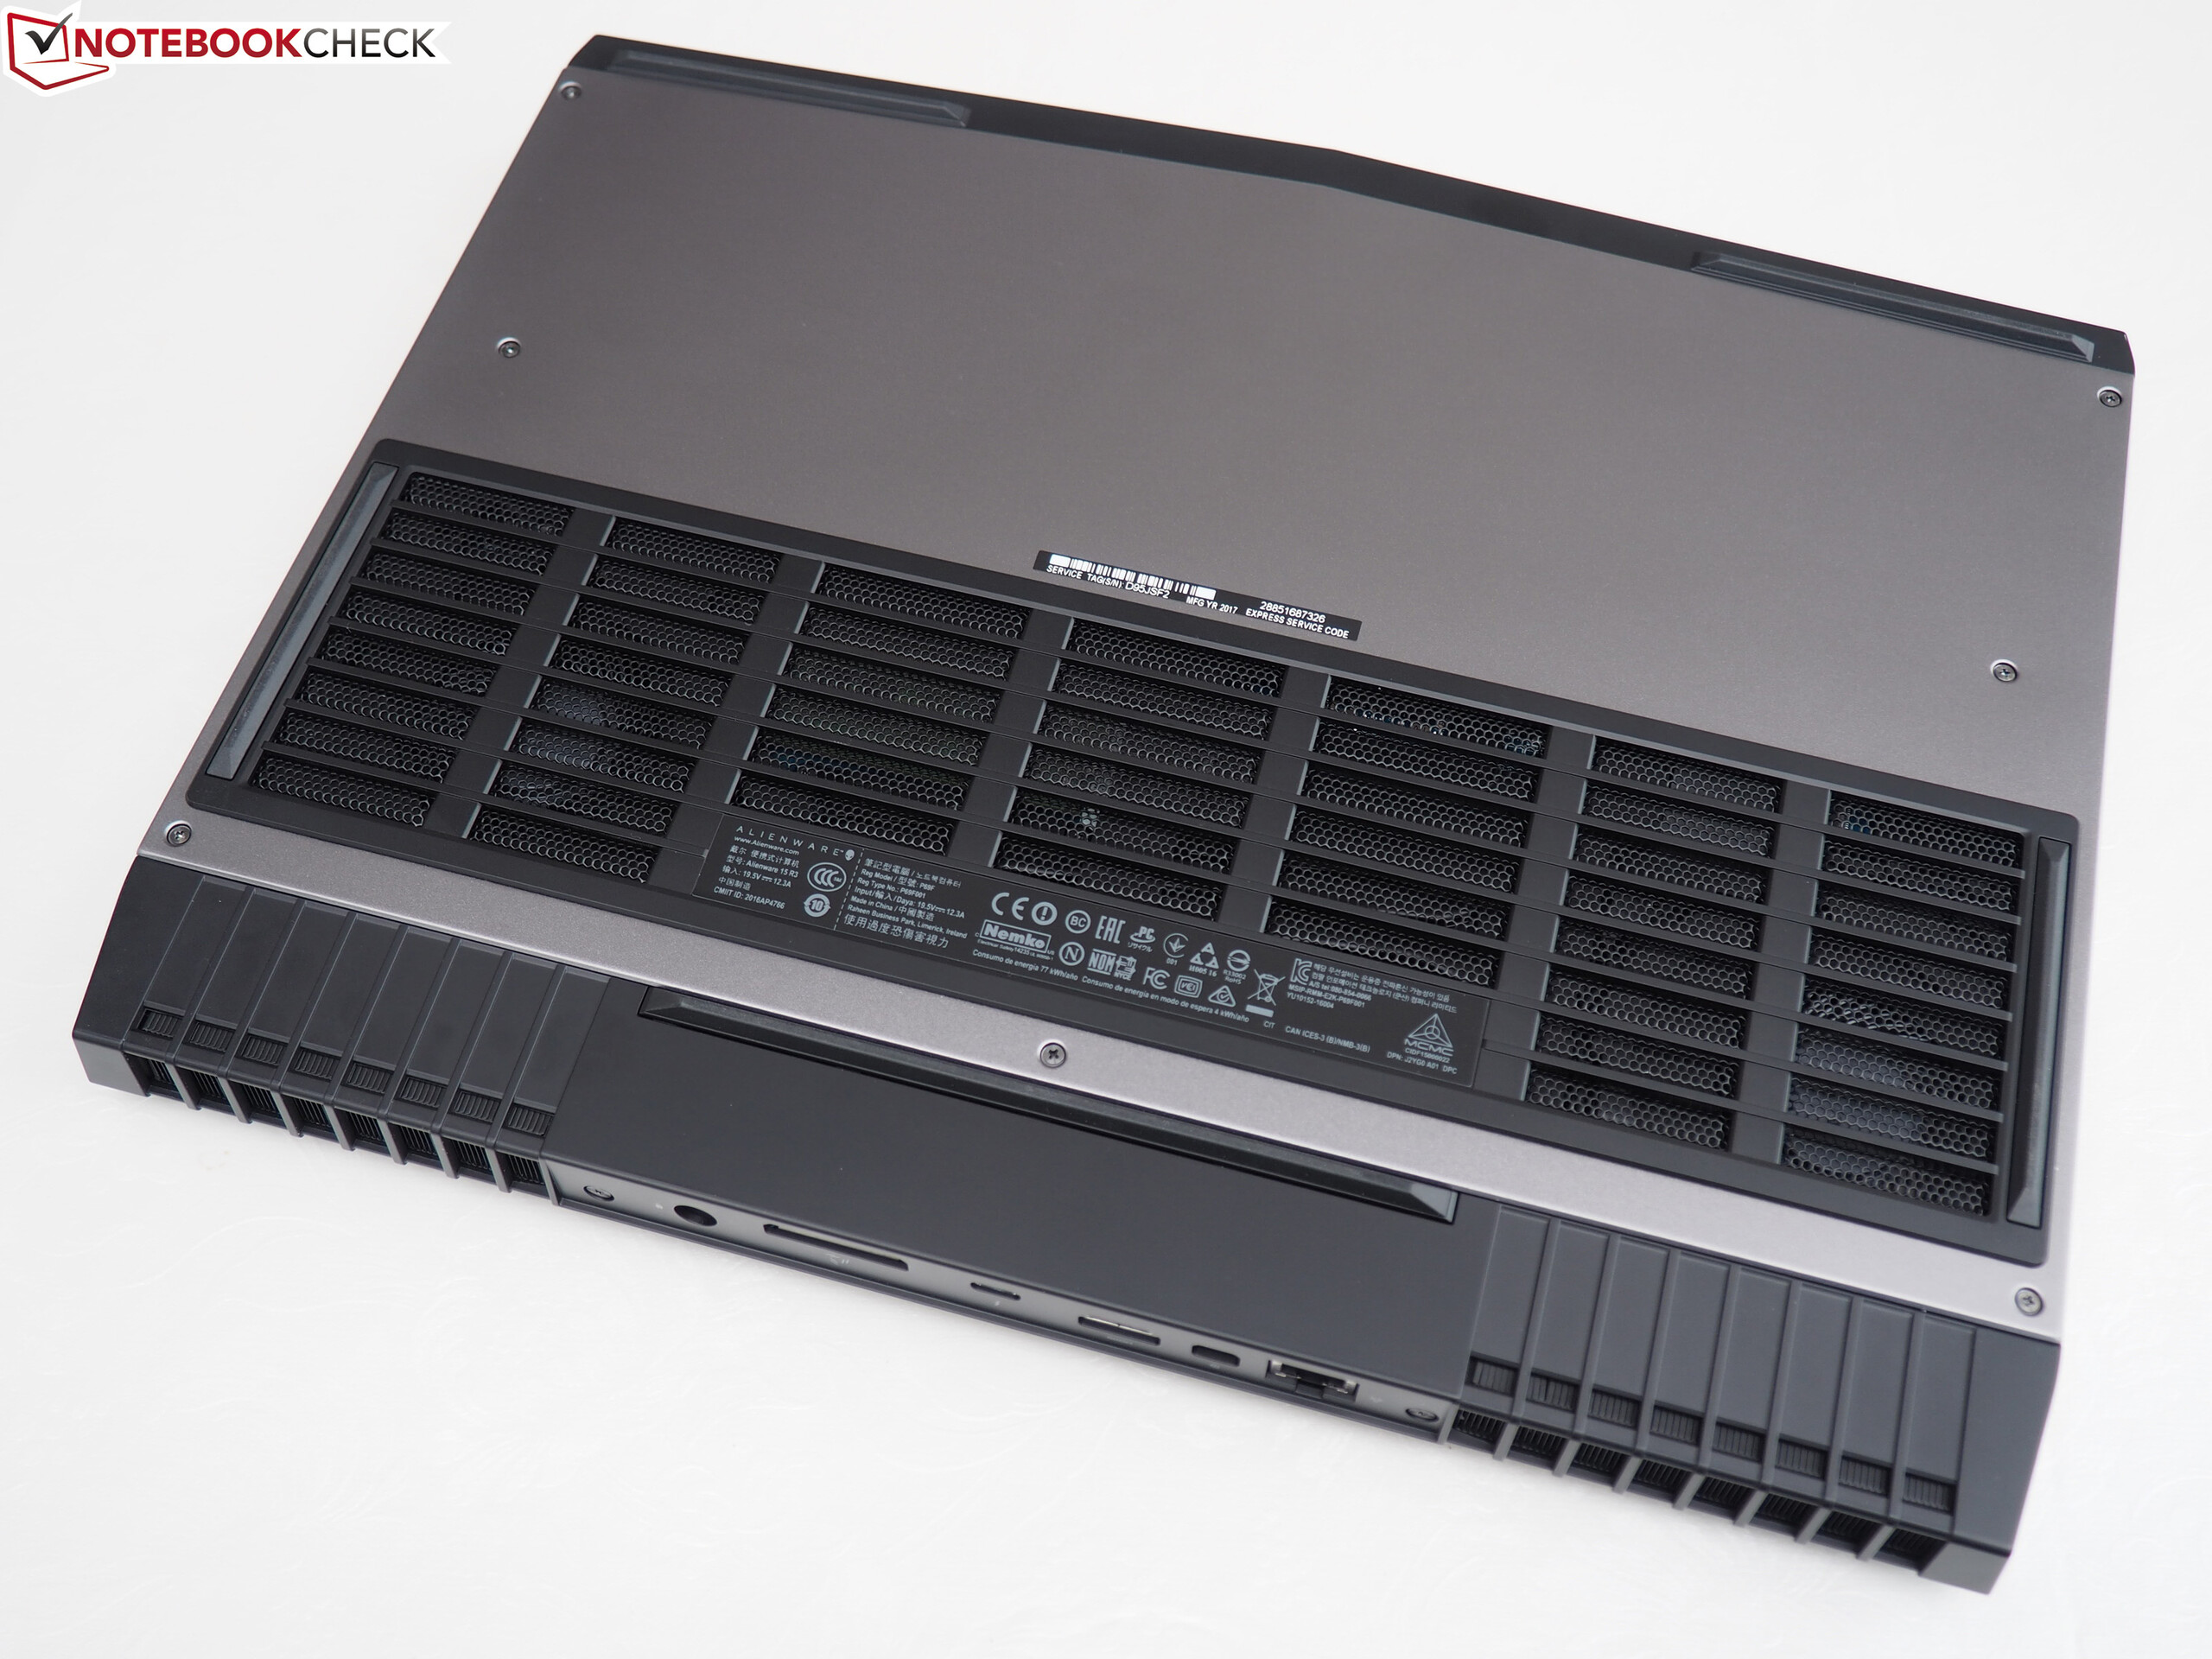
(-) The maximum temperature on the upper side is 47 °C / 117 F, compared to the average of 40.4 °C / 105 F, ranging from 21.2 to 68.8 °C for the class Gaming.
(-) The bottom heats up to a maximum of 55 °C / 131 F, compared to the average of 43.2 °C / 110 F
(+) In idle usage, the average temperature for the upper side is 31.7 °C / 89 F, compared to the device average of 33.9 °C / 93 F.
(-) Playing The Witcher 3, the average temperature for the upper side is 38.2 °C / 101 F, compared to the device average of 33.9 °C / 93 F.
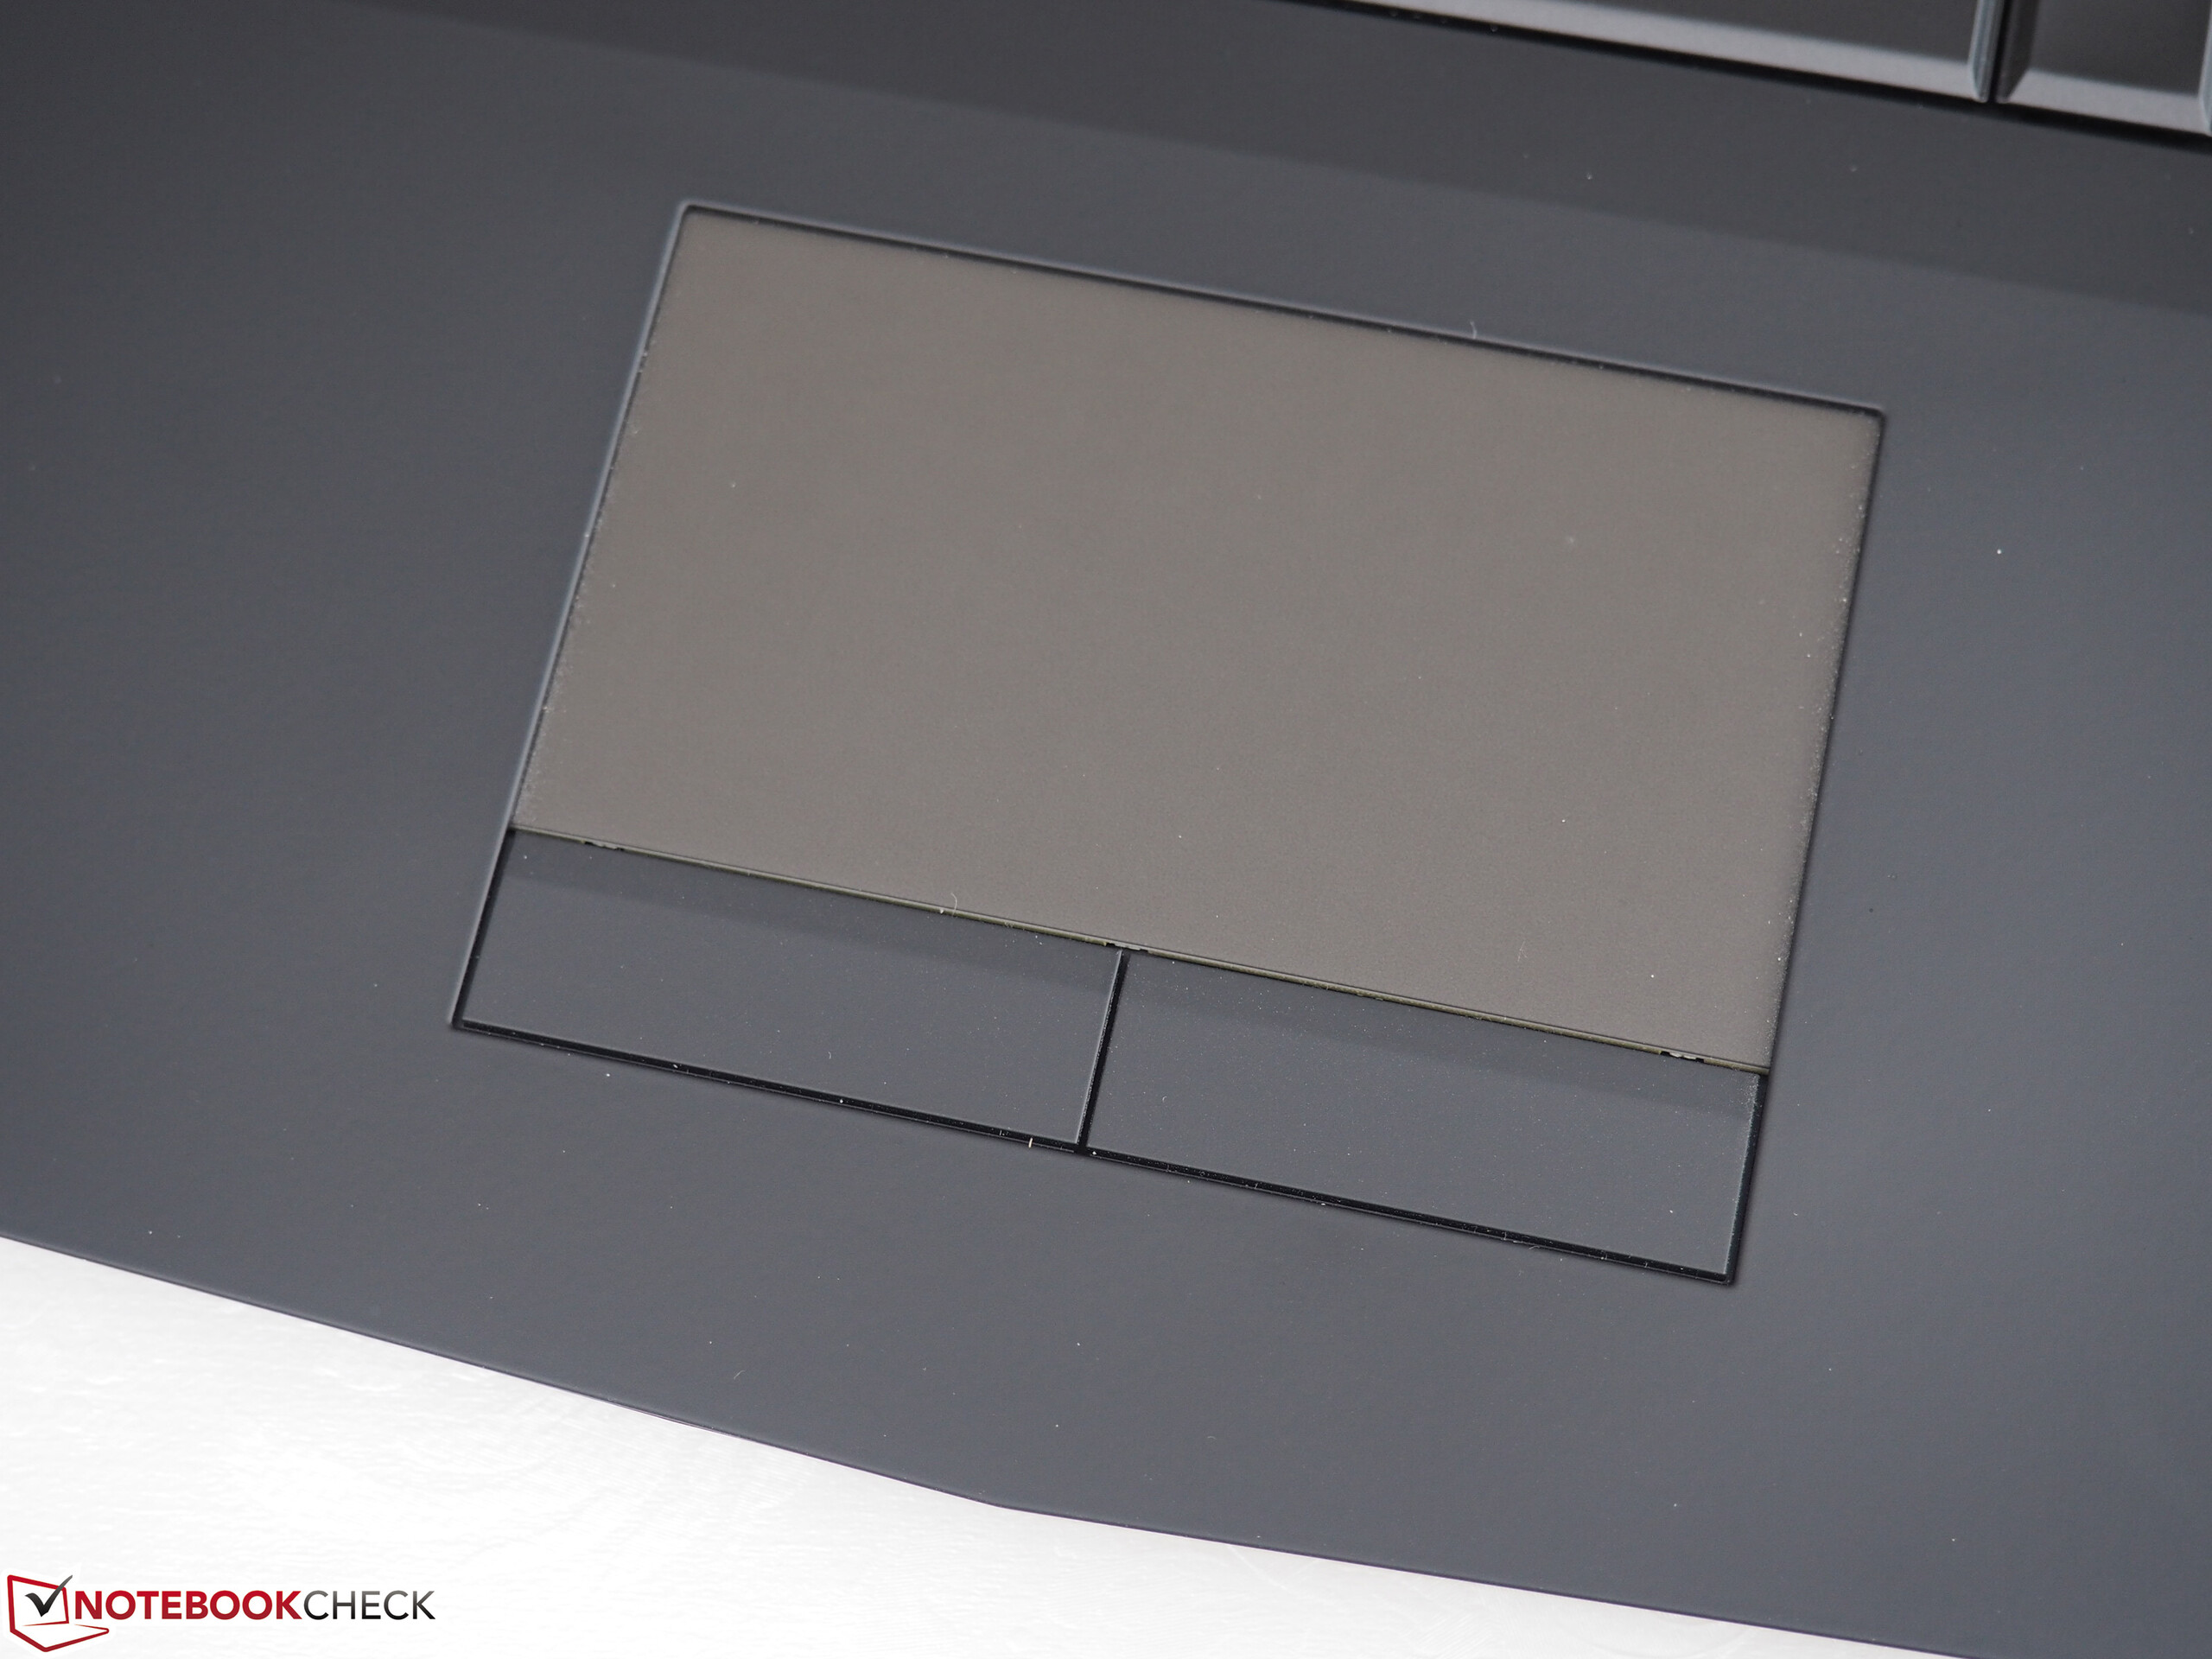
(+) The palmrests and touchpad are cooler than skin temperature with a maximum of 27 °C / 80.6 F and are therefore cool to the touch.
(±) The average temperature of the palmrest area of similar devices was 28.8 °C / 83.8 F (+1.8 °C / 3.2 F).
| Alienware 15 R3 Max-Q i7-7820HK, GeForce GTX 1080 Max-Q | Acer Predator Triton 700 i7-7700HQ, GeForce GTX 1080 Max-Q | Aorus X5 v7 i7-7820HK, GeForce GTX 1070 Mobile | Eurocom Q5 i7-7700HQ, GeForce GTX 1070 Max-Q | Alienware 15 R3 i7-7700HQ, GeForce GTX 1070 Mobile | Guru Mars K i7-7700, GeForce GTX 1080 Mobile | MSI GT75VR 7RF-012 Titan Pro i7-7820HK, GeForce GTX 1080 Mobile | |
|---|---|---|---|---|---|---|---|
| Heat | -5% | 1% | 4% | 2% | 12% | 3% | |
| Maximum Upper Side * (°C) | 47 | 61 -30% | 64 -36% | 56.2 -20% | 46 2% | 46 2% | 46 2% |
| Maximum Bottom * (°C) | 55 | 69 -25% | 56 -2% | 61.2 -11% | 51.8 6% | 46 16% | 57 -4% |
| Idle Upper Side * (°C) | 36 | 29 19% | 29 19% | 27.8 23% | 36.5 -1% | 32 11% | 34 6% |
| Idle Bottom * (°C) | 38 | 32 16% | 30 21% | 29.6 22% | 38.2 -1% | 31 18% | 35 8% |
* ... smaller is better
Alienware 15 R3 Max-Q audio analysis
(+) | speakers can play relatively loud (87 dB)
Bass 100 - 315 Hz
(-) | nearly no bass - on average 17.1% lower than median
(±) | linearity of bass is average (11% delta to prev. frequency)
Mids 400 - 2000 Hz
(±) | higher mids - on average 6.6% higher than median
(+) | mids are linear (4.7% delta to prev. frequency)
Highs 2 - 16 kHz
(+) | balanced highs - only 3% away from median
(+) | highs are linear (4.3% delta to prev. frequency)
Overall 100 - 16.000 Hz
(±) | linearity of overall sound is average (15.2% difference to median)
Compared to same class
» 33% of all tested devices in this class were better, 6% similar, 61% worse
» The best had a delta of 6%, average was 18%, worst was 132%
Compared to all devices tested
» 22% of all tested devices were better, 4% similar, 74% worse
» The best had a delta of 4%, average was 23%, worst was 134%
Aorus X5 v7 audio analysis
(±) | speaker loudness is average but good (78 dB)
Bass 100 - 315 Hz
(-) | nearly no bass - on average 19% lower than median
(±) | linearity of bass is average (10.6% delta to prev. frequency)
Mids 400 - 2000 Hz
(+) | balanced mids - only 4.2% away from median
(+) | mids are linear (5.8% delta to prev. frequency)
Highs 2 - 16 kHz
(+) | balanced highs - only 2.1% away from median
(+) | highs are linear (5.4% delta to prev. frequency)
Overall 100 - 16.000 Hz
(±) | linearity of overall sound is average (18.7% difference to median)
Compared to same class
» 62% of all tested devices in this class were better, 8% similar, 30% worse
» The best had a delta of 6%, average was 18%, worst was 132%
Compared to all devices tested
» 43% of all tested devices were better, 8% similar, 49% worse
» The best had a delta of 4%, average was 23%, worst was 134%
| Off / Standby | |
| Idle | |
| Load |
|
Key:
min: | |
| Alienware 15 R3 Max-Q i7-7820HK, GeForce GTX 1080 Max-Q | Acer Predator Triton 700 i7-7700HQ, GeForce GTX 1080 Max-Q | Aorus X5 v7 i7-7820HK, GeForce GTX 1070 Mobile | Eurocom Q5 i7-7700HQ, GeForce GTX 1070 Max-Q | Alienware 15 R3 i7-7700HQ, GeForce GTX 1070 Mobile | Guru Mars K i7-7700, GeForce GTX 1080 Mobile | MSI GT75VR 7RF-012 Titan Pro i7-7820HK, GeForce GTX 1080 Mobile | |
|---|---|---|---|---|---|---|---|
| Power Consumption | -15% | -13% | 35% | 10% | -43% | -50% | |
| Idle Minimum * (Watt) | 22 | 28 -27% | 26 -18% | 9 59% | 19 14% | 31 -41% | 34 -55% |
| Idle Average * (Watt) | 26 | 33 -27% | 31 -19% | 13.5 48% | 23 12% | 37 -42% | 41 -58% |
| Idle Maximum * (Watt) | 33 | 41 -24% | 36 -9% | 13.7 58% | 29 12% | 44 -33% | 50 -52% |
| Load Average * (Watt) | 86 | 94 -9% | 93 -8% | 87.8 -2% | 85 1% | 116 -35% | 106 -23% |
| Witcher 3 ultra * (Watt) | 159 | 160 -1% | 176 -11% | 129 19% | 259 -63% | 257 -62% | |
| Load Maximum * (Watt) | 215 | 222 -3% | 240 -12% | 158.6 26% | 192 11% | 312 -45% | 320 -49% |
* ... smaller is better
| Alienware 15 R3 Max-Q i7-7820HK, GeForce GTX 1080 Max-Q, 99 Wh | Alienware 15 R3 i7-7700HQ, GeForce GTX 1070 Mobile, 99 Wh | Acer Predator Triton 700 i7-7700HQ, GeForce GTX 1080 Max-Q, 54 Wh | Aorus X5 v7 i7-7820HK, GeForce GTX 1070 Mobile, 94 Wh | Eurocom Q5 i7-7700HQ, GeForce GTX 1070 Max-Q, 55 Wh | |
|---|---|---|---|---|---|
| Battery runtime | -13% | -56% | -44% | -23% | |
| Reader / Idle (h) | 7.1 | 6.4 -10% | 2.5 -65% | 3.5 -51% | 7.8 10% |
| H.264 (h) | 5 | 4.4 -12% | 1.8 -64% | 2.7 -46% | |
| WiFi v1.3 (h) | 5.4 | 4.4 -19% | 2.4 -56% | 2.5 -54% | 4.3 -20% |
| Load (h) | 1.9 | 1.7 -11% | 1.2 -37% | 1.4 -26% | 0.8 -58% |
Pros
Cons
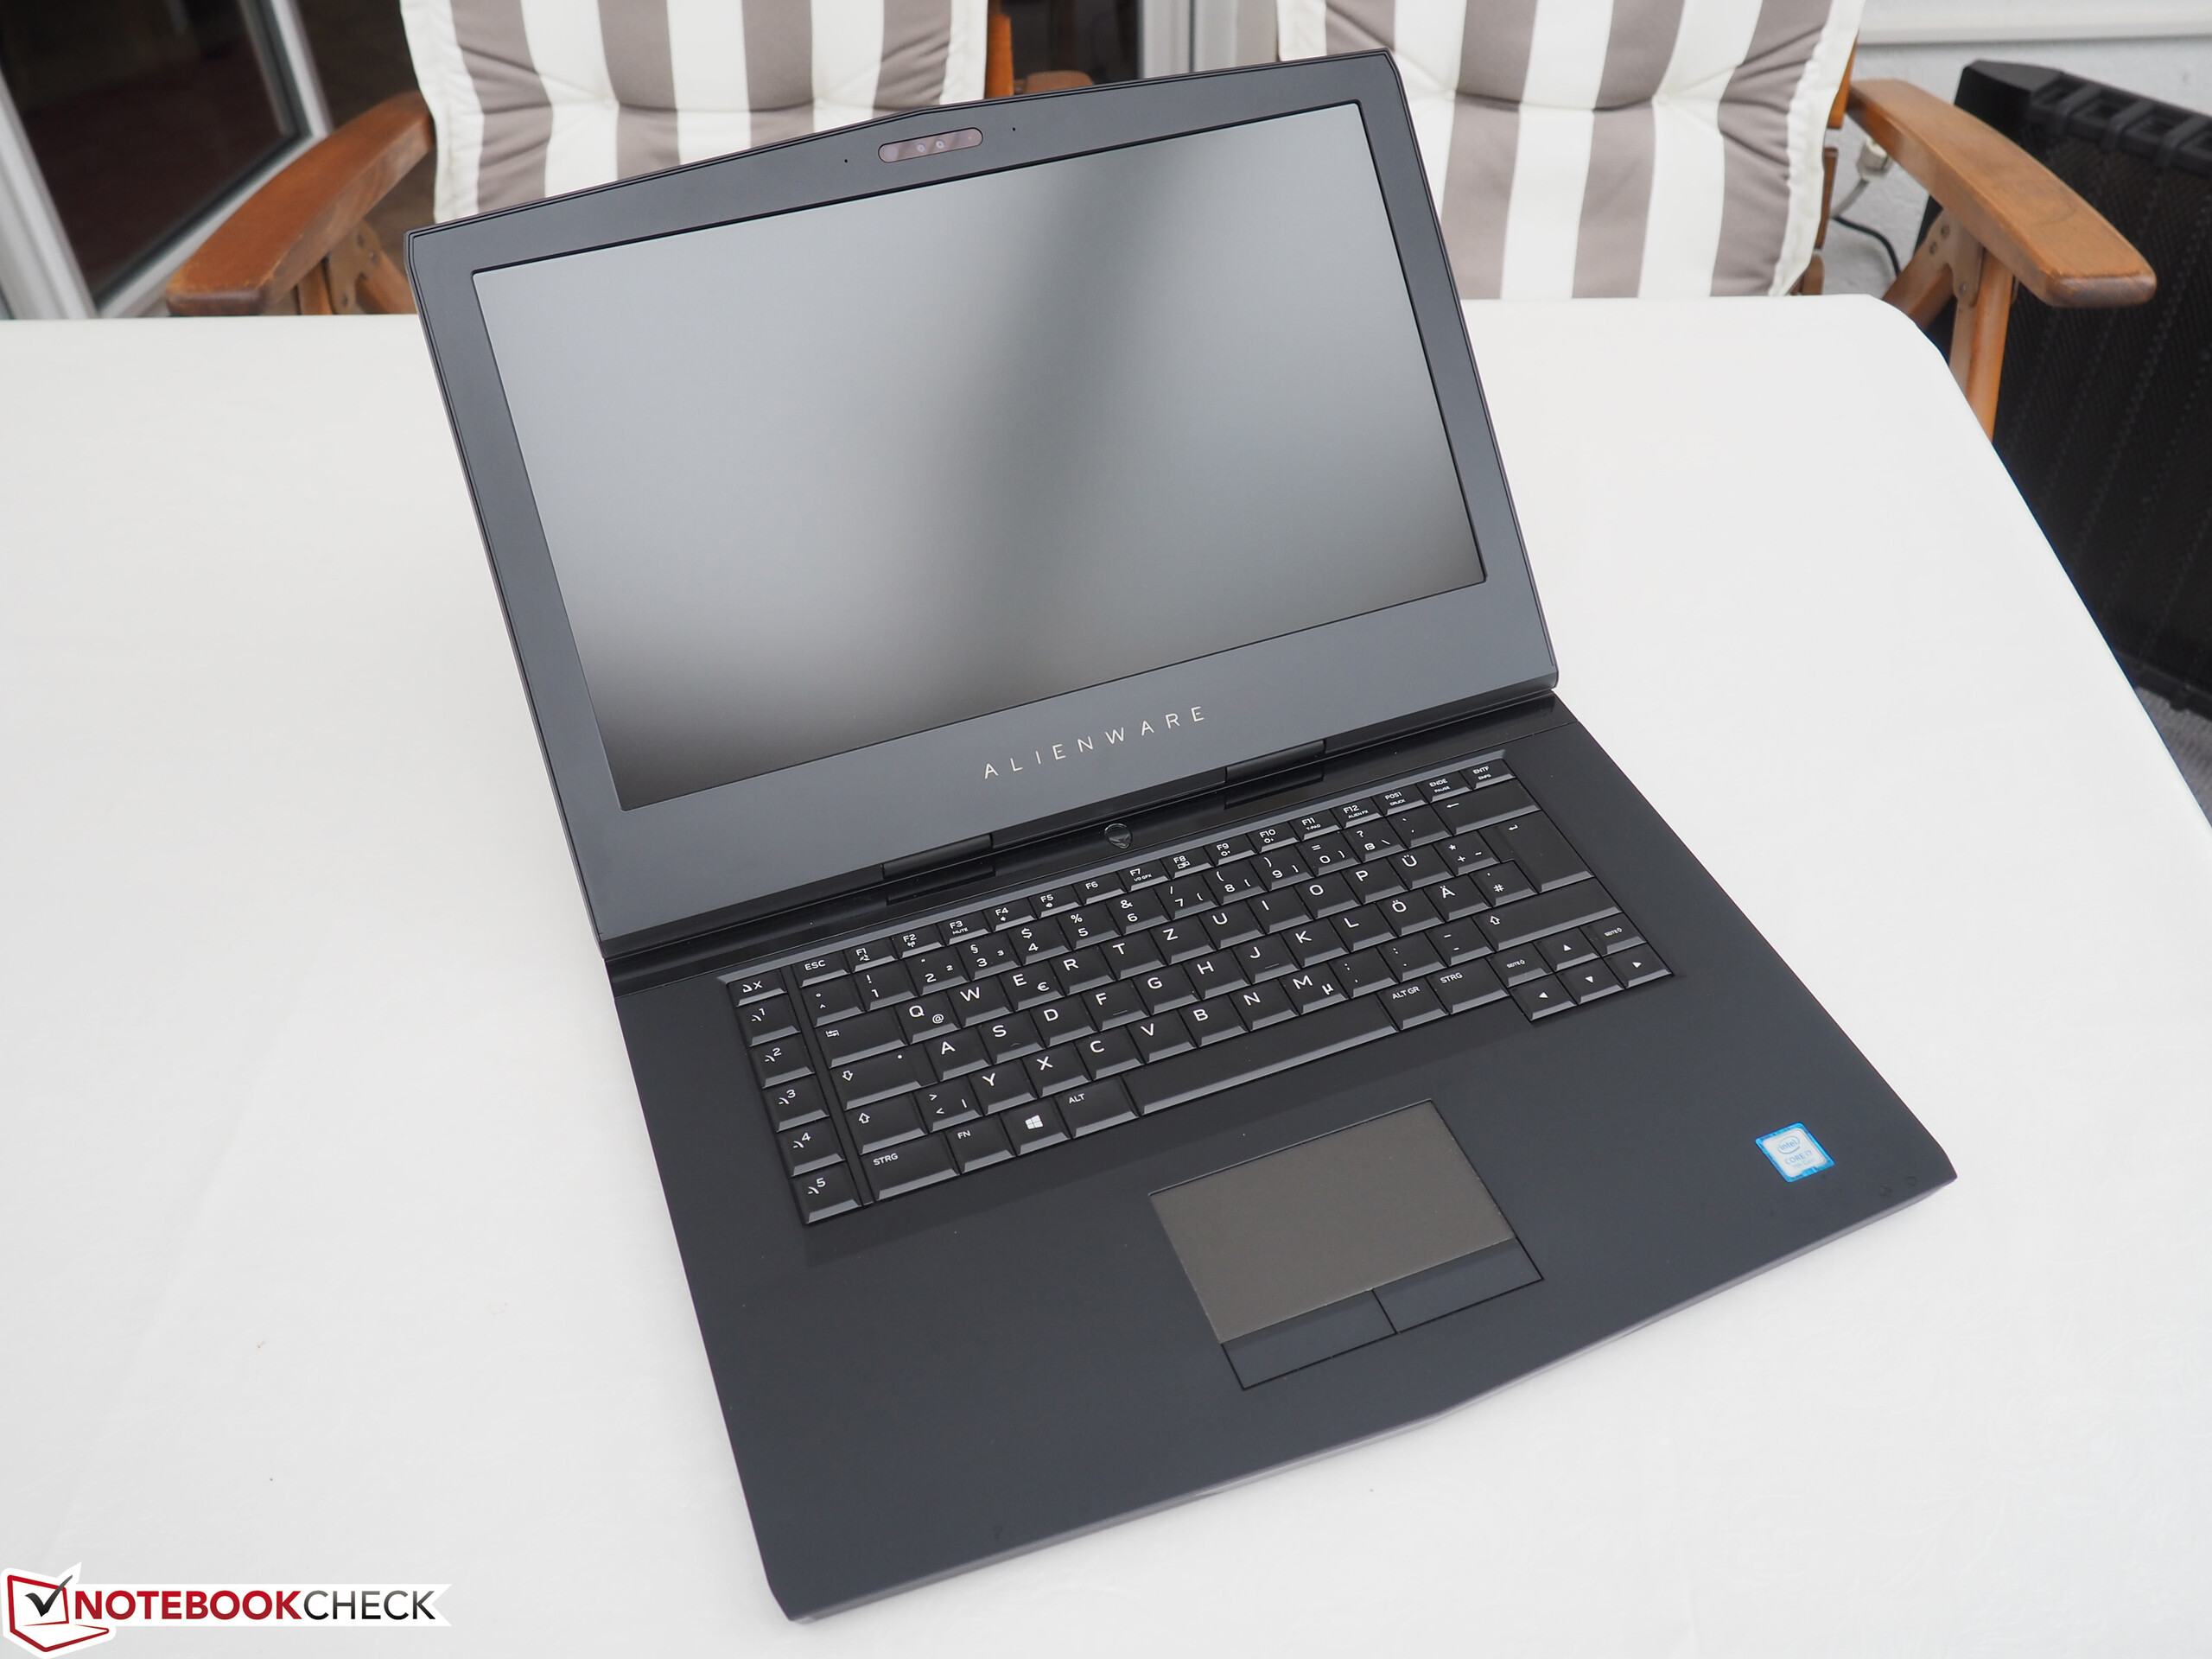
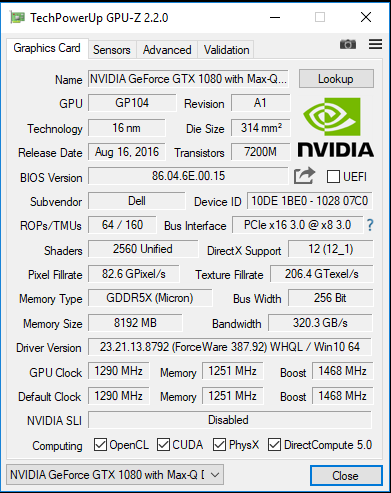
外星人 15 R3 可以在哑光的全高清屏幕上,完美运行时下的所有电脑游戏。
没有妥协:所有游戏都能在这最强配置下,顺畅运行。
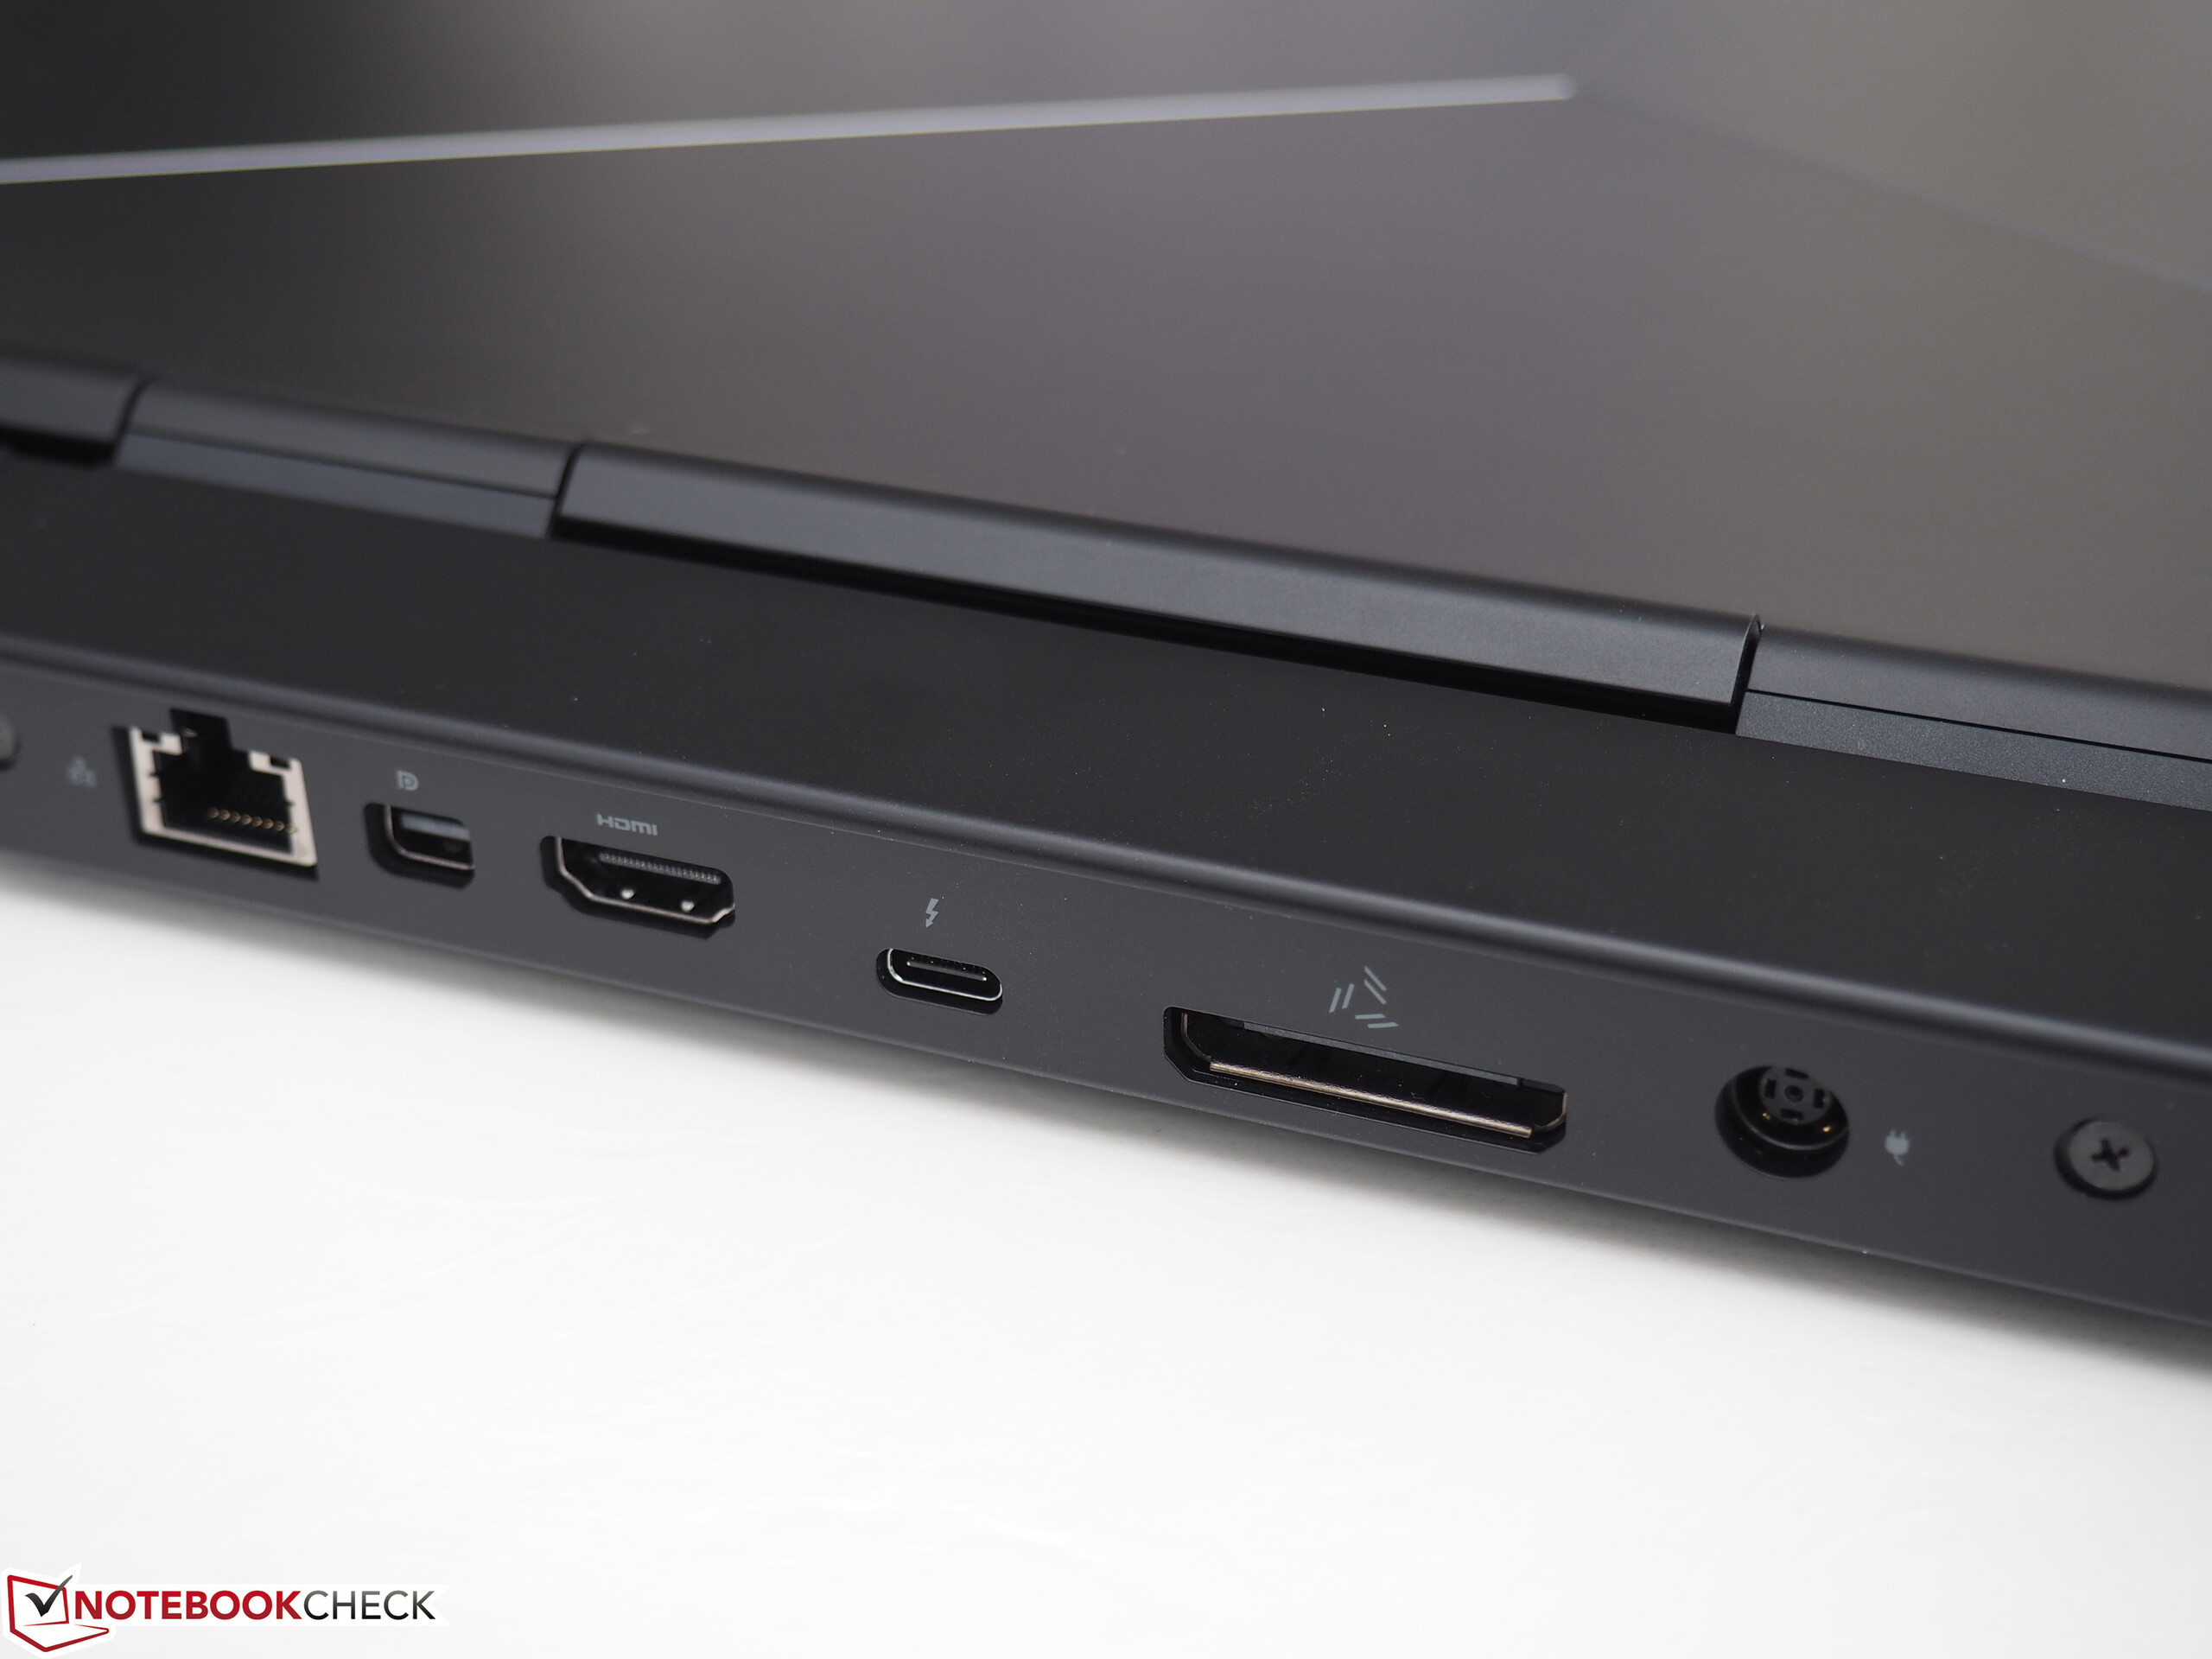
如果有一天,显卡的性能不足了,用户可以通过雷电3来外接显卡。
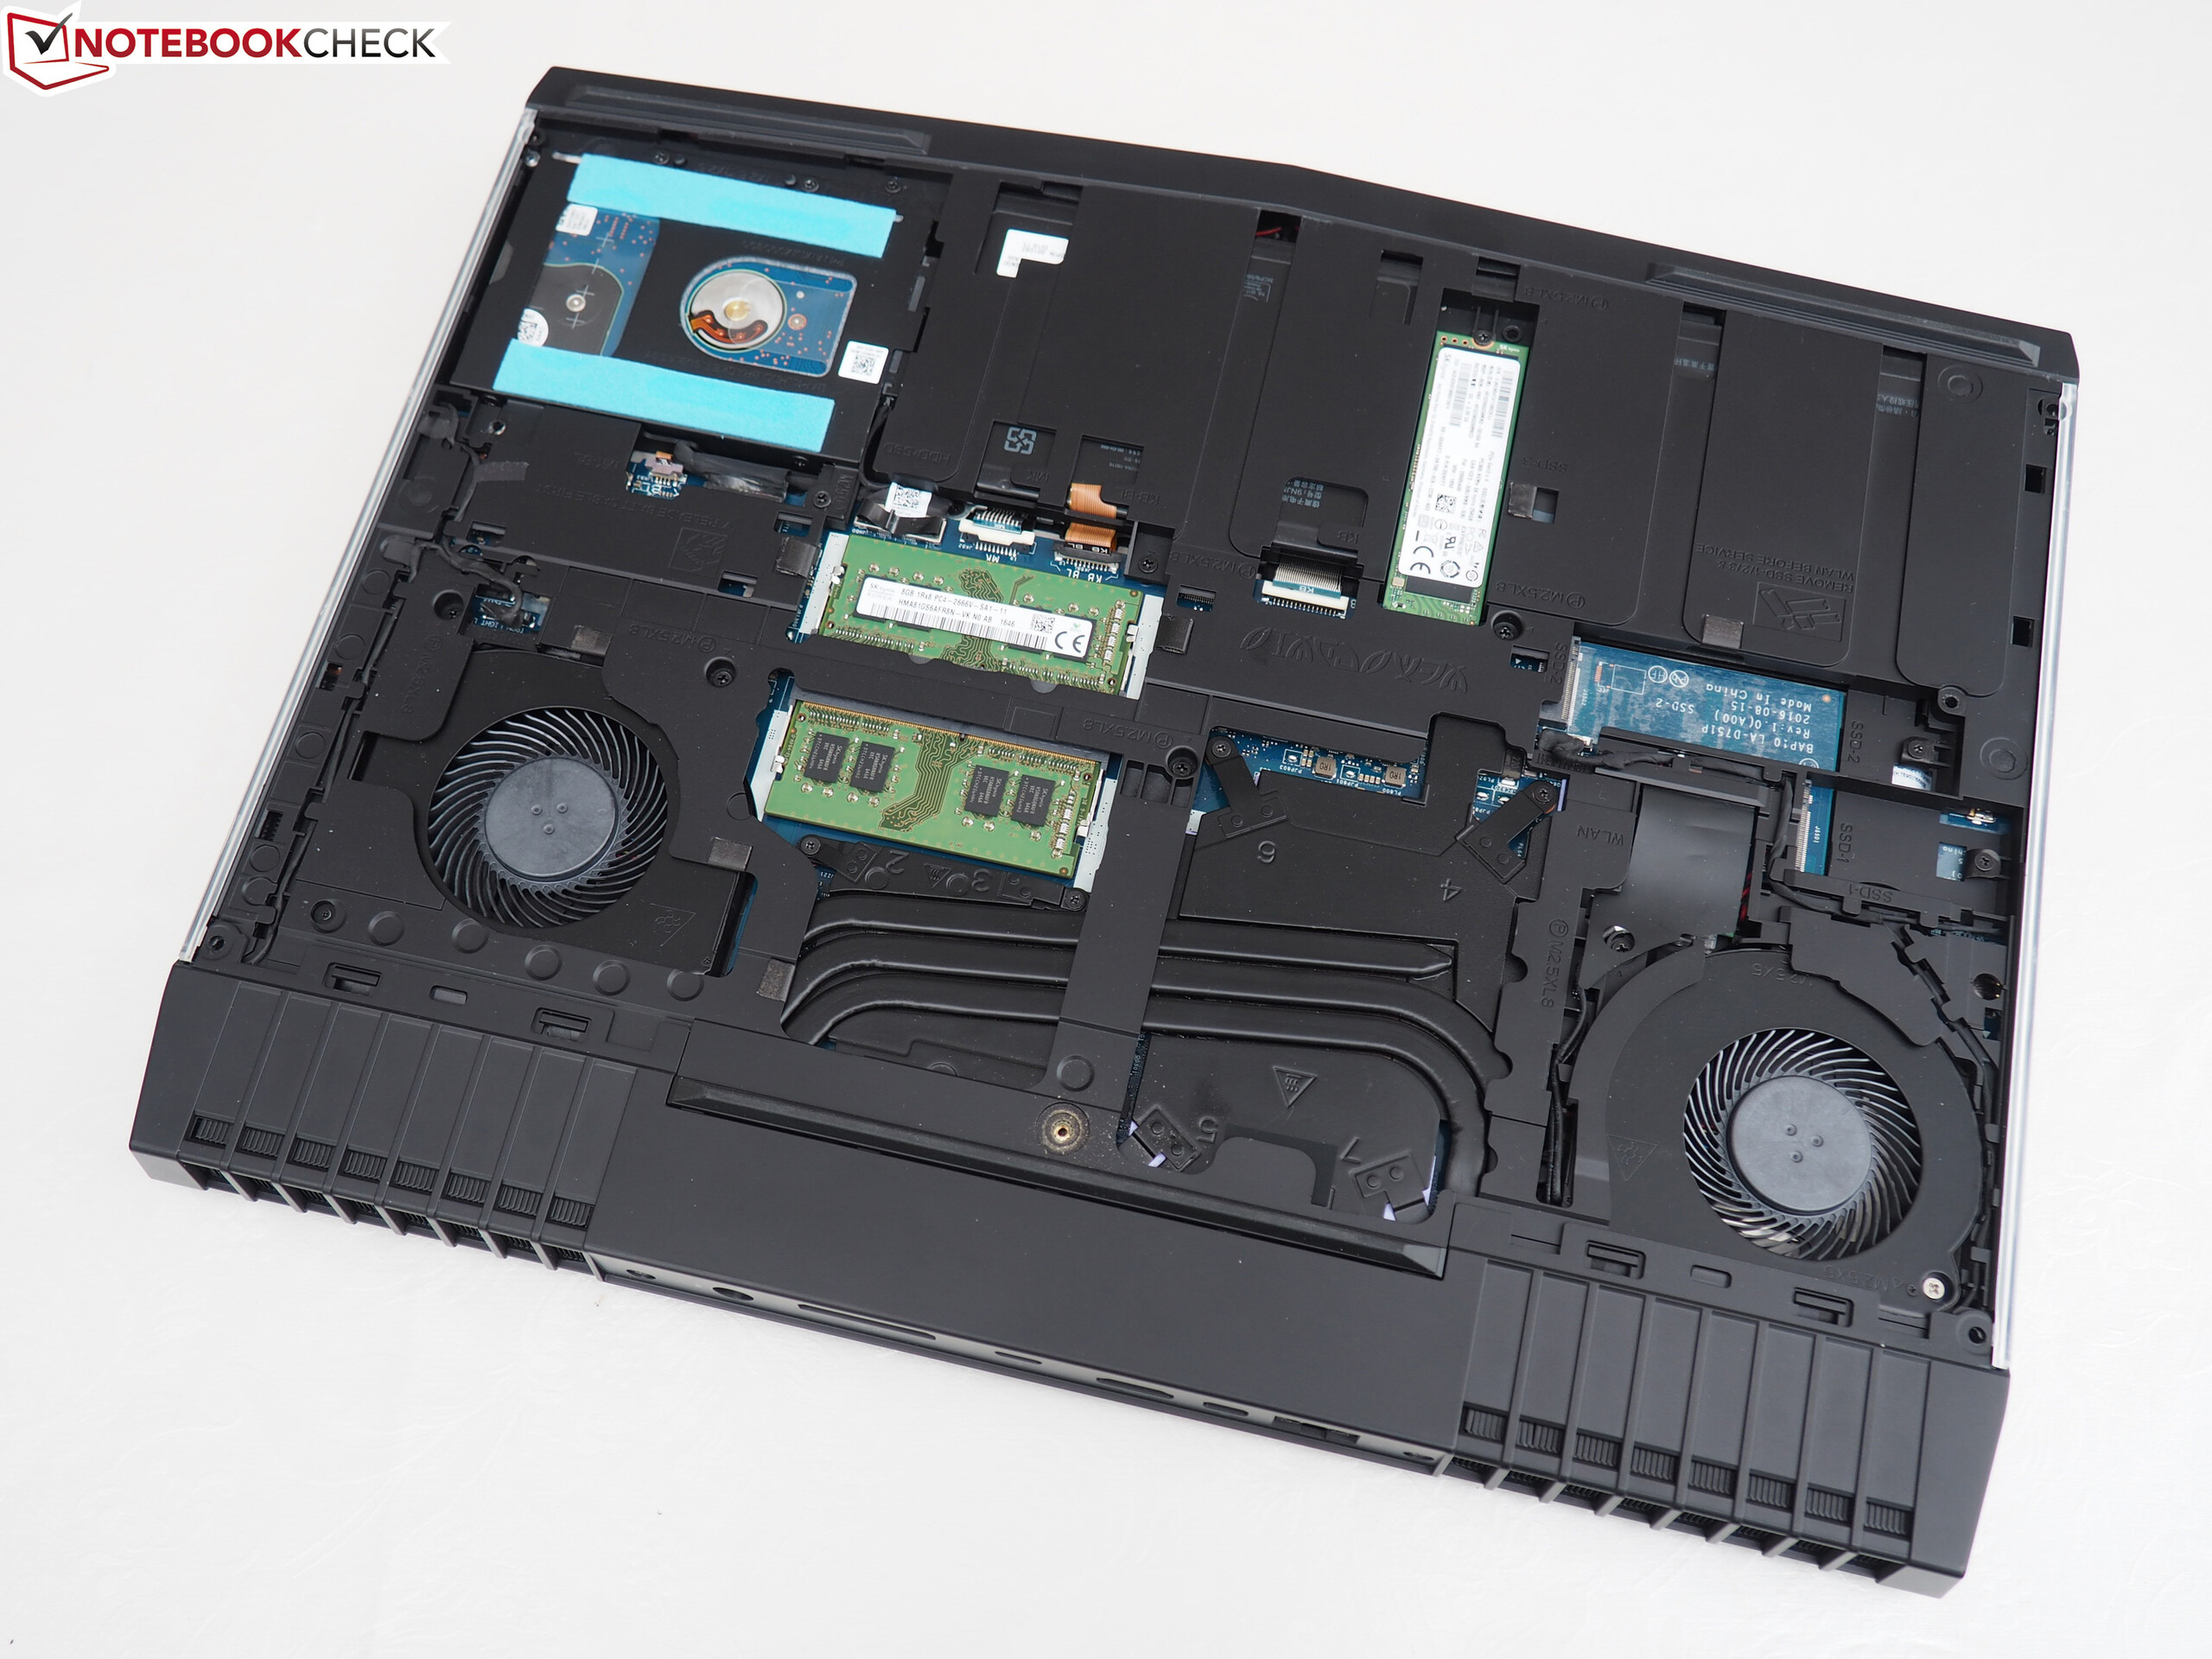
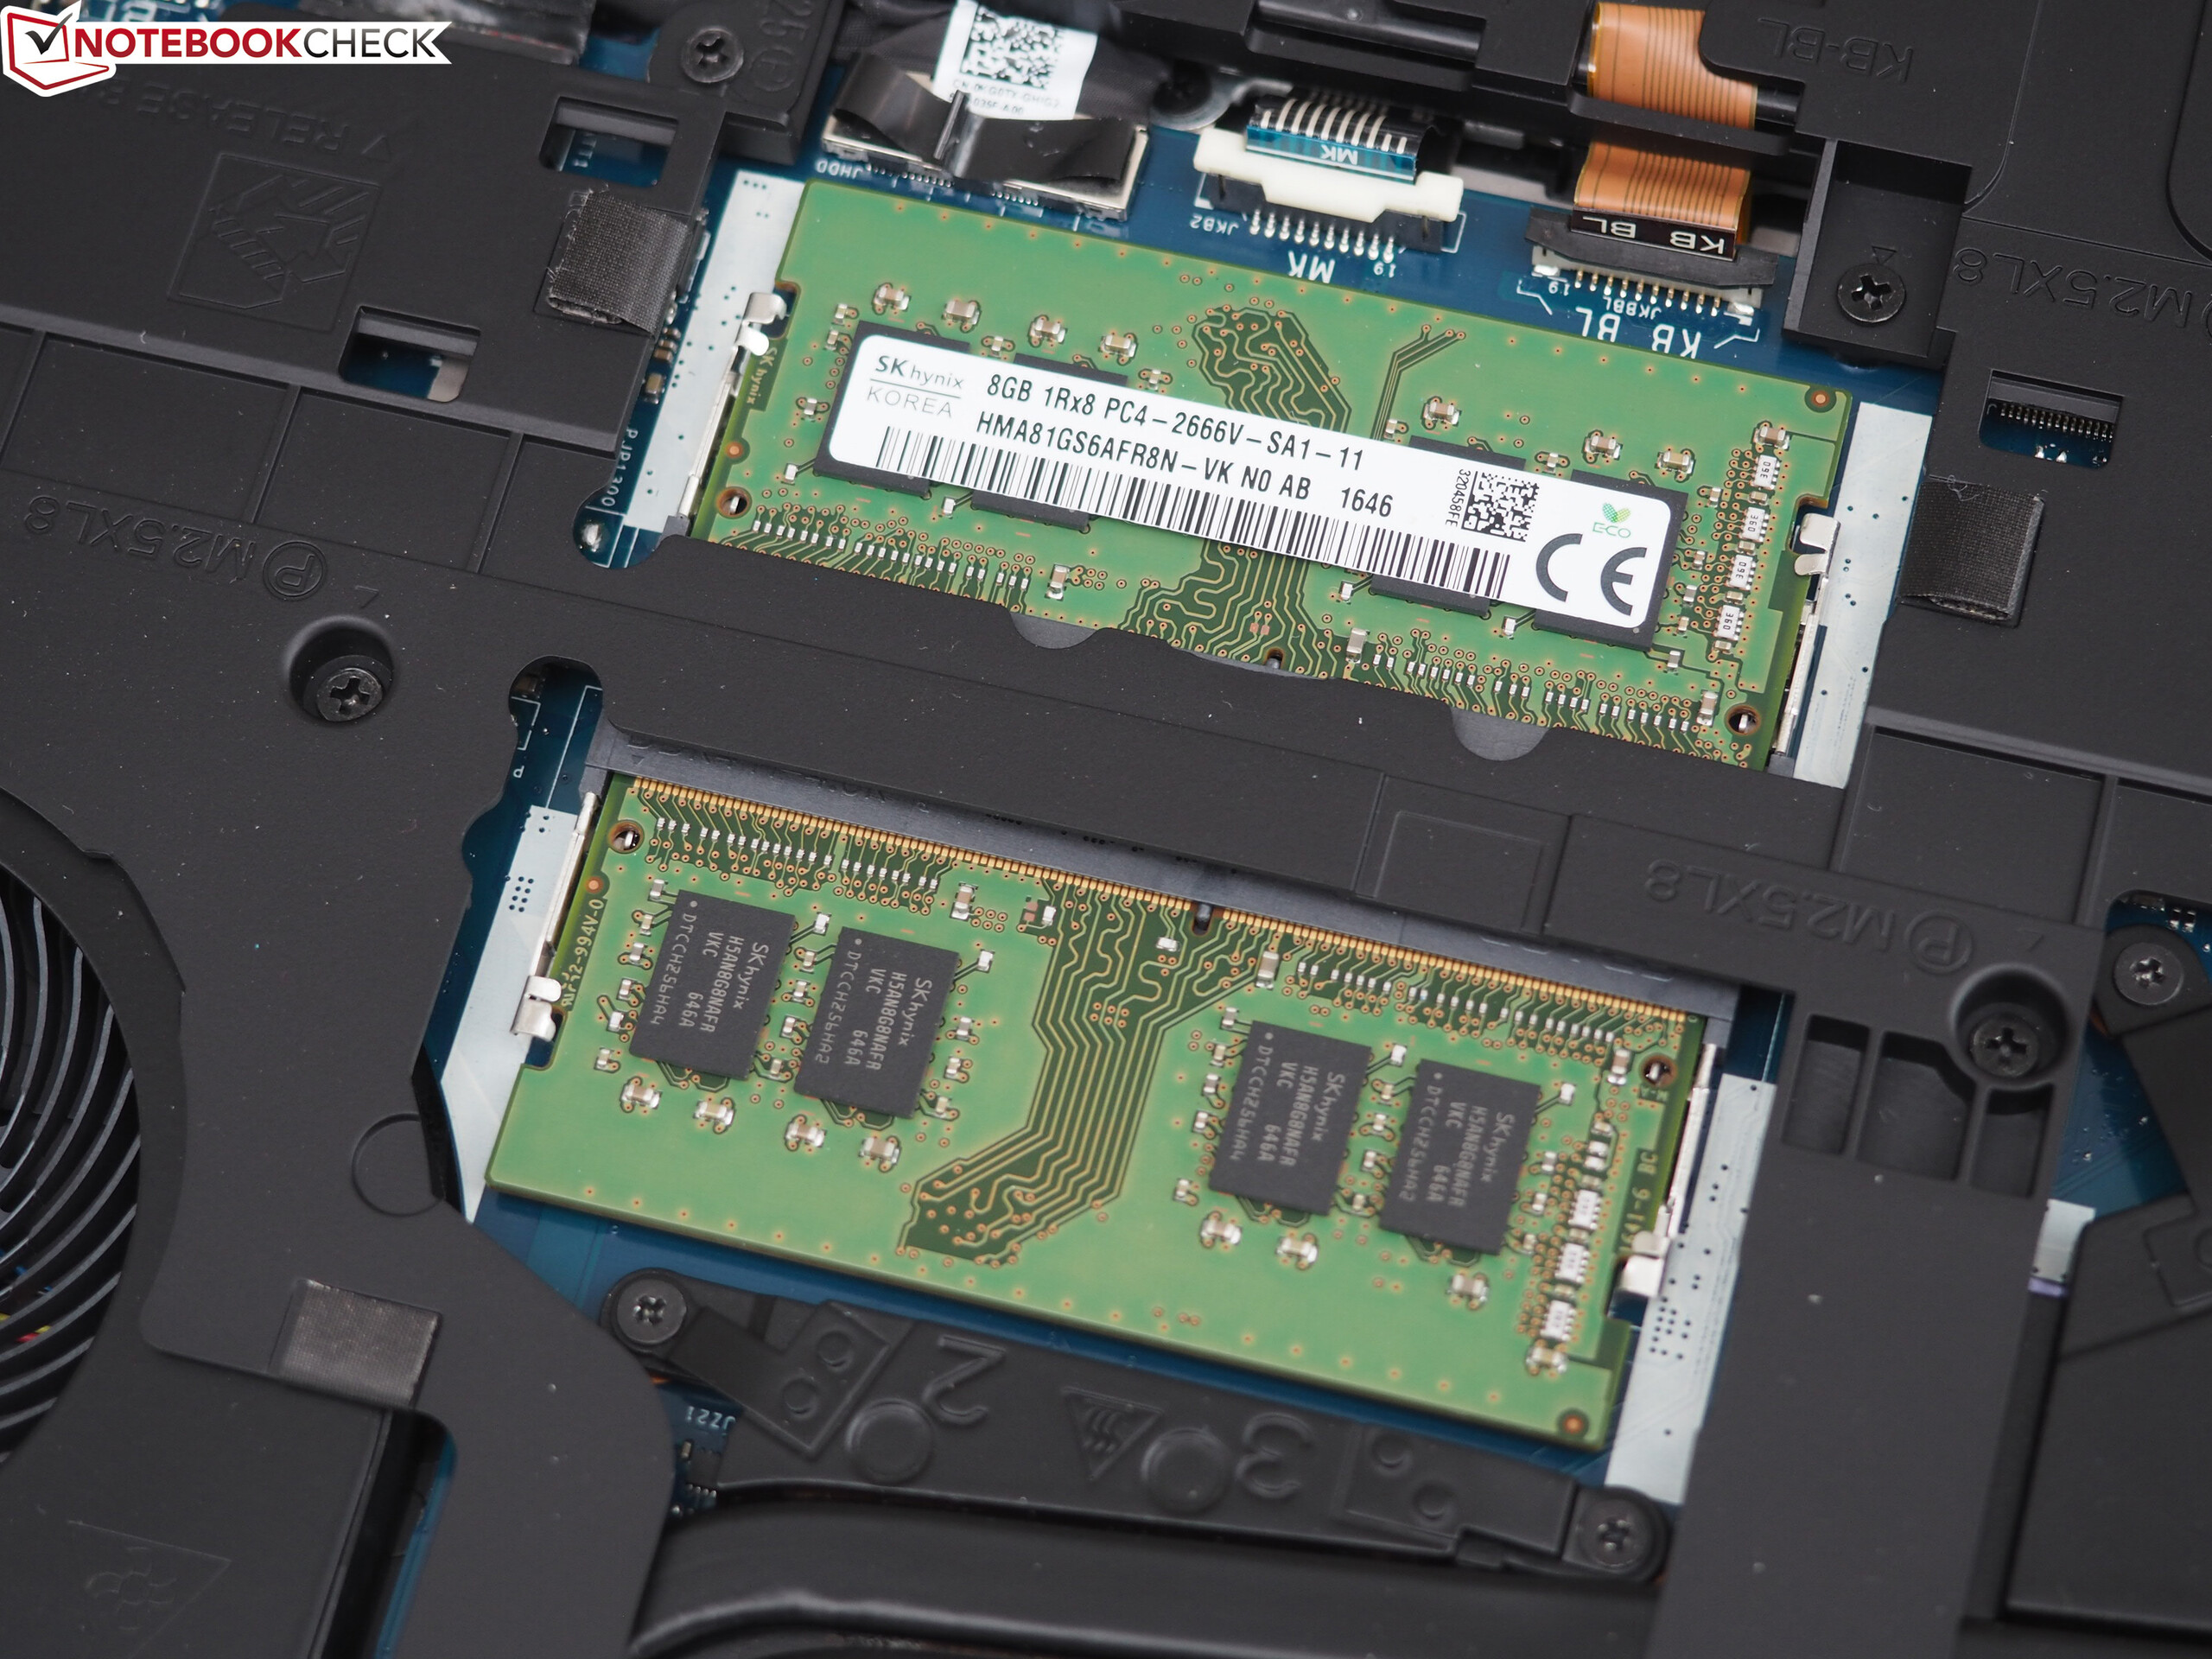
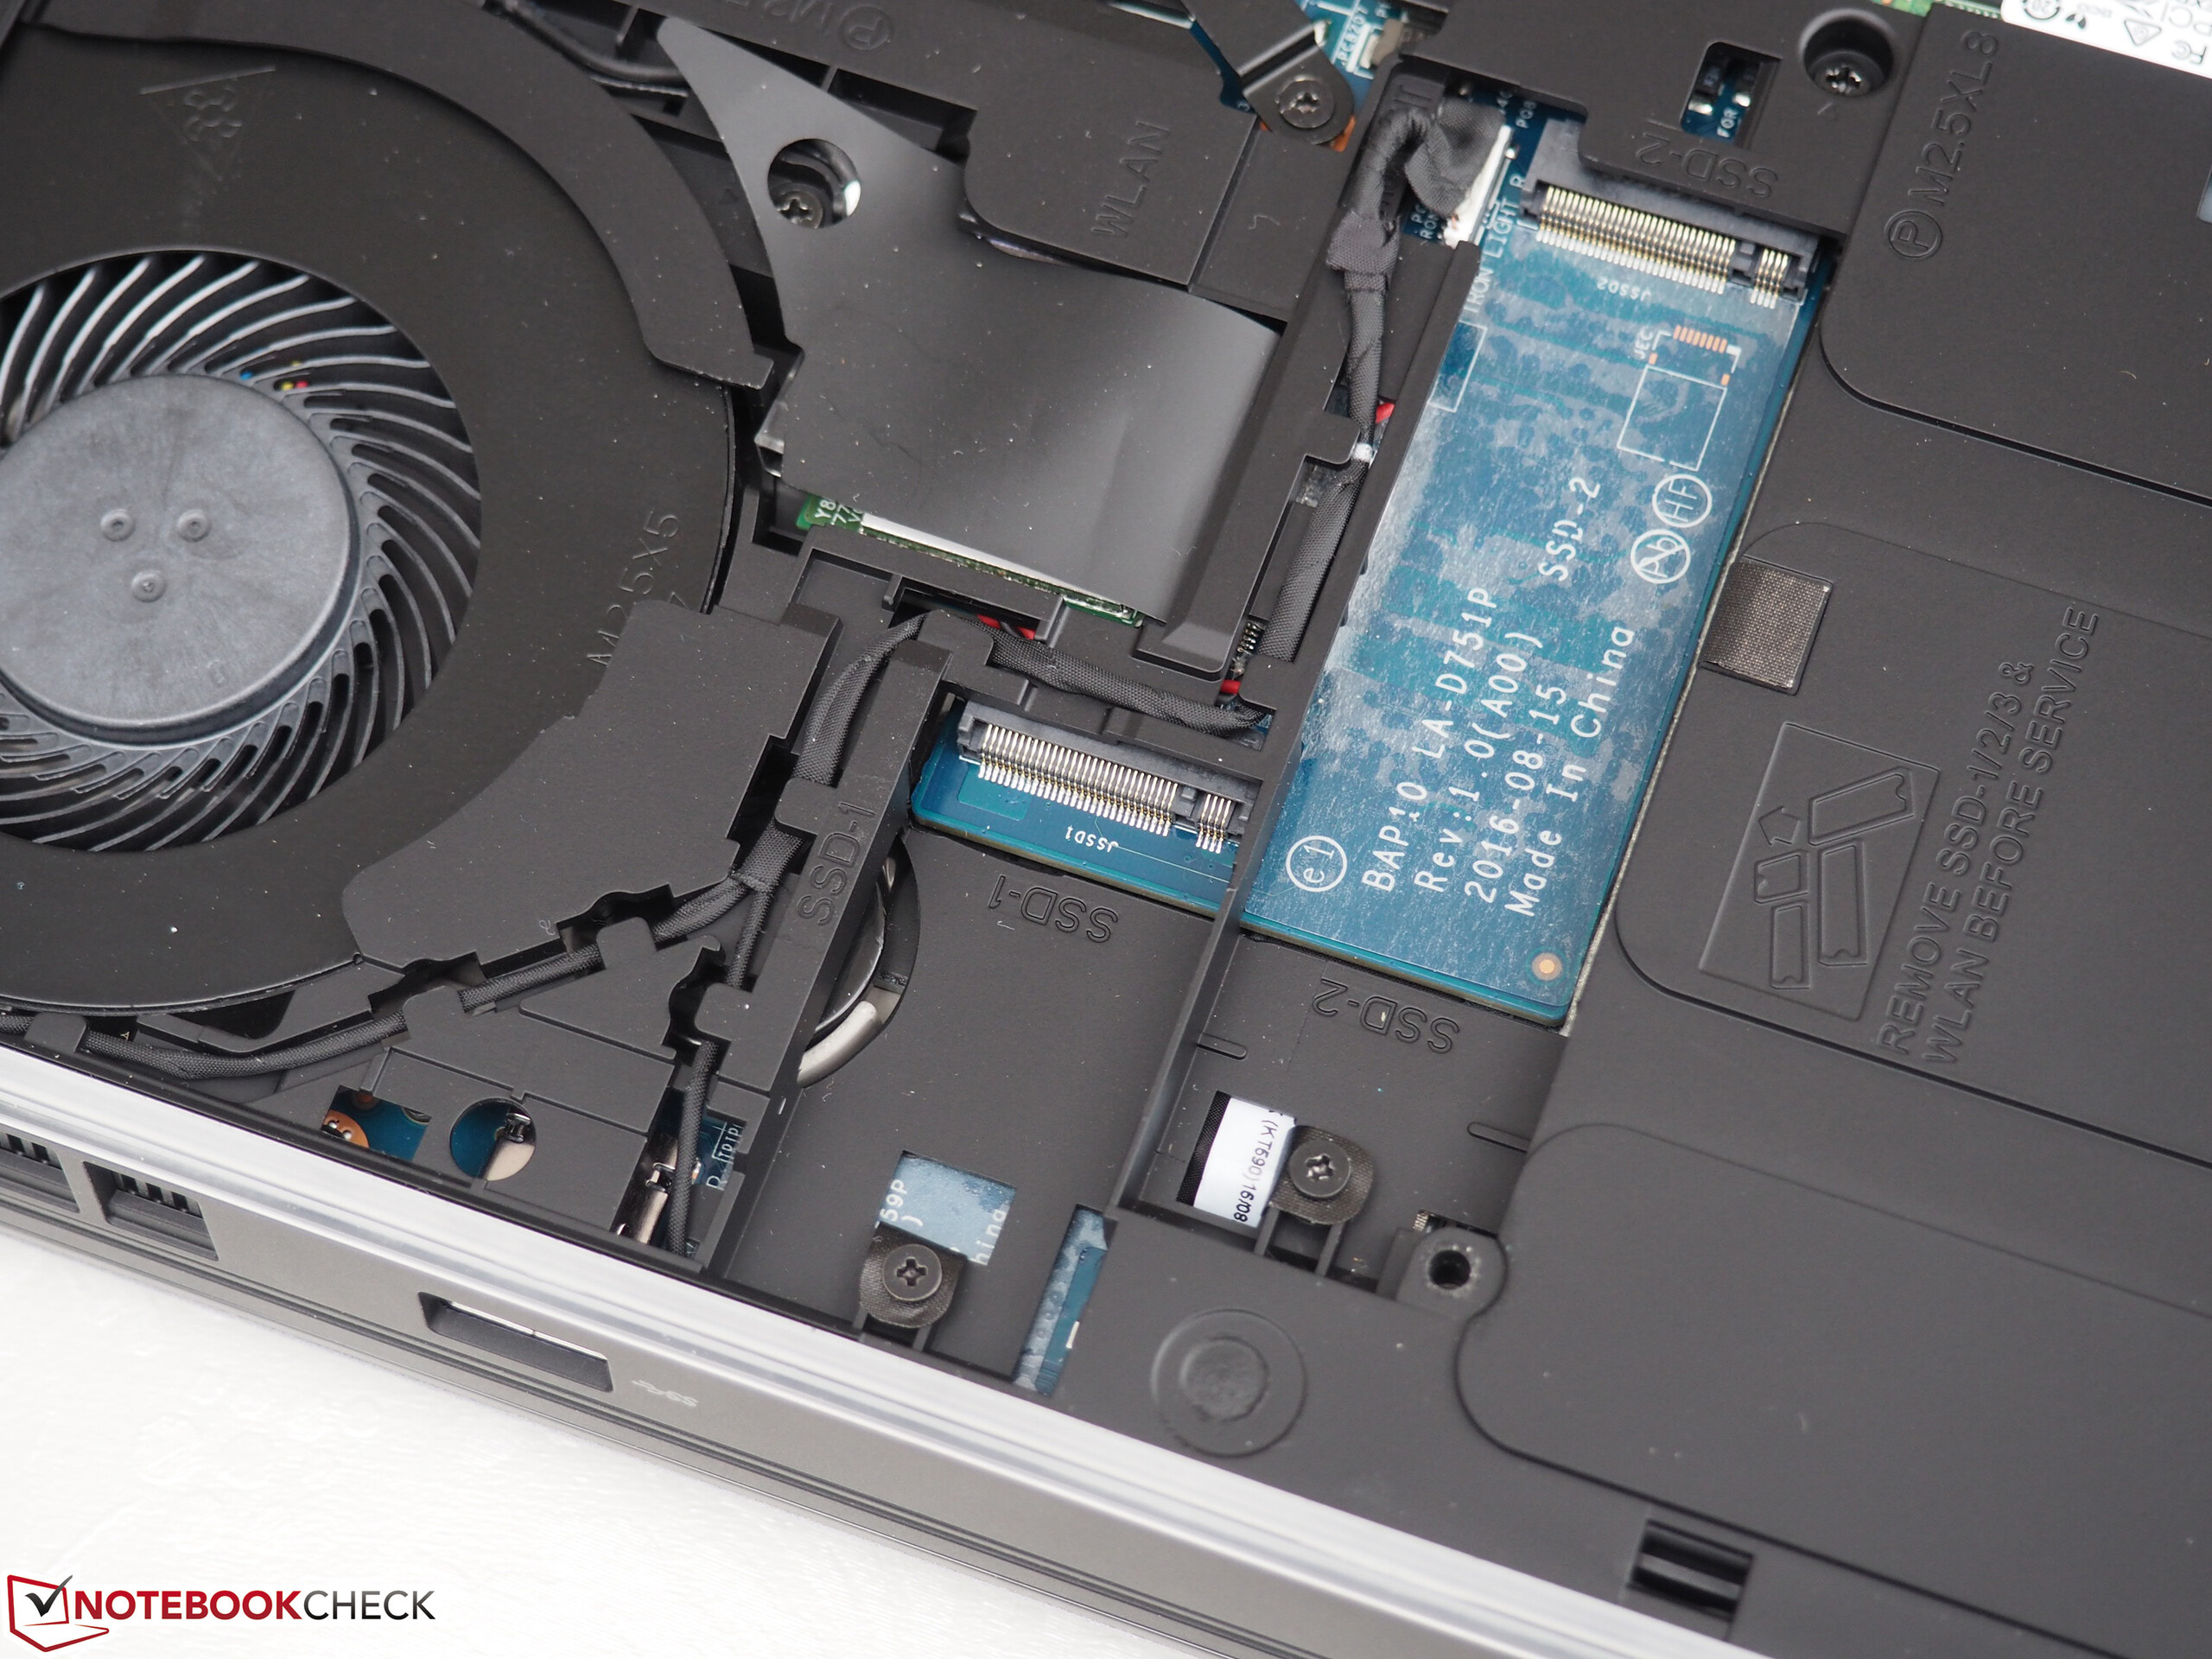
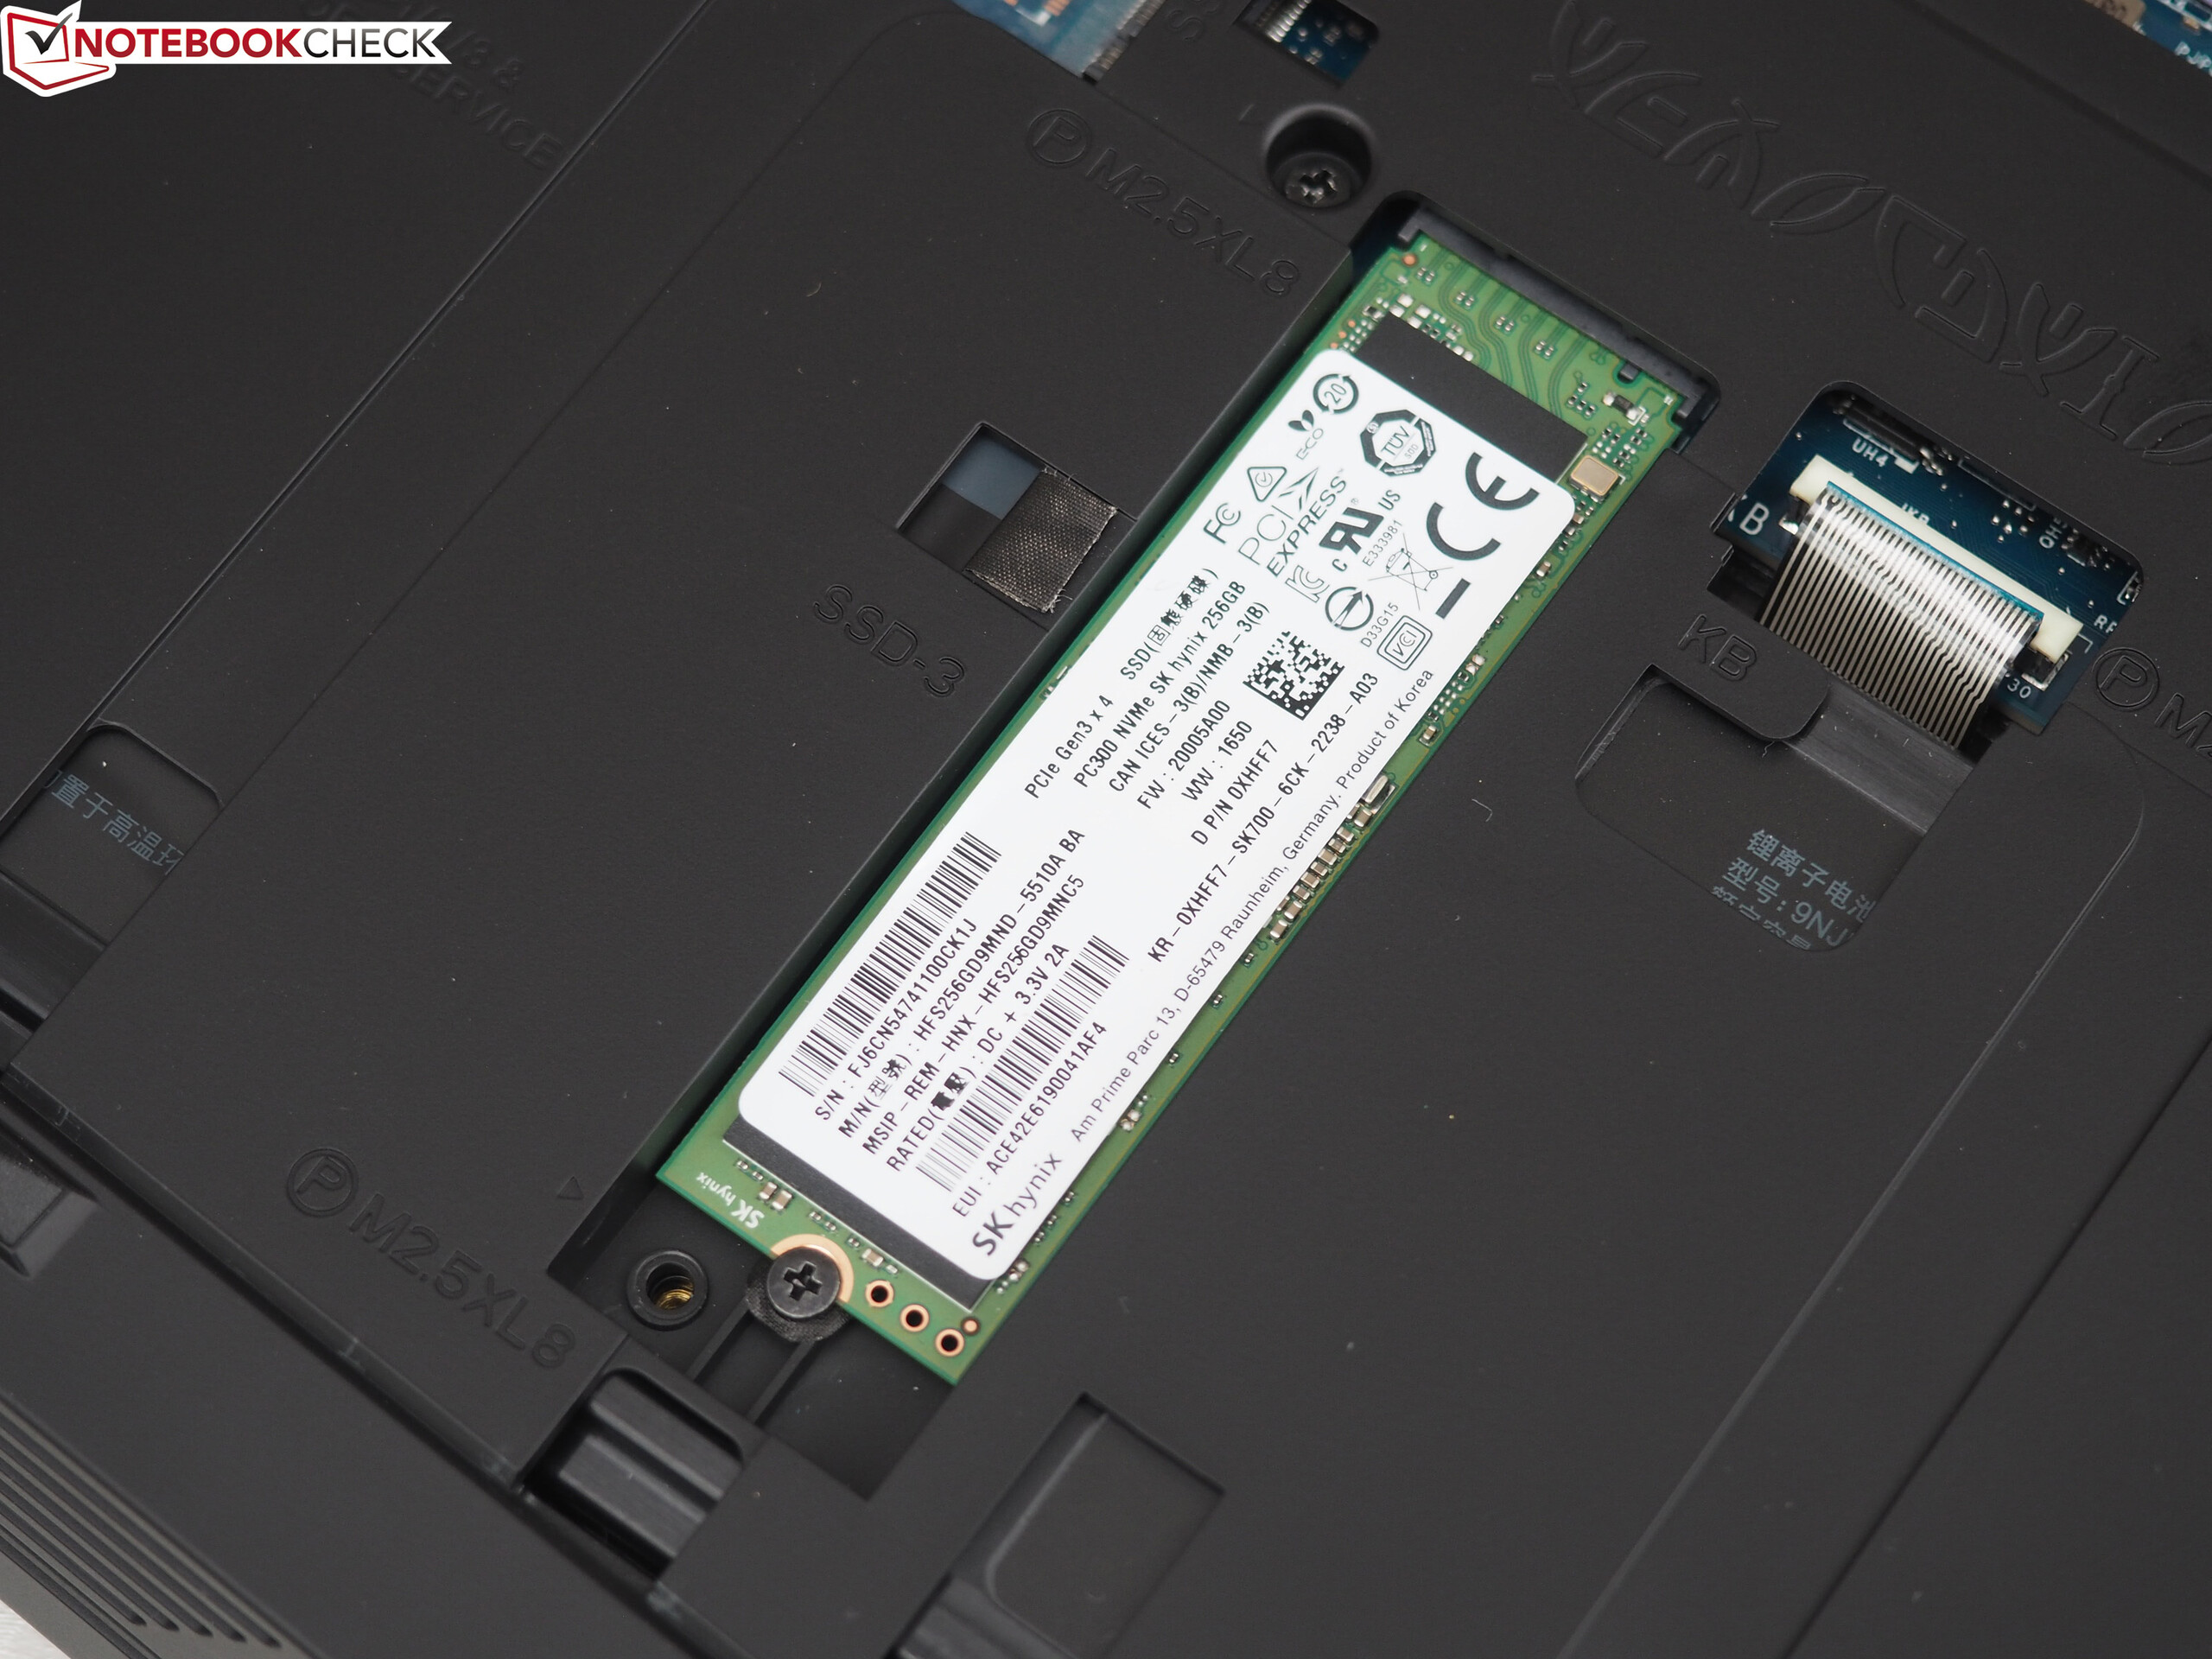
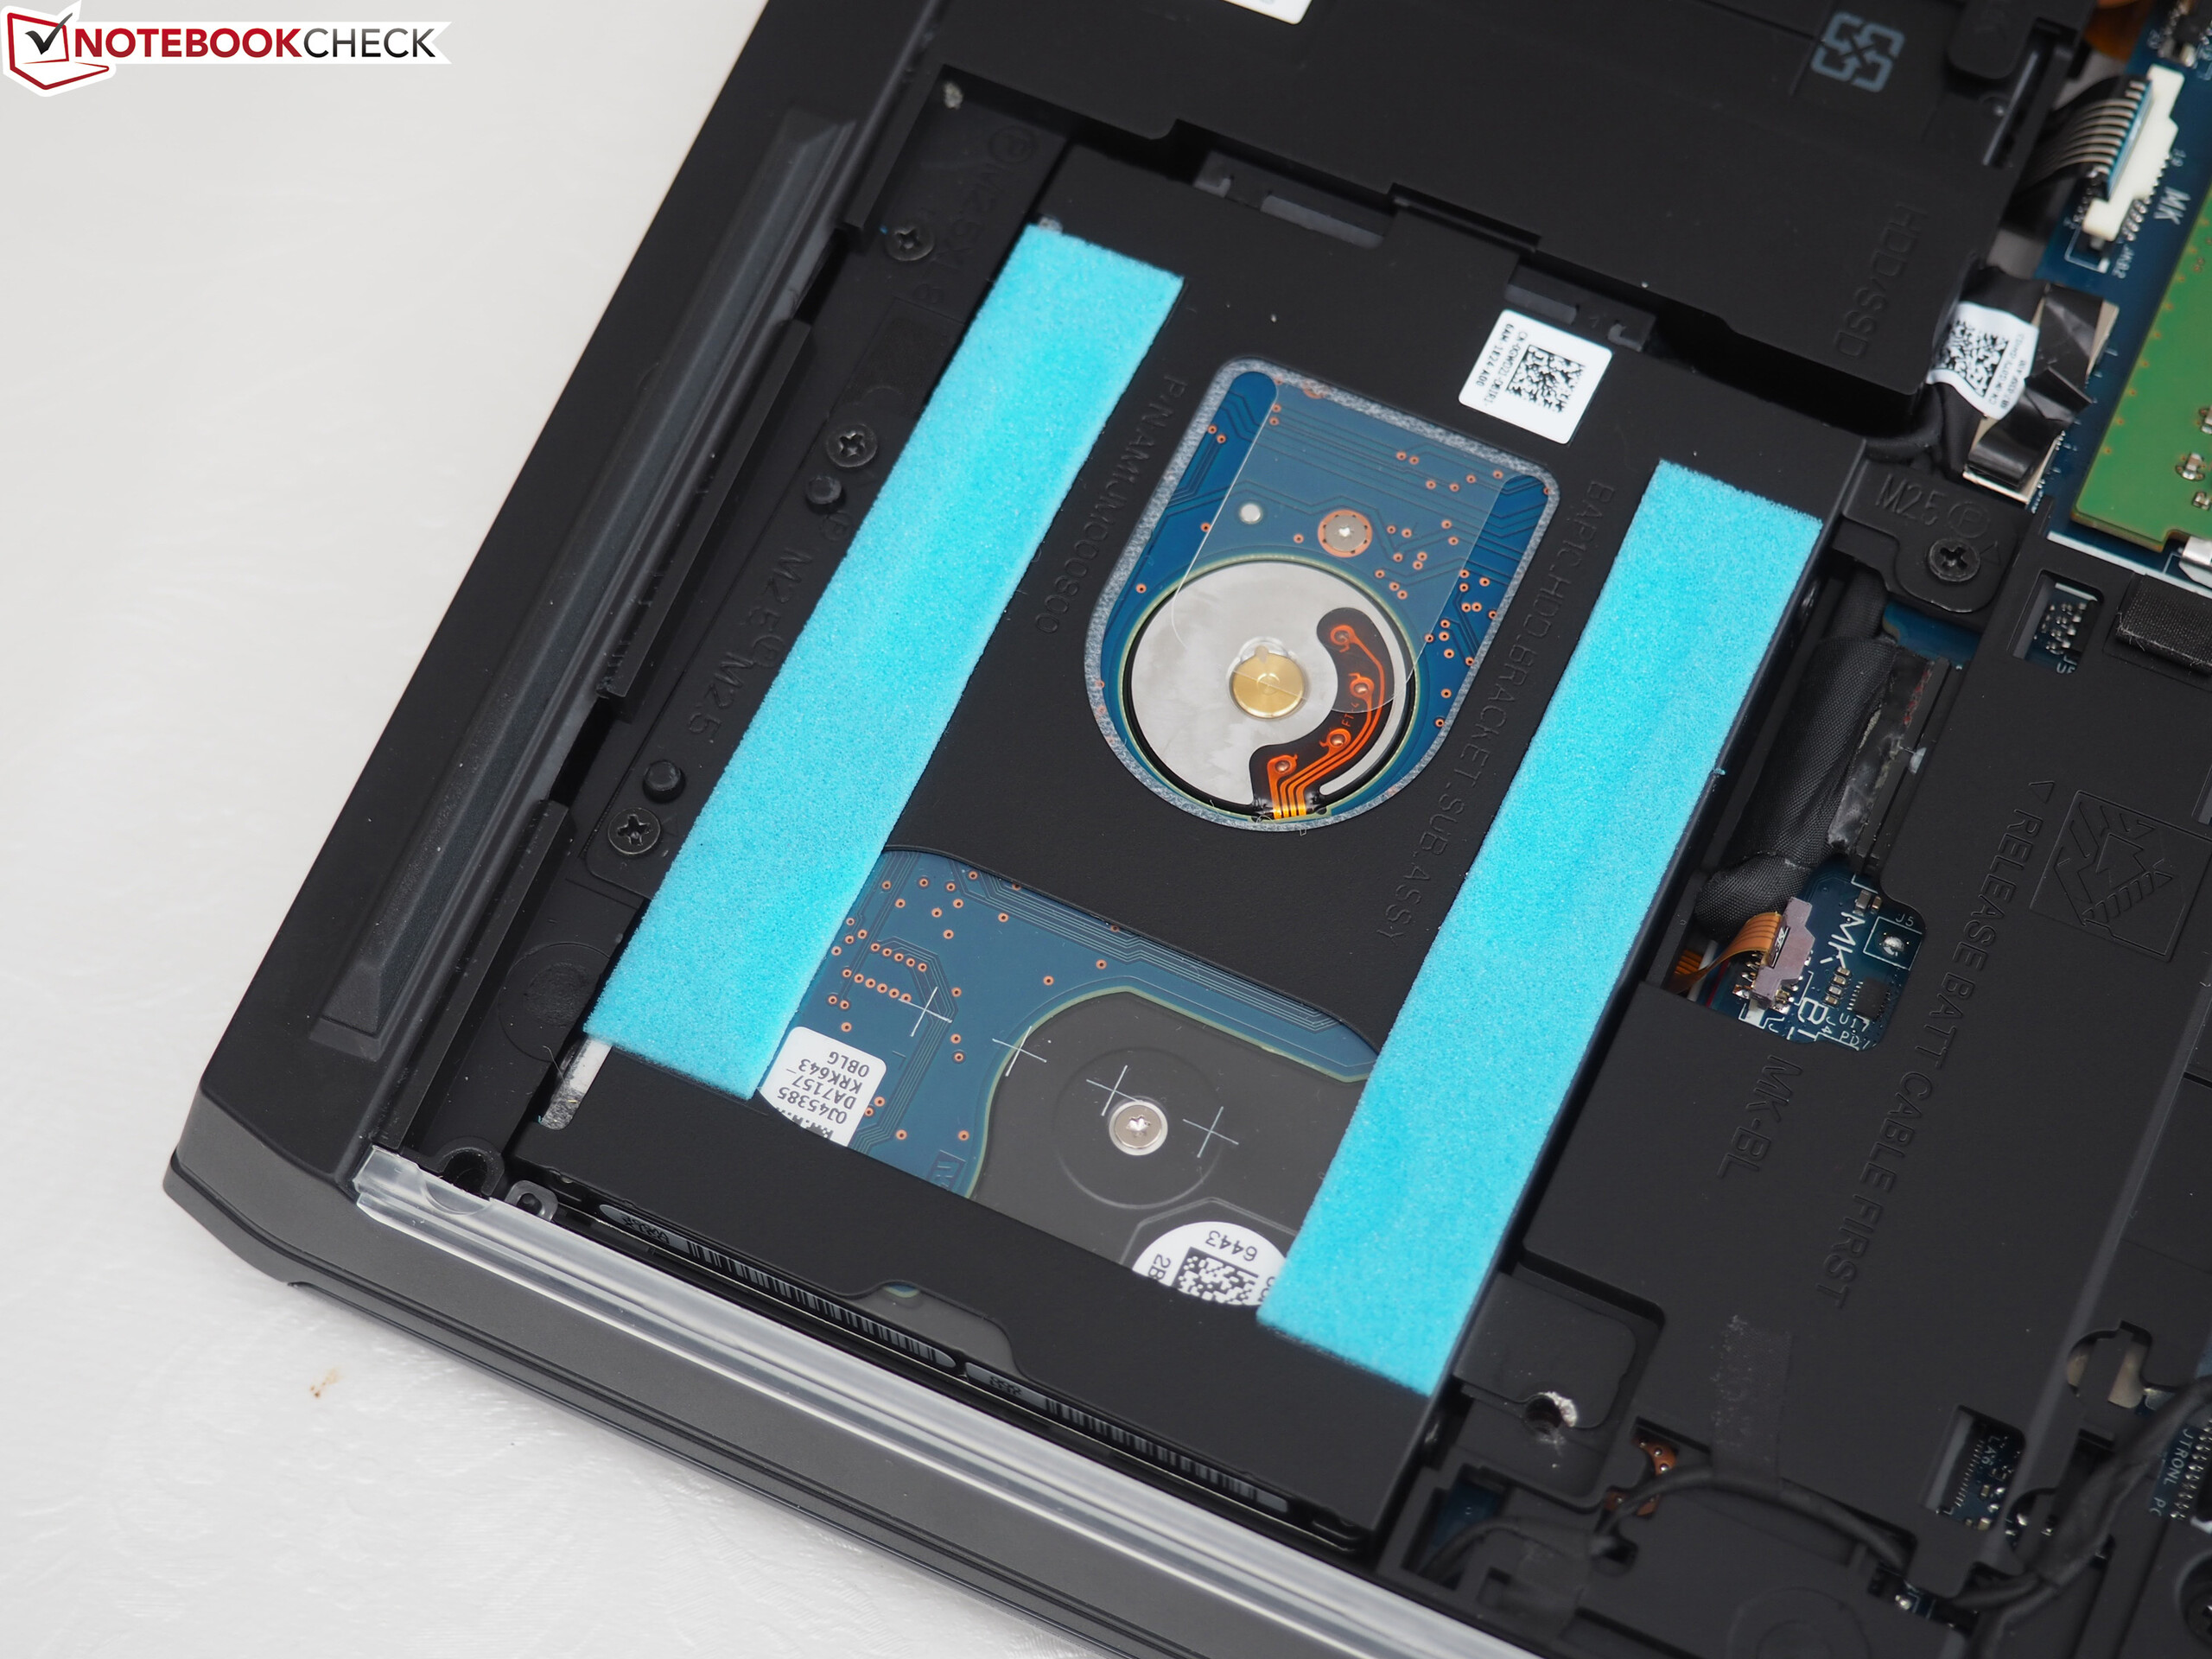
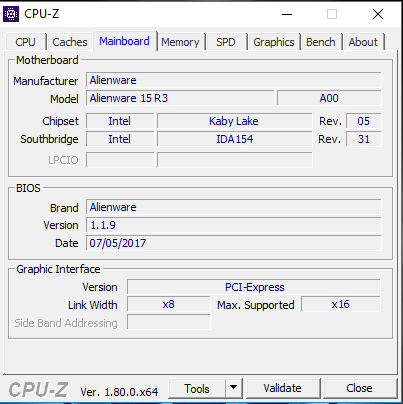
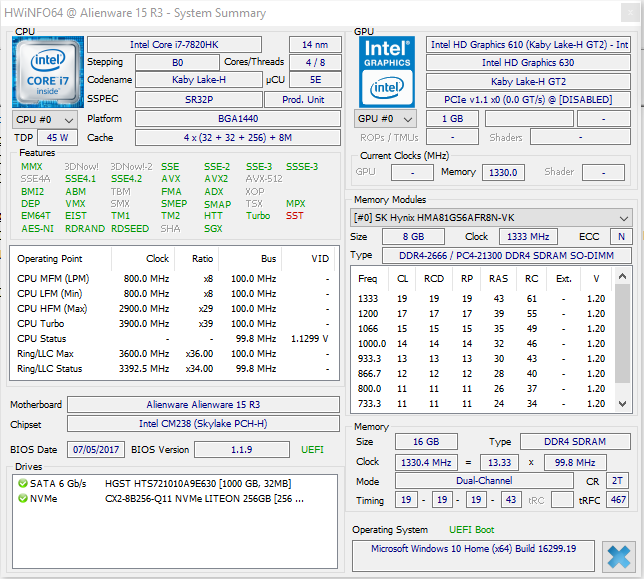
NVMe固态硬盘快如疾风,保证了系统的稳定运行。该机同样配备了1TB的机械硬盘。所有的存储单元都可以被更换。而电池,在该性能水平下,可以说是非常优秀。
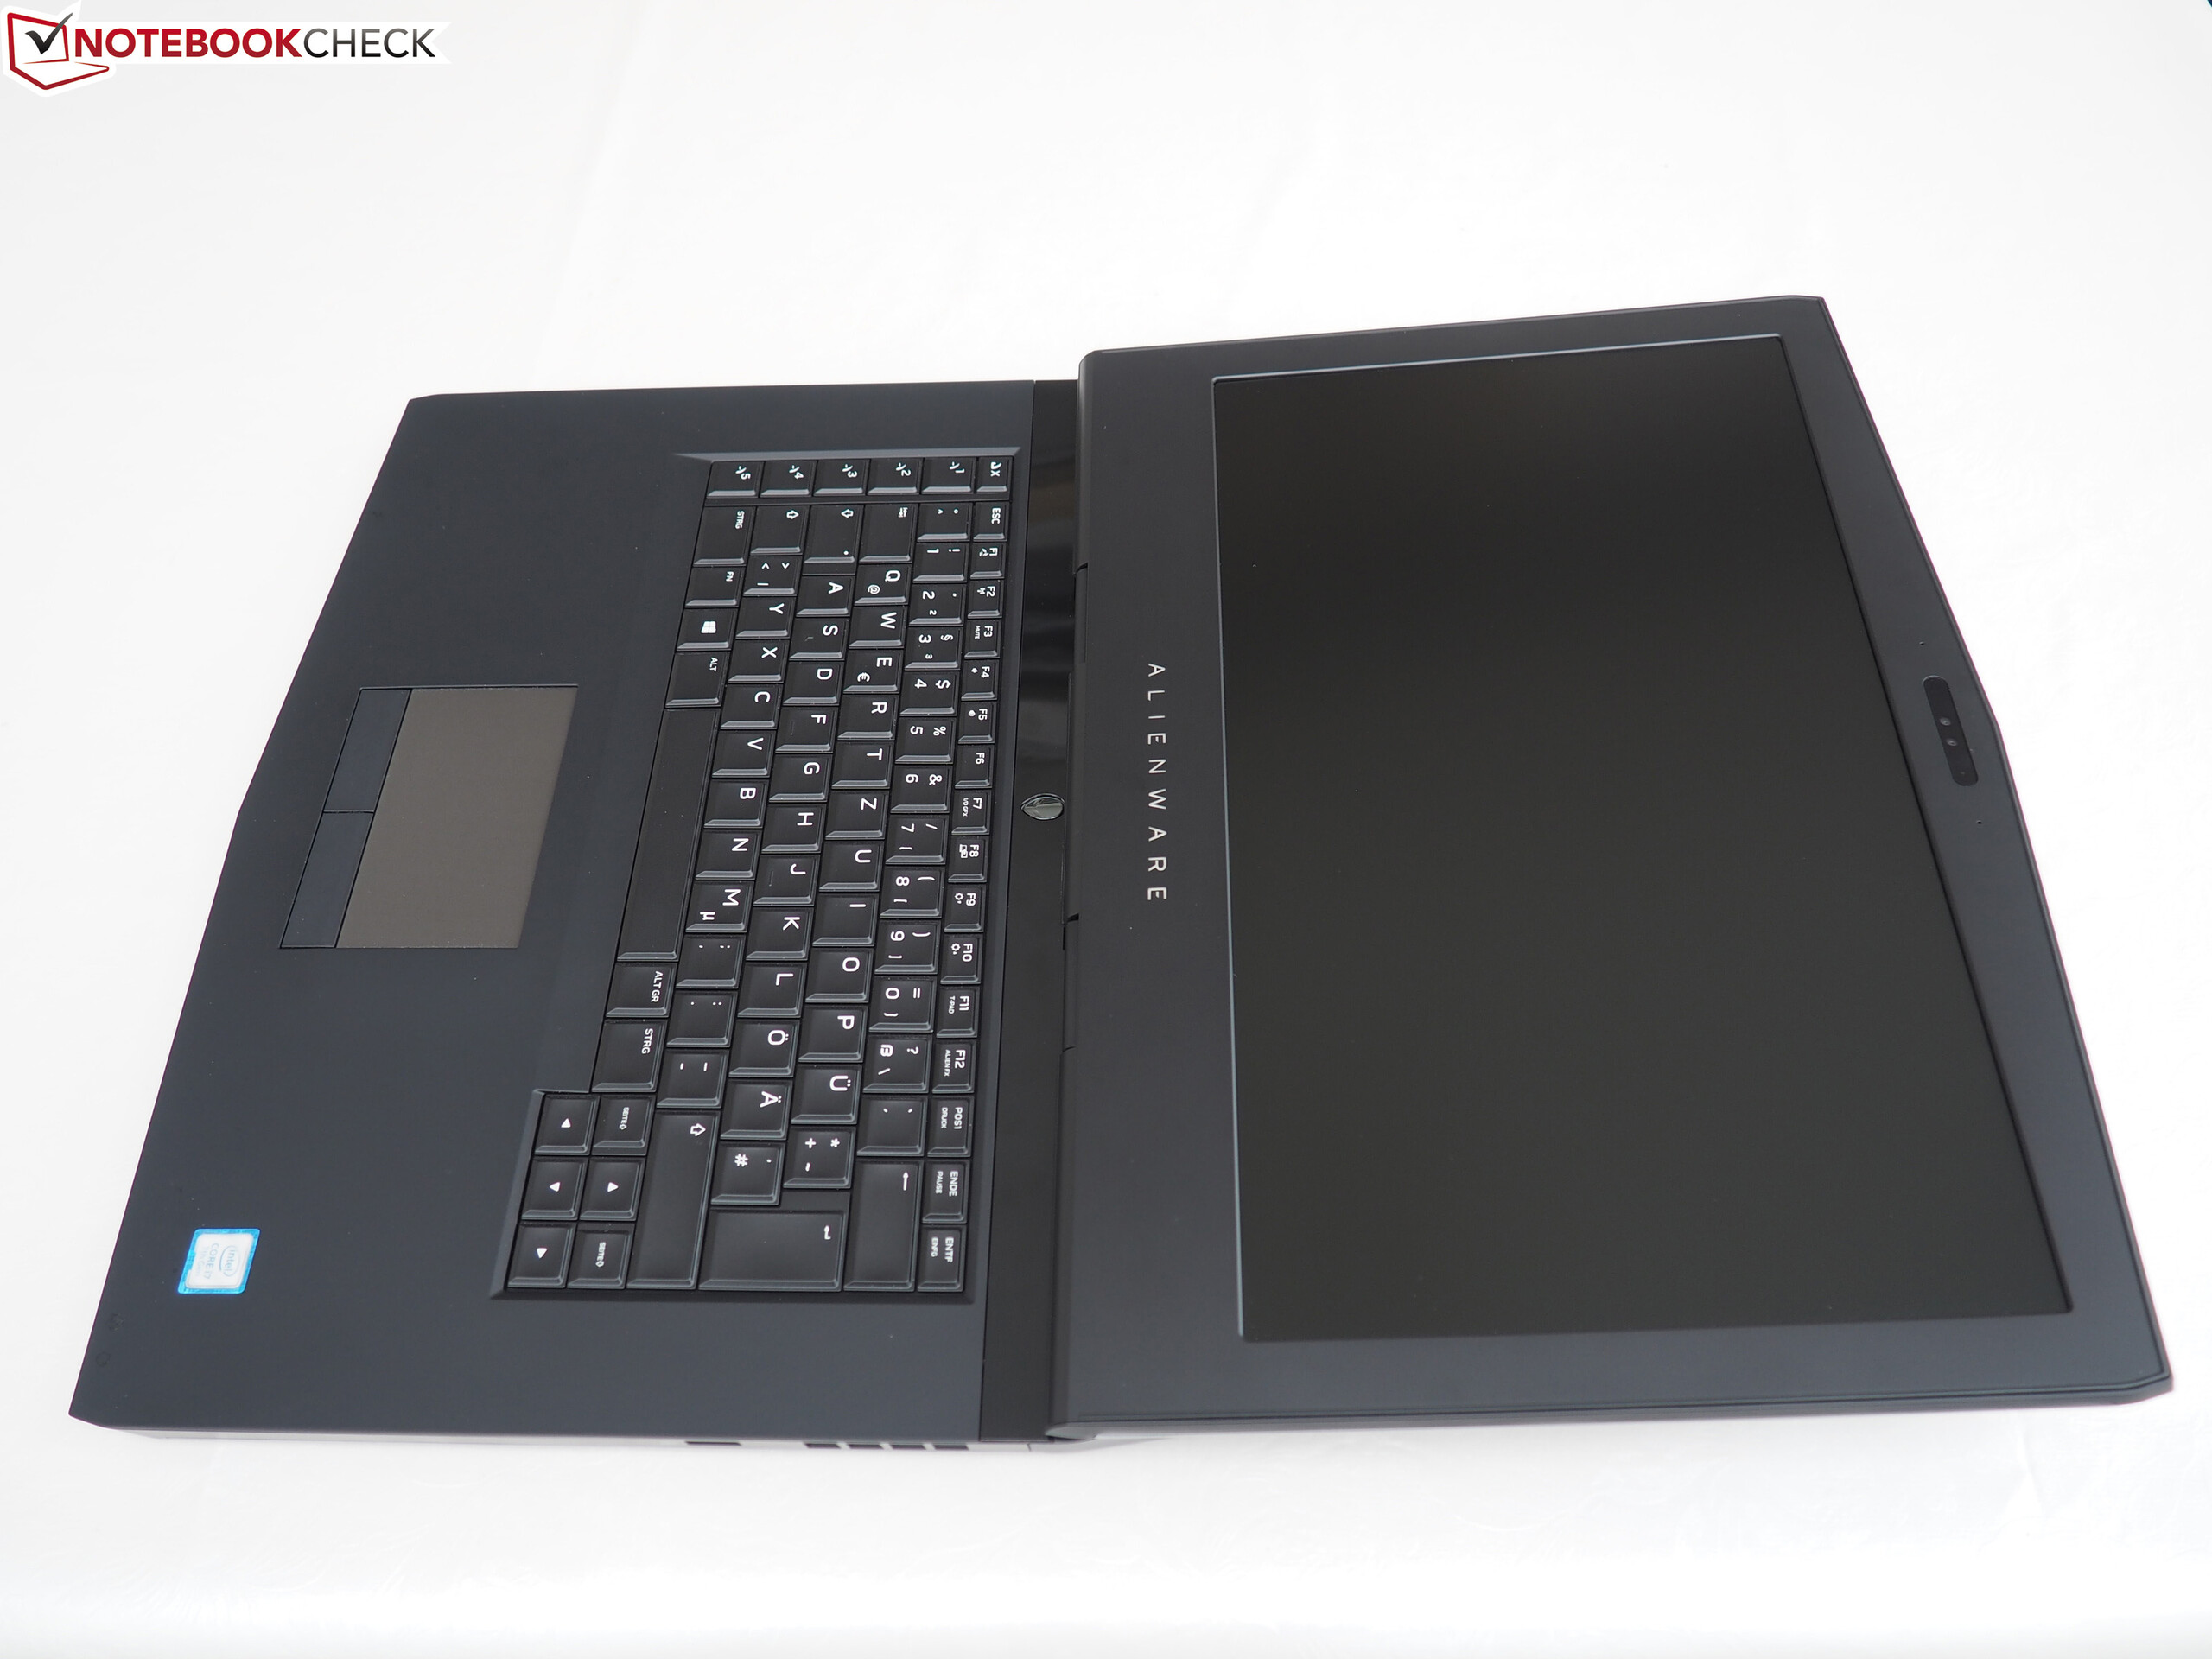
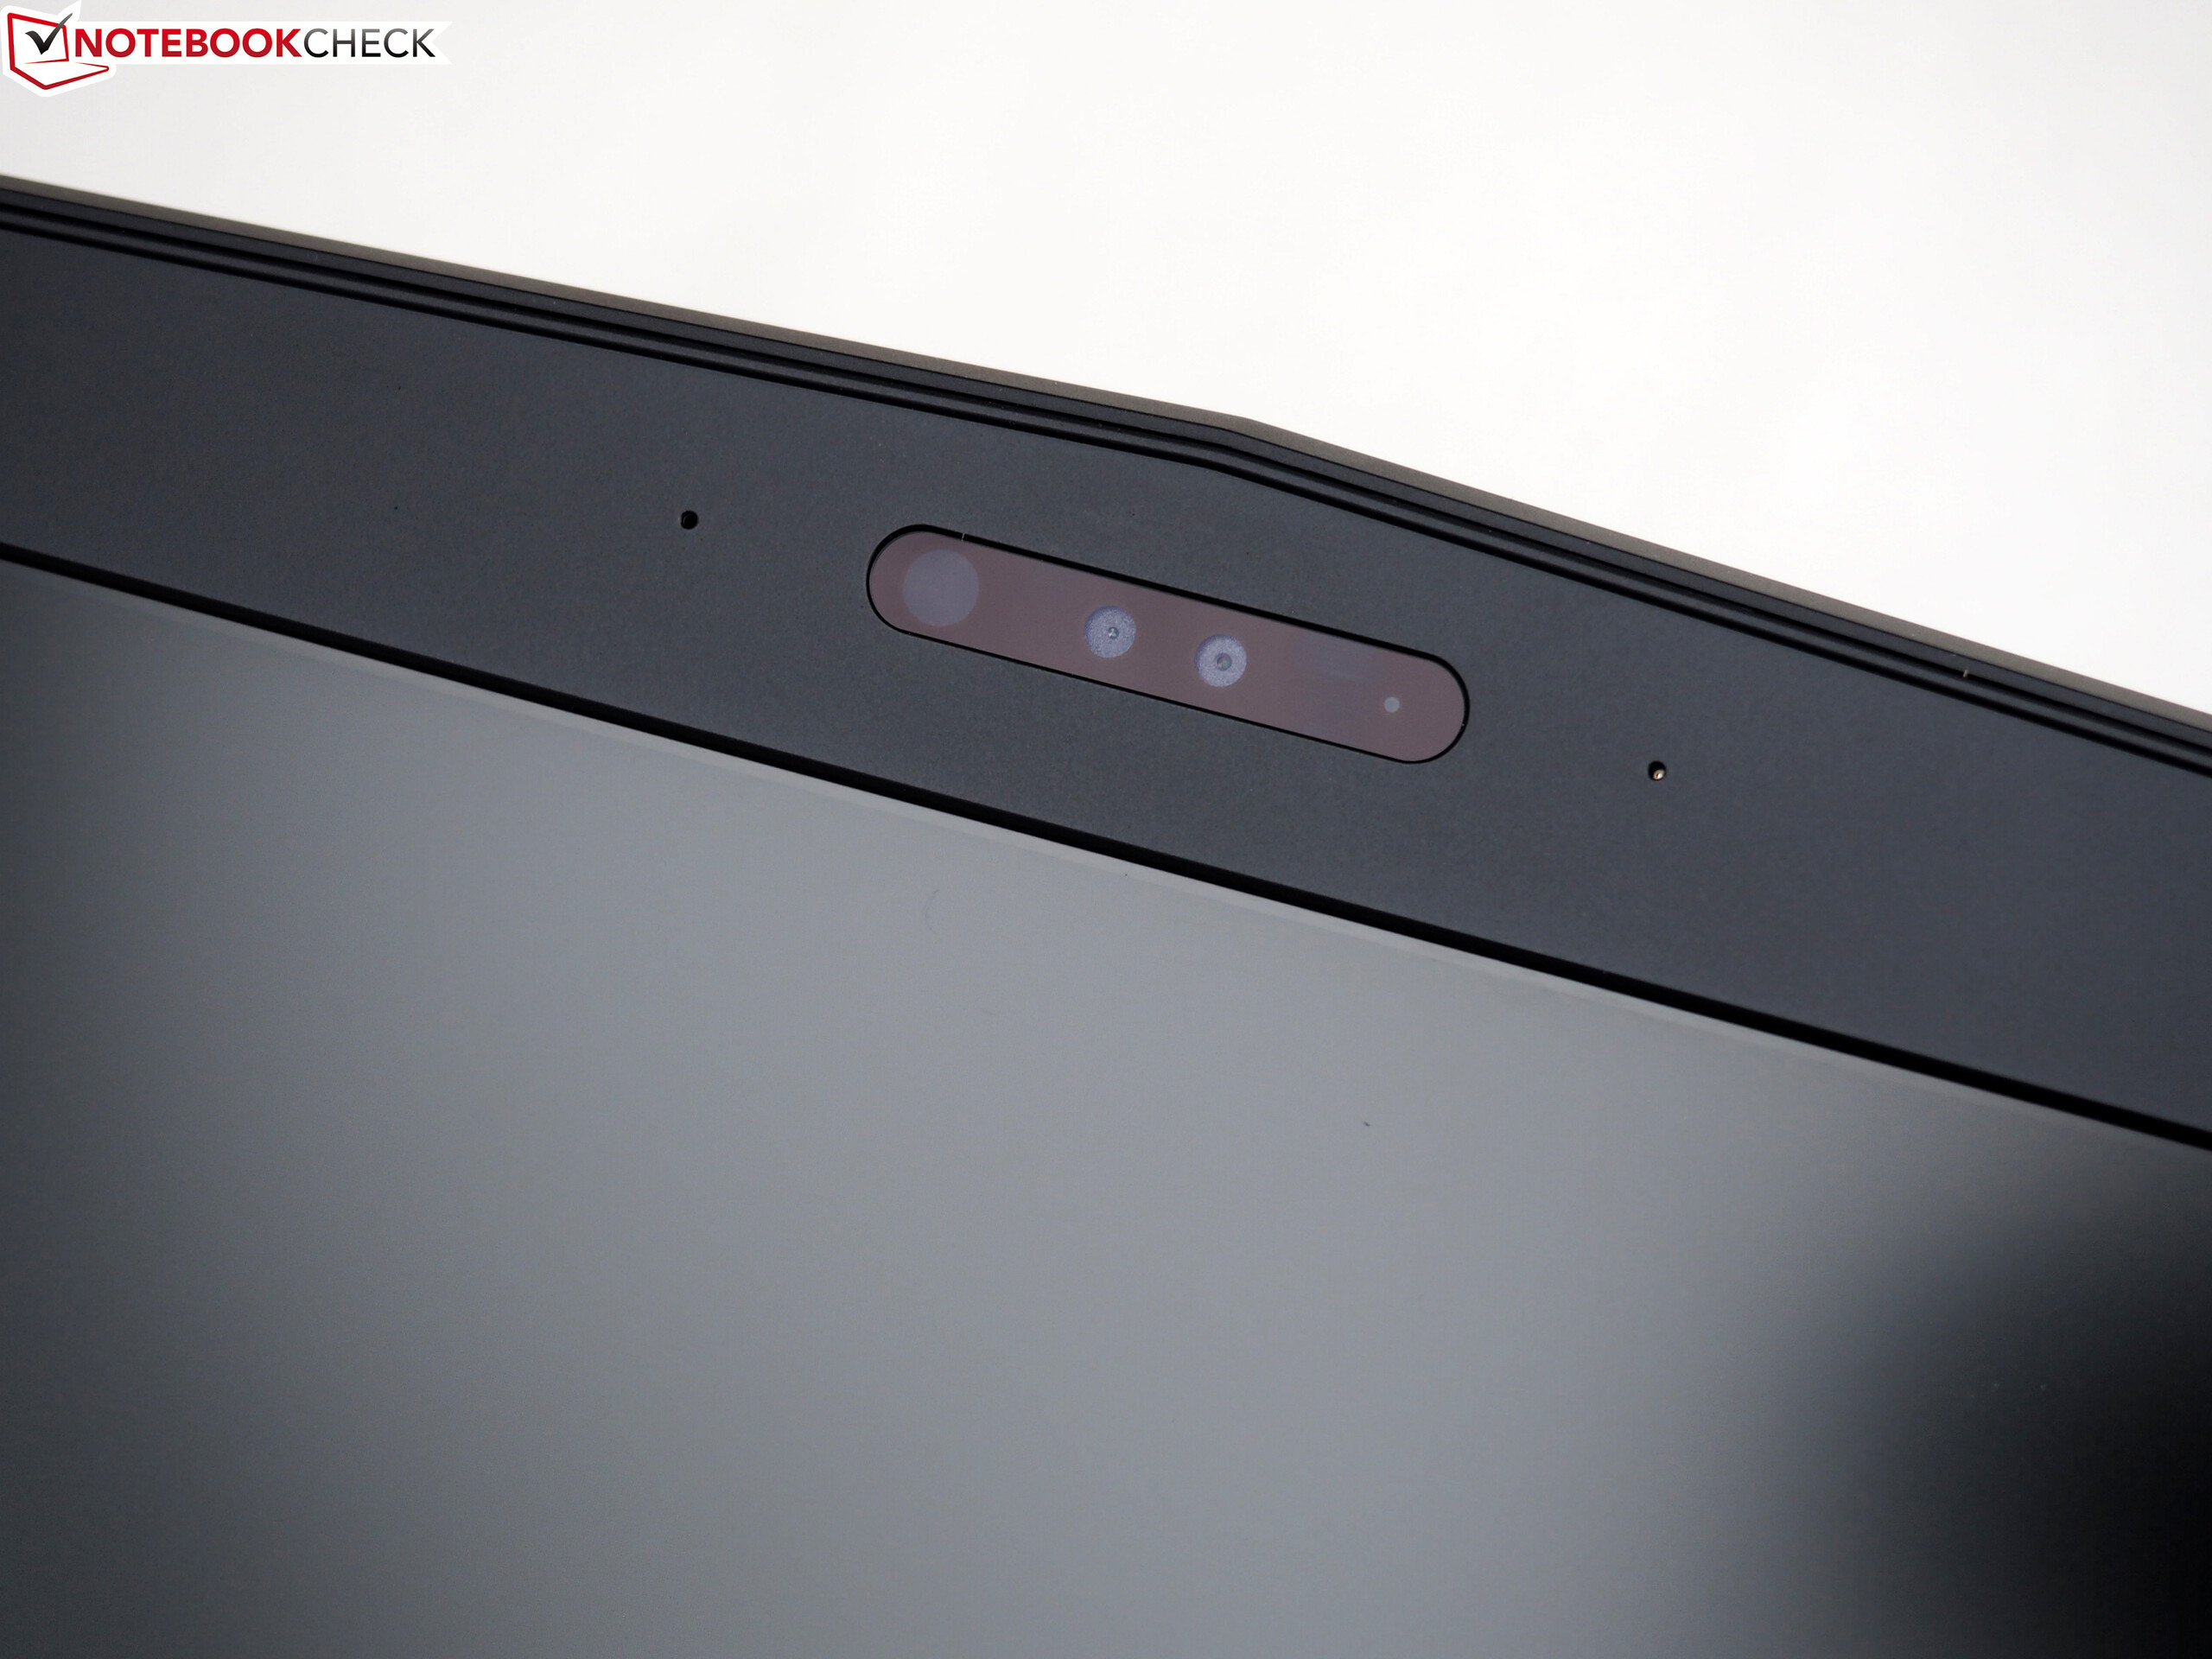
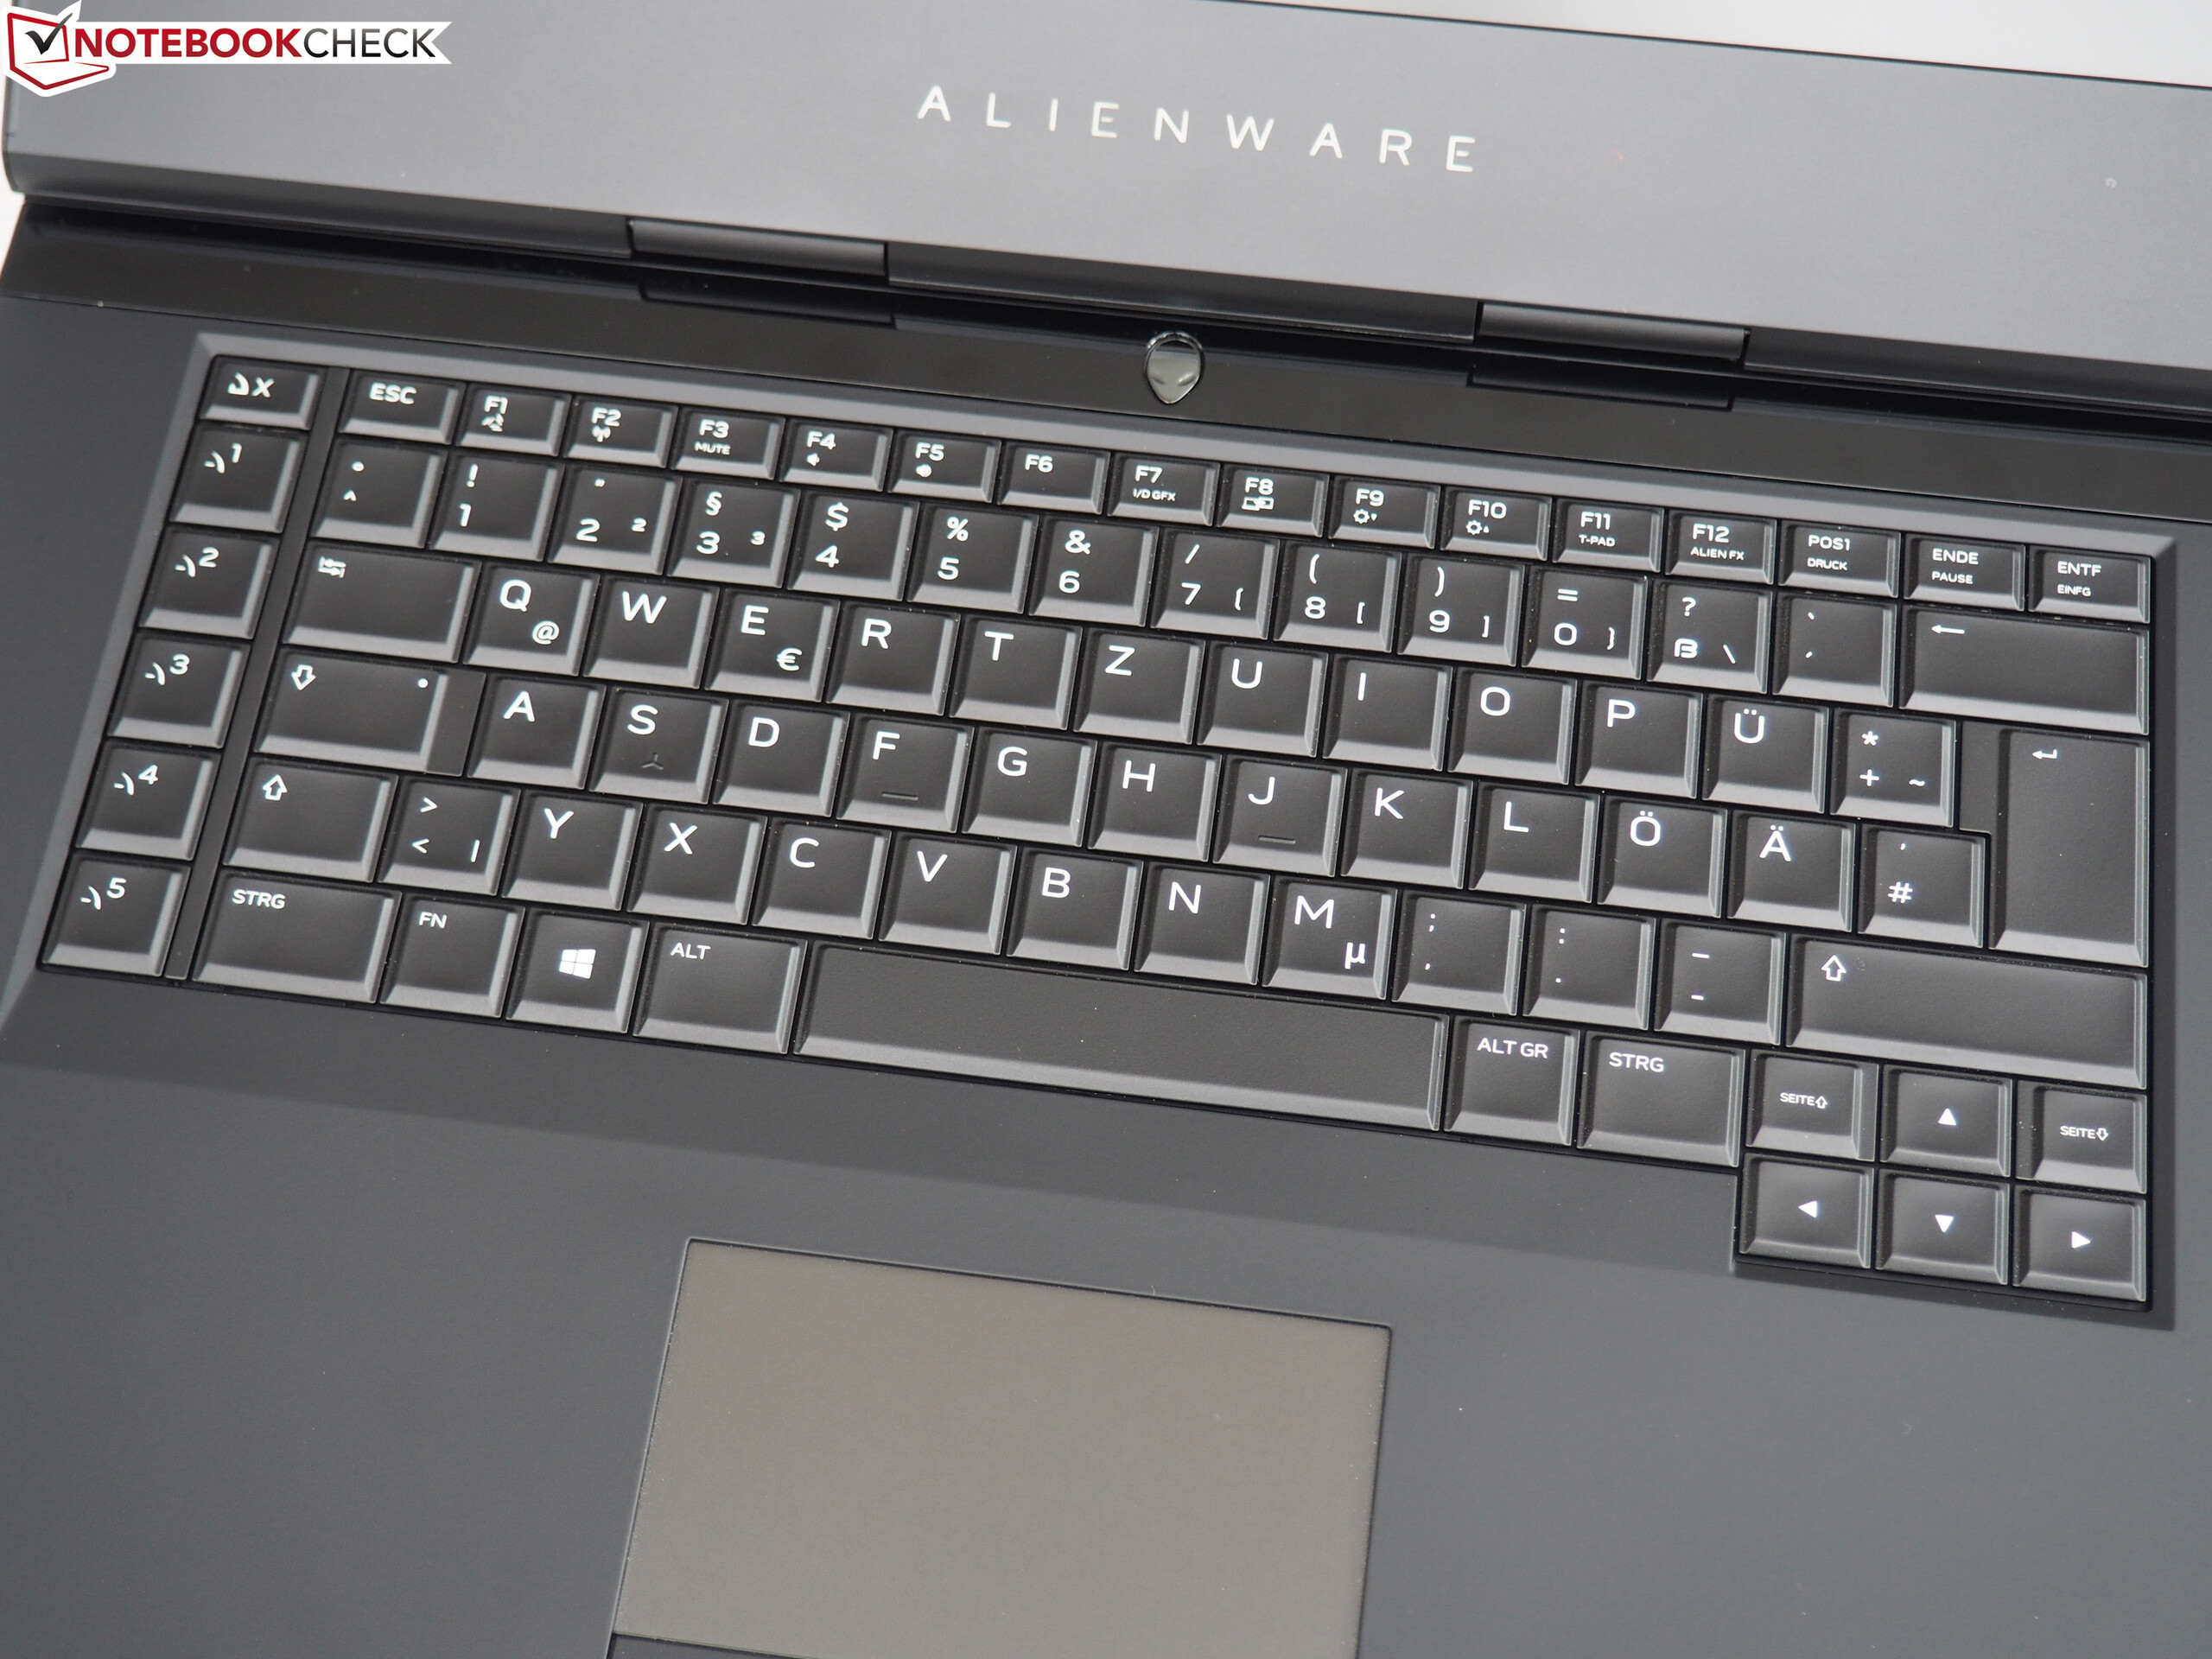
与已经测试过的15 R3型号相比,该机的显示屏也有了显着的改变。虽然姊妹机型配备了120Hz的TN面板,但我们目前的测试机只是配备了60Hz的IPS面板。哑光的15.6英寸显示屏具有稳定的视角,良好的对比度和足够的亮度。只是响应时间比TN面板的要长。
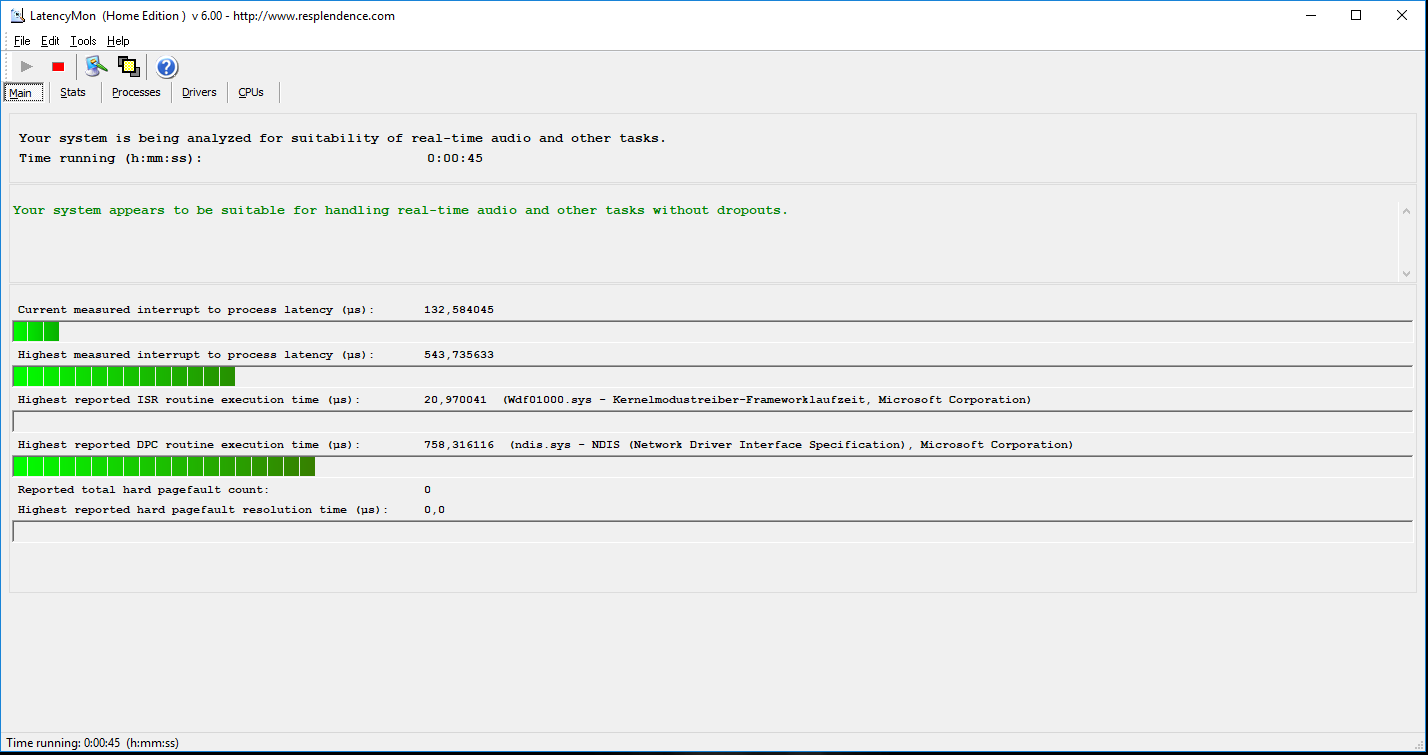
我们已经测试过的外星人 15 R3型号,在温度和系统噪音方面存在一个很大的问题:中央处理器无规律地升温。这在新机型中并没有发生,并且核心温度均匀。
注:本文是基于完整评测的缩减版本,阅读完整的英文评测,请点击这里。
Alienware 15 R3 Max-Q
- 10/27/2017 v6 (old)
Sascha Mölck