华硕 VivoBook Flip 12 TP203NAH (N4200, HD) 笔记本电脑简短评测
| Networking | |
| iperf3 transmit AX12 | |
| Dell Latitude 3189 | |
| Asus VivoBook Flip 12 TP203NAH-BP049T | |
| ODYS Vario Pro 12 | |
| iperf3 receive AX12 | |
| Dell Latitude 3189 | |
| Asus VivoBook Flip 12 TP203NAH-BP049T | |
| ODYS Vario Pro 12 | |
| |||||||||||||||||||||||||
Brightness Distribution: 65 %
Center on Battery: 253 cd/m²
Contrast: 1488:1 (Black: 0.17 cd/m²)
ΔE ColorChecker Calman: 3.17 | ∀{0.5-29.43 Ø4.71}
ΔE Greyscale Calman: 2 | ∀{0.09-98 Ø4.96}
66% sRGB (Argyll 1.6.3 3D)
42% AdobeRGB 1998 (Argyll 1.6.3 3D)
45.73% AdobeRGB 1998 (Argyll 3D)
66.3% sRGB (Argyll 3D)
44.23% Display P3 (Argyll 3D)
Gamma: 2.43
CCT: 6850 K
| Asus VivoBook Flip 12 TP203NAH-BP049T IPS, 1366x768, 11.6" | Dell Latitude 3189 IPS, 1366x768, 11.6" | ODYS Vario Pro 12 IPS, 1366x768, 11.6" | Medion Akoya E2215T IPS, 1920x1080, 11.6" | HP Pavilion 11-k103ng x360 IPS, 1366x768, 11.6" | |
|---|---|---|---|---|---|
| Display | 2% | 2% | 9% | 2% | |
| Display P3 Coverage (%) | 44.23 | 44.96 2% | 45.16 2% | 48.12 9% | 45.21 2% |
| sRGB Coverage (%) | 66.3 | 67.3 2% | 67.5 2% | 71.7 8% | 67.8 2% |
| AdobeRGB 1998 Coverage (%) | 45.73 | 46.49 2% | 46.71 2% | 49.78 9% | 46.73 2% |
| Response Times | -13% | -49% | 9% | 30% | |
| Response Time Grey 50% / Grey 80% * (ms) | 39 ? | 40 ? -3% | 60 ? -54% | 31 ? 21% | 18.8 ? 52% |
| Response Time Black / White * (ms) | 25 ? | 30.4 ? -22% | 36 ? -44% | 26 ? -4% | 23.2 ? 7% |
| PWM Frequency (Hz) | 50 ? | ||||
| Screen | 9% | -41% | -15% | -6% | |
| Brightness middle (cd/m²) | 253 | 291 15% | 282 11% | 338 34% | 194 -23% |
| Brightness (cd/m²) | 245 | 284 16% | 250 2% | 309 26% | 186 -24% |
| Brightness Distribution (%) | 65 | 92 42% | 74 14% | 76 17% | 86 32% |
| Black Level * (cd/m²) | 0.17 | 0.16 6% | 0.37 -118% | 0.39 -129% | 0.22 -29% |
| Contrast (:1) | 1488 | 1819 22% | 762 -49% | 867 -42% | 882 -41% |
| Colorchecker dE 2000 * | 3.17 | 3.4 -7% | 5.63 -78% | 3.94 -24% | 3.06 3% |
| Colorchecker dE 2000 max. * | 8.13 | 9.6 -18% | 11.28 -39% | 9.96 -23% | 8.81 -8% |
| Greyscale dE 2000 * | 2 | 1.8 10% | 5.04 -152% | 2.54 -27% | 1.42 29% |
| Gamma | 2.43 91% | 2.14 103% | 2.19 100% | 2.38 92% | 2.34 94% |
| CCT | 6850 95% | 6544 99% | 7254 90% | 6902 94% | 6432 101% |
| Color Space (Percent of AdobeRGB 1998) (%) | 42 | 42.8 2% | 43 2% | 46 10% | 42.98 2% |
| Color Space (Percent of sRGB) (%) | 66 | 67 2% | 67 2% | 71 8% | 67.56 2% |
| Total Average (Program / Settings) | -1% /
5% | -29% /
-33% | 1% /
-7% | 9% /
1% |
* ... smaller is better
Screen Flickering / PWM (Pulse-Width Modulation)
| Screen flickering / PWM not detected | ||
In comparison: 52 % of all tested devices do not use PWM to dim the display. If PWM was detected, an average of 7754 (minimum: 5 - maximum: 343500) Hz was measured. | ||
Display Response Times
| ↔ Response Time Black to White | ||
|---|---|---|
| 25 ms ... rise ↗ and fall ↘ combined | ↗ 13 ms rise | 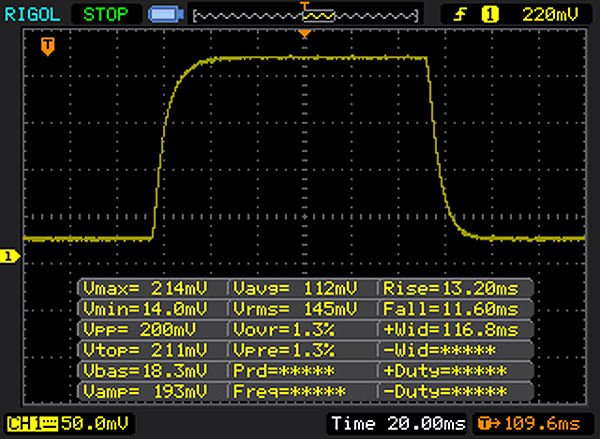 |
| ↘ 12 ms fall | ||
| The screen shows relatively slow response rates in our tests and may be too slow for gamers. In comparison, all tested devices range from 0.1 (minimum) to 240 (maximum) ms. » 59 % of all devices are better. This means that the measured response time is worse than the average of all tested devices (19.8 ms). | ||
| ↔ Response Time 50% Grey to 80% Grey | ||
| 39 ms ... rise ↗ and fall ↘ combined | ↗ 18 ms rise | 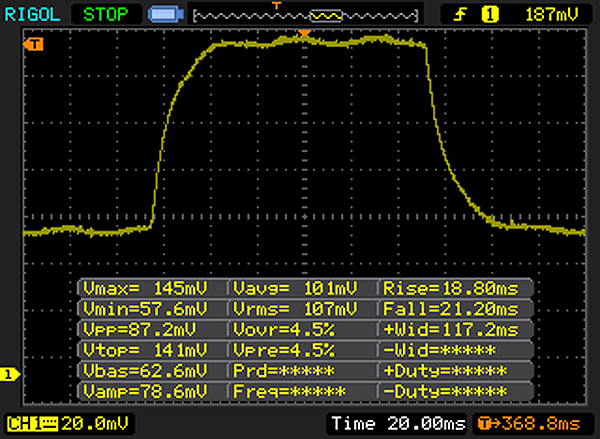 |
| ↘ 21 ms fall | ||
| The screen shows slow response rates in our tests and will be unsatisfactory for gamers. In comparison, all tested devices range from 0.165 (minimum) to 636 (maximum) ms. » 59 % of all devices are better. This means that the measured response time is worse than the average of all tested devices (31 ms). | ||
| Cinebench R15 | |
| CPU Single 64Bit | |
| Asus VivoBook Flip 12 TP203NAH-BP049T | |
| Dell Latitude 3180 | |
| Dell Latitude 3189 | |
| HP Pavilion 11-k103ng x360 | |
| CPU Multi 64Bit | |
| Dell Latitude 3180 | |
| Dell Latitude 3189 | |
| Asus VivoBook Flip 12 TP203NAH-BP049T | |
| HP Pavilion 11-k103ng x360 | |
| Cinebench R10 | |
| Rendering Multiple CPUs 32Bit | |
| Dell Latitude 3180 | |
| Dell Latitude 3189 | |
| Asus VivoBook Flip 12 TP203NAH-BP049T | |
| ODYS Vario Pro 12 | |
| Medion Akoya E2215T | |
| Rendering Single 32Bit | |
| Asus VivoBook Flip 12 TP203NAH-BP049T | |
| Dell Latitude 3180 | |
| Dell Latitude 3189 | |
| Medion Akoya E2215T | |
| ODYS Vario Pro 12 | |
| Geekbench 3 | |
| 32 Bit Multi-Core Score | |
| Dell Latitude 3180 | |
| Asus VivoBook Flip 12 TP203NAH-BP049T | |
| ODYS Vario Pro 12 | |
| Medion Akoya E2215T | |
| 32 Bit Single-Core Score | |
| Asus VivoBook Flip 12 TP203NAH-BP049T | |
| Dell Latitude 3180 | |
| ODYS Vario Pro 12 | |
| Medion Akoya E2215T | |
| Geekbench 4.0 | |
| 64 Bit Multi-Core Score | |
| Dell Latitude 3180 | |
| Asus VivoBook Flip 12 TP203NAH-BP049T | |
| 64 Bit Single-Core Score | |
| Asus VivoBook Flip 12 TP203NAH-BP049T | |
| Dell Latitude 3180 | |
| Geekbench 4.4 | |
| 64 Bit Multi-Core Score | |
| Asus VivoBook Flip 12 TP203NAH-BP049T | |
| Dell Latitude 3180 | |
| 64 Bit Single-Core Score | |
| Asus VivoBook Flip 12 TP203NAH-BP049T | |
| Dell Latitude 3180 | |
| JetStream 1.1 - 1.1 Total | |
| Asus VivoBook Flip 12 TP203NAH-BP049T | |
| Dell Latitude 3180 | |
| Dell Latitude 3189 | |
| ODYS Vario Pro 12 | |
| HP Pavilion 11-k103ng x360 | |
| Medion Akoya E2215T | |
| PCMark 8 Home Score Accelerated v2 | 2094 points | |
Help | ||
| PCMark 8 - Home Score Accelerated v2 | |
| Dell Latitude 3189 | |
| Asus VivoBook Flip 12 TP203NAH-BP049T | |
| HP Pavilion 11-k103ng x360 | |
| ODYS Vario Pro 12 | |
| Medion Akoya E2215T | |

| Asus VivoBook Flip 12 TP203NAH-BP049T Seagate Mobile HDD 1TB ST1000LM035 | Dell Latitude 3189 Liteonit CV3-8D128 | ODYS Vario Pro 12 32 GB eMMC Flash | Medion Akoya E2215T 64 GB eMMC Flash | HP Pavilion 11-k103ng x360 Hitachi Travelstar Z5K500 HTS545050A7E680 | |
|---|---|---|---|---|---|
| CrystalDiskMark 3.0 | 7181% | 1851% | 1279% | 68% | |
| Read Seq (MB/s) | 53.9 | 408.4 658% | 168.3 212% | 169.6 215% | 106 97% |
| Write Seq (MB/s) | 66.4 | 214.3 223% | 43.13 -35% | 39.77 -40% | 106.1 60% |
| Read 512 (MB/s) | 22.62 | 243.7 977% | 155 585% | 155.3 587% | 33.53 48% |
| Write 512 (MB/s) | 67.3 | 170.6 153% | 33.71 -50% | 27.45 -59% | 39.03 -42% |
| Read 4k (MB/s) | 0.378 | 8.864 2245% | 15.91 4109% | 13.09 3363% | 0.407 8% |
| Write 4k (MB/s) | 0.263 | 49.14 18584% | 11.64 4326% | 7.915 2910% | 1.026 290% |
| Read 4k QD32 (MB/s) | 0.998 | 132.2 13146% | 32.2 3126% | 15.11 1414% | 0.898 -10% |
| Write 4k QD32 (MB/s) | 0.518 | 111.7 21464% | 13.65 2535% | 10.05 1840% | 1.003 94% |
| 3DMark 11 Performance | 672 points | |
Help | ||
| 3DMark 11 - 1280x720 Performance GPU | |
| Dell Latitude 3189 | |
| Asus VivoBook Flip 12 TP203NAH-BP049T | |
| HP Pavilion 11-k103ng x360 | |
| ODYS Vario Pro 12 | |
| Medion Akoya E2215T | |
| low | med. | high | ultra | |
|---|---|---|---|---|
| World of Warcraft (2005) | 62.3 | 25.2 | ||
| BioShock Infinite (2013) | 25.4 | 14.4 | 11.5 | |
| Risen 3: Titan Lords (2014) | 14.2 | 9.3 | ||
| GTA V (2015) | 9.5 | 4.3 | ||
| Far Cry Primal (2016) | 3 | |||
| Civilization 6 (2016) | 9.7 | |||
| Titanfall 2 (2016) | 2.3 | |||
| Prey (2017) | 5.4 | |||
| Rocket League (2017) | 26.6 | |||
| Dirt 4 (2017) | 14.7 |
Noise level
| Idle |
| 31.7 / 31.7 / 31.7 dB(A) |
| HDD |
| 32.3 dB(A) |
| Load |
| 31.7 / 31.7 dB(A) |
 | ||
30 dB silent 40 dB(A) audible 50 dB(A) loud |
||
min: | ||
(-) The maximum temperature on the upper side is 45.2 °C / 113 F, compared to the average of 35.4 °C / 96 F, ranging from 19.6 to 60 °C for the class Convertible.
(-) The bottom heats up to a maximum of 50.4 °C / 123 F, compared to the average of 36.9 °C / 98 F
(+) In idle usage, the average temperature for the upper side is 29.4 °C / 85 F, compared to the device average of 30.3 °C / 87 F.
(+) The palmrests and touchpad are reaching skin temperature as a maximum (33.8 °C / 92.8 F) and are therefore not hot.
(-) The average temperature of the palmrest area of similar devices was 28 °C / 82.4 F (-5.8 °C / -10.4 F).
Asus VivoBook Flip 12 TP203NAH-BP049T audio analysis
(-) | not very loud speakers (66 dB)
Bass 100 - 315 Hz
(-) | nearly no bass - on average 20.4% lower than median
(±) | linearity of bass is average (10.9% delta to prev. frequency)
Mids 400 - 2000 Hz
(+) | balanced mids - only 3.6% away from median
(+) | mids are linear (6.5% delta to prev. frequency)
Highs 2 - 16 kHz
(+) | balanced highs - only 1.2% away from median
(+) | highs are linear (4.9% delta to prev. frequency)
Overall 100 - 16.000 Hz
(±) | linearity of overall sound is average (20% difference to median)
Compared to same class
» 50% of all tested devices in this class were better, 7% similar, 43% worse
» The best had a delta of 6%, average was 20%, worst was 57%
Compared to all devices tested
» 51% of all tested devices were better, 8% similar, 41% worse
» The best had a delta of 4%, average was 23%, worst was 134%
Apple MacBook 12 (Early 2016) 1.1 GHz audio analysis
(+) | speakers can play relatively loud (83.6 dB)
Bass 100 - 315 Hz
(±) | reduced bass - on average 11.3% lower than median
(±) | linearity of bass is average (14.2% delta to prev. frequency)
Mids 400 - 2000 Hz
(+) | balanced mids - only 2.4% away from median
(+) | mids are linear (5.5% delta to prev. frequency)
Highs 2 - 16 kHz
(+) | balanced highs - only 2% away from median
(+) | highs are linear (4.5% delta to prev. frequency)
Overall 100 - 16.000 Hz
(+) | overall sound is linear (10.2% difference to median)
Compared to same class
» 7% of all tested devices in this class were better, 2% similar, 90% worse
» The best had a delta of 5%, average was 18%, worst was 53%
Compared to all devices tested
» 5% of all tested devices were better, 1% similar, 94% worse
» The best had a delta of 4%, average was 23%, worst was 134%
| Off / Standby | |
| Idle | |
| Load |
|
Key:
min: | |
| Battery Runtime - WiFi Websurfing | |
| Dell Latitude 3189 | |
| Medion Akoya E2215T | |
| ODYS Vario Pro 12 | |
| Asus VivoBook Flip 12 TP203NAH-BP049T | |
| HP Pavilion 11-k103ng x360 | |
Pros
Cons
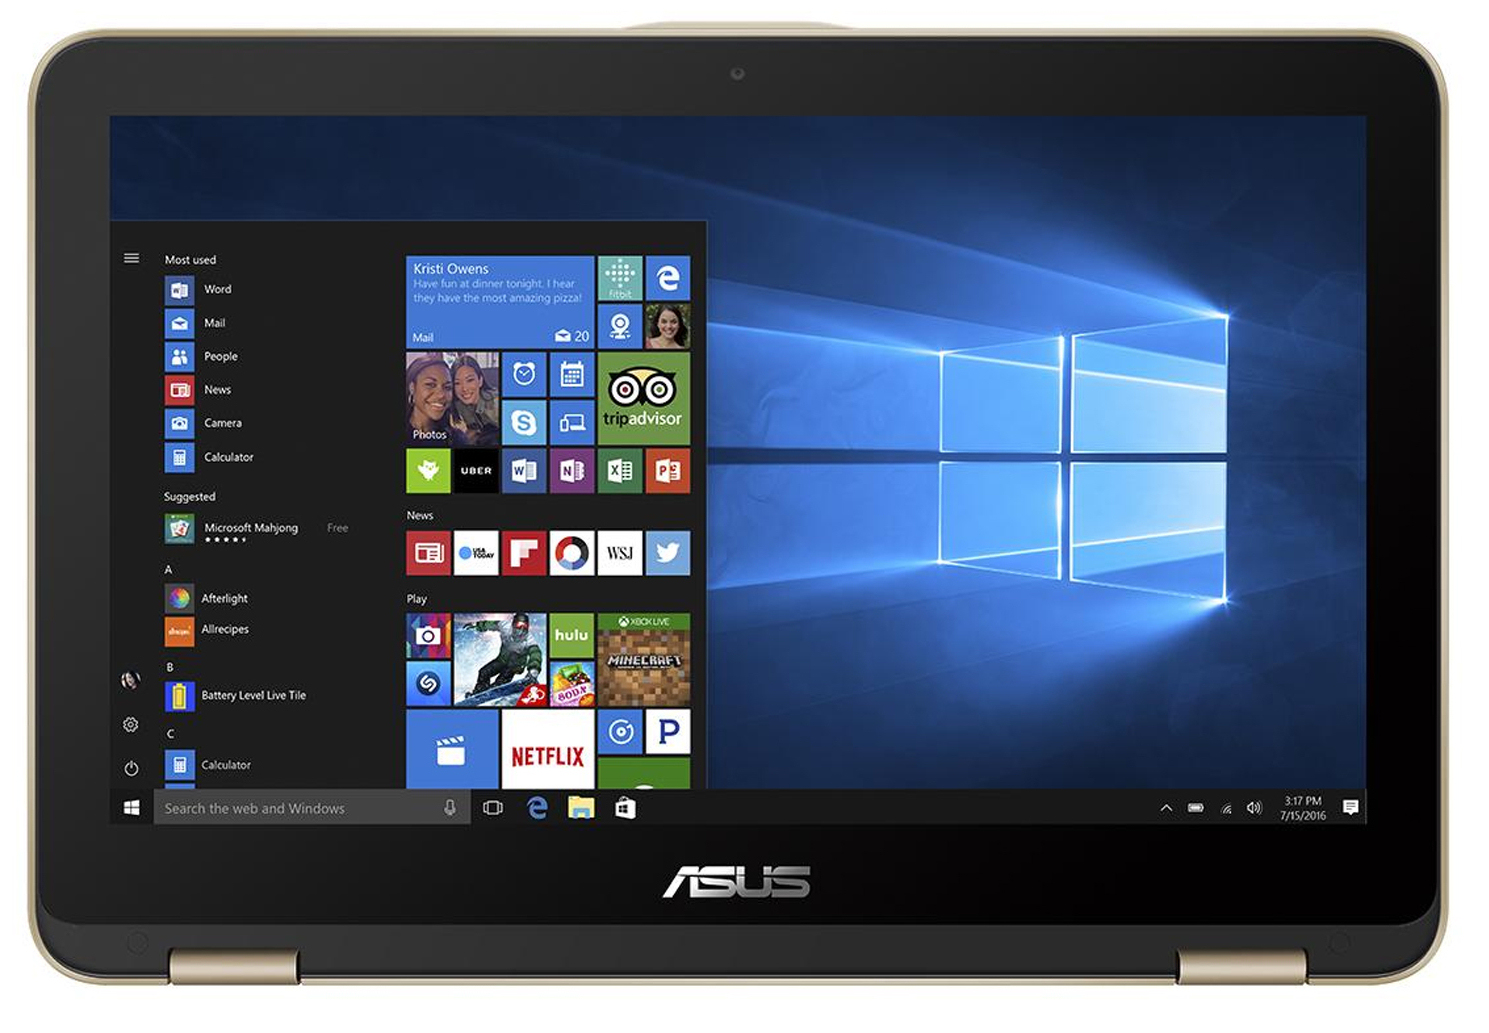
华硕发布了一台11.6英寸规格的变形本,VivoBook Flip 12 TP203NAH。内置的 Apollo Lake 处理器为办公和上网功能提供了足够的性能支持。鉴于,解码器集成于显卡中,该机可以播放大部分的视频格式,可以作为一个较好的家用电视视频播放设备。
显示屏留下了一个复杂的印象。华硕提供的这个高对比度屏幕,拥有这稳定的视角,但是亮度缺稍显不足。
The VivoBook Flip 12 主要用于家庭使用。
1-TB 硬盘的存在,使得电脑不缺存储空间。然而,一个小容量的固态硬盘可能会是更好的选择。特别是当电脑的处理器较弱时,固态硬盘和机械硬盘的差别在日常使用中就变明显了。用户需要自行安装固态硬盘。可惜,这更换过程显得并不容易。华硕也不提供配备固态硬盘的该机型。
电池续航时间勉强算是中等水平:在我们的无线连接测试中,该设备的续航时间是6小时5分钟。如果该机只是在家中的客厅使用,那么电池容量是够用的。但如果是在户外使用,用户必须随身携带电源适配器。而搭载相同硬件水平和电池容量的Dell Latitude 3189,却多了4小时的续航时间。
最后,需要提下售价。该机价格是500欧(约560美元),这价格对于一个简单的变形本来说太贵了。此外,该机的看起来没有比同等价位的其他笔记本好。
Asus VivoBook Flip 12 TP203NAH-BP049T
- 06/16/2017 v6 (old)
Sascha Mölck