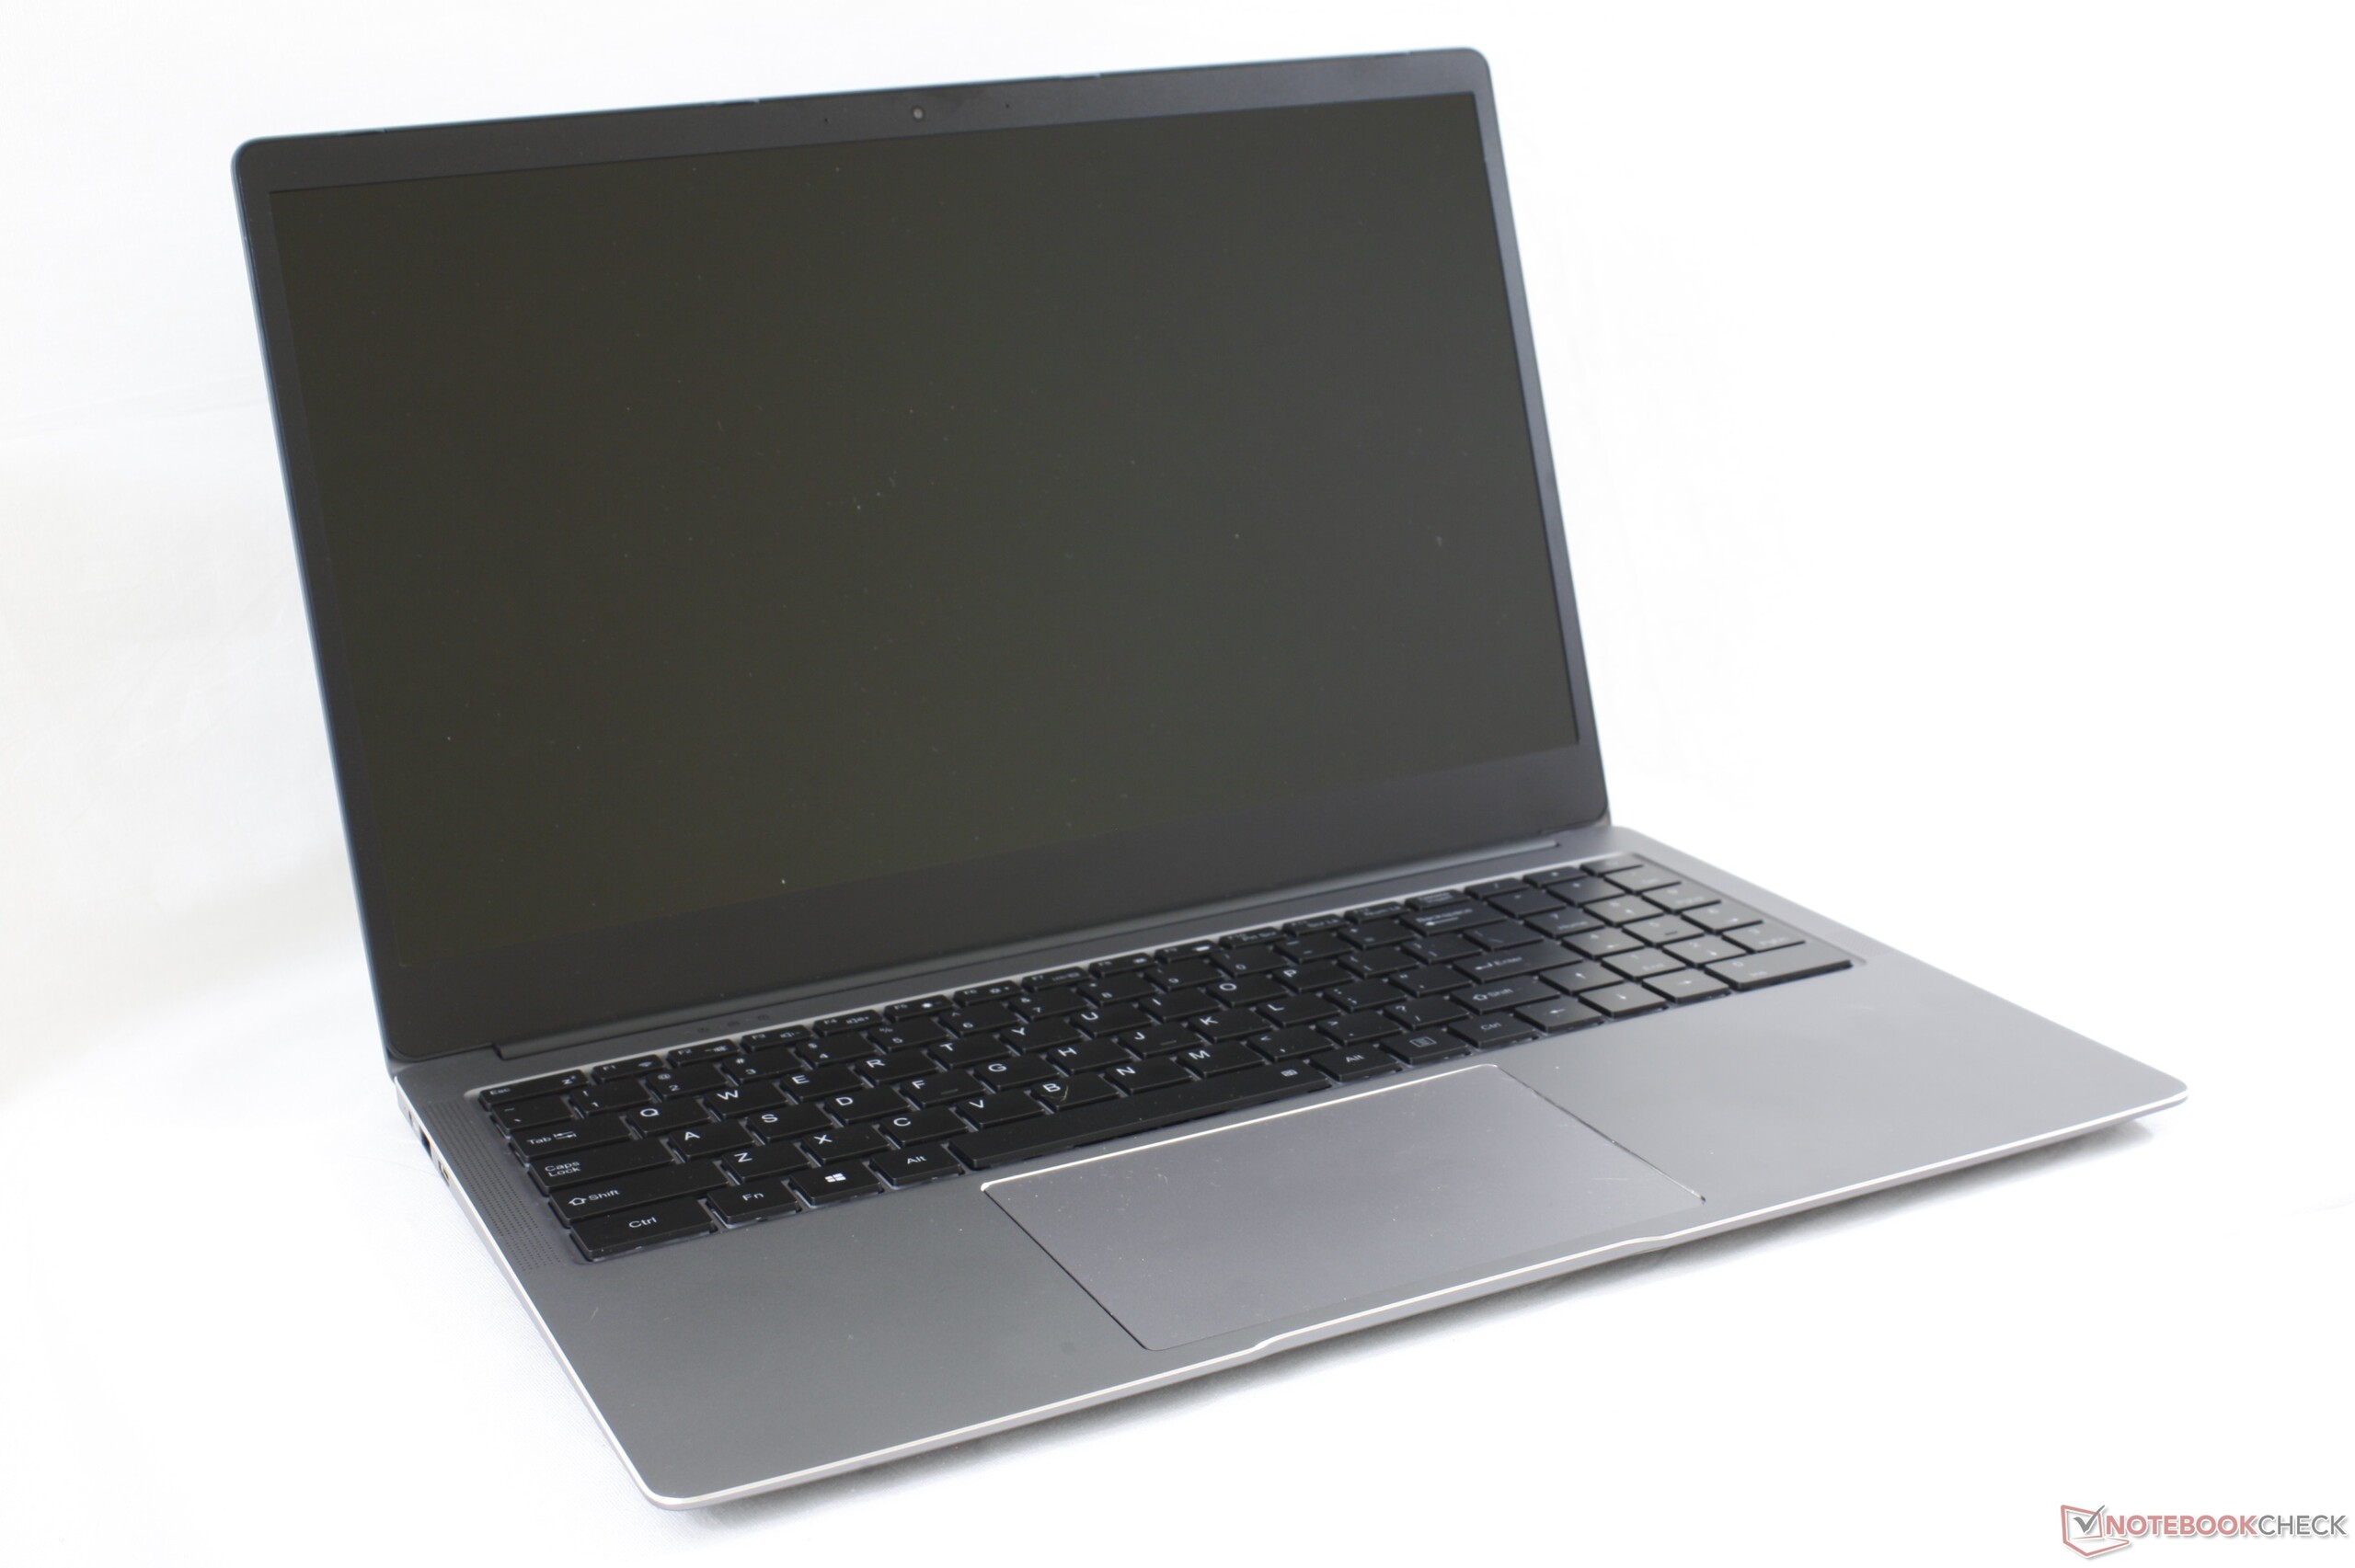
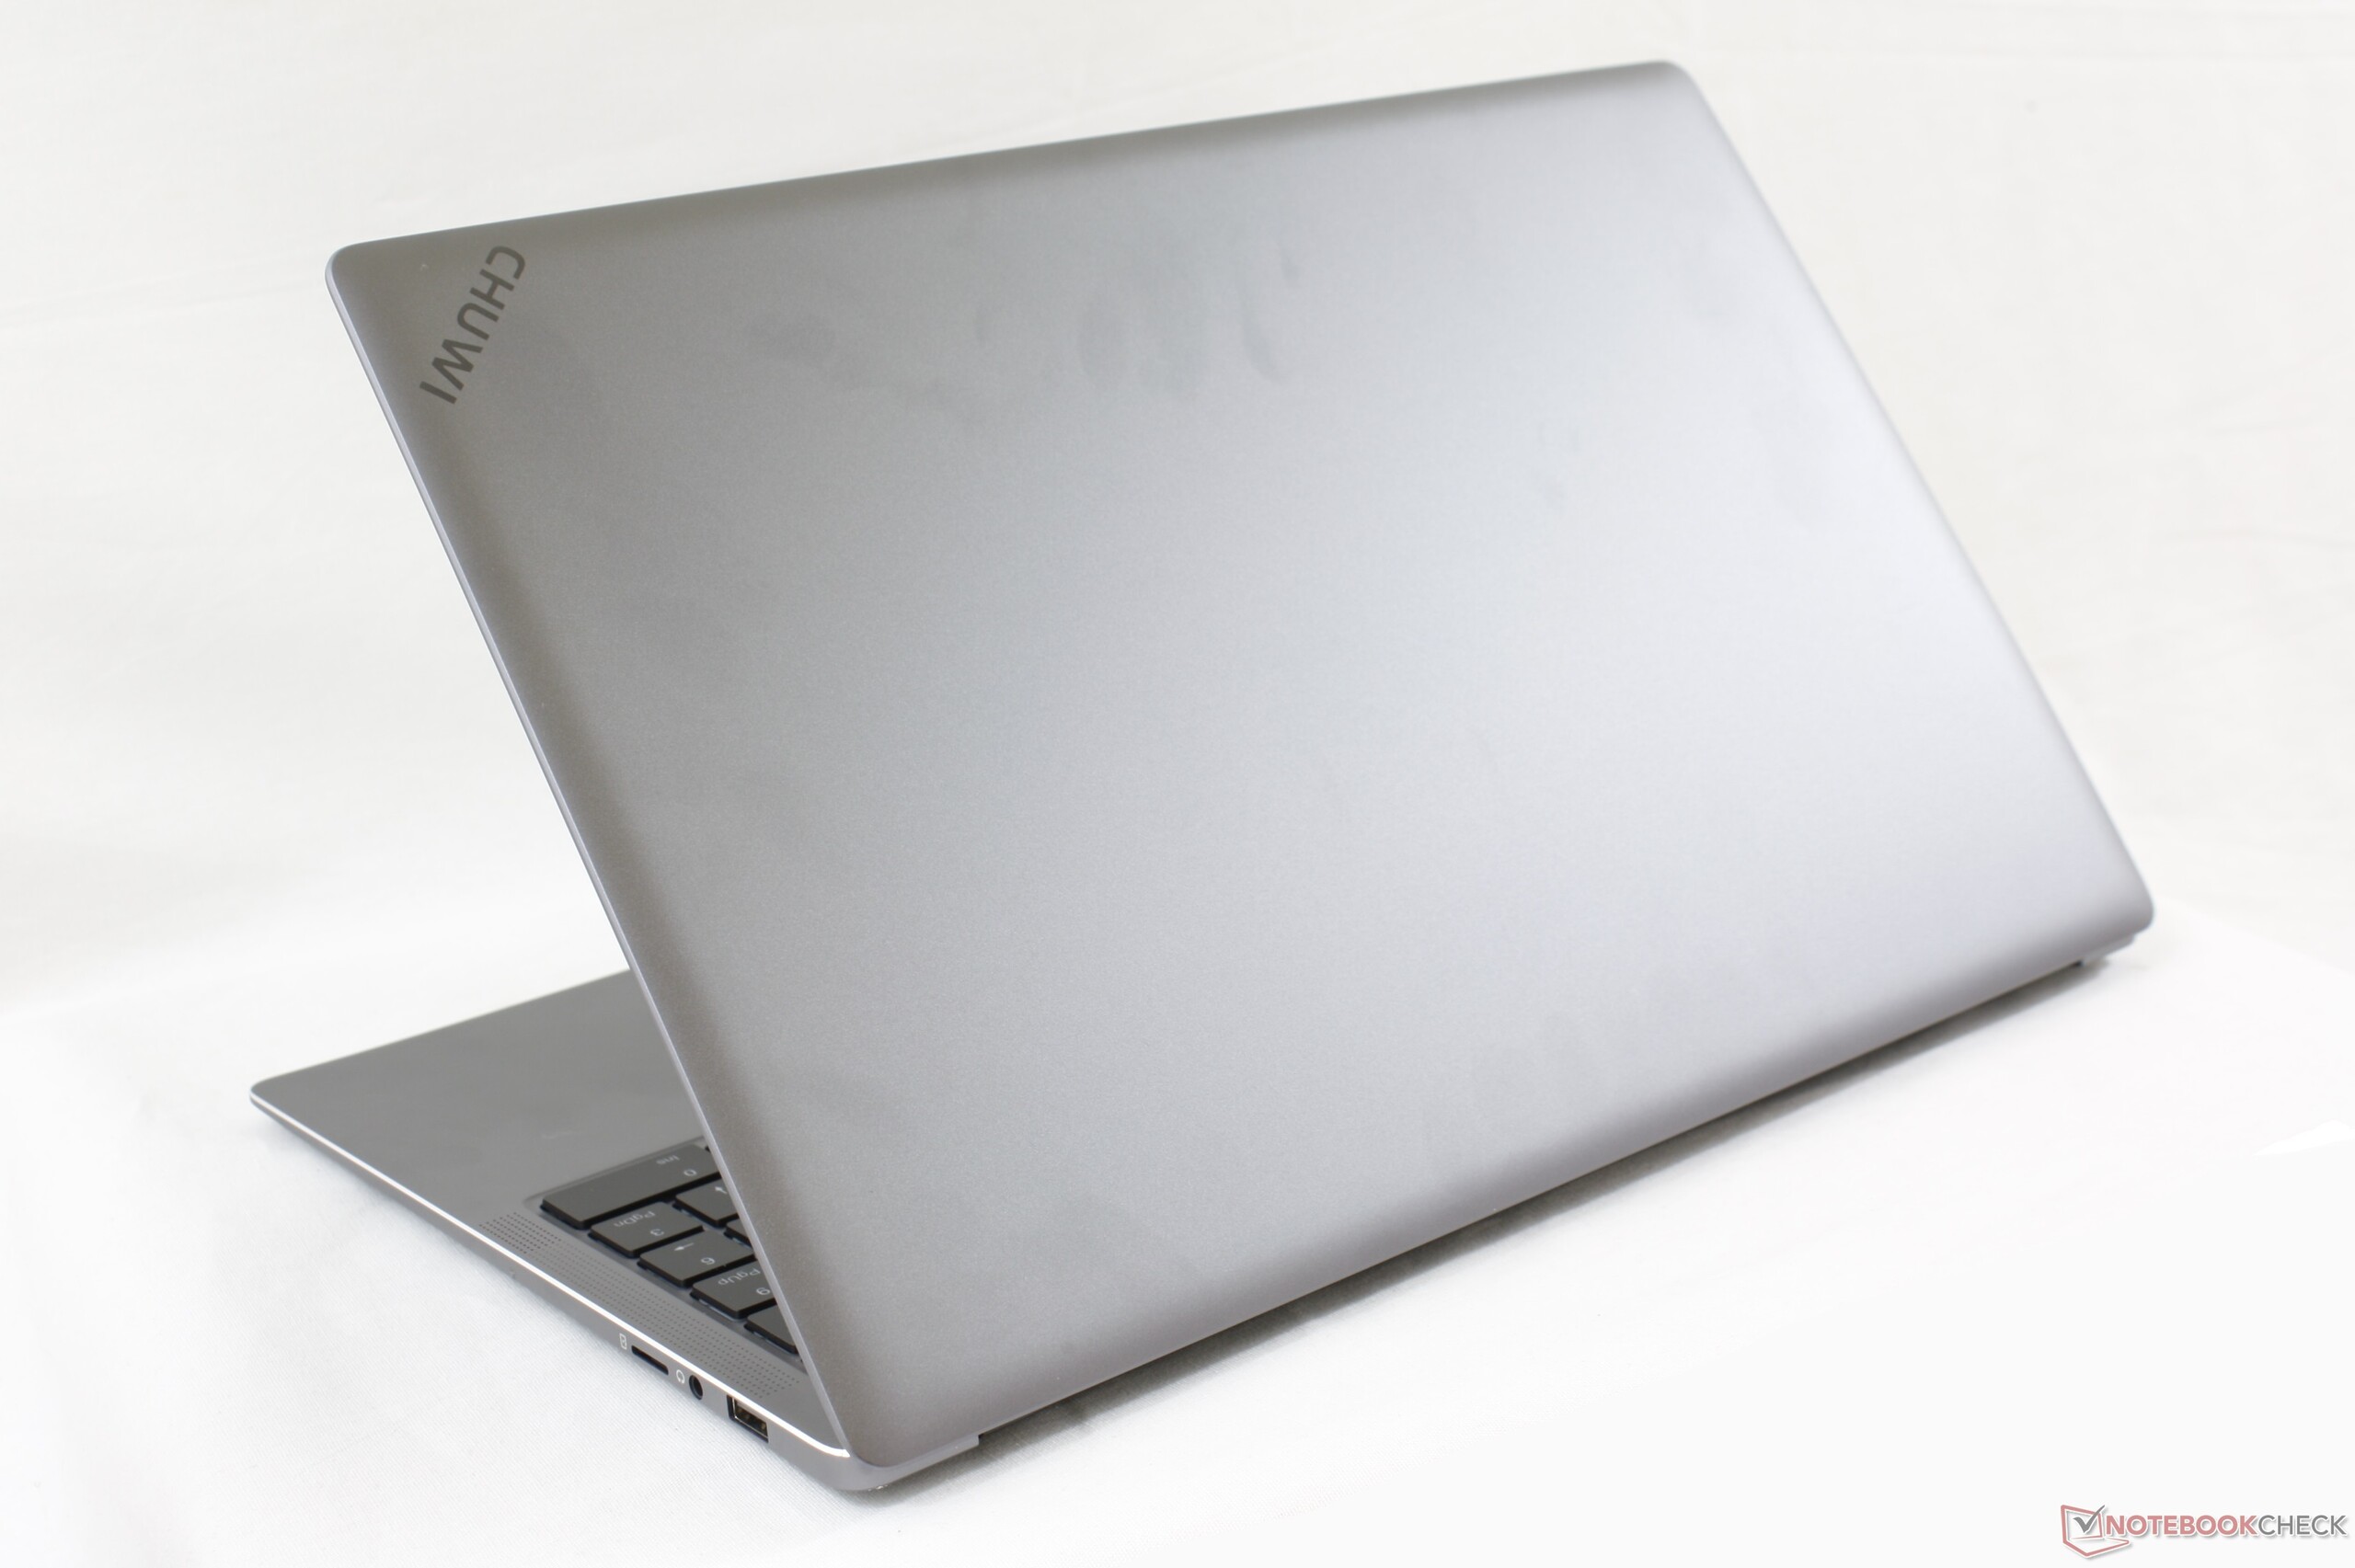
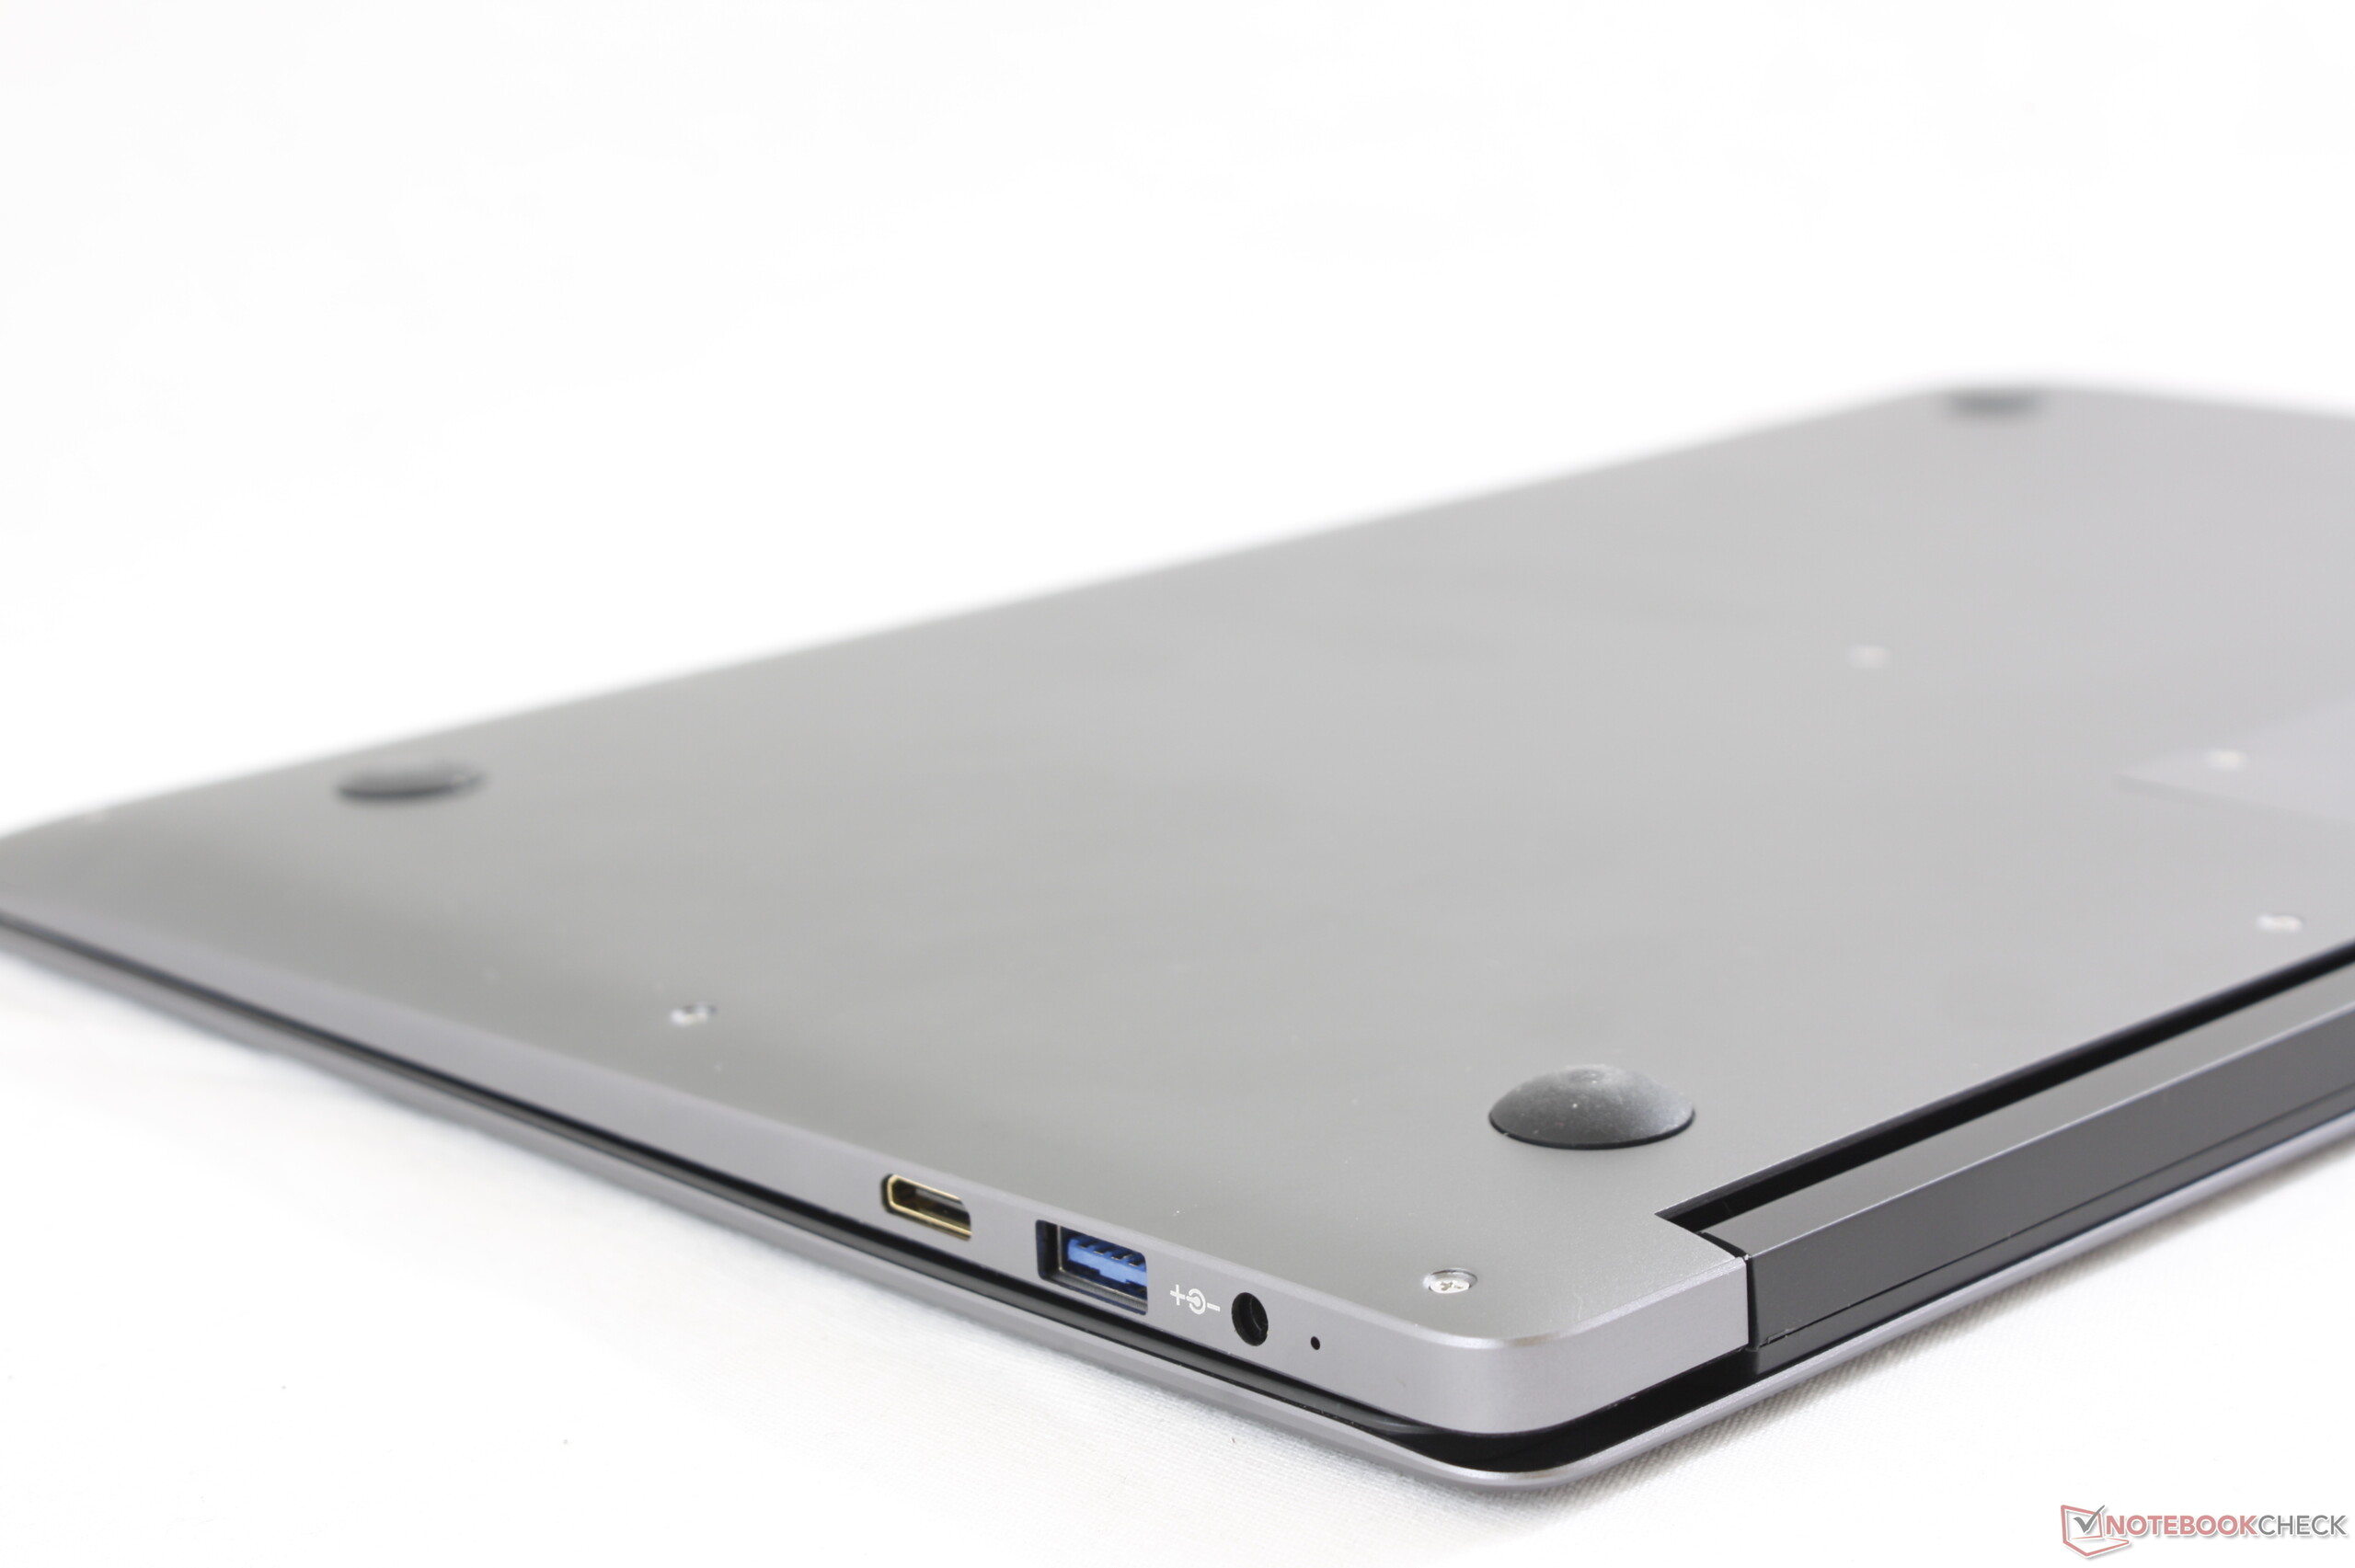
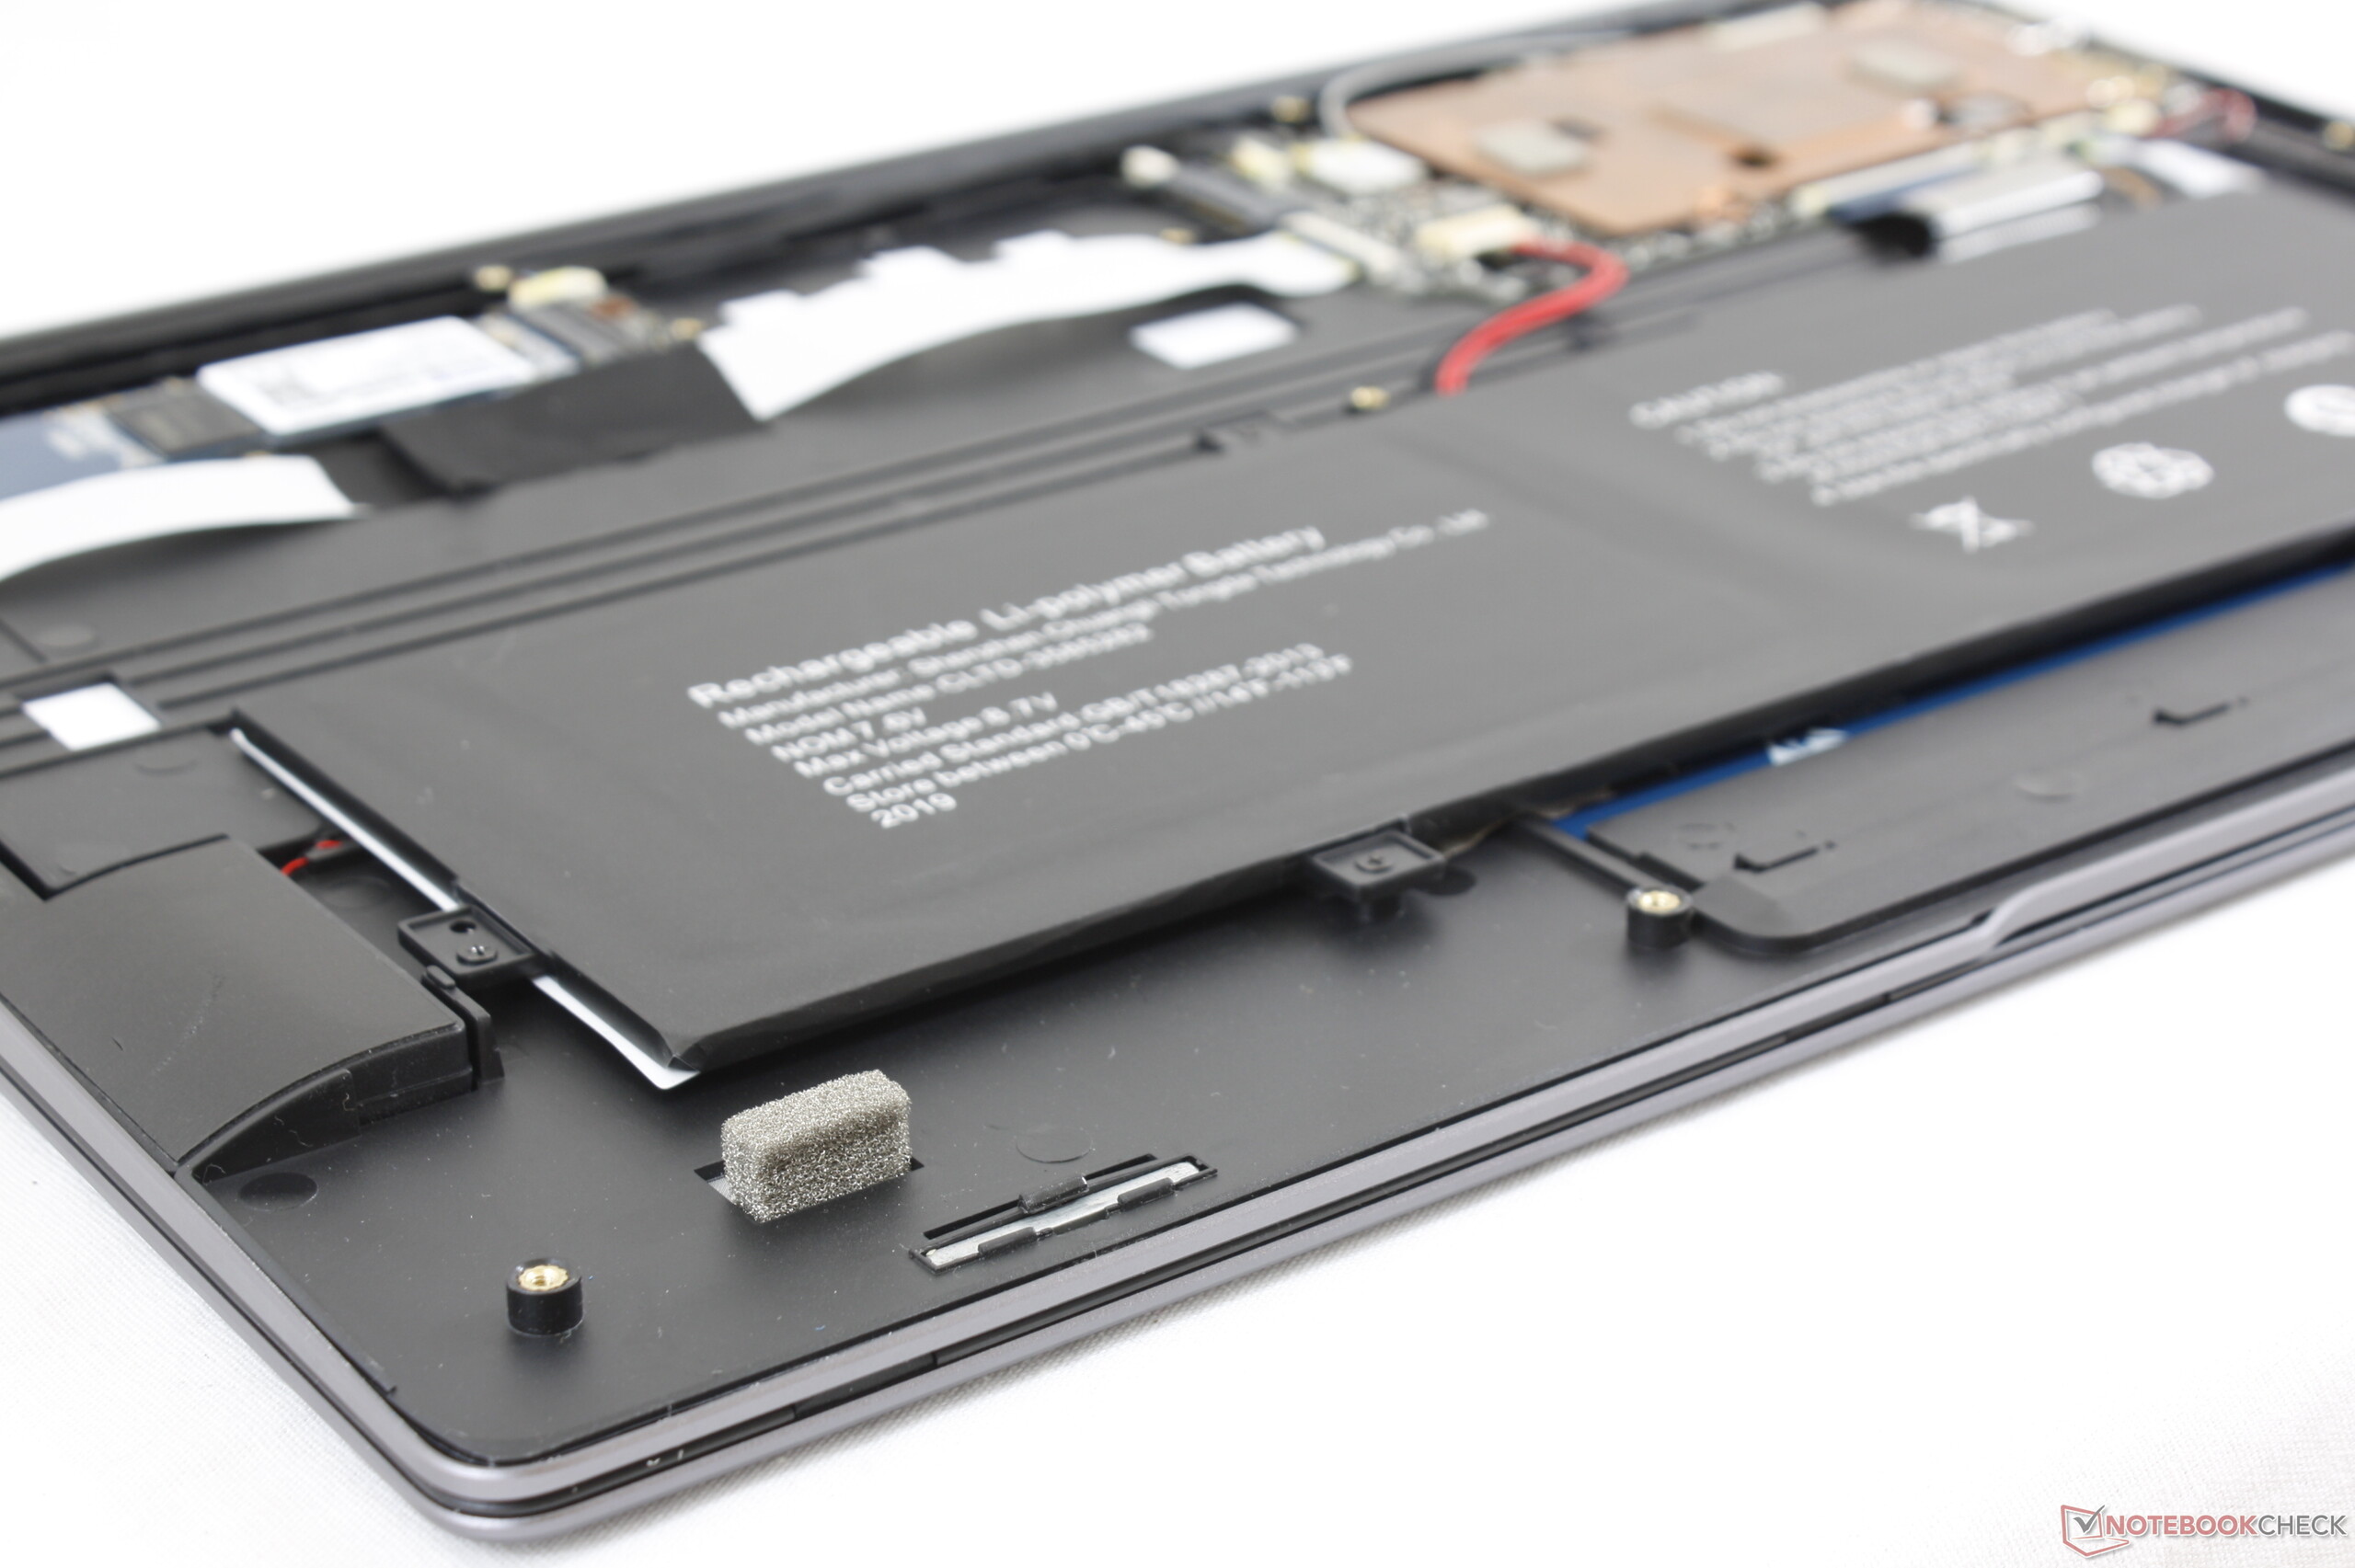
$440的4K笔记本:Chuwi LapBook Plus评测

| SD Card Reader | |
| average JPG Copy Test (av. of 3 runs) | |
| Dell XPS 15 9570 i7 UHD (Toshiba Exceria Pro SDXC 64 GB UHS-II) | |
| HP Spectre x360 15-df0126ng (Toshiba Exceria Pro M501 microSDXC 64GB) | |
| HP Pavilion 15-cs2019ng (Toshiba Exceria Pro SDXC 64 GB UHS-II) | |
| Asus VivoBook S15 S530UN-BQ097T (Toshiba Exceria Pro M501 64 GB UHS-II) | |
| Chuwi LapBook Plus (Toshiba Exceria Pro M501 microSDXC) | |
| maximum AS SSD Seq Read Test (1GB) | |
| HP Spectre x360 15-df0126ng (Toshiba Exceria Pro M501 microSDXC 64GB) | |
| Dell XPS 15 9570 i7 UHD (Toshiba Exceria Pro SDXC 64 GB UHS-II) | |
| HP Pavilion 15-cs2019ng (Toshiba Exceria Pro SDXC 64 GB UHS-II) | |
| Asus VivoBook S15 S530UN-BQ097T (Toshiba Exceria Pro M501 64 GB UHS-II) | |
| Chuwi LapBook Plus (Toshiba Exceria Pro M501 microSDXC) | |
| Networking | |
| iperf3 transmit AX12 | |
| Asus VivoBook S15 S530UN-BQ097T | |
| Dell XPS 15 9570 i7 UHD | |
| HP Pavilion 15-cs2019ng | |
| Chuwi LapBook Plus | |
| iperf3 receive AX12 | |
| HP Pavilion 15-cs2019ng | |
| Dell XPS 15 9570 i7 UHD | |
| Chuwi LapBook Plus | |
| Asus VivoBook S15 S530UN-BQ097T | |
| |||||||||||||||||||||||||
Brightness Distribution: 82 %
Center on Battery: 360.2 cd/m²
Contrast: 1092:1 (Black: 0.33 cd/m²)
ΔE ColorChecker Calman: 4.13 | ∀{0.5-29.43 Ø4.73}
calibrated: 3.8
ΔE Greyscale Calman: 5 | ∀{0.09-98 Ø4.97}
87.8% sRGB (Argyll 1.6.3 3D)
57.3% AdobeRGB 1998 (Argyll 1.6.3 3D)
64.5% AdobeRGB 1998 (Argyll 3D)
88.2% sRGB (Argyll 3D)
68.1% Display P3 (Argyll 3D)
Gamma: 2.23
CCT: 7532 K
| Chuwi LapBook Plus BOE NV156QUM-N51, IPS, 15.6", 3840x2160 | HP Pavilion 15-cs2019ng BOE080D, IPS, 15.6", 1920x1080 | Dell XPS 15 9570 i7 UHD LQ156D1, IPS, 15.6", 3840x2160 | Asus VivoBook S15 S530UN-BQ097T LP156WFC-SPD1, IPS LED, 15.6", 1920x1080 | Apple MacBook Pro 15 2018 (2.6 GHz, 560X) APPA040, IPS, 15.4", 2880x1800 | |
|---|---|---|---|---|---|
| Display | -0% | 17% | -38% | 31% | |
| Display P3 Coverage (%) | 68.1 | 67.2 -1% | 79.1 16% | 38.51 -43% | 98.7 45% |
| sRGB Coverage (%) | 88.2 | 88.1 0% | 98.8 12% | 57.9 -34% | 99.9 13% |
| AdobeRGB 1998 Coverage (%) | 64.5 | 64.4 0% | 79.2 23% | 39.79 -38% | 86.6 34% |
| Response Times | -12% | -22% | -2% | -16% | |
| Response Time Grey 50% / Grey 80% * (ms) | 40 ? | 43 ? -8% | 46.4 ? -16% | 38.8 ? 3% | 43.2 ? -8% |
| Response Time Black / White * (ms) | 25.2 ? | 29 ? -15% | 32 ? -27% | 26.8 ? -6% | 31.2 ? -24% |
| PWM Frequency (Hz) | 962 ? | 208 ? | 980 ? | 117000 ? | |
| Screen | 1% | 5% | -13% | 40% | |
| Brightness middle (cd/m²) | 360.2 | 320 -11% | 494 37% | 262 -27% | 520 44% |
| Brightness (cd/m²) | 337 | 293 -13% | 457 36% | 256 -24% | 492 46% |
| Brightness Distribution (%) | 82 | 86 5% | 88 7% | 90 10% | 88 7% |
| Black Level * (cd/m²) | 0.33 | 0.26 21% | 0.34 -3% | 0.21 36% | 0.39 -18% |
| Contrast (:1) | 1092 | 1231 13% | 1453 33% | 1248 14% | 1333 22% |
| Colorchecker dE 2000 * | 4.13 | 4.5 -9% | 5.2 -26% | 5.8 -40% | 1.2 71% |
| Colorchecker dE 2000 max. * | 8.15 | 8.81 -8% | 17.5 -115% | 14.3 -75% | 2.3 72% |
| Colorchecker dE 2000 calibrated * | 3.8 | 4.6 -21% | |||
| Greyscale dE 2000 * | 5 | 4.71 6% | 2.7 46% | 2.5 50% | 1.3 74% |
| Gamma | 2.23 99% | 2.45 90% | 2.1 105% | 1.99 111% | 2.18 101% |
| CCT | 7532 86% | 7085 92% | 7038 92% | 6528 100% | 6738 96% |
| Color Space (Percent of AdobeRGB 1998) (%) | 57.3 | 58 1% | 71.2 24% | 36.6 -36% | |
| Color Space (Percent of sRGB) (%) | 87.8 | 88 0% | 98.8 13% | 57.6 -34% | |
| Total Average (Program / Settings) | -4% /
-1% | 0% /
4% | -18% /
-17% | 18% /
29% |
* ... smaller is better
Display Response Times
| ↔ Response Time Black to White | ||
|---|---|---|
| 25.2 ms ... rise ↗ and fall ↘ combined | ↗ 14 ms rise | 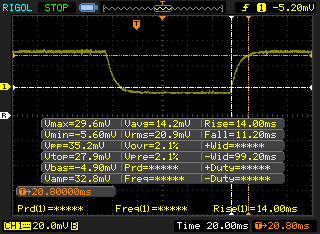 |
| ↘ 11.2 ms fall | ||
| The screen shows relatively slow response rates in our tests and may be too slow for gamers. In comparison, all tested devices range from 0.1 (minimum) to 240 (maximum) ms. » 60 % of all devices are better. This means that the measured response time is worse than the average of all tested devices (19.9 ms). | ||
| ↔ Response Time 50% Grey to 80% Grey | ||
| 40 ms ... rise ↗ and fall ↘ combined | ↗ 21.2 ms rise | 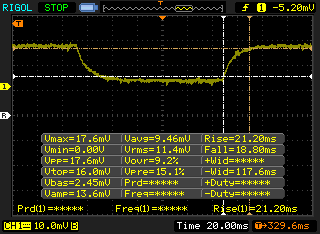 |
| ↘ 18.8 ms fall | ||
| The screen shows slow response rates in our tests and will be unsatisfactory for gamers. In comparison, all tested devices range from 0.165 (minimum) to 636 (maximum) ms. » 61 % of all devices are better. This means that the measured response time is worse than the average of all tested devices (31.1 ms). | ||
Screen Flickering / PWM (Pulse-Width Modulation)
| Screen flickering / PWM detected | 962 Hz | ≤ 99 % brightness setting | 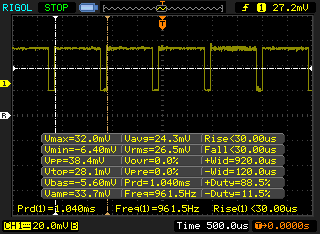 |
The display backlight flickers at 962 Hz (worst case, e.g., utilizing PWM) Flickering detected at a brightness setting of 99 % and below. There should be no flickering or PWM above this brightness setting. The frequency of 962 Hz is quite high, so most users sensitive to PWM should not notice any flickering. In comparison: 52 % of all tested devices do not use PWM to dim the display. If PWM was detected, an average of 7784 (minimum: 5 - maximum: 343500) Hz was measured. | |||
| Cinebench R11.5 | |
| CPU Single 64Bit | |
| Acer Swift 3 SF314-55-31N8 | |
| Microsoft Surface Pro (2017) m3 | |
| Lenovo ThinkPad X1 Tablet | |
| Asus X555DA-BB11 | |
| Chuwi LapBook Plus | |
| Asus Transformer Book T200TA PL | |
| CPU Multi 64Bit | |
| Acer Swift 3 SF314-55-31N8 | |
| Microsoft Surface Pro (2017) m3 | |
| Lenovo ThinkPad X1 Tablet | |
| Asus X555DA-BB11 | |
| Chuwi LapBook Plus | |
| Asus Transformer Book T200TA PL | |
| Cinebench R10 | |
| Rendering Multiple CPUs 32Bit | |
| Acer Swift 3 SF314-55-31N8 | |
| Microsoft Surface Pro (2017) m3 | |
| Lenovo Tablet 10-20L3000KGE | |
| Asus X555DA-BB11 | |
| Asus Transformer Book T200TA PL | |
| Chuwi LapBook Plus | |
| Chuwi HeroBook 14 | |
| Trekstor SurfTab duo W3 | |
| HP x2 210 G1 | |
| Rendering Single 32Bit | |
| Acer Swift 3 SF314-55-31N8 | |
| Microsoft Surface Pro (2017) m3 | |
| Asus X555DA-BB11 | |
| Lenovo Tablet 10-20L3000KGE | |
| Chuwi LapBook Plus | |
| Asus Transformer Book T200TA PL | |
| Trekstor SurfTab duo W3 | |
| Chuwi HeroBook 14 | |
| HP x2 210 G1 | |
| wPrime 2.10 - 1024m | |
| Chuwi HeroBook 14 | |
| Chuwi LapBook Plus | |
| Asus Transformer Book T200TA PL | |
| Lenovo ThinkPad X1 Tablet | |
| Asus X555DA-BB11 | |
| Acer Swift 3 SF314-55-31N8 | |
* ... smaller is better
| PCMark 10 | |
| Score | |
| Average of class Multimedia (4325 - 10386, n=58, last 2 years) | |
| Asus VivoBook S15 S530UN-BQ097T | |
| Apple MacBook Air 2018 | |
| Chuwi LapBook Plus | |
| HP x2 210 G2 | |
| Essentials | |
| Average of class Multimedia (8025 - 11664, n=57, last 2 years) | |
| Asus VivoBook S15 S530UN-BQ097T | |
| Apple MacBook Air 2018 | |
| Chuwi LapBook Plus | |
| HP x2 210 G2 | |
| Productivity | |
| Average of class Multimedia (7323 - 18233, n=57, last 2 years) | |
| Asus VivoBook S15 S530UN-BQ097T | |
| Apple MacBook Air 2018 | |
| Chuwi LapBook Plus | |
| HP x2 210 G2 | |
| Digital Content Creation | |
| Average of class Multimedia (3651 - 16240, n=57, last 2 years) | |
| Asus VivoBook S15 S530UN-BQ097T | |
| Apple MacBook Air 2018 | |
| Chuwi LapBook Plus | |
| HP x2 210 G2 | |
| PCMark 8 Home Score Accelerated v2 | 1371 points | |
| PCMark 10 Score | 1144 points | |
Help | ||
| Chuwi LapBook Plus Kimtigo KT256GM28S3 | HP Pavilion 15-cs2019ng Toshiba KBG30ZMV256G | HP Spectre x360 15-df0126ng Toshiba XG5-P KXG50PNV2T04 | Asus VivoBook S15 S530UN-BQ097T SanDisk SD9SN8W256G1027 | Chuwi HeroBook 14 SanDisk DF4064 | |
|---|---|---|---|---|---|
| AS SSD | 263% | 344% | 111% | -65% | |
| Seq Read (MB/s) | 391.5 | 1153 195% | 2018 415% | 504 29% | 127.9 -67% |
| Seq Write (MB/s) | 419.4 | 736 75% | 773 84% | 202.7 -52% | 85.9 -80% |
| 4K Read (MB/s) | 7.36 | 46.51 532% | 24.62 235% | 27.67 276% | 9.33 27% |
| 4K Write (MB/s) | 15.16 | 114.1 653% | 92.8 512% | 51.1 237% | 10.77 -29% |
| 4K-64 Read (MB/s) | 139.4 | 618 343% | 845 506% | 373.6 168% | 27.59 -80% |
| 4K-64 Write (MB/s) | 137.7 | 461.4 235% | 957 595% | 173 26% | 8.6 -94% |
| Access Time Read * (ms) | 0.361 | 0.421 -17% | 0.147 59% | 0.365 -1% | 0.408 -13% |
| Access Time Write * (ms) | 0.462 | 0.233 50% | 0.057 88% | 0.603 -31% | 0.904 -96% |
| Score Read (Points) | 186 | 780 319% | 1071 476% | 452 143% | 50 -73% |
| Score Write (Points) | 195 | 649 233% | 1127 478% | 244 25% | 28 -86% |
| Score Total (Points) | 479 | 1822 280% | 2684 460% | 921 92% | 105 -78% |
| Copy ISO MB/s (MB/s) | 464.9 | 1652 255% | 810 74% | 59 -87% | |
| Copy Program MB/s (MB/s) | 77.7 | 328.5 323% | 332.5 328% | 15.61 -80% | |
| Copy Game MB/s (MB/s) | 162 | 700 332% | 557 244% | 37.2 -77% |
* ... smaller is better

| 3DMark | |
| 1280x720 Cloud Gate Standard Graphics | |
| Asus VivoBook S15 S530UN-BQ097T | |
| Microsoft Surface Pro 6, Core i5, 128 GB | |
| Apple MacBook Air 2018 | |
| Acer Swift 3 SF314-55-31N8 | |
| Microsoft Surface Pro (2017) m3 | |
| Apple MacBook 12 (Early 2016) 1.1 GHz | |
| Lenovo ThinkPad X1 Tablet | |
| Asus X555DA-BB11 | |
| Chuwi LapBook Plus | |
| Lenovo Tablet 10-20L3000KGE | |
| Teclast Tbook 16 Power | |
| Chuwi HeroBook 14 | |
| 1920x1080 Ice Storm Extreme Graphics | |
| Microsoft Surface Pro (2017) m3 | |
| Asus X555DA-BB11 | |
| Chuwi LapBook Plus | |
| Lenovo Tablet 10-20L3000KGE | |
| 3DMark 06 Standard Score | 4884 points | |
| 3DMark Vantage P Result | 2744 points | |
| 3DMark 11 Performance | 835 points | |
| 3DMark Ice Storm Standard Score | 23656 points | |
| 3DMark Cloud Gate Standard Score | 2880 points | |
| 3DMark Time Spy Score | 161 points | |
Help | ||
| low | med. | high | ultra | |
|---|---|---|---|---|
| Rocket League (2017) | 21.4 | 15.3 |
(-) The maximum temperature on the upper side is 46.2 °C / 115 F, compared to the average of 36.8 °C / 98 F, ranging from 21 to 71 °C for the class Multimedia.
(-) The bottom heats up to a maximum of 51 °C / 124 F, compared to the average of 39.1 °C / 102 F
(+) In idle usage, the average temperature for the upper side is 28.3 °C / 83 F, compared to the device average of 31.3 °C / 88 F.
(+) The palmrests and touchpad are reaching skin temperature as a maximum (33.6 °C / 92.5 F) and are therefore not hot.
(-) The average temperature of the palmrest area of similar devices was 28.7 °C / 83.7 F (-4.9 °C / -8.8 F).
Chuwi LapBook Plus audio analysis
(-) | not very loud speakers (69.8 dB)
Bass 100 - 315 Hz
(-) | nearly no bass - on average 17.2% lower than median
(±) | linearity of bass is average (10.5% delta to prev. frequency)
Mids 400 - 2000 Hz
(+) | balanced mids - only 3.8% away from median
(±) | linearity of mids is average (13.8% delta to prev. frequency)
Highs 2 - 16 kHz
(+) | balanced highs - only 4.5% away from median
(±) | linearity of highs is average (12.6% delta to prev. frequency)
Overall 100 - 16.000 Hz
(-) | overall sound is not linear (35.5% difference to median)
Compared to same class
» 98% of all tested devices in this class were better, 0% similar, 1% worse
» The best had a delta of 5%, average was 17%, worst was 45%
Compared to all devices tested
» 94% of all tested devices were better, 1% similar, 5% worse
» The best had a delta of 4%, average was 24%, worst was 134%
Apple MacBook 12 (Early 2016) 1.1 GHz audio analysis
(+) | speakers can play relatively loud (83.6 dB)
Bass 100 - 315 Hz
(±) | reduced bass - on average 11.3% lower than median
(±) | linearity of bass is average (14.2% delta to prev. frequency)
Mids 400 - 2000 Hz
(+) | balanced mids - only 2.4% away from median
(+) | mids are linear (5.5% delta to prev. frequency)
Highs 2 - 16 kHz
(+) | balanced highs - only 2% away from median
(+) | highs are linear (4.5% delta to prev. frequency)
Overall 100 - 16.000 Hz
(+) | overall sound is linear (10.2% difference to median)
Compared to same class
» 7% of all tested devices in this class were better, 2% similar, 91% worse
» The best had a delta of 5%, average was 18%, worst was 53%
Compared to all devices tested
» 5% of all tested devices were better, 1% similar, 94% worse
» The best had a delta of 4%, average was 24%, worst was 134%
| Off / Standby | |
| Idle | |
| Load |
|
Key:
min: | |
| Chuwi LapBook Plus x7-E3950, HD Graphics 505, Kimtigo KT256GM28S3, IPS, 3840x2160, 15.6" | HP Pavilion 15-cs2019ng i5-8265U, GeForce MX250, Toshiba KBG30ZMV256G, IPS, 1920x1080, 15.6" | Dell XPS 15 9570 i7 UHD i7-8750H, GeForce GTX 1050 Ti Max-Q, Toshiba XG5 KXG50ZNV512G, IPS, 3840x2160, 15.6" | Asus VivoBook S15 S530UN-BQ097T i5-8550U, GeForce MX150, SanDisk SD9SN8W256G1027, IPS LED, 1920x1080, 15.6" | HP Spectre x360 15-df0126ng i7-8750H, GeForce GTX 1050 Ti Max-Q, Toshiba XG5-P KXG50PNV2T04, IPS, 3840x2160, 15.6" | Microsoft Surface Pro 6, Core i5, 128 GB i5-8250U, UHD Graphics 620, Toshiba KBG30ZPZ128G, IPS, 2736x1834, 12.3" | |
|---|---|---|---|---|---|---|
| Power Consumption | -40% | -205% | -51% | -141% | -3% | |
| Idle Minimum * (Watt) | 6.6 | 4.9 26% | 9.48 -44% | 3.1 53% | 2.1 68% | 4.3 35% |
| Idle Average * (Watt) | 11.3 | 7.9 30% | 16.1 -42% | 6.3 44% | 6.7 41% | 8.7 23% |
| Idle Maximum * (Watt) | 11.7 | 10.1 14% | 16.9 -44% | 8.6 26% | 11.4 3% | 9.4 20% |
| Load Average * (Watt) | 21.1 | 60 -184% | 90.8 -330% | 56.4 -167% | 77.7 -268% | 24.5 -16% |
| Load Maximum * (Watt) | 20.2 | 38 -88% | 134.4 -565% | 62.7 -210% | 131.5 -551% | 36 -78% |
| Witcher 3 ultra * (Watt) | 45 |
* ... smaller is better
| Chuwi LapBook Plus x7-E3950, HD Graphics 505, 36 Wh | HP Pavilion 15-cs2019ng i5-8265U, GeForce MX250, 41 Wh | Dell XPS 15 9570 i7 UHD i7-8750H, GeForce GTX 1050 Ti Max-Q, 97 Wh | HP Spectre x360 15-df0126ng i7-8750H, GeForce GTX 1050 Ti Max-Q, 84 Wh | Asus VivoBook S15 S530UN-BQ097T i5-8550U, GeForce MX150, 42 Wh | Apple MacBook Pro 15 2018 (2.6 GHz, 560X) i7-8850H, Radeon Pro 560X, 83 Wh | |
|---|---|---|---|---|---|---|
| Battery runtime | 43% | 174% | 151% | 86% | 191% | |
| WiFi v1.3 (h) | 3.5 | 5 43% | 9.6 174% | 8.8 151% | 6.5 86% | 10.2 191% |
| Reader / Idle (h) | 8 | 18.8 | ||||
| Load (h) | 1.3 | 1.3 | 2.3 | |||
| Witcher 3 ultra (h) | 1 | 1.5 |
Pros
Cons
尽管看起来很轻薄和性感,但对于简单的打印或电子邮件而言,性能都太差了,无法推荐其他任何功能。 即使是最简单的操作(如单击和键入),也都存在明显的延迟,这使得LapBook Plus成为多媒体,流媒体浏览的不佳选择。
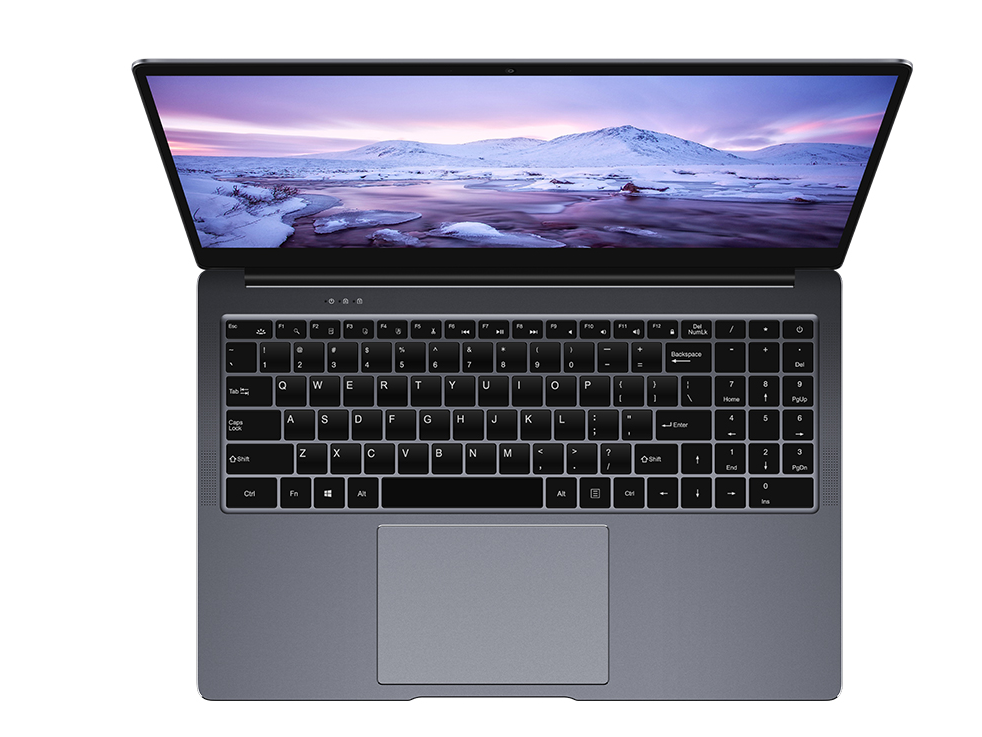
值得称赞的是,与其他Ultrabooks相比,键盘实际上是相当不错的,并且在此价格范围内4K UHD显示屏是无与伦比的。 不幸的是,这些受人欢迎的品质并没有实际用途,因为它们被今年上市的任何笔记本电脑中最慢的处理器之一所拖累。
被Intel Atom所困的漂亮笔记本电脑。非常慢的处理器拖累了本来可以买到便宜的超极本。 使用上一代Core i3笔记本电脑,用户会获得更好的体验,从而获得明显更快和更可靠的性能。
Chuwi LapBook Plus
- 07/05/2019 v6 (old)
Allen Ngo
Price comparison

